Lower Allen, PA Map & Demographics
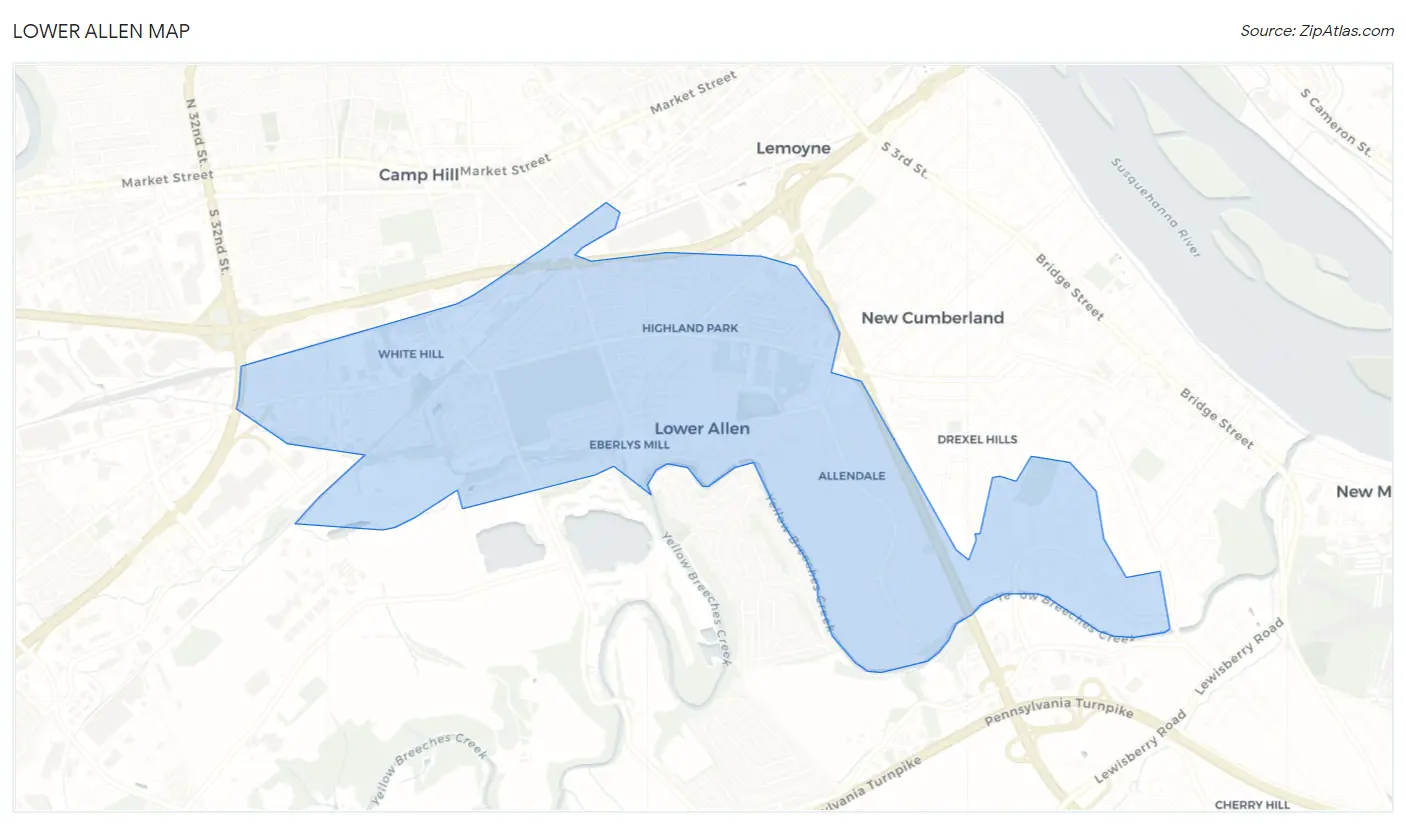
Lower Allen Map
Lower Allen Overview
$45,848
PER CAPITA INCOME
$111,875
AVG FAMILY INCOME
$83,814
AVG HOUSEHOLD INCOME
31.4%
WAGE / INCOME GAP [ % ]
68.6¢/ $1
WAGE / INCOME GAP [ $ ]
0.40
INEQUALITY / GINI INDEX
7,350
TOTAL POPULATION
3,467
MALE POPULATION
3,883
FEMALE POPULATION
89.29
MALES / 100 FEMALES
112.00
FEMALES / 100 MALES
39.8
MEDIAN AGE
3.0
AVG FAMILY SIZE
2.3
AVG HOUSEHOLD SIZE
4,156
LABOR FORCE [ PEOPLE ]
69.5%
PERCENT IN LABOR FORCE
2.9%
UNEMPLOYMENT RATE
Income in Lower Allen
Income Overview in Lower Allen
Per Capita Income in Lower Allen is $45,848, while median incomes of families and households are $111,875 and $83,814 respectively.
| Characteristic | Number | Measure |
| Per Capita Income | 7,350 | $45,848 |
| Median Family Income | 1,838 | $111,875 |
| Mean Family Income | 1,838 | $131,748 |
| Median Household Income | 3,241 | $83,814 |
| Mean Household Income | 3,241 | $102,786 |
| Income Deficit | 1,838 | $0 |
| Wage / Income Gap (%) | 7,350 | 31.42% |
| Wage / Income Gap ($) | 7,350 | 68.58¢ per $1 |
| Gini / Inequality Index | 7,350 | 0.40 |
Earnings by Sex in Lower Allen
Average Earnings in Lower Allen are $51,518, $61,738 for men and $42,338 for women, a difference of 31.4%.
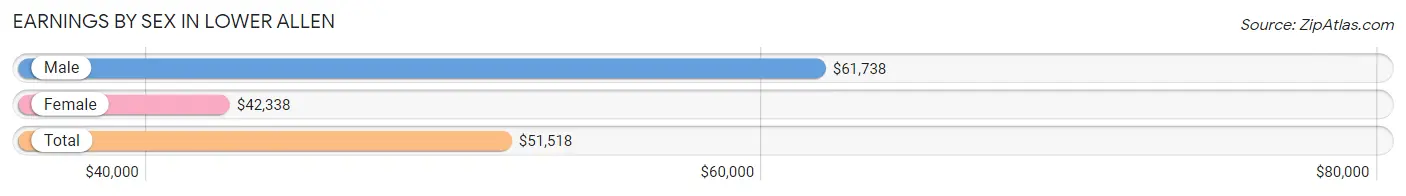
| Sex | Number | Average Earnings |
| Male | 2,153 (51.7%) | $61,738 |
| Female | 2,009 (48.3%) | $42,338 |
| Total | 4,162 (100.0%) | $51,518 |
Earnings by Sex by Income Bracket in Lower Allen
The most common earnings brackets in Lower Allen are $75,000 to $99,999 for men (444 | 20.6%) and $100,000+ for women (227 | 11.3%).
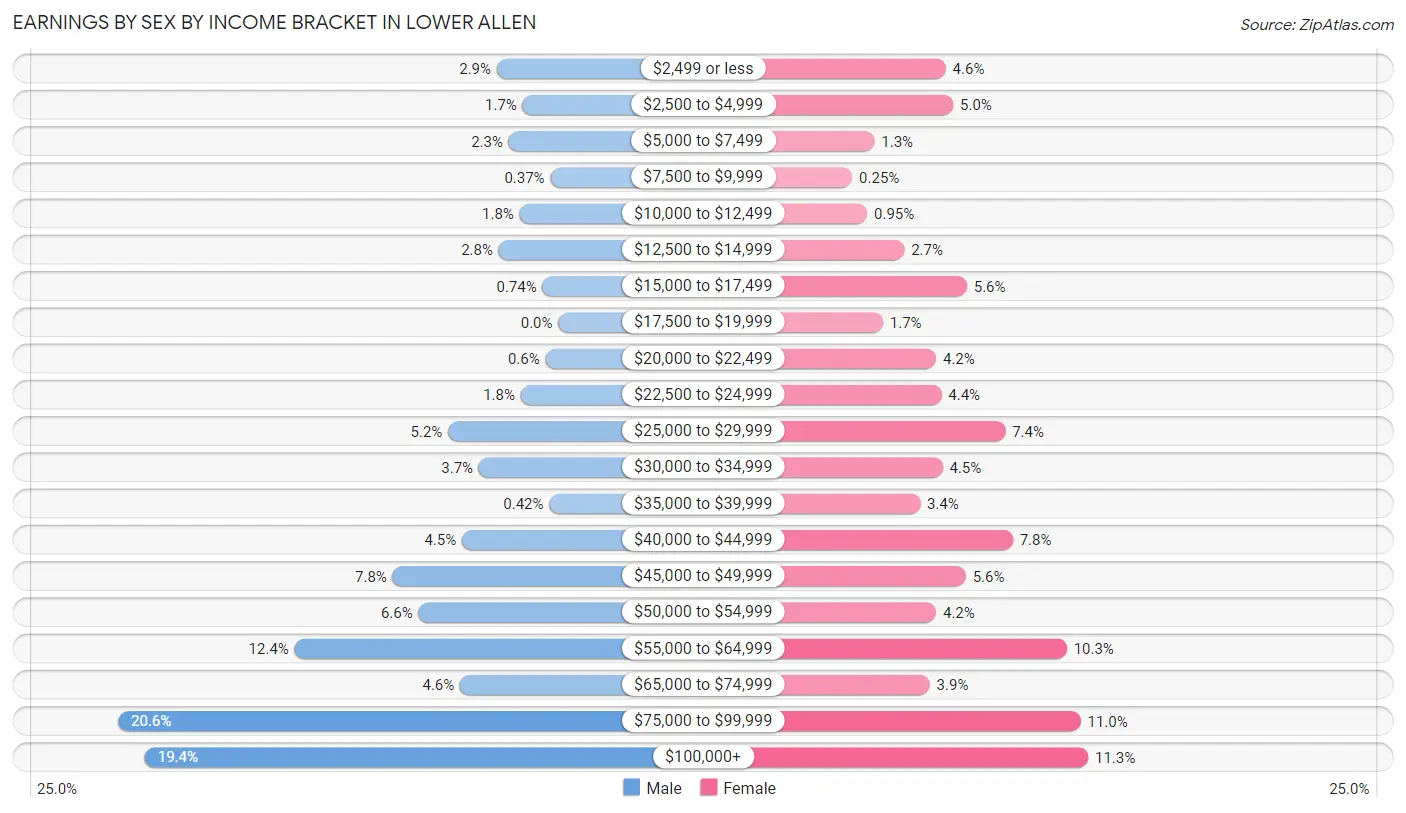
| Income | Male | Female |
| $2,499 or less | 62 (2.9%) | 93 (4.6%) |
| $2,500 to $4,999 | 36 (1.7%) | 100 (5.0%) |
| $5,000 to $7,499 | 50 (2.3%) | 26 (1.3%) |
| $7,500 to $9,999 | 8 (0.4%) | 5 (0.3%) |
| $10,000 to $12,499 | 39 (1.8%) | 19 (0.9%) |
| $12,500 to $14,999 | 60 (2.8%) | 54 (2.7%) |
| $15,000 to $17,499 | 16 (0.7%) | 113 (5.6%) |
| $17,500 to $19,999 | 0 (0.0%) | 34 (1.7%) |
| $20,000 to $22,499 | 13 (0.6%) | 84 (4.2%) |
| $22,500 to $24,999 | 38 (1.8%) | 89 (4.4%) |
| $25,000 to $29,999 | 111 (5.2%) | 149 (7.4%) |
| $30,000 to $34,999 | 80 (3.7%) | 90 (4.5%) |
| $35,000 to $39,999 | 9 (0.4%) | 69 (3.4%) |
| $40,000 to $44,999 | 97 (4.5%) | 156 (7.8%) |
| $45,000 to $49,999 | 167 (7.8%) | 112 (5.6%) |
| $50,000 to $54,999 | 141 (6.6%) | 84 (4.2%) |
| $55,000 to $64,999 | 266 (12.3%) | 207 (10.3%) |
| $65,000 to $74,999 | 99 (4.6%) | 78 (3.9%) |
| $75,000 to $99,999 | 444 (20.6%) | 220 (11.0%) |
| $100,000+ | 417 (19.4%) | 227 (11.3%) |
| Total | 2,153 (100.0%) | 2,009 (100.0%) |
Earnings by Sex by Educational Attainment in Lower Allen
Average earnings in Lower Allen are $64,273 for men and $46,307 for women, a difference of 28.0%. Men with an educational attainment of graduate degree enjoy the highest average annual earnings of $86,279, while those with high school diploma education earn the least with $50,584. Women with an educational attainment of graduate degree earn the most with the average annual earnings of $64,732, while those with high school diploma education have the smallest earnings of $20,898.
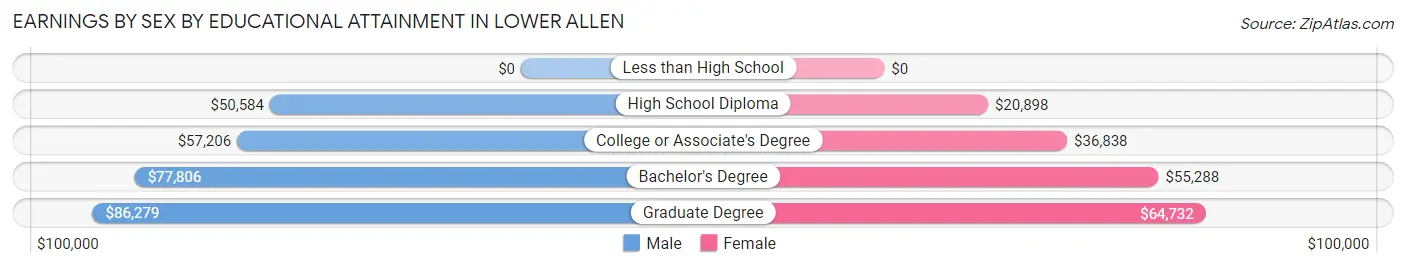
| Educational Attainment | Male Income | Female Income |
| Less than High School | - | - |
| High School Diploma | $50,584 | $20,898 |
| College or Associate's Degree | $57,206 | $36,838 |
| Bachelor's Degree | $77,806 | $55,288 |
| Graduate Degree | $86,279 | $64,732 |
| Total | $64,273 | $46,307 |
Family Income in Lower Allen
Family Income Brackets in Lower Allen
According to the Lower Allen family income data, there are 456 families falling into the $100,000 to $149,999 income range, which is the most common income bracket and makes up 24.8% of all families.
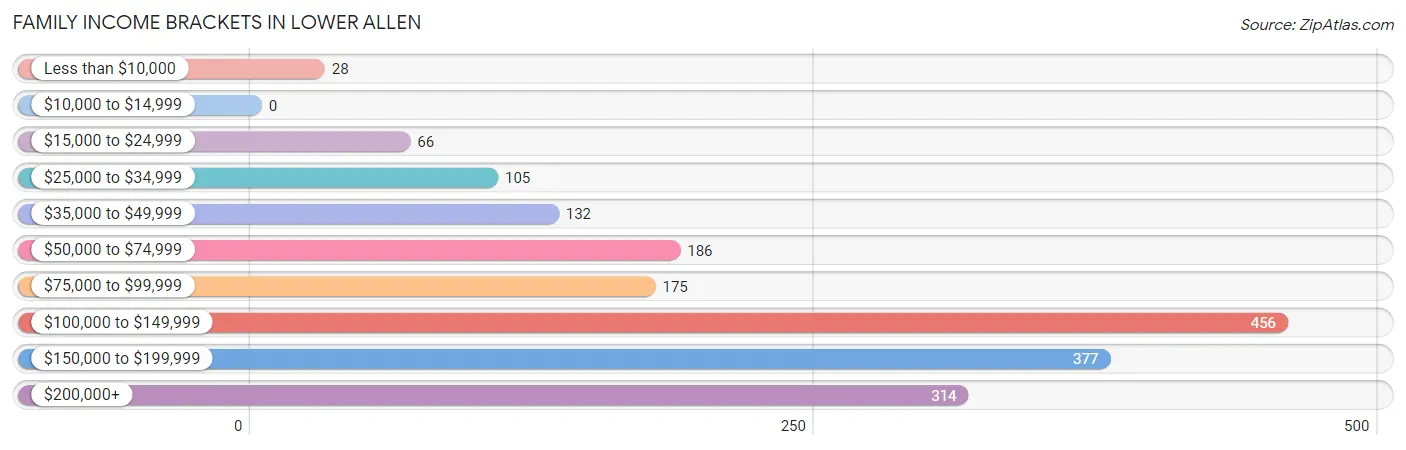
| Income Bracket | # Families | % Families |
| Less than $10,000 | 28 | 1.5% |
| $10,000 to $14,999 | 0 | 0.0% |
| $15,000 to $24,999 | 66 | 3.6% |
| $25,000 to $34,999 | 105 | 5.7% |
| $35,000 to $49,999 | 132 | 7.2% |
| $50,000 to $74,999 | 186 | 10.1% |
| $75,000 to $99,999 | 175 | 9.5% |
| $100,000 to $149,999 | 456 | 24.8% |
| $150,000 to $199,999 | 377 | 20.5% |
| $200,000+ | 314 | 17.1% |
Family Income by Famaliy Size in Lower Allen
6-person families (83 | 4.5%) account for the highest median family income in Lower Allen with $250,001 per family, while 2-person families (894 | 48.6%) have the highest median income of $61,643 per family member.
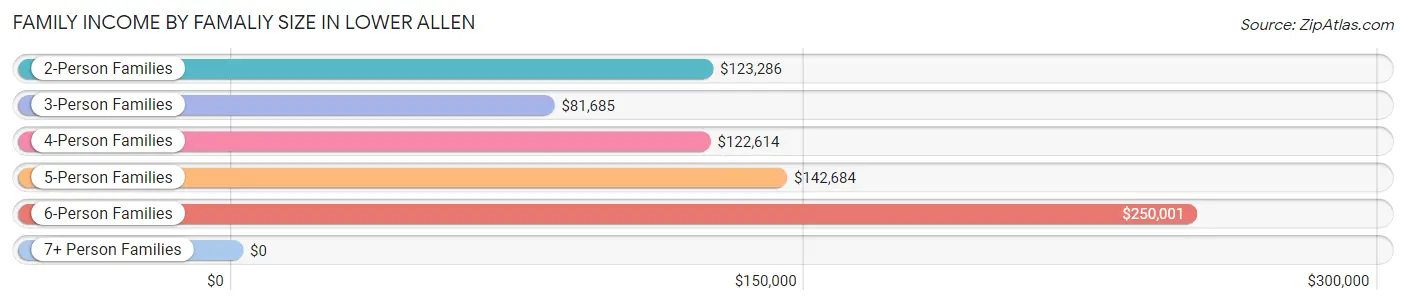
| Income Bracket | # Families | Median Income |
| 2-Person Families | 894 (48.6%) | $123,286 |
| 3-Person Families | 473 (25.7%) | $81,685 |
| 4-Person Families | 219 (11.9%) | $122,614 |
| 5-Person Families | 169 (9.2%) | $142,684 |
| 6-Person Families | 83 (4.5%) | $250,001 |
| 7+ Person Families | 0 (0.0%) | $0 |
| Total | 1,838 (100.0%) | $111,875 |
Family Income by Number of Earners in Lower Allen
The median family income in Lower Allen is $111,875, with families comprising 3+ earners (238) having the highest median family income of $152,778, while families with no earners (269) have the lowest median family income of $52,344, accounting for 13.0% and 14.6% of families, respectively.
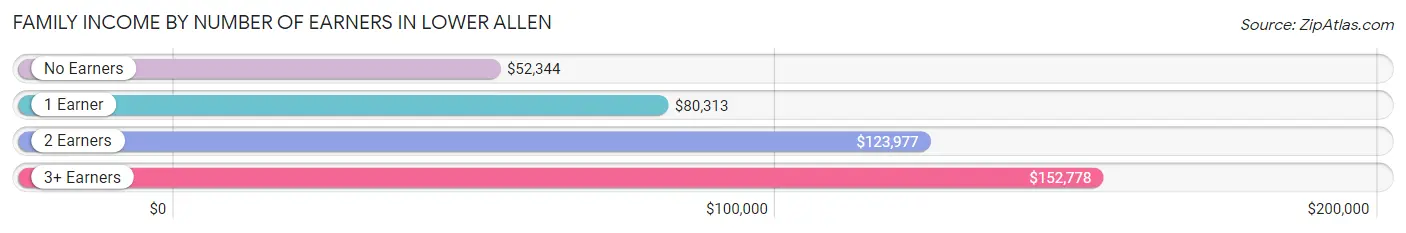
| Number of Earners | # Families | Median Income |
| No Earners | 269 (14.6%) | $52,344 |
| 1 Earner | 440 (23.9%) | $80,313 |
| 2 Earners | 891 (48.5%) | $123,977 |
| 3+ Earners | 238 (13.0%) | $152,778 |
| Total | 1,838 (100.0%) | $111,875 |
Household Income in Lower Allen
Household Income Brackets in Lower Allen
With 557 households falling in the category, the $100,000 to $149,999 income range is the most frequent in Lower Allen, accounting for 17.2% of all households. In contrast, only 45 households (1.4%) fall into the $10,000 to $14,999 income bracket, making it the least populous group.
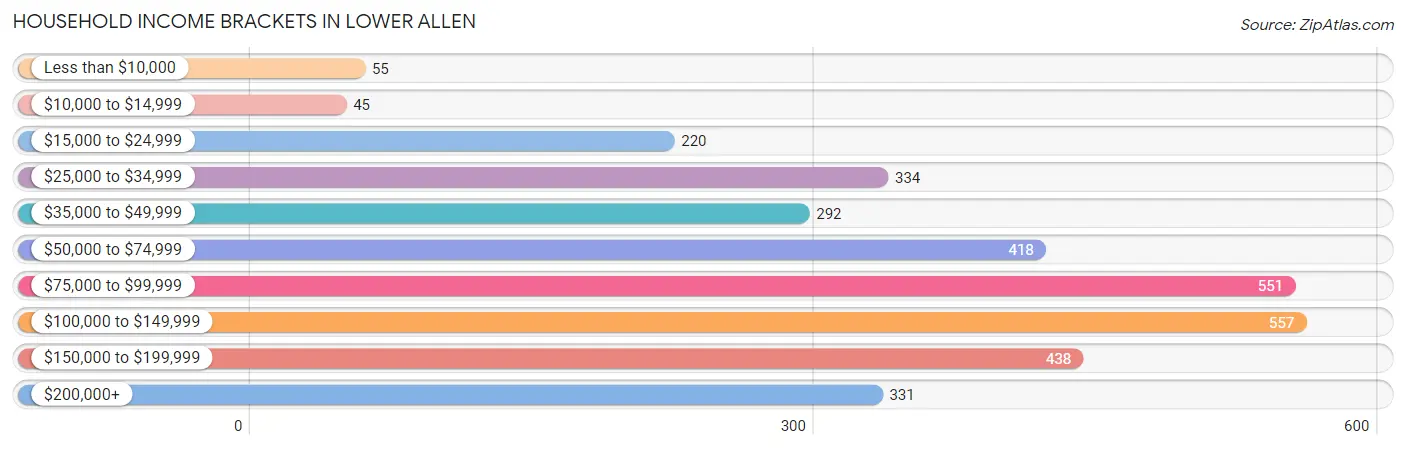
| Income Bracket | # Households | % Households |
| Less than $10,000 | 55 | 1.7% |
| $10,000 to $14,999 | 45 | 1.4% |
| $15,000 to $24,999 | 220 | 6.8% |
| $25,000 to $34,999 | 334 | 10.3% |
| $35,000 to $49,999 | 292 | 9.0% |
| $50,000 to $74,999 | 418 | 12.9% |
| $75,000 to $99,999 | 551 | 17.0% |
| $100,000 to $149,999 | 557 | 17.2% |
| $150,000 to $199,999 | 438 | 13.5% |
| $200,000+ | 331 | 10.2% |
Household Income by Householder Age in Lower Allen
The median household income in Lower Allen is $83,814, with the highest median household income of $135,438 found in the 45 to 64 years age bracket for the primary householder. A total of 1,055 households (32.6%) fall into this category. Meanwhile, the 15 to 24 years age bracket for the primary householder has the lowest median household income of $29,500, with 102 households (3.2%) in this group.
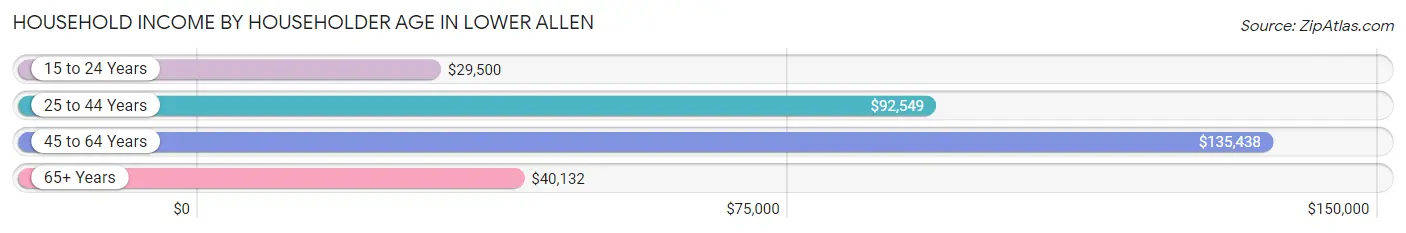
| Income Bracket | # Households | Median Income |
| 15 to 24 Years | 102 (3.2%) | $29,500 |
| 25 to 44 Years | 1,050 (32.4%) | $92,549 |
| 45 to 64 Years | 1,055 (32.6%) | $135,438 |
| 65+ Years | 1,034 (31.9%) | $40,132 |
| Total | 3,241 (100.0%) | $83,814 |
Poverty in Lower Allen
Income Below Poverty by Sex and Age in Lower Allen
With 3.2% poverty level for males and 4.2% for females among the residents of Lower Allen, 6 to 11 year old males and 18 to 24 year old females are the most vulnerable to poverty, with 30 males (18.4%) and 75 females (23.5%) in their respective age groups living below the poverty level.
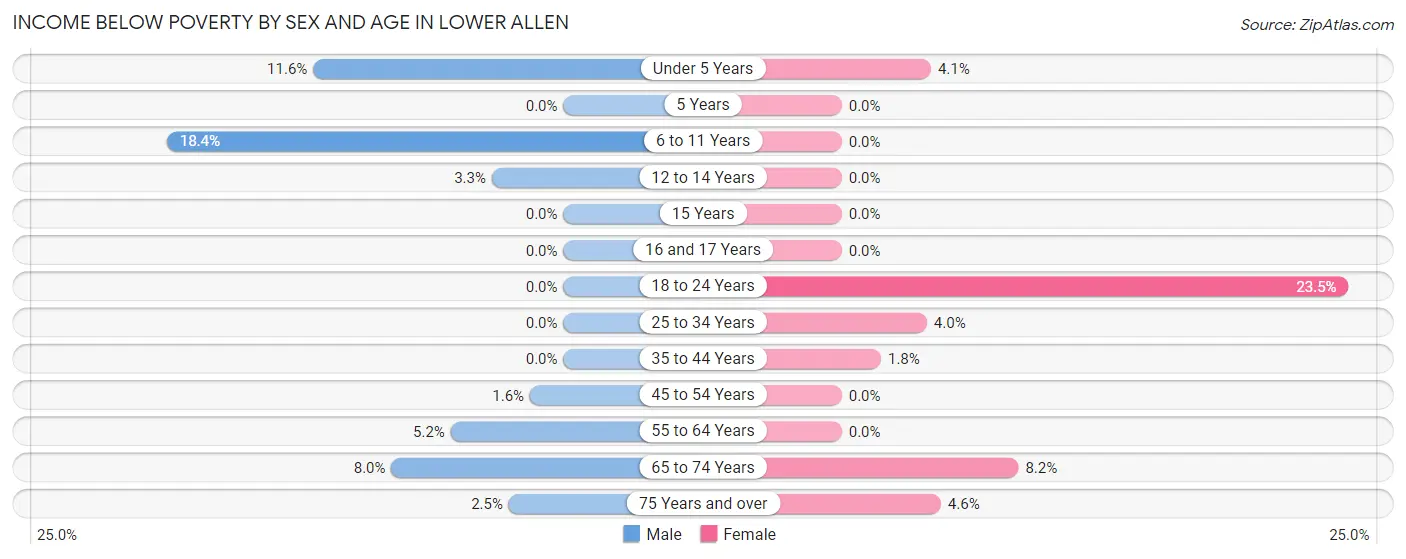
| Age Bracket | Male | Female |
| Under 5 Years | 13 (11.6%) | 6 (4.1%) |
| 5 Years | 0 (0.0%) | 0 (0.0%) |
| 6 to 11 Years | 30 (18.4%) | 0 (0.0%) |
| 12 to 14 Years | 7 (3.3%) | 0 (0.0%) |
| 15 Years | 0 (0.0%) | 0 (0.0%) |
| 16 and 17 Years | 0 (0.0%) | 0 (0.0%) |
| 18 to 24 Years | 0 (0.0%) | 75 (23.5%) |
| 25 to 34 Years | 0 (0.0%) | 20 (4.0%) |
| 35 to 44 Years | 0 (0.0%) | 9 (1.8%) |
| 45 to 54 Years | 9 (1.5%) | 0 (0.0%) |
| 55 to 64 Years | 28 (5.2%) | 0 (0.0%) |
| 65 to 74 Years | 17 (8.0%) | 25 (8.2%) |
| 75 Years and over | 7 (2.5%) | 27 (4.6%) |
| Total | 111 (3.2%) | 162 (4.2%) |
Income Above Poverty by Sex and Age in Lower Allen
According to the poverty statistics in Lower Allen, males aged 5 years and females aged 5 years are the age groups that are most secure financially, with 100.0% of males and 100.0% of females in these age groups living above the poverty line.
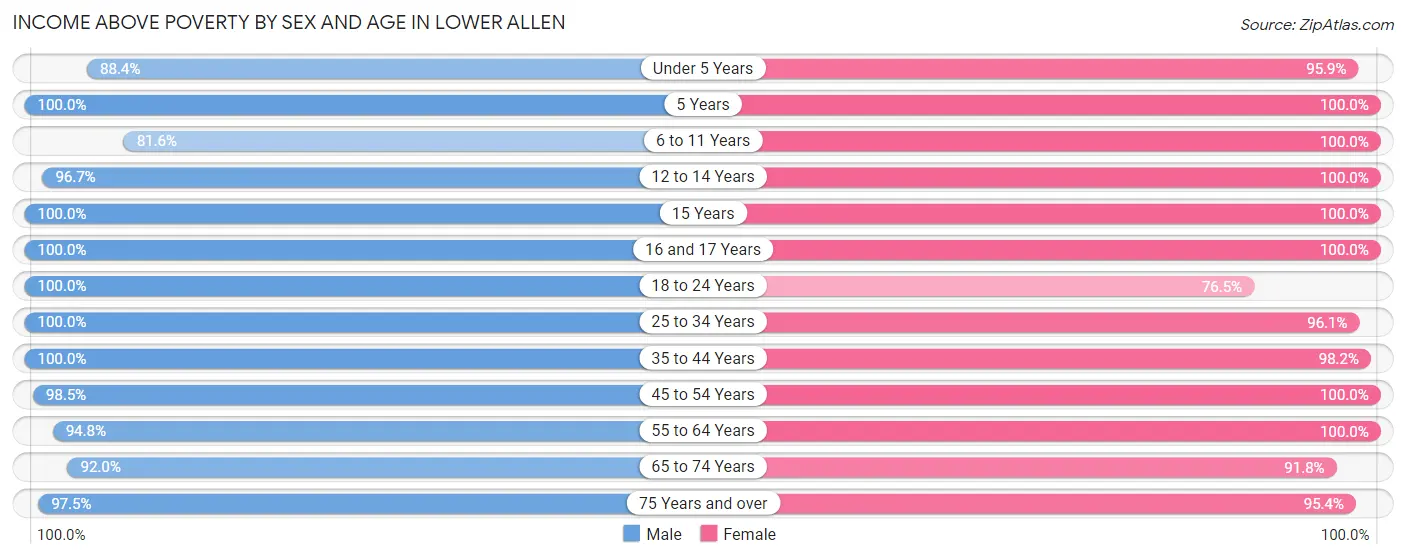
| Age Bracket | Male | Female |
| Under 5 Years | 99 (88.4%) | 139 (95.9%) |
| 5 Years | 86 (100.0%) | 29 (100.0%) |
| 6 to 11 Years | 133 (81.6%) | 273 (100.0%) |
| 12 to 14 Years | 204 (96.7%) | 217 (100.0%) |
| 15 Years | 14 (100.0%) | 105 (100.0%) |
| 16 and 17 Years | 153 (100.0%) | 87 (100.0%) |
| 18 to 24 Years | 178 (100.0%) | 244 (76.5%) |
| 25 to 34 Years | 595 (100.0%) | 486 (96.1%) |
| 35 to 44 Years | 334 (100.0%) | 486 (98.2%) |
| 45 to 54 Years | 572 (98.5%) | 448 (100.0%) |
| 55 to 64 Years | 507 (94.8%) | 367 (100.0%) |
| 65 to 74 Years | 196 (92.0%) | 280 (91.8%) |
| 75 Years and over | 270 (97.5%) | 560 (95.4%) |
| Total | 3,341 (96.8%) | 3,721 (95.8%) |
Income Below Poverty Among Married-Couple Families in Lower Allen
The poverty statistics for married-couple families in Lower Allen show that 0.5% or 7 of the total 1,491 families live below the poverty line. Families with no children have the highest poverty rate of 0.8%, comprising of 7 families. On the other hand, families with 1 or 2 children have the lowest poverty rate of 0.0%, which includes 0 families.
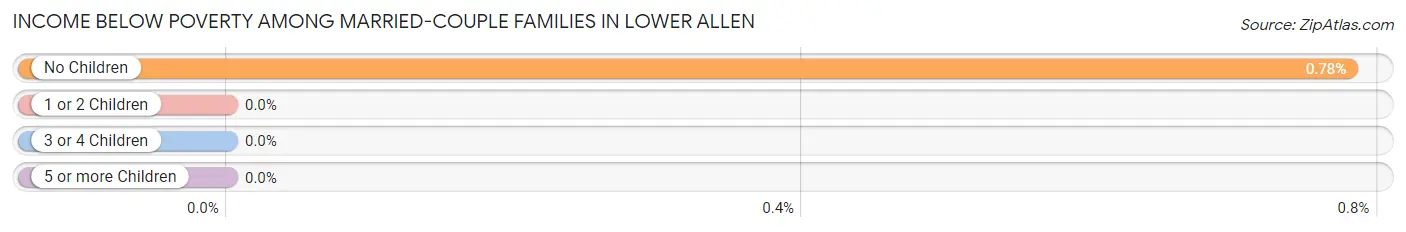
| Children | Above Poverty | Below Poverty |
| No Children | 892 (99.2%) | 7 (0.8%) |
| 1 or 2 Children | 409 (100.0%) | 0 (0.0%) |
| 3 or 4 Children | 183 (100.0%) | 0 (0.0%) |
| 5 or more Children | 0 (0.0%) | 0 (0.0%) |
| Total | 1,484 (99.5%) | 7 (0.5%) |
Income Below Poverty Among Single-Parent Households in Lower Allen
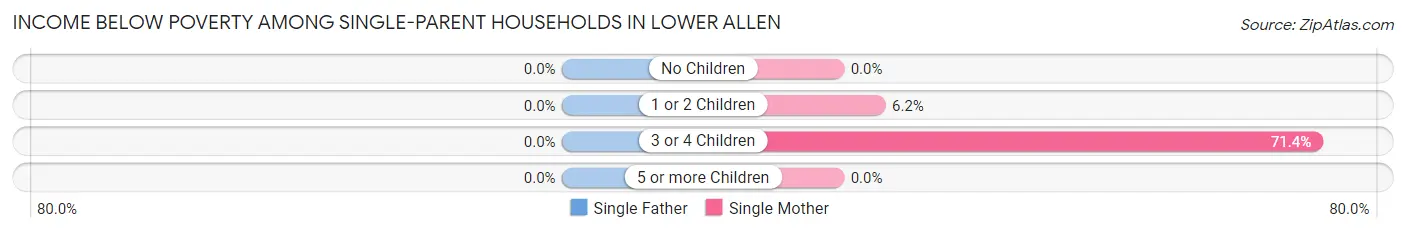
| Children | Single Father | Single Mother |
| No Children | 0 (0.0%) | 0 (0.0%) |
| 1 or 2 Children | 0 (0.0%) | 10 (6.2%) |
| 3 or 4 Children | 0 (0.0%) | 20 (71.4%) |
| 5 or more Children | 0 (0.0%) | 0 (0.0%) |
| Total | 0 (0.0%) | 30 (11.0%) |
Income Below Poverty Among Married-Couple vs Single-Parent Households in Lower Allen
The poverty data for Lower Allen shows that 7 of the married-couple family households (0.5%) and 30 of the single-parent households (8.6%) are living below the poverty level. Within the married-couple family households, those with no children have the highest poverty rate, with 7 households (0.8%) falling below the poverty line. Among the single-parent households, those with 3 or 4 children have the highest poverty rate, with 20 household (71.4%) living below poverty.
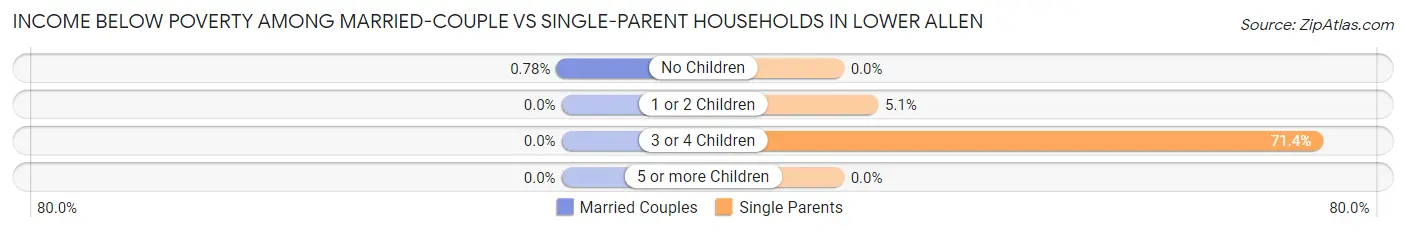
| Children | Married-Couple Families | Single-Parent Households |
| No Children | 7 (0.8%) | 0 (0.0%) |
| 1 or 2 Children | 0 (0.0%) | 10 (5.1%) |
| 3 or 4 Children | 0 (0.0%) | 20 (71.4%) |
| 5 or more Children | 0 (0.0%) | 0 (0.0%) |
| Total | 7 (0.5%) | 30 (8.6%) |
Race in Lower Allen
The most populous races in Lower Allen are White / Caucasian (6,345 | 86.3%), Hispanic or Latino (606 | 8.2%), and Two or more Races (399 | 5.4%).
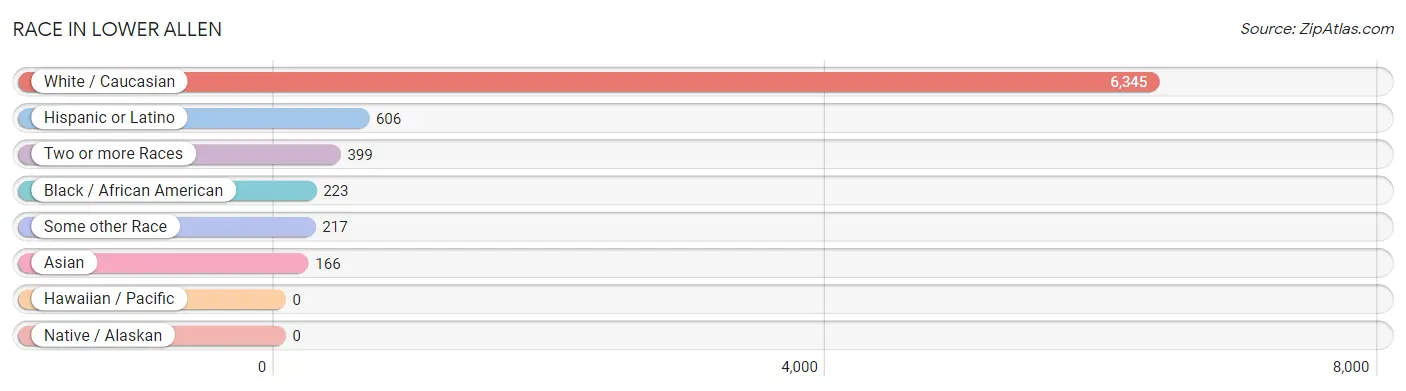
| Race | # Population | % Population |
| Asian | 166 | 2.3% |
| Black / African American | 223 | 3.0% |
| Hawaiian / Pacific | 0 | 0.0% |
| Hispanic or Latino | 606 | 8.2% |
| Native / Alaskan | 0 | 0.0% |
| White / Caucasian | 6,345 | 86.3% |
| Two or more Races | 399 | 5.4% |
| Some other Race | 217 | 2.9% |
| Total | 7,350 | 100.0% |
Ancestry in Lower Allen
The most populous ancestries reported in Lower Allen are German (1,858 | 25.3%), Irish (1,019 | 13.9%), English (857 | 11.7%), French (451 | 6.1%), and American (407 | 5.5%), together accounting for 62.5% of all Lower Allen residents.
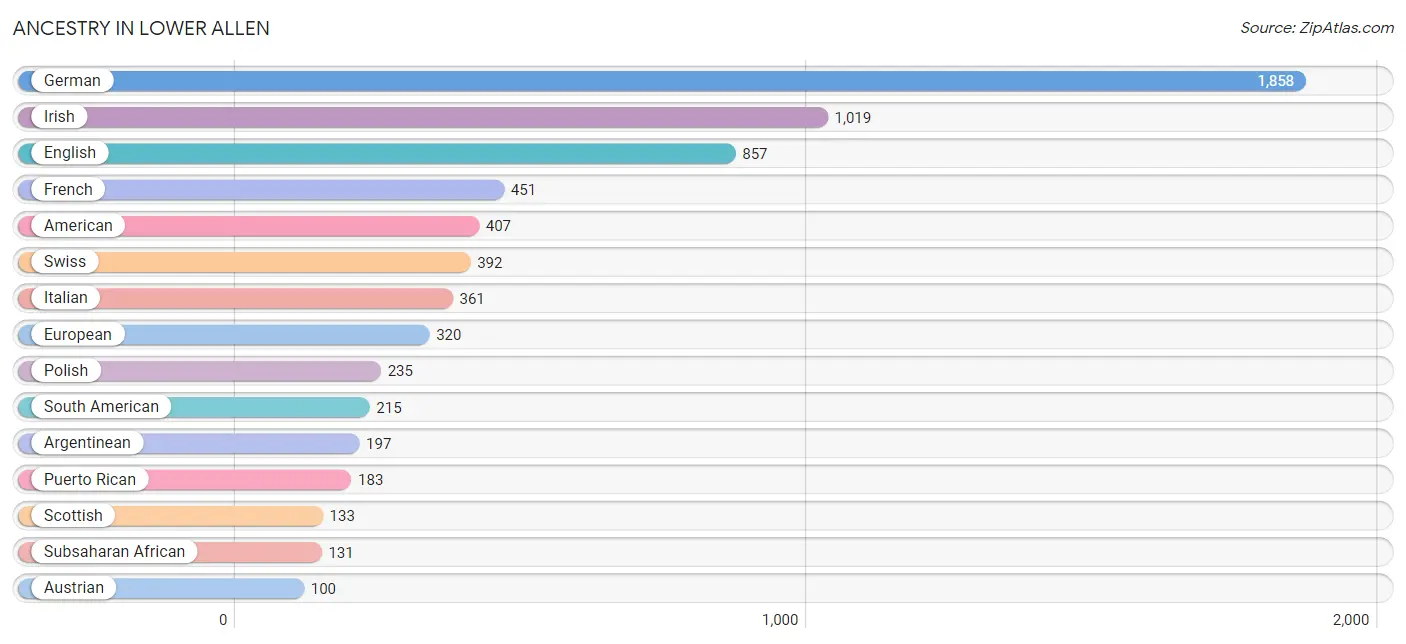
| Ancestry | # Population | % Population |
| African | 60 | 0.8% |
| American | 407 | 5.5% |
| Arab | 25 | 0.3% |
| Argentinean | 197 | 2.7% |
| Austrian | 100 | 1.4% |
| Bhutanese | 4 | 0.1% |
| British | 43 | 0.6% |
| Burmese | 13 | 0.2% |
| Canadian | 20 | 0.3% |
| Croatian | 18 | 0.2% |
| Cuban | 51 | 0.7% |
| Czech | 50 | 0.7% |
| Dutch | 17 | 0.2% |
| Eastern European | 63 | 0.9% |
| English | 857 | 11.7% |
| European | 320 | 4.3% |
| French | 451 | 6.1% |
| French American Indian | 16 | 0.2% |
| French Canadian | 49 | 0.7% |
| German | 1,858 | 25.3% |
| Greek | 16 | 0.2% |
| Hungarian | 64 | 0.9% |
| Icelander | 14 | 0.2% |
| Indian (Asian) | 66 | 0.9% |
| Indonesian | 82 | 1.1% |
| Irish | 1,019 | 13.9% |
| Italian | 361 | 4.9% |
| Lithuanian | 26 | 0.4% |
| Mexican | 90 | 1.2% |
| Moroccan | 25 | 0.3% |
| Norwegian | 26 | 0.4% |
| Pennsylvania German | 73 | 1.0% |
| Peruvian | 18 | 0.2% |
| Polish | 235 | 3.2% |
| Portuguese | 30 | 0.4% |
| Puerto Rican | 183 | 2.5% |
| Romanian | 84 | 1.1% |
| Scotch-Irish | 29 | 0.4% |
| Scottish | 133 | 1.8% |
| Slavic | 7 | 0.1% |
| Slovak | 7 | 0.1% |
| South African | 16 | 0.2% |
| South American | 215 | 2.9% |
| Spaniard | 67 | 0.9% |
| Subsaharan African | 131 | 1.8% |
| Sudanese | 34 | 0.5% |
| Swedish | 38 | 0.5% |
| Swiss | 392 | 5.3% |
| Ukrainian | 25 | 0.3% |
| Welsh | 49 | 0.7% |
| Yugoslavian | 15 | 0.2% | View All 51 Rows |
Immigrants in Lower Allen
The most numerous immigrant groups reported in Lower Allen came from Asia (150 | 2.0%), Europe (140 | 1.9%), Western Europe (83 | 1.1%), South Eastern Asia (82 | 1.1%), and France (76 | 1.0%), together accounting for 7.2% of all Lower Allen residents.
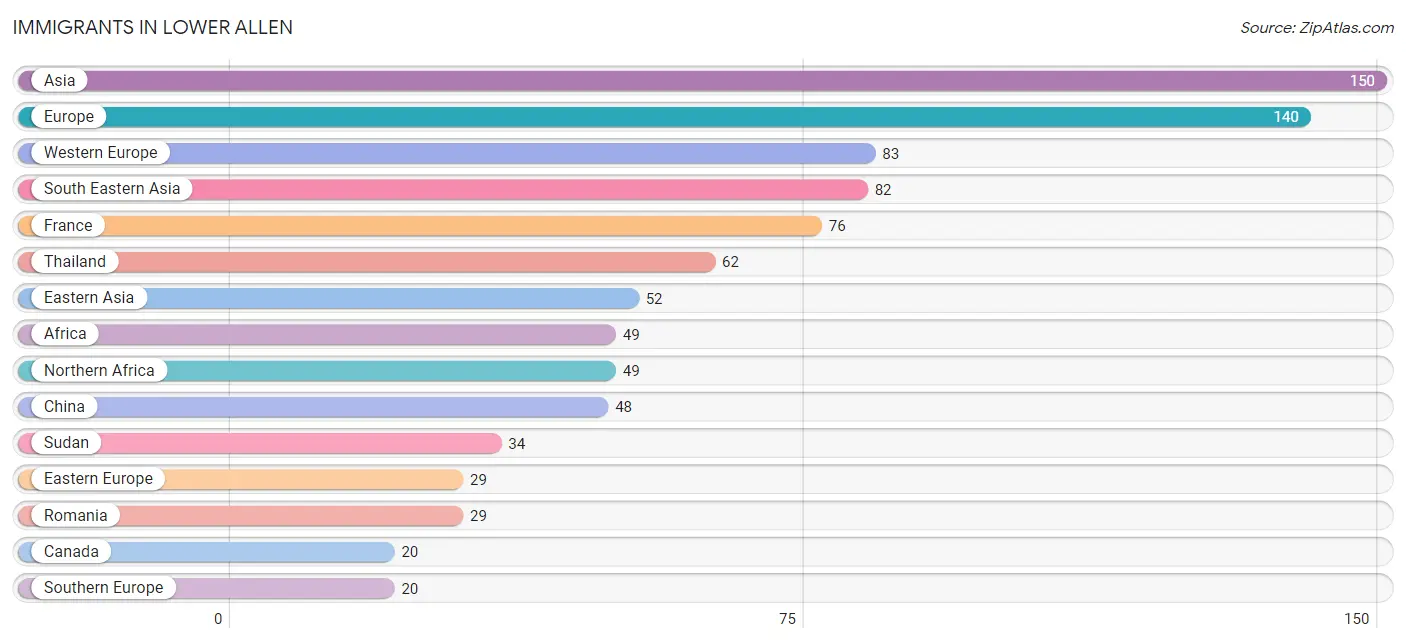
| Immigration Origin | # Population | % Population |
| Africa | 49 | 0.7% |
| Asia | 150 | 2.0% |
| Canada | 20 | 0.3% |
| China | 48 | 0.6% |
| Eastern Asia | 52 | 0.7% |
| Eastern Europe | 29 | 0.4% |
| England | 8 | 0.1% |
| Europe | 140 | 1.9% |
| France | 76 | 1.0% |
| Germany | 7 | 0.1% |
| Israel | 16 | 0.2% |
| Japan | 4 | 0.1% |
| Latin America | 18 | 0.2% |
| Morocco | 15 | 0.2% |
| Northern Africa | 49 | 0.7% |
| Northern Europe | 8 | 0.1% |
| Peru | 18 | 0.2% |
| Romania | 29 | 0.4% |
| South America | 18 | 0.2% |
| South Eastern Asia | 82 | 1.1% |
| Southern Europe | 20 | 0.3% |
| Spain | 20 | 0.3% |
| Sudan | 34 | 0.5% |
| Thailand | 62 | 0.8% |
| Western Asia | 16 | 0.2% |
| Western Europe | 83 | 1.1% | View All 26 Rows |
Sex and Age in Lower Allen
Sex and Age in Lower Allen
The most populous age groups in Lower Allen are 10 to 14 Years (346 | 10.0%) for men and 10 to 14 Years (349 | 9.0%) for women.
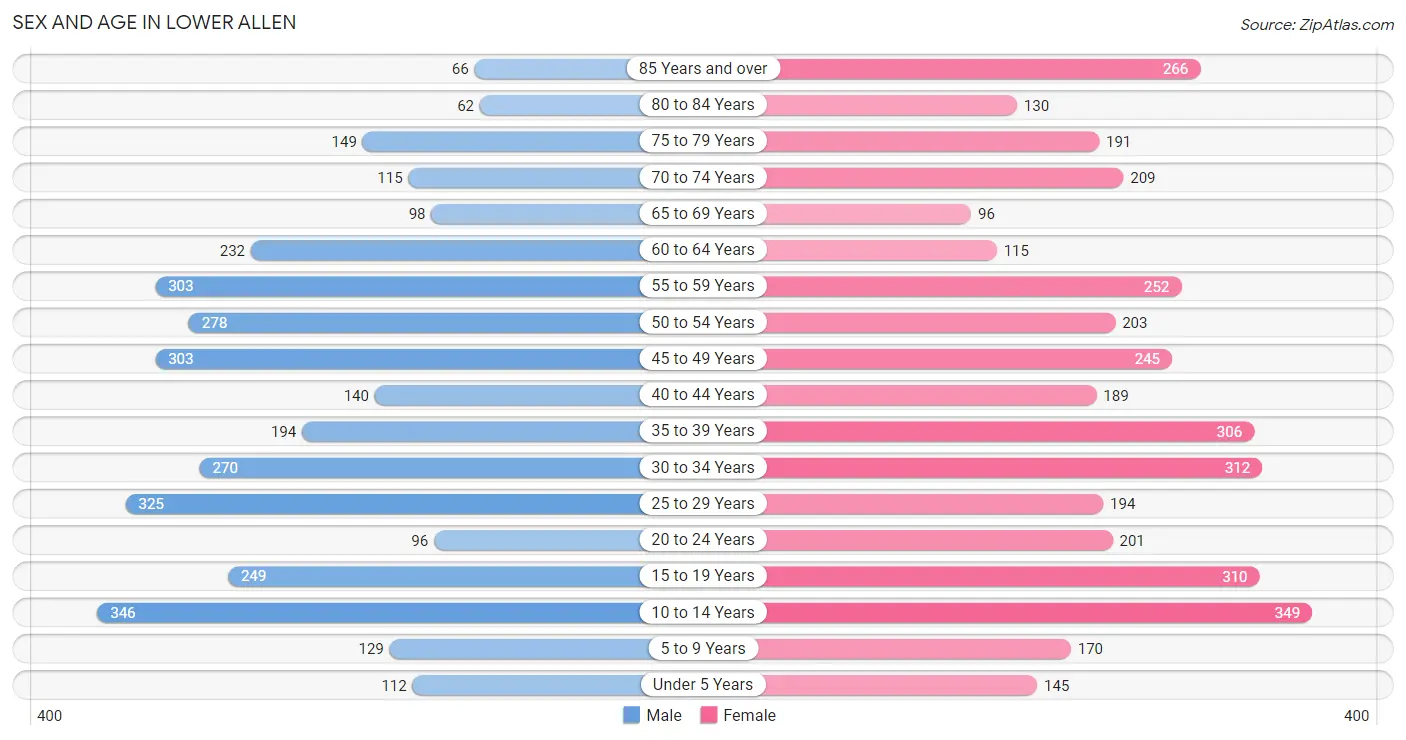
| Age Bracket | Male | Female |
| Under 5 Years | 112 (3.2%) | 145 (3.7%) |
| 5 to 9 Years | 129 (3.7%) | 170 (4.4%) |
| 10 to 14 Years | 346 (10.0%) | 349 (9.0%) |
| 15 to 19 Years | 249 (7.2%) | 310 (8.0%) |
| 20 to 24 Years | 96 (2.8%) | 201 (5.2%) |
| 25 to 29 Years | 325 (9.4%) | 194 (5.0%) |
| 30 to 34 Years | 270 (7.8%) | 312 (8.0%) |
| 35 to 39 Years | 194 (5.6%) | 306 (7.9%) |
| 40 to 44 Years | 140 (4.0%) | 189 (4.9%) |
| 45 to 49 Years | 303 (8.7%) | 245 (6.3%) |
| 50 to 54 Years | 278 (8.0%) | 203 (5.2%) |
| 55 to 59 Years | 303 (8.7%) | 252 (6.5%) |
| 60 to 64 Years | 232 (6.7%) | 115 (3.0%) |
| 65 to 69 Years | 98 (2.8%) | 96 (2.5%) |
| 70 to 74 Years | 115 (3.3%) | 209 (5.4%) |
| 75 to 79 Years | 149 (4.3%) | 191 (4.9%) |
| 80 to 84 Years | 62 (1.8%) | 130 (3.4%) |
| 85 Years and over | 66 (1.9%) | 266 (6.9%) |
| Total | 3,467 (100.0%) | 3,883 (100.0%) |
Families and Households in Lower Allen
Median Family Size in Lower Allen
The median family size in Lower Allen is 3.04 persons per family, with single male/father families (74 | 4.0%) accounting for the largest median family size of 3.22 persons per family. On the other hand, single female/mother families (273 | 14.8%) represent the smallest median family size with 3.01 persons per family.
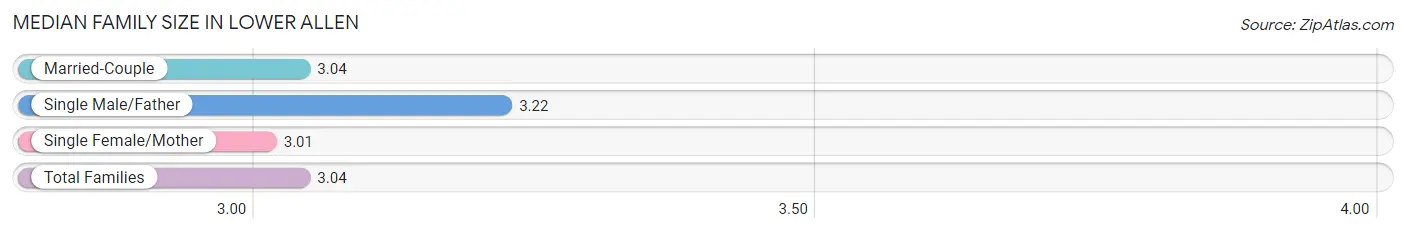
| Family Type | # Families | Family Size |
| Married-Couple | 1,491 (81.1%) | 3.04 |
| Single Male/Father | 74 (4.0%) | 3.22 |
| Single Female/Mother | 273 (14.8%) | 3.01 |
| Total Families | 1,838 (100.0%) | 3.04 |
Median Household Size in Lower Allen
The median household size in Lower Allen is 2.27 persons per household, with single male/father households (74 | 2.3%) accounting for the largest median household size of 3.32 persons per household. non-family households (1,403 | 43.3%) represent the smallest median household size with 1.20 persons per household.
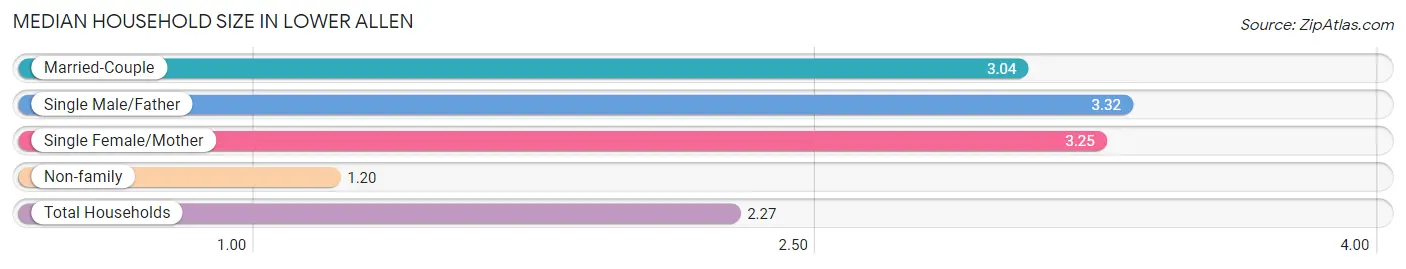
| Household Type | # Households | Household Size |
| Married-Couple | 1,491 (46.0%) | 3.04 |
| Single Male/Father | 74 (2.3%) | 3.32 |
| Single Female/Mother | 273 (8.4%) | 3.25 |
| Non-family | 1,403 (43.3%) | 1.20 |
| Total Households | 3,241 (100.0%) | 2.27 |
Household Size by Marriage Status in Lower Allen
Out of a total of 3,241 households in Lower Allen, 1,838 (56.7%) are family households, while 1,403 (43.3%) are nonfamily households. The most numerous type of family households are 2-person households, comprising 879, and the most common type of nonfamily households are 1-person households, comprising 1,162.
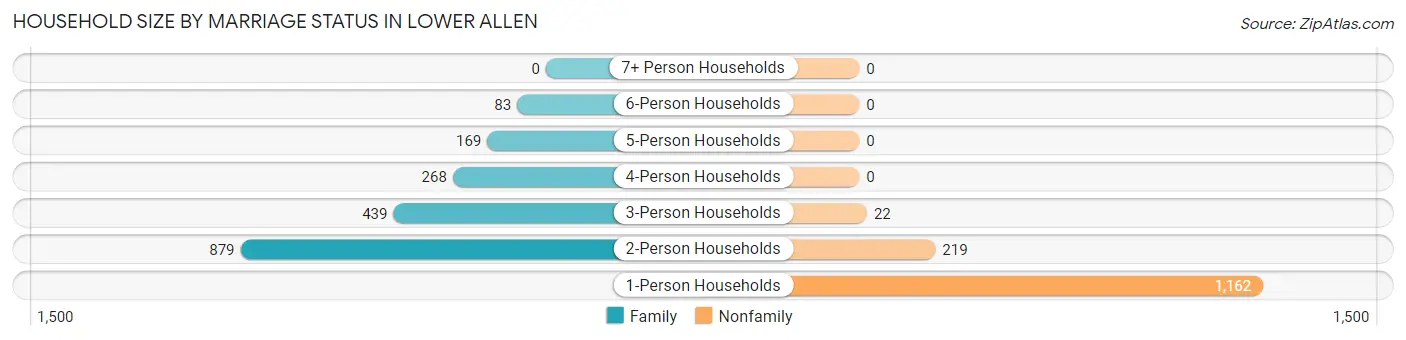
| Household Size | Family Households | Nonfamily Households |
| 1-Person Households | - | 1,162 (35.8%) |
| 2-Person Households | 879 (27.1%) | 219 (6.8%) |
| 3-Person Households | 439 (13.6%) | 22 (0.7%) |
| 4-Person Households | 268 (8.3%) | 0 (0.0%) |
| 5-Person Households | 169 (5.2%) | 0 (0.0%) |
| 6-Person Households | 83 (2.6%) | 0 (0.0%) |
| 7+ Person Households | 0 (0.0%) | 0 (0.0%) |
| Total | 1,838 (56.7%) | 1,403 (43.3%) |
Female Fertility in Lower Allen
Fertility by Age in Lower Allen
Average fertility rate in Lower Allen is 43.0 births per 1,000 women. Women in the age bracket of 20 to 34 years have the highest fertility rate with 62.0 births per 1,000 women. Women in the age bracket of 20 to 34 years acount for 58.7% of all women with births.
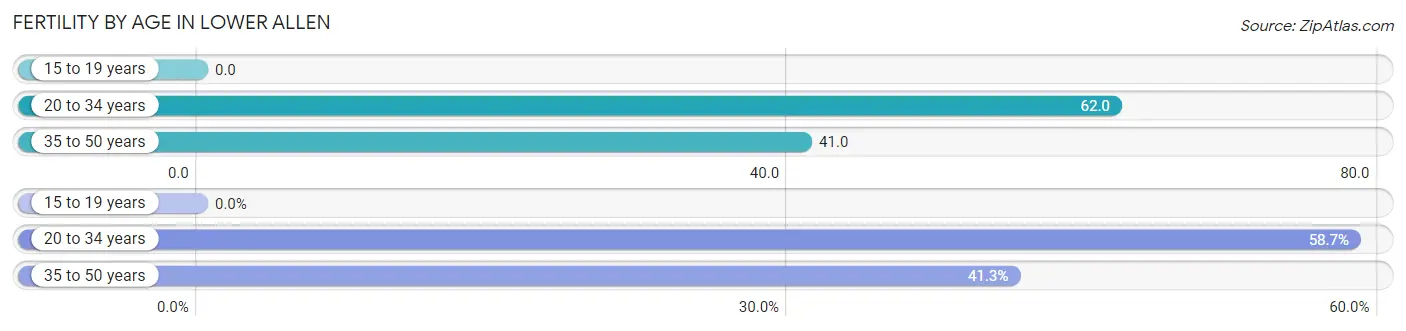
| Age Bracket | Women with Births | Births / 1,000 Women |
| 15 to 19 years | 0 (0.0%) | 0.0 |
| 20 to 34 years | 44 (58.7%) | 62.0 |
| 35 to 50 years | 31 (41.3%) | 41.0 |
| Total | 75 (100.0%) | 43.0 |
Fertility by Age by Marriage Status in Lower Allen
62.7% of women with births (75) in Lower Allen are married. The highest percentage of unmarried women with births falls into 20 to 34 years age bracket with 63.6% of them unmarried at the time of birth, while the lowest percentage of unmarried women with births belong to 35 to 50 years age bracket with 0.0% of them unmarried.
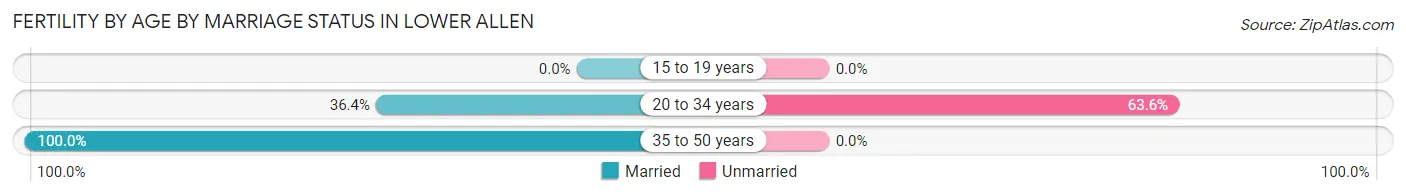
| Age Bracket | Married | Unmarried |
| 15 to 19 years | 0 (0.0%) | 0 (0.0%) |
| 20 to 34 years | 16 (36.4%) | 28 (63.6%) |
| 35 to 50 years | 31 (100.0%) | 0 (0.0%) |
| Total | 47 (62.7%) | 28 (37.3%) |
Fertility by Education in Lower Allen
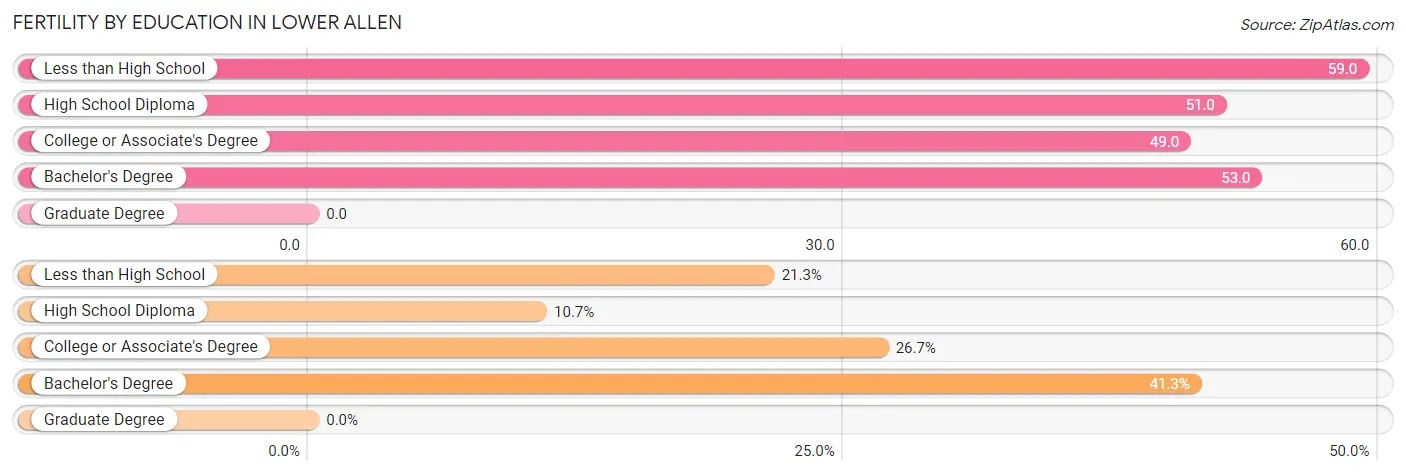
| Educational Attainment | Women with Births | Births / 1,000 Women |
| Less than High School | 16 (21.3%) | 59.0 |
| High School Diploma | 8 (10.7%) | 51.0 |
| College or Associate's Degree | 20 (26.7%) | 49.0 |
| Bachelor's Degree | 31 (41.3%) | 53.0 |
| Graduate Degree | 0 (0.0%) | 0.0 |
| Total | 75 (100.0%) | 43.0 |
Fertility by Education by Marriage Status in Lower Allen
37.3% of women with births in Lower Allen are unmarried. Women with the educational attainment of less than high school are most likely to be married with 100.0% of them married at childbirth, while women with the educational attainment of high school diploma are least likely to be married with 100.0% of them unmarried at childbirth.
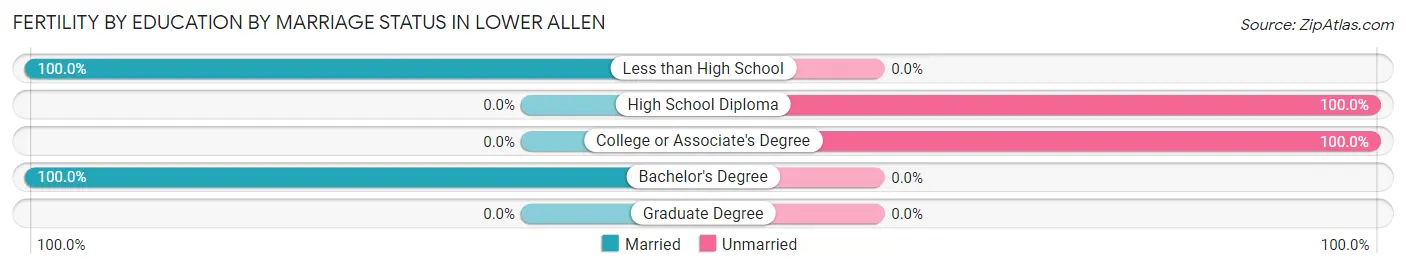
| Educational Attainment | Married | Unmarried |
| Less than High School | 16 (100.0%) | 0 (0.0%) |
| High School Diploma | 0 (0.0%) | 8 (100.0%) |
| College or Associate's Degree | 0 (0.0%) | 20 (100.0%) |
| Bachelor's Degree | 31 (100.0%) | 0 (0.0%) |
| Graduate Degree | 0 (0.0%) | 0 (0.0%) |
| Total | 47 (62.7%) | 28 (37.3%) |
Employment Characteristics in Lower Allen
Employment by Class of Employer in Lower Allen
Among the 3,911 employed individuals in Lower Allen, private company employees (2,482 | 63.5%), not-for-profit organizations (521 | 13.3%), and state government employees (329 | 8.4%) make up the most common classes of employment.
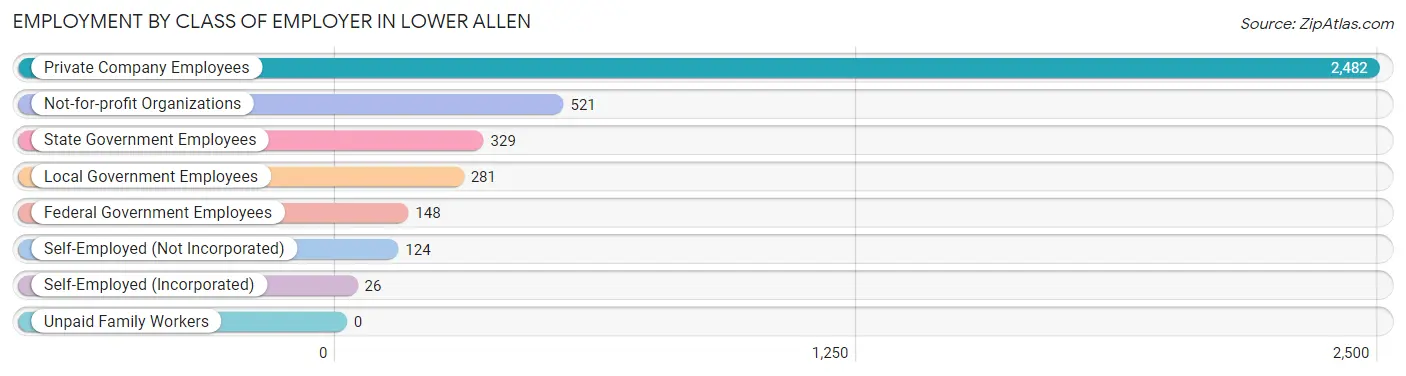
| Employer Class | # Employees | % Employees |
| Private Company Employees | 2,482 | 63.5% |
| Self-Employed (Incorporated) | 26 | 0.7% |
| Self-Employed (Not Incorporated) | 124 | 3.2% |
| Not-for-profit Organizations | 521 | 13.3% |
| Local Government Employees | 281 | 7.2% |
| State Government Employees | 329 | 8.4% |
| Federal Government Employees | 148 | 3.8% |
| Unpaid Family Workers | 0 | 0.0% |
| Total | 3,911 | 100.0% |
Employment Status by Age in Lower Allen
According to the labor force statistics for Lower Allen, out of the total population over 16 years of age (5,980), 69.5% or 4,156 individuals are in the labor force, with 2.9% or 121 of them unemployed. The age group with the highest labor force participation rate is 25 to 29 years, with 96.0% or 498 individuals in the labor force. Within the labor force, the 16 to 19 years age range has the highest percentage of unemployed individuals, with 11.2% or 26 of them being unemployed.
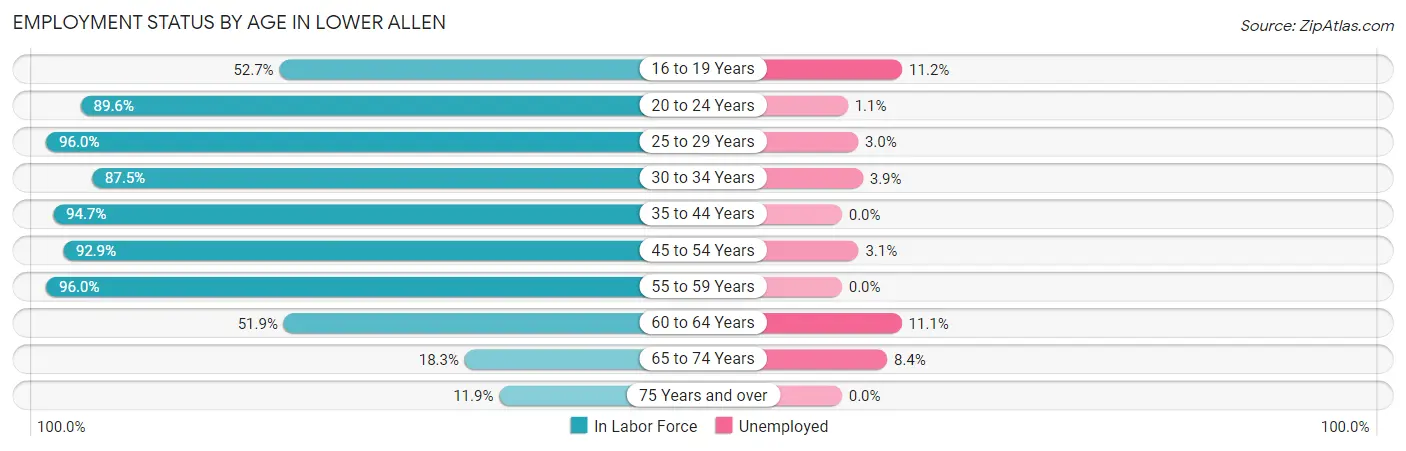
| Age Bracket | In Labor Force | Unemployed |
| 16 to 19 Years | 232 (52.7%) | 26 (11.2%) |
| 20 to 24 Years | 266 (89.6%) | 3 (1.1%) |
| 25 to 29 Years | 498 (96.0%) | 15 (3.0%) |
| 30 to 34 Years | 509 (87.5%) | 20 (3.9%) |
| 35 to 44 Years | 785 (94.7%) | 0 (0.0%) |
| 45 to 54 Years | 956 (92.9%) | 30 (3.1%) |
| 55 to 59 Years | 533 (96.0%) | 0 (0.0%) |
| 60 to 64 Years | 180 (51.9%) | 20 (11.1%) |
| 65 to 74 Years | 95 (18.3%) | 8 (8.4%) |
| 75 Years and over | 103 (11.9%) | 0 (0.0%) |
| Total | 4,156 (69.5%) | 121 (2.9%) |
Employment Status by Educational Attainment in Lower Allen
According to labor force statistics for Lower Allen, 89.6% of individuals (3,459) out of the total population between 25 and 64 years of age (3,861) are in the labor force, with 2.4% or 83 of them being unemployed. The group with the highest labor force participation rate are those with the educational attainment of bachelor's degree or higher, with 95.2% or 1,926 individuals in the labor force. Within the labor force, individuals with high school diploma education have the highest percentage of unemployment, with 3.8% or 20 of them being unemployed.
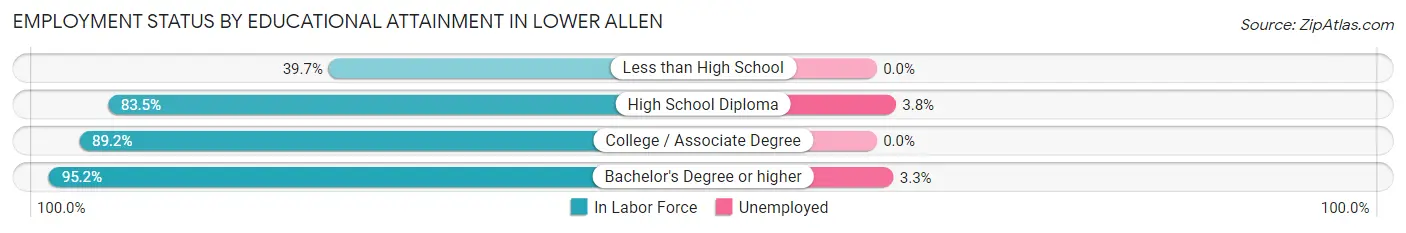
| Educational Attainment | In Labor Force | Unemployed |
| Less than High School | 54 (39.7%) | 0 (0.0%) |
| High School Diploma | 528 (83.5%) | 24 (3.8%) |
| College / Associate Degree | 954 (89.2%) | 0 (0.0%) |
| Bachelor's Degree or higher | 1,926 (95.2%) | 67 (3.3%) |
| Total | 3,459 (89.6%) | 93 (2.4%) |
Employment Occupations by Sex in Lower Allen
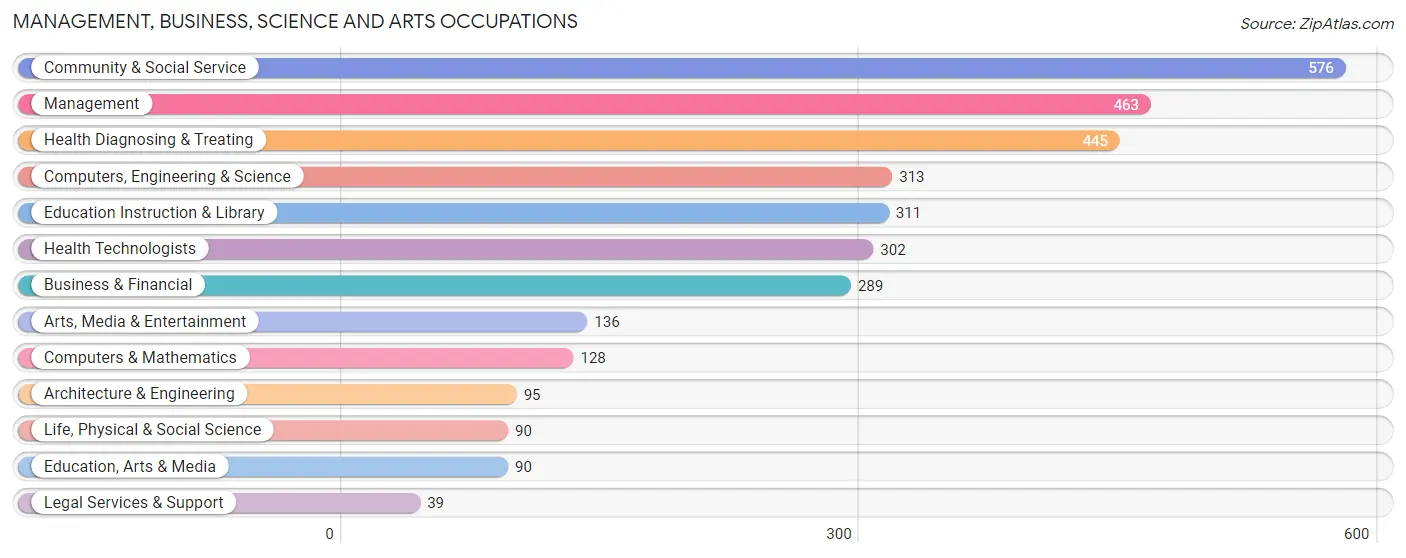
Management, Business, Science and Arts Occupations
The most common Management, Business, Science and Arts occupations in Lower Allen are Community & Social Service (576 | 14.3%), Management (463 | 11.5%), Health Diagnosing & Treating (445 | 11.1%), Computers, Engineering & Science (313 | 7.8%), and Education Instruction & Library (311 | 7.7%).
Management, Business, Science and Arts Occupations by Sex
Within the Management, Business, Science and Arts occupations in Lower Allen, the most male-oriented occupations are Computers & Mathematics (100.0%), Architecture & Engineering (100.0%), and Computers, Engineering & Science (76.4%), while the most female-oriented occupations are Health Technologists (91.7%), Life, Physical & Social Science (82.2%), and Health Diagnosing & Treating (81.6%).
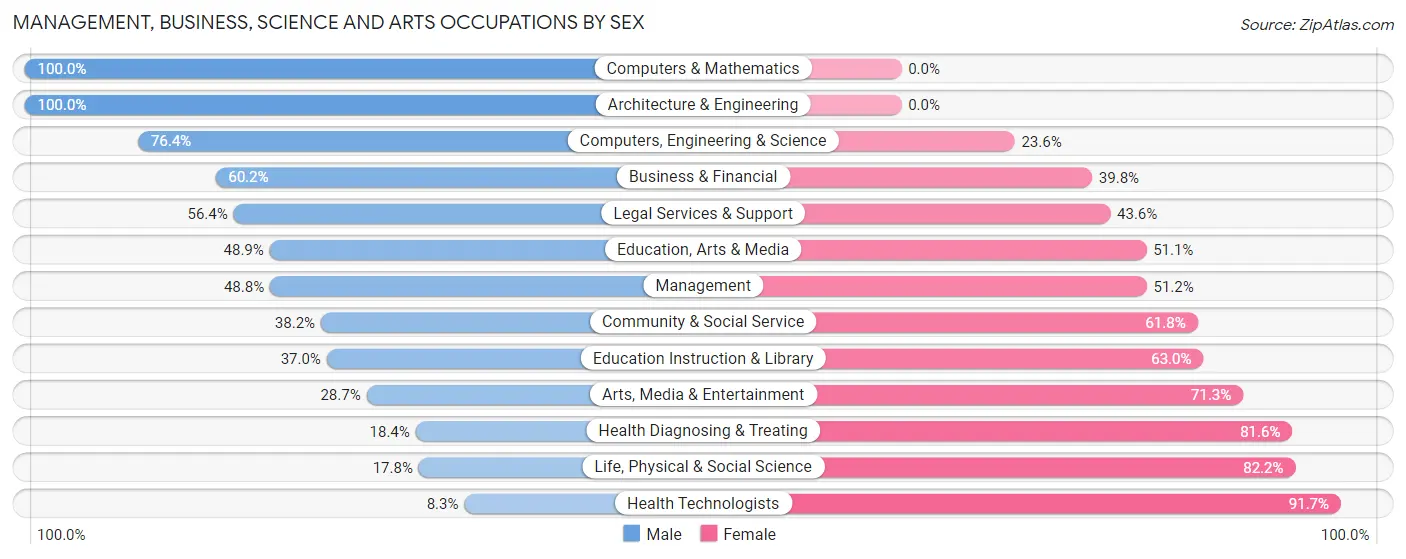
| Occupation | Male | Female |
| Management | 226 (48.8%) | 237 (51.2%) |
| Business & Financial | 174 (60.2%) | 115 (39.8%) |
| Computers, Engineering & Science | 239 (76.4%) | 74 (23.6%) |
| Computers & Mathematics | 128 (100.0%) | 0 (0.0%) |
| Architecture & Engineering | 95 (100.0%) | 0 (0.0%) |
| Life, Physical & Social Science | 16 (17.8%) | 74 (82.2%) |
| Community & Social Service | 220 (38.2%) | 356 (61.8%) |
| Education, Arts & Media | 44 (48.9%) | 46 (51.1%) |
| Legal Services & Support | 22 (56.4%) | 17 (43.6%) |
| Education Instruction & Library | 115 (37.0%) | 196 (63.0%) |
| Arts, Media & Entertainment | 39 (28.7%) | 97 (71.3%) |
| Health Diagnosing & Treating | 82 (18.4%) | 363 (81.6%) |
| Health Technologists | 25 (8.3%) | 277 (91.7%) |
| Total (Category) | 941 (45.1%) | 1,145 (54.9%) |
| Total (Overall) | 2,085 (51.9%) | 1,930 (48.1%) |
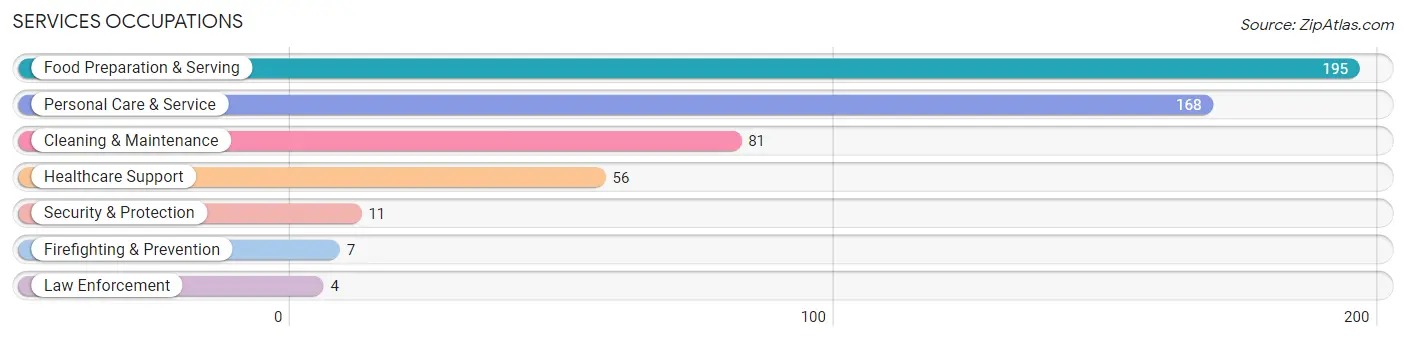
Services Occupations
The most common Services occupations in Lower Allen are Food Preparation & Serving (195 | 4.9%), Personal Care & Service (168 | 4.2%), Cleaning & Maintenance (81 | 2.0%), Healthcare Support (56 | 1.4%), and Security & Protection (11 | 0.3%).
Services Occupations by Sex
Within the Services occupations in Lower Allen, the most male-oriented occupations are Security & Protection (100.0%), Firefighting & Prevention (100.0%), and Law Enforcement (100.0%), while the most female-oriented occupations are Personal Care & Service (70.2%), Healthcare Support (66.1%), and Food Preparation & Serving (16.9%).
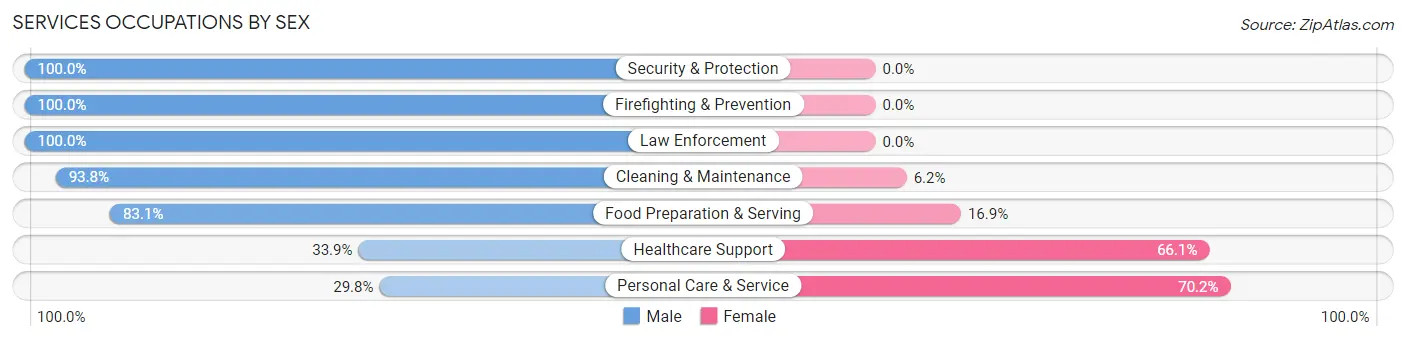
| Occupation | Male | Female |
| Healthcare Support | 19 (33.9%) | 37 (66.1%) |
| Security & Protection | 11 (100.0%) | 0 (0.0%) |
| Firefighting & Prevention | 7 (100.0%) | 0 (0.0%) |
| Law Enforcement | 4 (100.0%) | 0 (0.0%) |
| Food Preparation & Serving | 162 (83.1%) | 33 (16.9%) |
| Cleaning & Maintenance | 76 (93.8%) | 5 (6.2%) |
| Personal Care & Service | 50 (29.8%) | 118 (70.2%) |
| Total (Category) | 318 (62.2%) | 193 (37.8%) |
| Total (Overall) | 2,085 (51.9%) | 1,930 (48.1%) |
Sales and Office Occupations
The most common Sales and Office occupations in Lower Allen are Office & Administration (584 | 14.5%), and Sales & Related (412 | 10.3%).
Sales and Office Occupations by Sex
| Occupation | Male | Female |
| Sales & Related | 241 (58.5%) | 171 (41.5%) |
| Office & Administration | 176 (30.1%) | 408 (69.9%) |
| Total (Category) | 417 (41.9%) | 579 (58.1%) |
| Total (Overall) | 2,085 (51.9%) | 1,930 (48.1%) |
Natural Resources, Construction and Maintenance Occupations
The most common Natural Resources, Construction and Maintenance occupations in Lower Allen are Installation, Maintenance & Repair (75 | 1.9%), and Construction & Extraction (31 | 0.8%).
Natural Resources, Construction and Maintenance Occupations by Sex
| Occupation | Male | Female |
| Farming, Fishing & Forestry | 0 (0.0%) | 0 (0.0%) |
| Construction & Extraction | 31 (100.0%) | 0 (0.0%) |
| Installation, Maintenance & Repair | 75 (100.0%) | 0 (0.0%) |
| Total (Category) | 106 (100.0%) | 0 (0.0%) |
| Total (Overall) | 2,085 (51.9%) | 1,930 (48.1%) |
Production, Transportation and Moving Occupations
The most common Production, Transportation and Moving occupations in Lower Allen are Material Moving (131 | 3.3%), Transportation (130 | 3.2%), and Production (55 | 1.4%).
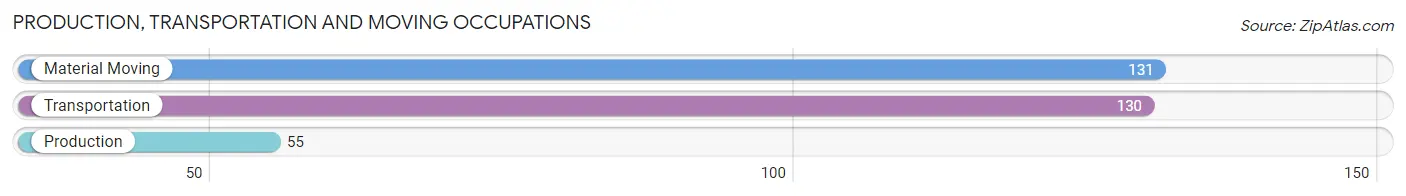
Production, Transportation and Moving Occupations by Sex
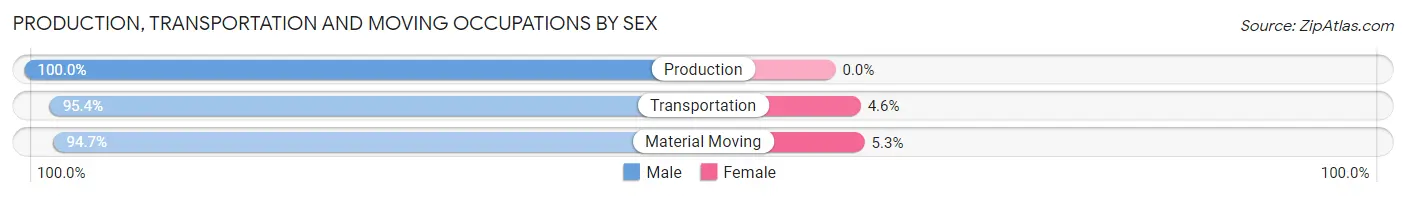
| Occupation | Male | Female |
| Production | 55 (100.0%) | 0 (0.0%) |
| Transportation | 124 (95.4%) | 6 (4.6%) |
| Material Moving | 124 (94.7%) | 7 (5.3%) |
| Total (Category) | 303 (95.9%) | 13 (4.1%) |
| Total (Overall) | 2,085 (51.9%) | 1,930 (48.1%) |
Employment Industries by Sex in Lower Allen
Employment Industries in Lower Allen
The major employment industries in Lower Allen include Health Care & Social Assistance (703 | 17.5%), Educational Services (512 | 12.8%), Retail Trade (484 | 12.0%), Public Administration (345 | 8.6%), and Professional & Scientific (334 | 8.3%).
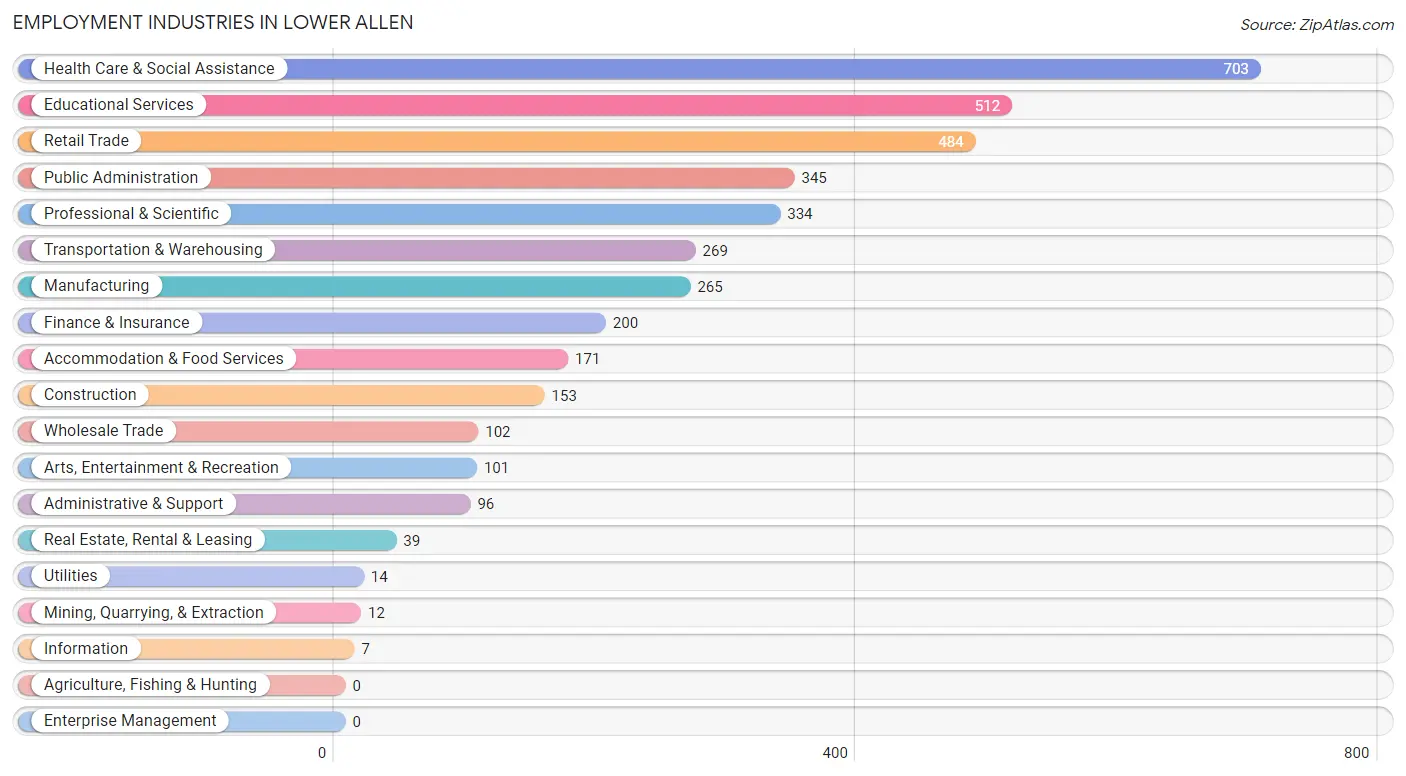
Employment Industries by Sex in Lower Allen
The Lower Allen industries that see more men than women are Construction (100.0%), Utilities (100.0%), and Information (100.0%), whereas the industries that tend to have a higher number of women are Mining, Quarrying, & Extraction (100.0%), Health Care & Social Assistance (82.8%), and Arts, Entertainment & Recreation (71.3%).
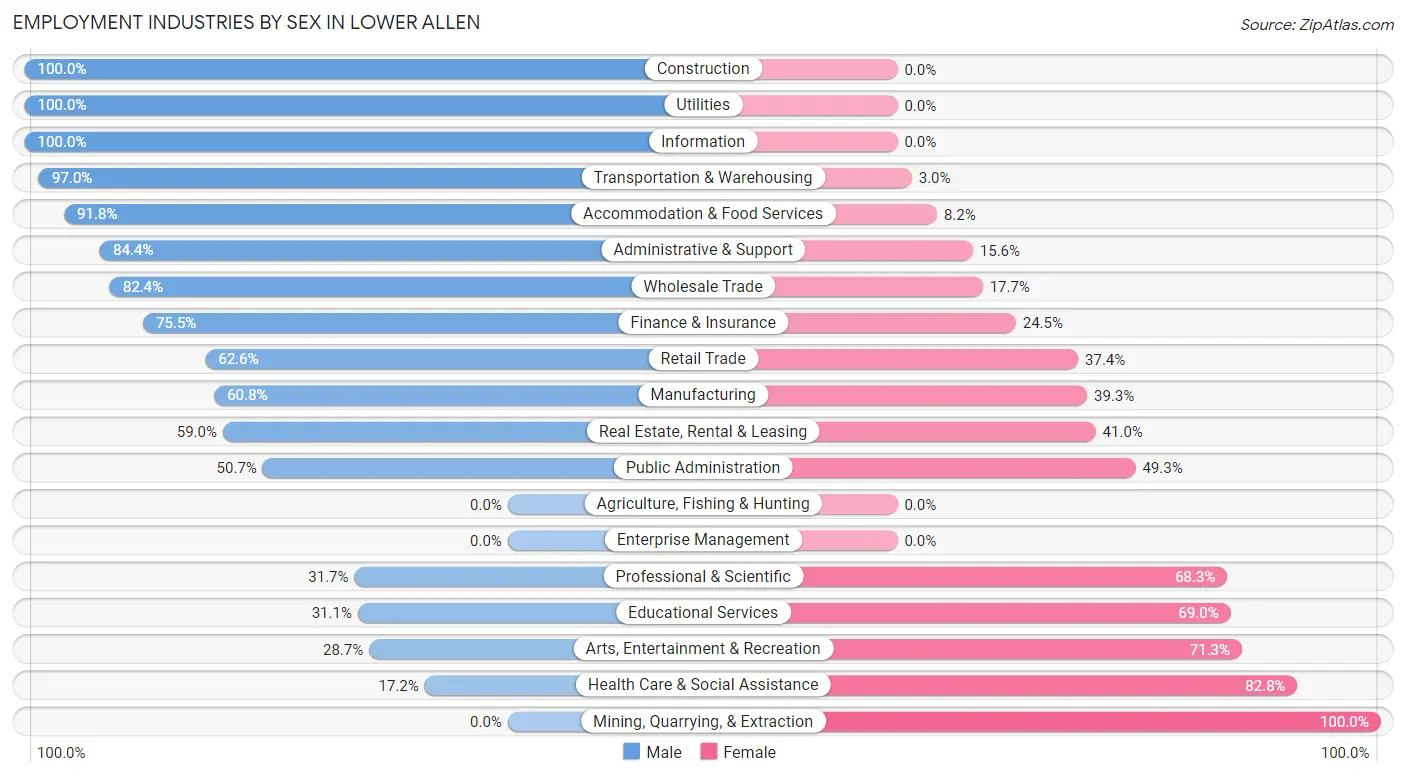
| Industry | Male | Female |
| Agriculture, Fishing & Hunting | 0 (0.0%) | 0 (0.0%) |
| Mining, Quarrying, & Extraction | 0 (0.0%) | 12 (100.0%) |
| Construction | 153 (100.0%) | 0 (0.0%) |
| Manufacturing | 161 (60.8%) | 104 (39.3%) |
| Wholesale Trade | 84 (82.4%) | 18 (17.6%) |
| Retail Trade | 303 (62.6%) | 181 (37.4%) |
| Transportation & Warehousing | 261 (97.0%) | 8 (3.0%) |
| Utilities | 14 (100.0%) | 0 (0.0%) |
| Information | 7 (100.0%) | 0 (0.0%) |
| Finance & Insurance | 151 (75.5%) | 49 (24.5%) |
| Real Estate, Rental & Leasing | 23 (59.0%) | 16 (41.0%) |
| Professional & Scientific | 106 (31.7%) | 228 (68.3%) |
| Enterprise Management | 0 (0.0%) | 0 (0.0%) |
| Administrative & Support | 81 (84.4%) | 15 (15.6%) |
| Educational Services | 159 (31.0%) | 353 (69.0%) |
| Health Care & Social Assistance | 121 (17.2%) | 582 (82.8%) |
| Arts, Entertainment & Recreation | 29 (28.7%) | 72 (71.3%) |
| Accommodation & Food Services | 157 (91.8%) | 14 (8.2%) |
| Public Administration | 175 (50.7%) | 170 (49.3%) |
| Total | 2,085 (51.9%) | 1,930 (48.1%) |
Education in Lower Allen
School Enrollment in Lower Allen
The most common levels of schooling among the 1,877 students in Lower Allen are middle school (575 | 30.6%), high school (518 | 27.6%), and elementary school (271 | 14.4%).
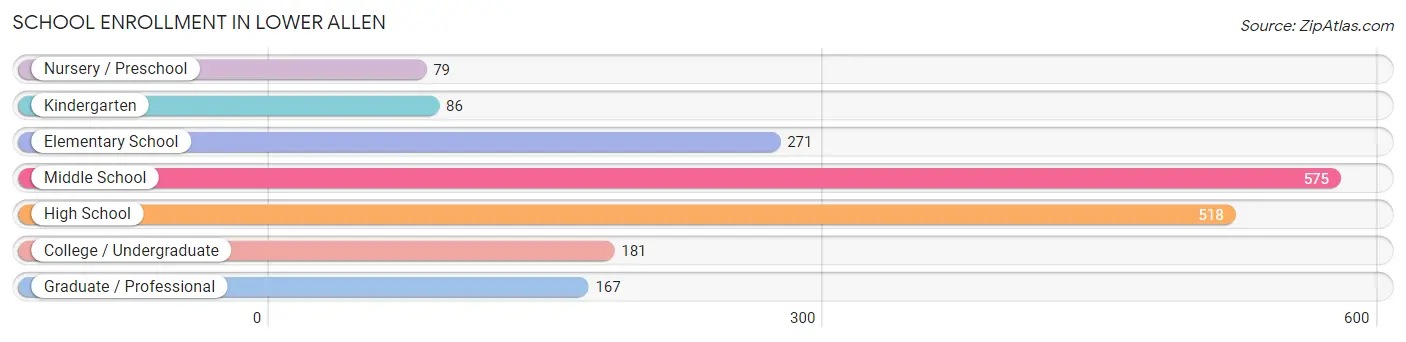
| School Level | # Students | % Students |
| Nursery / Preschool | 79 | 4.2% |
| Kindergarten | 86 | 4.6% |
| Elementary School | 271 | 14.4% |
| Middle School | 575 | 30.6% |
| High School | 518 | 27.6% |
| College / Undergraduate | 181 | 9.6% |
| Graduate / Professional | 167 | 8.9% |
| Total | 1,877 | 100.0% |
School Enrollment by Age by Funding Source in Lower Allen
Out of a total of 1,877 students who are enrolled in schools in Lower Allen, 377 (20.1%) attend a private institution, while the remaining 1,500 (79.9%) are enrolled in public schools. The age group of 20 to 24 year olds has the highest likelihood of being enrolled in private schools, with 106 (79.1% in the age bracket) enrolled. Conversely, the age group of 3 to 4 year olds has the lowest likelihood of being enrolled in a private school, with 50 (100.0% in the age bracket) attending a public institution.
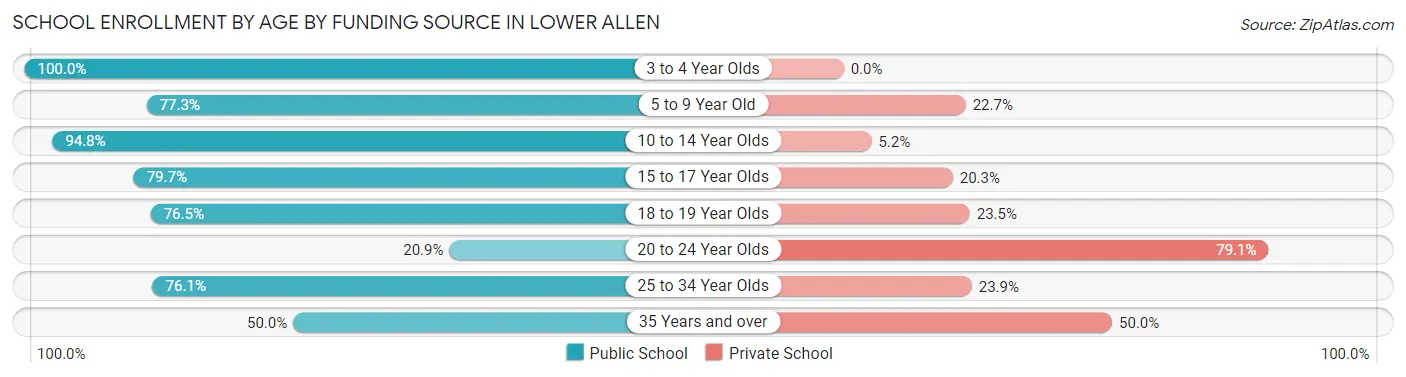
| Age Bracket | Public School | Private School |
| 3 to 4 Year Olds | 50 (100.0%) | 0 (0.0%) |
| 5 to 9 Year Old | 231 (77.3%) | 68 (22.7%) |
| 10 to 14 Year Olds | 659 (94.8%) | 36 (5.2%) |
| 15 to 17 Year Olds | 286 (79.7%) | 73 (20.3%) |
| 18 to 19 Year Olds | 153 (76.5%) | 47 (23.5%) |
| 20 to 24 Year Olds | 28 (20.9%) | 106 (79.1%) |
| 25 to 34 Year Olds | 67 (76.1%) | 21 (23.9%) |
| 35 Years and over | 26 (50.0%) | 26 (50.0%) |
| Total | 1,500 (79.9%) | 377 (20.1%) |
Educational Attainment by Field of Study in Lower Allen
Business (575 | 20.8%), education (539 | 19.5%), science & technology (238 | 8.6%), bio, nature & agricultural (228 | 8.2%), and arts & humanities (165 | 6.0%) are the most common fields of study among 2,767 individuals in Lower Allen who have obtained a bachelor's degree or higher.
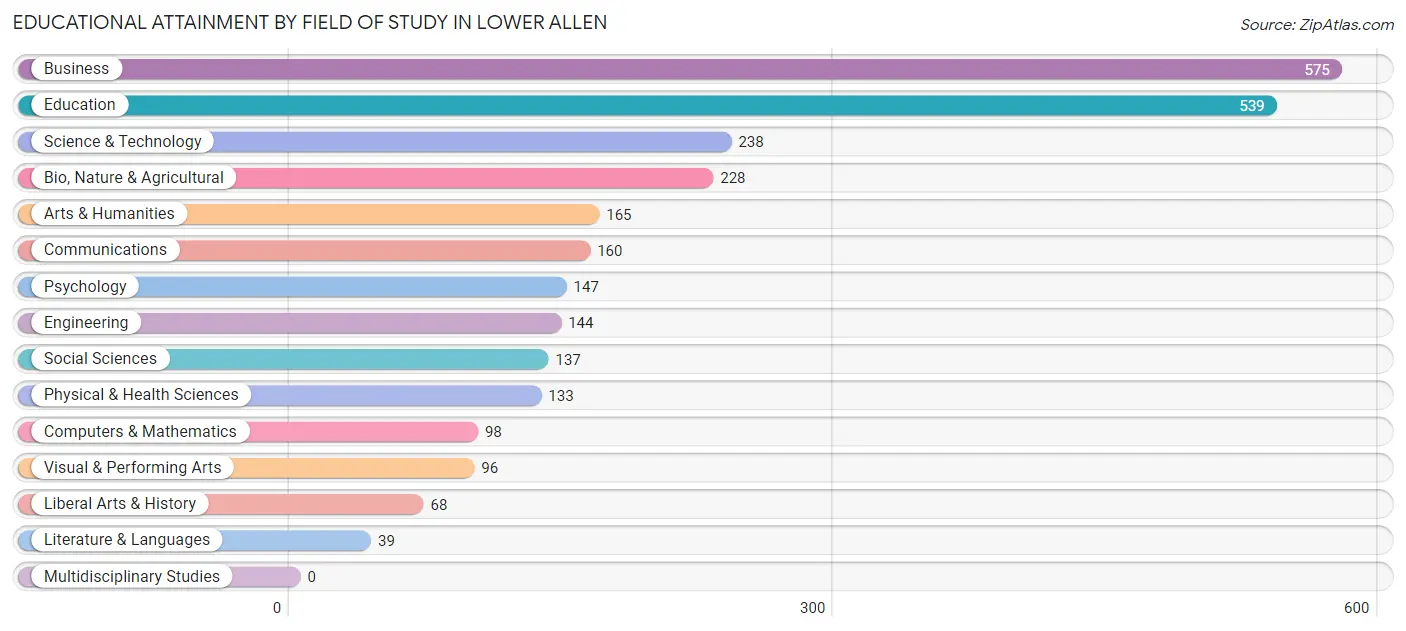
| Field of Study | # Graduates | % Graduates |
| Computers & Mathematics | 98 | 3.5% |
| Bio, Nature & Agricultural | 228 | 8.2% |
| Physical & Health Sciences | 133 | 4.8% |
| Psychology | 147 | 5.3% |
| Social Sciences | 137 | 5.0% |
| Engineering | 144 | 5.2% |
| Multidisciplinary Studies | 0 | 0.0% |
| Science & Technology | 238 | 8.6% |
| Business | 575 | 20.8% |
| Education | 539 | 19.5% |
| Literature & Languages | 39 | 1.4% |
| Liberal Arts & History | 68 | 2.5% |
| Visual & Performing Arts | 96 | 3.5% |
| Communications | 160 | 5.8% |
| Arts & Humanities | 165 | 6.0% |
| Total | 2,767 | 100.0% |
Transportation & Commute in Lower Allen
Vehicle Availability by Sex in Lower Allen
The most prevalent vehicle ownership categories in Lower Allen are males with 2 vehicles (1,071, accounting for 51.8%) and females with 2 vehicles (1,052, making up 58.1%).
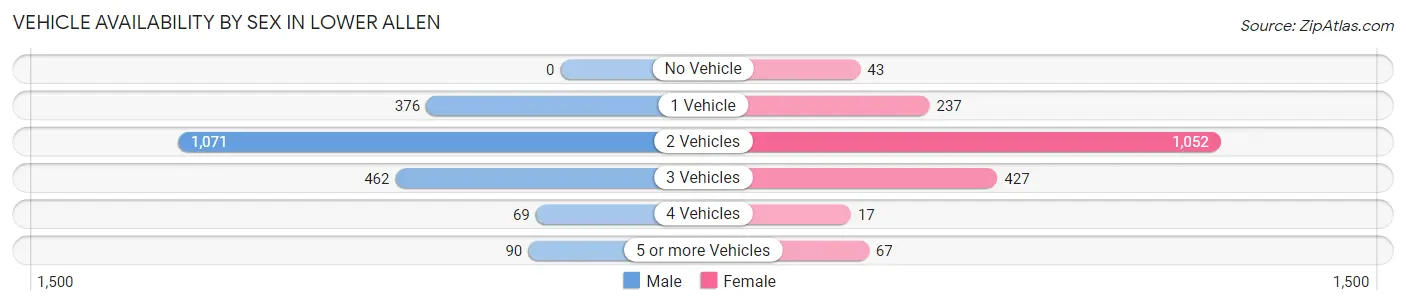
| Vehicles Available | Male | Female |
| No Vehicle | 0 (0.0%) | 43 (2.3%) |
| 1 Vehicle | 376 (18.2%) | 237 (12.9%) |
| 2 Vehicles | 1,071 (51.8%) | 1,052 (57.1%) |
| 3 Vehicles | 462 (22.3%) | 427 (23.2%) |
| 4 Vehicles | 69 (3.3%) | 17 (0.9%) |
| 5 or more Vehicles | 90 (4.3%) | 67 (3.6%) |
| Total | 2,068 (100.0%) | 1,843 (100.0%) |
Commute Time in Lower Allen
The most frequently occuring commute durations in Lower Allen are 15 to 19 minutes (941 commuters, 26.2%), 10 to 14 minutes (728 commuters, 20.3%), and 20 to 24 minutes (493 commuters, 13.7%).
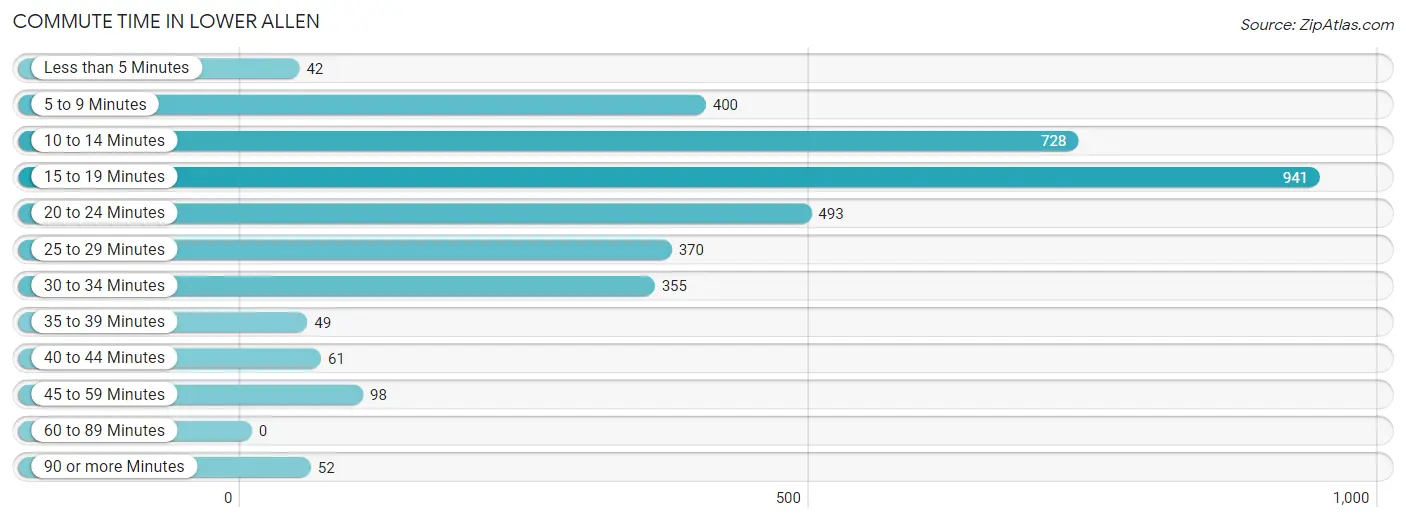
| Commute Time | # Commuters | % Commuters |
| Less than 5 Minutes | 42 | 1.2% |
| 5 to 9 Minutes | 400 | 11.2% |
| 10 to 14 Minutes | 728 | 20.3% |
| 15 to 19 Minutes | 941 | 26.2% |
| 20 to 24 Minutes | 493 | 13.7% |
| 25 to 29 Minutes | 370 | 10.3% |
| 30 to 34 Minutes | 355 | 9.9% |
| 35 to 39 Minutes | 49 | 1.4% |
| 40 to 44 Minutes | 61 | 1.7% |
| 45 to 59 Minutes | 98 | 2.7% |
| 60 to 89 Minutes | 0 | 0.0% |
| 90 or more Minutes | 52 | 1.5% |
Commute Time by Sex in Lower Allen
The most common commute times in Lower Allen are 15 to 19 minutes (549 commuters, 28.8%) for males and 15 to 19 minutes (392 commuters, 23.3%) for females.
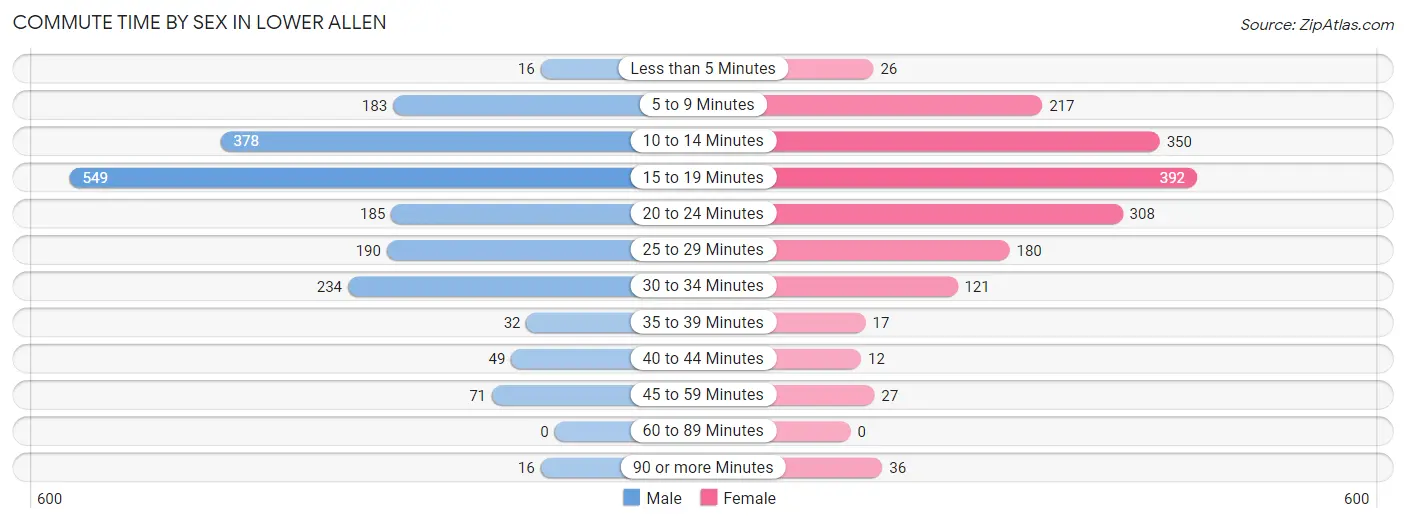
| Commute Time | Male | Female |
| Less than 5 Minutes | 16 (0.8%) | 26 (1.5%) |
| 5 to 9 Minutes | 183 (9.6%) | 217 (12.9%) |
| 10 to 14 Minutes | 378 (19.9%) | 350 (20.8%) |
| 15 to 19 Minutes | 549 (28.8%) | 392 (23.3%) |
| 20 to 24 Minutes | 185 (9.7%) | 308 (18.3%) |
| 25 to 29 Minutes | 190 (10.0%) | 180 (10.7%) |
| 30 to 34 Minutes | 234 (12.3%) | 121 (7.2%) |
| 35 to 39 Minutes | 32 (1.7%) | 17 (1.0%) |
| 40 to 44 Minutes | 49 (2.6%) | 12 (0.7%) |
| 45 to 59 Minutes | 71 (3.7%) | 27 (1.6%) |
| 60 to 89 Minutes | 0 (0.0%) | 0 (0.0%) |
| 90 or more Minutes | 16 (0.8%) | 36 (2.1%) |
Time of Departure to Work by Sex in Lower Allen
The most frequent times of departure to work in Lower Allen are 7:30 AM to 7:59 AM (426, 22.4%) for males and 7:00 AM to 7:29 AM (419, 24.8%) for females.
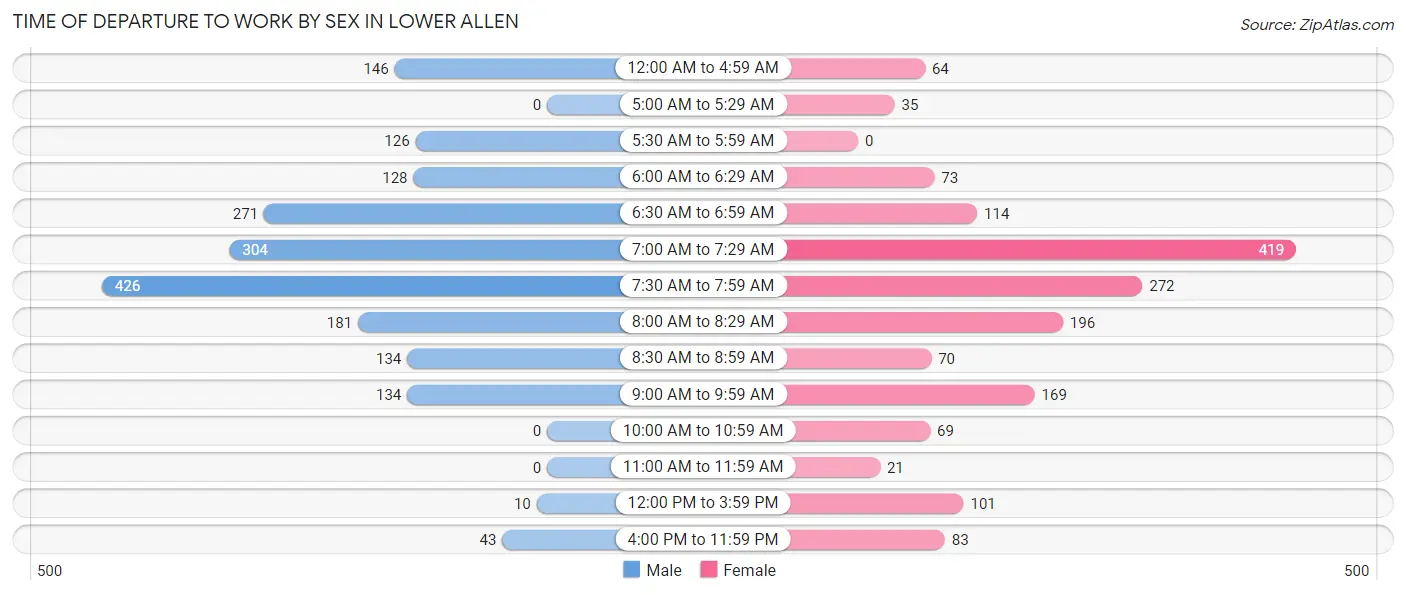
| Time of Departure | Male | Female |
| 12:00 AM to 4:59 AM | 146 (7.7%) | 64 (3.8%) |
| 5:00 AM to 5:29 AM | 0 (0.0%) | 35 (2.1%) |
| 5:30 AM to 5:59 AM | 126 (6.6%) | 0 (0.0%) |
| 6:00 AM to 6:29 AM | 128 (6.7%) | 73 (4.3%) |
| 6:30 AM to 6:59 AM | 271 (14.2%) | 114 (6.8%) |
| 7:00 AM to 7:29 AM | 304 (16.0%) | 419 (24.8%) |
| 7:30 AM to 7:59 AM | 426 (22.4%) | 272 (16.1%) |
| 8:00 AM to 8:29 AM | 181 (9.5%) | 196 (11.6%) |
| 8:30 AM to 8:59 AM | 134 (7.0%) | 70 (4.2%) |
| 9:00 AM to 9:59 AM | 134 (7.0%) | 169 (10.0%) |
| 10:00 AM to 10:59 AM | 0 (0.0%) | 69 (4.1%) |
| 11:00 AM to 11:59 AM | 0 (0.0%) | 21 (1.3%) |
| 12:00 PM to 3:59 PM | 10 (0.5%) | 101 (6.0%) |
| 4:00 PM to 11:59 PM | 43 (2.3%) | 83 (4.9%) |
| Total | 1,903 (100.0%) | 1,686 (100.0%) |
Housing Occupancy in Lower Allen
Occupancy by Ownership in Lower Allen
Of the total 3,241 dwellings in Lower Allen, owner-occupied units account for 2,193 (67.7%), while renter-occupied units make up 1,048 (32.3%).
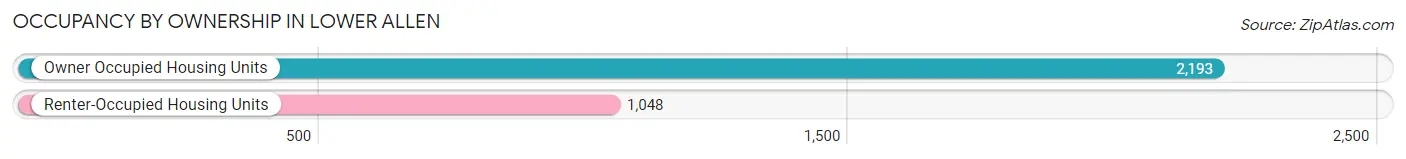
| Occupancy | # Housing Units | % Housing Units |
| Owner Occupied Housing Units | 2,193 | 67.7% |
| Renter-Occupied Housing Units | 1,048 | 32.3% |
| Total Occupied Housing Units | 3,241 | 100.0% |
Occupancy by Household Size in Lower Allen
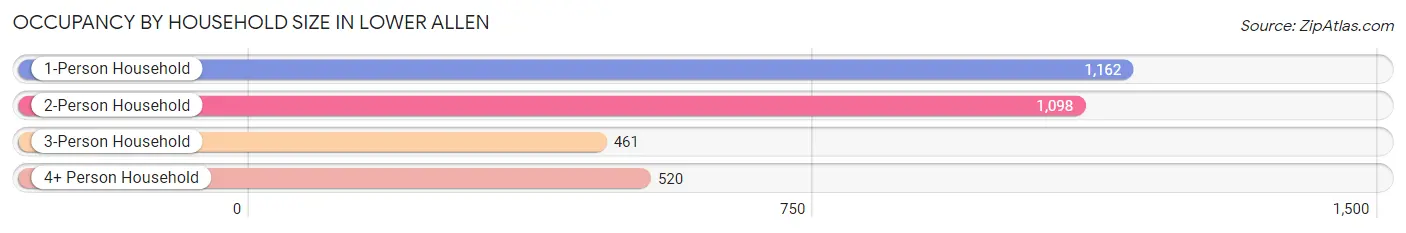
| Household Size | # Housing Units | % Housing Units |
| 1-Person Household | 1,162 | 35.8% |
| 2-Person Household | 1,098 | 33.9% |
| 3-Person Household | 461 | 14.2% |
| 4+ Person Household | 520 | 16.0% |
| Total Housing Units | 3,241 | 100.0% |
Occupancy by Ownership by Household Size in Lower Allen
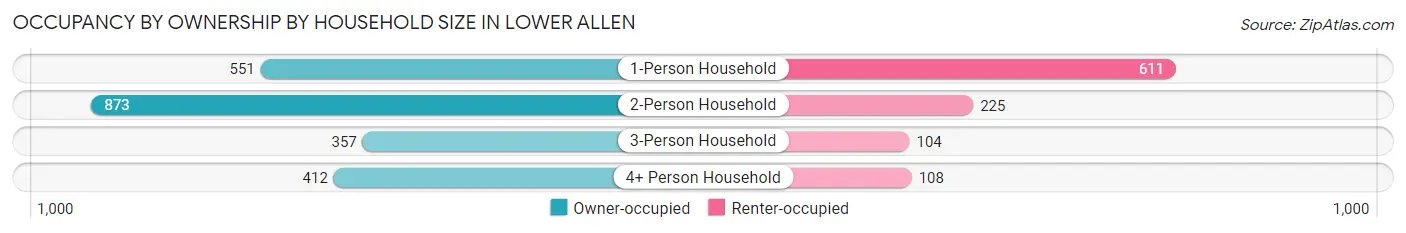
| Household Size | Owner-occupied | Renter-occupied |
| 1-Person Household | 551 (47.4%) | 611 (52.6%) |
| 2-Person Household | 873 (79.5%) | 225 (20.5%) |
| 3-Person Household | 357 (77.4%) | 104 (22.6%) |
| 4+ Person Household | 412 (79.2%) | 108 (20.8%) |
| Total Housing Units | 2,193 (67.7%) | 1,048 (32.3%) |
Occupancy by Educational Attainment in Lower Allen
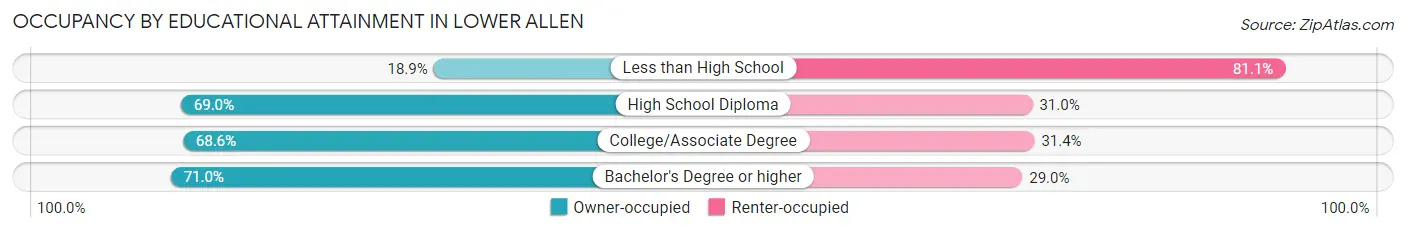
| Household Size | Owner-occupied | Renter-occupied |
| Less than High School | 28 (18.9%) | 120 (81.1%) |
| High School Diploma | 363 (69.0%) | 163 (31.0%) |
| College/Associate Degree | 608 (68.6%) | 278 (31.4%) |
| Bachelor's Degree or higher | 1,194 (71.0%) | 487 (29.0%) |
Occupancy by Age of Householder in Lower Allen
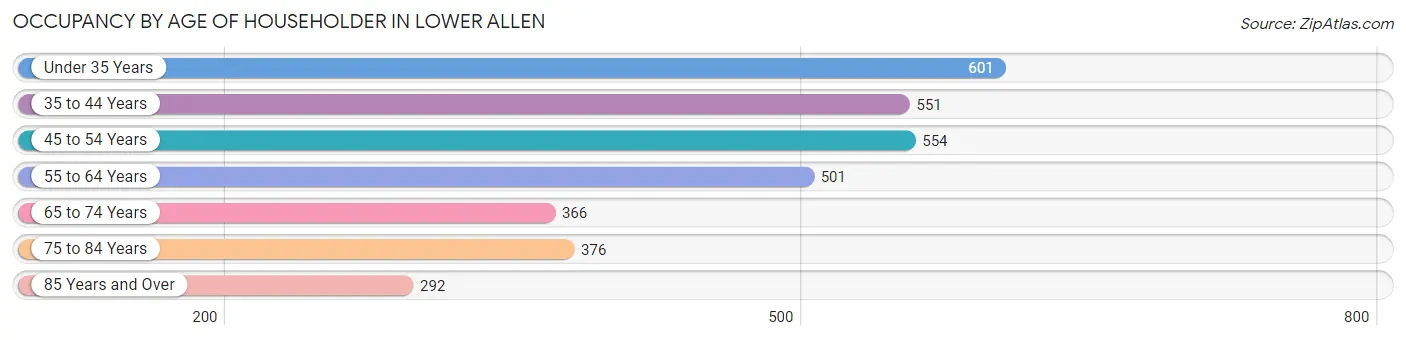
| Age Bracket | # Households | % Households |
| Under 35 Years | 601 | 18.5% |
| 35 to 44 Years | 551 | 17.0% |
| 45 to 54 Years | 554 | 17.1% |
| 55 to 64 Years | 501 | 15.5% |
| 65 to 74 Years | 366 | 11.3% |
| 75 to 84 Years | 376 | 11.6% |
| 85 Years and Over | 292 | 9.0% |
| Total | 3,241 | 100.0% |
Housing Finances in Lower Allen
Median Income by Occupancy in Lower Allen
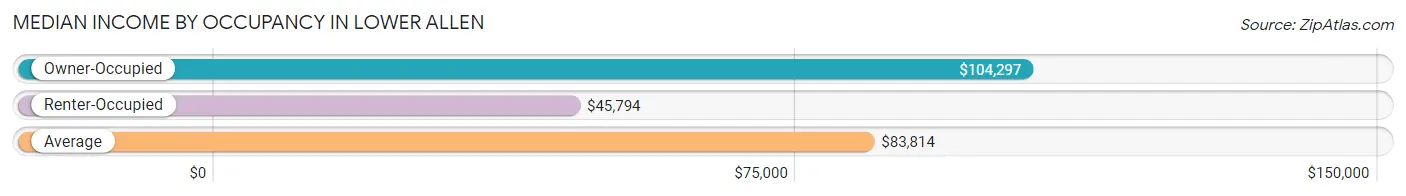
| Occupancy Type | # Households | Median Income |
| Owner-Occupied | 2,193 (67.7%) | $104,297 |
| Renter-Occupied | 1,048 (32.3%) | $45,794 |
| Average | 3,241 (100.0%) | $83,814 |
Occupancy by Householder Income Bracket in Lower Allen
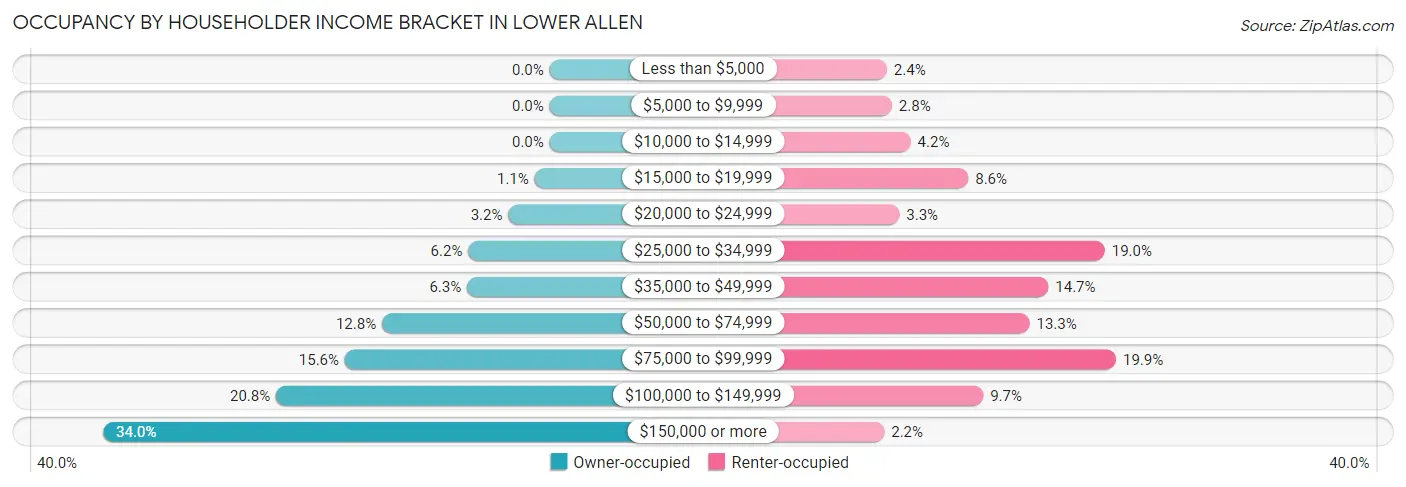
| Income Bracket | Owner-occupied | Renter-occupied |
| Less than $5,000 | 0 (0.0%) | 25 (2.4%) |
| $5,000 to $9,999 | 0 (0.0%) | 29 (2.8%) |
| $10,000 to $14,999 | 0 (0.0%) | 44 (4.2%) |
| $15,000 to $19,999 | 25 (1.1%) | 90 (8.6%) |
| $20,000 to $24,999 | 69 (3.2%) | 35 (3.3%) |
| $25,000 to $34,999 | 136 (6.2%) | 199 (19.0%) |
| $35,000 to $49,999 | 138 (6.3%) | 154 (14.7%) |
| $50,000 to $74,999 | 280 (12.8%) | 139 (13.3%) |
| $75,000 to $99,999 | 342 (15.6%) | 208 (19.9%) |
| $100,000 to $149,999 | 457 (20.8%) | 102 (9.7%) |
| $150,000 or more | 746 (34.0%) | 23 (2.2%) |
| Total | 2,193 (100.0%) | 1,048 (100.0%) |
Monthly Housing Cost Tiers in Lower Allen
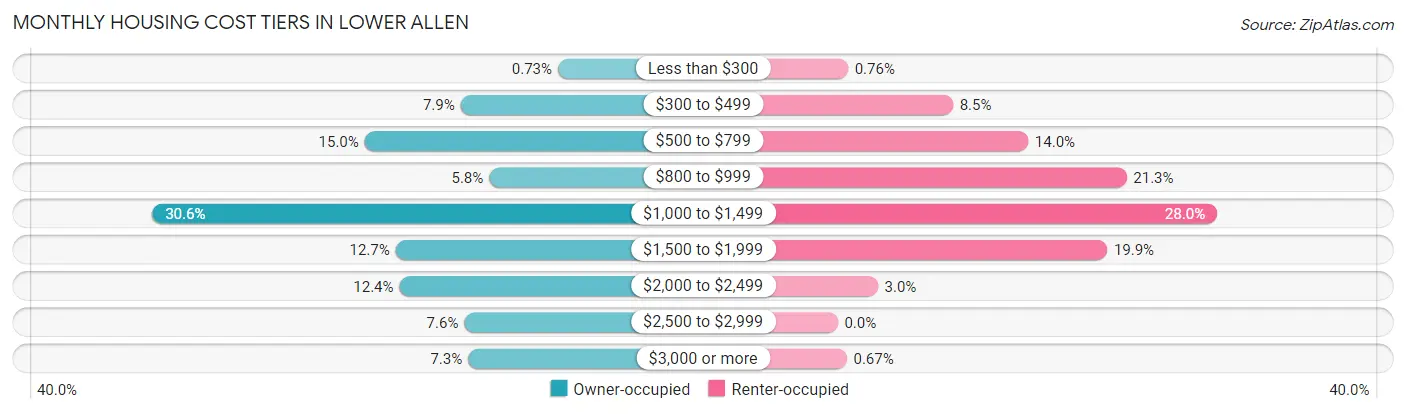
| Monthly Cost | Owner-occupied | Renter-occupied |
| Less than $300 | 16 (0.7%) | 8 (0.8%) |
| $300 to $499 | 173 (7.9%) | 89 (8.5%) |
| $500 to $799 | 328 (15.0%) | 147 (14.0%) |
| $800 to $999 | 127 (5.8%) | 223 (21.3%) |
| $1,000 to $1,499 | 671 (30.6%) | 293 (28.0%) |
| $1,500 to $1,999 | 278 (12.7%) | 208 (19.9%) |
| $2,000 to $2,499 | 272 (12.4%) | 31 (3.0%) |
| $2,500 to $2,999 | 167 (7.6%) | 0 (0.0%) |
| $3,000 or more | 161 (7.3%) | 7 (0.7%) |
| Total | 2,193 (100.0%) | 1,048 (100.0%) |
Physical Housing Characteristics in Lower Allen
Housing Structures in Lower Allen
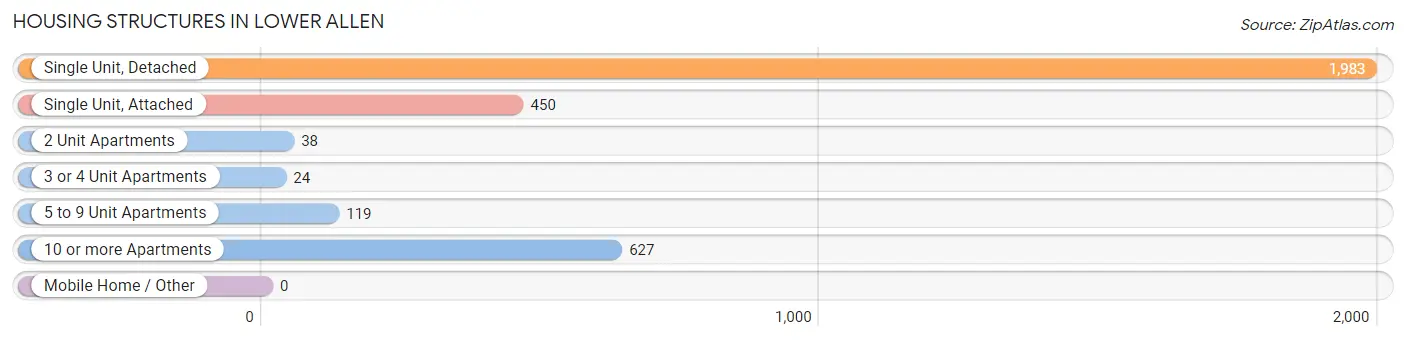
| Structure Type | # Housing Units | % Housing Units |
| Single Unit, Detached | 1,983 | 61.2% |
| Single Unit, Attached | 450 | 13.9% |
| 2 Unit Apartments | 38 | 1.2% |
| 3 or 4 Unit Apartments | 24 | 0.7% |
| 5 to 9 Unit Apartments | 119 | 3.7% |
| 10 or more Apartments | 627 | 19.4% |
| Mobile Home / Other | 0 | 0.0% |
| Total | 3,241 | 100.0% |
Housing Structures by Occupancy in Lower Allen
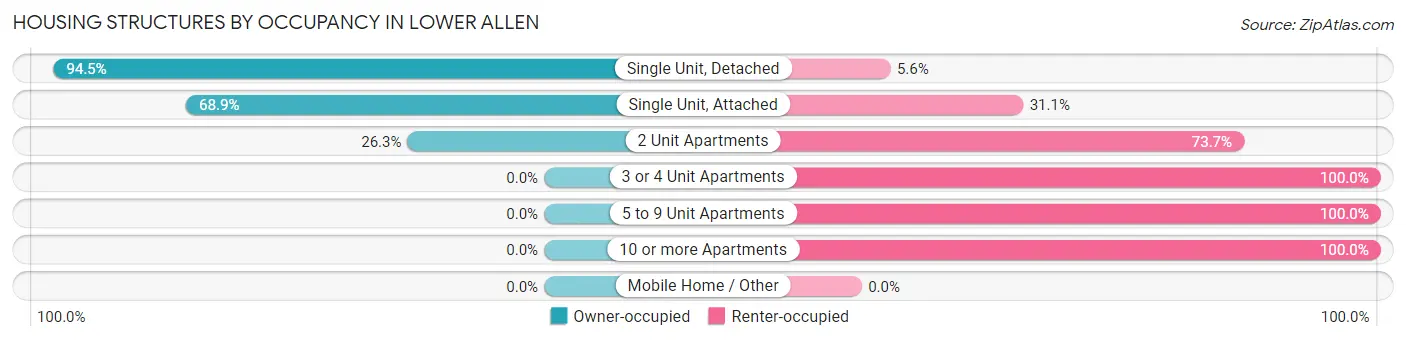
| Structure Type | Owner-occupied | Renter-occupied |
| Single Unit, Detached | 1,873 (94.5%) | 110 (5.6%) |
| Single Unit, Attached | 310 (68.9%) | 140 (31.1%) |
| 2 Unit Apartments | 10 (26.3%) | 28 (73.7%) |
| 3 or 4 Unit Apartments | 0 (0.0%) | 24 (100.0%) |
| 5 to 9 Unit Apartments | 0 (0.0%) | 119 (100.0%) |
| 10 or more Apartments | 0 (0.0%) | 627 (100.0%) |
| Mobile Home / Other | 0 (0.0%) | 0 (0.0%) |
| Total | 2,193 (67.7%) | 1,048 (32.3%) |
Housing Structures by Number of Rooms in Lower Allen
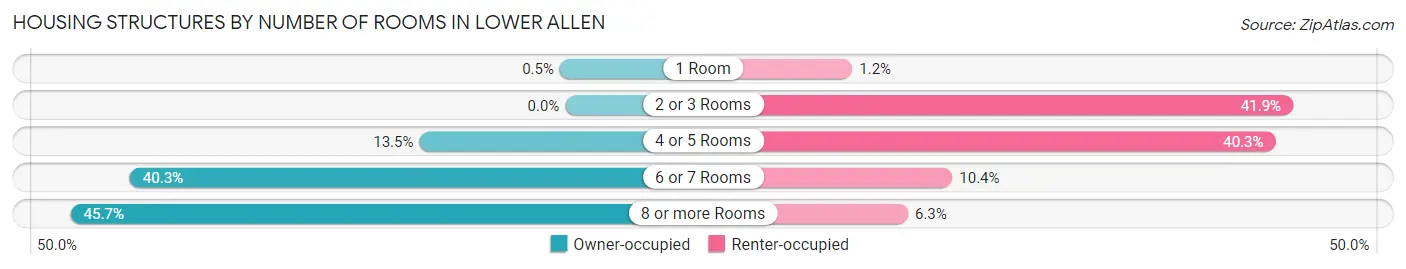
| Number of Rooms | Owner-occupied | Renter-occupied |
| 1 Room | 11 (0.5%) | 12 (1.1%) |
| 2 or 3 Rooms | 0 (0.0%) | 439 (41.9%) |
| 4 or 5 Rooms | 296 (13.5%) | 422 (40.3%) |
| 6 or 7 Rooms | 883 (40.3%) | 109 (10.4%) |
| 8 or more Rooms | 1,003 (45.7%) | 66 (6.3%) |
| Total | 2,193 (100.0%) | 1,048 (100.0%) |
Housing Structure by Heating Type in Lower Allen
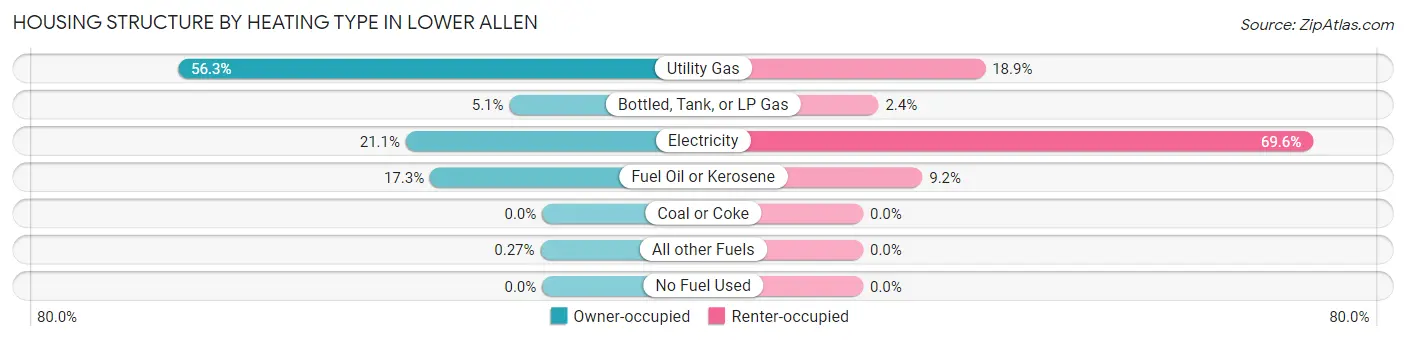
| Heating Type | Owner-occupied | Renter-occupied |
| Utility Gas | 1,234 (56.3%) | 198 (18.9%) |
| Bottled, Tank, or LP Gas | 111 (5.1%) | 25 (2.4%) |
| Electricity | 462 (21.1%) | 729 (69.6%) |
| Fuel Oil or Kerosene | 380 (17.3%) | 96 (9.2%) |
| Coal or Coke | 0 (0.0%) | 0 (0.0%) |
| All other Fuels | 6 (0.3%) | 0 (0.0%) |
| No Fuel Used | 0 (0.0%) | 0 (0.0%) |
| Total | 2,193 (100.0%) | 1,048 (100.0%) |
Household Vehicle Usage in Lower Allen
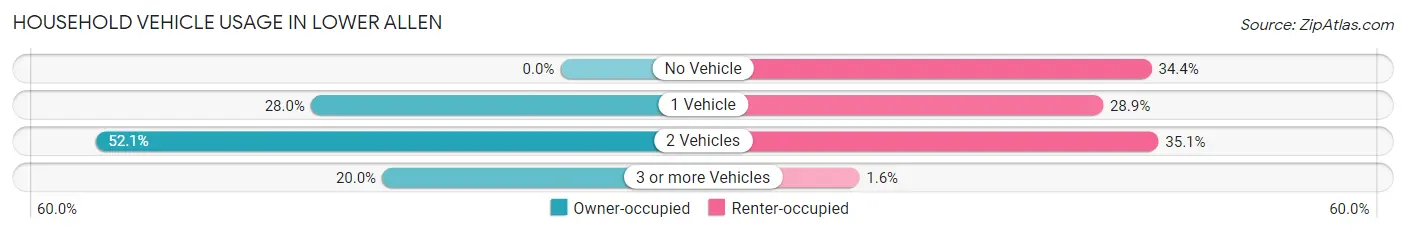
| Vehicles per Household | Owner-occupied | Renter-occupied |
| No Vehicle | 0 (0.0%) | 360 (34.4%) |
| 1 Vehicle | 613 (28.0%) | 303 (28.9%) |
| 2 Vehicles | 1,142 (52.1%) | 368 (35.1%) |
| 3 or more Vehicles | 438 (20.0%) | 17 (1.6%) |
| Total | 2,193 (100.0%) | 1,048 (100.0%) |
Real Estate & Mortgages in Lower Allen
Real Estate and Mortgage Overview in Lower Allen
| Characteristic | Without Mortgage | With Mortgage |
| Housing Units | 576 | 1,617 |
| Median Property Value | $205,600 | $237,700 |
| Median Household Income | $76,278 | $689 |
| Monthly Housing Costs | $630 | $161 |
| Real Estate Taxes | $3,211 | $2 |
Property Value by Mortgage Status in Lower Allen
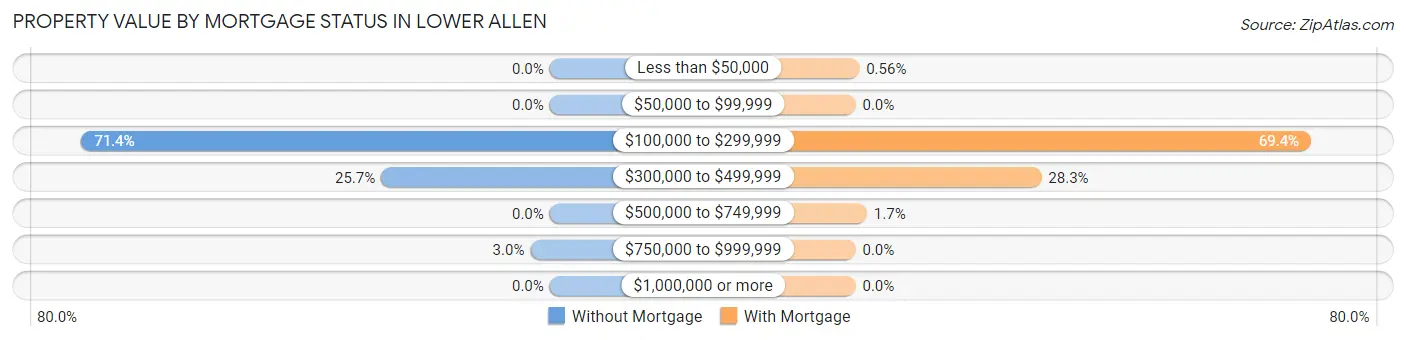
| Property Value | Without Mortgage | With Mortgage |
| Less than $50,000 | 0 (0.0%) | 9 (0.6%) |
| $50,000 to $99,999 | 0 (0.0%) | 0 (0.0%) |
| $100,000 to $299,999 | 411 (71.4%) | 1,122 (69.4%) |
| $300,000 to $499,999 | 148 (25.7%) | 458 (28.3%) |
| $500,000 to $749,999 | 0 (0.0%) | 28 (1.7%) |
| $750,000 to $999,999 | 17 (2.9%) | 0 (0.0%) |
| $1,000,000 or more | 0 (0.0%) | 0 (0.0%) |
| Total | 576 (100.0%) | 1,617 (100.0%) |
Household Income by Mortgage Status in Lower Allen
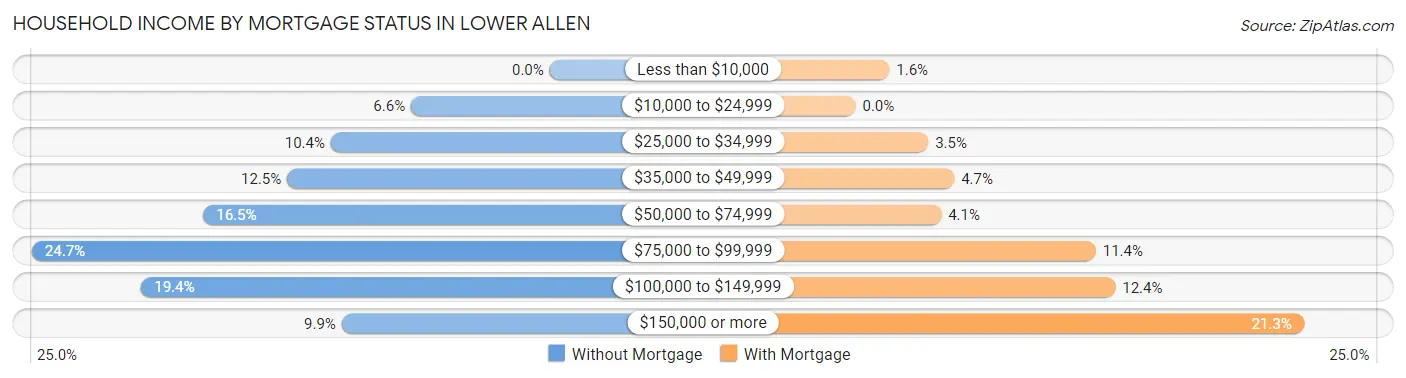
| Household Income | Without Mortgage | With Mortgage |
| Less than $10,000 | 0 (0.0%) | 26 (1.6%) |
| $10,000 to $24,999 | 38 (6.6%) | 0 (0.0%) |
| $25,000 to $34,999 | 60 (10.4%) | 56 (3.5%) |
| $35,000 to $49,999 | 72 (12.5%) | 76 (4.7%) |
| $50,000 to $74,999 | 95 (16.5%) | 66 (4.1%) |
| $75,000 to $99,999 | 142 (24.6%) | 185 (11.4%) |
| $100,000 to $149,999 | 112 (19.4%) | 200 (12.4%) |
| $150,000 or more | 57 (9.9%) | 345 (21.3%) |
| Total | 576 (100.0%) | 1,617 (100.0%) |
Property Value to Household Income Ratio in Lower Allen
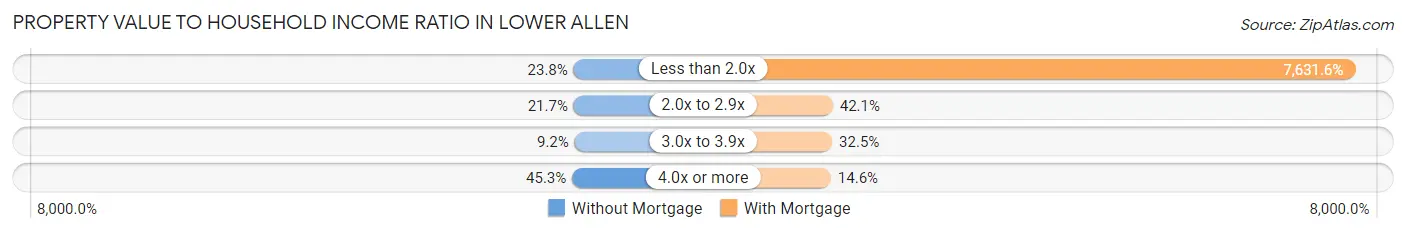
| Value-to-Income Ratio | Without Mortgage | With Mortgage |
| Less than 2.0x | 137 (23.8%) | 123,403 (7,631.6%) |
| 2.0x to 2.9x | 125 (21.7%) | 681 (42.1%) |
| 3.0x to 3.9x | 53 (9.2%) | 526 (32.5%) |
| 4.0x or more | 261 (45.3%) | 236 (14.6%) |
| Total | 576 (100.0%) | 1,617 (100.0%) |
Real Estate Taxes by Mortgage Status in Lower Allen
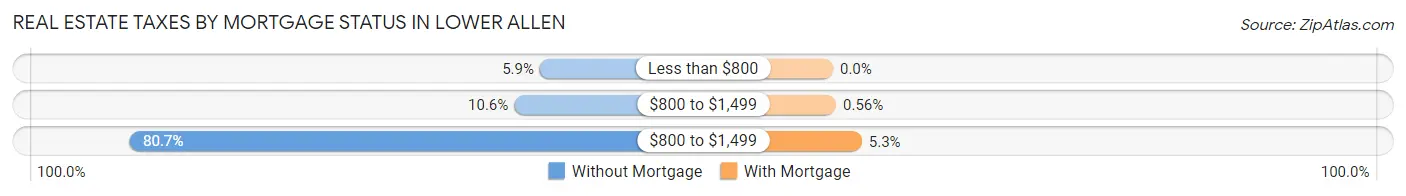
| Property Taxes | Without Mortgage | With Mortgage |
| Less than $800 | 34 (5.9%) | 0 (0.0%) |
| $800 to $1,499 | 61 (10.6%) | 9 (0.6%) |
| $800 to $1,499 | 465 (80.7%) | 85 (5.3%) |
| Total | 576 (100.0%) | 1,617 (100.0%) |
Health & Disability in Lower Allen
Health Insurance Coverage by Age in Lower Allen
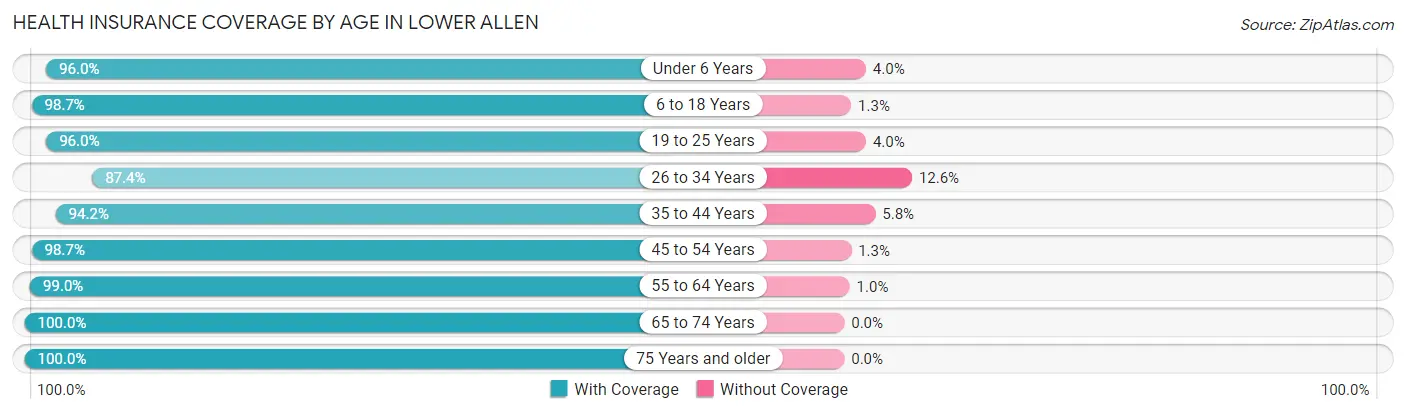
| Age Bracket | With Coverage | Without Coverage |
| Under 6 Years | 357 (96.0%) | 15 (4.0%) |
| 6 to 18 Years | 1,384 (98.7%) | 18 (1.3%) |
| 19 to 25 Years | 380 (96.0%) | 16 (4.0%) |
| 26 to 34 Years | 907 (87.4%) | 131 (12.6%) |
| 35 to 44 Years | 781 (94.2%) | 48 (5.8%) |
| 45 to 54 Years | 995 (98.7%) | 13 (1.3%) |
| 55 to 64 Years | 893 (99.0%) | 9 (1.0%) |
| 65 to 74 Years | 518 (100.0%) | 0 (0.0%) |
| 75 Years and older | 864 (100.0%) | 0 (0.0%) |
| Total | 7,079 (96.6%) | 250 (3.4%) |
Health Insurance Coverage by Citizenship Status in Lower Allen
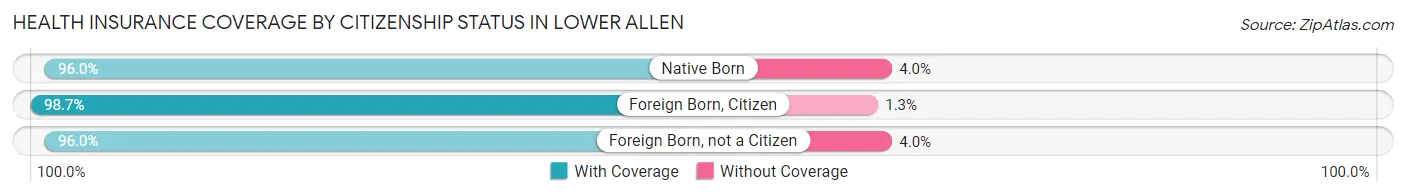
| Citizenship Status | With Coverage | Without Coverage |
| Native Born | 357 (96.0%) | 15 (4.0%) |
| Foreign Born, Citizen | 1,384 (98.7%) | 18 (1.3%) |
| Foreign Born, not a Citizen | 380 (96.0%) | 16 (4.0%) |
Health Insurance Coverage by Household Income in Lower Allen
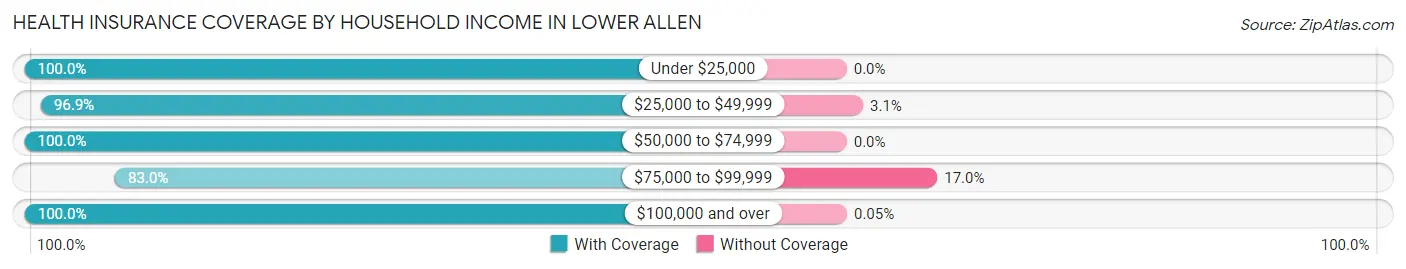
| Household Income | With Coverage | Without Coverage |
| Under $25,000 | 463 (100.0%) | 0 (0.0%) |
| $25,000 to $49,999 | 1,014 (96.9%) | 32 (3.1%) |
| $50,000 to $74,999 | 809 (100.0%) | 0 (0.0%) |
| $75,000 to $99,999 | 1,048 (83.0%) | 214 (17.0%) |
| $100,000 and over | 3,742 (100.0%) | 2 (0.1%) |
Public vs Private Health Insurance Coverage by Age in Lower Allen
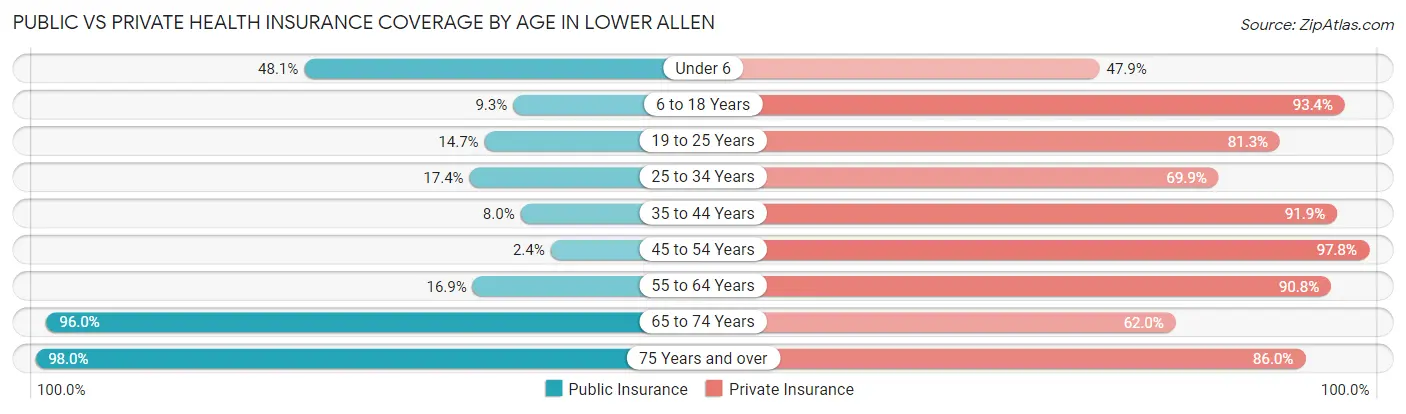
| Age Bracket | Public Insurance | Private Insurance |
| Under 6 | 179 (48.1%) | 178 (47.8%) |
| 6 to 18 Years | 131 (9.3%) | 1,309 (93.4%) |
| 19 to 25 Years | 58 (14.6%) | 322 (81.3%) |
| 25 to 34 Years | 181 (17.4%) | 726 (69.9%) |
| 35 to 44 Years | 66 (8.0%) | 762 (91.9%) |
| 45 to 54 Years | 24 (2.4%) | 986 (97.8%) |
| 55 to 64 Years | 152 (16.9%) | 819 (90.8%) |
| 65 to 74 Years | 497 (96.0%) | 321 (62.0%) |
| 75 Years and over | 847 (98.0%) | 743 (86.0%) |
| Total | 2,135 (29.1%) | 6,166 (84.1%) |
Disability Status by Sex by Age in Lower Allen
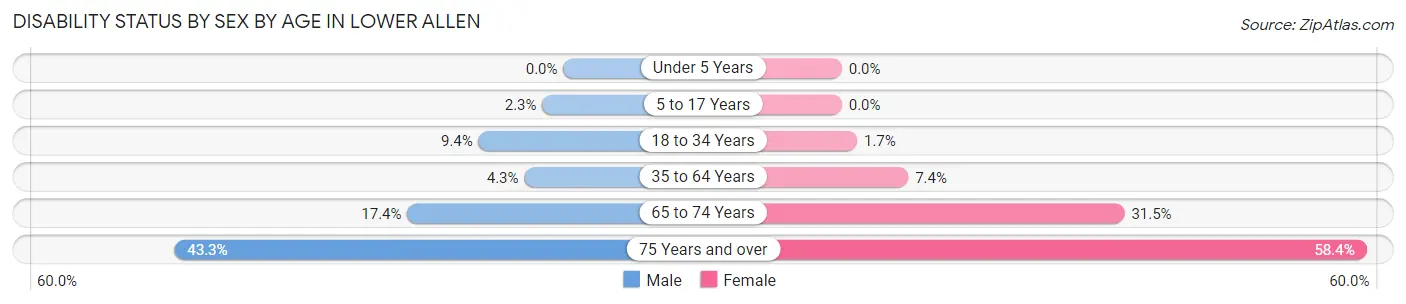
| Age Bracket | Male | Female |
| Under 5 Years | 0 (0.0%) | 0 (0.0%) |
| 5 to 17 Years | 15 (2.3%) | 0 (0.0%) |
| 18 to 34 Years | 73 (9.4%) | 14 (1.7%) |
| 35 to 64 Years | 62 (4.3%) | 97 (7.4%) |
| 65 to 74 Years | 37 (17.4%) | 96 (31.5%) |
| 75 Years and over | 120 (43.3%) | 343 (58.4%) |
Disability Class by Sex by Age in Lower Allen
Disability Class: Hearing Difficulty
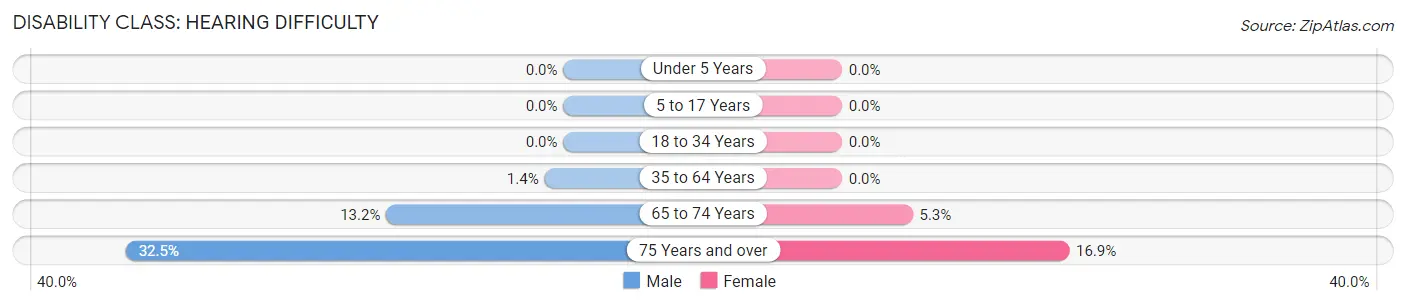
| Age Bracket | Male | Female |
| Under 5 Years | 0 (0.0%) | 0 (0.0%) |
| 5 to 17 Years | 0 (0.0%) | 0 (0.0%) |
| 18 to 34 Years | 0 (0.0%) | 0 (0.0%) |
| 35 to 64 Years | 20 (1.4%) | 0 (0.0%) |
| 65 to 74 Years | 28 (13.2%) | 16 (5.2%) |
| 75 Years and over | 90 (32.5%) | 99 (16.9%) |
Disability Class: Vision Difficulty
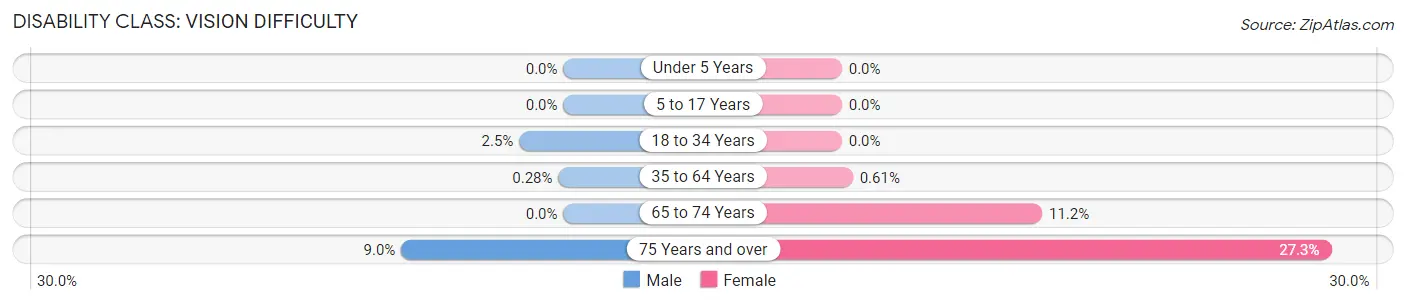
| Age Bracket | Male | Female |
| Under 5 Years | 0 (0.0%) | 0 (0.0%) |
| 5 to 17 Years | 0 (0.0%) | 0 (0.0%) |
| 18 to 34 Years | 19 (2.5%) | 0 (0.0%) |
| 35 to 64 Years | 4 (0.3%) | 8 (0.6%) |
| 65 to 74 Years | 0 (0.0%) | 34 (11.2%) |
| 75 Years and over | 25 (9.0%) | 160 (27.3%) |
Disability Class: Cognitive Difficulty
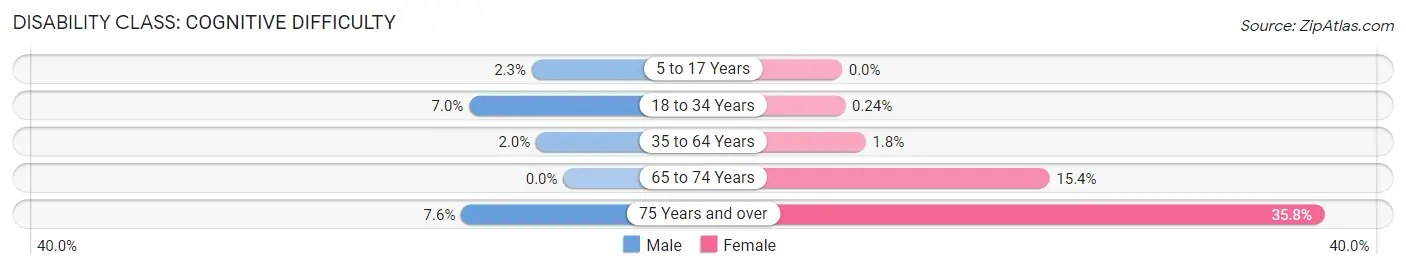
| Age Bracket | Male | Female |
| 5 to 17 Years | 15 (2.3%) | 0 (0.0%) |
| 18 to 34 Years | 54 (7.0%) | 2 (0.2%) |
| 35 to 64 Years | 29 (2.0%) | 23 (1.8%) |
| 65 to 74 Years | 0 (0.0%) | 47 (15.4%) |
| 75 Years and over | 21 (7.6%) | 210 (35.8%) |
Disability Class: Ambulatory Difficulty
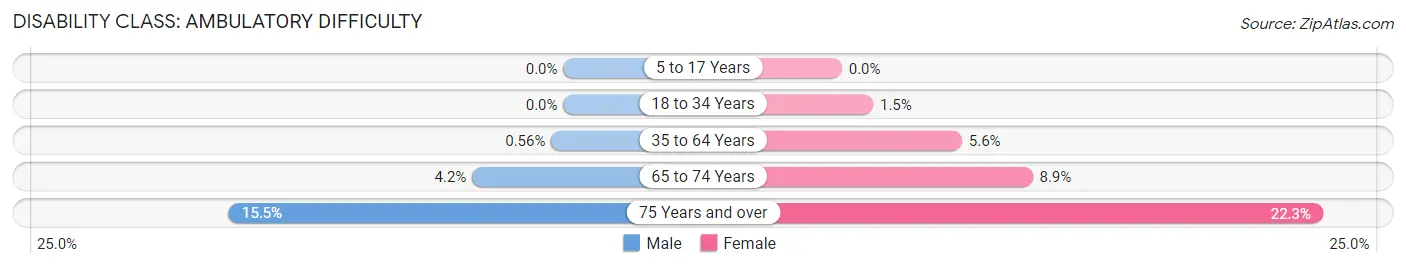
| Age Bracket | Male | Female |
| 5 to 17 Years | 0 (0.0%) | 0 (0.0%) |
| 18 to 34 Years | 0 (0.0%) | 12 (1.5%) |
| 35 to 64 Years | 8 (0.6%) | 73 (5.6%) |
| 65 to 74 Years | 9 (4.2%) | 27 (8.8%) |
| 75 Years and over | 43 (15.5%) | 131 (22.3%) |
Disability Class: Self-Care Difficulty
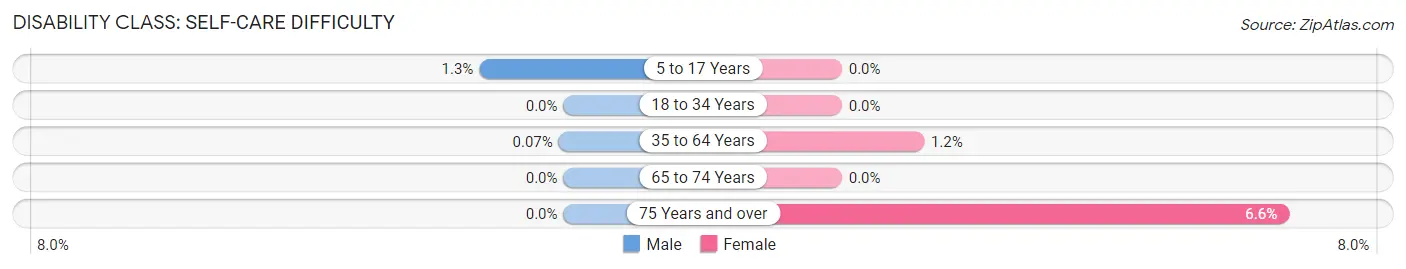
| Age Bracket | Male | Female |
| 5 to 17 Years | 8 (1.3%) | 0 (0.0%) |
| 18 to 34 Years | 0 (0.0%) | 0 (0.0%) |
| 35 to 64 Years | 1 (0.1%) | 16 (1.2%) |
| 65 to 74 Years | 0 (0.0%) | 0 (0.0%) |
| 75 Years and over | 0 (0.0%) | 39 (6.6%) |
Technology Access in Lower Allen
Computing Device Access in Lower Allen
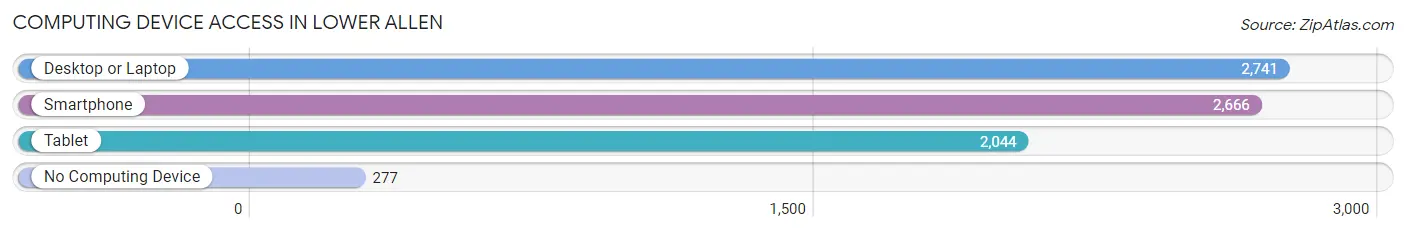
| Device Type | # Households | % Households |
| Desktop or Laptop | 2,741 | 84.6% |
| Smartphone | 2,666 | 82.3% |
| Tablet | 2,044 | 63.1% |
| No Computing Device | 277 | 8.6% |
| Total | 3,241 | 100.0% |
Internet Access in Lower Allen
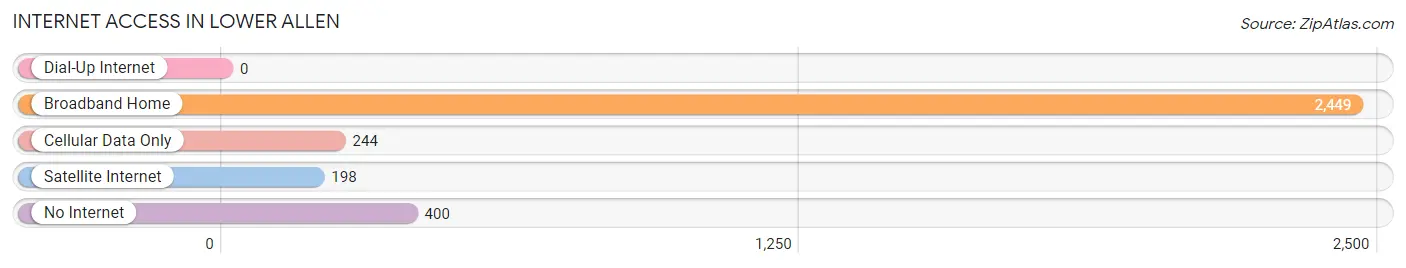
| Internet Type | # Households | % Households |
| Dial-Up Internet | 0 | 0.0% |
| Broadband Home | 2,449 | 75.6% |
| Cellular Data Only | 244 | 7.5% |
| Satellite Internet | 198 | 6.1% |
| No Internet | 400 | 12.3% |
| Total | 3,241 | 100.0% |
Lower Allen Summary
Allen Township is a township located in Cumberland County, Pennsylvania. It is part of the Harrisburg-Carlisle Metropolitan Statistical Area. The township is bordered by the townships of Hampden, Silver Spring, and Upper Allen. The township is home to the Lower Allen Township Park, which is a popular destination for outdoor recreation.
History
Lower Allen Township was established in 1729, when it was part of Cumberland County. The township was named after William Allen, who was the Chief Justice of the Province of Pennsylvania from 1750 to 1774. The township was originally part of the larger Allen Township, which was divided into Upper and Lower Allen in 1845.
Geography
Lower Allen Township is located in the southeastern corner of Cumberland County, Pennsylvania. It is bordered by the townships of Hampden, Silver Spring, and Upper Allen. The township is located in the Appalachian Mountains and is part of the Cumberland Valley. The township is located at an elevation of 590 feet above sea level.
The township is home to the Lower Allen Township Park, which is a popular destination for outdoor recreation. The park features a playground, picnic pavilions, a walking trail, and a fishing pond.
Economy
Lower Allen Township is home to a variety of businesses and industries. The township is home to the Capital City Mall, which is a popular shopping destination. The township is also home to a variety of restaurants, retail stores, and other businesses.
The township is home to several manufacturing companies, including the Lower Allen Manufacturing Company, which produces a variety of products, including automotive parts, medical devices, and industrial equipment. The township is also home to a variety of technology companies, including the Lower Allen Technology Center, which is a research and development facility.
Demographics
As of the 2010 census, the population of Lower Allen Township was 8,945. The median household income was $60,945, and the median family income was $71,945. The median age was 40.7 years.
The racial makeup of the township was 90.2% White, 4.2% African American, 0.3% Native American, 2.2% Asian, 0.1% Pacific Islander, 1.2% from other races, and 1.9% from two or more races. Hispanic or Latino of any race were 3.2% of the population.
The township is home to a variety of religious denominations, including Catholic, Lutheran, Methodist, Presbyterian, and Baptist. The township is also home to a variety of educational institutions, including the Lower Allen Township School District, which serves the township's public school students.
Common Questions
What is Per Capita Income in Lower Allen?
Per Capita income in Lower Allen is $45,848.
What is the Median Family Income in Lower Allen?
Median Family Income in Lower Allen is $111,875.
What is the Median Household income in Lower Allen?
Median Household Income in Lower Allen is $83,814.
What is Income or Wage Gap in Lower Allen?
Income or Wage Gap in Lower Allen is 31.4%.
Women in Lower Allen earn 68.6 cents for every dollar earned by a man.
What is Inequality or Gini Index in Lower Allen?
Inequality or Gini Index in Lower Allen is 0.40.
What is the Total Population of Lower Allen?
Total Population of Lower Allen is 7,350.
What is the Total Male Population of Lower Allen?
Total Male Population of Lower Allen is 3,467.
What is the Total Female Population of Lower Allen?
Total Female Population of Lower Allen is 3,883.
What is the Ratio of Males per 100 Females in Lower Allen?
There are 89.29 Males per 100 Females in Lower Allen.
What is the Ratio of Females per 100 Males in Lower Allen?
There are 112.00 Females per 100 Males in Lower Allen.
What is the Median Population Age in Lower Allen?
Median Population Age in Lower Allen is 39.8 Years.
What is the Average Family Size in Lower Allen
Average Family Size in Lower Allen is 3.0 People.
What is the Average Household Size in Lower Allen
Average Household Size in Lower Allen is 2.3 People.
How Large is the Labor Force in Lower Allen?
There are 4,156 People in the Labor Forcein in Lower Allen.
What is the Percentage of People in the Labor Force in Lower Allen?
69.5% of People are in the Labor Force in Lower Allen.
What is the Unemployment Rate in Lower Allen?
Unemployment Rate in Lower Allen is 2.9%.