Clarks Green borough, PA Map & Demographics
Clarks Green borough Overview
$51,750
PER CAPITA INCOME
$141,250
AVG FAMILY INCOME
$105,298
AVG HOUSEHOLD INCOME
37.5%
WAGE / INCOME GAP [ % ]
62.5¢/ $1
WAGE / INCOME GAP [ $ ]
0.43
INEQUALITY / GINI INDEX
1,594
TOTAL POPULATION
852
MALE POPULATION
742
FEMALE POPULATION
114.82
MALES / 100 FEMALES
87.09
FEMALES / 100 MALES
46.7
MEDIAN AGE
3.2
AVG FAMILY SIZE
2.5
AVG HOUSEHOLD SIZE
901
LABOR FORCE [ PEOPLE ]
70.2%
PERCENT IN LABOR FORCE
0.6%
UNEMPLOYMENT RATE
Income in Clarks Green borough
Income Overview in Clarks Green borough
Per Capita Income in Clarks Green borough is $51,750, while median incomes of families and households are $141,250 and $105,298 respectively.
| Characteristic | Number | Measure |
| Per Capita Income | 1,594 | $51,750 |
| Median Family Income | 412 | $141,250 |
| Mean Family Income | 412 | $169,706 |
| Median Household Income | 629 | $105,298 |
| Mean Household Income | 629 | $129,228 |
| Income Deficit | 412 | $0 |
| Wage / Income Gap (%) | 1,594 | 37.50% |
| Wage / Income Gap ($) | 1,594 | 62.50¢ per $1 |
| Gini / Inequality Index | 1,594 | 0.43 |
Earnings by Sex in Clarks Green borough
Average Earnings in Clarks Green borough are $48,690, $57,778 for men and $36,111 for women, a difference of 37.5%.
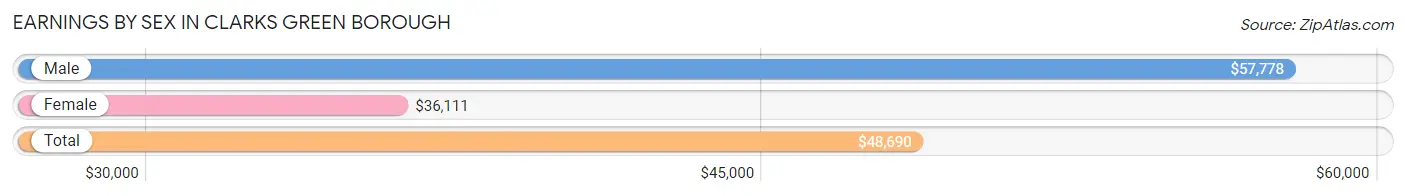
| Sex | Number | Average Earnings |
| Male | 534 (55.6%) | $57,778 |
| Female | 426 (44.4%) | $36,111 |
| Total | 960 (100.0%) | $48,690 |
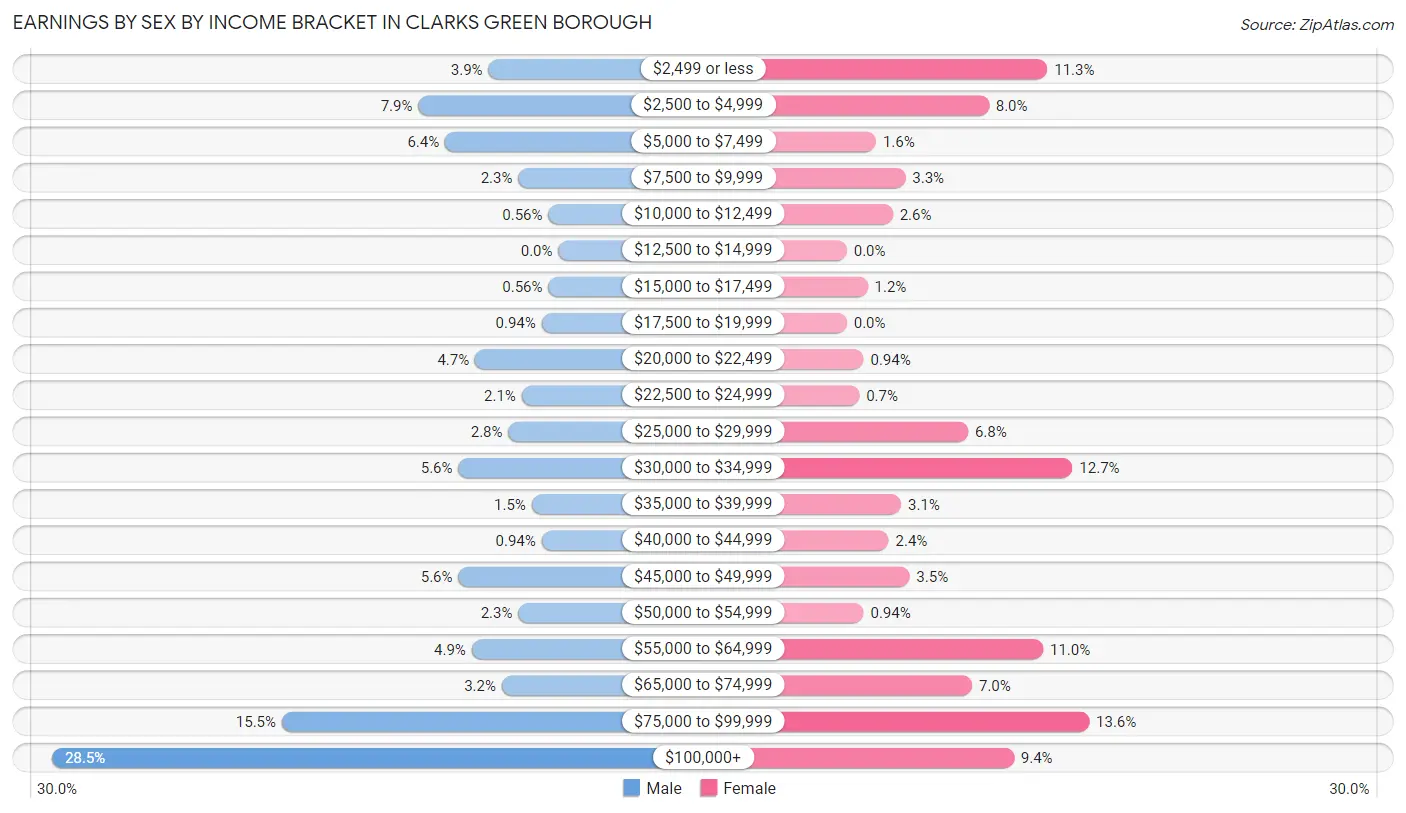
Earnings by Sex by Income Bracket in Clarks Green borough
The most common earnings brackets in Clarks Green borough are $100,000+ for men (152 | 28.5%) and $75,000 to $99,999 for women (58 | 13.6%).
| Income | Male | Female |
| $2,499 or less | 21 (3.9%) | 48 (11.3%) |
| $2,500 to $4,999 | 42 (7.9%) | 34 (8.0%) |
| $5,000 to $7,499 | 34 (6.4%) | 7 (1.6%) |
| $7,500 to $9,999 | 12 (2.2%) | 14 (3.3%) |
| $10,000 to $12,499 | 3 (0.6%) | 11 (2.6%) |
| $12,500 to $14,999 | 0 (0.0%) | 0 (0.0%) |
| $15,000 to $17,499 | 3 (0.6%) | 5 (1.2%) |
| $17,500 to $19,999 | 5 (0.9%) | 0 (0.0%) |
| $20,000 to $22,499 | 25 (4.7%) | 4 (0.9%) |
| $22,500 to $24,999 | 11 (2.1%) | 3 (0.7%) |
| $25,000 to $29,999 | 15 (2.8%) | 29 (6.8%) |
| $30,000 to $34,999 | 30 (5.6%) | 54 (12.7%) |
| $35,000 to $39,999 | 8 (1.5%) | 13 (3.0%) |
| $40,000 to $44,999 | 5 (0.9%) | 10 (2.4%) |
| $45,000 to $49,999 | 30 (5.6%) | 15 (3.5%) |
| $50,000 to $54,999 | 12 (2.2%) | 4 (0.9%) |
| $55,000 to $64,999 | 26 (4.9%) | 47 (11.0%) |
| $65,000 to $74,999 | 17 (3.2%) | 30 (7.0%) |
| $75,000 to $99,999 | 83 (15.5%) | 58 (13.6%) |
| $100,000+ | 152 (28.5%) | 40 (9.4%) |
| Total | 534 (100.0%) | 426 (100.0%) |
Earnings by Sex by Educational Attainment in Clarks Green borough
Average earnings in Clarks Green borough are $79,063 for men and $48,636 for women, a difference of 38.5%. Men with an educational attainment of graduate degree enjoy the highest average annual earnings of $92,396, while those with high school diploma education earn the least with $49,750. Women with an educational attainment of graduate degree earn the most with the average annual earnings of $68,594, while those with high school diploma education have the smallest earnings of $32,292.
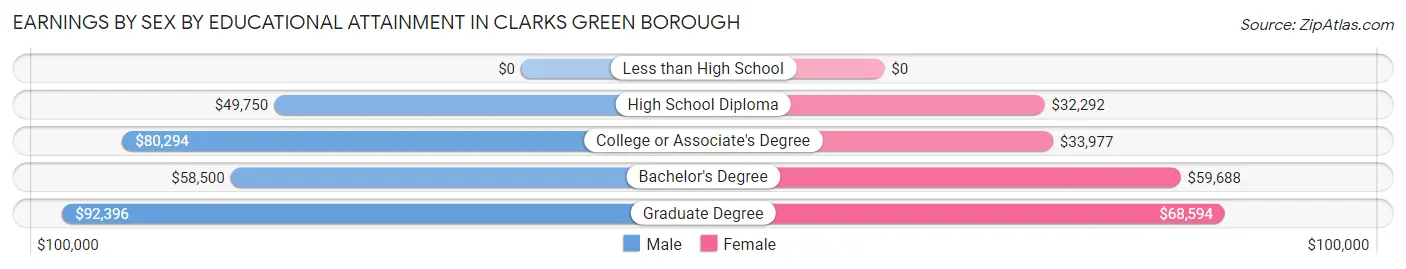
| Educational Attainment | Male Income | Female Income |
| Less than High School | - | - |
| High School Diploma | $49,750 | $32,292 |
| College or Associate's Degree | $80,294 | $33,977 |
| Bachelor's Degree | $58,500 | $59,688 |
| Graduate Degree | $92,396 | $68,594 |
| Total | $79,063 | $48,636 |
Family Income in Clarks Green borough
Family Income Brackets in Clarks Green borough
According to the Clarks Green borough family income data, there are 113 families falling into the $200,000+ income range, which is the most common income bracket and makes up 27.4% of all families.
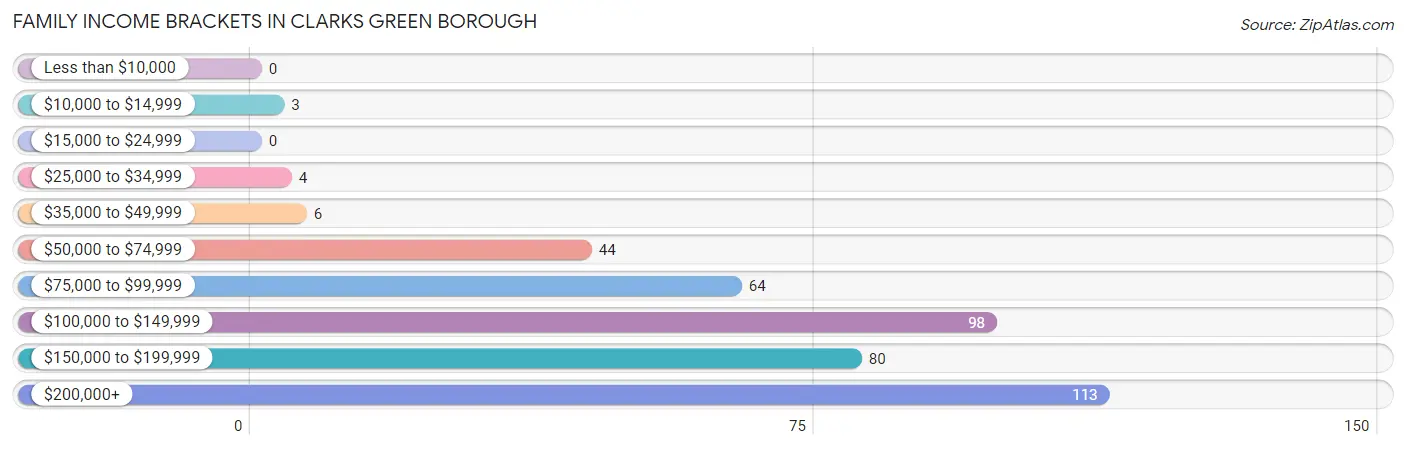
| Income Bracket | # Families | % Families |
| Less than $10,000 | 0 | 0.0% |
| $10,000 to $14,999 | 3 | 0.7% |
| $15,000 to $24,999 | 0 | 0.0% |
| $25,000 to $34,999 | 4 | 1.0% |
| $35,000 to $49,999 | 6 | 1.5% |
| $50,000 to $74,999 | 44 | 10.7% |
| $75,000 to $99,999 | 64 | 15.5% |
| $100,000 to $149,999 | 98 | 23.8% |
| $150,000 to $199,999 | 80 | 19.4% |
| $200,000+ | 113 | 27.4% |
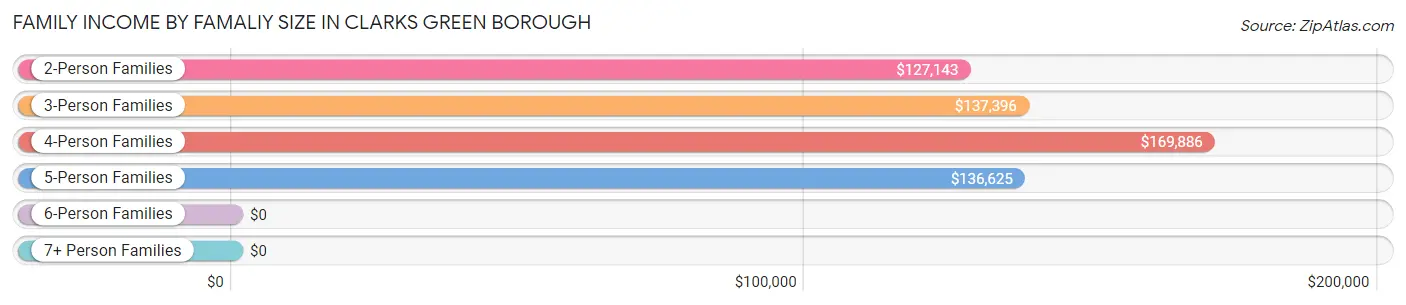
Family Income by Famaliy Size in Clarks Green borough
4-person families (103 | 25.0%) account for the highest median family income in Clarks Green borough with $169,886 per family, while 2-person families (194 | 47.1%) have the highest median income of $63,572 per family member.
| Income Bracket | # Families | Median Income |
| 2-Person Families | 194 (47.1%) | $127,143 |
| 3-Person Families | 53 (12.9%) | $137,396 |
| 4-Person Families | 103 (25.0%) | $169,886 |
| 5-Person Families | 57 (13.8%) | $136,625 |
| 6-Person Families | 2 (0.5%) | $0 |
| 7+ Person Families | 3 (0.7%) | $0 |
| Total | 412 (100.0%) | $141,250 |
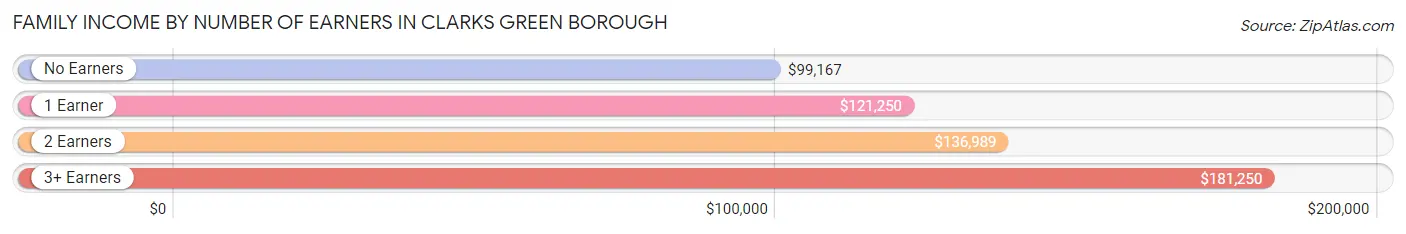
Family Income by Number of Earners in Clarks Green borough
The median family income in Clarks Green borough is $141,250, with families comprising 3+ earners (99) having the highest median family income of $181,250, while families with no earners (28) have the lowest median family income of $99,167, accounting for 24.0% and 6.8% of families, respectively.
| Number of Earners | # Families | Median Income |
| No Earners | 28 (6.8%) | $99,167 |
| 1 Earner | 94 (22.8%) | $121,250 |
| 2 Earners | 191 (46.4%) | $136,989 |
| 3+ Earners | 99 (24.0%) | $181,250 |
| Total | 412 (100.0%) | $141,250 |
Household Income in Clarks Green borough
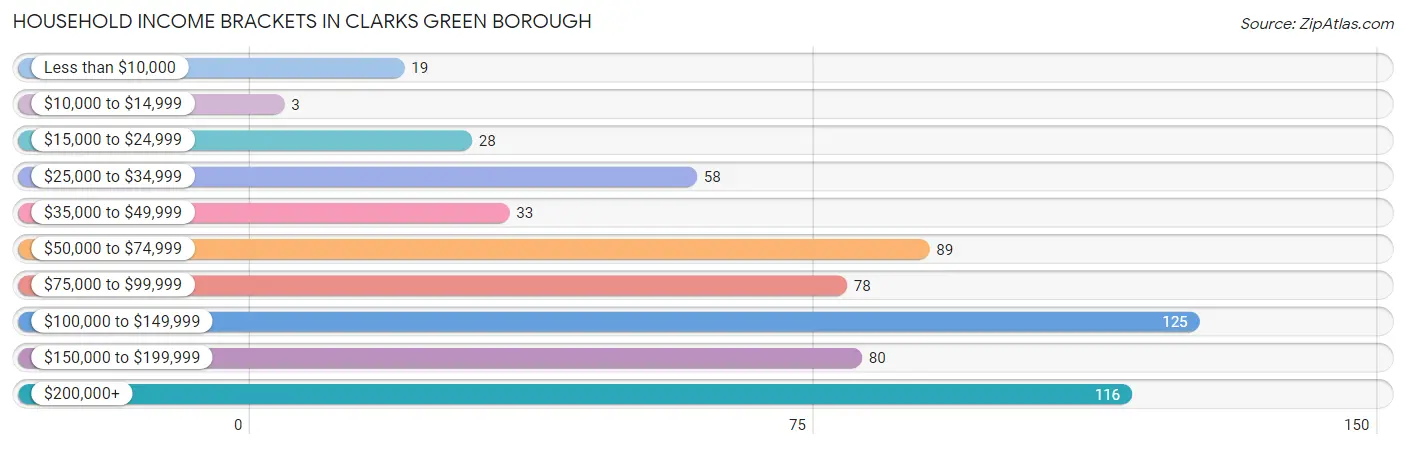
Household Income Brackets in Clarks Green borough
With 125 households falling in the category, the $100,000 to $149,999 income range is the most frequent in Clarks Green borough, accounting for 19.9% of all households. In contrast, only 3 households (0.5%) fall into the $10,000 to $14,999 income bracket, making it the least populous group.
| Income Bracket | # Households | % Households |
| Less than $10,000 | 19 | 3.0% |
| $10,000 to $14,999 | 3 | 0.5% |
| $15,000 to $24,999 | 28 | 4.5% |
| $25,000 to $34,999 | 58 | 9.2% |
| $35,000 to $49,999 | 33 | 5.2% |
| $50,000 to $74,999 | 89 | 14.1% |
| $75,000 to $99,999 | 78 | 12.4% |
| $100,000 to $149,999 | 125 | 19.9% |
| $150,000 to $199,999 | 80 | 12.7% |
| $200,000+ | 116 | 18.4% |
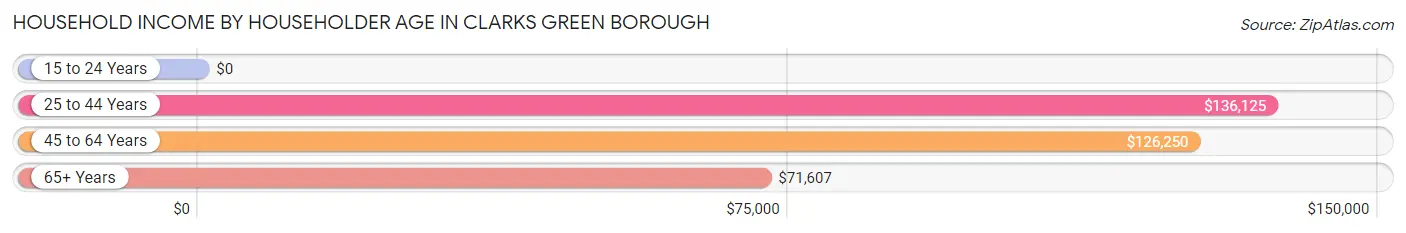
Household Income by Householder Age in Clarks Green borough
The median household income in Clarks Green borough is $105,298, with the highest median household income of $136,125 found in the 25 to 44 years age bracket for the primary householder. A total of 117 households (18.6%) fall into this category. Meanwhile, the 15 to 24 years age bracket for the primary householder has the lowest median household income of $0, with 7 households (1.1%) in this group.
| Income Bracket | # Households | Median Income |
| 15 to 24 Years | 7 (1.1%) | $0 |
| 25 to 44 Years | 117 (18.6%) | $136,125 |
| 45 to 64 Years | 256 (40.7%) | $126,250 |
| 65+ Years | 249 (39.6%) | $71,607 |
| Total | 629 (100.0%) | $105,298 |
Poverty in Clarks Green borough
Income Below Poverty by Sex and Age in Clarks Green borough
With 0.8% poverty level for males and 2.4% for females among the residents of Clarks Green borough, 75 year old and over males and 55 to 64 year old females are the most vulnerable to poverty, with 3 males (4.0%) and 8 females (5.3%) in their respective age groups living below the poverty level.
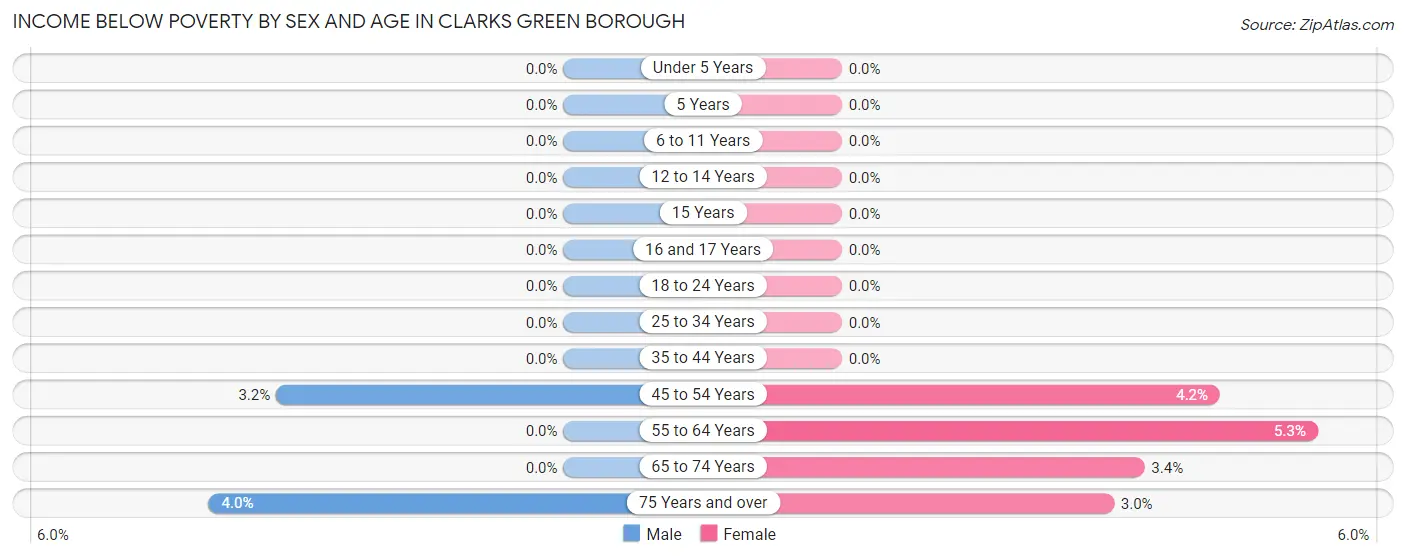
| Age Bracket | Male | Female |
| Under 5 Years | 0 (0.0%) | 0 (0.0%) |
| 5 Years | 0 (0.0%) | 0 (0.0%) |
| 6 to 11 Years | 0 (0.0%) | 0 (0.0%) |
| 12 to 14 Years | 0 (0.0%) | 0 (0.0%) |
| 15 Years | 0 (0.0%) | 0 (0.0%) |
| 16 and 17 Years | 0 (0.0%) | 0 (0.0%) |
| 18 to 24 Years | 0 (0.0%) | 0 (0.0%) |
| 25 to 34 Years | 0 (0.0%) | 0 (0.0%) |
| 35 to 44 Years | 0 (0.0%) | 0 (0.0%) |
| 45 to 54 Years | 4 (3.2%) | 4 (4.2%) |
| 55 to 64 Years | 0 (0.0%) | 8 (5.3%) |
| 65 to 74 Years | 0 (0.0%) | 3 (3.4%) |
| 75 Years and over | 3 (4.0%) | 3 (3.0%) |
| Total | 7 (0.8%) | 18 (2.4%) |
Income Above Poverty by Sex and Age in Clarks Green borough
According to the poverty statistics in Clarks Green borough, males aged under 5 years and females aged under 5 years are the age groups that are most secure financially, with 100.0% of males and 100.0% of females in these age groups living above the poverty line.
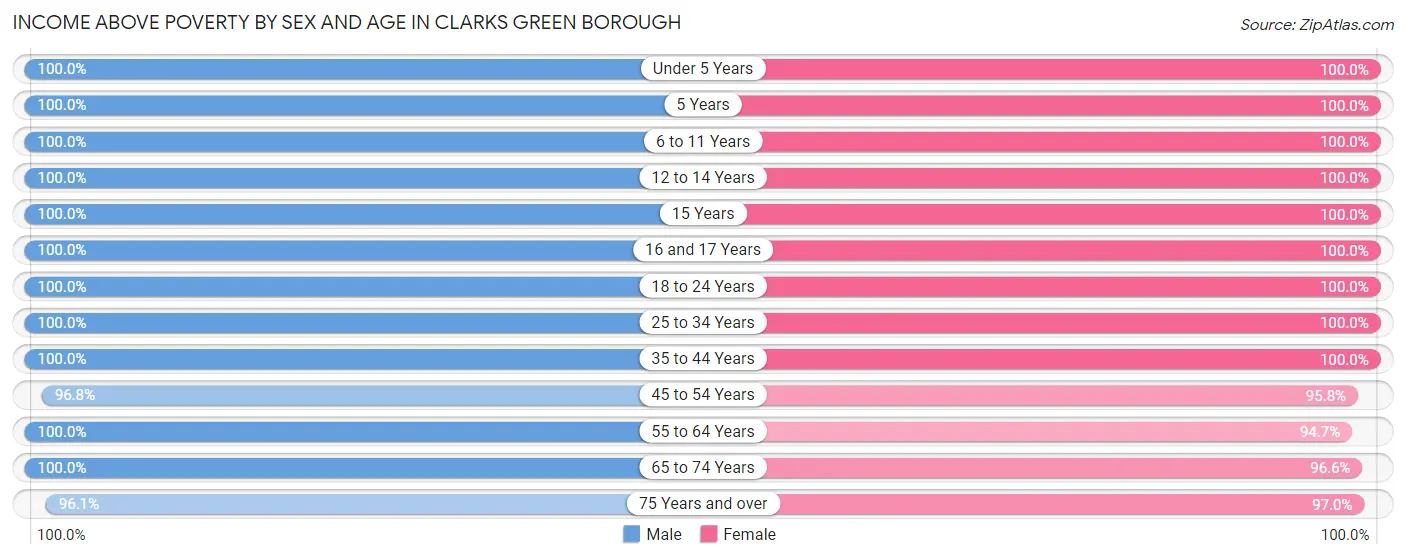
| Age Bracket | Male | Female |
| Under 5 Years | 30 (100.0%) | 26 (100.0%) |
| 5 Years | 6 (100.0%) | 2 (100.0%) |
| 6 to 11 Years | 105 (100.0%) | 12 (100.0%) |
| 12 to 14 Years | 52 (100.0%) | 46 (100.0%) |
| 15 Years | 8 (100.0%) | 9 (100.0%) |
| 16 and 17 Years | 23 (100.0%) | 26 (100.0%) |
| 18 to 24 Years | 92 (100.0%) | 39 (100.0%) |
| 25 to 34 Years | 70 (100.0%) | 65 (100.0%) |
| 35 to 44 Years | 55 (100.0%) | 79 (100.0%) |
| 45 to 54 Years | 121 (96.8%) | 91 (95.8%) |
| 55 to 64 Years | 97 (100.0%) | 143 (94.7%) |
| 65 to 74 Years | 103 (100.0%) | 86 (96.6%) |
| 75 Years and over | 73 (96.1%) | 96 (97.0%) |
| Total | 835 (99.2%) | 720 (97.6%) |
Income Below Poverty Among Married-Couple Families in Clarks Green borough
The poverty statistics for married-couple families in Clarks Green borough show that 0.8% or 3 of the total 364 families live below the poverty line. Families with no children have the highest poverty rate of 1.4%, comprising of 3 families. On the other hand, families with 1 or 2 children have the lowest poverty rate of 0.0%, which includes 0 families.
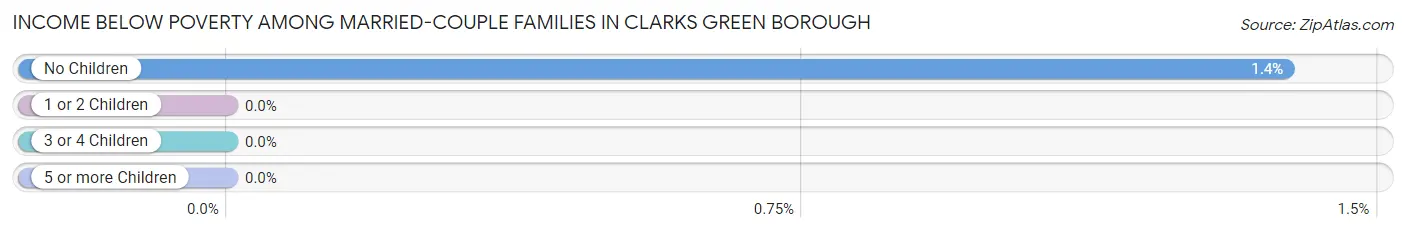
| Children | Above Poverty | Below Poverty |
| No Children | 214 (98.6%) | 3 (1.4%) |
| 1 or 2 Children | 103 (100.0%) | 0 (0.0%) |
| 3 or 4 Children | 44 (100.0%) | 0 (0.0%) |
| 5 or more Children | 0 (0.0%) | 0 (0.0%) |
| Total | 361 (99.2%) | 3 (0.8%) |
Income Below Poverty Among Single-Parent Households in Clarks Green borough
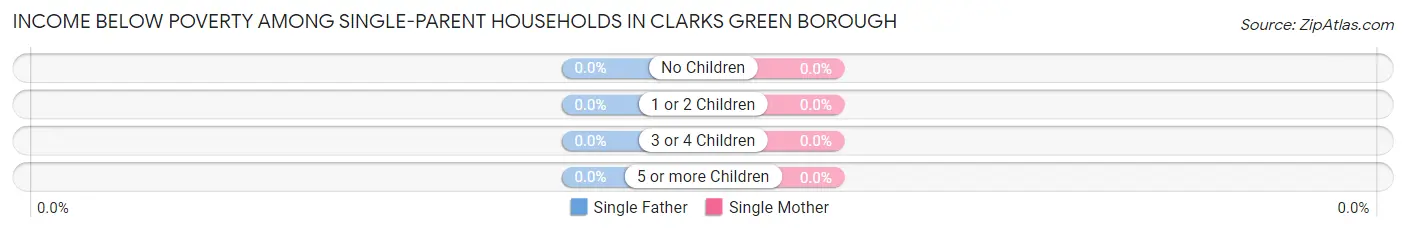
| Children | Single Father | Single Mother |
| No Children | 0 (0.0%) | 0 (0.0%) |
| 1 or 2 Children | 0 (0.0%) | 0 (0.0%) |
| 3 or 4 Children | 0 (0.0%) | 0 (0.0%) |
| 5 or more Children | 0 (0.0%) | 0 (0.0%) |
| Total | 0 (0.0%) | 0 (0.0%) |
Income Below Poverty Among Married-Couple vs Single-Parent Households in Clarks Green borough
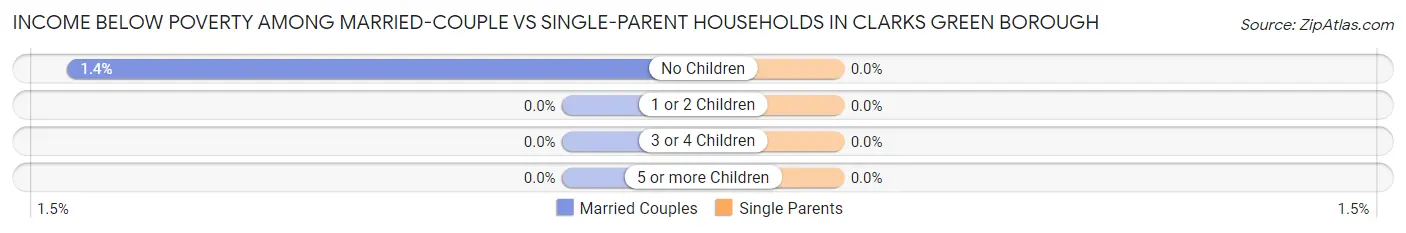
| Children | Married-Couple Families | Single-Parent Households |
| No Children | 3 (1.4%) | 0 (0.0%) |
| 1 or 2 Children | 0 (0.0%) | 0 (0.0%) |
| 3 or 4 Children | 0 (0.0%) | 0 (0.0%) |
| 5 or more Children | 0 (0.0%) | 0 (0.0%) |
| Total | 3 (0.8%) | 0 (0.0%) |
Race in Clarks Green borough
The most populous races in Clarks Green borough are White / Caucasian (1,417 | 88.9%), Asian (145 | 9.1%), and Hispanic or Latino (66 | 4.1%).
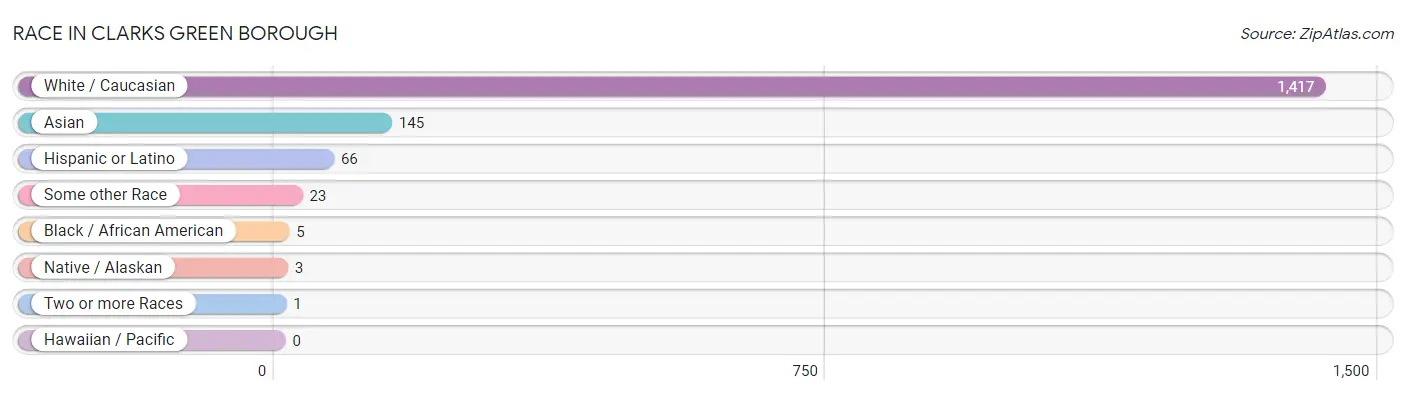
| Race | # Population | % Population |
| Asian | 145 | 9.1% |
| Black / African American | 5 | 0.3% |
| Hawaiian / Pacific | 0 | 0.0% |
| Hispanic or Latino | 66 | 4.1% |
| Native / Alaskan | 3 | 0.2% |
| White / Caucasian | 1,417 | 88.9% |
| Two or more Races | 1 | 0.1% |
| Some other Race | 23 | 1.4% |
| Total | 1,594 | 100.0% |
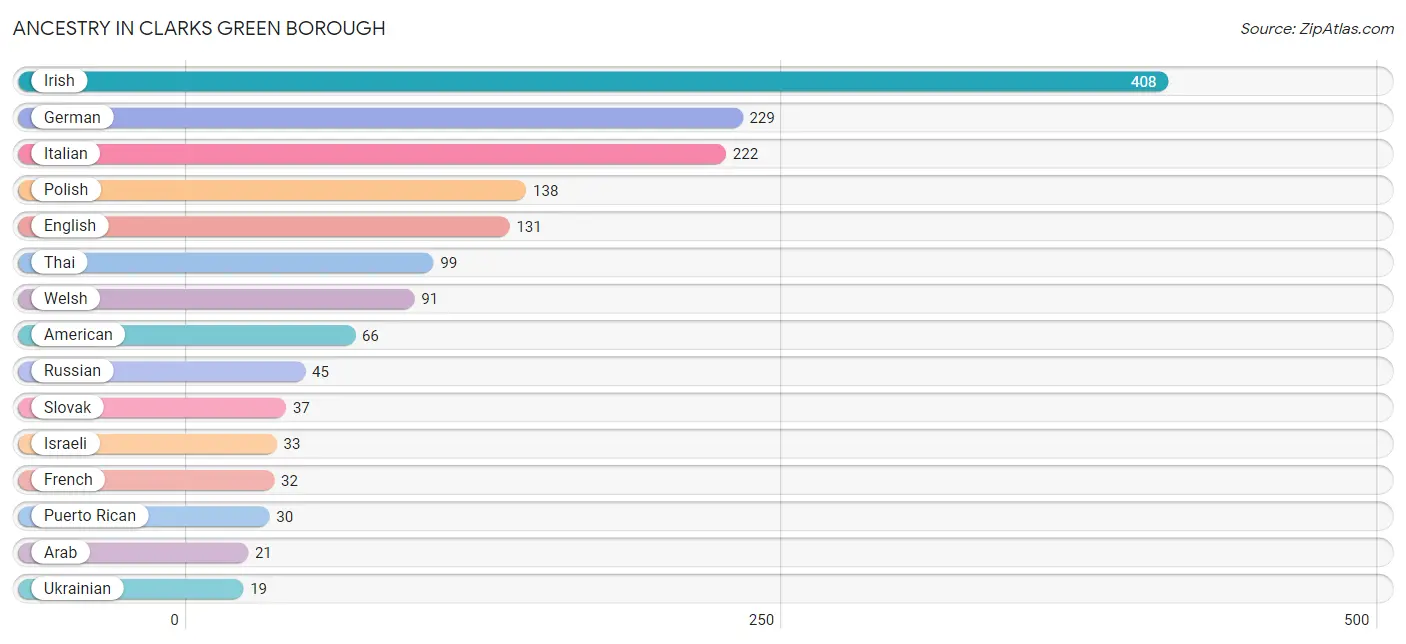
Ancestry in Clarks Green borough
The most populous ancestries reported in Clarks Green borough are Irish (408 | 25.6%), German (229 | 14.4%), Italian (222 | 13.9%), Polish (138 | 8.7%), and English (131 | 8.2%), together accounting for 70.8% of all Clarks Green borough residents.
| Ancestry | # Population | % Population |
| American | 66 | 4.1% |
| Arab | 21 | 1.3% |
| Argentinean | 17 | 1.1% |
| Austrian | 6 | 0.4% |
| British | 8 | 0.5% |
| Croatian | 2 | 0.1% |
| Cuban | 6 | 0.4% |
| Czech | 3 | 0.2% |
| Dominican | 13 | 0.8% |
| Eastern European | 17 | 1.1% |
| English | 131 | 8.2% |
| European | 8 | 0.5% |
| French | 32 | 2.0% |
| German | 229 | 14.4% |
| Greek | 6 | 0.4% |
| Hungarian | 4 | 0.3% |
| Irish | 408 | 25.6% |
| Israeli | 33 | 2.1% |
| Italian | 222 | 13.9% |
| Lebanese | 3 | 0.2% |
| Lithuanian | 7 | 0.4% |
| Norwegian | 3 | 0.2% |
| Pennsylvania German | 3 | 0.2% |
| Polish | 138 | 8.7% |
| Portuguese | 10 | 0.6% |
| Puerto Rican | 30 | 1.9% |
| Romanian | 2 | 0.1% |
| Russian | 45 | 2.8% |
| Scotch-Irish | 6 | 0.4% |
| Scottish | 11 | 0.7% |
| Slavic | 3 | 0.2% |
| Slovak | 37 | 2.3% |
| Slovene | 4 | 0.3% |
| South American | 17 | 1.1% |
| Swedish | 4 | 0.3% |
| Syrian | 18 | 1.1% |
| Thai | 99 | 6.2% |
| Ukrainian | 19 | 1.2% |
| Welsh | 91 | 5.7% | View All 39 Rows |
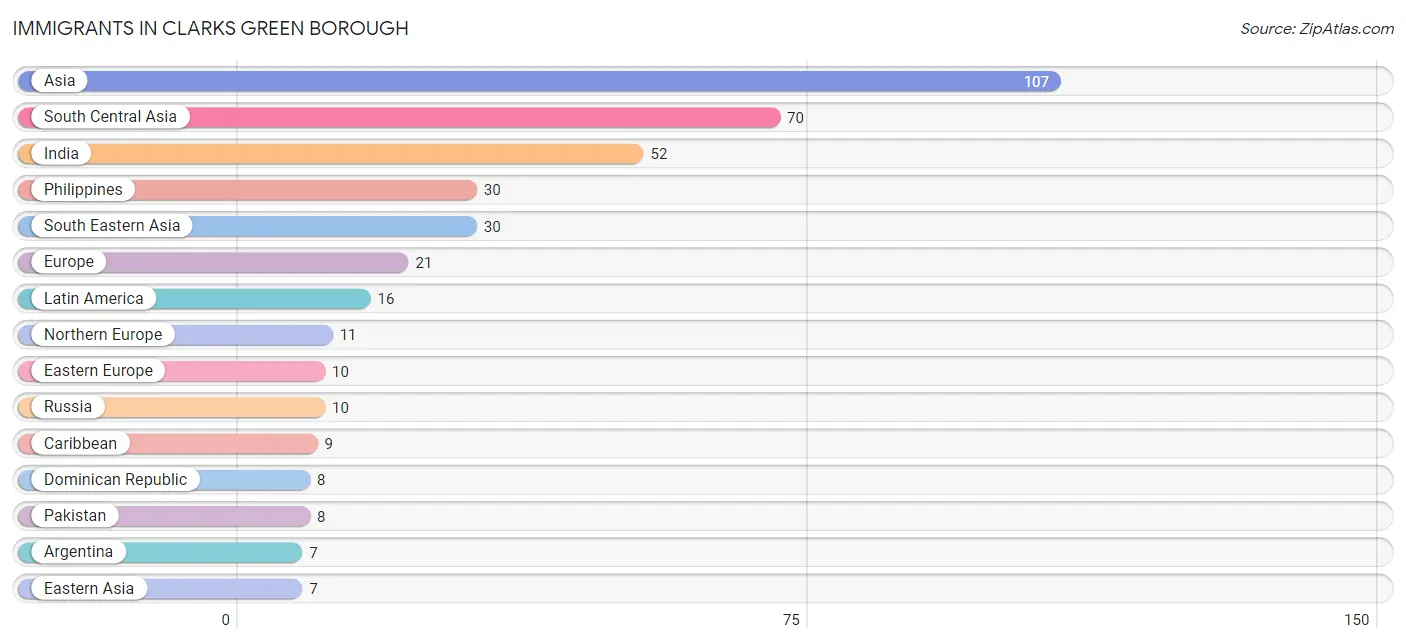
Immigrants in Clarks Green borough
The most numerous immigrant groups reported in Clarks Green borough came from Asia (107 | 6.7%), South Central Asia (70 | 4.4%), India (52 | 3.3%), Philippines (30 | 1.9%), and South Eastern Asia (30 | 1.9%), together accounting for 18.1% of all Clarks Green borough residents.
| Immigration Origin | # Population | % Population |
| Argentina | 7 | 0.4% |
| Asia | 107 | 6.7% |
| Caribbean | 9 | 0.6% |
| Cuba | 1 | 0.1% |
| Dominican Republic | 8 | 0.5% |
| Eastern Asia | 7 | 0.4% |
| Eastern Europe | 10 | 0.6% |
| Europe | 21 | 1.3% |
| India | 52 | 3.3% |
| Ireland | 3 | 0.2% |
| Japan | 7 | 0.4% |
| Latin America | 16 | 1.0% |
| Northern Europe | 11 | 0.7% |
| Pakistan | 8 | 0.5% |
| Philippines | 30 | 1.9% |
| Russia | 10 | 0.6% |
| Scotland | 3 | 0.2% |
| South America | 7 | 0.4% |
| South Central Asia | 70 | 4.4% |
| South Eastern Asia | 30 | 1.9% | View All 20 Rows |
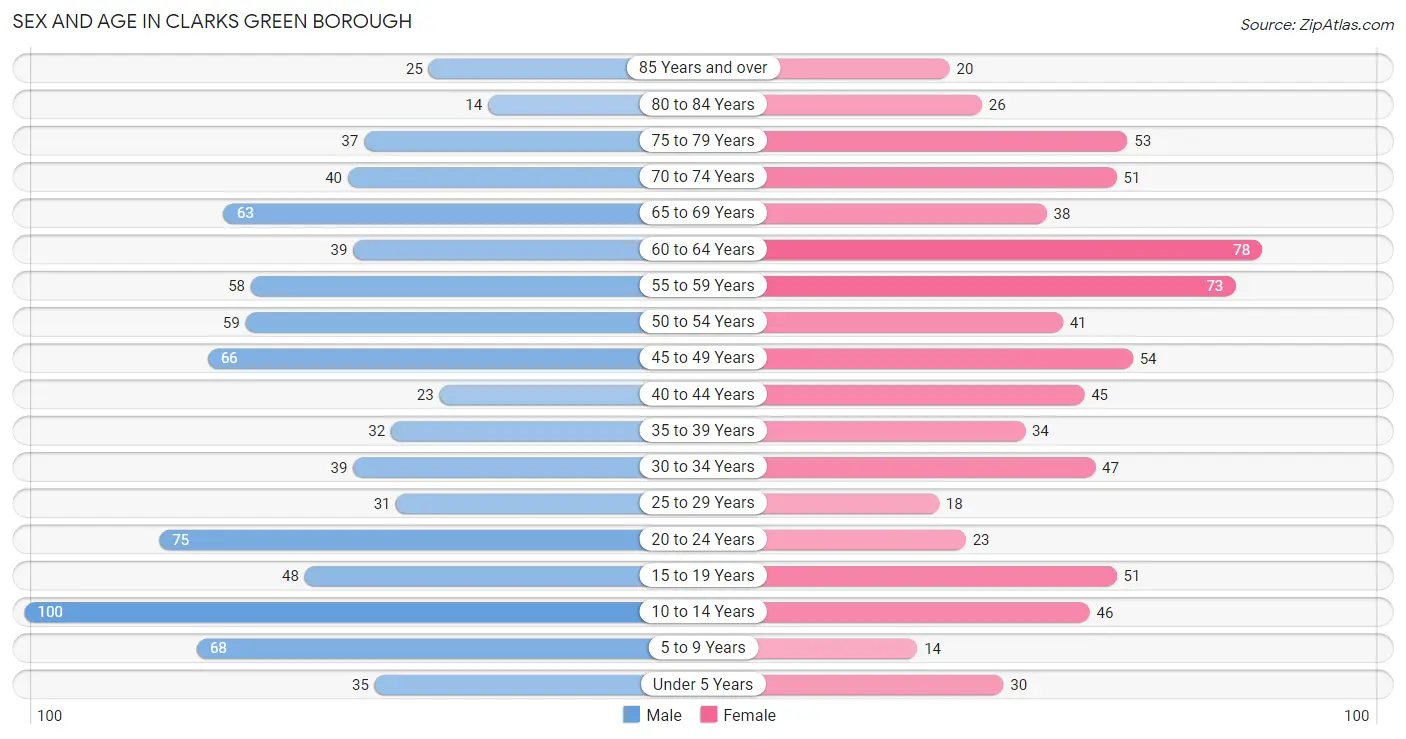
Sex and Age in Clarks Green borough
Sex and Age in Clarks Green borough
The most populous age groups in Clarks Green borough are 10 to 14 Years (100 | 11.7%) for men and 60 to 64 Years (78 | 10.5%) for women.
| Age Bracket | Male | Female |
| Under 5 Years | 35 (4.1%) | 30 (4.0%) |
| 5 to 9 Years | 68 (8.0%) | 14 (1.9%) |
| 10 to 14 Years | 100 (11.7%) | 46 (6.2%) |
| 15 to 19 Years | 48 (5.6%) | 51 (6.9%) |
| 20 to 24 Years | 75 (8.8%) | 23 (3.1%) |
| 25 to 29 Years | 31 (3.6%) | 18 (2.4%) |
| 30 to 34 Years | 39 (4.6%) | 47 (6.3%) |
| 35 to 39 Years | 32 (3.8%) | 34 (4.6%) |
| 40 to 44 Years | 23 (2.7%) | 45 (6.1%) |
| 45 to 49 Years | 66 (7.7%) | 54 (7.3%) |
| 50 to 54 Years | 59 (6.9%) | 41 (5.5%) |
| 55 to 59 Years | 58 (6.8%) | 73 (9.8%) |
| 60 to 64 Years | 39 (4.6%) | 78 (10.5%) |
| 65 to 69 Years | 63 (7.4%) | 38 (5.1%) |
| 70 to 74 Years | 40 (4.7%) | 51 (6.9%) |
| 75 to 79 Years | 37 (4.3%) | 53 (7.1%) |
| 80 to 84 Years | 14 (1.6%) | 26 (3.5%) |
| 85 Years and over | 25 (2.9%) | 20 (2.7%) |
| Total | 852 (100.0%) | 742 (100.0%) |
Families and Households in Clarks Green borough
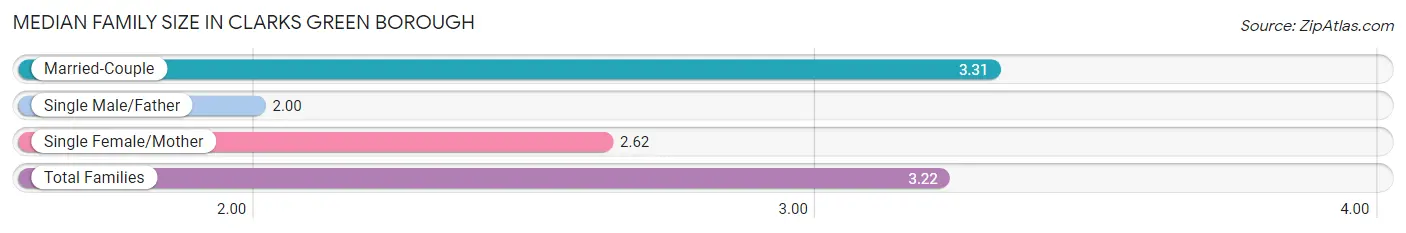
Median Family Size in Clarks Green borough
The median family size in Clarks Green borough is 3.22 persons per family, with married-couple families (364 | 88.3%) accounting for the largest median family size of 3.31 persons per family. On the other hand, single male/father families (6 | 1.5%) represent the smallest median family size with 2.00 persons per family.
| Family Type | # Families | Family Size |
| Married-Couple | 364 (88.3%) | 3.31 |
| Single Male/Father | 6 (1.5%) | 2.00 |
| Single Female/Mother | 42 (10.2%) | 2.62 |
| Total Families | 412 (100.0%) | 3.22 |
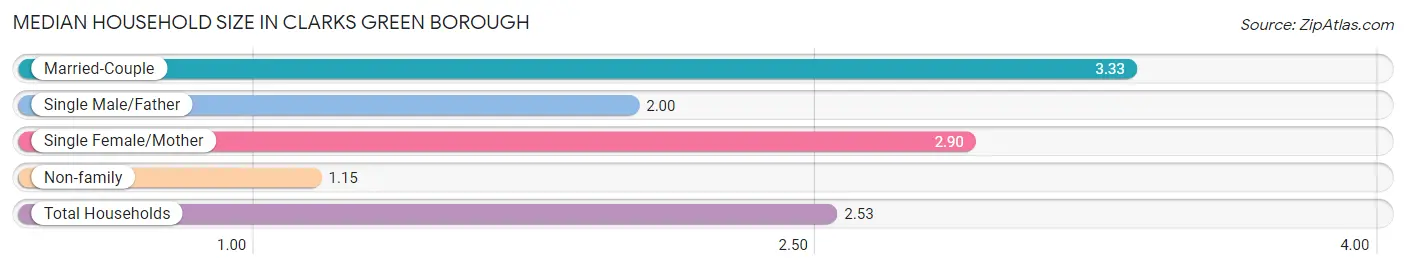
Median Household Size in Clarks Green borough
The median household size in Clarks Green borough is 2.53 persons per household, with married-couple households (364 | 57.9%) accounting for the largest median household size of 3.33 persons per household. non-family households (217 | 34.5%) represent the smallest median household size with 1.15 persons per household.
| Household Type | # Households | Household Size |
| Married-Couple | 364 (57.9%) | 3.33 |
| Single Male/Father | 6 (0.9%) | 2.00 |
| Single Female/Mother | 42 (6.7%) | 2.90 |
| Non-family | 217 (34.5%) | 1.15 |
| Total Households | 629 (100.0%) | 2.53 |
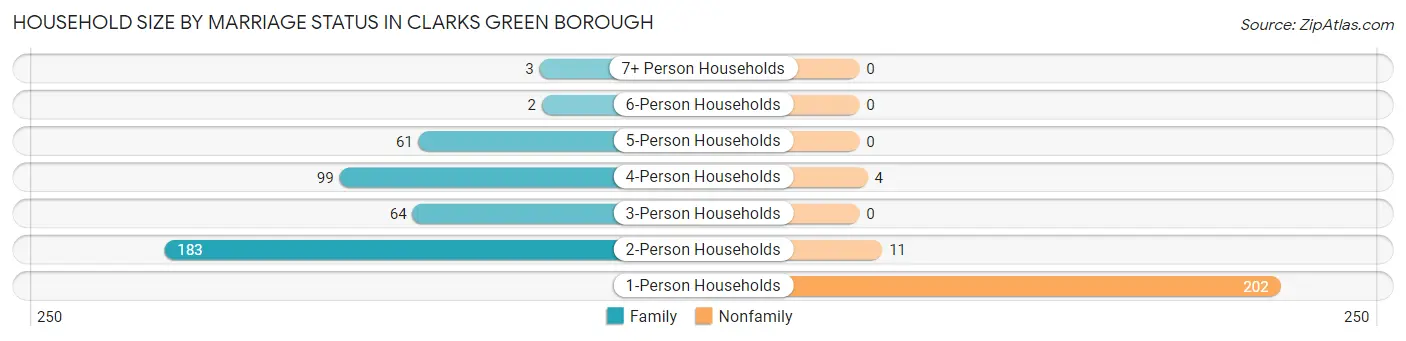
Household Size by Marriage Status in Clarks Green borough
Out of a total of 629 households in Clarks Green borough, 412 (65.5%) are family households, while 217 (34.5%) are nonfamily households. The most numerous type of family households are 2-person households, comprising 183, and the most common type of nonfamily households are 1-person households, comprising 202.
| Household Size | Family Households | Nonfamily Households |
| 1-Person Households | - | 202 (32.1%) |
| 2-Person Households | 183 (29.1%) | 11 (1.8%) |
| 3-Person Households | 64 (10.2%) | 0 (0.0%) |
| 4-Person Households | 99 (15.7%) | 4 (0.6%) |
| 5-Person Households | 61 (9.7%) | 0 (0.0%) |
| 6-Person Households | 2 (0.3%) | 0 (0.0%) |
| 7+ Person Households | 3 (0.5%) | 0 (0.0%) |
| Total | 412 (65.5%) | 217 (34.5%) |
Female Fertility in Clarks Green borough
Fertility by Age in Clarks Green borough
| Age Bracket | Women with Births | Births / 1,000 Women |
| 15 to 19 years | 0 (0.0%) | 0.0 |
| 20 to 34 years | 0 (0.0%) | 0.0 |
| 35 to 50 years | 0 (0.0%) | 0.0 |
| Total | 0 (0.0%) | 0.0 |
Fertility by Age by Marriage Status in Clarks Green borough
| Age Bracket | Married | Unmarried |
| 15 to 19 years | 0 (0.0%) | 0 (0.0%) |
| 20 to 34 years | 0 (0.0%) | 0 (0.0%) |
| 35 to 50 years | 0 (0.0%) | 0 (0.0%) |
| Total | 0 (0.0%) | 0 (0.0%) |
Fertility by Education in Clarks Green borough
| Educational Attainment | Women with Births | Births / 1,000 Women |
| Less than High School | 0 (0.0%) | 0.0 |
| High School Diploma | 0 (0.0%) | 0.0 |
| College or Associate's Degree | 0 (0.0%) | 0.0 |
| Bachelor's Degree | 0 (0.0%) | 0.0 |
| Graduate Degree | 0 (0.0%) | 0.0 |
| Total | 0 (0.0%) | 0.0 |
Fertility by Education by Marriage Status in Clarks Green borough
| Educational Attainment | Married | Unmarried |
| Less than High School | 0 (0.0%) | 0 (0.0%) |
| High School Diploma | 0 (0.0%) | 0 (0.0%) |
| College or Associate's Degree | 0 (0.0%) | 0 (0.0%) |
| Bachelor's Degree | 0 (0.0%) | 0 (0.0%) |
| Graduate Degree | 0 (0.0%) | 0 (0.0%) |
| Total | 0 (0.0%) | 0 (0.0%) |
Employment Characteristics in Clarks Green borough
Employment by Class of Employer in Clarks Green borough
Among the 889 employed individuals in Clarks Green borough, private company employees (544 | 61.2%), local government employees (81 | 9.1%), and self-employed (incorporated) (80 | 9.0%) make up the most common classes of employment.
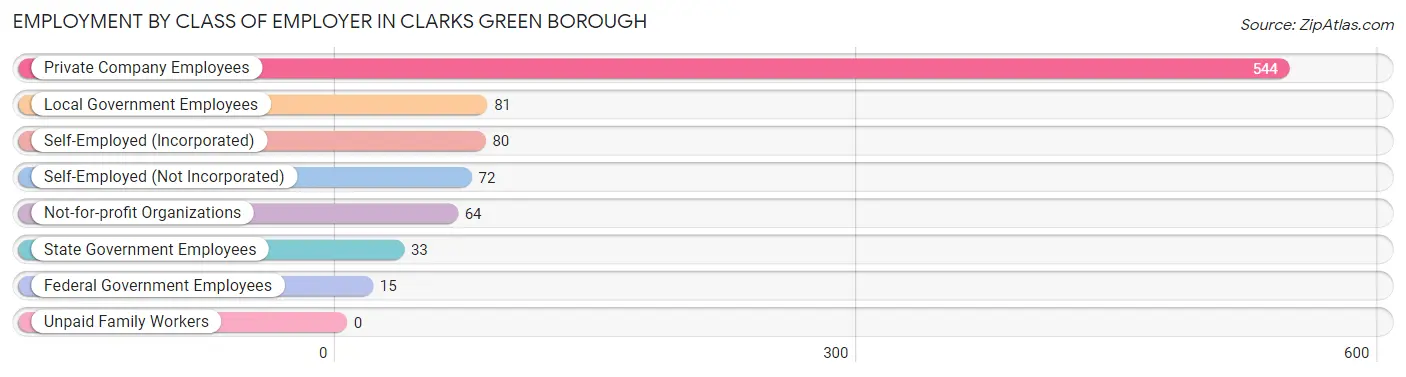
| Employer Class | # Employees | % Employees |
| Private Company Employees | 544 | 61.2% |
| Self-Employed (Incorporated) | 80 | 9.0% |
| Self-Employed (Not Incorporated) | 72 | 8.1% |
| Not-for-profit Organizations | 64 | 7.2% |
| Local Government Employees | 81 | 9.1% |
| State Government Employees | 33 | 3.7% |
| Federal Government Employees | 15 | 1.7% |
| Unpaid Family Workers | 0 | 0.0% |
| Total | 889 | 100.0% |
Employment Status by Age in Clarks Green borough
According to the labor force statistics for Clarks Green borough, out of the total population over 16 years of age (1,284), 70.2% or 901 individuals are in the labor force, with 0.6% or 5 of them unemployed. The age group with the highest labor force participation rate is 30 to 34 years, with 94.2% or 81 individuals in the labor force. Within the labor force, the 65 to 74 years age range has the highest percentage of unemployed individuals, with 2.8% or 3 of them being unemployed.
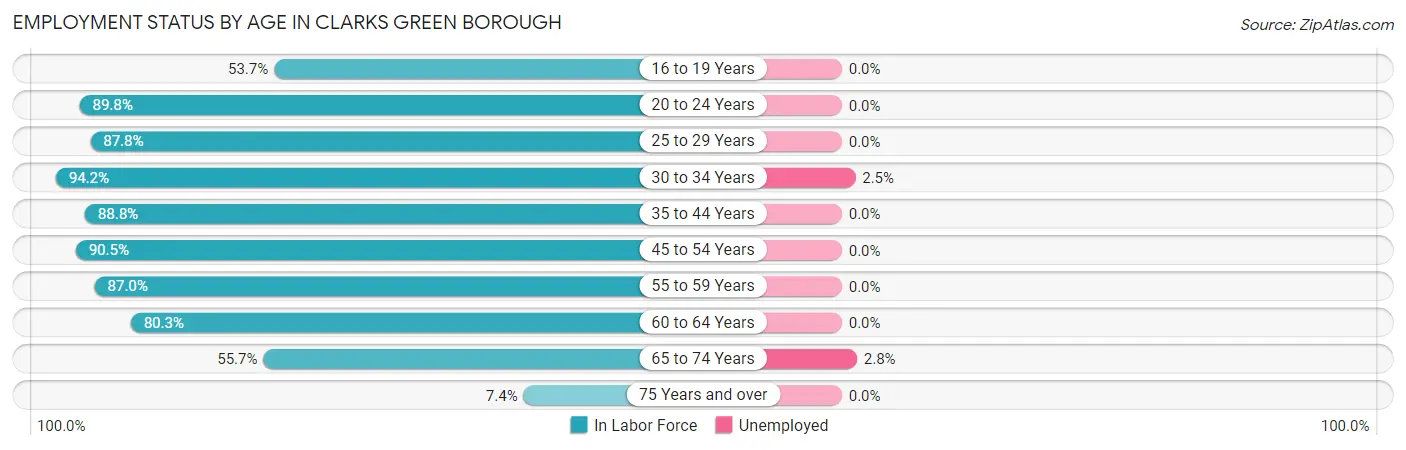
| Age Bracket | In Labor Force | Unemployed |
| 16 to 19 Years | 44 (53.7%) | 0 (0.0%) |
| 20 to 24 Years | 88 (89.8%) | 0 (0.0%) |
| 25 to 29 Years | 43 (87.8%) | 0 (0.0%) |
| 30 to 34 Years | 81 (94.2%) | 2 (2.5%) |
| 35 to 44 Years | 119 (88.8%) | 0 (0.0%) |
| 45 to 54 Years | 199 (90.5%) | 0 (0.0%) |
| 55 to 59 Years | 114 (87.0%) | 0 (0.0%) |
| 60 to 64 Years | 94 (80.3%) | 0 (0.0%) |
| 65 to 74 Years | 107 (55.7%) | 3 (2.8%) |
| 75 Years and over | 13 (7.4%) | 0 (0.0%) |
| Total | 901 (70.2%) | 5 (0.6%) |
Employment Status by Educational Attainment in Clarks Green borough
According to labor force statistics for Clarks Green borough, 88.2% of individuals (650) out of the total population between 25 and 64 years of age (737) are in the labor force, with 0.3% or 2 of them being unemployed. The group with the highest labor force participation rate are those with the educational attainment of less than high school, with 100.0% or 19 individuals in the labor force. Within the labor force, individuals with bachelor's degree or higher education have the highest percentage of unemployment, with 0.5% or 2 of them being unemployed.
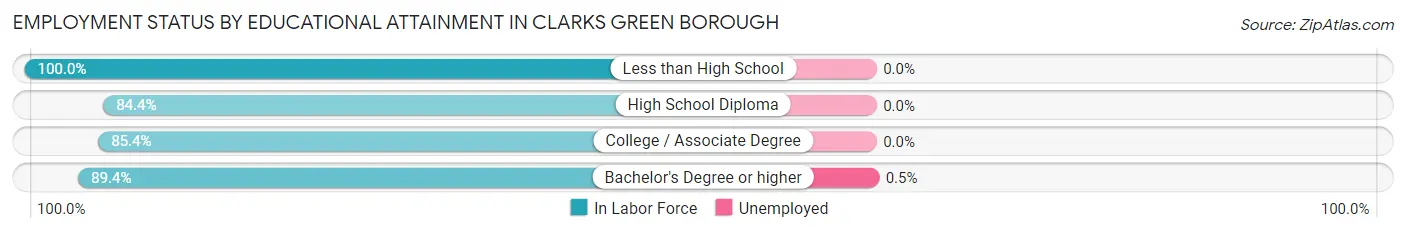
| Educational Attainment | In Labor Force | Unemployed |
| Less than High School | 19 (100.0%) | 0 (0.0%) |
| High School Diploma | 81 (84.4%) | 0 (0.0%) |
| College / Associate Degree | 135 (85.4%) | 0 (0.0%) |
| Bachelor's Degree or higher | 415 (89.4%) | 2 (0.5%) |
| Total | 650 (88.2%) | 2 (0.3%) |
Employment Occupations by Sex in Clarks Green borough
Management, Business, Science and Arts Occupations
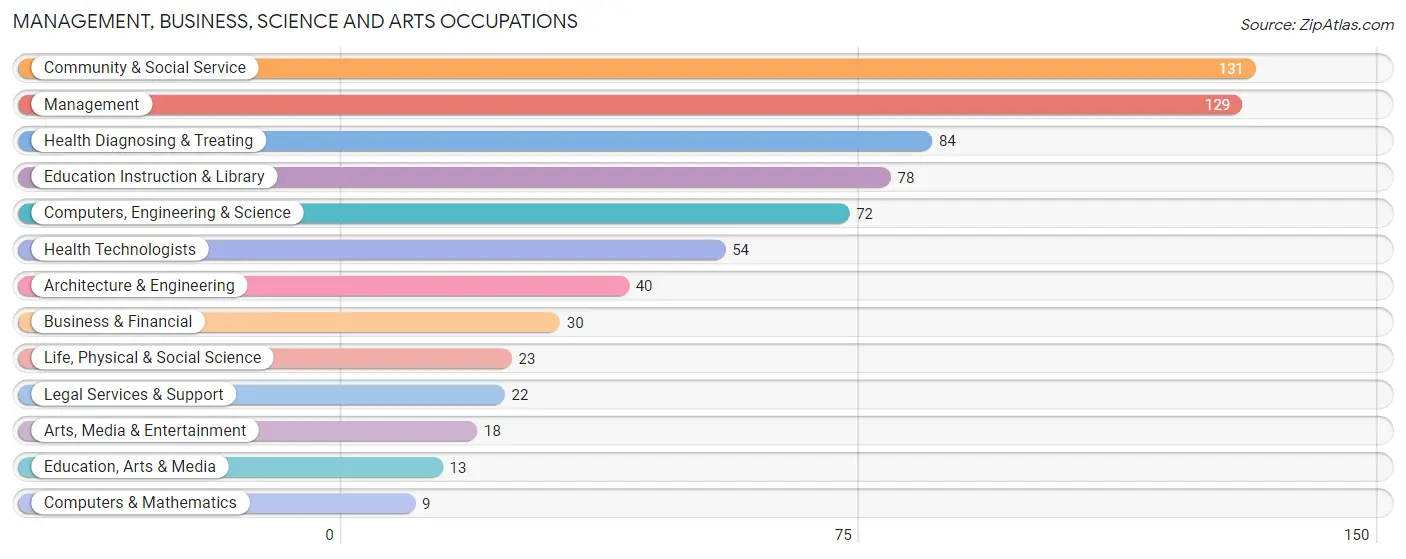
The most common Management, Business, Science and Arts occupations in Clarks Green borough are Community & Social Service (131 | 14.6%), Management (129 | 14.4%), Health Diagnosing & Treating (84 | 9.4%), Education Instruction & Library (78 | 8.7%), and Computers, Engineering & Science (72 | 8.0%).
Management, Business, Science and Arts Occupations by Sex
Within the Management, Business, Science and Arts occupations in Clarks Green borough, the most male-oriented occupations are Architecture & Engineering (100.0%), Arts, Media & Entertainment (88.9%), and Computers, Engineering & Science (87.5%), while the most female-oriented occupations are Education Instruction & Library (91.0%), Health Technologists (75.9%), and Education, Arts & Media (69.2%).
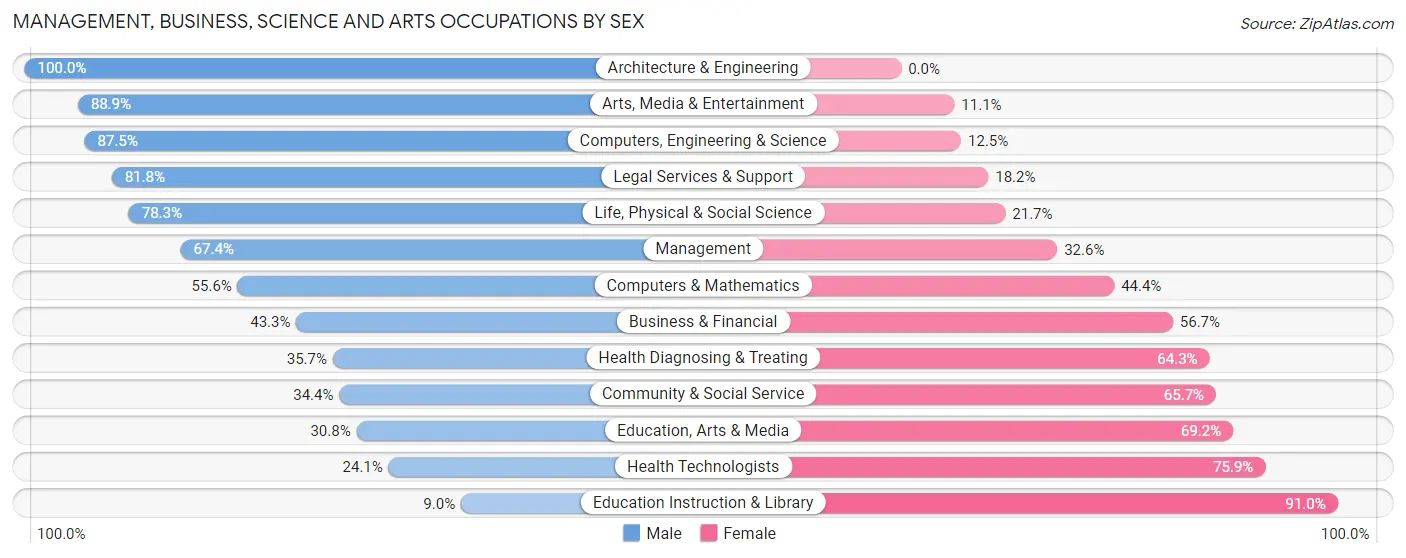
| Occupation | Male | Female |
| Management | 87 (67.4%) | 42 (32.6%) |
| Business & Financial | 13 (43.3%) | 17 (56.7%) |
| Computers, Engineering & Science | 63 (87.5%) | 9 (12.5%) |
| Computers & Mathematics | 5 (55.6%) | 4 (44.4%) |
| Architecture & Engineering | 40 (100.0%) | 0 (0.0%) |
| Life, Physical & Social Science | 18 (78.3%) | 5 (21.7%) |
| Community & Social Service | 45 (34.4%) | 86 (65.6%) |
| Education, Arts & Media | 4 (30.8%) | 9 (69.2%) |
| Legal Services & Support | 18 (81.8%) | 4 (18.2%) |
| Education Instruction & Library | 7 (9.0%) | 71 (91.0%) |
| Arts, Media & Entertainment | 16 (88.9%) | 2 (11.1%) |
| Health Diagnosing & Treating | 30 (35.7%) | 54 (64.3%) |
| Health Technologists | 13 (24.1%) | 41 (75.9%) |
| Total (Category) | 238 (53.4%) | 208 (46.6%) |
| Total (Overall) | 517 (57.6%) | 380 (42.4%) |
Services Occupations
The most common Services occupations in Clarks Green borough are Personal Care & Service (40 | 4.5%), Cleaning & Maintenance (12 | 1.3%), Healthcare Support (11 | 1.2%), Food Preparation & Serving (9 | 1.0%), and Security & Protection (8 | 0.9%).
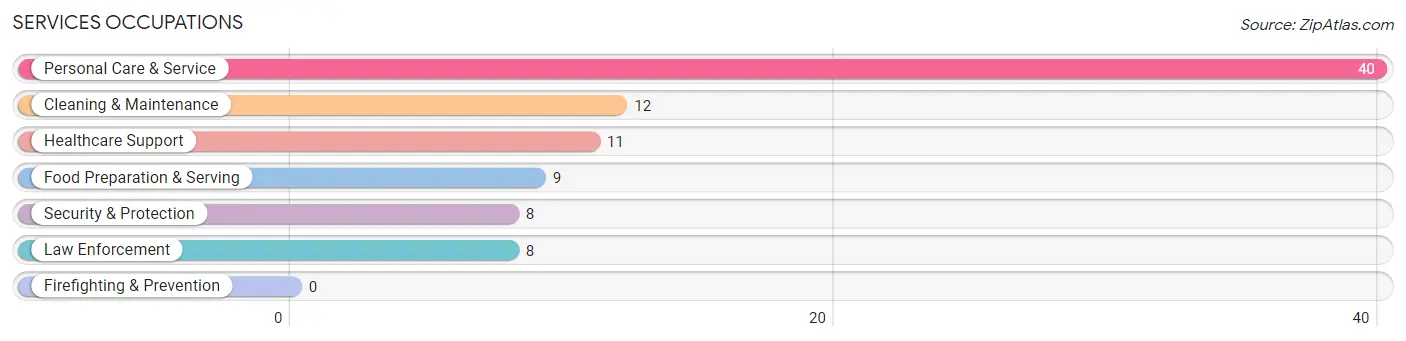
Services Occupations by Sex
Within the Services occupations in Clarks Green borough, the most male-oriented occupations are Cleaning & Maintenance (100.0%), Personal Care & Service (67.5%), and Security & Protection (50.0%), while the most female-oriented occupations are Healthcare Support (100.0%), Food Preparation & Serving (55.6%), and Security & Protection (50.0%).
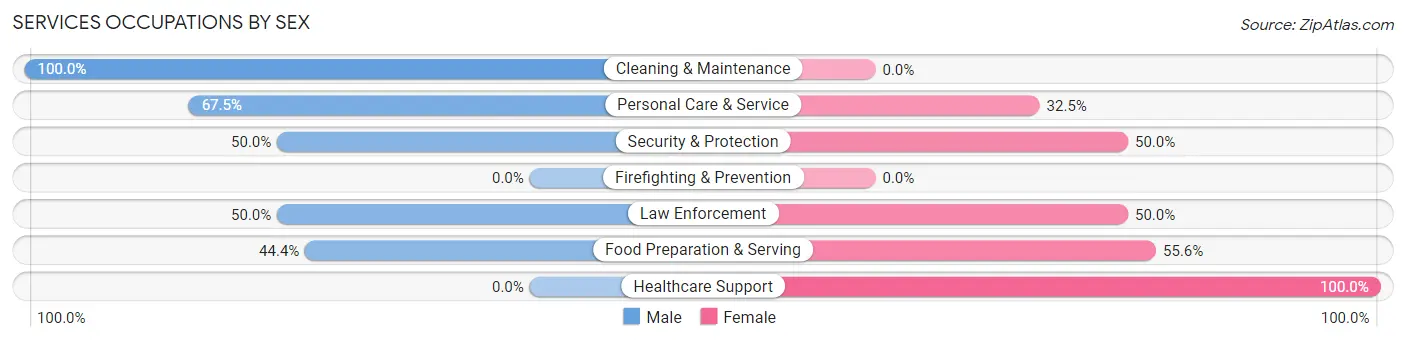
| Occupation | Male | Female |
| Healthcare Support | 0 (0.0%) | 11 (100.0%) |
| Security & Protection | 4 (50.0%) | 4 (50.0%) |
| Firefighting & Prevention | 0 (0.0%) | 0 (0.0%) |
| Law Enforcement | 4 (50.0%) | 4 (50.0%) |
| Food Preparation & Serving | 4 (44.4%) | 5 (55.6%) |
| Cleaning & Maintenance | 12 (100.0%) | 0 (0.0%) |
| Personal Care & Service | 27 (67.5%) | 13 (32.5%) |
| Total (Category) | 47 (58.8%) | 33 (41.2%) |
| Total (Overall) | 517 (57.6%) | 380 (42.4%) |
Sales and Office Occupations
The most common Sales and Office occupations in Clarks Green borough are Sales & Related (191 | 21.3%), and Office & Administration (78 | 8.7%).
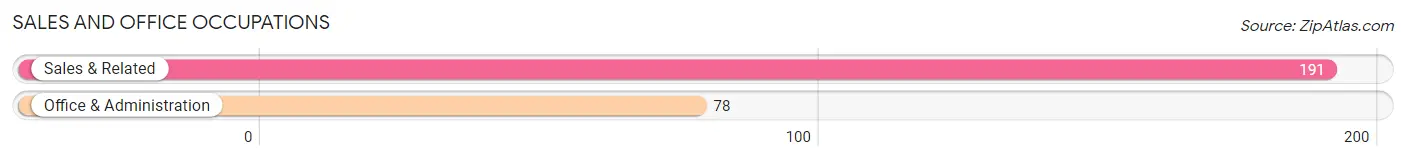
Sales and Office Occupations by Sex
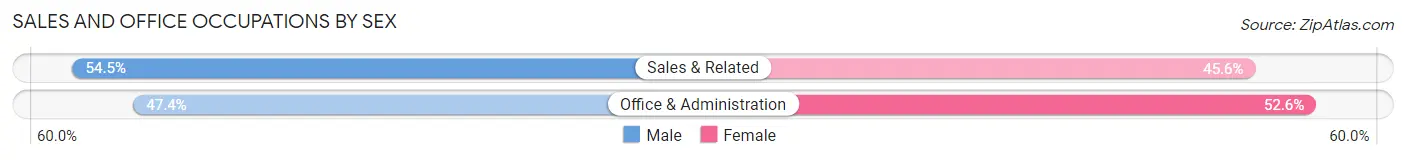
| Occupation | Male | Female |
| Sales & Related | 104 (54.4%) | 87 (45.6%) |
| Office & Administration | 37 (47.4%) | 41 (52.6%) |
| Total (Category) | 141 (52.4%) | 128 (47.6%) |
| Total (Overall) | 517 (57.6%) | 380 (42.4%) |
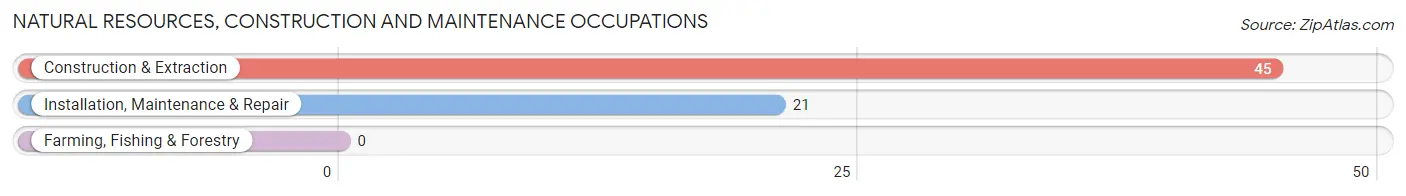
Natural Resources, Construction and Maintenance Occupations
The most common Natural Resources, Construction and Maintenance occupations in Clarks Green borough are Construction & Extraction (45 | 5.0%), and Installation, Maintenance & Repair (21 | 2.3%).
Natural Resources, Construction and Maintenance Occupations by Sex
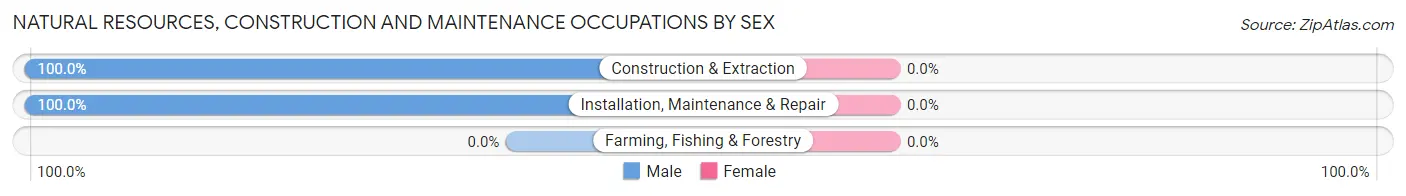
| Occupation | Male | Female |
| Farming, Fishing & Forestry | 0 (0.0%) | 0 (0.0%) |
| Construction & Extraction | 45 (100.0%) | 0 (0.0%) |
| Installation, Maintenance & Repair | 21 (100.0%) | 0 (0.0%) |
| Total (Category) | 66 (100.0%) | 0 (0.0%) |
| Total (Overall) | 517 (57.6%) | 380 (42.4%) |
Production, Transportation and Moving Occupations
The most common Production, Transportation and Moving occupations in Clarks Green borough are Material Moving (18 | 2.0%), Production (9 | 1.0%), and Transportation (9 | 1.0%).
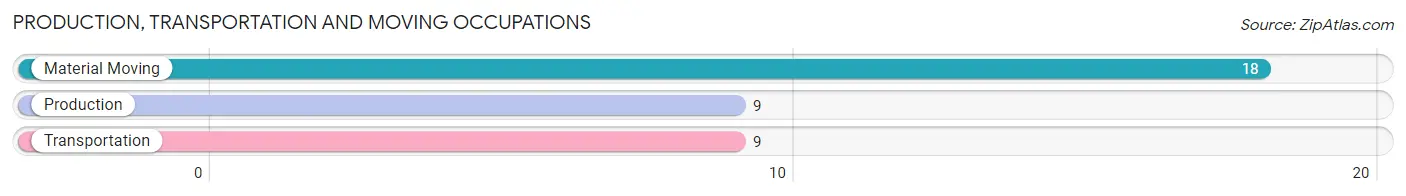
Production, Transportation and Moving Occupations by Sex
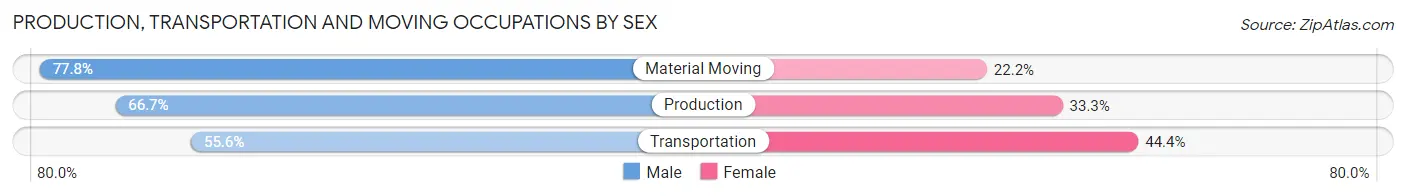
| Occupation | Male | Female |
| Production | 6 (66.7%) | 3 (33.3%) |
| Transportation | 5 (55.6%) | 4 (44.4%) |
| Material Moving | 14 (77.8%) | 4 (22.2%) |
| Total (Category) | 25 (69.4%) | 11 (30.6%) |
| Total (Overall) | 517 (57.6%) | 380 (42.4%) |
Employment Industries by Sex in Clarks Green borough
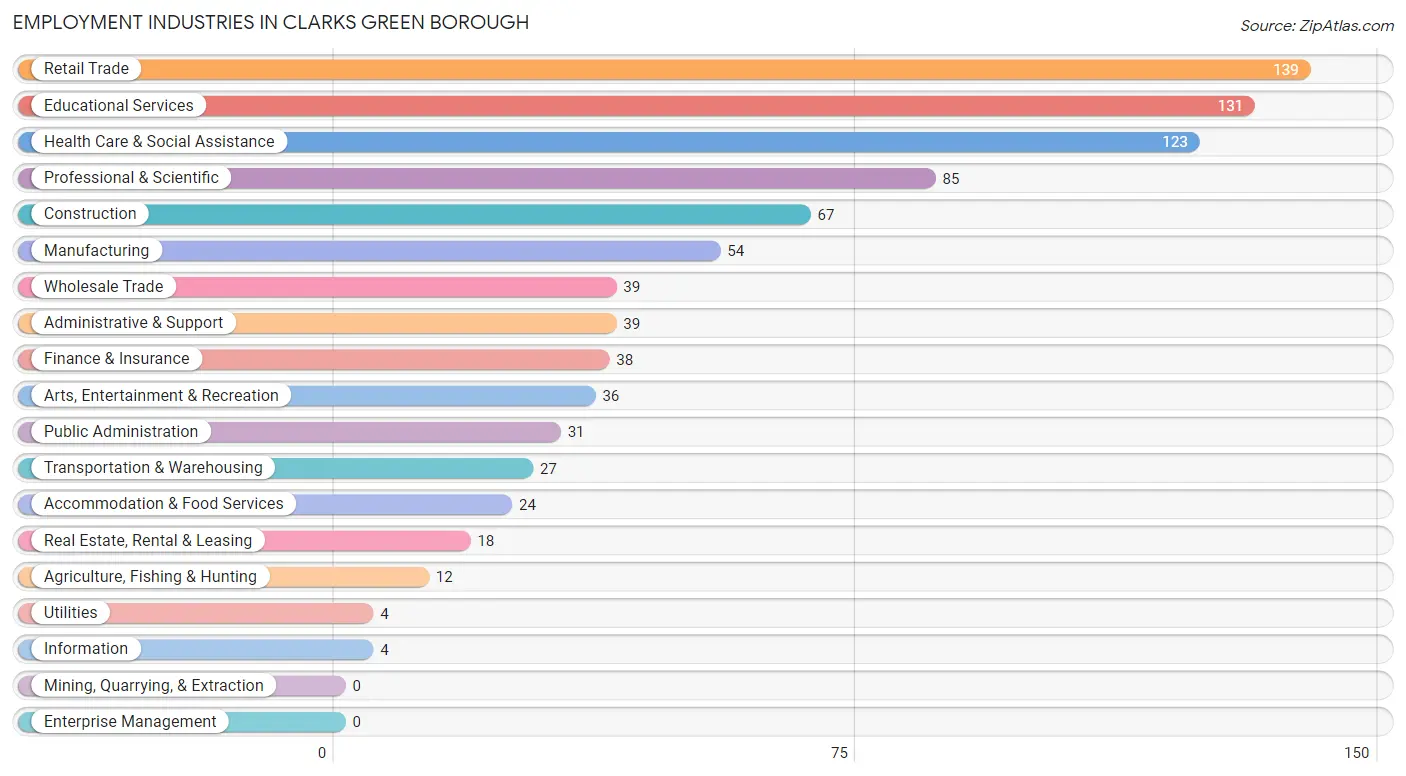
Employment Industries in Clarks Green borough
The major employment industries in Clarks Green borough include Retail Trade (139 | 15.5%), Educational Services (131 | 14.6%), Health Care & Social Assistance (123 | 13.7%), Professional & Scientific (85 | 9.5%), and Construction (67 | 7.5%).
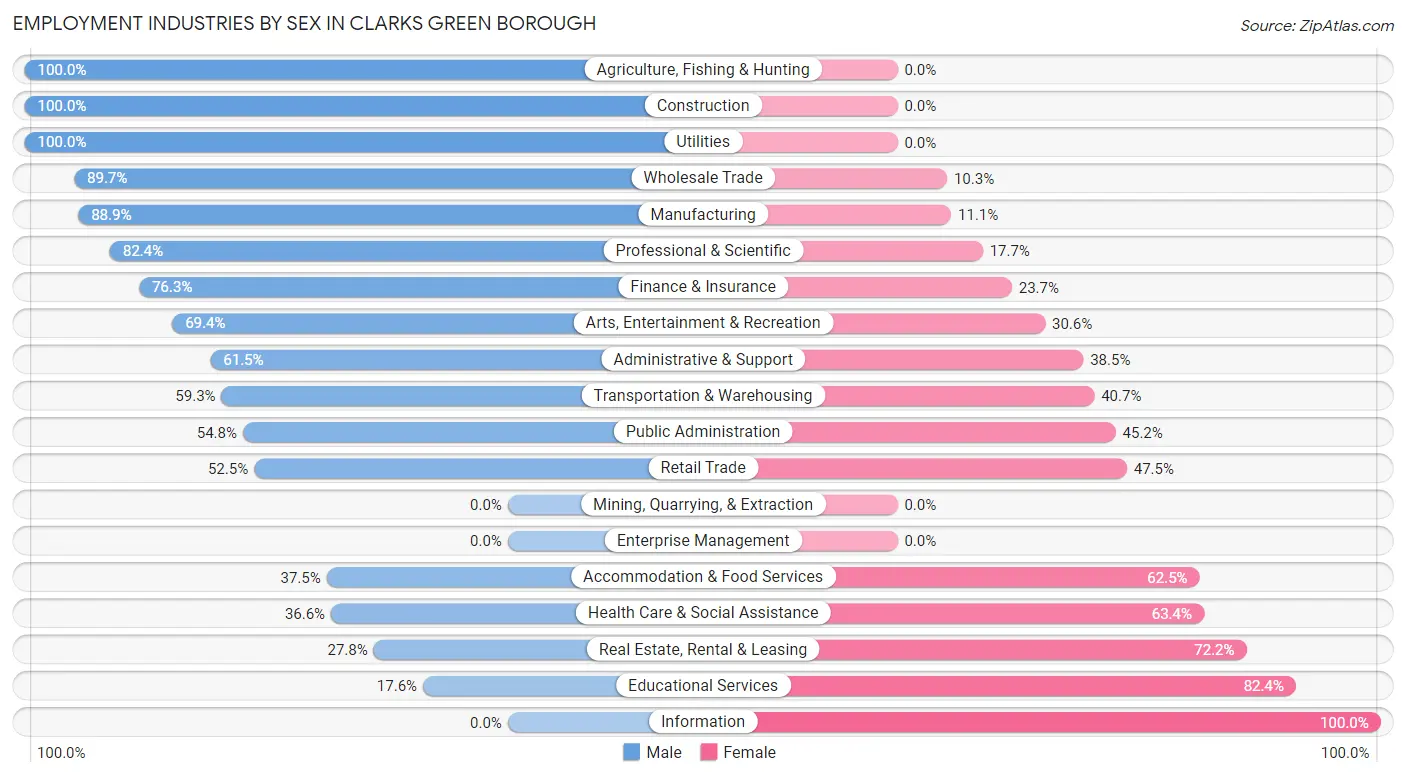
Employment Industries by Sex in Clarks Green borough
The Clarks Green borough industries that see more men than women are Agriculture, Fishing & Hunting (100.0%), Construction (100.0%), and Utilities (100.0%), whereas the industries that tend to have a higher number of women are Information (100.0%), Educational Services (82.4%), and Real Estate, Rental & Leasing (72.2%).
| Industry | Male | Female |
| Agriculture, Fishing & Hunting | 12 (100.0%) | 0 (0.0%) |
| Mining, Quarrying, & Extraction | 0 (0.0%) | 0 (0.0%) |
| Construction | 67 (100.0%) | 0 (0.0%) |
| Manufacturing | 48 (88.9%) | 6 (11.1%) |
| Wholesale Trade | 35 (89.7%) | 4 (10.3%) |
| Retail Trade | 73 (52.5%) | 66 (47.5%) |
| Transportation & Warehousing | 16 (59.3%) | 11 (40.7%) |
| Utilities | 4 (100.0%) | 0 (0.0%) |
| Information | 0 (0.0%) | 4 (100.0%) |
| Finance & Insurance | 29 (76.3%) | 9 (23.7%) |
| Real Estate, Rental & Leasing | 5 (27.8%) | 13 (72.2%) |
| Professional & Scientific | 70 (82.4%) | 15 (17.6%) |
| Enterprise Management | 0 (0.0%) | 0 (0.0%) |
| Administrative & Support | 24 (61.5%) | 15 (38.5%) |
| Educational Services | 23 (17.6%) | 108 (82.4%) |
| Health Care & Social Assistance | 45 (36.6%) | 78 (63.4%) |
| Arts, Entertainment & Recreation | 25 (69.4%) | 11 (30.6%) |
| Accommodation & Food Services | 9 (37.5%) | 15 (62.5%) |
| Public Administration | 17 (54.8%) | 14 (45.2%) |
| Total | 517 (57.6%) | 380 (42.4%) |
Education in Clarks Green borough
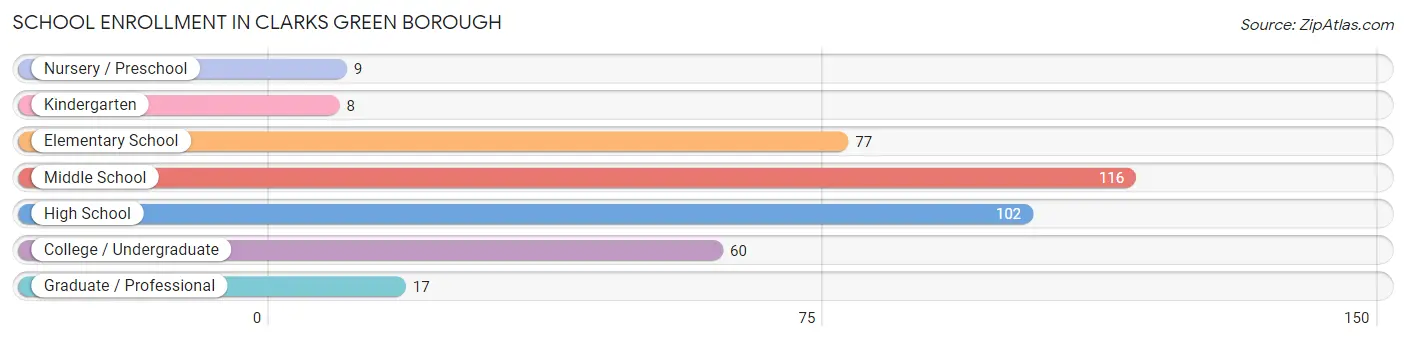
School Enrollment in Clarks Green borough
The most common levels of schooling among the 389 students in Clarks Green borough are middle school (116 | 29.8%), high school (102 | 26.2%), and elementary school (77 | 19.8%).
| School Level | # Students | % Students |
| Nursery / Preschool | 9 | 2.3% |
| Kindergarten | 8 | 2.1% |
| Elementary School | 77 | 19.8% |
| Middle School | 116 | 29.8% |
| High School | 102 | 26.2% |
| College / Undergraduate | 60 | 15.4% |
| Graduate / Professional | 17 | 4.4% |
| Total | 389 | 100.0% |
School Enrollment by Age by Funding Source in Clarks Green borough
Out of a total of 389 students who are enrolled in schools in Clarks Green borough, 104 (26.7%) attend a private institution, while the remaining 285 (73.3%) are enrolled in public schools. The age group of 3 to 4 year olds has the highest likelihood of being enrolled in private schools, with 5 (100.0% in the age bracket) enrolled. Conversely, the age group of 15 to 17 year olds has the lowest likelihood of being enrolled in a private school, with 61 (92.4% in the age bracket) attending a public institution.
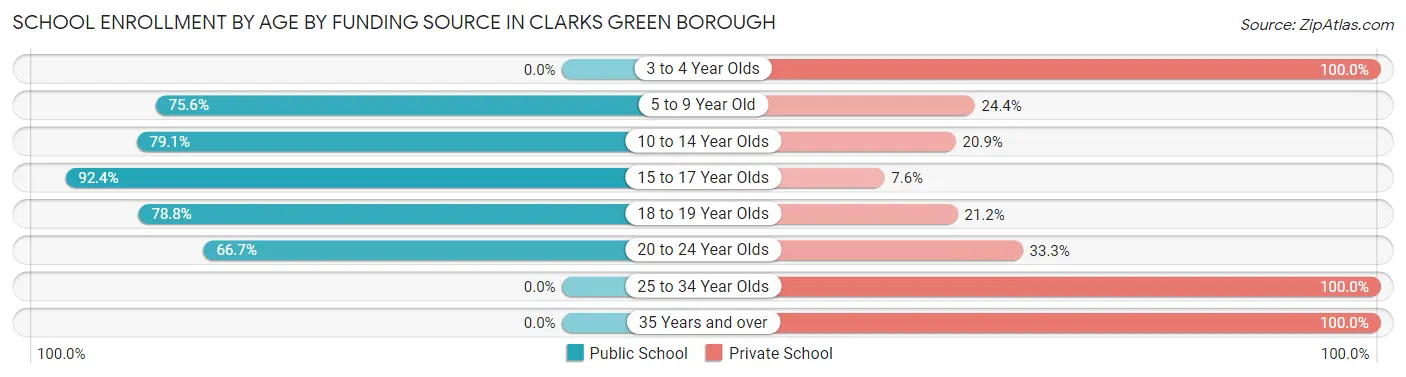
| Age Bracket | Public School | Private School |
| 3 to 4 Year Olds | 0 (0.0%) | 5 (100.0%) |
| 5 to 9 Year Old | 62 (75.6%) | 20 (24.4%) |
| 10 to 14 Year Olds | 110 (79.1%) | 29 (20.9%) |
| 15 to 17 Year Olds | 61 (92.4%) | 5 (7.6%) |
| 18 to 19 Year Olds | 26 (78.8%) | 7 (21.2%) |
| 20 to 24 Year Olds | 26 (66.7%) | 13 (33.3%) |
| 25 to 34 Year Olds | 0 (0.0%) | 21 (100.0%) |
| 35 Years and over | 0 (0.0%) | 4 (100.0%) |
| Total | 285 (73.3%) | 104 (26.7%) |
Educational Attainment by Field of Study in Clarks Green borough
Business (105 | 15.0%), education (84 | 12.0%), social sciences (73 | 10.4%), science & technology (66 | 9.4%), and communications (60 | 8.6%) are the most common fields of study among 702 individuals in Clarks Green borough who have obtained a bachelor's degree or higher.
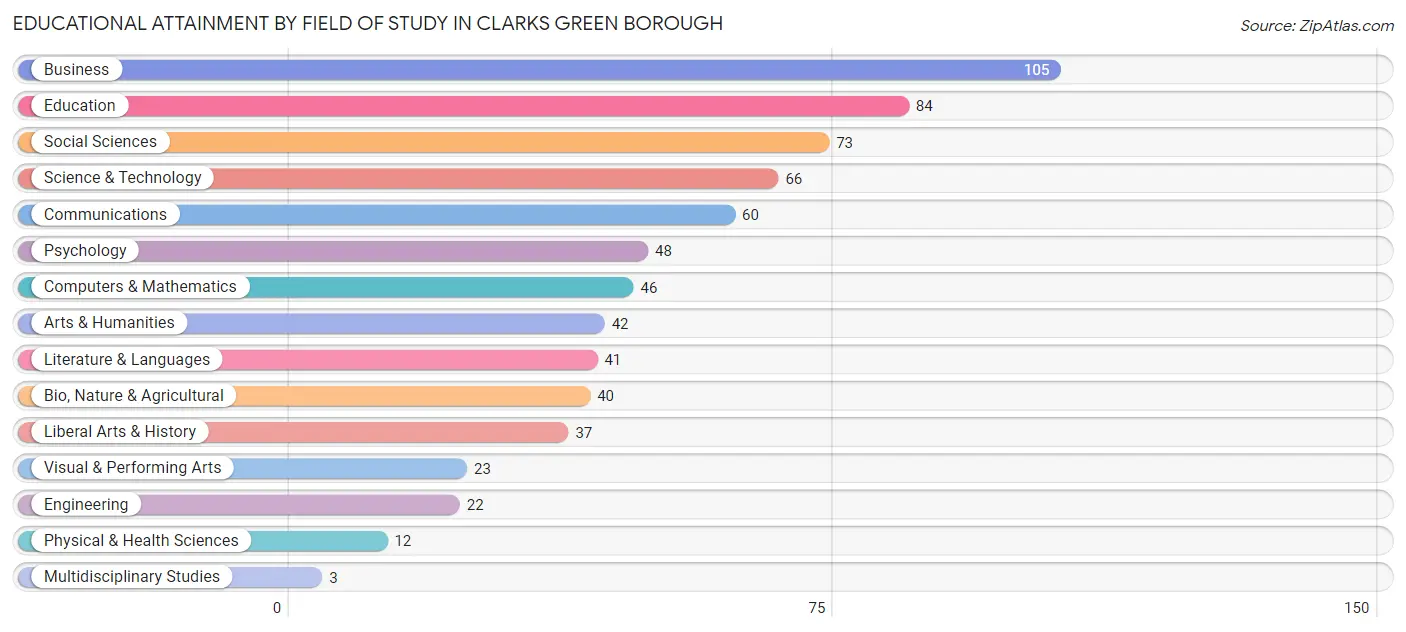
| Field of Study | # Graduates | % Graduates |
| Computers & Mathematics | 46 | 6.6% |
| Bio, Nature & Agricultural | 40 | 5.7% |
| Physical & Health Sciences | 12 | 1.7% |
| Psychology | 48 | 6.8% |
| Social Sciences | 73 | 10.4% |
| Engineering | 22 | 3.1% |
| Multidisciplinary Studies | 3 | 0.4% |
| Science & Technology | 66 | 9.4% |
| Business | 105 | 15.0% |
| Education | 84 | 12.0% |
| Literature & Languages | 41 | 5.8% |
| Liberal Arts & History | 37 | 5.3% |
| Visual & Performing Arts | 23 | 3.3% |
| Communications | 60 | 8.6% |
| Arts & Humanities | 42 | 6.0% |
| Total | 702 | 100.0% |
Transportation & Commute in Clarks Green borough
Vehicle Availability by Sex in Clarks Green borough
The most prevalent vehicle ownership categories in Clarks Green borough are males with 2 vehicles (217, accounting for 42.3%) and females with 2 vehicles (140, making up 57.7%).
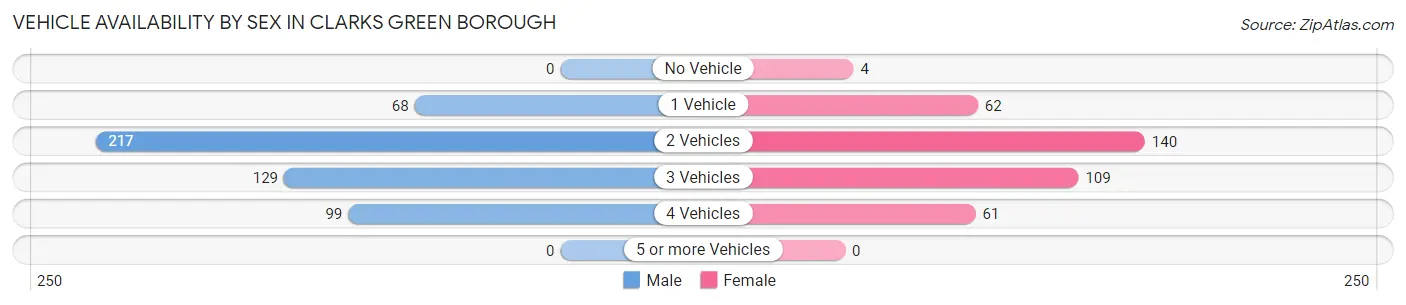
| Vehicles Available | Male | Female |
| No Vehicle | 0 (0.0%) | 4 (1.1%) |
| 1 Vehicle | 68 (13.3%) | 62 (16.5%) |
| 2 Vehicles | 217 (42.3%) | 140 (37.2%) |
| 3 Vehicles | 129 (25.2%) | 109 (29.0%) |
| 4 Vehicles | 99 (19.3%) | 61 (16.2%) |
| 5 or more Vehicles | 0 (0.0%) | 0 (0.0%) |
| Total | 513 (100.0%) | 376 (100.0%) |
Commute Time in Clarks Green borough
The most frequently occuring commute durations in Clarks Green borough are 10 to 14 minutes (157 commuters, 19.9%), 20 to 24 minutes (156 commuters, 19.8%), and 15 to 19 minutes (148 commuters, 18.8%).
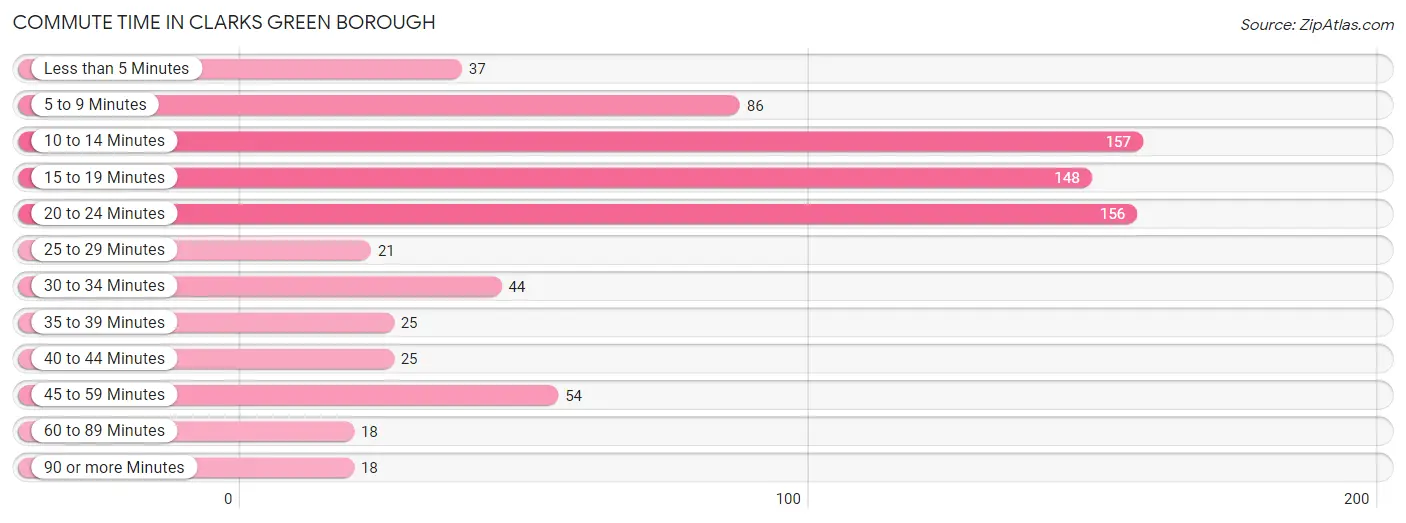
| Commute Time | # Commuters | % Commuters |
| Less than 5 Minutes | 37 | 4.7% |
| 5 to 9 Minutes | 86 | 10.9% |
| 10 to 14 Minutes | 157 | 19.9% |
| 15 to 19 Minutes | 148 | 18.8% |
| 20 to 24 Minutes | 156 | 19.8% |
| 25 to 29 Minutes | 21 | 2.7% |
| 30 to 34 Minutes | 44 | 5.6% |
| 35 to 39 Minutes | 25 | 3.2% |
| 40 to 44 Minutes | 25 | 3.2% |
| 45 to 59 Minutes | 54 | 6.8% |
| 60 to 89 Minutes | 18 | 2.3% |
| 90 or more Minutes | 18 | 2.3% |
Commute Time by Sex in Clarks Green borough
The most common commute times in Clarks Green borough are 20 to 24 minutes (93 commuters, 20.3%) for males and 10 to 14 minutes (73 commuters, 22.0%) for females.
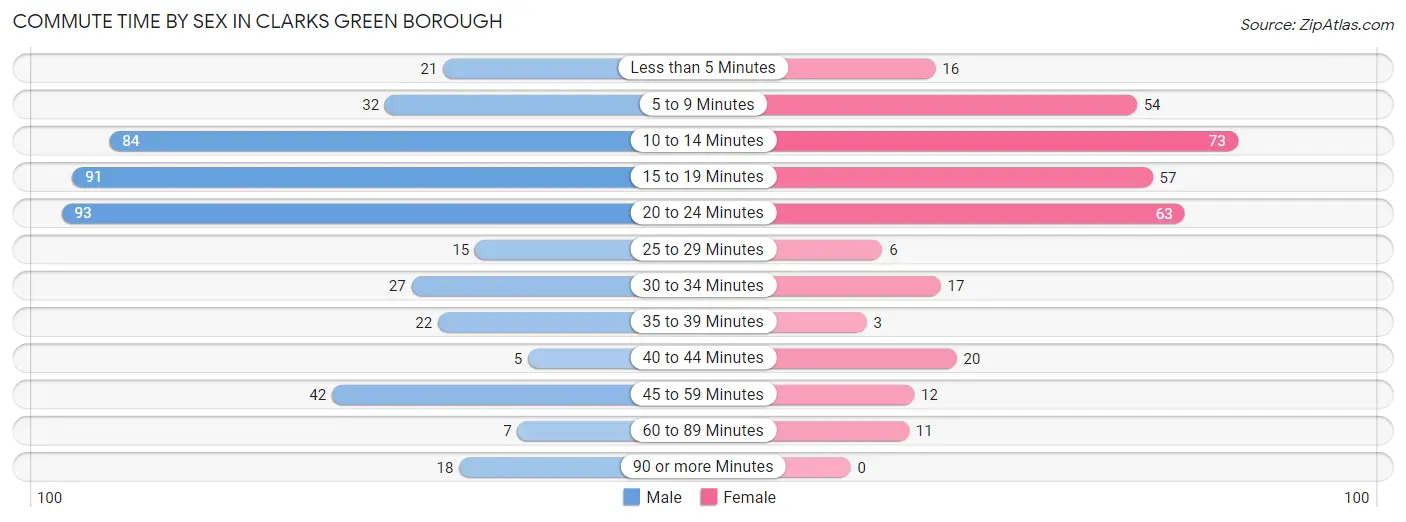
| Commute Time | Male | Female |
| Less than 5 Minutes | 21 (4.6%) | 16 (4.8%) |
| 5 to 9 Minutes | 32 (7.0%) | 54 (16.3%) |
| 10 to 14 Minutes | 84 (18.4%) | 73 (22.0%) |
| 15 to 19 Minutes | 91 (19.9%) | 57 (17.2%) |
| 20 to 24 Minutes | 93 (20.3%) | 63 (19.0%) |
| 25 to 29 Minutes | 15 (3.3%) | 6 (1.8%) |
| 30 to 34 Minutes | 27 (5.9%) | 17 (5.1%) |
| 35 to 39 Minutes | 22 (4.8%) | 3 (0.9%) |
| 40 to 44 Minutes | 5 (1.1%) | 20 (6.0%) |
| 45 to 59 Minutes | 42 (9.2%) | 12 (3.6%) |
| 60 to 89 Minutes | 7 (1.5%) | 11 (3.3%) |
| 90 or more Minutes | 18 (3.9%) | 0 (0.0%) |
Time of Departure to Work by Sex in Clarks Green borough
The most frequent times of departure to work in Clarks Green borough are 8:00 AM to 8:29 AM (91, 19.9%) for males and 7:30 AM to 7:59 AM (85, 25.6%) for females.
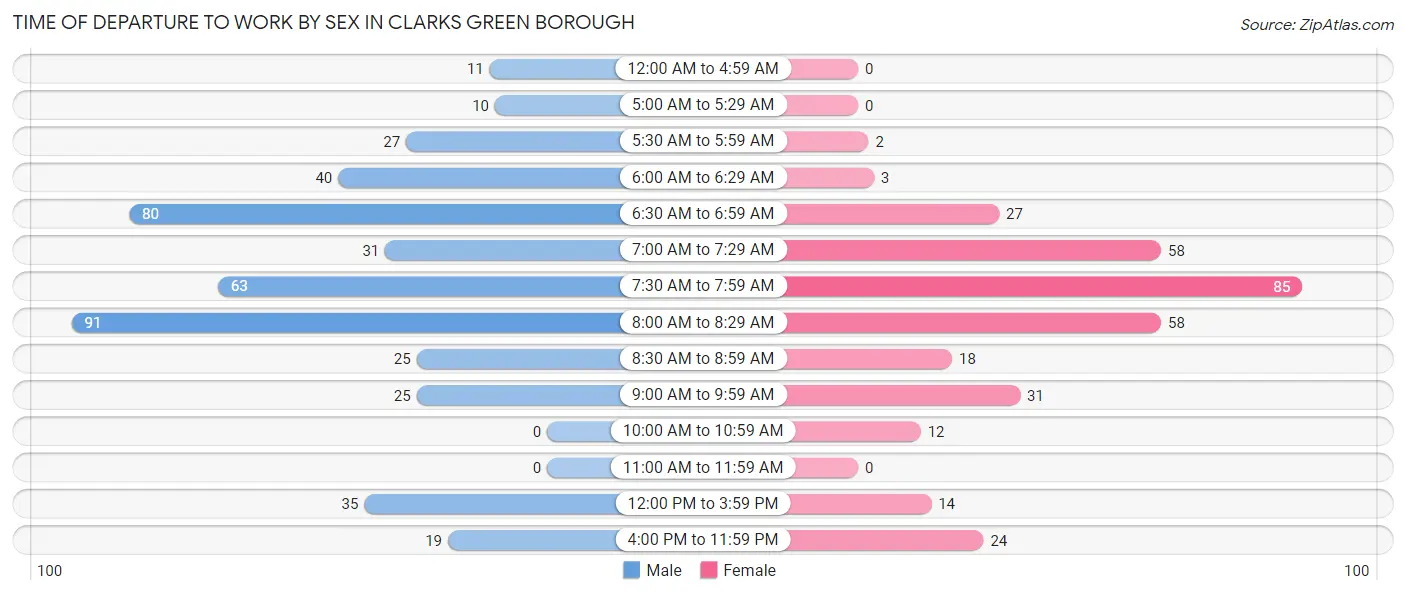
| Time of Departure | Male | Female |
| 12:00 AM to 4:59 AM | 11 (2.4%) | 0 (0.0%) |
| 5:00 AM to 5:29 AM | 10 (2.2%) | 0 (0.0%) |
| 5:30 AM to 5:59 AM | 27 (5.9%) | 2 (0.6%) |
| 6:00 AM to 6:29 AM | 40 (8.7%) | 3 (0.9%) |
| 6:30 AM to 6:59 AM | 80 (17.5%) | 27 (8.1%) |
| 7:00 AM to 7:29 AM | 31 (6.8%) | 58 (17.5%) |
| 7:30 AM to 7:59 AM | 63 (13.8%) | 85 (25.6%) |
| 8:00 AM to 8:29 AM | 91 (19.9%) | 58 (17.5%) |
| 8:30 AM to 8:59 AM | 25 (5.5%) | 18 (5.4%) |
| 9:00 AM to 9:59 AM | 25 (5.5%) | 31 (9.3%) |
| 10:00 AM to 10:59 AM | 0 (0.0%) | 12 (3.6%) |
| 11:00 AM to 11:59 AM | 0 (0.0%) | 0 (0.0%) |
| 12:00 PM to 3:59 PM | 35 (7.7%) | 14 (4.2%) |
| 4:00 PM to 11:59 PM | 19 (4.2%) | 24 (7.2%) |
| Total | 457 (100.0%) | 332 (100.0%) |
Housing Occupancy in Clarks Green borough
Occupancy by Ownership in Clarks Green borough
Of the total 629 dwellings in Clarks Green borough, owner-occupied units account for 580 (92.2%), while renter-occupied units make up 49 (7.8%).
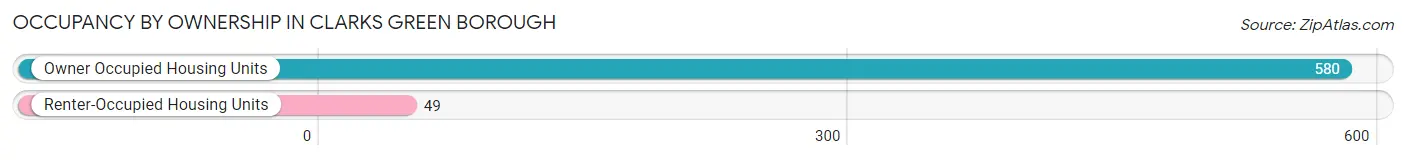
| Occupancy | # Housing Units | % Housing Units |
| Owner Occupied Housing Units | 580 | 92.2% |
| Renter-Occupied Housing Units | 49 | 7.8% |
| Total Occupied Housing Units | 629 | 100.0% |
Occupancy by Household Size in Clarks Green borough
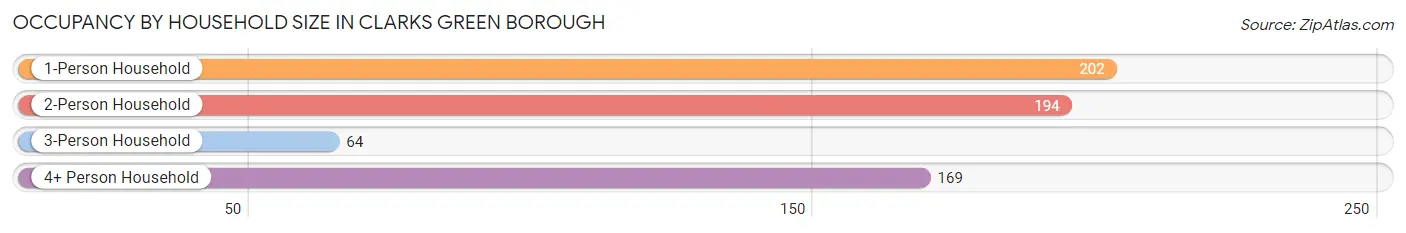
| Household Size | # Housing Units | % Housing Units |
| 1-Person Household | 202 | 32.1% |
| 2-Person Household | 194 | 30.8% |
| 3-Person Household | 64 | 10.2% |
| 4+ Person Household | 169 | 26.9% |
| Total Housing Units | 629 | 100.0% |
Occupancy by Ownership by Household Size in Clarks Green borough
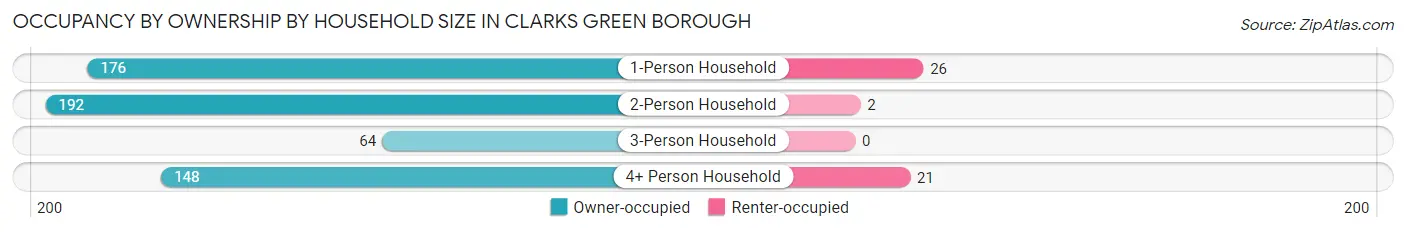
| Household Size | Owner-occupied | Renter-occupied |
| 1-Person Household | 176 (87.1%) | 26 (12.9%) |
| 2-Person Household | 192 (99.0%) | 2 (1.0%) |
| 3-Person Household | 64 (100.0%) | 0 (0.0%) |
| 4+ Person Household | 148 (87.6%) | 21 (12.4%) |
| Total Housing Units | 580 (92.2%) | 49 (7.8%) |
Occupancy by Educational Attainment in Clarks Green borough
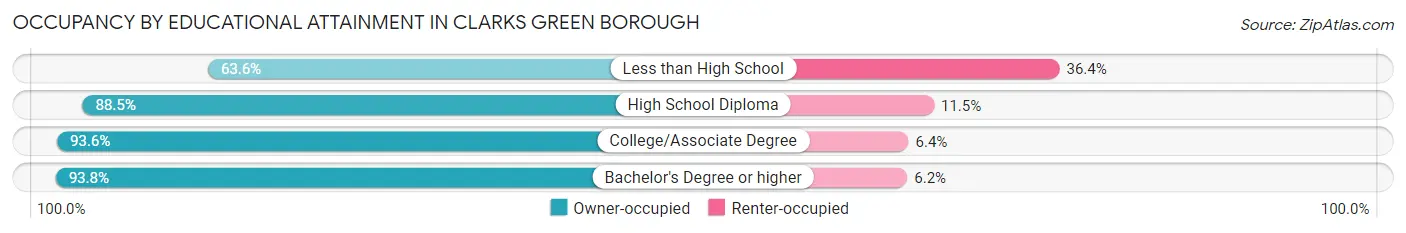
| Household Size | Owner-occupied | Renter-occupied |
| Less than High School | 7 (63.6%) | 4 (36.4%) |
| High School Diploma | 108 (88.5%) | 14 (11.5%) |
| College/Associate Degree | 131 (93.6%) | 9 (6.4%) |
| Bachelor's Degree or higher | 334 (93.8%) | 22 (6.2%) |
Occupancy by Age of Householder in Clarks Green borough
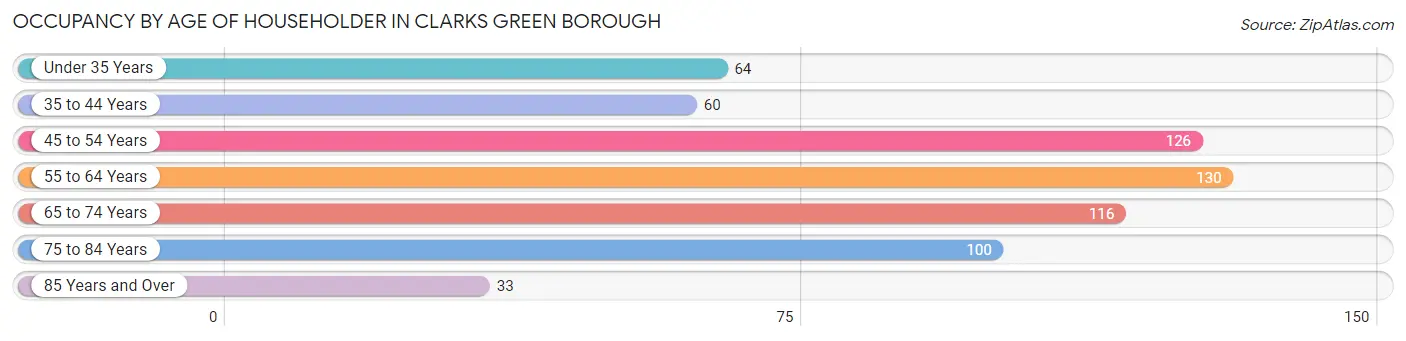
| Age Bracket | # Households | % Households |
| Under 35 Years | 64 | 10.2% |
| 35 to 44 Years | 60 | 9.5% |
| 45 to 54 Years | 126 | 20.0% |
| 55 to 64 Years | 130 | 20.7% |
| 65 to 74 Years | 116 | 18.4% |
| 75 to 84 Years | 100 | 15.9% |
| 85 Years and Over | 33 | 5.2% |
| Total | 629 | 100.0% |
Housing Finances in Clarks Green borough
Median Income by Occupancy in Clarks Green borough
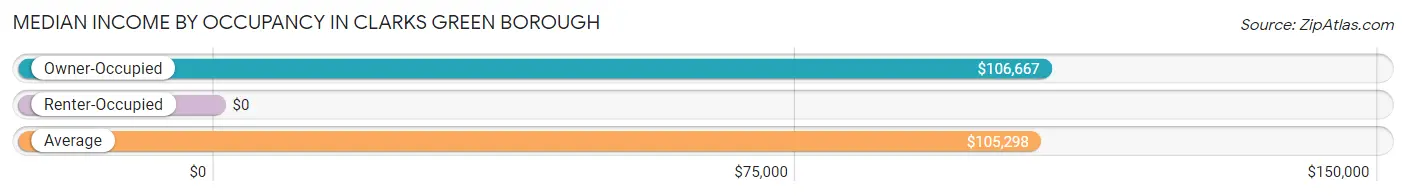
| Occupancy Type | # Households | Median Income |
| Owner-Occupied | 580 (92.2%) | $106,667 |
| Renter-Occupied | 49 (7.8%) | $0 |
| Average | 629 (100.0%) | $105,298 |
Occupancy by Householder Income Bracket in Clarks Green borough
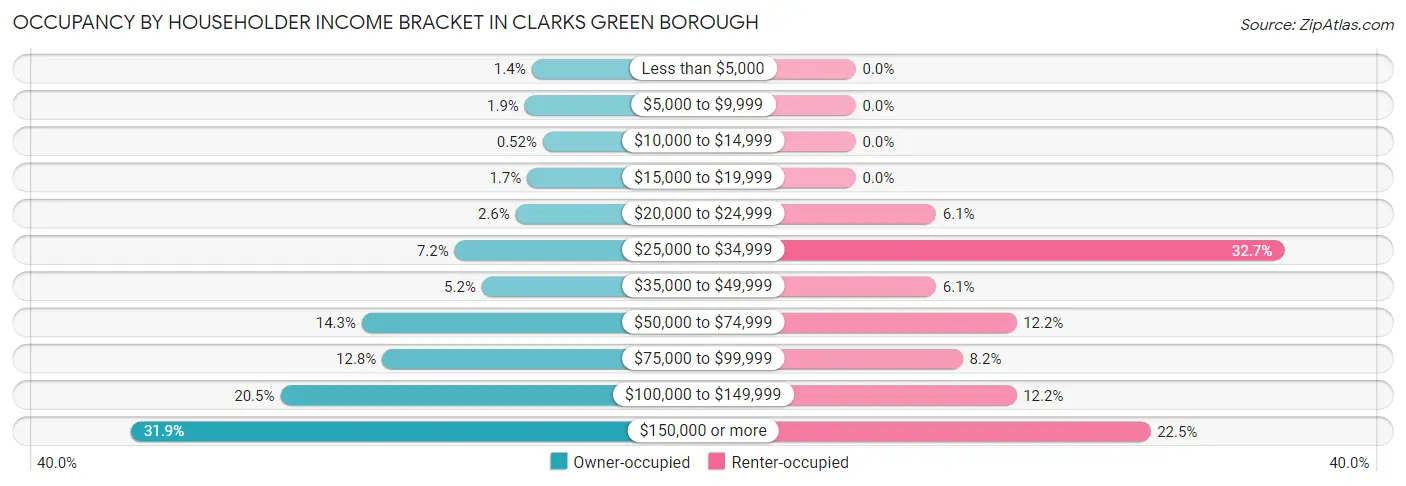
| Income Bracket | Owner-occupied | Renter-occupied |
| Less than $5,000 | 8 (1.4%) | 0 (0.0%) |
| $5,000 to $9,999 | 11 (1.9%) | 0 (0.0%) |
| $10,000 to $14,999 | 3 (0.5%) | 0 (0.0%) |
| $15,000 to $19,999 | 10 (1.7%) | 0 (0.0%) |
| $20,000 to $24,999 | 15 (2.6%) | 3 (6.1%) |
| $25,000 to $34,999 | 42 (7.2%) | 16 (32.7%) |
| $35,000 to $49,999 | 30 (5.2%) | 3 (6.1%) |
| $50,000 to $74,999 | 83 (14.3%) | 6 (12.2%) |
| $75,000 to $99,999 | 74 (12.8%) | 4 (8.2%) |
| $100,000 to $149,999 | 119 (20.5%) | 6 (12.2%) |
| $150,000 or more | 185 (31.9%) | 11 (22.5%) |
| Total | 580 (100.0%) | 49 (100.0%) |
Monthly Housing Cost Tiers in Clarks Green borough
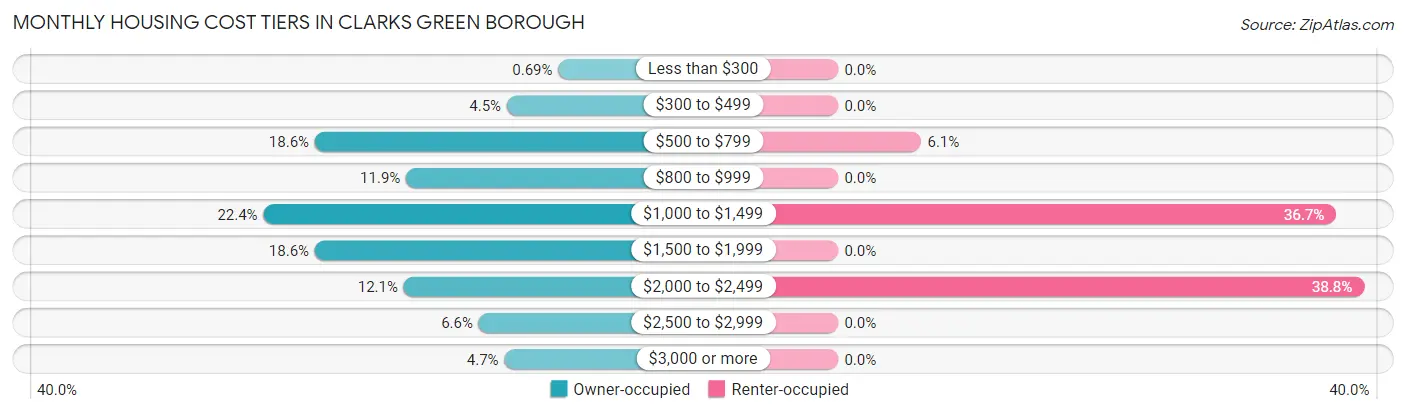
| Monthly Cost | Owner-occupied | Renter-occupied |
| Less than $300 | 4 (0.7%) | 0 (0.0%) |
| $300 to $499 | 26 (4.5%) | 0 (0.0%) |
| $500 to $799 | 108 (18.6%) | 3 (6.1%) |
| $800 to $999 | 69 (11.9%) | 0 (0.0%) |
| $1,000 to $1,499 | 130 (22.4%) | 18 (36.7%) |
| $1,500 to $1,999 | 108 (18.6%) | 0 (0.0%) |
| $2,000 to $2,499 | 70 (12.1%) | 19 (38.8%) |
| $2,500 to $2,999 | 38 (6.6%) | 0 (0.0%) |
| $3,000 or more | 27 (4.7%) | 0 (0.0%) |
| Total | 580 (100.0%) | 49 (100.0%) |
Physical Housing Characteristics in Clarks Green borough
Housing Structures in Clarks Green borough
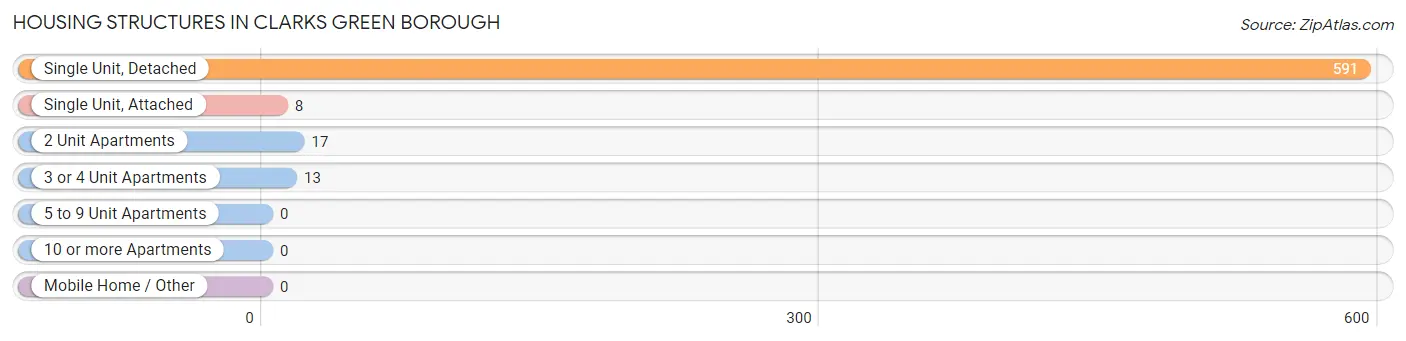
| Structure Type | # Housing Units | % Housing Units |
| Single Unit, Detached | 591 | 94.0% |
| Single Unit, Attached | 8 | 1.3% |
| 2 Unit Apartments | 17 | 2.7% |
| 3 or 4 Unit Apartments | 13 | 2.1% |
| 5 to 9 Unit Apartments | 0 | 0.0% |
| 10 or more Apartments | 0 | 0.0% |
| Mobile Home / Other | 0 | 0.0% |
| Total | 629 | 100.0% |
Housing Structures by Occupancy in Clarks Green borough
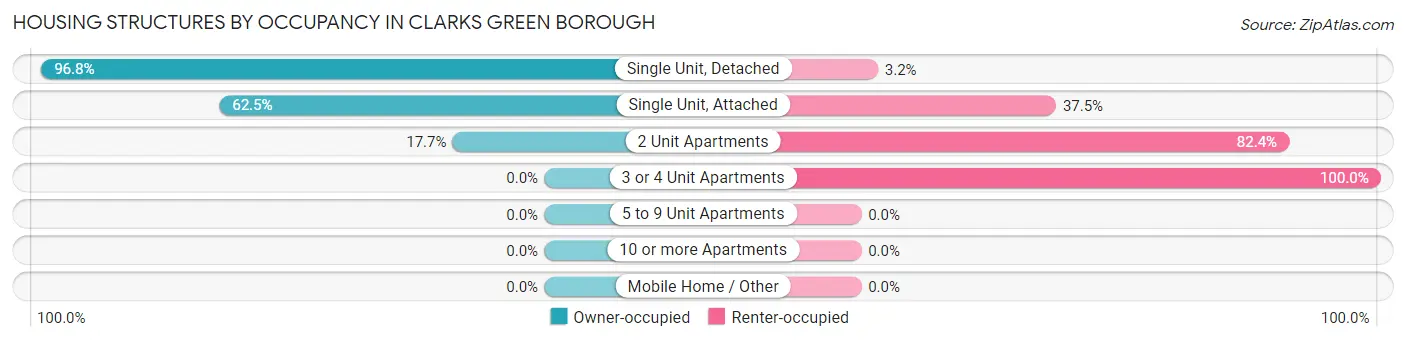
| Structure Type | Owner-occupied | Renter-occupied |
| Single Unit, Detached | 572 (96.8%) | 19 (3.2%) |
| Single Unit, Attached | 5 (62.5%) | 3 (37.5%) |
| 2 Unit Apartments | 3 (17.6%) | 14 (82.4%) |
| 3 or 4 Unit Apartments | 0 (0.0%) | 13 (100.0%) |
| 5 to 9 Unit Apartments | 0 (0.0%) | 0 (0.0%) |
| 10 or more Apartments | 0 (0.0%) | 0 (0.0%) |
| Mobile Home / Other | 0 (0.0%) | 0 (0.0%) |
| Total | 580 (92.2%) | 49 (7.8%) |
Housing Structures by Number of Rooms in Clarks Green borough
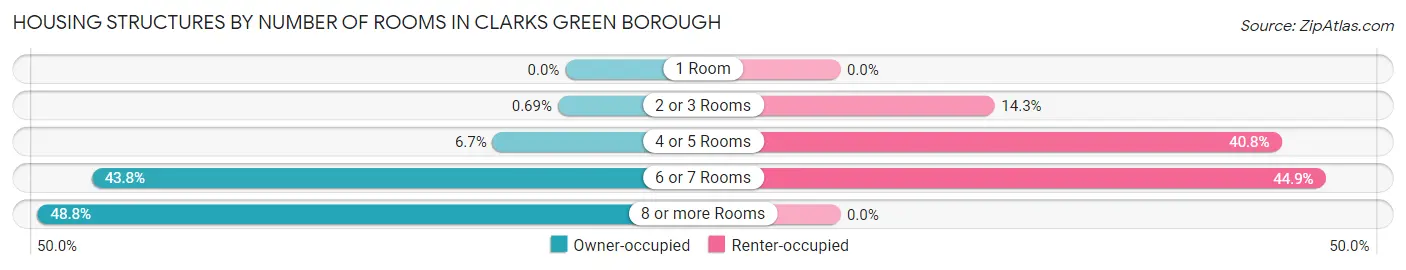
| Number of Rooms | Owner-occupied | Renter-occupied |
| 1 Room | 0 (0.0%) | 0 (0.0%) |
| 2 or 3 Rooms | 4 (0.7%) | 7 (14.3%) |
| 4 or 5 Rooms | 39 (6.7%) | 20 (40.8%) |
| 6 or 7 Rooms | 254 (43.8%) | 22 (44.9%) |
| 8 or more Rooms | 283 (48.8%) | 0 (0.0%) |
| Total | 580 (100.0%) | 49 (100.0%) |
Housing Structure by Heating Type in Clarks Green borough
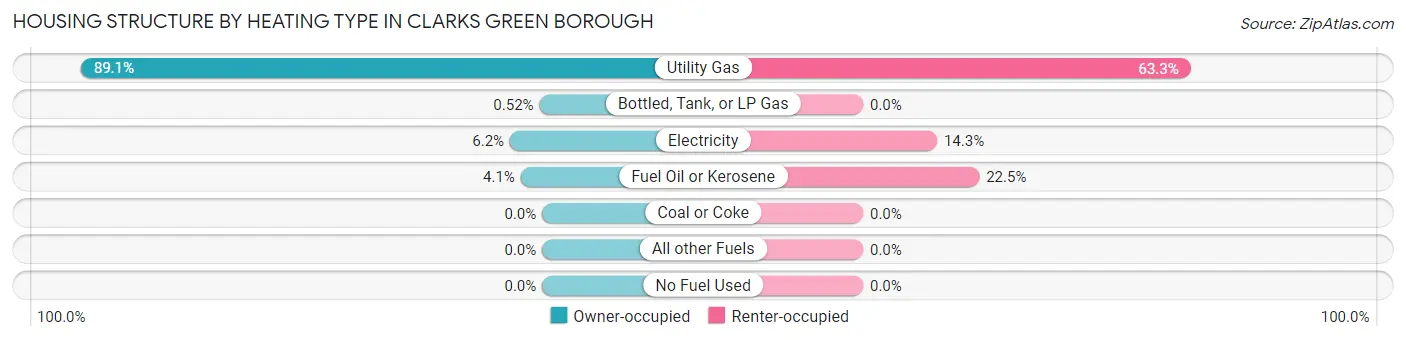
| Heating Type | Owner-occupied | Renter-occupied |
| Utility Gas | 517 (89.1%) | 31 (63.3%) |
| Bottled, Tank, or LP Gas | 3 (0.5%) | 0 (0.0%) |
| Electricity | 36 (6.2%) | 7 (14.3%) |
| Fuel Oil or Kerosene | 24 (4.1%) | 11 (22.5%) |
| Coal or Coke | 0 (0.0%) | 0 (0.0%) |
| All other Fuels | 0 (0.0%) | 0 (0.0%) |
| No Fuel Used | 0 (0.0%) | 0 (0.0%) |
| Total | 580 (100.0%) | 49 (100.0%) |
Household Vehicle Usage in Clarks Green borough
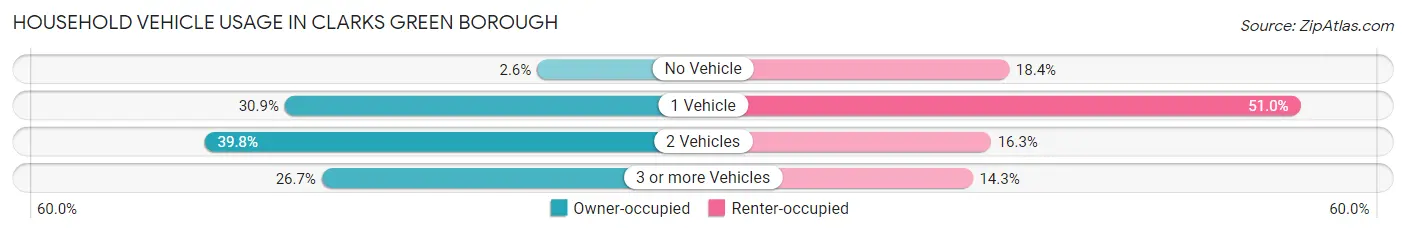
| Vehicles per Household | Owner-occupied | Renter-occupied |
| No Vehicle | 15 (2.6%) | 9 (18.4%) |
| 1 Vehicle | 179 (30.9%) | 25 (51.0%) |
| 2 Vehicles | 231 (39.8%) | 8 (16.3%) |
| 3 or more Vehicles | 155 (26.7%) | 7 (14.3%) |
| Total | 580 (100.0%) | 49 (100.0%) |
Real Estate & Mortgages in Clarks Green borough
Real Estate and Mortgage Overview in Clarks Green borough
| Characteristic | Without Mortgage | With Mortgage |
| Housing Units | 236 | 344 |
| Median Property Value | $235,100 | $269,200 |
| Median Household Income | $76,875 | $113 |
| Monthly Housing Costs | $786 | $27 |
| Real Estate Taxes | $3,940 | $0 |
Property Value by Mortgage Status in Clarks Green borough
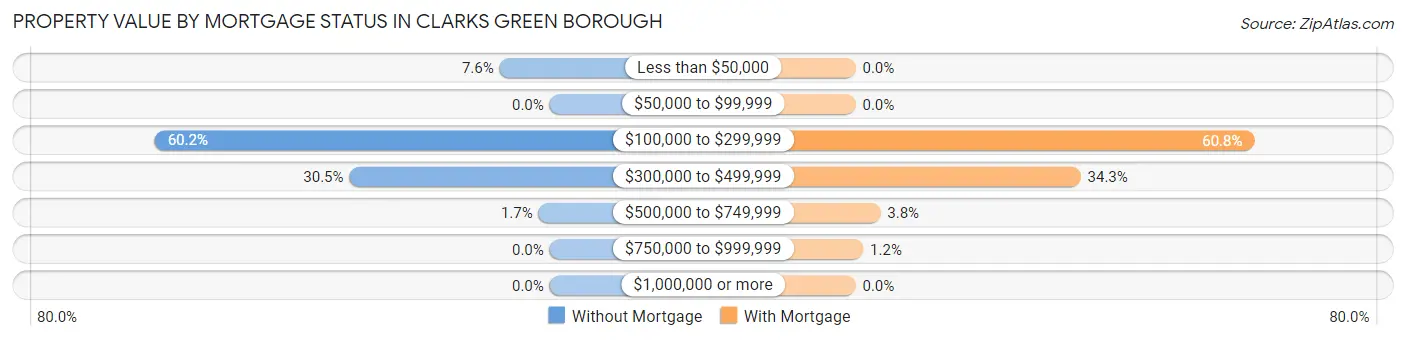
| Property Value | Without Mortgage | With Mortgage |
| Less than $50,000 | 18 (7.6%) | 0 (0.0%) |
| $50,000 to $99,999 | 0 (0.0%) | 0 (0.0%) |
| $100,000 to $299,999 | 142 (60.2%) | 209 (60.8%) |
| $300,000 to $499,999 | 72 (30.5%) | 118 (34.3%) |
| $500,000 to $749,999 | 4 (1.7%) | 13 (3.8%) |
| $750,000 to $999,999 | 0 (0.0%) | 4 (1.2%) |
| $1,000,000 or more | 0 (0.0%) | 0 (0.0%) |
| Total | 236 (100.0%) | 344 (100.0%) |
Household Income by Mortgage Status in Clarks Green borough
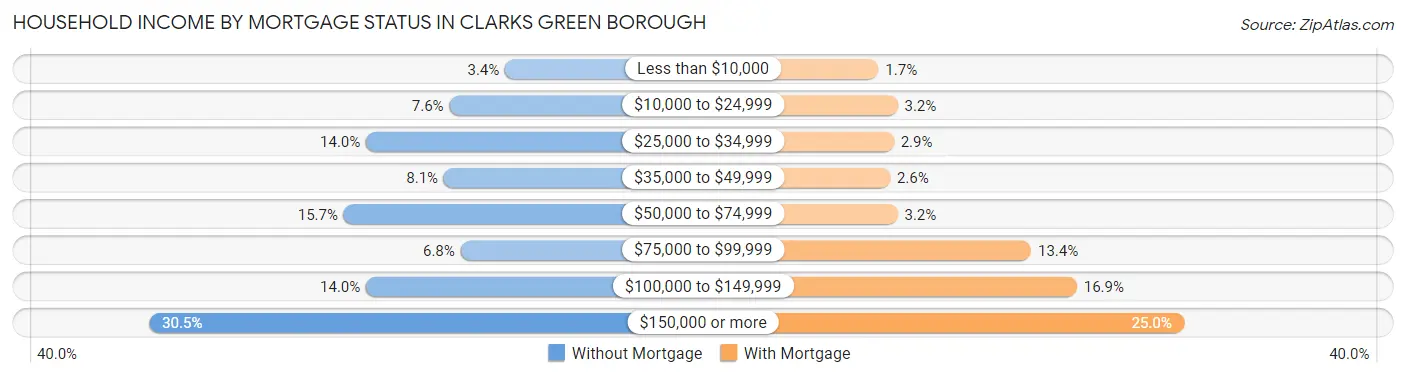
| Household Income | Without Mortgage | With Mortgage |
| Less than $10,000 | 8 (3.4%) | 6 (1.7%) |
| $10,000 to $24,999 | 18 (7.6%) | 11 (3.2%) |
| $25,000 to $34,999 | 33 (14.0%) | 10 (2.9%) |
| $35,000 to $49,999 | 19 (8.1%) | 9 (2.6%) |
| $50,000 to $74,999 | 37 (15.7%) | 11 (3.2%) |
| $75,000 to $99,999 | 16 (6.8%) | 46 (13.4%) |
| $100,000 to $149,999 | 33 (14.0%) | 58 (16.9%) |
| $150,000 or more | 72 (30.5%) | 86 (25.0%) |
| Total | 236 (100.0%) | 344 (100.0%) |
Property Value to Household Income Ratio in Clarks Green borough
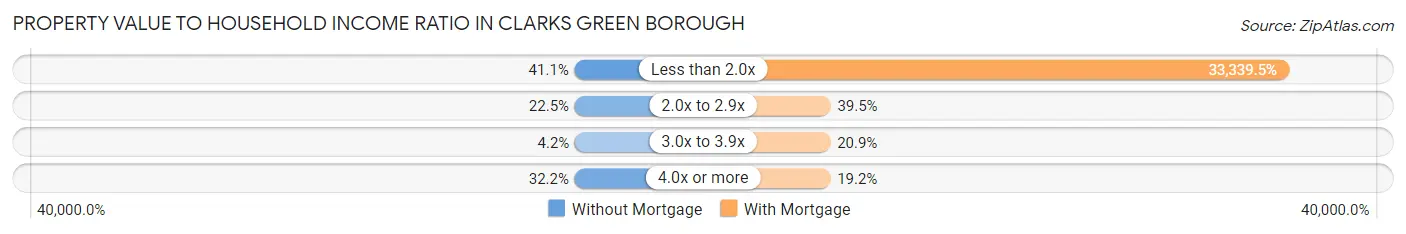
| Value-to-Income Ratio | Without Mortgage | With Mortgage |
| Less than 2.0x | 97 (41.1%) | 114,688 (33,339.5%) |
| 2.0x to 2.9x | 53 (22.5%) | 136 (39.5%) |
| 3.0x to 3.9x | 10 (4.2%) | 72 (20.9%) |
| 4.0x or more | 76 (32.2%) | 66 (19.2%) |
| Total | 236 (100.0%) | 344 (100.0%) |
Real Estate Taxes by Mortgage Status in Clarks Green borough
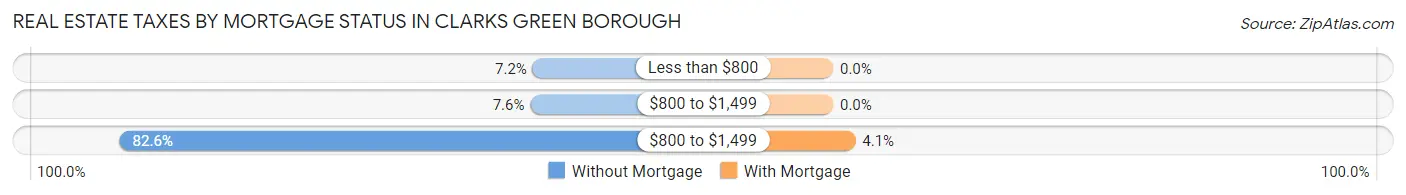
| Property Taxes | Without Mortgage | With Mortgage |
| Less than $800 | 17 (7.2%) | 0 (0.0%) |
| $800 to $1,499 | 18 (7.6%) | 0 (0.0%) |
| $800 to $1,499 | 195 (82.6%) | 14 (4.1%) |
| Total | 236 (100.0%) | 344 (100.0%) |
Health & Disability in Clarks Green borough
Health Insurance Coverage by Age in Clarks Green borough
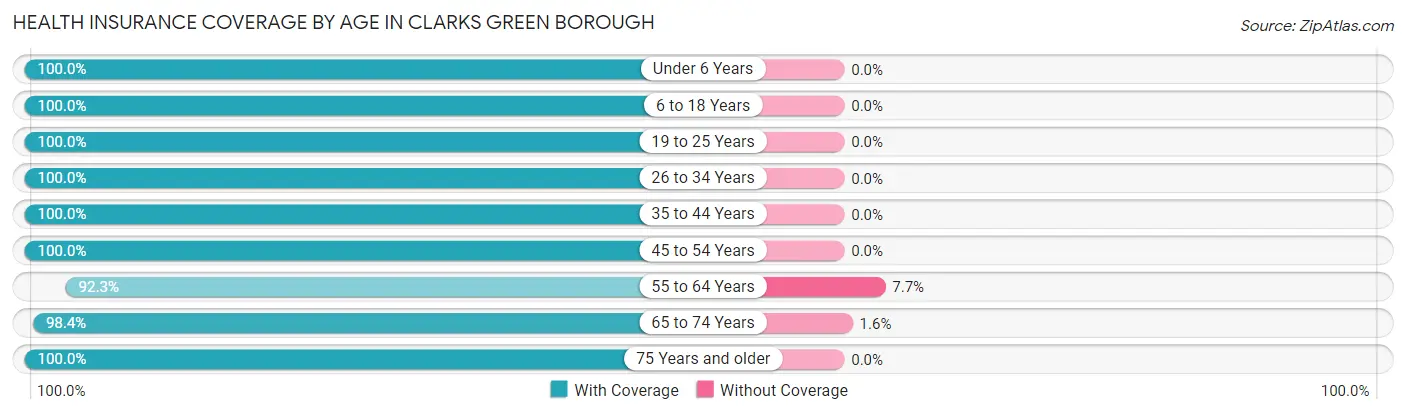
| Age Bracket | With Coverage | Without Coverage |
| Under 6 Years | 73 (100.0%) | 0 (0.0%) |
| 6 to 18 Years | 306 (100.0%) | 0 (0.0%) |
| 19 to 25 Years | 124 (100.0%) | 0 (0.0%) |
| 26 to 34 Years | 122 (100.0%) | 0 (0.0%) |
| 35 to 44 Years | 134 (100.0%) | 0 (0.0%) |
| 45 to 54 Years | 220 (100.0%) | 0 (0.0%) |
| 55 to 64 Years | 229 (92.3%) | 19 (7.7%) |
| 65 to 74 Years | 189 (98.4%) | 3 (1.6%) |
| 75 Years and older | 175 (100.0%) | 0 (0.0%) |
| Total | 1,572 (98.6%) | 22 (1.4%) |
Health Insurance Coverage by Citizenship Status in Clarks Green borough
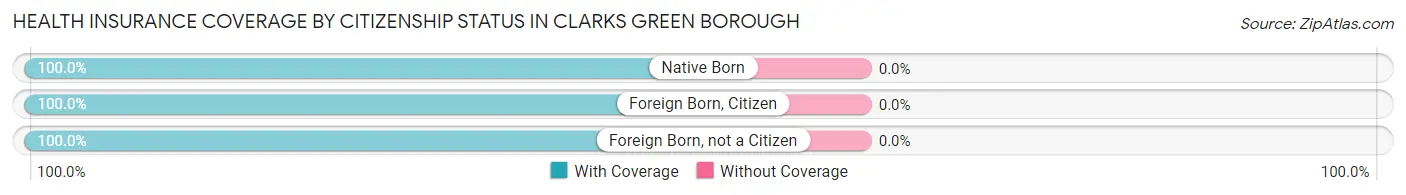
| Citizenship Status | With Coverage | Without Coverage |
| Native Born | 73 (100.0%) | 0 (0.0%) |
| Foreign Born, Citizen | 306 (100.0%) | 0 (0.0%) |
| Foreign Born, not a Citizen | 124 (100.0%) | 0 (0.0%) |
Health Insurance Coverage by Household Income in Clarks Green borough
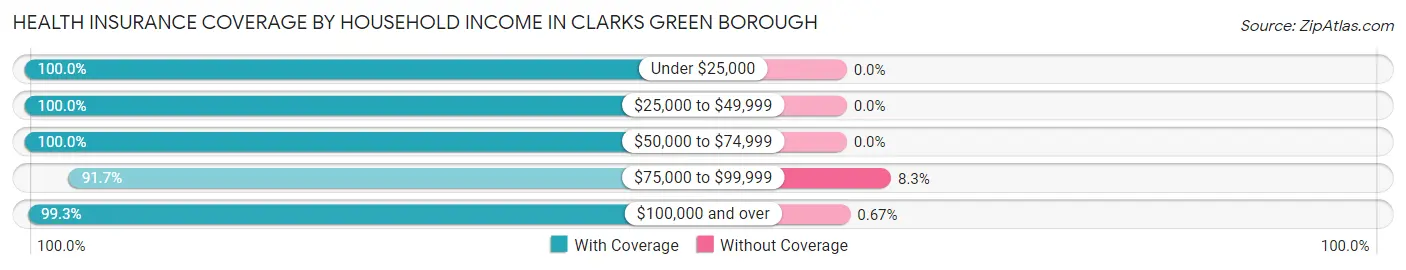
| Household Income | With Coverage | Without Coverage |
| Under $25,000 | 53 (100.0%) | 0 (0.0%) |
| $25,000 to $49,999 | 102 (100.0%) | 0 (0.0%) |
| $50,000 to $74,999 | 218 (100.0%) | 0 (0.0%) |
| $75,000 to $99,999 | 166 (91.7%) | 15 (8.3%) |
| $100,000 and over | 1,033 (99.3%) | 7 (0.7%) |
Public vs Private Health Insurance Coverage by Age in Clarks Green borough
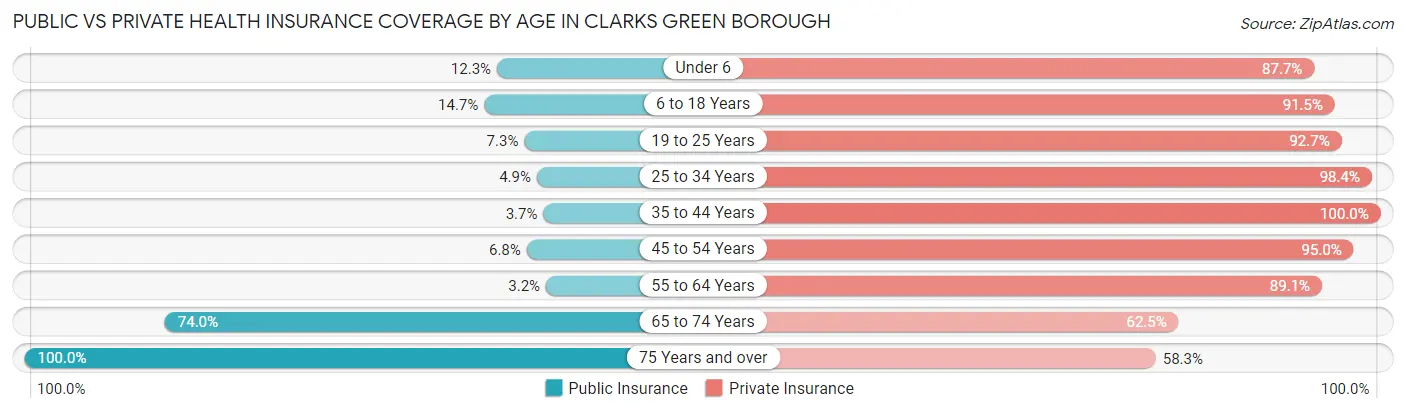
| Age Bracket | Public Insurance | Private Insurance |
| Under 6 | 9 (12.3%) | 64 (87.7%) |
| 6 to 18 Years | 45 (14.7%) | 280 (91.5%) |
| 19 to 25 Years | 9 (7.3%) | 115 (92.7%) |
| 25 to 34 Years | 6 (4.9%) | 120 (98.4%) |
| 35 to 44 Years | 5 (3.7%) | 134 (100.0%) |
| 45 to 54 Years | 15 (6.8%) | 209 (95.0%) |
| 55 to 64 Years | 8 (3.2%) | 221 (89.1%) |
| 65 to 74 Years | 142 (74.0%) | 120 (62.5%) |
| 75 Years and over | 175 (100.0%) | 102 (58.3%) |
| Total | 414 (26.0%) | 1,365 (85.6%) |
Disability Status by Sex by Age in Clarks Green borough
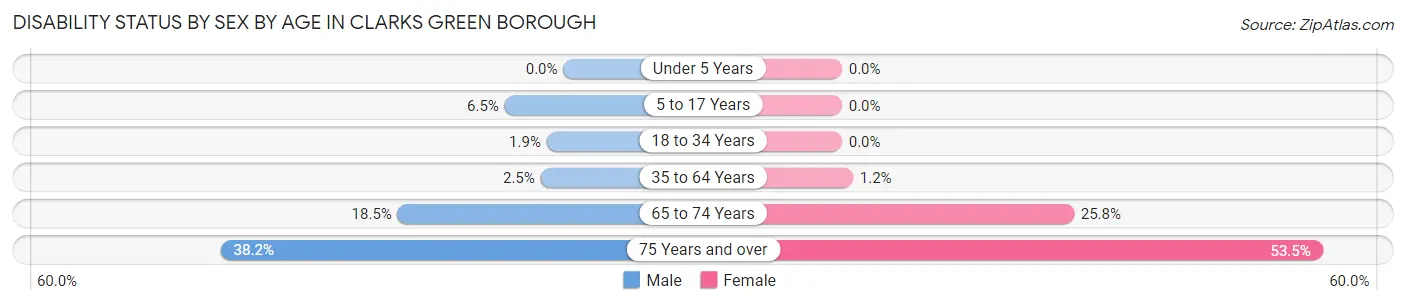
| Age Bracket | Male | Female |
| Under 5 Years | 0 (0.0%) | 0 (0.0%) |
| 5 to 17 Years | 13 (6.5%) | 0 (0.0%) |
| 18 to 34 Years | 3 (1.8%) | 0 (0.0%) |
| 35 to 64 Years | 7 (2.5%) | 4 (1.2%) |
| 65 to 74 Years | 19 (18.4%) | 23 (25.8%) |
| 75 Years and over | 29 (38.2%) | 53 (53.5%) |
Disability Class by Sex by Age in Clarks Green borough
Disability Class: Hearing Difficulty
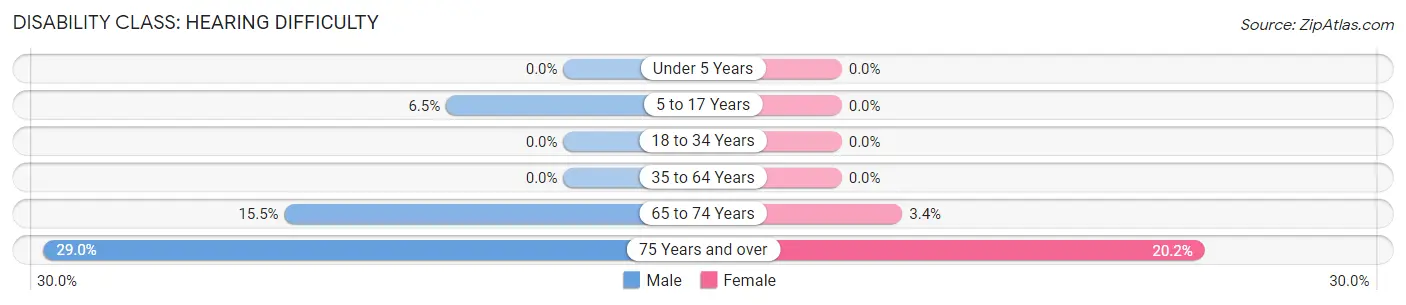
| Age Bracket | Male | Female |
| Under 5 Years | 0 (0.0%) | 0 (0.0%) |
| 5 to 17 Years | 13 (6.5%) | 0 (0.0%) |
| 18 to 34 Years | 0 (0.0%) | 0 (0.0%) |
| 35 to 64 Years | 0 (0.0%) | 0 (0.0%) |
| 65 to 74 Years | 16 (15.5%) | 3 (3.4%) |
| 75 Years and over | 22 (28.9%) | 20 (20.2%) |
Disability Class: Vision Difficulty
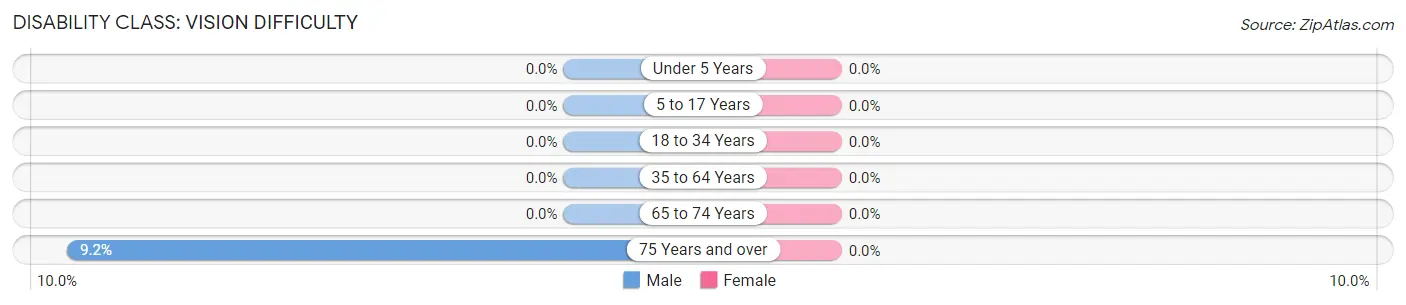
| Age Bracket | Male | Female |
| Under 5 Years | 0 (0.0%) | 0 (0.0%) |
| 5 to 17 Years | 0 (0.0%) | 0 (0.0%) |
| 18 to 34 Years | 0 (0.0%) | 0 (0.0%) |
| 35 to 64 Years | 0 (0.0%) | 0 (0.0%) |
| 65 to 74 Years | 0 (0.0%) | 0 (0.0%) |
| 75 Years and over | 7 (9.2%) | 0 (0.0%) |
Disability Class: Cognitive Difficulty
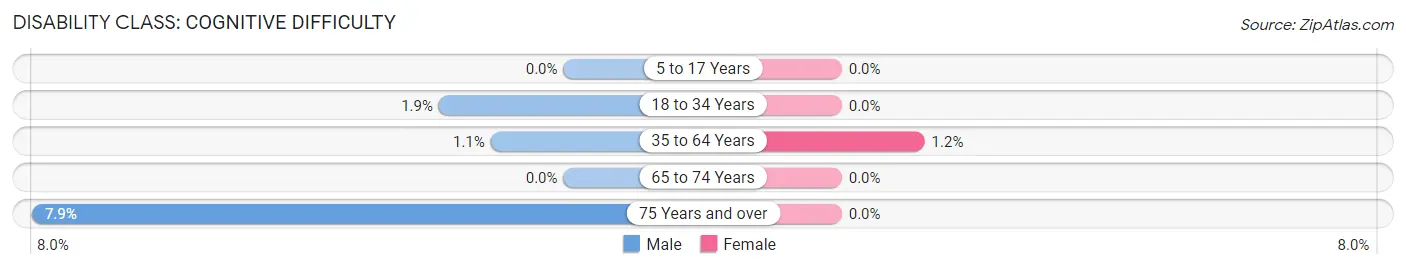
| Age Bracket | Male | Female |
| 5 to 17 Years | 0 (0.0%) | 0 (0.0%) |
| 18 to 34 Years | 3 (1.8%) | 0 (0.0%) |
| 35 to 64 Years | 3 (1.1%) | 4 (1.2%) |
| 65 to 74 Years | 0 (0.0%) | 0 (0.0%) |
| 75 Years and over | 6 (7.9%) | 0 (0.0%) |
Disability Class: Ambulatory Difficulty
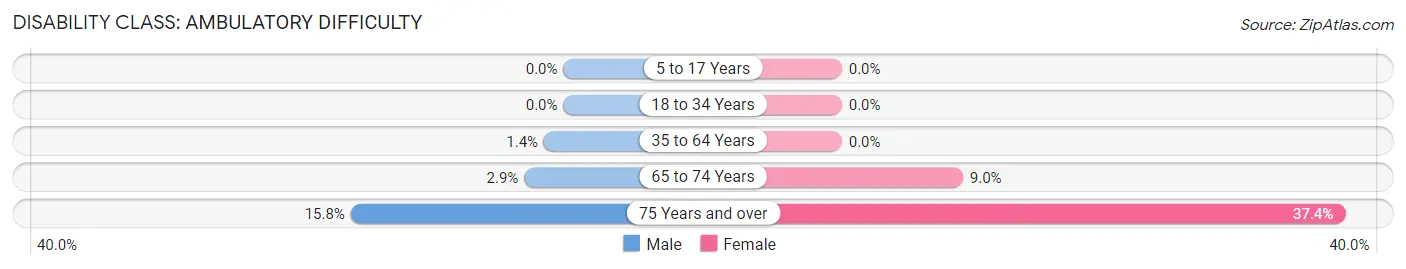
| Age Bracket | Male | Female |
| 5 to 17 Years | 0 (0.0%) | 0 (0.0%) |
| 18 to 34 Years | 0 (0.0%) | 0 (0.0%) |
| 35 to 64 Years | 4 (1.4%) | 0 (0.0%) |
| 65 to 74 Years | 3 (2.9%) | 8 (9.0%) |
| 75 Years and over | 12 (15.8%) | 37 (37.4%) |
Disability Class: Self-Care Difficulty
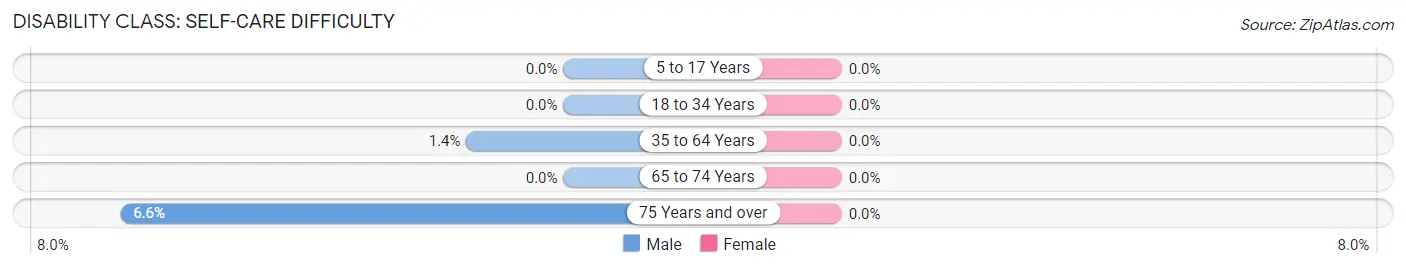
| Age Bracket | Male | Female |
| 5 to 17 Years | 0 (0.0%) | 0 (0.0%) |
| 18 to 34 Years | 0 (0.0%) | 0 (0.0%) |
| 35 to 64 Years | 4 (1.4%) | 0 (0.0%) |
| 65 to 74 Years | 0 (0.0%) | 0 (0.0%) |
| 75 Years and over | 5 (6.6%) | 0 (0.0%) |
Technology Access in Clarks Green borough
Computing Device Access in Clarks Green borough
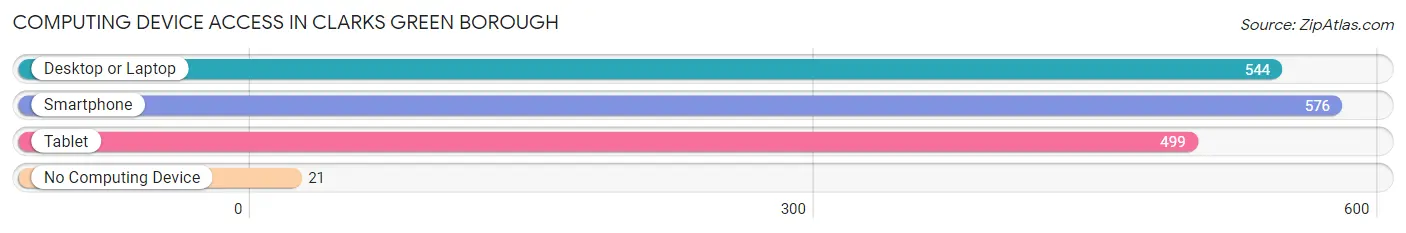
| Device Type | # Households | % Households |
| Desktop or Laptop | 544 | 86.5% |
| Smartphone | 576 | 91.6% |
| Tablet | 499 | 79.3% |
| No Computing Device | 21 | 3.3% |
| Total | 629 | 100.0% |
Internet Access in Clarks Green borough
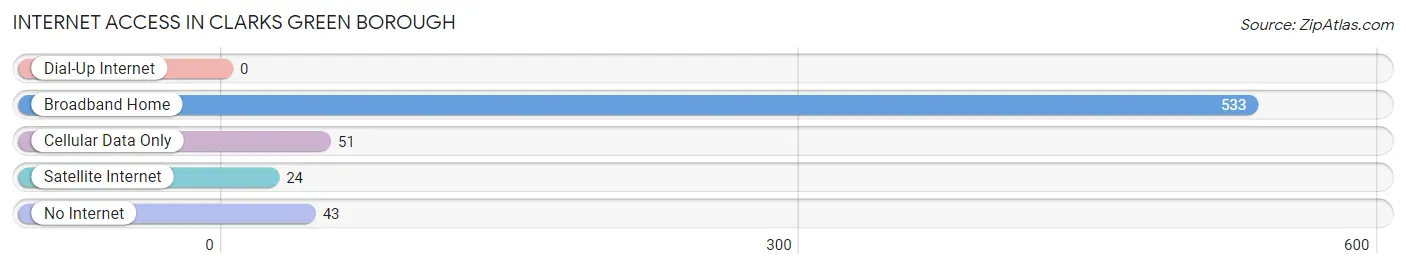
| Internet Type | # Households | % Households |
| Dial-Up Internet | 0 | 0.0% |
| Broadband Home | 533 | 84.7% |
| Cellular Data Only | 51 | 8.1% |
| Satellite Internet | 24 | 3.8% |
| No Internet | 43 | 6.8% |
| Total | 629 | 100.0% |
Clarks Green borough Summary
Clarks Green Borough is a small borough located in Lackawanna County, Pennsylvania. It is situated in the Scranton-Wilkes Barre-Hazleton Metropolitan Statistical Area and is part of the larger Scranton-Wilkes Barre-Hazleton Combined Statistical Area. The borough is home to approximately 1,800 people and is located just south of the city of Scranton.
History
Clarks Green Borough was founded in 1876 by William Clark, a local businessman. The borough was named after Clark, who was a prominent figure in the area. The borough was originally part of the larger town of South Abington Township, which was incorporated in 1878. In 1891, Clarks Green was officially incorporated as a borough.
The borough has a long history of industry and manufacturing. In the late 19th century, the borough was home to several factories, including a paper mill, a tannery, and a brickyard. These factories provided employment for many of the borough’s residents.
In the early 20th century, Clarks Green was home to several large businesses, including the Clarks Green Manufacturing Company, which produced a variety of products, including furniture, clothing, and leather goods. The borough also had a thriving coal mining industry, which provided employment for many of the borough’s residents.
Geography
Clarks Green Borough is located in Lackawanna County, Pennsylvania. It is situated in the Scranton-Wilkes Barre-Hazleton Metropolitan Statistical Area and is part of the larger Scranton-Wilkes Barre-Hazleton Combined Statistical Area. The borough is located just south of the city of Scranton and is bordered by South Abington Township to the north, Waverly Township to the east, and North Abington Township to the south.
The borough has a total area of 0.9 square miles, all of which is land. The borough is located in the Lackawanna Valley, which is part of the Appalachian Mountains. The borough is located at an elevation of 1,068 feet above sea level.
Economy
Clarks Green Borough has a diverse economy. The borough is home to several small businesses, including restaurants, retail stores, and professional services. The borough also has a thriving manufacturing sector, which includes several factories that produce a variety of products, including furniture, clothing, and leather goods.
The borough is also home to several large employers, including the Clarks Green Manufacturing Company, which employs over 500 people. The borough also has a thriving coal mining industry, which provides employment for many of the borough’s residents.
Demographics
As of the 2010 census, the population of Clarks Green Borough was 1,811. The racial makeup of the borough was 97.3% White, 0.9% African American, 0.2% Native American, 0.4% Asian, 0.1% Pacific Islander, 0.2% from other races, and 0.9% from two or more races. Hispanic or Latino of any race were 1.2% of the population.
The median household income in Clarks Green Borough was $45,938, and the median family income was $54,844. The per capita income for the borough was $22,945. About 8.3% of families and 10.2% of the population were below the poverty line, including 14.2% of those under age 18 and 5.2% of those age 65 or over.
Common Questions
What is Per Capita Income in Clarks Green borough?
Per Capita income in Clarks Green borough is $51,750.
What is the Median Family Income in Clarks Green borough?
Median Family Income in Clarks Green borough is $141,250.
What is the Median Household income in Clarks Green borough?
Median Household Income in Clarks Green borough is $105,298.
What is Income or Wage Gap in Clarks Green borough?
Income or Wage Gap in Clarks Green borough is 37.5%.
Women in Clarks Green borough earn 62.5 cents for every dollar earned by a man.
What is Inequality or Gini Index in Clarks Green borough?
Inequality or Gini Index in Clarks Green borough is 0.43.
What is the Total Population of Clarks Green borough?
Total Population of Clarks Green borough is 1,594.
What is the Total Male Population of Clarks Green borough?
Total Male Population of Clarks Green borough is 852.
What is the Total Female Population of Clarks Green borough?
Total Female Population of Clarks Green borough is 742.
What is the Ratio of Males per 100 Females in Clarks Green borough?
There are 114.82 Males per 100 Females in Clarks Green borough.
What is the Ratio of Females per 100 Males in Clarks Green borough?
There are 87.09 Females per 100 Males in Clarks Green borough.
What is the Median Population Age in Clarks Green borough?
Median Population Age in Clarks Green borough is 46.7 Years.
What is the Average Family Size in Clarks Green borough
Average Family Size in Clarks Green borough is 3.2 People.
What is the Average Household Size in Clarks Green borough
Average Household Size in Clarks Green borough is 2.5 People.
How Large is the Labor Force in Clarks Green borough?
There are 901 People in the Labor Forcein in Clarks Green borough.
What is the Percentage of People in the Labor Force in Clarks Green borough?
70.2% of People are in the Labor Force in Clarks Green borough.
What is the Unemployment Rate in Clarks Green borough?
Unemployment Rate in Clarks Green borough is 0.6%.