Richboro, PA Map & Demographics
Richboro Map
Richboro Overview
$68,870
PER CAPITA INCOME
$148,555
AVG FAMILY INCOME
$147,703
AVG HOUSEHOLD INCOME
46.8%
WAGE / INCOME GAP [ % ]
53.2¢/ $1
WAGE / INCOME GAP [ $ ]
0.41
INEQUALITY / GINI INDEX
6,983
TOTAL POPULATION
3,677
MALE POPULATION
3,306
FEMALE POPULATION
111.22
MALES / 100 FEMALES
89.91
FEMALES / 100 MALES
52.9
MEDIAN AGE
2.9
AVG FAMILY SIZE
2.7
AVG HOUSEHOLD SIZE
3,561
LABOR FORCE [ PEOPLE ]
60.7%
PERCENT IN LABOR FORCE
3.3%
UNEMPLOYMENT RATE
Richboro Zip Codes
Income in Richboro
Income Overview in Richboro
Per Capita Income in Richboro is $68,870, while median incomes of families and households are $148,555 and $147,703 respectively.
| Characteristic | Number | Measure |
| Per Capita Income | 6,983 | $68,870 |
| Median Family Income | 2,291 | $148,555 |
| Mean Family Income | 2,291 | $195,739 |
| Median Household Income | 2,581 | $147,703 |
| Mean Household Income | 2,581 | $181,843 |
| Income Deficit | 2,291 | $0 |
| Wage / Income Gap (%) | 6,983 | 46.84% |
| Wage / Income Gap ($) | 6,983 | 53.16¢ per $1 |
| Gini / Inequality Index | 6,983 | 0.41 |
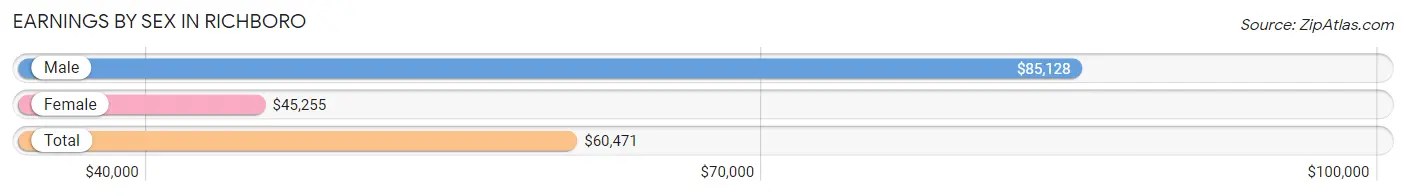
Earnings by Sex in Richboro
Average Earnings in Richboro are $60,471, $85,128 for men and $45,255 for women, a difference of 46.8%.
| Sex | Number | Average Earnings |
| Male | 2,047 (55.7%) | $85,128 |
| Female | 1,625 (44.3%) | $45,255 |
| Total | 3,672 (100.0%) | $60,471 |
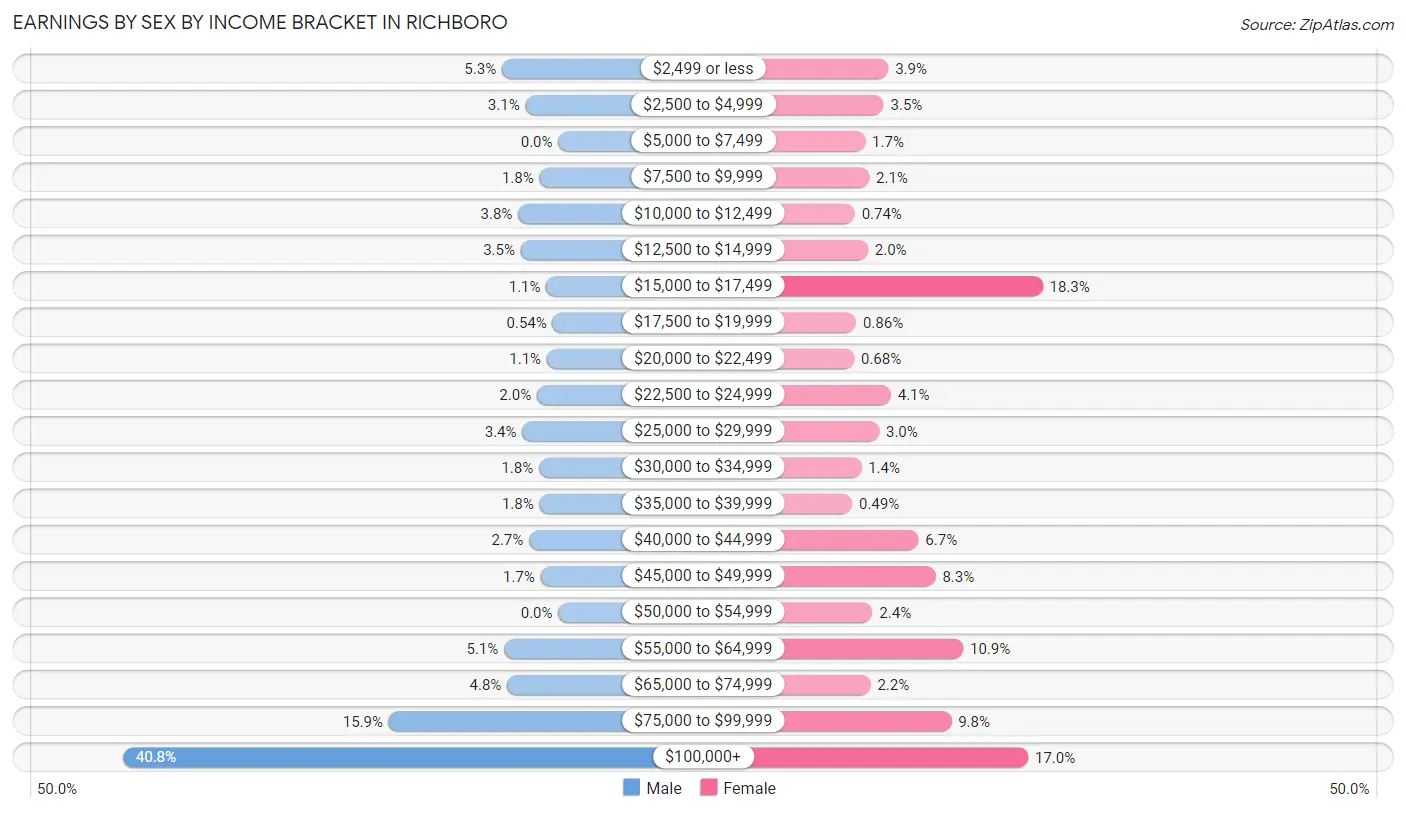
Earnings by Sex by Income Bracket in Richboro
The most common earnings brackets in Richboro are $100,000+ for men (835 | 40.8%) and $15,000 to $17,499 for women (298 | 18.3%).
| Income | Male | Female |
| $2,499 or less | 108 (5.3%) | 63 (3.9%) |
| $2,500 to $4,999 | 63 (3.1%) | 56 (3.5%) |
| $5,000 to $7,499 | 0 (0.0%) | 28 (1.7%) |
| $7,500 to $9,999 | 36 (1.8%) | 34 (2.1%) |
| $10,000 to $12,499 | 77 (3.8%) | 12 (0.7%) |
| $12,500 to $14,999 | 72 (3.5%) | 32 (2.0%) |
| $15,000 to $17,499 | 23 (1.1%) | 298 (18.3%) |
| $17,500 to $19,999 | 11 (0.5%) | 14 (0.9%) |
| $20,000 to $22,499 | 22 (1.1%) | 11 (0.7%) |
| $22,500 to $24,999 | 41 (2.0%) | 67 (4.1%) |
| $25,000 to $29,999 | 69 (3.4%) | 49 (3.0%) |
| $30,000 to $34,999 | 37 (1.8%) | 22 (1.3%) |
| $35,000 to $39,999 | 36 (1.8%) | 8 (0.5%) |
| $40,000 to $44,999 | 56 (2.7%) | 109 (6.7%) |
| $45,000 to $49,999 | 34 (1.7%) | 135 (8.3%) |
| $50,000 to $54,999 | 0 (0.0%) | 39 (2.4%) |
| $55,000 to $64,999 | 104 (5.1%) | 177 (10.9%) |
| $65,000 to $74,999 | 98 (4.8%) | 36 (2.2%) |
| $75,000 to $99,999 | 325 (15.9%) | 159 (9.8%) |
| $100,000+ | 835 (40.8%) | 276 (17.0%) |
| Total | 2,047 (100.0%) | 1,625 (100.0%) |
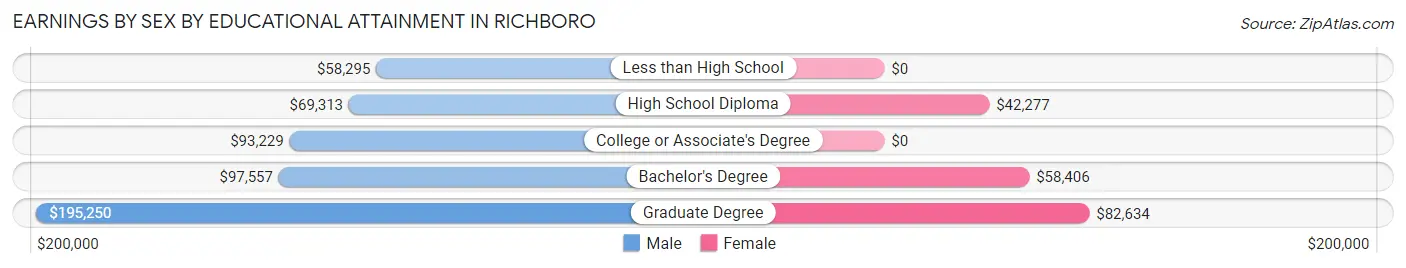
Earnings by Sex by Educational Attainment in Richboro
Average earnings in Richboro are $95,104 for men and $46,532 for women, a difference of 51.1%. Men with an educational attainment of graduate degree enjoy the highest average annual earnings of $195,250, while those with less than high school education earn the least with $58,295. Women with an educational attainment of graduate degree earn the most with the average annual earnings of $82,634, while those with high school diploma education have the smallest earnings of $42,277.
| Educational Attainment | Male Income | Female Income |
| Less than High School | $58,295 | $0 |
| High School Diploma | $69,313 | $42,277 |
| College or Associate's Degree | $93,229 | $0 |
| Bachelor's Degree | $97,557 | $58,406 |
| Graduate Degree | $195,250 | $82,634 |
| Total | $95,104 | $46,532 |
Family Income in Richboro
Family Income Brackets in Richboro
According to the Richboro family income data, there are 921 families falling into the $100,000 to $149,999 income range, which is the most common income bracket and makes up 40.2% of all families.
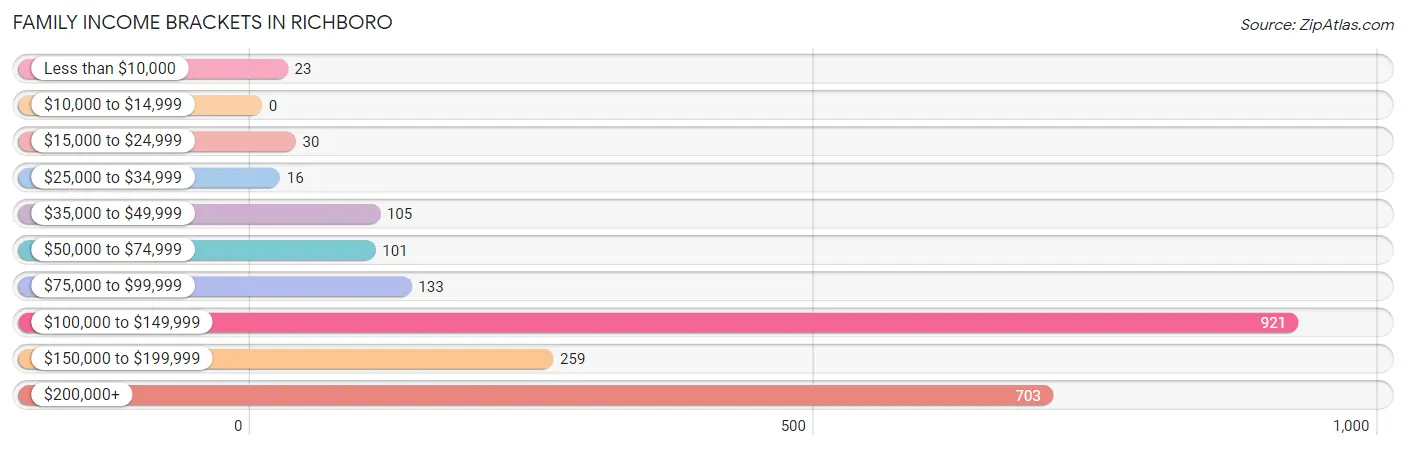
| Income Bracket | # Families | % Families |
| Less than $10,000 | 23 | 1.0% |
| $10,000 to $14,999 | 0 | 0.0% |
| $15,000 to $24,999 | 30 | 1.3% |
| $25,000 to $34,999 | 16 | 0.7% |
| $35,000 to $49,999 | 105 | 4.6% |
| $50,000 to $74,999 | 101 | 4.4% |
| $75,000 to $99,999 | 133 | 5.8% |
| $100,000 to $149,999 | 921 | 40.2% |
| $150,000 to $199,999 | 259 | 11.3% |
| $200,000+ | 703 | 30.7% |
Family Income by Famaliy Size in Richboro
5-person families (113 | 4.9%) account for the highest median family income in Richboro with $218,594 per family, while 2-person families (1,073 | 46.8%) have the highest median income of $66,904 per family member.
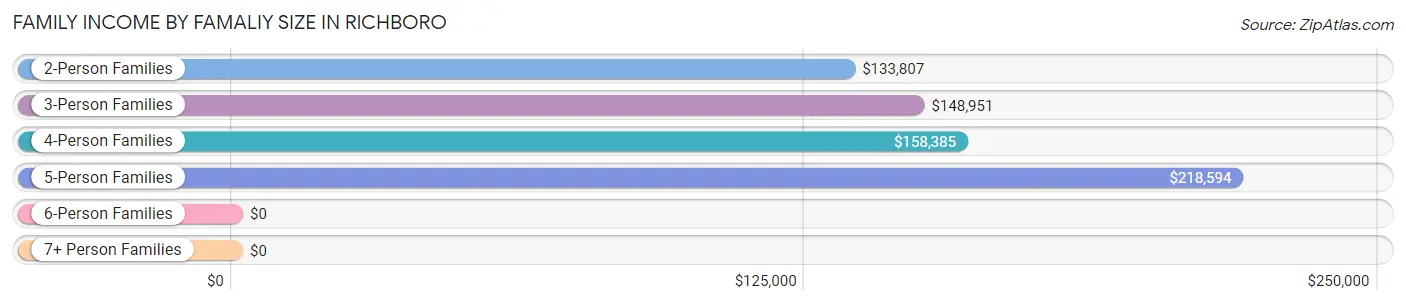
| Income Bracket | # Families | Median Income |
| 2-Person Families | 1,073 (46.8%) | $133,807 |
| 3-Person Families | 568 (24.8%) | $148,951 |
| 4-Person Families | 441 (19.3%) | $158,385 |
| 5-Person Families | 113 (4.9%) | $218,594 |
| 6-Person Families | 88 (3.8%) | $0 |
| 7+ Person Families | 8 (0.4%) | $0 |
| Total | 2,291 (100.0%) | $148,555 |
Family Income by Number of Earners in Richboro
The median family income in Richboro is $148,555, with families comprising 3+ earners (284) having the highest median family income of $235,750, while families with no earners (292) have the lowest median family income of $101,563, accounting for 12.4% and 12.8% of families, respectively.
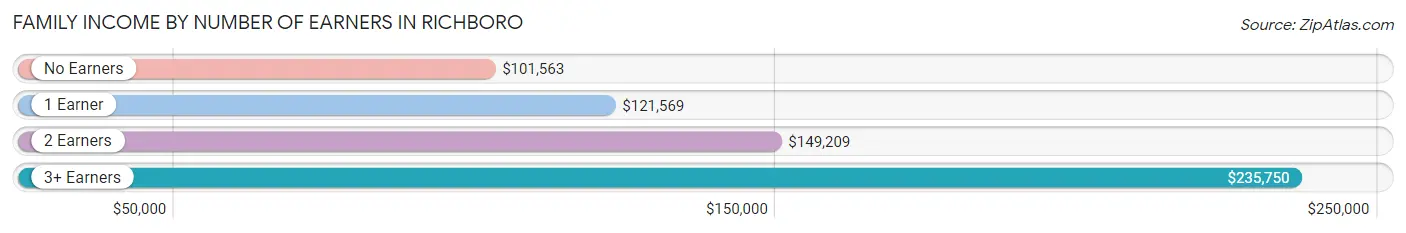
| Number of Earners | # Families | Median Income |
| No Earners | 292 (12.8%) | $101,563 |
| 1 Earner | 576 (25.1%) | $121,569 |
| 2 Earners | 1,139 (49.7%) | $149,209 |
| 3+ Earners | 284 (12.4%) | $235,750 |
| Total | 2,291 (100.0%) | $148,555 |
Household Income in Richboro
Household Income Brackets in Richboro
With 945 households falling in the category, the $100,000 to $149,999 income range is the most frequent in Richboro, accounting for 36.6% of all households. In contrast, only 10 households (0.4%) fall into the $10,000 to $14,999 income bracket, making it the least populous group.
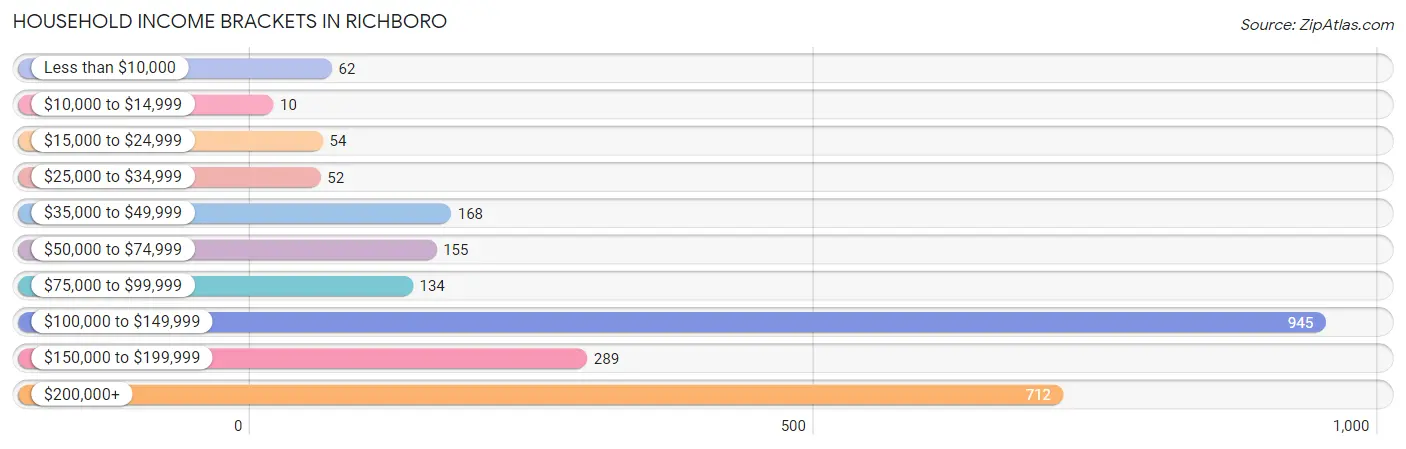
| Income Bracket | # Households | % Households |
| Less than $10,000 | 62 | 2.4% |
| $10,000 to $14,999 | 10 | 0.4% |
| $15,000 to $24,999 | 54 | 2.1% |
| $25,000 to $34,999 | 52 | 2.0% |
| $35,000 to $49,999 | 168 | 6.5% |
| $50,000 to $74,999 | 155 | 6.0% |
| $75,000 to $99,999 | 134 | 5.2% |
| $100,000 to $149,999 | 945 | 36.6% |
| $150,000 to $199,999 | 289 | 11.2% |
| $200,000+ | 712 | 27.6% |
Household Income by Householder Age in Richboro
The median household income in Richboro is $147,703, with the highest median household income of $160,972 found in the 25 to 44 years age bracket for the primary householder. A total of 462 households (17.9%) fall into this category.
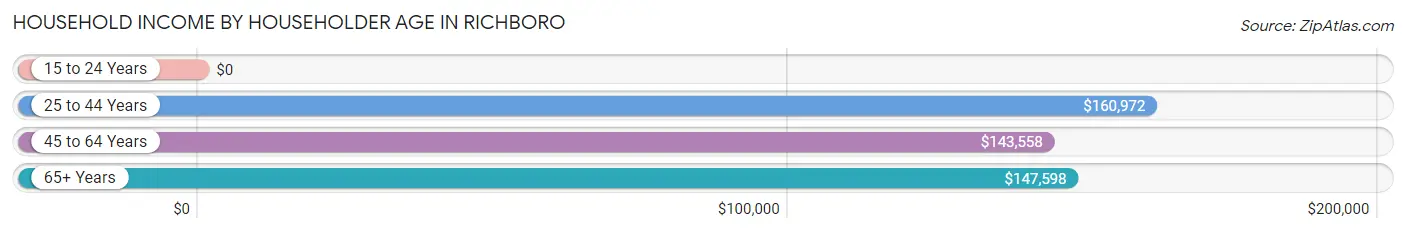
| Income Bracket | # Households | Median Income |
| 15 to 24 Years | 0 (0.0%) | $0 |
| 25 to 44 Years | 462 (17.9%) | $160,972 |
| 45 to 64 Years | 1,025 (39.7%) | $143,558 |
| 65+ Years | 1,094 (42.4%) | $147,598 |
| Total | 2,581 (100.0%) | $147,703 |
Poverty in Richboro
Income Below Poverty by Sex and Age in Richboro
With 0.7% poverty level for males and 2.2% for females among the residents of Richboro, 55 to 64 year old males and 75 year old and over females are the most vulnerable to poverty, with 23 males (4.0%) and 38 females (12.5%) in their respective age groups living below the poverty level.
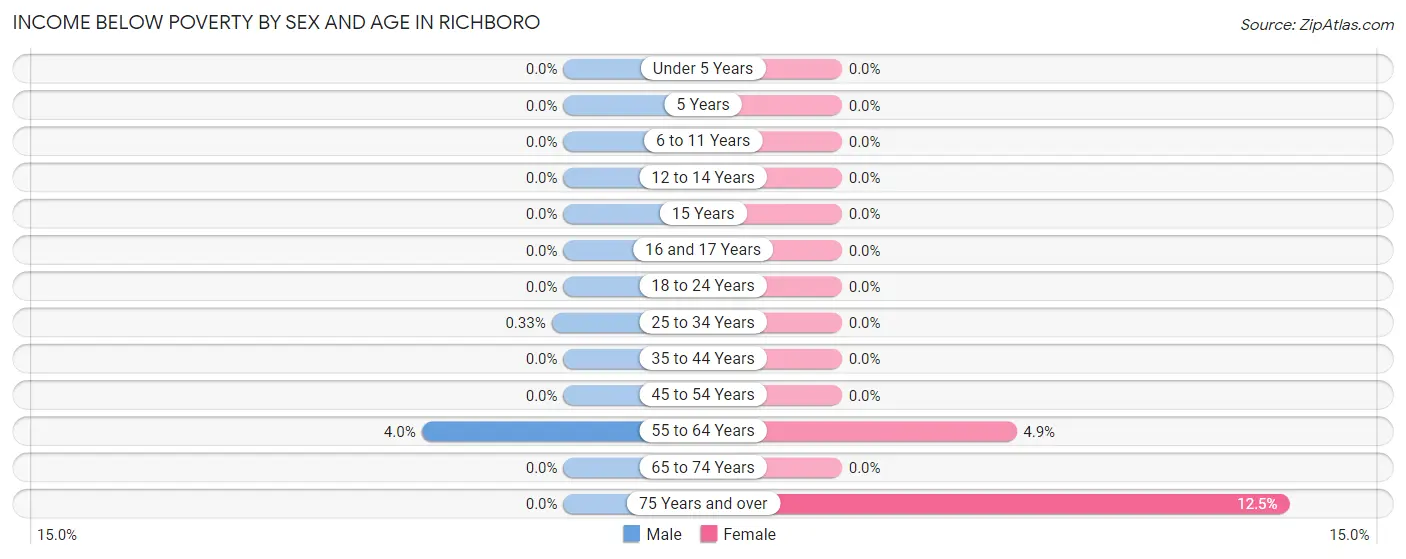
| Age Bracket | Male | Female |
| Under 5 Years | 0 (0.0%) | 0 (0.0%) |
| 5 Years | 0 (0.0%) | 0 (0.0%) |
| 6 to 11 Years | 0 (0.0%) | 0 (0.0%) |
| 12 to 14 Years | 0 (0.0%) | 0 (0.0%) |
| 15 Years | 0 (0.0%) | 0 (0.0%) |
| 16 and 17 Years | 0 (0.0%) | 0 (0.0%) |
| 18 to 24 Years | 0 (0.0%) | 0 (0.0%) |
| 25 to 34 Years | 1 (0.3%) | 0 (0.0%) |
| 35 to 44 Years | 0 (0.0%) | 0 (0.0%) |
| 45 to 54 Years | 0 (0.0%) | 0 (0.0%) |
| 55 to 64 Years | 23 (4.0%) | 34 (4.9%) |
| 65 to 74 Years | 0 (0.0%) | 0 (0.0%) |
| 75 Years and over | 0 (0.0%) | 38 (12.5%) |
| Total | 24 (0.7%) | 72 (2.2%) |
Income Above Poverty by Sex and Age in Richboro
According to the poverty statistics in Richboro, males aged under 5 years and females aged under 5 years are the age groups that are most secure financially, with 100.0% of males and 100.0% of females in these age groups living above the poverty line.
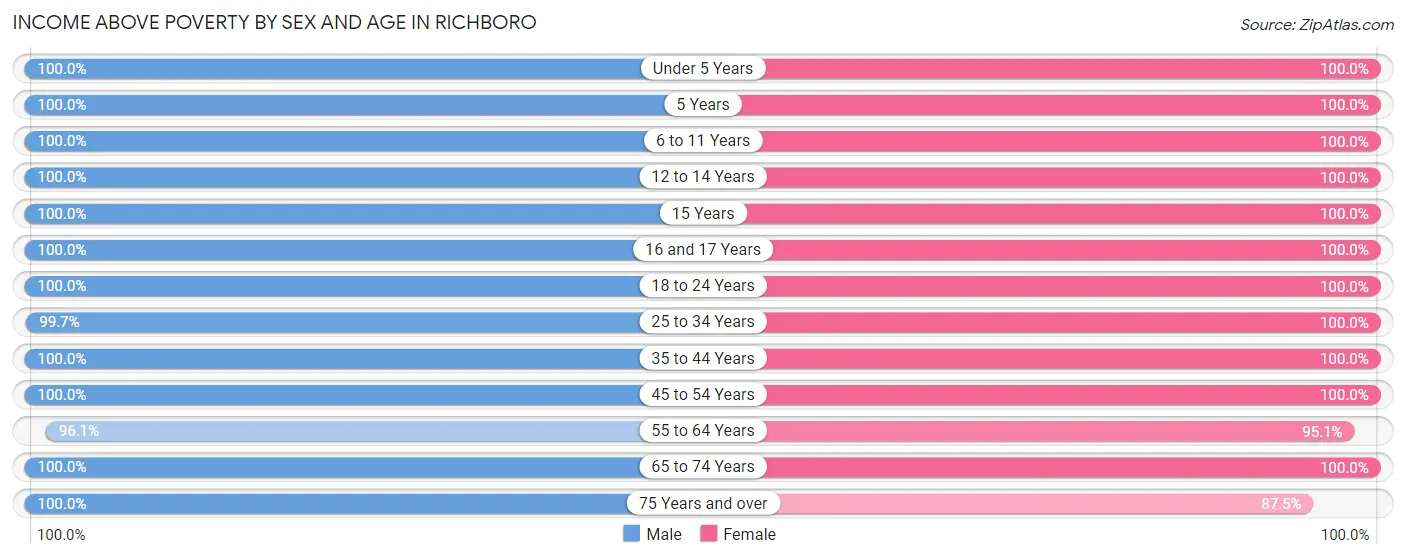
| Age Bracket | Male | Female |
| Under 5 Years | 227 (100.0%) | 159 (100.0%) |
| 5 Years | 36 (100.0%) | 22 (100.0%) |
| 6 to 11 Years | 195 (100.0%) | 148 (100.0%) |
| 12 to 14 Years | 88 (100.0%) | 124 (100.0%) |
| 15 Years | 48 (100.0%) | 70 (100.0%) |
| 16 and 17 Years | 144 (100.0%) | 45 (100.0%) |
| 18 to 24 Years | 343 (100.0%) | 102 (100.0%) |
| 25 to 34 Years | 306 (99.7%) | 207 (100.0%) |
| 35 to 44 Years | 284 (100.0%) | 322 (100.0%) |
| 45 to 54 Years | 442 (100.0%) | 360 (100.0%) |
| 55 to 64 Years | 559 (96.1%) | 665 (95.1%) |
| 65 to 74 Years | 782 (100.0%) | 690 (100.0%) |
| 75 Years and over | 152 (100.0%) | 267 (87.5%) |
| Total | 3,606 (99.3%) | 3,181 (97.8%) |
Income Below Poverty Among Married-Couple Families in Richboro
The poverty statistics for married-couple families in Richboro show that 1.1% or 23 of the total 2,122 families live below the poverty line. Families with no children have the highest poverty rate of 1.5%, comprising of 23 families. On the other hand, families with 1 or 2 children have the lowest poverty rate of 0.0%, which includes 0 families.
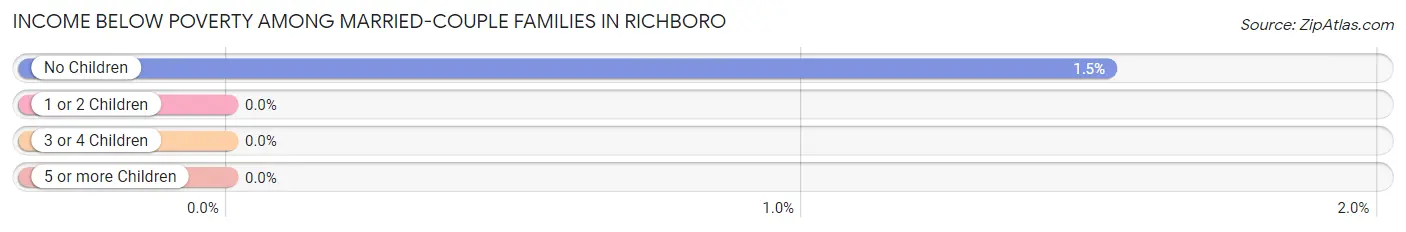
| Children | Above Poverty | Below Poverty |
| No Children | 1,484 (98.5%) | 23 (1.5%) |
| 1 or 2 Children | 461 (100.0%) | 0 (0.0%) |
| 3 or 4 Children | 146 (100.0%) | 0 (0.0%) |
| 5 or more Children | 8 (100.0%) | 0 (0.0%) |
| Total | 2,099 (98.9%) | 23 (1.1%) |
Income Below Poverty Among Single-Parent Households in Richboro
| Children | Single Father | Single Mother |
| No Children | 0 (0.0%) | 0 (0.0%) |
| 1 or 2 Children | 0 (0.0%) | 0 (0.0%) |
| 3 or 4 Children | 0 (0.0%) | 0 (0.0%) |
| 5 or more Children | 0 (0.0%) | 0 (0.0%) |
| Total | 0 (0.0%) | 0 (0.0%) |
Income Below Poverty Among Married-Couple vs Single-Parent Households in Richboro
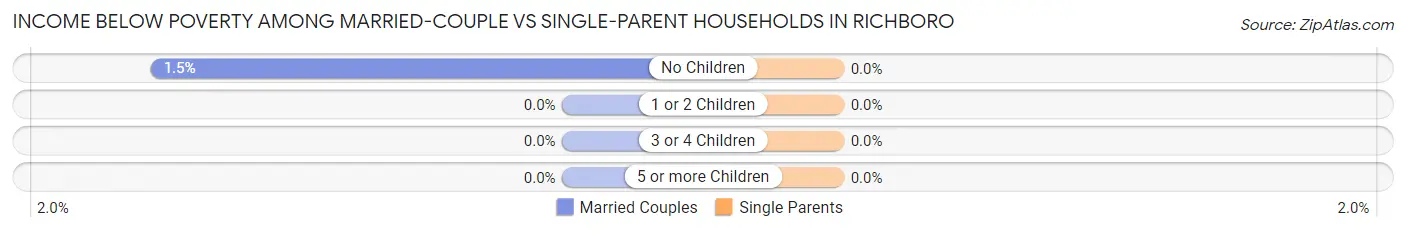
| Children | Married-Couple Families | Single-Parent Households |
| No Children | 23 (1.5%) | 0 (0.0%) |
| 1 or 2 Children | 0 (0.0%) | 0 (0.0%) |
| 3 or 4 Children | 0 (0.0%) | 0 (0.0%) |
| 5 or more Children | 0 (0.0%) | 0 (0.0%) |
| Total | 23 (1.1%) | 0 (0.0%) |
Race in Richboro
The most populous races in Richboro are White / Caucasian (5,929 | 84.9%), Some other Race (612 | 8.8%), and Asian (251 | 3.6%).
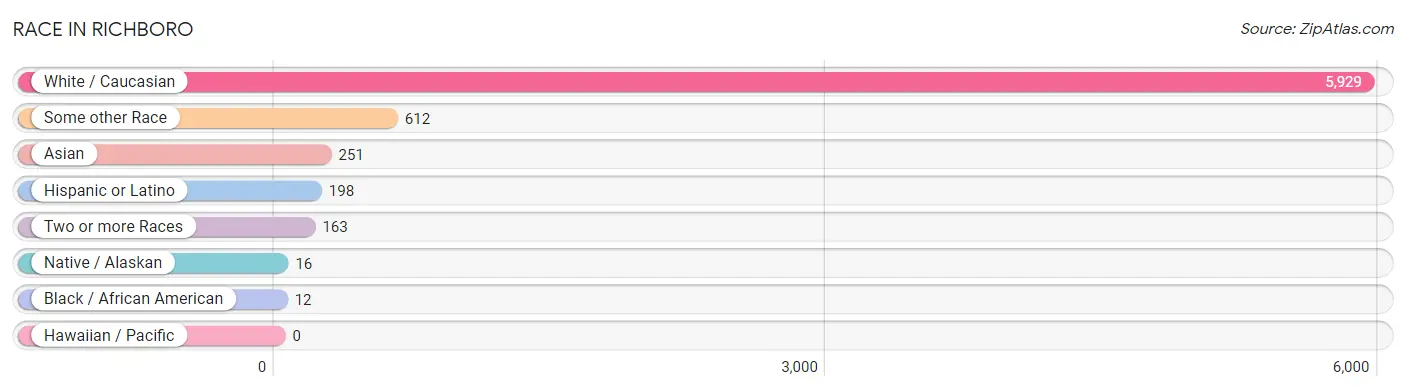
| Race | # Population | % Population |
| Asian | 251 | 3.6% |
| Black / African American | 12 | 0.2% |
| Hawaiian / Pacific | 0 | 0.0% |
| Hispanic or Latino | 198 | 2.8% |
| Native / Alaskan | 16 | 0.2% |
| White / Caucasian | 5,929 | 84.9% |
| Two or more Races | 163 | 2.3% |
| Some other Race | 612 | 8.8% |
| Total | 6,983 | 100.0% |
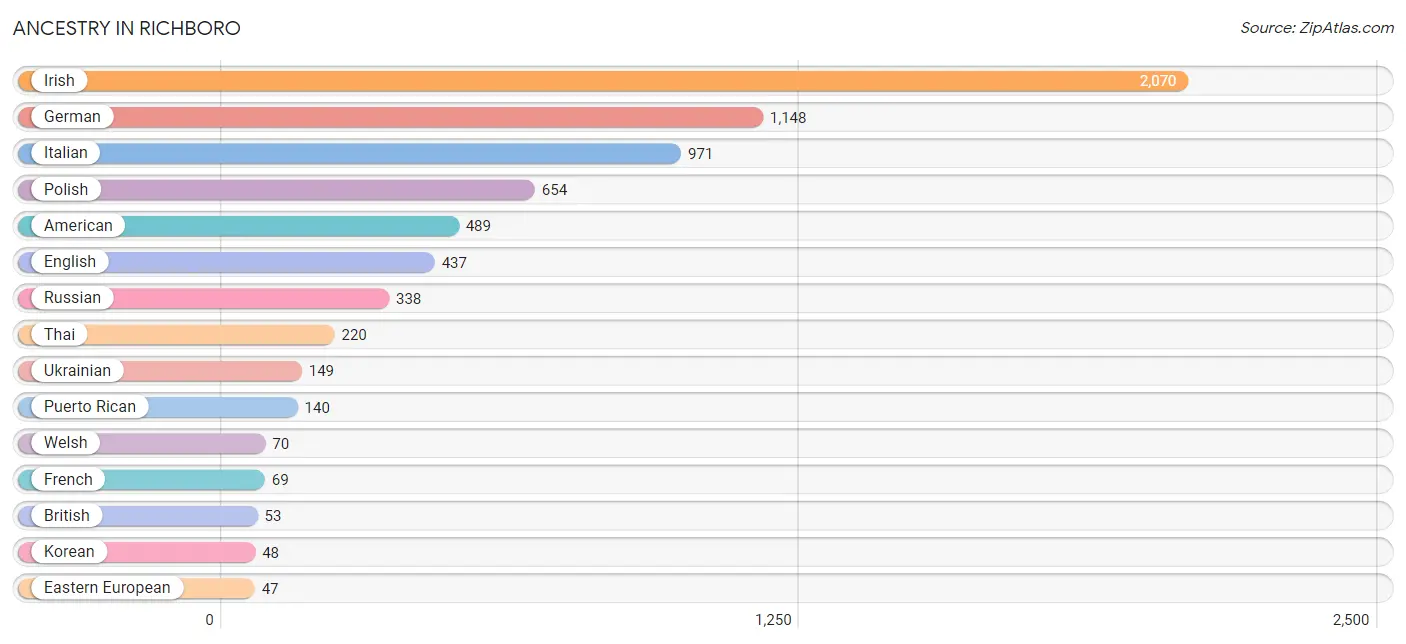
Ancestry in Richboro
The most populous ancestries reported in Richboro are Irish (2,070 | 29.6%), German (1,148 | 16.4%), Italian (971 | 13.9%), Polish (654 | 9.4%), and American (489 | 7.0%), together accounting for 76.4% of all Richboro residents.
| Ancestry | # Population | % Population |
| American | 489 | 7.0% |
| Arab | 20 | 0.3% |
| Armenian | 10 | 0.1% |
| Austrian | 29 | 0.4% |
| British | 53 | 0.8% |
| Colombian | 5 | 0.1% |
| Cuban | 9 | 0.1% |
| Czech | 20 | 0.3% |
| Danish | 19 | 0.3% |
| Dominican | 22 | 0.3% |
| Dutch | 31 | 0.4% |
| Eastern European | 47 | 0.7% |
| English | 437 | 6.3% |
| European | 28 | 0.4% |
| French | 69 | 1.0% |
| French Canadian | 39 | 0.6% |
| German | 1,148 | 16.4% |
| Hungarian | 40 | 0.6% |
| Indian (Asian) | 15 | 0.2% |
| Irish | 2,070 | 29.6% |
| Italian | 971 | 13.9% |
| Korean | 48 | 0.7% |
| Mexican | 17 | 0.2% |
| Mexican American Indian | 10 | 0.1% |
| Navajo | 5 | 0.1% |
| Norwegian | 26 | 0.4% |
| Pennsylvania German | 9 | 0.1% |
| Polish | 654 | 9.4% |
| Puerto Rican | 140 | 2.0% |
| Romanian | 25 | 0.4% |
| Russian | 338 | 4.8% |
| Scottish | 23 | 0.3% |
| Slovak | 7 | 0.1% |
| South American | 5 | 0.1% |
| Sri Lankan | 12 | 0.2% |
| Swedish | 27 | 0.4% |
| Swiss | 7 | 0.1% |
| Syrian | 9 | 0.1% |
| Thai | 220 | 3.2% |
| Ukrainian | 149 | 2.1% |
| Welsh | 70 | 1.0% |
| Yugoslavian | 11 | 0.2% | View All 42 Rows |
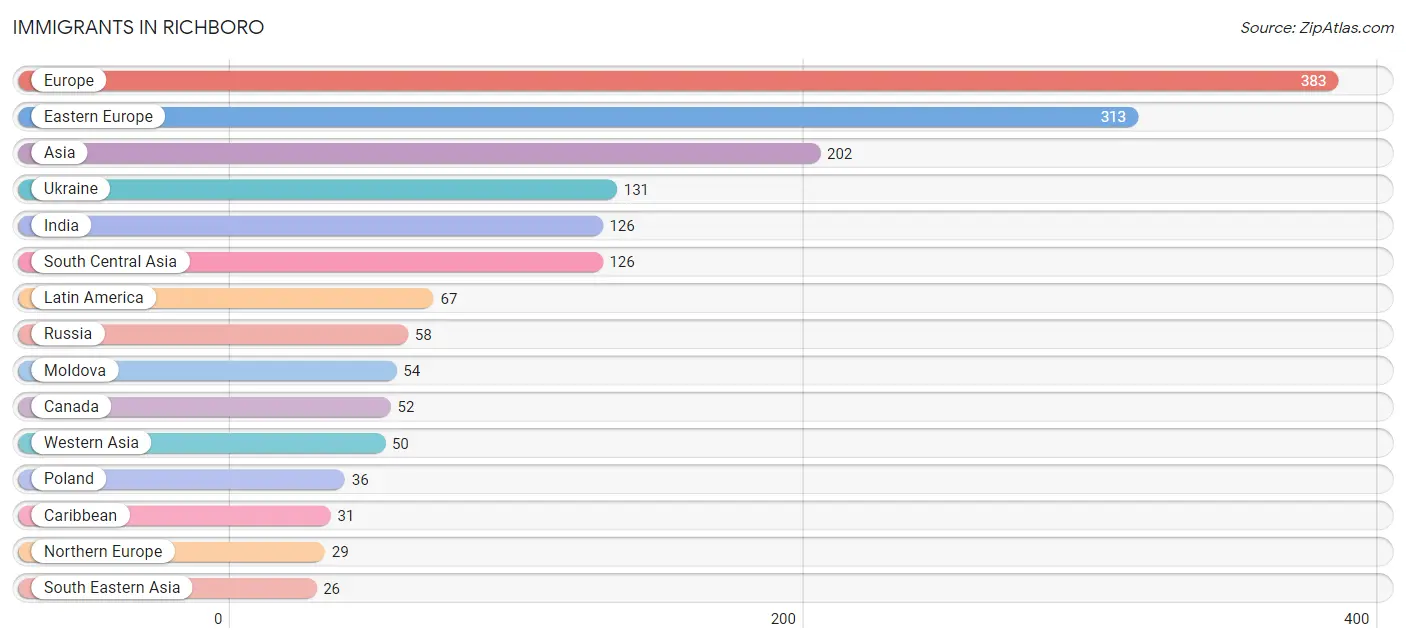
Immigrants in Richboro
The most numerous immigrant groups reported in Richboro came from Europe (383 | 5.5%), Eastern Europe (313 | 4.5%), Asia (202 | 2.9%), Ukraine (131 | 1.9%), and India (126 | 1.8%), together accounting for 16.5% of all Richboro residents.
| Immigration Origin | # Population | % Population |
| Asia | 202 | 2.9% |
| Belarus | 7 | 0.1% |
| Canada | 52 | 0.7% |
| Caribbean | 31 | 0.4% |
| Central America | 13 | 0.2% |
| Colombia | 10 | 0.1% |
| Cuba | 9 | 0.1% |
| Dominican Republic | 22 | 0.3% |
| Eastern Europe | 313 | 4.5% |
| Europe | 383 | 5.5% |
| France | 11 | 0.2% |
| Germany | 12 | 0.2% |
| India | 126 | 1.8% |
| Ireland | 21 | 0.3% |
| Israel | 14 | 0.2% |
| Italy | 18 | 0.3% |
| Latin America | 67 | 1.0% |
| Mexico | 13 | 0.2% |
| Moldova | 54 | 0.8% |
| Northern Europe | 29 | 0.4% |
| Philippines | 18 | 0.3% |
| Poland | 36 | 0.5% |
| Russia | 58 | 0.8% |
| Saudi Arabia | 11 | 0.2% |
| South America | 23 | 0.3% |
| South Central Asia | 126 | 1.8% |
| South Eastern Asia | 26 | 0.4% |
| Southern Europe | 18 | 0.3% |
| Ukraine | 131 | 1.9% |
| Uruguay | 13 | 0.2% |
| Vietnam | 8 | 0.1% |
| Western Asia | 50 | 0.7% |
| Western Europe | 23 | 0.3% | View All 33 Rows |
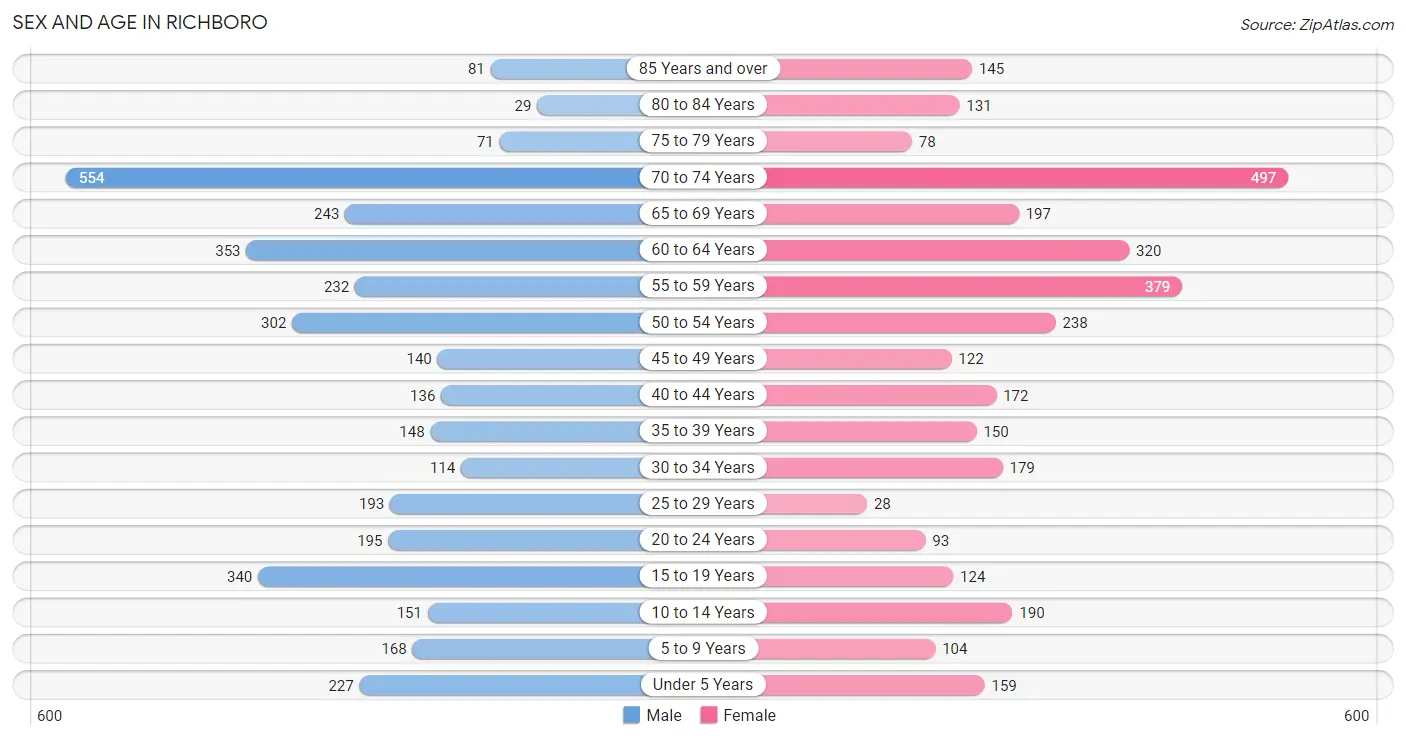
Sex and Age in Richboro
Sex and Age in Richboro
The most populous age groups in Richboro are 70 to 74 Years (554 | 15.1%) for men and 70 to 74 Years (497 | 15.0%) for women.
| Age Bracket | Male | Female |
| Under 5 Years | 227 (6.2%) | 159 (4.8%) |
| 5 to 9 Years | 168 (4.6%) | 104 (3.2%) |
| 10 to 14 Years | 151 (4.1%) | 190 (5.8%) |
| 15 to 19 Years | 340 (9.2%) | 124 (3.7%) |
| 20 to 24 Years | 195 (5.3%) | 93 (2.8%) |
| 25 to 29 Years | 193 (5.2%) | 28 (0.9%) |
| 30 to 34 Years | 114 (3.1%) | 179 (5.4%) |
| 35 to 39 Years | 148 (4.0%) | 150 (4.5%) |
| 40 to 44 Years | 136 (3.7%) | 172 (5.2%) |
| 45 to 49 Years | 140 (3.8%) | 122 (3.7%) |
| 50 to 54 Years | 302 (8.2%) | 238 (7.2%) |
| 55 to 59 Years | 232 (6.3%) | 379 (11.5%) |
| 60 to 64 Years | 353 (9.6%) | 320 (9.7%) |
| 65 to 69 Years | 243 (6.6%) | 197 (6.0%) |
| 70 to 74 Years | 554 (15.1%) | 497 (15.0%) |
| 75 to 79 Years | 71 (1.9%) | 78 (2.4%) |
| 80 to 84 Years | 29 (0.8%) | 131 (4.0%) |
| 85 Years and over | 81 (2.2%) | 145 (4.4%) |
| Total | 3,677 (100.0%) | 3,306 (100.0%) |
Families and Households in Richboro
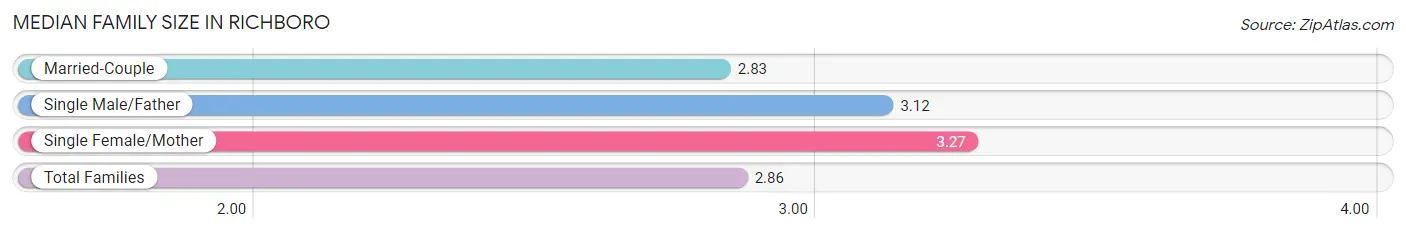
Median Family Size in Richboro
The median family size in Richboro is 2.86 persons per family, with single female/mother families (112 | 4.9%) accounting for the largest median family size of 3.27 persons per family. On the other hand, married-couple families (2,122 | 92.6%) represent the smallest median family size with 2.83 persons per family.
| Family Type | # Families | Family Size |
| Married-Couple | 2,122 (92.6%) | 2.83 |
| Single Male/Father | 57 (2.5%) | 3.12 |
| Single Female/Mother | 112 (4.9%) | 3.27 |
| Total Families | 2,291 (100.0%) | 2.86 |
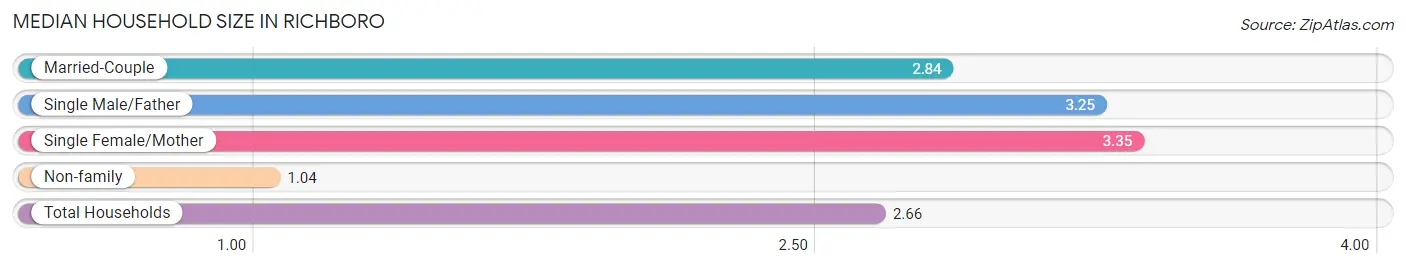
Median Household Size in Richboro
The median household size in Richboro is 2.66 persons per household, with single female/mother households (112 | 4.3%) accounting for the largest median household size of 3.35 persons per household. non-family households (290 | 11.2%) represent the smallest median household size with 1.04 persons per household.
| Household Type | # Households | Household Size |
| Married-Couple | 2,122 (82.2%) | 2.84 |
| Single Male/Father | 57 (2.2%) | 3.25 |
| Single Female/Mother | 112 (4.3%) | 3.35 |
| Non-family | 290 (11.2%) | 1.04 |
| Total Households | 2,581 (100.0%) | 2.66 |
Household Size by Marriage Status in Richboro
Out of a total of 2,581 households in Richboro, 2,291 (88.8%) are family households, while 290 (11.2%) are nonfamily households. The most numerous type of family households are 2-person households, comprising 1,073, and the most common type of nonfamily households are 1-person households, comprising 279.
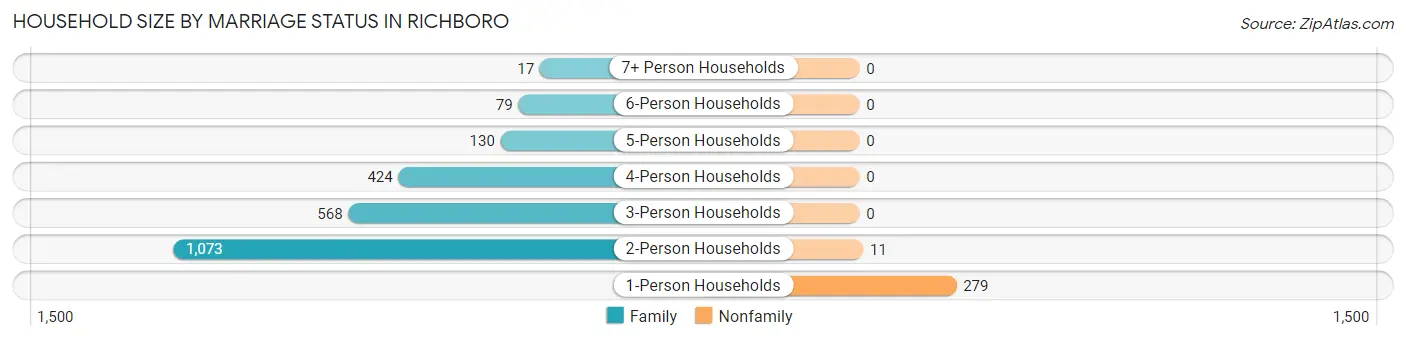
| Household Size | Family Households | Nonfamily Households |
| 1-Person Households | - | 279 (10.8%) |
| 2-Person Households | 1,073 (41.6%) | 11 (0.4%) |
| 3-Person Households | 568 (22.0%) | 0 (0.0%) |
| 4-Person Households | 424 (16.4%) | 0 (0.0%) |
| 5-Person Households | 130 (5.0%) | 0 (0.0%) |
| 6-Person Households | 79 (3.1%) | 0 (0.0%) |
| 7+ Person Households | 17 (0.7%) | 0 (0.0%) |
| Total | 2,291 (88.8%) | 290 (11.2%) |
Female Fertility in Richboro
Fertility by Age in Richboro
Average fertility rate in Richboro is 74.0 births per 1,000 women. Women in the age bracket of 20 to 34 years have the highest fertility rate with 177.0 births per 1,000 women. Women in the age bracket of 20 to 34 years acount for 77.9% of all women with births.
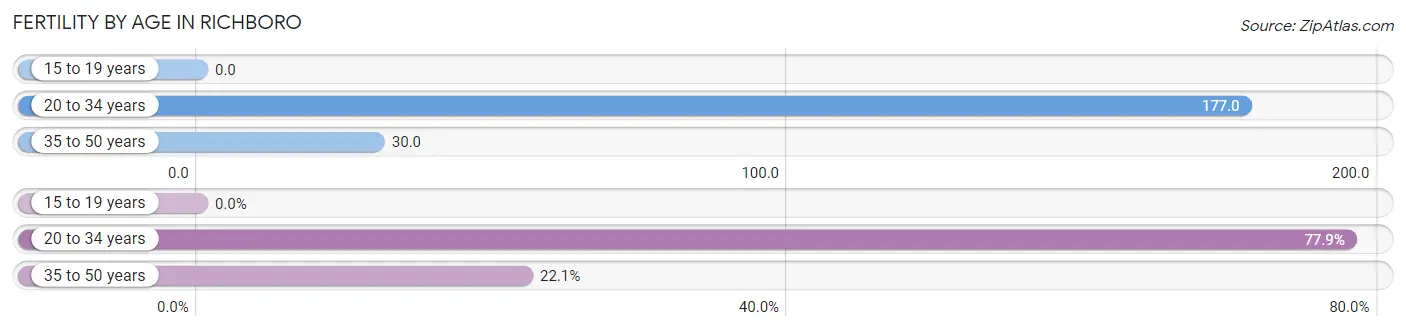
| Age Bracket | Women with Births | Births / 1,000 Women |
| 15 to 19 years | 0 (0.0%) | 0.0 |
| 20 to 34 years | 53 (77.9%) | 177.0 |
| 35 to 50 years | 15 (22.1%) | 30.0 |
| Total | 68 (100.0%) | 74.0 |
Fertility by Age by Marriage Status in Richboro
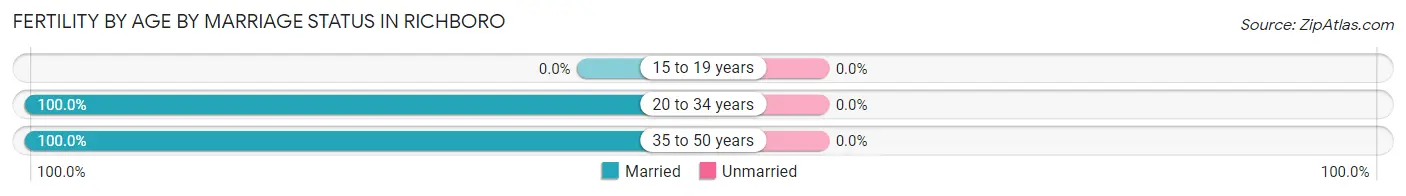
| Age Bracket | Married | Unmarried |
| 15 to 19 years | 0 (0.0%) | 0 (0.0%) |
| 20 to 34 years | 53 (100.0%) | 0 (0.0%) |
| 35 to 50 years | 15 (100.0%) | 0 (0.0%) |
| Total | 68 (100.0%) | 0 (0.0%) |
Fertility by Education in Richboro
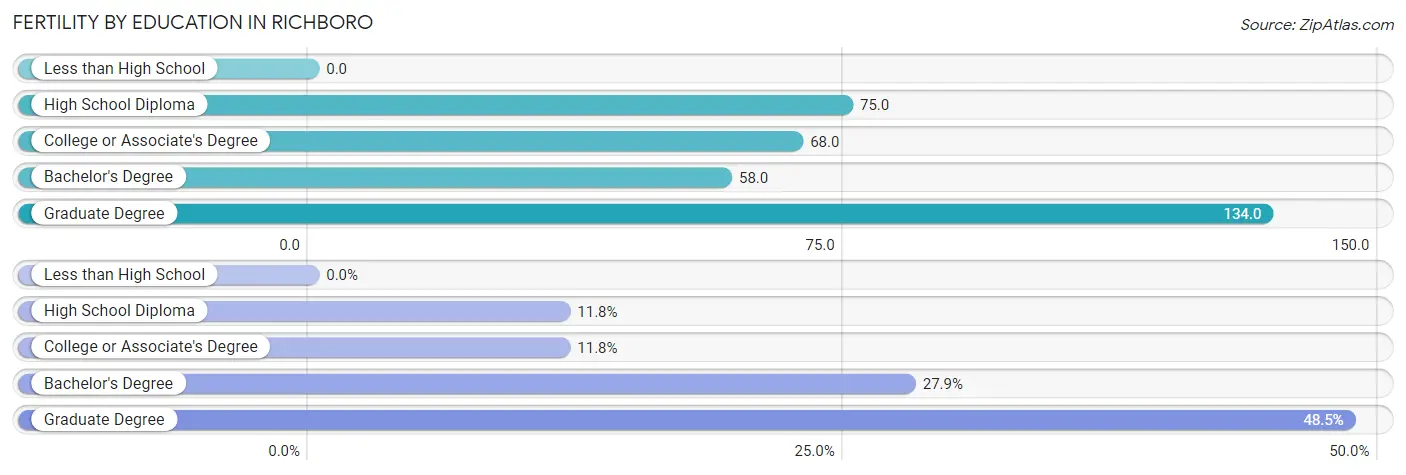
| Educational Attainment | Women with Births | Births / 1,000 Women |
| Less than High School | 0 (0.0%) | 0.0 |
| High School Diploma | 8 (11.8%) | 75.0 |
| College or Associate's Degree | 8 (11.8%) | 68.0 |
| Bachelor's Degree | 19 (27.9%) | 58.0 |
| Graduate Degree | 33 (48.5%) | 134.0 |
| Total | 68 (100.0%) | 74.0 |
Fertility by Education by Marriage Status in Richboro
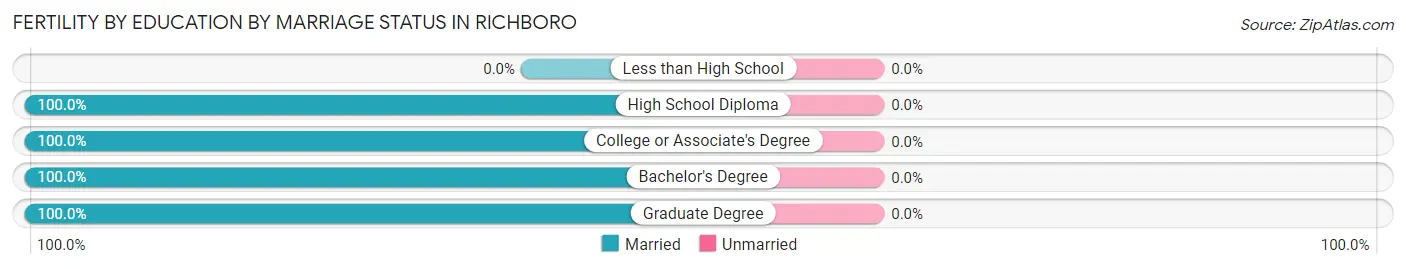
| Educational Attainment | Married | Unmarried |
| Less than High School | 0 (0.0%) | 0 (0.0%) |
| High School Diploma | 8 (100.0%) | 0 (0.0%) |
| College or Associate's Degree | 8 (100.0%) | 0 (0.0%) |
| Bachelor's Degree | 19 (100.0%) | 0 (0.0%) |
| Graduate Degree | 33 (100.0%) | 0 (0.0%) |
| Total | 68 (100.0%) | 0 (0.0%) |
Employment Characteristics in Richboro
Employment by Class of Employer in Richboro
Among the 3,416 employed individuals in Richboro, private company employees (2,025 | 59.3%), local government employees (554 | 16.2%), and not-for-profit organizations (379 | 11.1%) make up the most common classes of employment.
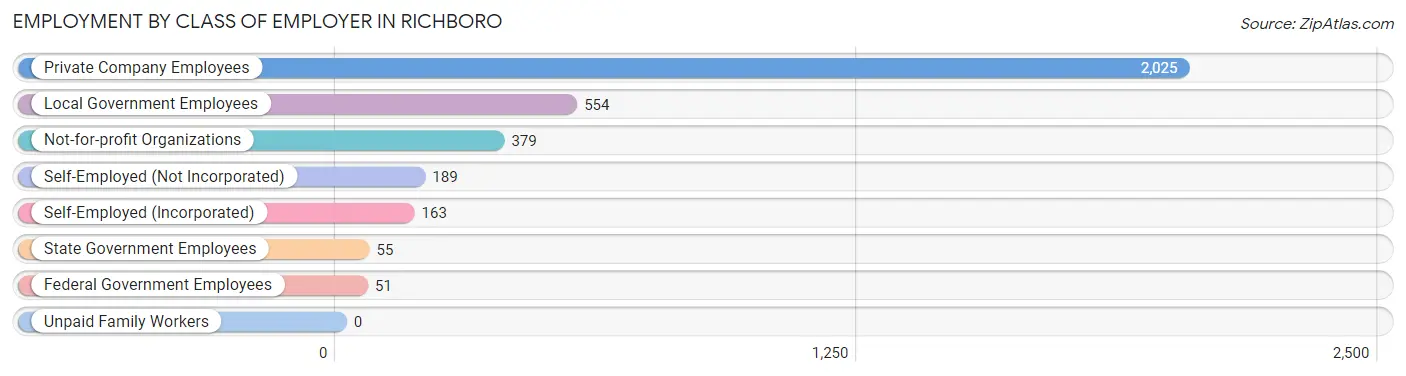
| Employer Class | # Employees | % Employees |
| Private Company Employees | 2,025 | 59.3% |
| Self-Employed (Incorporated) | 163 | 4.8% |
| Self-Employed (Not Incorporated) | 189 | 5.5% |
| Not-for-profit Organizations | 379 | 11.1% |
| Local Government Employees | 554 | 16.2% |
| State Government Employees | 55 | 1.6% |
| Federal Government Employees | 51 | 1.5% |
| Unpaid Family Workers | 0 | 0.0% |
| Total | 3,416 | 100.0% |
Employment Status by Age in Richboro
According to the labor force statistics for Richboro, out of the total population over 16 years of age (5,866), 60.7% or 3,561 individuals are in the labor force, with 3.3% or 118 of them unemployed. The age group with the highest labor force participation rate is 25 to 29 years, with 95.9% or 212 individuals in the labor force. Within the labor force, the 60 to 64 years age range has the highest percentage of unemployed individuals, with 8.8% or 43 of them being unemployed.
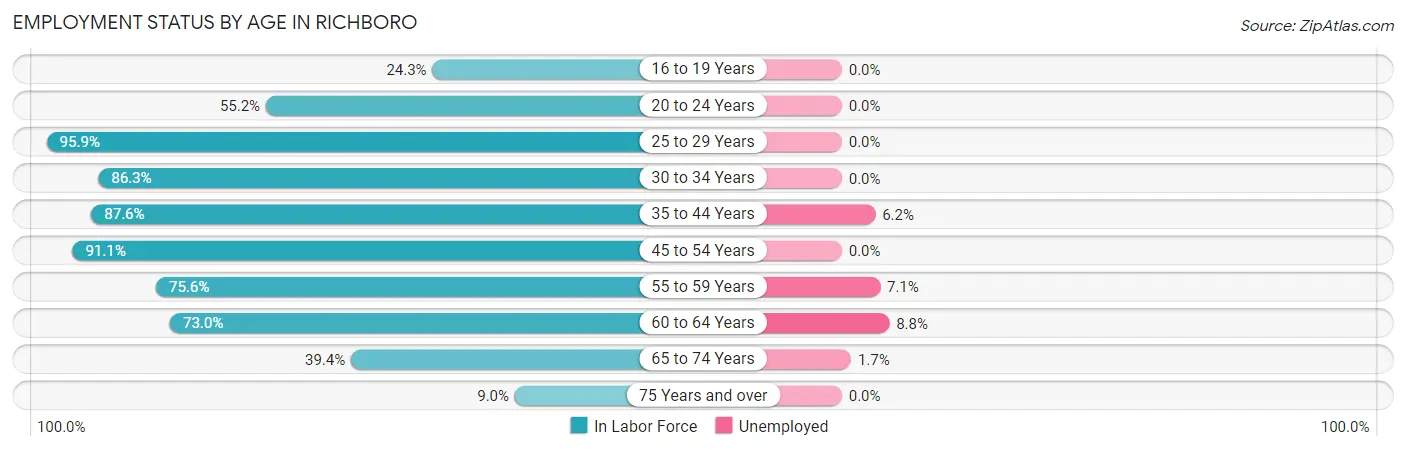
| Age Bracket | In Labor Force | Unemployed |
| 16 to 19 Years | 84 (24.3%) | 0 (0.0%) |
| 20 to 24 Years | 159 (55.2%) | 0 (0.0%) |
| 25 to 29 Years | 212 (95.9%) | 0 (0.0%) |
| 30 to 34 Years | 253 (86.3%) | 0 (0.0%) |
| 35 to 44 Years | 531 (87.6%) | 33 (6.2%) |
| 45 to 54 Years | 731 (91.1%) | 0 (0.0%) |
| 55 to 59 Years | 462 (75.6%) | 33 (7.1%) |
| 60 to 64 Years | 491 (73.0%) | 43 (8.8%) |
| 65 to 74 Years | 587 (39.4%) | 10 (1.7%) |
| 75 Years and over | 48 (9.0%) | 0 (0.0%) |
| Total | 3,561 (60.7%) | 118 (3.3%) |
Employment Status by Educational Attainment in Richboro
According to labor force statistics for Richboro, 83.6% of individuals (2,680) out of the total population between 25 and 64 years of age (3,206) are in the labor force, with 4.1% or 110 of them being unemployed. The group with the highest labor force participation rate are those with the educational attainment of less than high school, with 92.9% or 39 individuals in the labor force. Within the labor force, individuals with college / associate degree education have the highest percentage of unemployment, with 13.9% or 66 of them being unemployed.
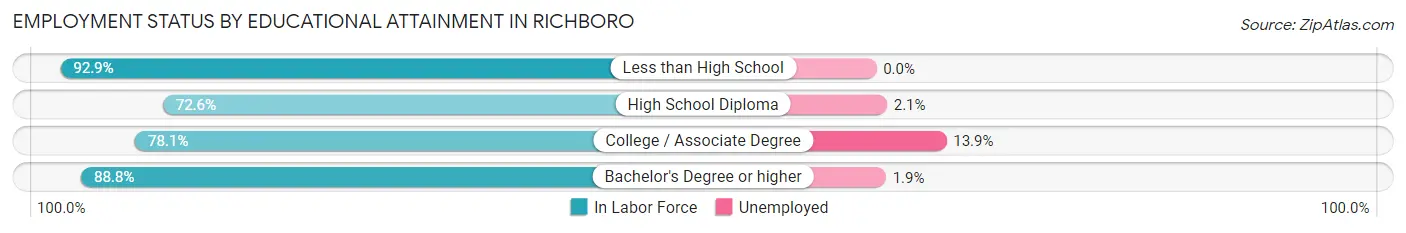
| Educational Attainment | In Labor Force | Unemployed |
| Less than High School | 39 (92.9%) | 0 (0.0%) |
| High School Diploma | 467 (72.6%) | 14 (2.1%) |
| College / Associate Degree | 475 (78.1%) | 85 (13.9%) |
| Bachelor's Degree or higher | 1,699 (88.8%) | 36 (1.9%) |
| Total | 2,680 (83.6%) | 131 (4.1%) |
Employment Occupations by Sex in Richboro
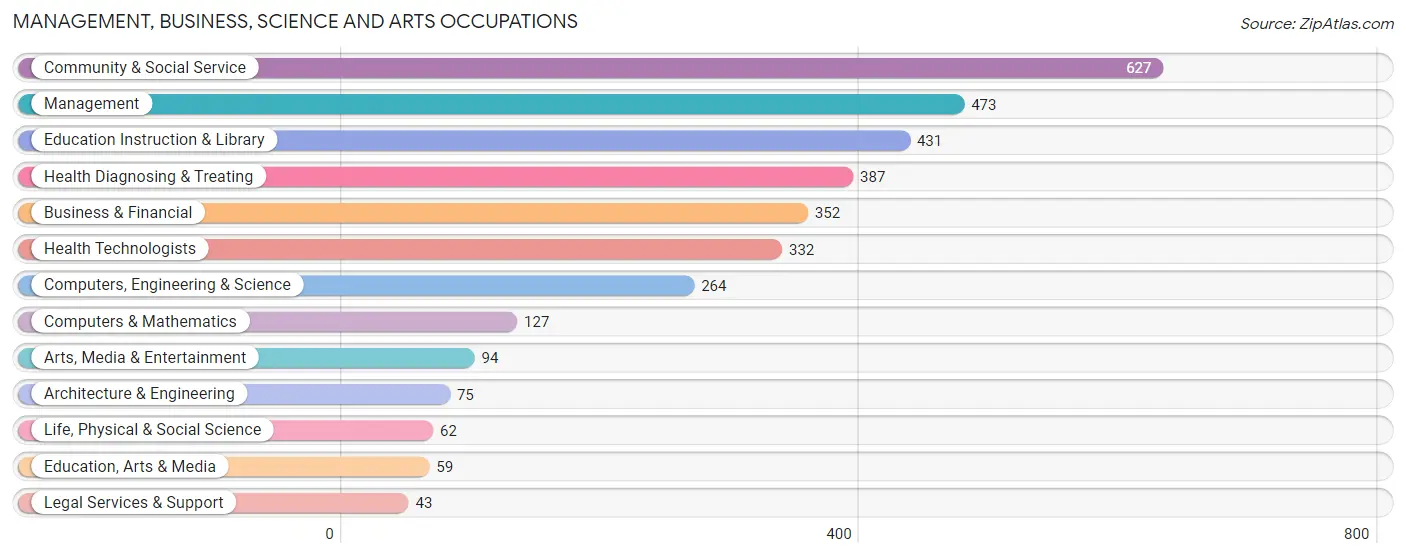
Management, Business, Science and Arts Occupations
The most common Management, Business, Science and Arts occupations in Richboro are Community & Social Service (627 | 18.2%), Management (473 | 13.8%), Education Instruction & Library (431 | 12.6%), Health Diagnosing & Treating (387 | 11.3%), and Business & Financial (352 | 10.2%).
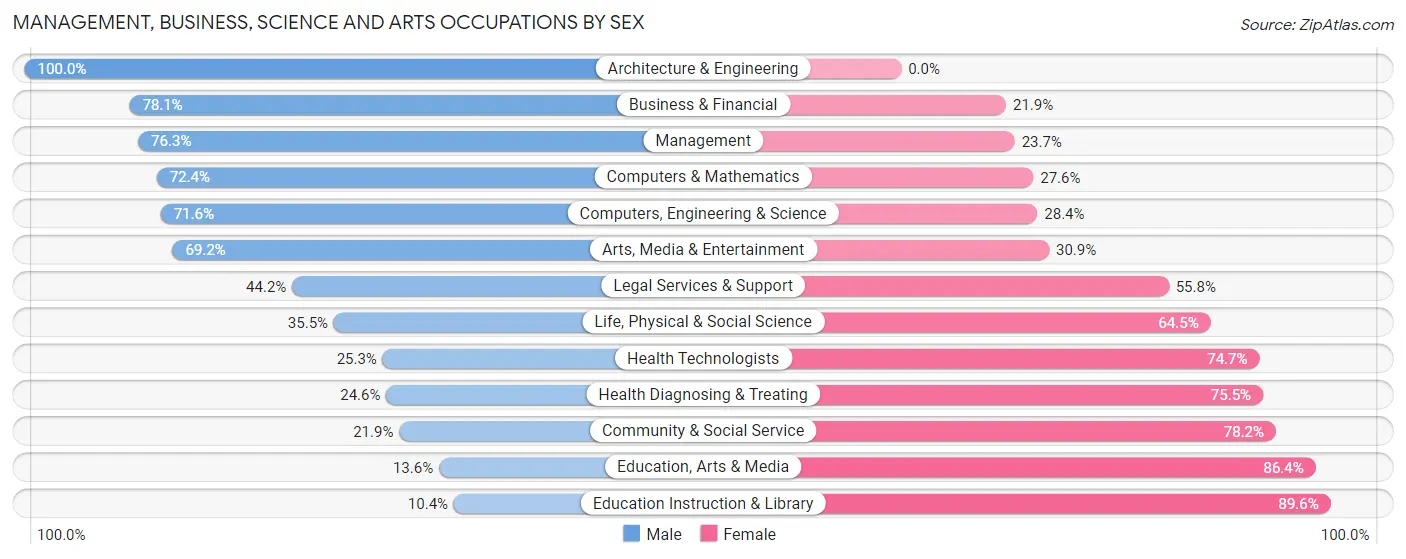
Management, Business, Science and Arts Occupations by Sex
Within the Management, Business, Science and Arts occupations in Richboro, the most male-oriented occupations are Architecture & Engineering (100.0%), Business & Financial (78.1%), and Management (76.3%), while the most female-oriented occupations are Education Instruction & Library (89.6%), Education, Arts & Media (86.4%), and Community & Social Service (78.1%).
| Occupation | Male | Female |
| Management | 361 (76.3%) | 112 (23.7%) |
| Business & Financial | 275 (78.1%) | 77 (21.9%) |
| Computers, Engineering & Science | 189 (71.6%) | 75 (28.4%) |
| Computers & Mathematics | 92 (72.4%) | 35 (27.6%) |
| Architecture & Engineering | 75 (100.0%) | 0 (0.0%) |
| Life, Physical & Social Science | 22 (35.5%) | 40 (64.5%) |
| Community & Social Service | 137 (21.8%) | 490 (78.1%) |
| Education, Arts & Media | 8 (13.6%) | 51 (86.4%) |
| Legal Services & Support | 19 (44.2%) | 24 (55.8%) |
| Education Instruction & Library | 45 (10.4%) | 386 (89.6%) |
| Arts, Media & Entertainment | 65 (69.2%) | 29 (30.8%) |
| Health Diagnosing & Treating | 95 (24.5%) | 292 (75.4%) |
| Health Technologists | 84 (25.3%) | 248 (74.7%) |
| Total (Category) | 1,057 (50.3%) | 1,046 (49.7%) |
| Total (Overall) | 1,927 (56.1%) | 1,508 (43.9%) |
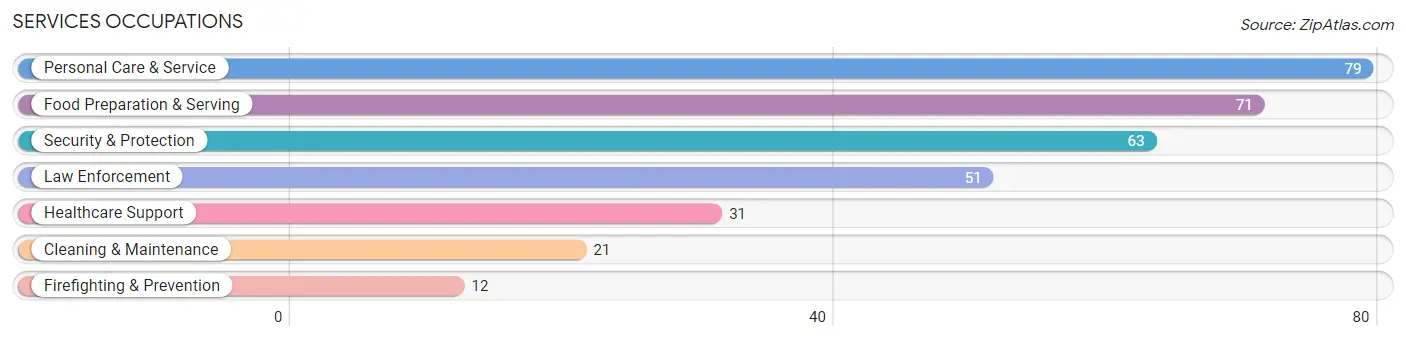
Services Occupations
The most common Services occupations in Richboro are Personal Care & Service (79 | 2.3%), Food Preparation & Serving (71 | 2.1%), Security & Protection (63 | 1.8%), Law Enforcement (51 | 1.5%), and Healthcare Support (31 | 0.9%).
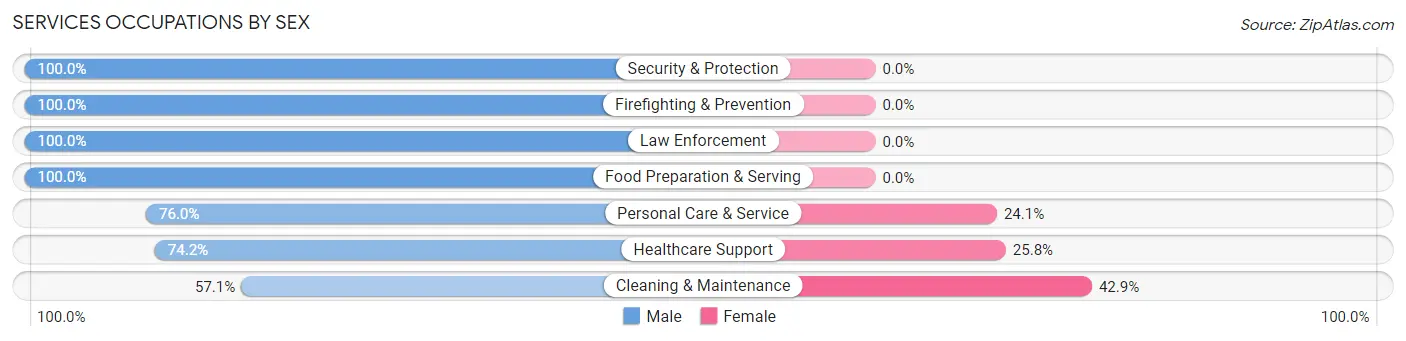
Services Occupations by Sex
Within the Services occupations in Richboro, the most male-oriented occupations are Security & Protection (100.0%), Firefighting & Prevention (100.0%), and Law Enforcement (100.0%), while the most female-oriented occupations are Cleaning & Maintenance (42.9%), Healthcare Support (25.8%), and Personal Care & Service (24.0%).
| Occupation | Male | Female |
| Healthcare Support | 23 (74.2%) | 8 (25.8%) |
| Security & Protection | 63 (100.0%) | 0 (0.0%) |
| Firefighting & Prevention | 12 (100.0%) | 0 (0.0%) |
| Law Enforcement | 51 (100.0%) | 0 (0.0%) |
| Food Preparation & Serving | 71 (100.0%) | 0 (0.0%) |
| Cleaning & Maintenance | 12 (57.1%) | 9 (42.9%) |
| Personal Care & Service | 60 (75.9%) | 19 (24.0%) |
| Total (Category) | 229 (86.4%) | 36 (13.6%) |
| Total (Overall) | 1,927 (56.1%) | 1,508 (43.9%) |
Sales and Office Occupations
The most common Sales and Office occupations in Richboro are Sales & Related (347 | 10.1%), and Office & Administration (330 | 9.6%).
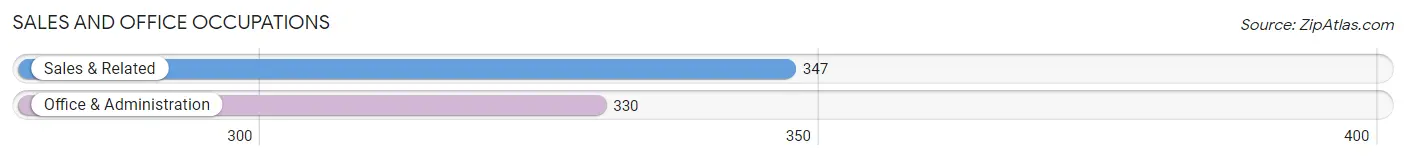
Sales and Office Occupations by Sex
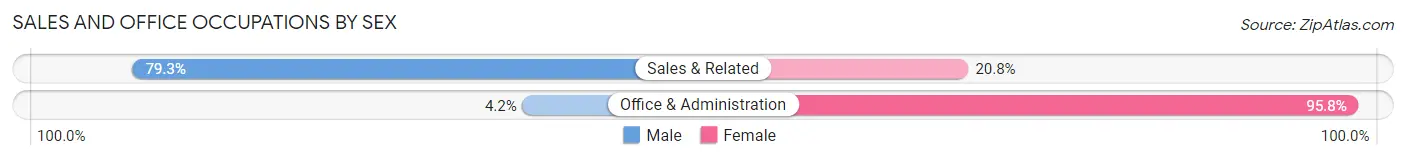
| Occupation | Male | Female |
| Sales & Related | 275 (79.2%) | 72 (20.7%) |
| Office & Administration | 14 (4.2%) | 316 (95.8%) |
| Total (Category) | 289 (42.7%) | 388 (57.3%) |
| Total (Overall) | 1,927 (56.1%) | 1,508 (43.9%) |
Natural Resources, Construction and Maintenance Occupations
The most common Natural Resources, Construction and Maintenance occupations in Richboro are Installation, Maintenance & Repair (91 | 2.6%), and Construction & Extraction (71 | 2.1%).
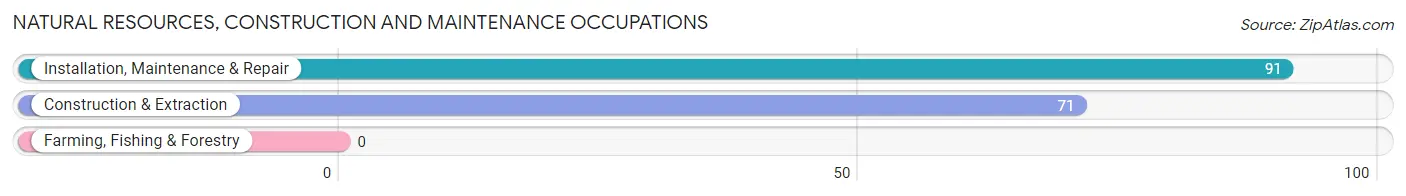
Natural Resources, Construction and Maintenance Occupations by Sex
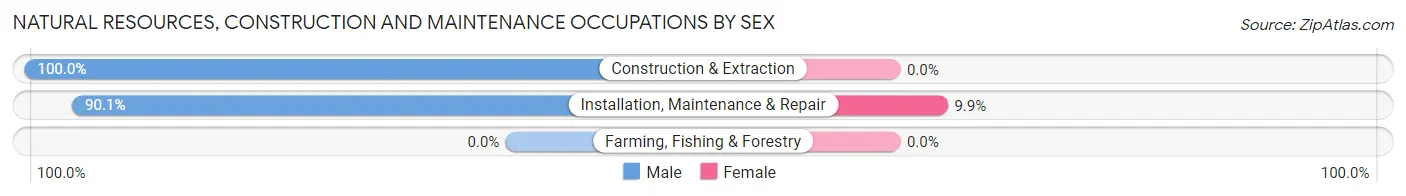
| Occupation | Male | Female |
| Farming, Fishing & Forestry | 0 (0.0%) | 0 (0.0%) |
| Construction & Extraction | 71 (100.0%) | 0 (0.0%) |
| Installation, Maintenance & Repair | 82 (90.1%) | 9 (9.9%) |
| Total (Category) | 153 (94.4%) | 9 (5.6%) |
| Total (Overall) | 1,927 (56.1%) | 1,508 (43.9%) |
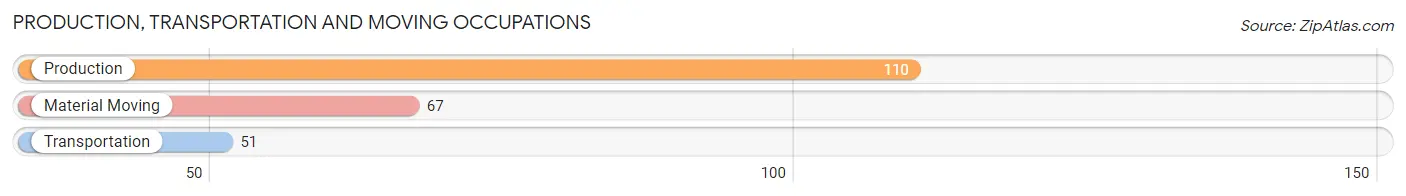
Production, Transportation and Moving Occupations
The most common Production, Transportation and Moving occupations in Richboro are Production (110 | 3.2%), Material Moving (67 | 1.9%), and Transportation (51 | 1.5%).
Production, Transportation and Moving Occupations by Sex
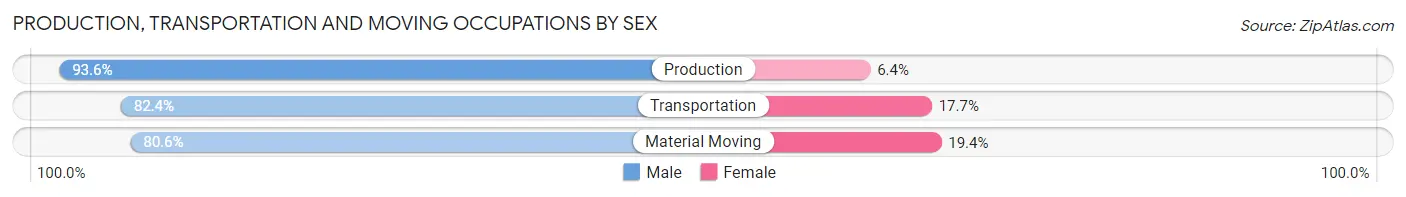
| Occupation | Male | Female |
| Production | 103 (93.6%) | 7 (6.4%) |
| Transportation | 42 (82.4%) | 9 (17.6%) |
| Material Moving | 54 (80.6%) | 13 (19.4%) |
| Total (Category) | 199 (87.3%) | 29 (12.7%) |
| Total (Overall) | 1,927 (56.1%) | 1,508 (43.9%) |
Employment Industries by Sex in Richboro
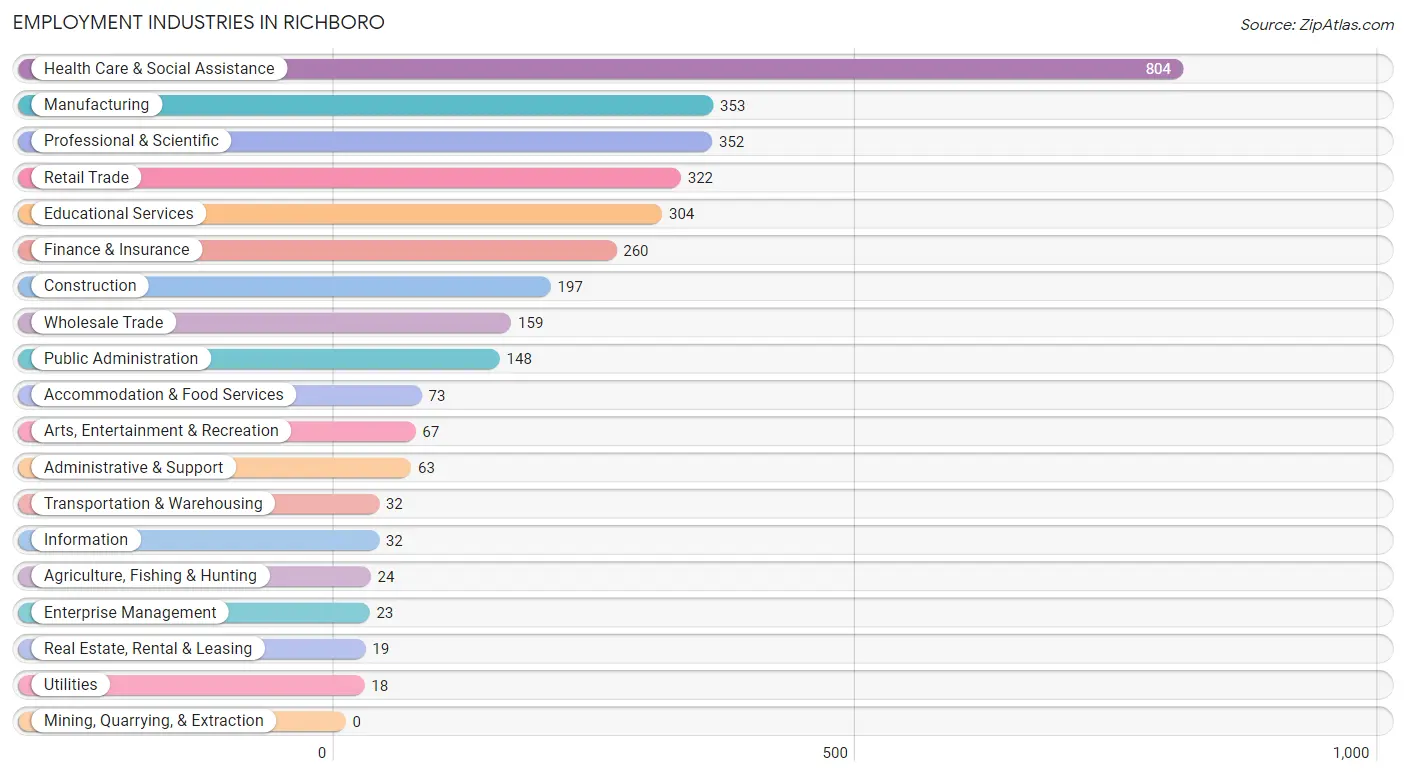
Employment Industries in Richboro
The major employment industries in Richboro include Health Care & Social Assistance (804 | 23.4%), Manufacturing (353 | 10.3%), Professional & Scientific (352 | 10.2%), Retail Trade (322 | 9.4%), and Educational Services (304 | 8.8%).
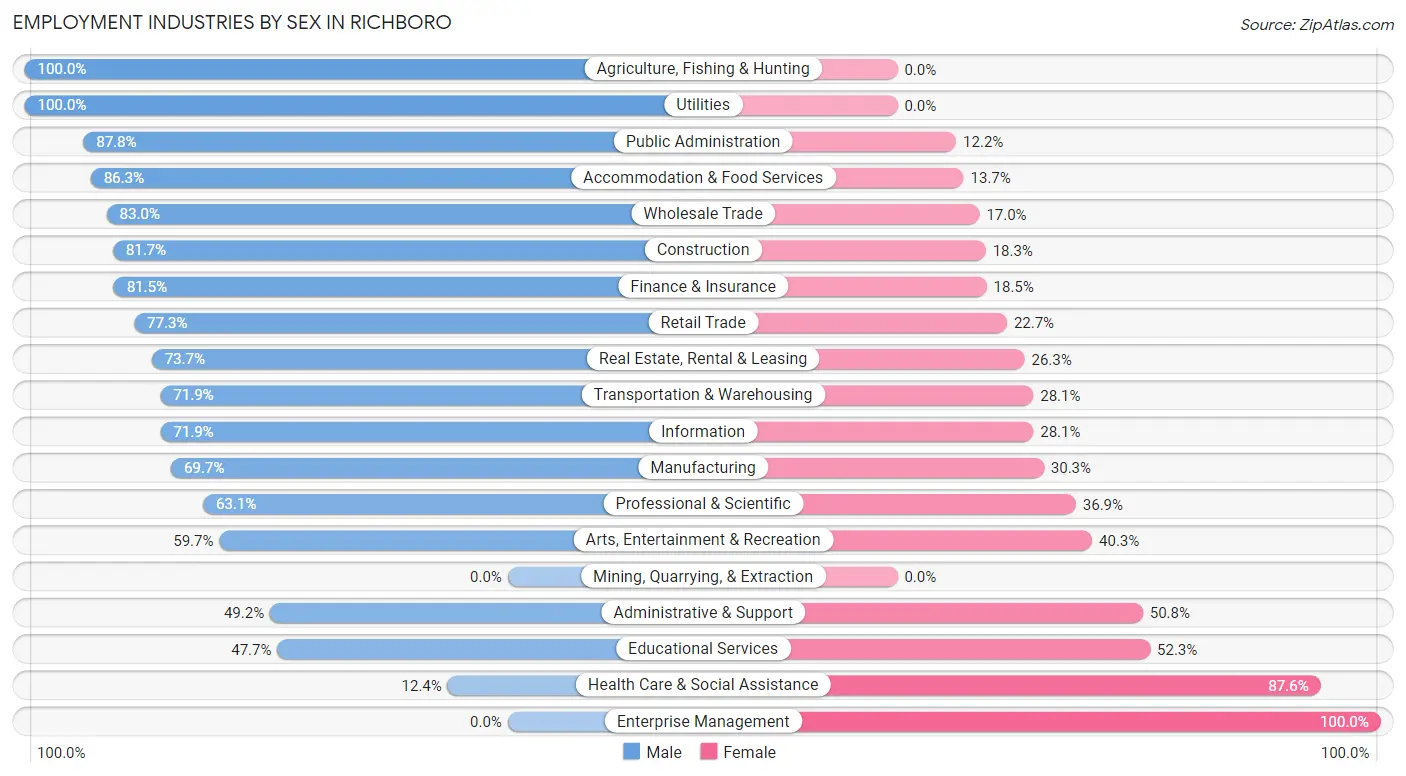
Employment Industries by Sex in Richboro
The Richboro industries that see more men than women are Agriculture, Fishing & Hunting (100.0%), Utilities (100.0%), and Public Administration (87.8%), whereas the industries that tend to have a higher number of women are Enterprise Management (100.0%), Health Care & Social Assistance (87.6%), and Educational Services (52.3%).
| Industry | Male | Female |
| Agriculture, Fishing & Hunting | 24 (100.0%) | 0 (0.0%) |
| Mining, Quarrying, & Extraction | 0 (0.0%) | 0 (0.0%) |
| Construction | 161 (81.7%) | 36 (18.3%) |
| Manufacturing | 246 (69.7%) | 107 (30.3%) |
| Wholesale Trade | 132 (83.0%) | 27 (17.0%) |
| Retail Trade | 249 (77.3%) | 73 (22.7%) |
| Transportation & Warehousing | 23 (71.9%) | 9 (28.1%) |
| Utilities | 18 (100.0%) | 0 (0.0%) |
| Information | 23 (71.9%) | 9 (28.1%) |
| Finance & Insurance | 212 (81.5%) | 48 (18.5%) |
| Real Estate, Rental & Leasing | 14 (73.7%) | 5 (26.3%) |
| Professional & Scientific | 222 (63.1%) | 130 (36.9%) |
| Enterprise Management | 0 (0.0%) | 23 (100.0%) |
| Administrative & Support | 31 (49.2%) | 32 (50.8%) |
| Educational Services | 145 (47.7%) | 159 (52.3%) |
| Health Care & Social Assistance | 100 (12.4%) | 704 (87.6%) |
| Arts, Entertainment & Recreation | 40 (59.7%) | 27 (40.3%) |
| Accommodation & Food Services | 63 (86.3%) | 10 (13.7%) |
| Public Administration | 130 (87.8%) | 18 (12.2%) |
| Total | 1,927 (56.1%) | 1,508 (43.9%) |
Education in Richboro
School Enrollment in Richboro
The most common levels of schooling among the 1,475 students in Richboro are high school (462 | 31.3%), middle school (259 | 17.6%), and college / undergraduate (235 | 15.9%).

| School Level | # Students | % Students |
| Nursery / Preschool | 157 | 10.6% |
| Kindergarten | 42 | 2.9% |
| Elementary School | 197 | 13.4% |
| Middle School | 259 | 17.6% |
| High School | 462 | 31.3% |
| College / Undergraduate | 235 | 15.9% |
| Graduate / Professional | 123 | 8.3% |
| Total | 1,475 | 100.0% |
School Enrollment by Age by Funding Source in Richboro
Out of a total of 1,475 students who are enrolled in schools in Richboro, 271 (18.4%) attend a private institution, while the remaining 1,204 (81.6%) are enrolled in public schools. The age group of 25 to 34 year olds has the highest likelihood of being enrolled in private schools, with 55 (80.9% in the age bracket) enrolled. Conversely, the age group of 15 to 17 year olds has the lowest likelihood of being enrolled in a private school, with 297 (96.7% in the age bracket) attending a public institution.
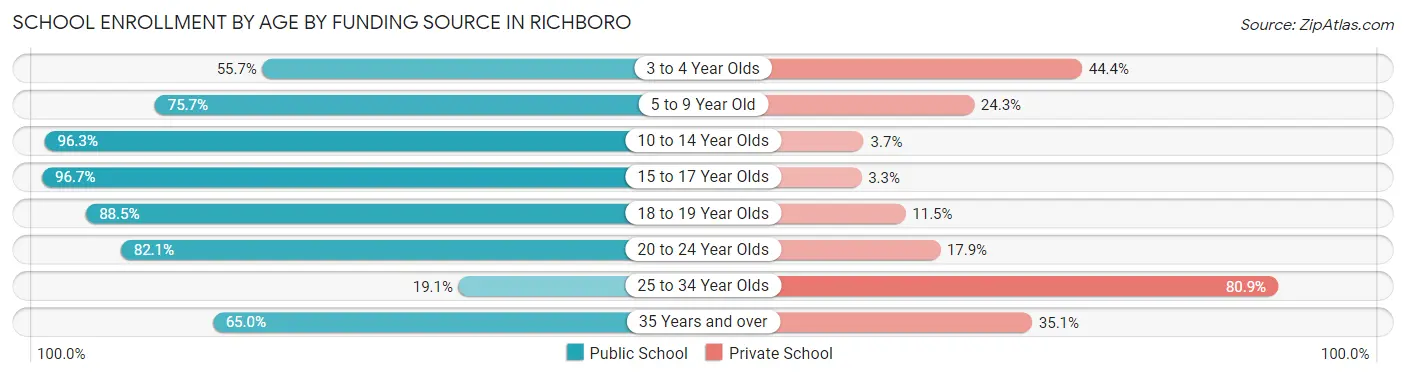
| Age Bracket | Public School | Private School |
| 3 to 4 Year Olds | 64 (55.6%) | 51 (44.4%) |
| 5 to 9 Year Old | 206 (75.7%) | 66 (24.3%) |
| 10 to 14 Year Olds | 311 (96.3%) | 12 (3.7%) |
| 15 to 17 Year Olds | 297 (96.7%) | 10 (3.3%) |
| 18 to 19 Year Olds | 131 (88.5%) | 17 (11.5%) |
| 20 to 24 Year Olds | 119 (82.1%) | 26 (17.9%) |
| 25 to 34 Year Olds | 13 (19.1%) | 55 (80.9%) |
| 35 Years and over | 63 (64.9%) | 34 (35.0%) |
| Total | 1,204 (81.6%) | 271 (18.4%) |
Educational Attainment by Field of Study in Richboro
Business (612 | 19.2%), education (580 | 18.1%), science & technology (377 | 11.8%), physical & health sciences (342 | 10.7%), and bio, nature & agricultural (285 | 8.9%) are the most common fields of study among 3,196 individuals in Richboro who have obtained a bachelor's degree or higher.
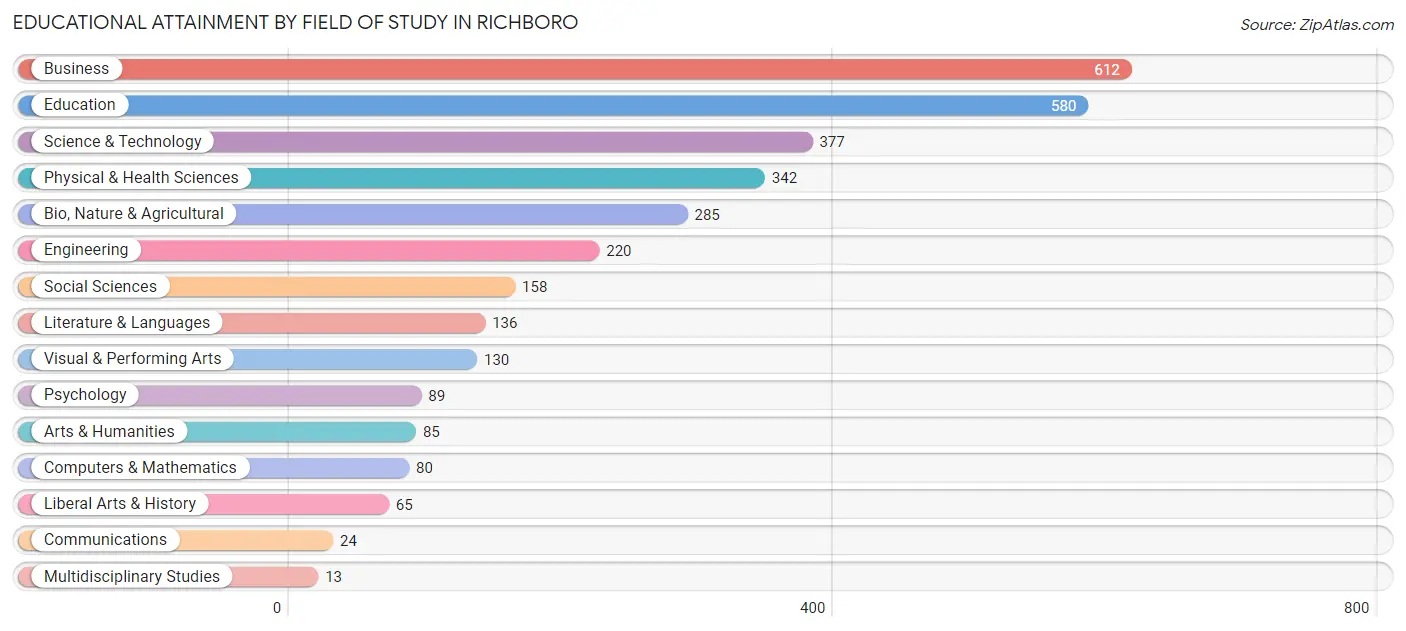
| Field of Study | # Graduates | % Graduates |
| Computers & Mathematics | 80 | 2.5% |
| Bio, Nature & Agricultural | 285 | 8.9% |
| Physical & Health Sciences | 342 | 10.7% |
| Psychology | 89 | 2.8% |
| Social Sciences | 158 | 4.9% |
| Engineering | 220 | 6.9% |
| Multidisciplinary Studies | 13 | 0.4% |
| Science & Technology | 377 | 11.8% |
| Business | 612 | 19.2% |
| Education | 580 | 18.1% |
| Literature & Languages | 136 | 4.3% |
| Liberal Arts & History | 65 | 2.0% |
| Visual & Performing Arts | 130 | 4.1% |
| Communications | 24 | 0.7% |
| Arts & Humanities | 85 | 2.7% |
| Total | 3,196 | 100.0% |
Transportation & Commute in Richboro
Vehicle Availability by Sex in Richboro
The most prevalent vehicle ownership categories in Richboro are males with 2 vehicles (874, accounting for 45.4%) and females with 2 vehicles (882, making up 58.7%).
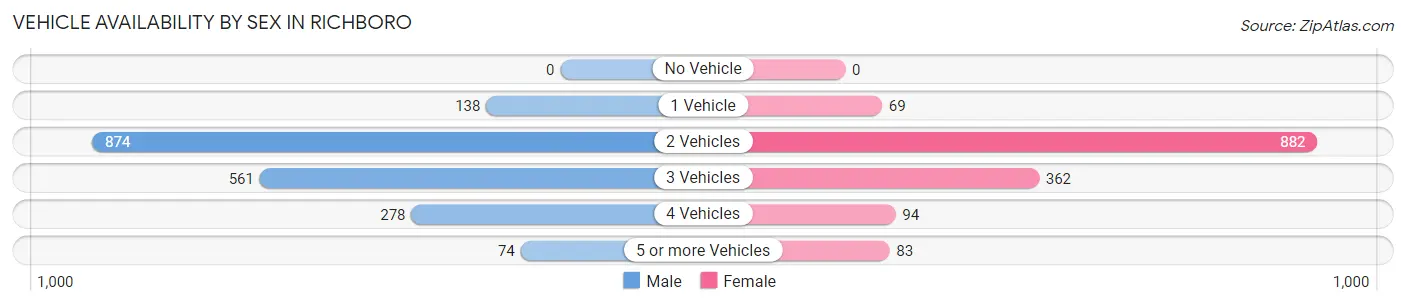
| Vehicles Available | Male | Female |
| No Vehicle | 0 (0.0%) | 0 (0.0%) |
| 1 Vehicle | 138 (7.2%) | 69 (4.6%) |
| 2 Vehicles | 874 (45.4%) | 882 (59.2%) |
| 3 Vehicles | 561 (29.1%) | 362 (24.3%) |
| 4 Vehicles | 278 (14.4%) | 94 (6.3%) |
| 5 or more Vehicles | 74 (3.8%) | 83 (5.6%) |
| Total | 1,925 (100.0%) | 1,490 (100.0%) |
Commute Time in Richboro
The most frequently occuring commute durations in Richboro are 5 to 9 minutes (469 commuters, 16.5%), 30 to 34 minutes (400 commuters, 14.1%), and 60 to 89 minutes (333 commuters, 11.7%).
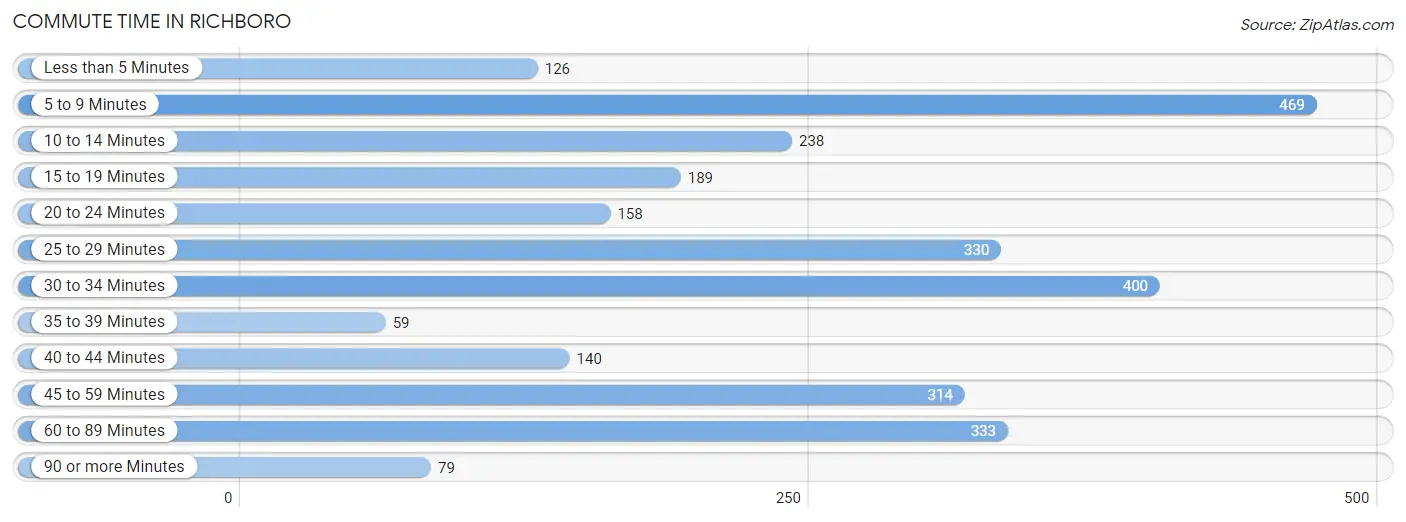
| Commute Time | # Commuters | % Commuters |
| Less than 5 Minutes | 126 | 4.4% |
| 5 to 9 Minutes | 469 | 16.5% |
| 10 to 14 Minutes | 238 | 8.4% |
| 15 to 19 Minutes | 189 | 6.7% |
| 20 to 24 Minutes | 158 | 5.6% |
| 25 to 29 Minutes | 330 | 11.6% |
| 30 to 34 Minutes | 400 | 14.1% |
| 35 to 39 Minutes | 59 | 2.1% |
| 40 to 44 Minutes | 140 | 4.9% |
| 45 to 59 Minutes | 314 | 11.1% |
| 60 to 89 Minutes | 333 | 11.7% |
| 90 or more Minutes | 79 | 2.8% |
Commute Time by Sex in Richboro
The most common commute times in Richboro are 30 to 34 minutes (254 commuters, 16.6%) for males and 5 to 9 minutes (336 commuters, 25.8%) for females.
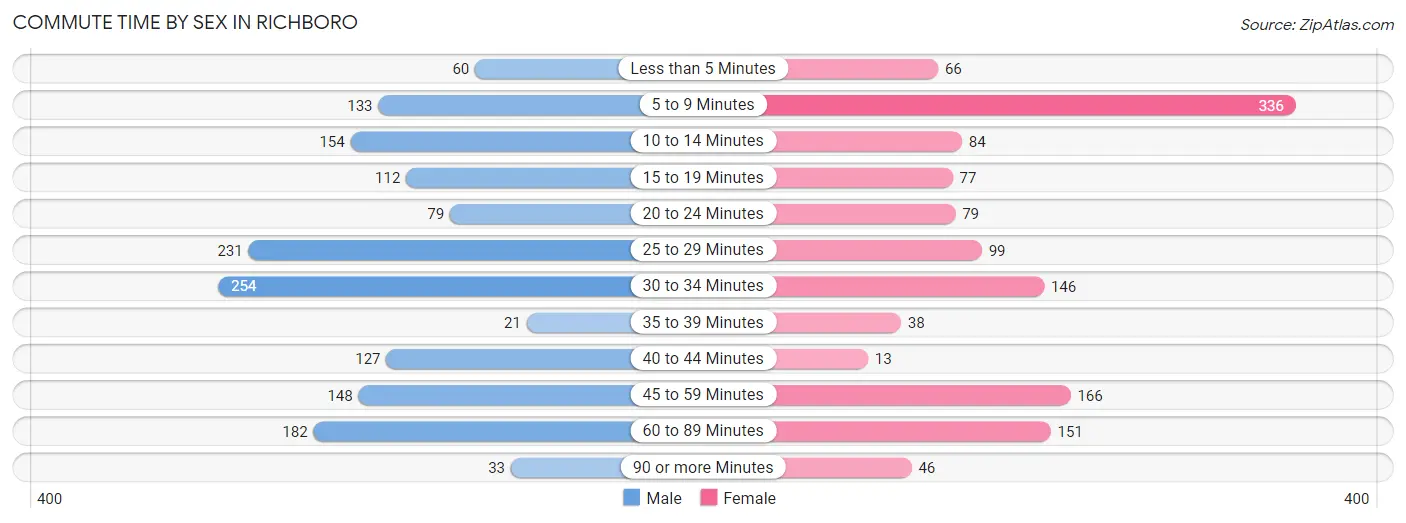
| Commute Time | Male | Female |
| Less than 5 Minutes | 60 (3.9%) | 66 (5.1%) |
| 5 to 9 Minutes | 133 (8.7%) | 336 (25.8%) |
| 10 to 14 Minutes | 154 (10.0%) | 84 (6.5%) |
| 15 to 19 Minutes | 112 (7.3%) | 77 (5.9%) |
| 20 to 24 Minutes | 79 (5.1%) | 79 (6.1%) |
| 25 to 29 Minutes | 231 (15.1%) | 99 (7.6%) |
| 30 to 34 Minutes | 254 (16.6%) | 146 (11.2%) |
| 35 to 39 Minutes | 21 (1.4%) | 38 (2.9%) |
| 40 to 44 Minutes | 127 (8.3%) | 13 (1.0%) |
| 45 to 59 Minutes | 148 (9.7%) | 166 (12.8%) |
| 60 to 89 Minutes | 182 (11.9%) | 151 (11.6%) |
| 90 or more Minutes | 33 (2.1%) | 46 (3.5%) |
Time of Departure to Work by Sex in Richboro
The most frequent times of departure to work in Richboro are 6:30 AM to 6:59 AM (322, 21.0%) for males and 7:00 AM to 7:29 AM (401, 30.8%) for females.
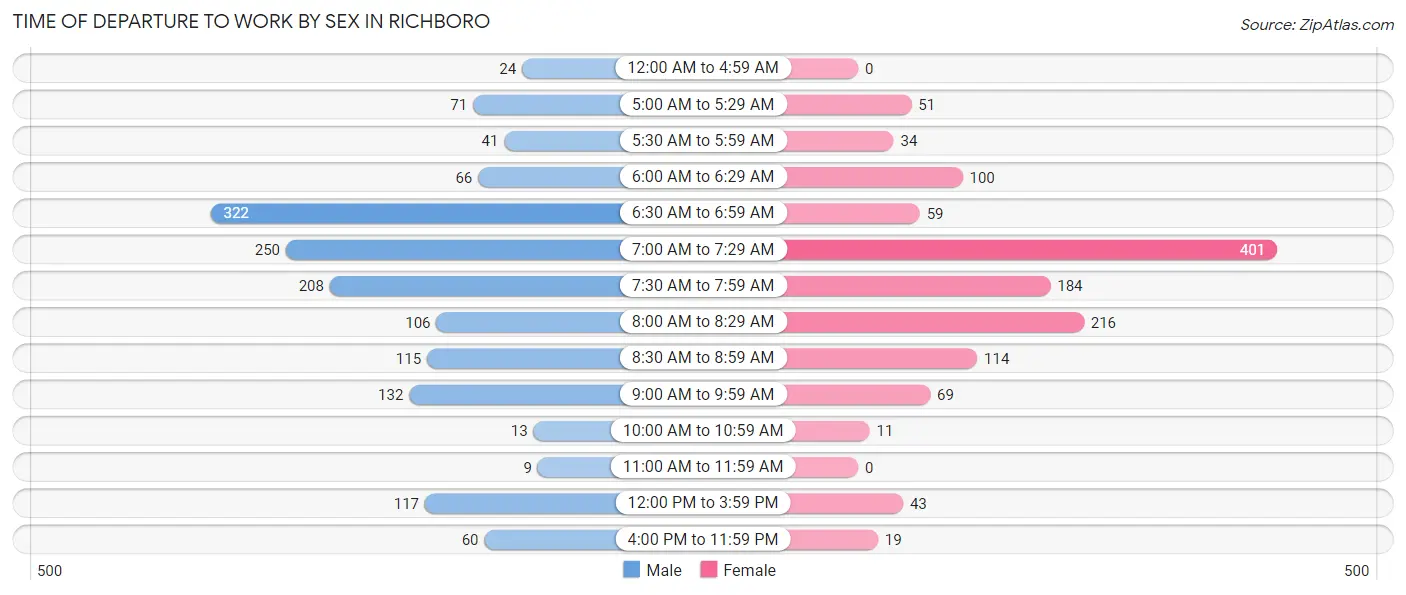
| Time of Departure | Male | Female |
| 12:00 AM to 4:59 AM | 24 (1.6%) | 0 (0.0%) |
| 5:00 AM to 5:29 AM | 71 (4.6%) | 51 (3.9%) |
| 5:30 AM to 5:59 AM | 41 (2.7%) | 34 (2.6%) |
| 6:00 AM to 6:29 AM | 66 (4.3%) | 100 (7.7%) |
| 6:30 AM to 6:59 AM | 322 (21.0%) | 59 (4.5%) |
| 7:00 AM to 7:29 AM | 250 (16.3%) | 401 (30.8%) |
| 7:30 AM to 7:59 AM | 208 (13.6%) | 184 (14.1%) |
| 8:00 AM to 8:29 AM | 106 (6.9%) | 216 (16.6%) |
| 8:30 AM to 8:59 AM | 115 (7.5%) | 114 (8.8%) |
| 9:00 AM to 9:59 AM | 132 (8.6%) | 69 (5.3%) |
| 10:00 AM to 10:59 AM | 13 (0.9%) | 11 (0.9%) |
| 11:00 AM to 11:59 AM | 9 (0.6%) | 0 (0.0%) |
| 12:00 PM to 3:59 PM | 117 (7.6%) | 43 (3.3%) |
| 4:00 PM to 11:59 PM | 60 (3.9%) | 19 (1.5%) |
| Total | 1,534 (100.0%) | 1,301 (100.0%) |
Housing Occupancy in Richboro
Occupancy by Ownership in Richboro
Of the total 2,581 dwellings in Richboro, owner-occupied units account for 2,519 (97.6%), while renter-occupied units make up 62 (2.4%).
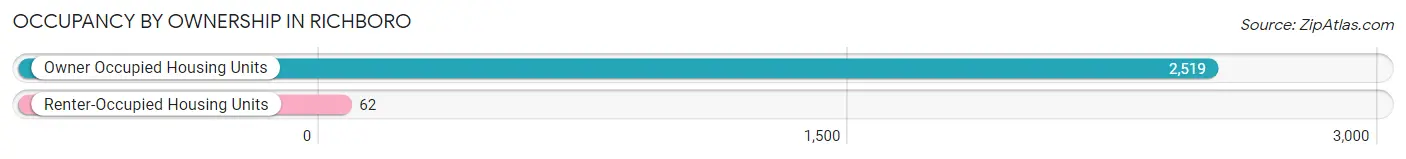
| Occupancy | # Housing Units | % Housing Units |
| Owner Occupied Housing Units | 2,519 | 97.6% |
| Renter-Occupied Housing Units | 62 | 2.4% |
| Total Occupied Housing Units | 2,581 | 100.0% |
Occupancy by Household Size in Richboro
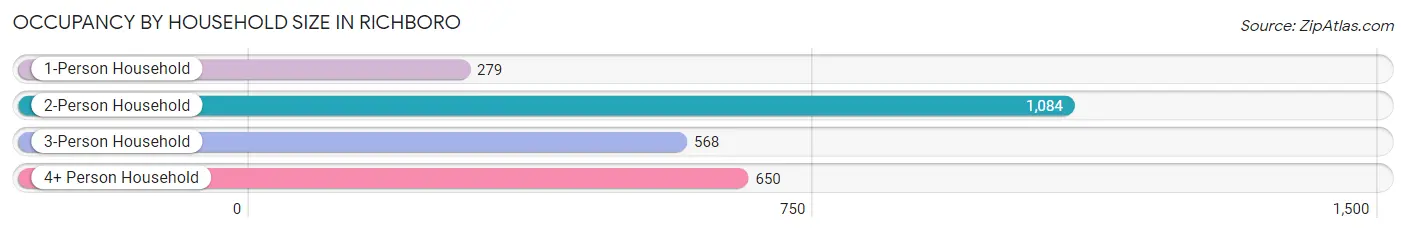
| Household Size | # Housing Units | % Housing Units |
| 1-Person Household | 279 | 10.8% |
| 2-Person Household | 1,084 | 42.0% |
| 3-Person Household | 568 | 22.0% |
| 4+ Person Household | 650 | 25.2% |
| Total Housing Units | 2,581 | 100.0% |
Occupancy by Ownership by Household Size in Richboro
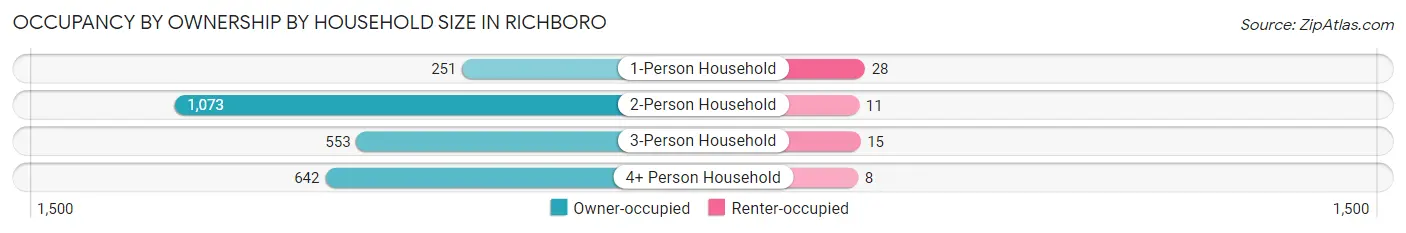
| Household Size | Owner-occupied | Renter-occupied |
| 1-Person Household | 251 (90.0%) | 28 (10.0%) |
| 2-Person Household | 1,073 (99.0%) | 11 (1.0%) |
| 3-Person Household | 553 (97.4%) | 15 (2.6%) |
| 4+ Person Household | 642 (98.8%) | 8 (1.2%) |
| Total Housing Units | 2,519 (97.6%) | 62 (2.4%) |
Occupancy by Educational Attainment in Richboro
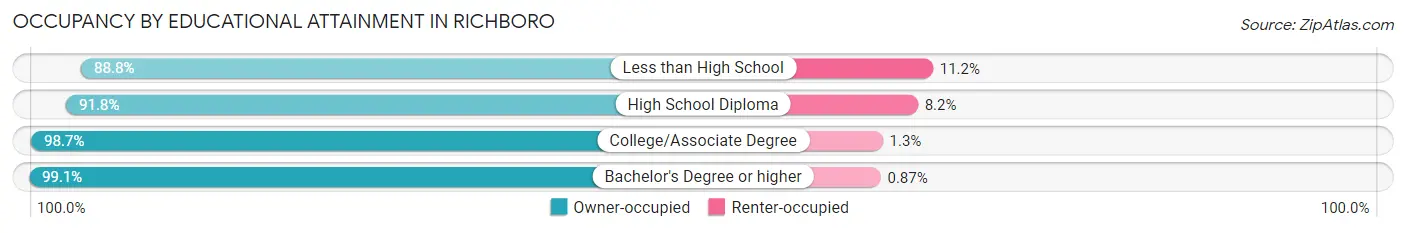
| Household Size | Owner-occupied | Renter-occupied |
| Less than High School | 87 (88.8%) | 11 (11.2%) |
| High School Diploma | 345 (91.8%) | 31 (8.2%) |
| College/Associate Degree | 387 (98.7%) | 5 (1.3%) |
| Bachelor's Degree or higher | 1,700 (99.1%) | 15 (0.9%) |
Occupancy by Age of Householder in Richboro
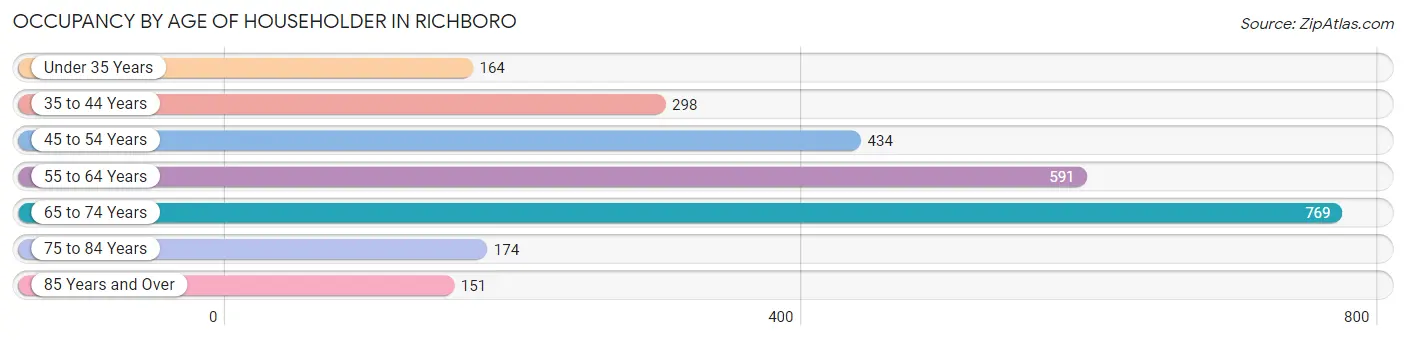
| Age Bracket | # Households | % Households |
| Under 35 Years | 164 | 6.4% |
| 35 to 44 Years | 298 | 11.6% |
| 45 to 54 Years | 434 | 16.8% |
| 55 to 64 Years | 591 | 22.9% |
| 65 to 74 Years | 769 | 29.8% |
| 75 to 84 Years | 174 | 6.7% |
| 85 Years and Over | 151 | 5.9% |
| Total | 2,581 | 100.0% |
Housing Finances in Richboro
Median Income by Occupancy in Richboro
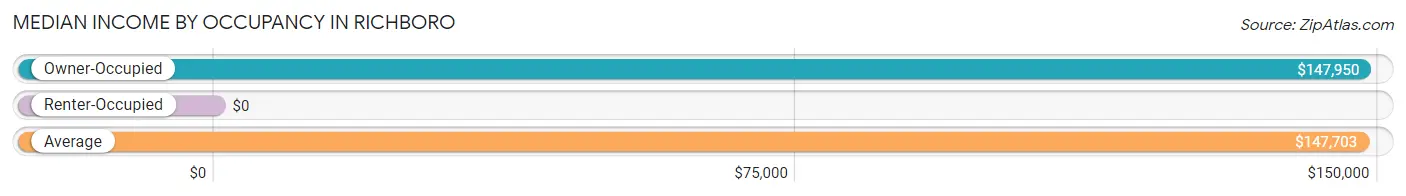
| Occupancy Type | # Households | Median Income |
| Owner-Occupied | 2,519 (97.6%) | $147,950 |
| Renter-Occupied | 62 (2.4%) | $0 |
| Average | 2,581 (100.0%) | $147,703 |
Occupancy by Householder Income Bracket in Richboro
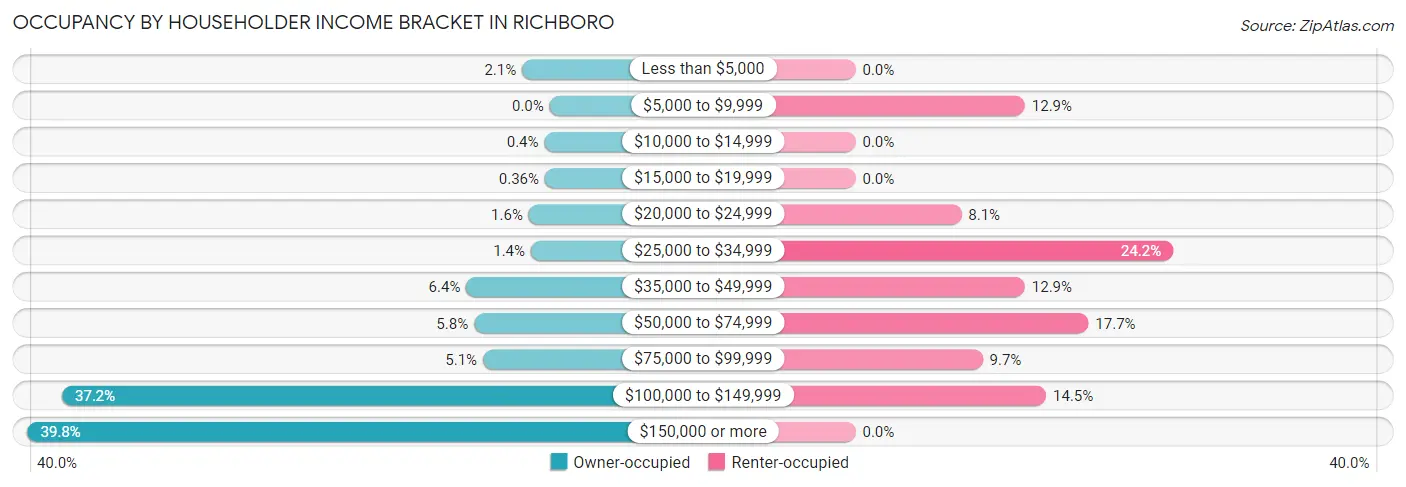
| Income Bracket | Owner-occupied | Renter-occupied |
| Less than $5,000 | 53 (2.1%) | 0 (0.0%) |
| $5,000 to $9,999 | 0 (0.0%) | 8 (12.9%) |
| $10,000 to $14,999 | 10 (0.4%) | 0 (0.0%) |
| $15,000 to $19,999 | 9 (0.4%) | 0 (0.0%) |
| $20,000 to $24,999 | 40 (1.6%) | 5 (8.1%) |
| $25,000 to $34,999 | 36 (1.4%) | 15 (24.2%) |
| $35,000 to $49,999 | 160 (6.4%) | 8 (12.9%) |
| $50,000 to $74,999 | 145 (5.8%) | 11 (17.7%) |
| $75,000 to $99,999 | 128 (5.1%) | 6 (9.7%) |
| $100,000 to $149,999 | 936 (37.2%) | 9 (14.5%) |
| $150,000 or more | 1,002 (39.8%) | 0 (0.0%) |
| Total | 2,519 (100.0%) | 62 (100.0%) |
Monthly Housing Cost Tiers in Richboro
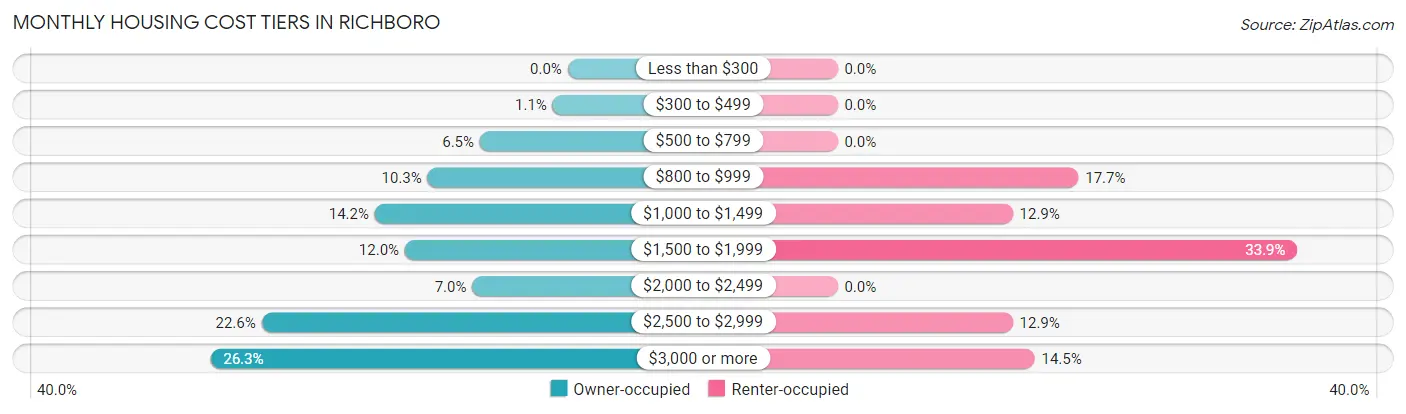
| Monthly Cost | Owner-occupied | Renter-occupied |
| Less than $300 | 0 (0.0%) | 0 (0.0%) |
| $300 to $499 | 28 (1.1%) | 0 (0.0%) |
| $500 to $799 | 163 (6.5%) | 0 (0.0%) |
| $800 to $999 | 260 (10.3%) | 11 (17.7%) |
| $1,000 to $1,499 | 358 (14.2%) | 8 (12.9%) |
| $1,500 to $1,999 | 302 (12.0%) | 21 (33.9%) |
| $2,000 to $2,499 | 177 (7.0%) | 0 (0.0%) |
| $2,500 to $2,999 | 568 (22.6%) | 8 (12.9%) |
| $3,000 or more | 663 (26.3%) | 9 (14.5%) |
| Total | 2,519 (100.0%) | 62 (100.0%) |
Physical Housing Characteristics in Richboro
Housing Structures in Richboro
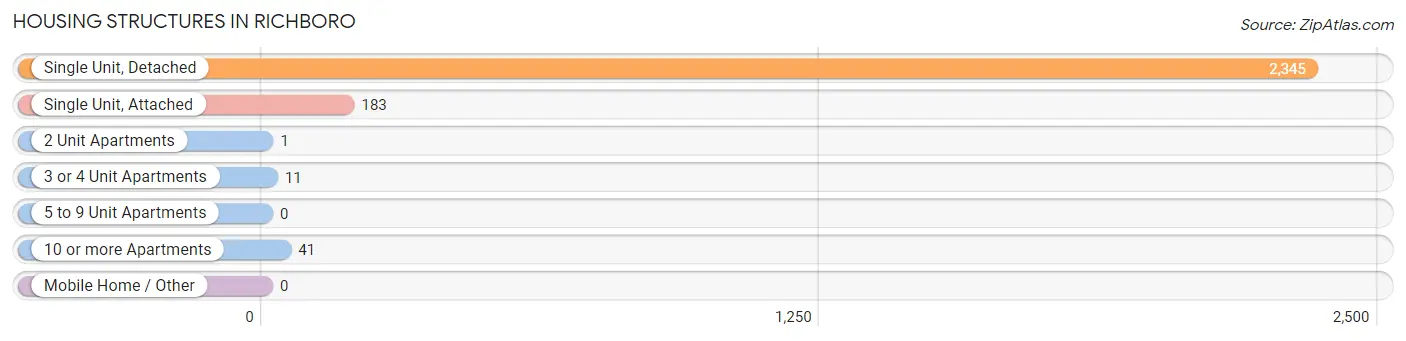
| Structure Type | # Housing Units | % Housing Units |
| Single Unit, Detached | 2,345 | 90.9% |
| Single Unit, Attached | 183 | 7.1% |
| 2 Unit Apartments | 1 | 0.0% |
| 3 or 4 Unit Apartments | 11 | 0.4% |
| 5 to 9 Unit Apartments | 0 | 0.0% |
| 10 or more Apartments | 41 | 1.6% |
| Mobile Home / Other | 0 | 0.0% |
| Total | 2,581 | 100.0% |
Housing Structures by Occupancy in Richboro
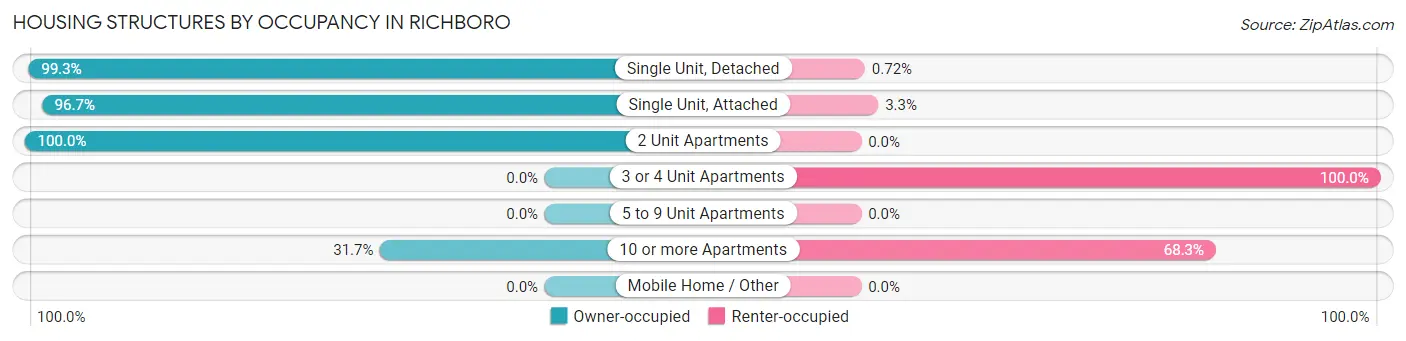
| Structure Type | Owner-occupied | Renter-occupied |
| Single Unit, Detached | 2,328 (99.3%) | 17 (0.7%) |
| Single Unit, Attached | 177 (96.7%) | 6 (3.3%) |
| 2 Unit Apartments | 1 (100.0%) | 0 (0.0%) |
| 3 or 4 Unit Apartments | 0 (0.0%) | 11 (100.0%) |
| 5 to 9 Unit Apartments | 0 (0.0%) | 0 (0.0%) |
| 10 or more Apartments | 13 (31.7%) | 28 (68.3%) |
| Mobile Home / Other | 0 (0.0%) | 0 (0.0%) |
| Total | 2,519 (97.6%) | 62 (2.4%) |
Housing Structures by Number of Rooms in Richboro
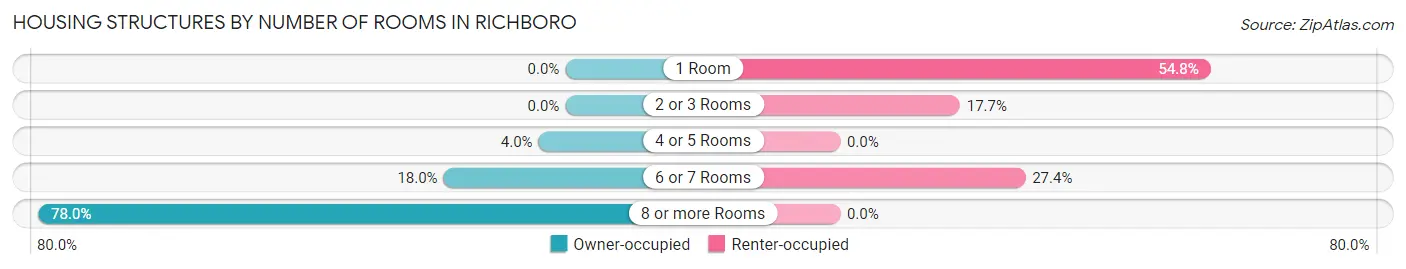
| Number of Rooms | Owner-occupied | Renter-occupied |
| 1 Room | 0 (0.0%) | 34 (54.8%) |
| 2 or 3 Rooms | 0 (0.0%) | 11 (17.7%) |
| 4 or 5 Rooms | 100 (4.0%) | 0 (0.0%) |
| 6 or 7 Rooms | 454 (18.0%) | 17 (27.4%) |
| 8 or more Rooms | 1,965 (78.0%) | 0 (0.0%) |
| Total | 2,519 (100.0%) | 62 (100.0%) |
Housing Structure by Heating Type in Richboro
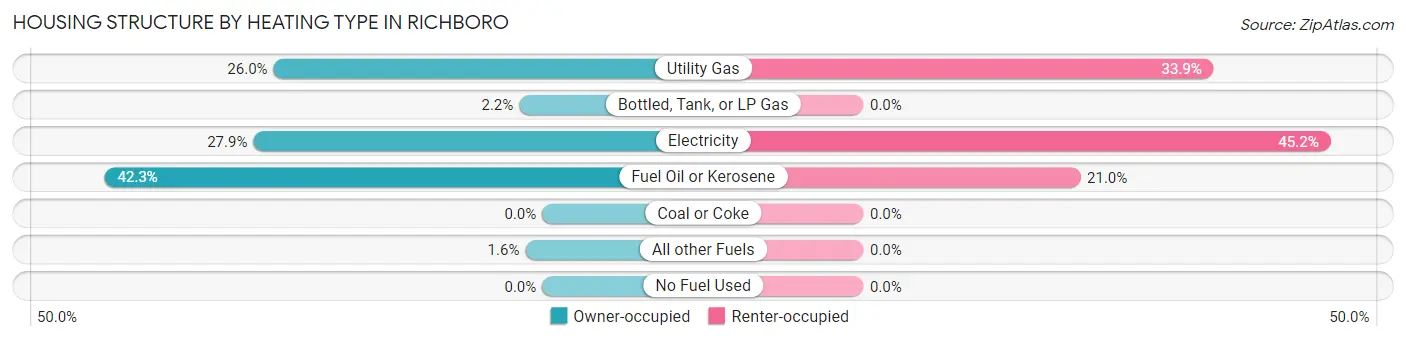
| Heating Type | Owner-occupied | Renter-occupied |
| Utility Gas | 654 (26.0%) | 21 (33.9%) |
| Bottled, Tank, or LP Gas | 56 (2.2%) | 0 (0.0%) |
| Electricity | 703 (27.9%) | 28 (45.2%) |
| Fuel Oil or Kerosene | 1,065 (42.3%) | 13 (21.0%) |
| Coal or Coke | 0 (0.0%) | 0 (0.0%) |
| All other Fuels | 41 (1.6%) | 0 (0.0%) |
| No Fuel Used | 0 (0.0%) | 0 (0.0%) |
| Total | 2,519 (100.0%) | 62 (100.0%) |
Household Vehicle Usage in Richboro
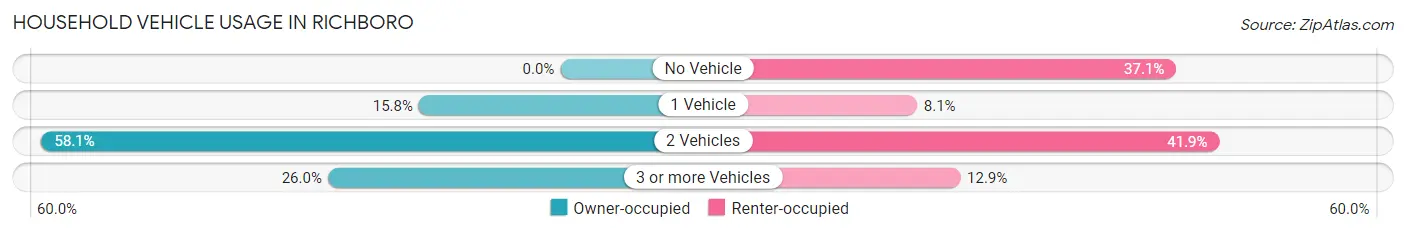
| Vehicles per Household | Owner-occupied | Renter-occupied |
| No Vehicle | 0 (0.0%) | 23 (37.1%) |
| 1 Vehicle | 399 (15.8%) | 5 (8.1%) |
| 2 Vehicles | 1,464 (58.1%) | 26 (41.9%) |
| 3 or more Vehicles | 656 (26.0%) | 8 (12.9%) |
| Total | 2,519 (100.0%) | 62 (100.0%) |
Real Estate & Mortgages in Richboro
Real Estate and Mortgage Overview in Richboro
| Characteristic | Without Mortgage | With Mortgage |
| Housing Units | 854 | 1,665 |
| Median Property Value | $456,000 | $493,700 |
| Median Household Income | $118,576 | $687 |
| Monthly Housing Costs | $986 | $663 |
| Real Estate Taxes | $6,305 | $0 |
Property Value by Mortgage Status in Richboro
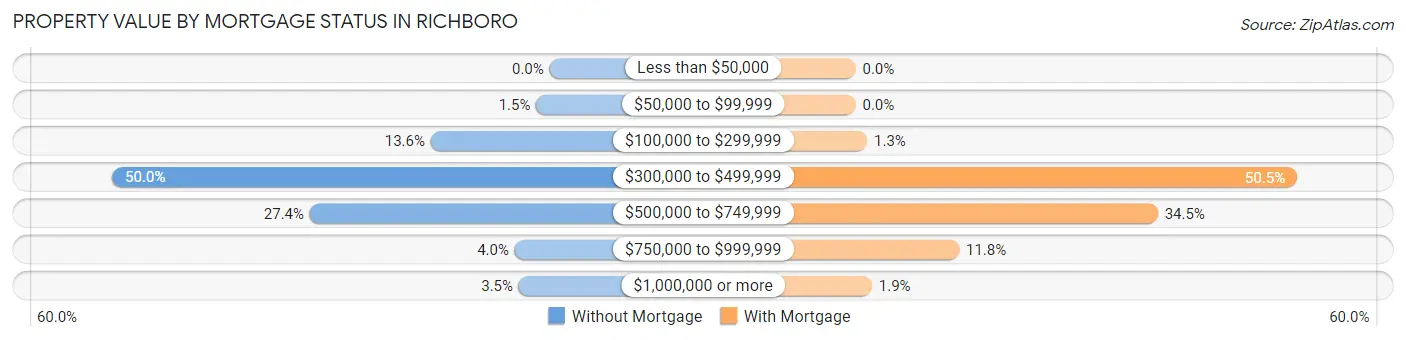
| Property Value | Without Mortgage | With Mortgage |
| Less than $50,000 | 0 (0.0%) | 0 (0.0%) |
| $50,000 to $99,999 | 13 (1.5%) | 0 (0.0%) |
| $100,000 to $299,999 | 116 (13.6%) | 22 (1.3%) |
| $300,000 to $499,999 | 427 (50.0%) | 840 (50.4%) |
| $500,000 to $749,999 | 234 (27.4%) | 575 (34.5%) |
| $750,000 to $999,999 | 34 (4.0%) | 197 (11.8%) |
| $1,000,000 or more | 30 (3.5%) | 31 (1.9%) |
| Total | 854 (100.0%) | 1,665 (100.0%) |
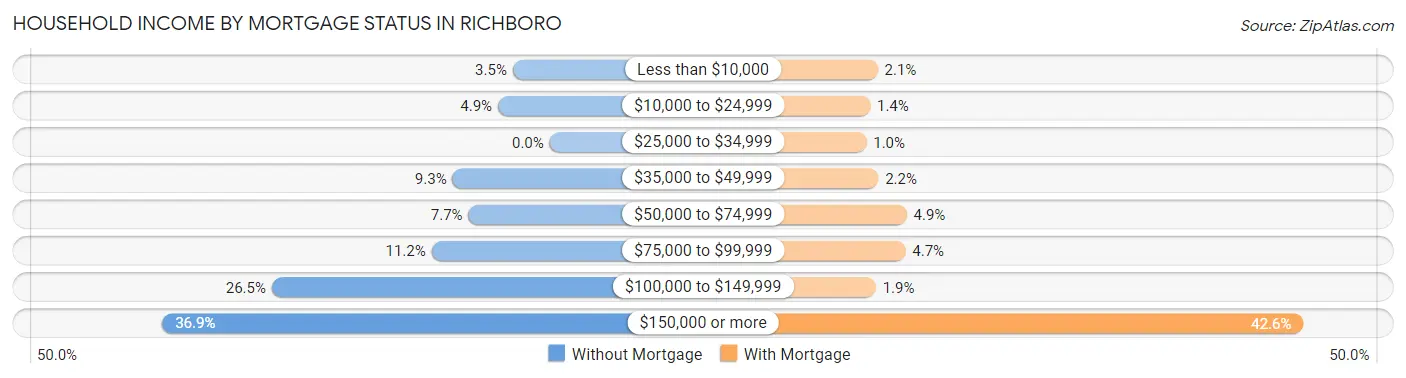
Household Income by Mortgage Status in Richboro
| Household Income | Without Mortgage | With Mortgage |
| Less than $10,000 | 30 (3.5%) | 35 (2.1%) |
| $10,000 to $24,999 | 42 (4.9%) | 23 (1.4%) |
| $25,000 to $34,999 | 0 (0.0%) | 17 (1.0%) |
| $35,000 to $49,999 | 79 (9.2%) | 36 (2.2%) |
| $50,000 to $74,999 | 66 (7.7%) | 81 (4.9%) |
| $75,000 to $99,999 | 96 (11.2%) | 79 (4.7%) |
| $100,000 to $149,999 | 226 (26.5%) | 32 (1.9%) |
| $150,000 or more | 315 (36.9%) | 710 (42.6%) |
| Total | 854 (100.0%) | 1,665 (100.0%) |
Property Value to Household Income Ratio in Richboro
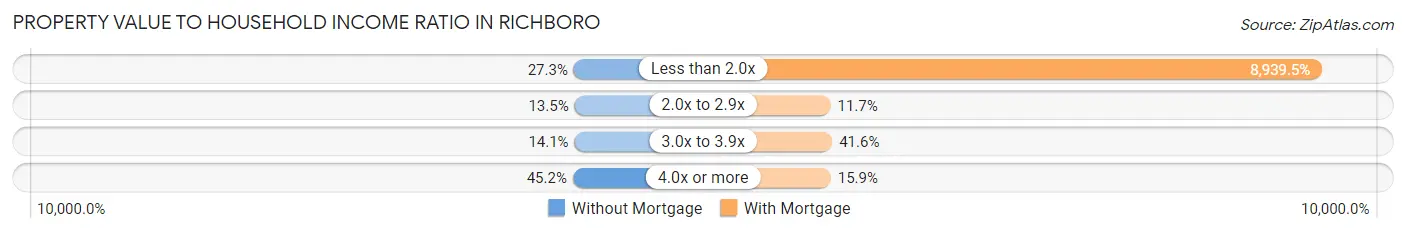
| Value-to-Income Ratio | Without Mortgage | With Mortgage |
| Less than 2.0x | 233 (27.3%) | 148,842 (8,939.5%) |
| 2.0x to 2.9x | 115 (13.5%) | 194 (11.7%) |
| 3.0x to 3.9x | 120 (14.1%) | 692 (41.6%) |
| 4.0x or more | 386 (45.2%) | 264 (15.9%) |
| Total | 854 (100.0%) | 1,665 (100.0%) |
Real Estate Taxes by Mortgage Status in Richboro
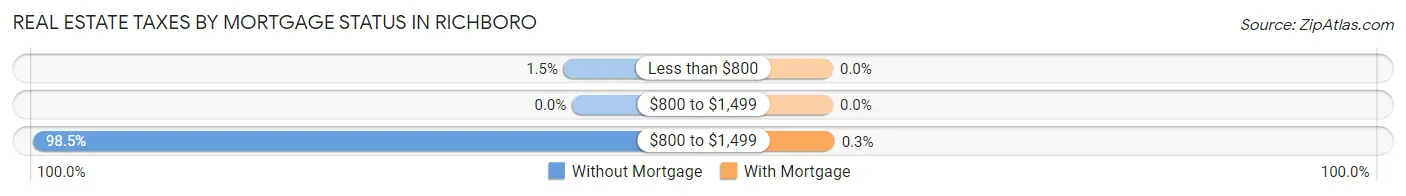
| Property Taxes | Without Mortgage | With Mortgage |
| Less than $800 | 13 (1.5%) | 0 (0.0%) |
| $800 to $1,499 | 0 (0.0%) | 0 (0.0%) |
| $800 to $1,499 | 841 (98.5%) | 5 (0.3%) |
| Total | 854 (100.0%) | 1,665 (100.0%) |
Health & Disability in Richboro
Health Insurance Coverage by Age in Richboro
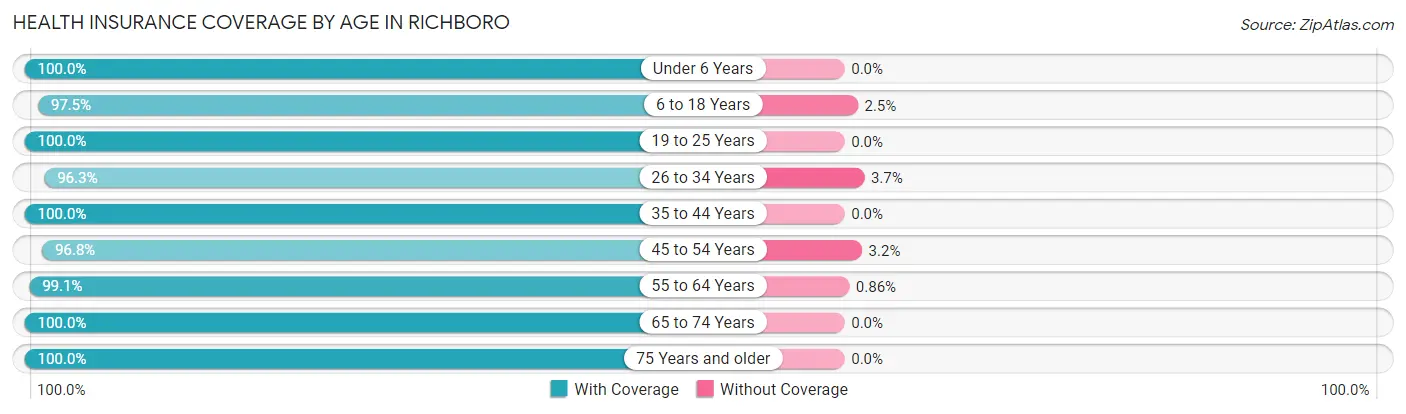
| Age Bracket | With Coverage | Without Coverage |
| Under 6 Years | 444 (100.0%) | 0 (0.0%) |
| 6 to 18 Years | 947 (97.5%) | 24 (2.5%) |
| 19 to 25 Years | 354 (100.0%) | 0 (0.0%) |
| 26 to 34 Years | 473 (96.3%) | 18 (3.7%) |
| 35 to 44 Years | 606 (100.0%) | 0 (0.0%) |
| 45 to 54 Years | 776 (96.8%) | 26 (3.2%) |
| 55 to 64 Years | 1,270 (99.1%) | 11 (0.9%) |
| 65 to 74 Years | 1,472 (100.0%) | 0 (0.0%) |
| 75 Years and older | 457 (100.0%) | 0 (0.0%) |
| Total | 6,799 (98.9%) | 79 (1.1%) |
Health Insurance Coverage by Citizenship Status in Richboro
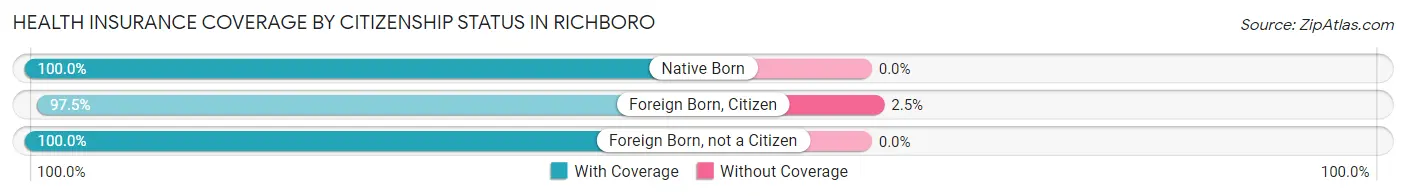
| Citizenship Status | With Coverage | Without Coverage |
| Native Born | 444 (100.0%) | 0 (0.0%) |
| Foreign Born, Citizen | 947 (97.5%) | 24 (2.5%) |
| Foreign Born, not a Citizen | 354 (100.0%) | 0 (0.0%) |
Health Insurance Coverage by Household Income in Richboro
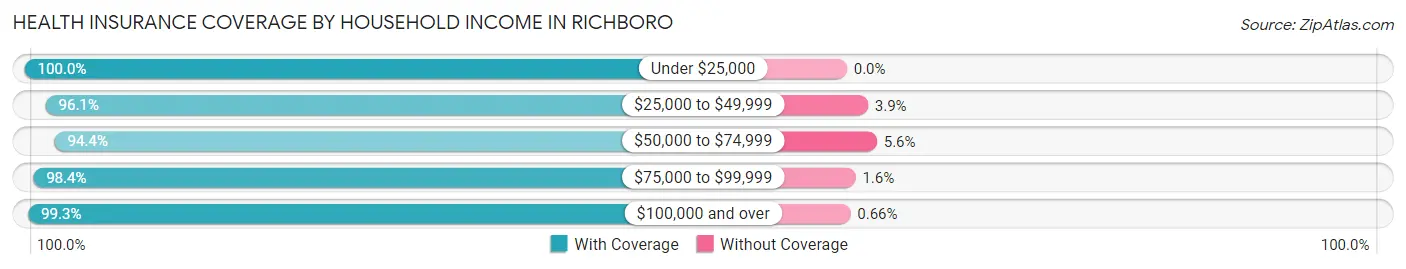
| Household Income | With Coverage | Without Coverage |
| Under $25,000 | 178 (100.0%) | 0 (0.0%) |
| $25,000 to $49,999 | 390 (96.1%) | 16 (3.9%) |
| $50,000 to $74,999 | 336 (94.4%) | 20 (5.6%) |
| $75,000 to $99,999 | 303 (98.4%) | 5 (1.6%) |
| $100,000 and over | 5,588 (99.3%) | 37 (0.7%) |
Public vs Private Health Insurance Coverage by Age in Richboro
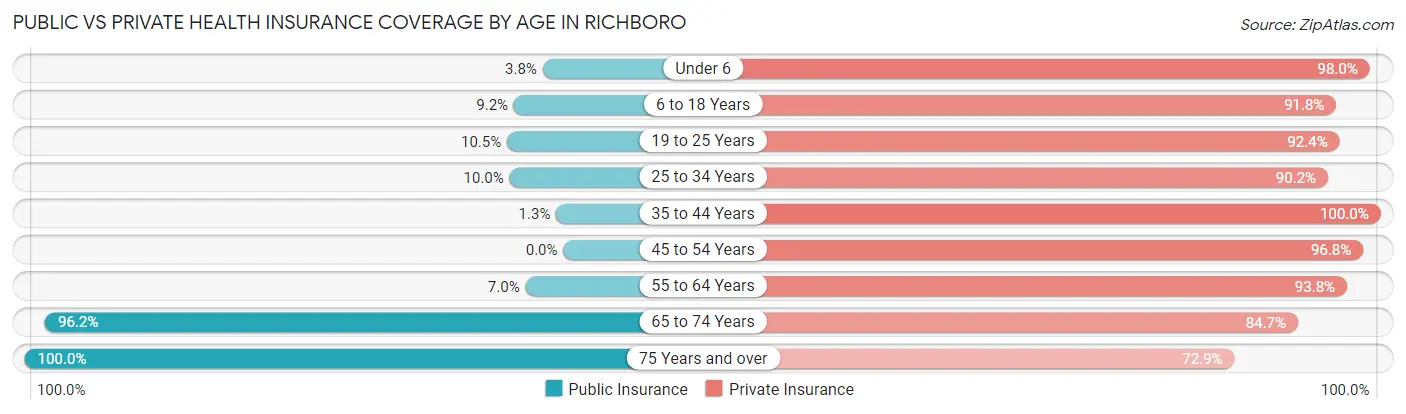
| Age Bracket | Public Insurance | Private Insurance |
| Under 6 | 17 (3.8%) | 435 (98.0%) |
| 6 to 18 Years | 89 (9.2%) | 891 (91.8%) |
| 19 to 25 Years | 37 (10.4%) | 327 (92.4%) |
| 25 to 34 Years | 49 (10.0%) | 443 (90.2%) |
| 35 to 44 Years | 8 (1.3%) | 606 (100.0%) |
| 45 to 54 Years | 0 (0.0%) | 776 (96.8%) |
| 55 to 64 Years | 90 (7.0%) | 1,201 (93.8%) |
| 65 to 74 Years | 1,416 (96.2%) | 1,246 (84.7%) |
| 75 Years and over | 457 (100.0%) | 333 (72.9%) |
| Total | 2,163 (31.5%) | 6,258 (91.0%) |
Disability Status by Sex by Age in Richboro
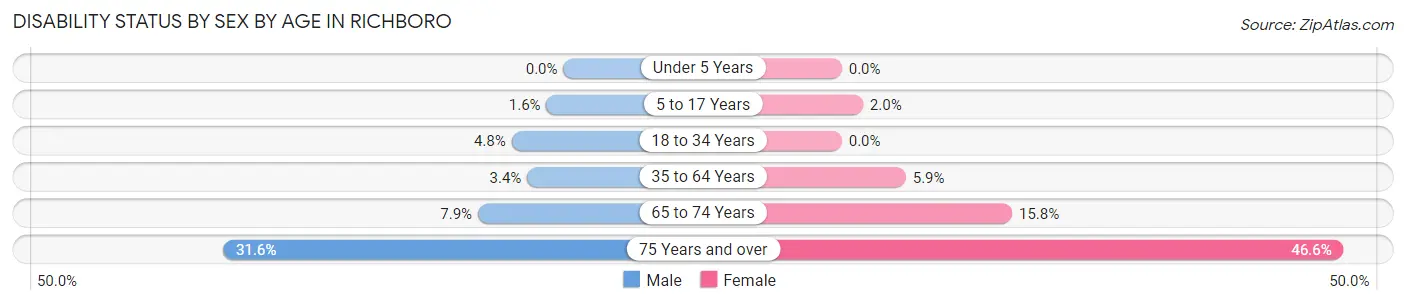
| Age Bracket | Male | Female |
| Under 5 Years | 0 (0.0%) | 0 (0.0%) |
| 5 to 17 Years | 8 (1.6%) | 8 (2.0%) |
| 18 to 34 Years | 31 (4.8%) | 0 (0.0%) |
| 35 to 64 Years | 44 (3.4%) | 82 (5.9%) |
| 65 to 74 Years | 62 (7.9%) | 109 (15.8%) |
| 75 Years and over | 48 (31.6%) | 142 (46.6%) |
Disability Class by Sex by Age in Richboro
Disability Class: Hearing Difficulty
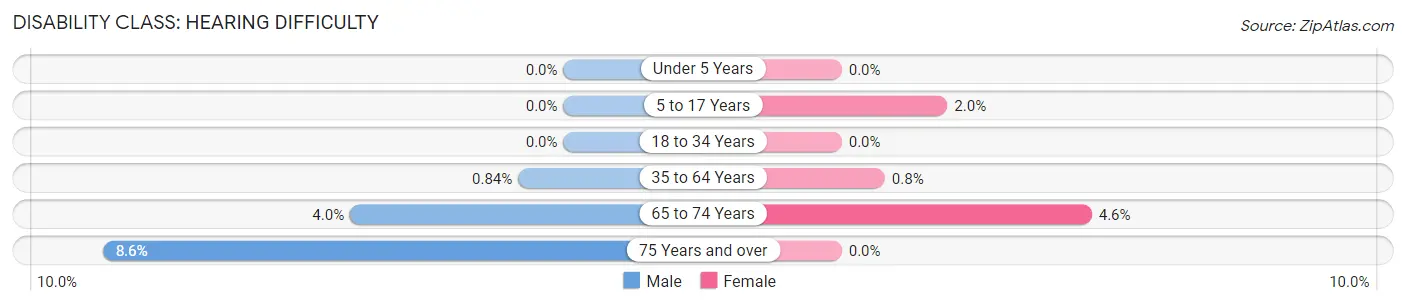
| Age Bracket | Male | Female |
| Under 5 Years | 0 (0.0%) | 0 (0.0%) |
| 5 to 17 Years | 0 (0.0%) | 8 (2.0%) |
| 18 to 34 Years | 0 (0.0%) | 0 (0.0%) |
| 35 to 64 Years | 11 (0.8%) | 11 (0.8%) |
| 65 to 74 Years | 31 (4.0%) | 32 (4.6%) |
| 75 Years and over | 13 (8.6%) | 0 (0.0%) |
Disability Class: Vision Difficulty
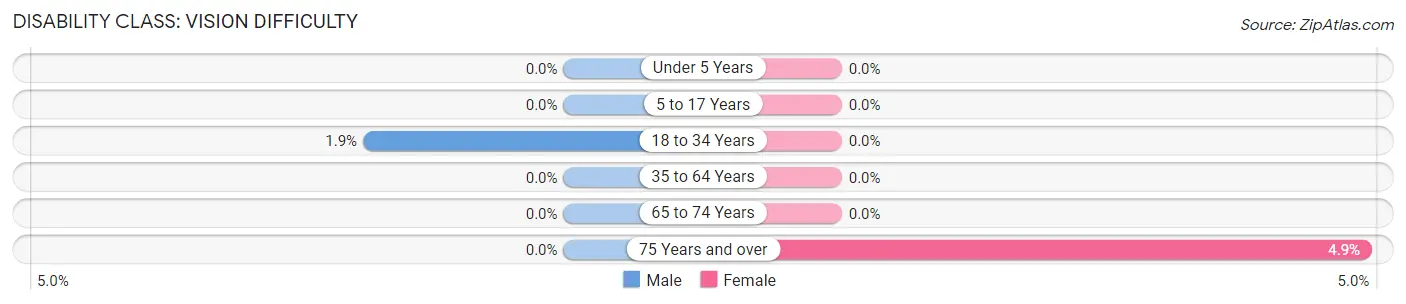
| Age Bracket | Male | Female |
| Under 5 Years | 0 (0.0%) | 0 (0.0%) |
| 5 to 17 Years | 0 (0.0%) | 0 (0.0%) |
| 18 to 34 Years | 12 (1.9%) | 0 (0.0%) |
| 35 to 64 Years | 0 (0.0%) | 0 (0.0%) |
| 65 to 74 Years | 0 (0.0%) | 0 (0.0%) |
| 75 Years and over | 0 (0.0%) | 15 (4.9%) |
Disability Class: Cognitive Difficulty
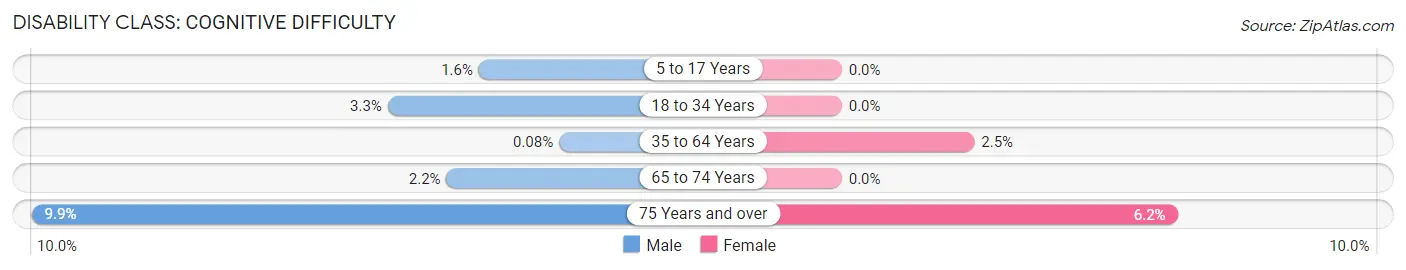
| Age Bracket | Male | Female |
| 5 to 17 Years | 8 (1.6%) | 0 (0.0%) |
| 18 to 34 Years | 21 (3.3%) | 0 (0.0%) |
| 35 to 64 Years | 1 (0.1%) | 34 (2.5%) |
| 65 to 74 Years | 17 (2.2%) | 0 (0.0%) |
| 75 Years and over | 15 (9.9%) | 19 (6.2%) |
Disability Class: Ambulatory Difficulty
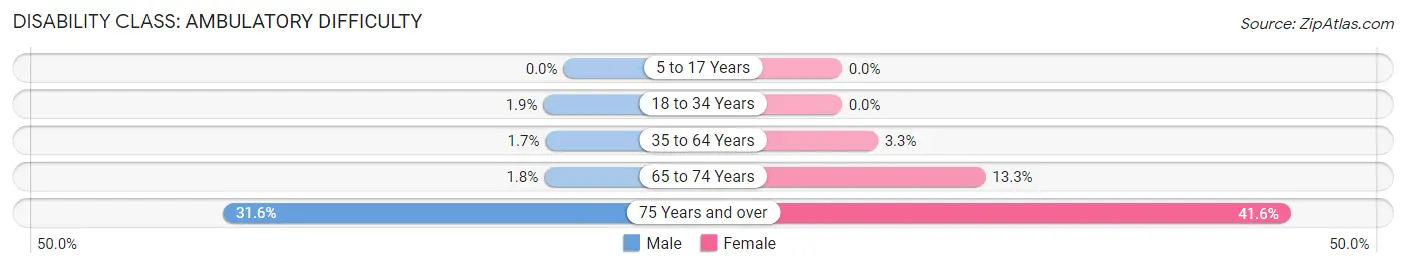
| Age Bracket | Male | Female |
| 5 to 17 Years | 0 (0.0%) | 0 (0.0%) |
| 18 to 34 Years | 12 (1.9%) | 0 (0.0%) |
| 35 to 64 Years | 22 (1.7%) | 46 (3.3%) |
| 65 to 74 Years | 14 (1.8%) | 92 (13.3%) |
| 75 Years and over | 48 (31.6%) | 127 (41.6%) |
Disability Class: Self-Care Difficulty
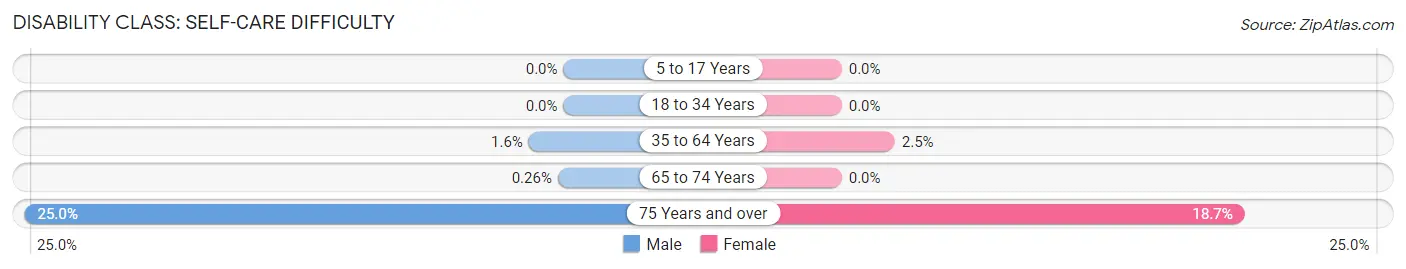
| Age Bracket | Male | Female |
| 5 to 17 Years | 0 (0.0%) | 0 (0.0%) |
| 18 to 34 Years | 0 (0.0%) | 0 (0.0%) |
| 35 to 64 Years | 21 (1.6%) | 34 (2.5%) |
| 65 to 74 Years | 2 (0.3%) | 0 (0.0%) |
| 75 Years and over | 38 (25.0%) | 57 (18.7%) |
Technology Access in Richboro
Computing Device Access in Richboro
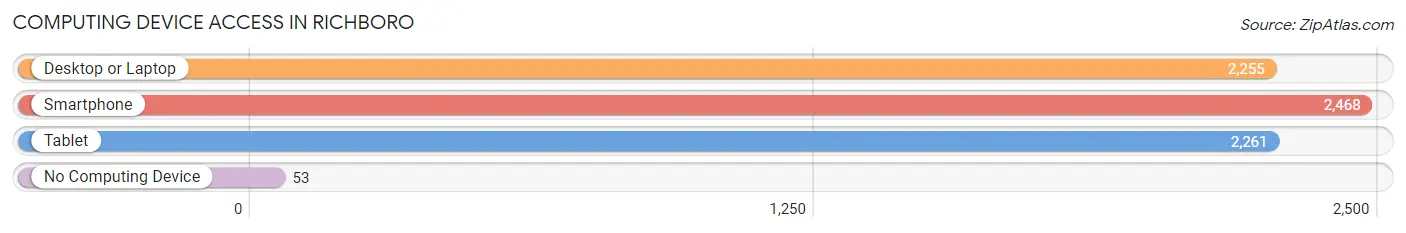
| Device Type | # Households | % Households |
| Desktop or Laptop | 2,255 | 87.4% |
| Smartphone | 2,468 | 95.6% |
| Tablet | 2,261 | 87.6% |
| No Computing Device | 53 | 2.1% |
| Total | 2,581 | 100.0% |
Internet Access in Richboro
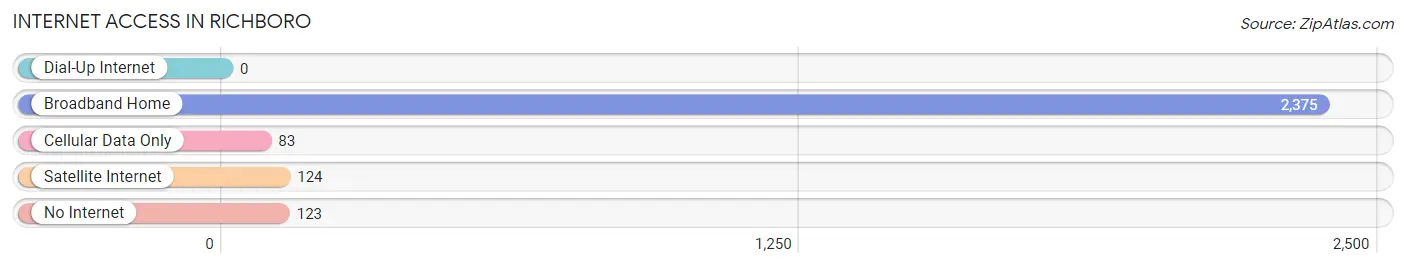
| Internet Type | # Households | % Households |
| Dial-Up Internet | 0 | 0.0% |
| Broadband Home | 2,375 | 92.0% |
| Cellular Data Only | 83 | 3.2% |
| Satellite Internet | 124 | 4.8% |
| No Internet | 123 | 4.8% |
| Total | 2,581 | 100.0% |
Richboro Summary
Richboro is a census-designated place (CDP) located in Northampton Township, Bucks County, Pennsylvania. It is located in the heart of Bucks County, approximately 25 miles northeast of Philadelphia. The population of Richboro was 6,563 at the 2010 census.
History
Richboro was originally known as “Richland” and was part of the original land grant given to William Penn in 1682. The area was first settled in the late 1700s by Quakers from England. The first recorded settler was Thomas Rich, who purchased land in the area in 1702. The area was officially incorporated as Richland Township in 1725. In 1845, the name was changed to Richboro, after Thomas Rich.
Geography
Richboro is located at 40°14'45" North, 75°7'45" West (40.245833, -75.129028). According to the United States Census Bureau, the CDP has a total area of 4.2 square miles, all of it land.
Economy
Richboro is home to a variety of businesses, including retail stores, restaurants, and professional services. The largest employers in the area are the Richboro Shopping Center, which includes a grocery store, pharmacy, and other retail stores, and the Richboro Business Park, which is home to a variety of professional services.
Demographics
As of the 2010 census, there were 6,563 people, 2,541 households, and 1,845 families residing in the CDP. The population density was 1,567.2 people per square mile. The racial makeup of the CDP was 94.2% White, 1.7% African American, 0.2% Native American, 2.2% Asian, 0.1% Pacific Islander, 0.7% from other races, and 1.0% from two or more races. Hispanic or Latino of any race were 2.3% of the population.
The median age in Richboro was 43.2 years. 22.2% of residents were under the age of 18; 6.2% were between the ages of 18 and 24; 24.2% were from 25 to 44; 33.2% were from 45 to 64; and 14.2% were 65 years of age or older. The gender makeup of the CDP was 48.2% male and 51.8% female.
The median income for a household in Richboro was $90,945, and the median income for a family was $106,945. Males had a median income of $76,945 versus $50,945 for females. The per capita income for the CDP was $45,945. About 2.2% of families and 3.2% of the population were below the poverty line, including 4.2% of those under age 18 and 2.2% of those age 65 or over.
Common Questions
What is Per Capita Income in Richboro?
Per Capita income in Richboro is $68,870.
What is the Median Family Income in Richboro?
Median Family Income in Richboro is $148,555.
What is the Median Household income in Richboro?
Median Household Income in Richboro is $147,703.
What is Income or Wage Gap in Richboro?
Income or Wage Gap in Richboro is 46.8%.
Women in Richboro earn 53.2 cents for every dollar earned by a man.
What is Inequality or Gini Index in Richboro?
Inequality or Gini Index in Richboro is 0.41.
What is the Total Population of Richboro?
Total Population of Richboro is 6,983.
What is the Total Male Population of Richboro?
Total Male Population of Richboro is 3,677.
What is the Total Female Population of Richboro?
Total Female Population of Richboro is 3,306.
What is the Ratio of Males per 100 Females in Richboro?
There are 111.22 Males per 100 Females in Richboro.
What is the Ratio of Females per 100 Males in Richboro?
There are 89.91 Females per 100 Males in Richboro.
What is the Median Population Age in Richboro?
Median Population Age in Richboro is 52.9 Years.
What is the Average Family Size in Richboro
Average Family Size in Richboro is 2.9 People.
What is the Average Household Size in Richboro
Average Household Size in Richboro is 2.7 People.
How Large is the Labor Force in Richboro?
There are 3,561 People in the Labor Forcein in Richboro.
What is the Percentage of People in the Labor Force in Richboro?
60.7% of People are in the Labor Force in Richboro.
What is the Unemployment Rate in Richboro?
Unemployment Rate in Richboro is 3.3%.