Roaring Spring borough, PA Map & Demographics
Roaring Spring borough Overview
$29,550
PER CAPITA INCOME
$79,063
AVG FAMILY INCOME
$63,194
AVG HOUSEHOLD INCOME
22.8%
WAGE / INCOME GAP [ % ]
77.2¢/ $1
WAGE / INCOME GAP [ $ ]
0.37
INEQUALITY / GINI INDEX
2,512
TOTAL POPULATION
1,111
MALE POPULATION
1,401
FEMALE POPULATION
79.30
MALES / 100 FEMALES
126.10
FEMALES / 100 MALES
36.1
MEDIAN AGE
3.0
AVG FAMILY SIZE
2.5
AVG HOUSEHOLD SIZE
1,402
LABOR FORCE [ PEOPLE ]
71.5%
PERCENT IN LABOR FORCE
5.7%
UNEMPLOYMENT RATE
Income in Roaring Spring borough
Income Overview in Roaring Spring borough
Per Capita Income in Roaring Spring borough is $29,550, while median incomes of families and households are $79,063 and $63,194 respectively.
| Characteristic | Number | Measure |
| Per Capita Income | 2,512 | $29,550 |
| Median Family Income | 732 | $79,063 |
| Mean Family Income | 732 | $82,312 |
| Median Household Income | 1,011 | $63,194 |
| Mean Household Income | 1,011 | $71,097 |
| Income Deficit | 732 | $0 |
| Wage / Income Gap (%) | 2,512 | 22.78% |
| Wage / Income Gap ($) | 2,512 | 77.22¢ per $1 |
| Gini / Inequality Index | 2,512 | 0.37 |
Earnings by Sex in Roaring Spring borough
Average Earnings in Roaring Spring borough are $35,028, $39,063 for men and $30,163 for women, a difference of 22.8%.
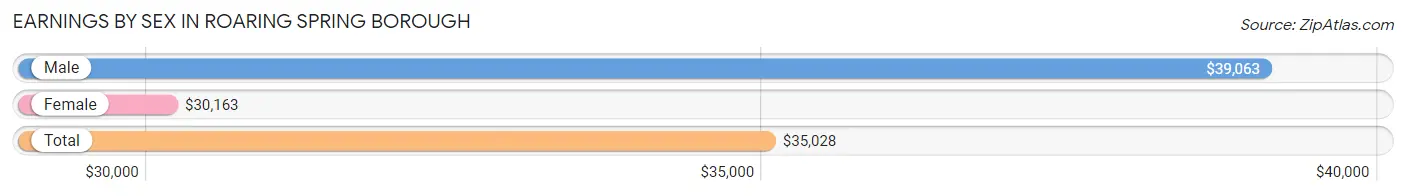
| Sex | Number | Average Earnings |
| Male | 657 (46.4%) | $39,063 |
| Female | 758 (53.6%) | $30,163 |
| Total | 1,415 (100.0%) | $35,028 |
Earnings by Sex by Income Bracket in Roaring Spring borough
The most common earnings brackets in Roaring Spring borough are $25,000 to $29,999 for men (114 | 17.3%) and $25,000 to $29,999 for women (86 | 11.4%).
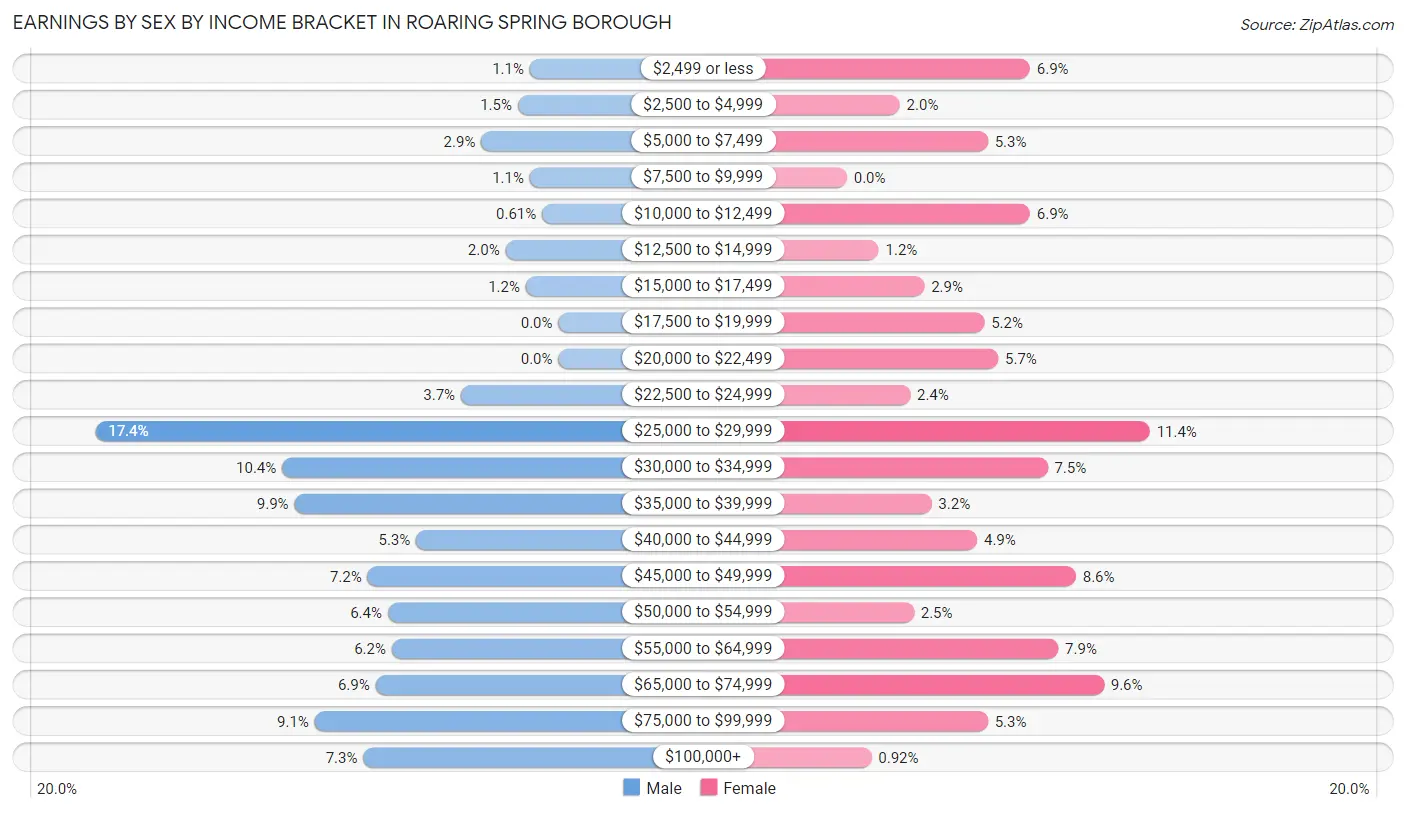
| Income | Male | Female |
| $2,499 or less | 7 (1.1%) | 52 (6.9%) |
| $2,500 to $4,999 | 10 (1.5%) | 15 (2.0%) |
| $5,000 to $7,499 | 19 (2.9%) | 40 (5.3%) |
| $7,500 to $9,999 | 7 (1.1%) | 0 (0.0%) |
| $10,000 to $12,499 | 4 (0.6%) | 52 (6.9%) |
| $12,500 to $14,999 | 13 (2.0%) | 9 (1.2%) |
| $15,000 to $17,499 | 8 (1.2%) | 22 (2.9%) |
| $17,500 to $19,999 | 0 (0.0%) | 39 (5.1%) |
| $20,000 to $22,499 | 0 (0.0%) | 43 (5.7%) |
| $22,500 to $24,999 | 24 (3.6%) | 18 (2.4%) |
| $25,000 to $29,999 | 114 (17.3%) | 86 (11.4%) |
| $30,000 to $34,999 | 68 (10.3%) | 57 (7.5%) |
| $35,000 to $39,999 | 65 (9.9%) | 24 (3.2%) |
| $40,000 to $44,999 | 35 (5.3%) | 37 (4.9%) |
| $45,000 to $49,999 | 47 (7.1%) | 65 (8.6%) |
| $50,000 to $54,999 | 42 (6.4%) | 19 (2.5%) |
| $55,000 to $64,999 | 41 (6.2%) | 60 (7.9%) |
| $65,000 to $74,999 | 45 (6.9%) | 73 (9.6%) |
| $75,000 to $99,999 | 60 (9.1%) | 40 (5.3%) |
| $100,000+ | 48 (7.3%) | 7 (0.9%) |
| Total | 657 (100.0%) | 758 (100.0%) |
Earnings by Sex by Educational Attainment in Roaring Spring borough
Average earnings in Roaring Spring borough are $40,368 for men and $32,201 for women, a difference of 20.2%. Men with an educational attainment of bachelor's degree enjoy the highest average annual earnings of $75,625, while those with college or associate's degree education earn the least with $35,972. Women with an educational attainment of graduate degree earn the most with the average annual earnings of $59,853, while those with high school diploma education have the smallest earnings of $27,188.
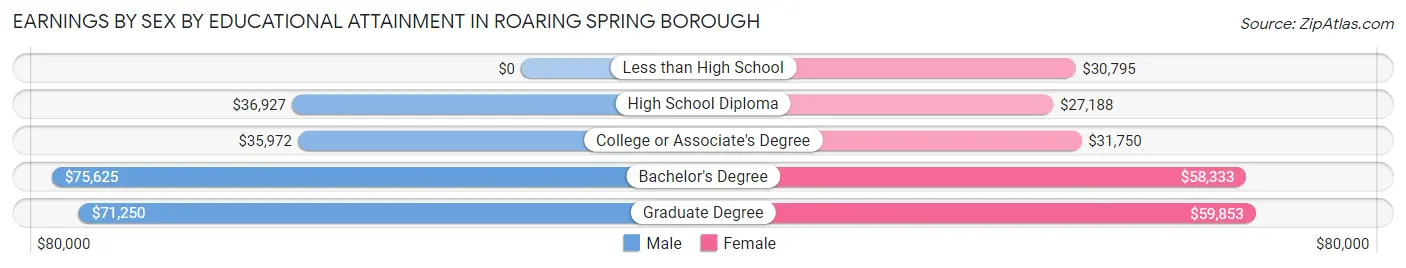
| Educational Attainment | Male Income | Female Income |
| Less than High School | - | - |
| High School Diploma | $36,927 | $27,188 |
| College or Associate's Degree | $35,972 | $31,750 |
| Bachelor's Degree | $75,625 | $58,333 |
| Graduate Degree | $71,250 | $59,853 |
| Total | $40,368 | $32,201 |
Family Income in Roaring Spring borough
Family Income Brackets in Roaring Spring borough
According to the Roaring Spring borough family income data, there are 192 families falling into the $100,000 to $149,999 income range, which is the most common income bracket and makes up 26.2% of all families. Conversely, the $150,000 to $199,999 income bracket is the least frequent group with only 9 families (1.2%) belonging to this category.
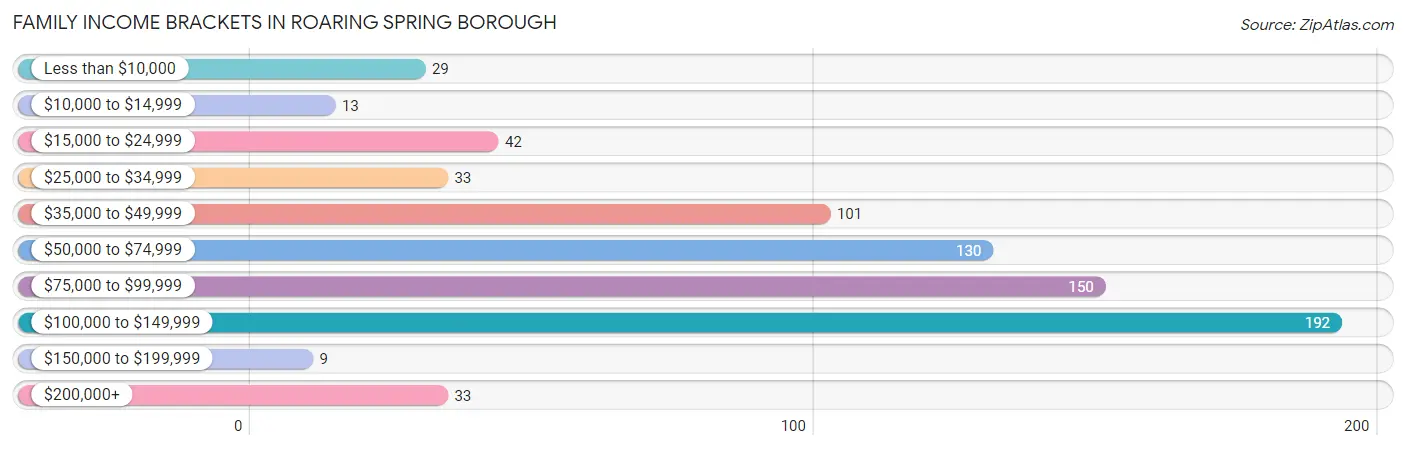
| Income Bracket | # Families | % Families |
| Less than $10,000 | 29 | 4.0% |
| $10,000 to $14,999 | 13 | 1.8% |
| $15,000 to $24,999 | 42 | 5.7% |
| $25,000 to $34,999 | 33 | 4.5% |
| $35,000 to $49,999 | 101 | 13.8% |
| $50,000 to $74,999 | 130 | 17.8% |
| $75,000 to $99,999 | 150 | 20.5% |
| $100,000 to $149,999 | 192 | 26.2% |
| $150,000 to $199,999 | 9 | 1.2% |
| $200,000+ | 33 | 4.5% |
Family Income by Famaliy Size in Roaring Spring borough
4-person families (100 | 13.7%) account for the highest median family income in Roaring Spring borough with $118,000 per family, while 2-person families (384 | 52.5%) have the highest median income of $33,352 per family member.
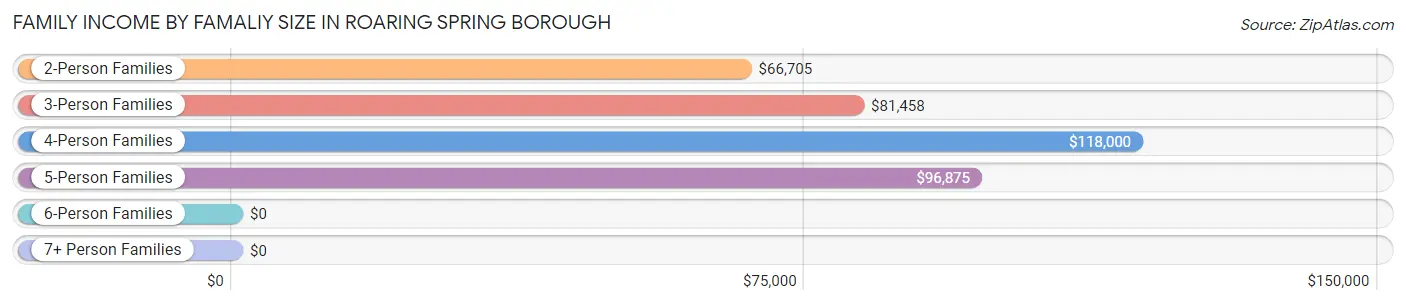
| Income Bracket | # Families | Median Income |
| 2-Person Families | 384 (52.5%) | $66,705 |
| 3-Person Families | 145 (19.8%) | $81,458 |
| 4-Person Families | 100 (13.7%) | $118,000 |
| 5-Person Families | 75 (10.2%) | $96,875 |
| 6-Person Families | 28 (3.8%) | $0 |
| 7+ Person Families | 0 (0.0%) | $0 |
| Total | 732 (100.0%) | $79,063 |
Family Income by Number of Earners in Roaring Spring borough
The median family income in Roaring Spring borough is $79,063, with families comprising 3+ earners (61) having the highest median family income of $129,896, while families with no earners (94) have the lowest median family income of $33,750, accounting for 8.3% and 12.8% of families, respectively.
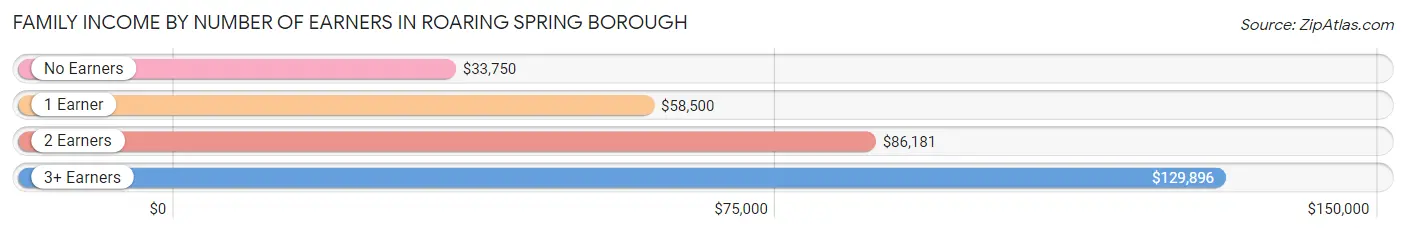
| Number of Earners | # Families | Median Income |
| No Earners | 94 (12.8%) | $33,750 |
| 1 Earner | 232 (31.7%) | $58,500 |
| 2 Earners | 345 (47.1%) | $86,181 |
| 3+ Earners | 61 (8.3%) | $129,896 |
| Total | 732 (100.0%) | $79,063 |
Household Income in Roaring Spring borough
Household Income Brackets in Roaring Spring borough
With 207 households falling in the category, the $50,000 to $74,999 income range is the most frequent in Roaring Spring borough, accounting for 20.5% of all households. In contrast, only 9 households (0.9%) fall into the $150,000 to $199,999 income bracket, making it the least populous group.
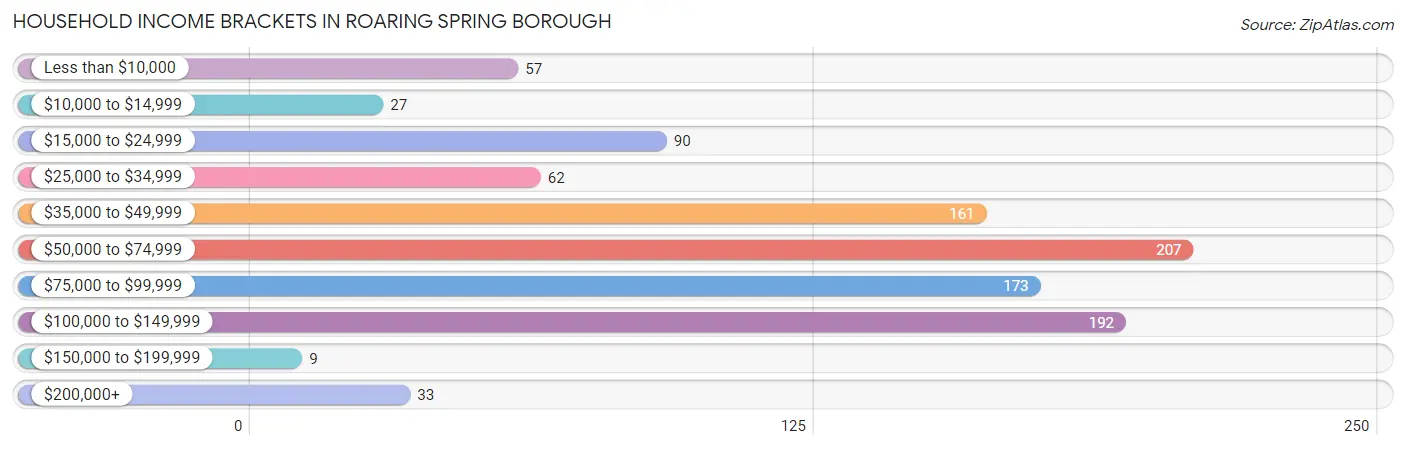
| Income Bracket | # Households | % Households |
| Less than $10,000 | 57 | 5.6% |
| $10,000 to $14,999 | 27 | 2.7% |
| $15,000 to $24,999 | 90 | 8.9% |
| $25,000 to $34,999 | 62 | 6.1% |
| $35,000 to $49,999 | 161 | 15.9% |
| $50,000 to $74,999 | 207 | 20.5% |
| $75,000 to $99,999 | 173 | 17.1% |
| $100,000 to $149,999 | 192 | 19.0% |
| $150,000 to $199,999 | 9 | 0.9% |
| $200,000+ | 33 | 3.3% |
Household Income by Householder Age in Roaring Spring borough
The median household income in Roaring Spring borough is $63,194, with the highest median household income of $73,900 found in the 25 to 44 years age bracket for the primary householder. A total of 374 households (37.0%) fall into this category. Meanwhile, the 15 to 24 years age bracket for the primary householder has the lowest median household income of $0, with 42 households (4.2%) in this group.
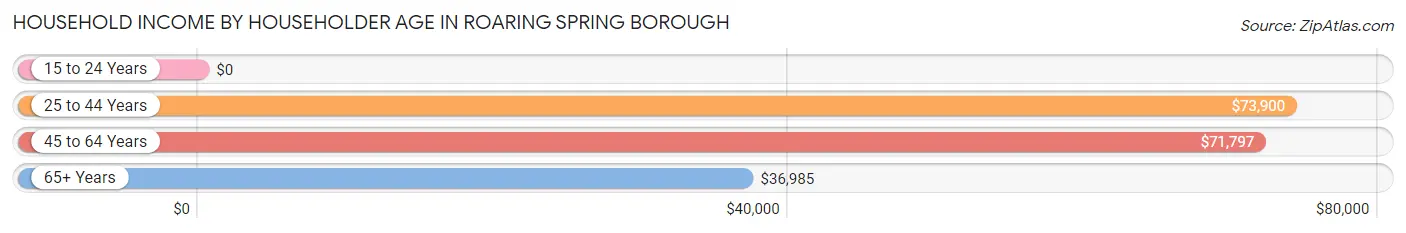
| Income Bracket | # Households | Median Income |
| 15 to 24 Years | 42 (4.2%) | $0 |
| 25 to 44 Years | 374 (37.0%) | $73,900 |
| 45 to 64 Years | 355 (35.1%) | $71,797 |
| 65+ Years | 240 (23.7%) | $36,985 |
| Total | 1,011 (100.0%) | $63,194 |
Poverty in Roaring Spring borough
Income Below Poverty by Sex and Age in Roaring Spring borough
With 12.3% poverty level for males and 17.3% for females among the residents of Roaring Spring borough, 15 year old males and 5 year old females are the most vulnerable to poverty, with 11 males (73.3%) and 13 females (61.9%) in their respective age groups living below the poverty level.
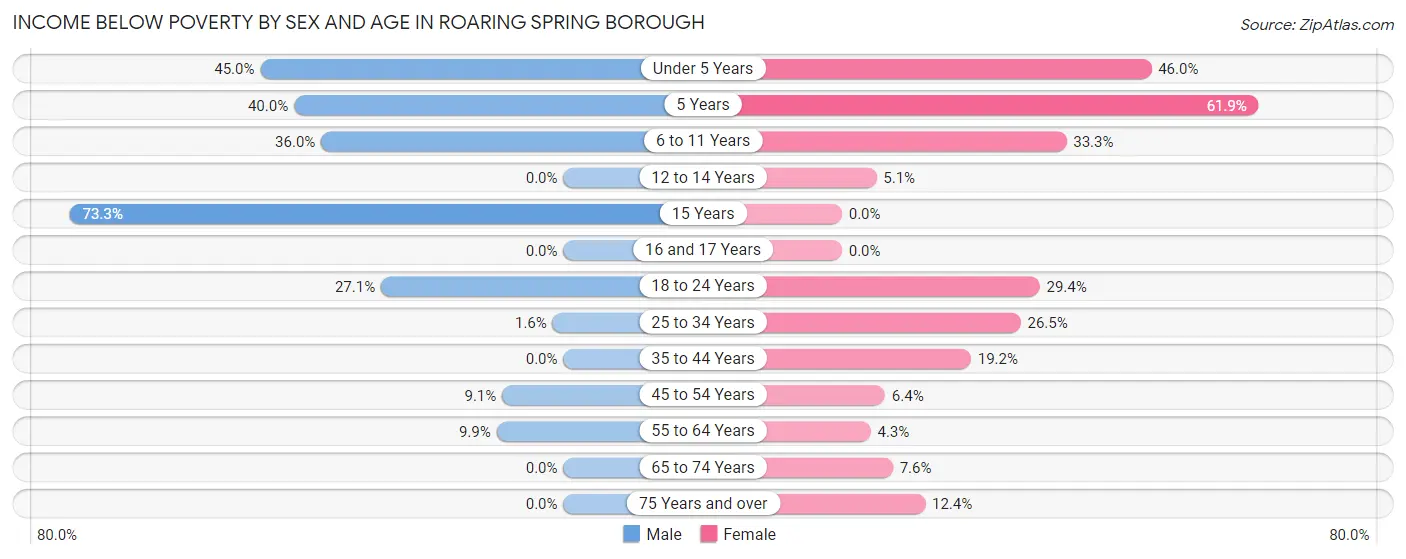
| Age Bracket | Male | Female |
| Under 5 Years | 36 (45.0%) | 34 (46.0%) |
| 5 Years | 4 (40.0%) | 13 (61.9%) |
| 6 to 11 Years | 41 (36.0%) | 24 (33.3%) |
| 12 to 14 Years | 0 (0.0%) | 4 (5.1%) |
| 15 Years | 11 (73.3%) | 0 (0.0%) |
| 16 and 17 Years | 0 (0.0%) | 0 (0.0%) |
| 18 to 24 Years | 13 (27.1%) | 42 (29.4%) |
| 25 to 34 Years | 4 (1.6%) | 56 (26.5%) |
| 35 to 44 Years | 0 (0.0%) | 32 (19.2%) |
| 45 to 54 Years | 15 (9.1%) | 11 (6.4%) |
| 55 to 64 Years | 13 (9.9%) | 7 (4.3%) |
| 65 to 74 Years | 0 (0.0%) | 9 (7.6%) |
| 75 Years and over | 0 (0.0%) | 11 (12.4%) |
| Total | 137 (12.3%) | 243 (17.3%) |
Income Above Poverty by Sex and Age in Roaring Spring borough
According to the poverty statistics in Roaring Spring borough, males aged 12 to 14 years and females aged 15 years are the age groups that are most secure financially, with 100.0% of males and 100.0% of females in these age groups living above the poverty line.
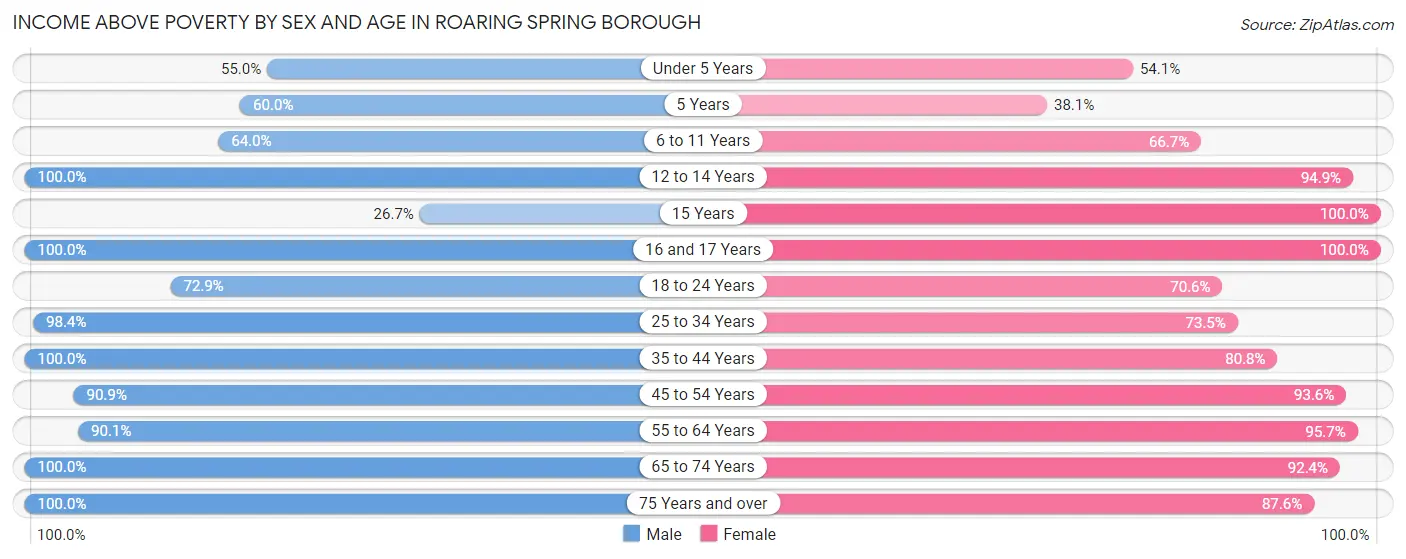
| Age Bracket | Male | Female |
| Under 5 Years | 44 (55.0%) | 40 (54.0%) |
| 5 Years | 6 (60.0%) | 8 (38.1%) |
| 6 to 11 Years | 73 (64.0%) | 48 (66.7%) |
| 12 to 14 Years | 25 (100.0%) | 74 (94.9%) |
| 15 Years | 4 (26.7%) | 62 (100.0%) |
| 16 and 17 Years | 12 (100.0%) | 29 (100.0%) |
| 18 to 24 Years | 35 (72.9%) | 101 (70.6%) |
| 25 to 34 Years | 247 (98.4%) | 155 (73.5%) |
| 35 to 44 Years | 134 (100.0%) | 135 (80.8%) |
| 45 to 54 Years | 150 (90.9%) | 161 (93.6%) |
| 55 to 64 Years | 118 (90.1%) | 157 (95.7%) |
| 65 to 74 Years | 59 (100.0%) | 110 (92.4%) |
| 75 Years and over | 67 (100.0%) | 78 (87.6%) |
| Total | 974 (87.7%) | 1,158 (82.7%) |
Income Below Poverty Among Married-Couple Families in Roaring Spring borough
The poverty statistics for married-couple families in Roaring Spring borough show that 0.8% or 4 of the total 477 families live below the poverty line. Families with 3 or 4 children have the highest poverty rate of 8.5%, comprising of 4 families. On the other hand, families with no children have the lowest poverty rate of 0.0%, which includes 0 families.
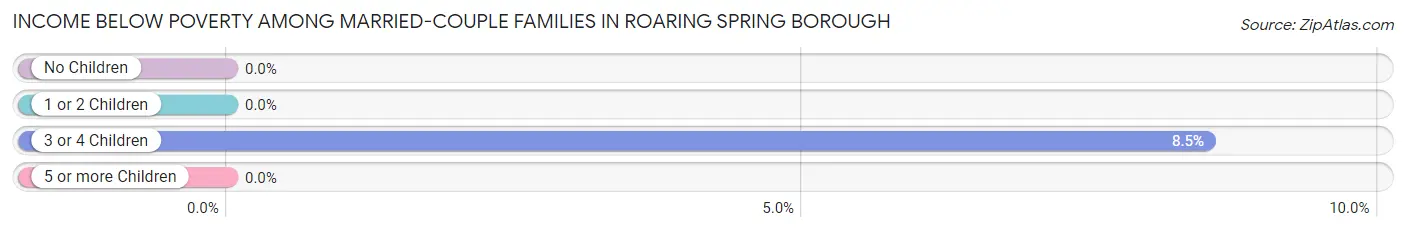
| Children | Above Poverty | Below Poverty |
| No Children | 284 (100.0%) | 0 (0.0%) |
| 1 or 2 Children | 146 (100.0%) | 0 (0.0%) |
| 3 or 4 Children | 43 (91.5%) | 4 (8.5%) |
| 5 or more Children | 0 (0.0%) | 0 (0.0%) |
| Total | 473 (99.2%) | 4 (0.8%) |
Income Below Poverty Among Single-Parent Households in Roaring Spring borough
According to the poverty data in Roaring Spring borough, 5.6% or 2 single-father households and 35.2% or 77 single-mother households are living below the poverty line. Among single-father households, those with 1 or 2 children have the highest poverty rate, with 2 households (25.0%) experiencing poverty. Likewise, among single-mother households, those with 3 or 4 children have the highest poverty rate, with 13 households (100.0%) falling below the poverty line.
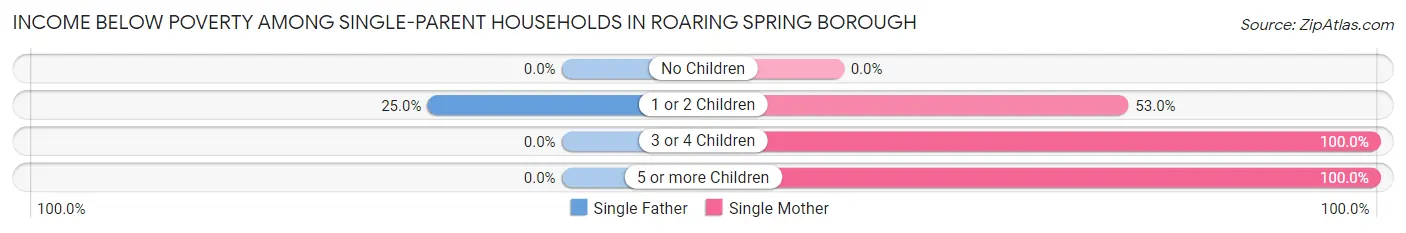
| Children | Single Father | Single Mother |
| No Children | 0 (0.0%) | 0 (0.0%) |
| 1 or 2 Children | 2 (25.0%) | 61 (53.0%) |
| 3 or 4 Children | 0 (0.0%) | 13 (100.0%) |
| 5 or more Children | 0 (0.0%) | 3 (100.0%) |
| Total | 2 (5.6%) | 77 (35.2%) |
Income Below Poverty Among Married-Couple vs Single-Parent Households in Roaring Spring borough
The poverty data for Roaring Spring borough shows that 4 of the married-couple family households (0.8%) and 79 of the single-parent households (31.0%) are living below the poverty level. Within the married-couple family households, those with 3 or 4 children have the highest poverty rate, with 4 households (8.5%) falling below the poverty line. Among the single-parent households, those with 3 or 4 children have the highest poverty rate, with 13 household (100.0%) living below poverty.
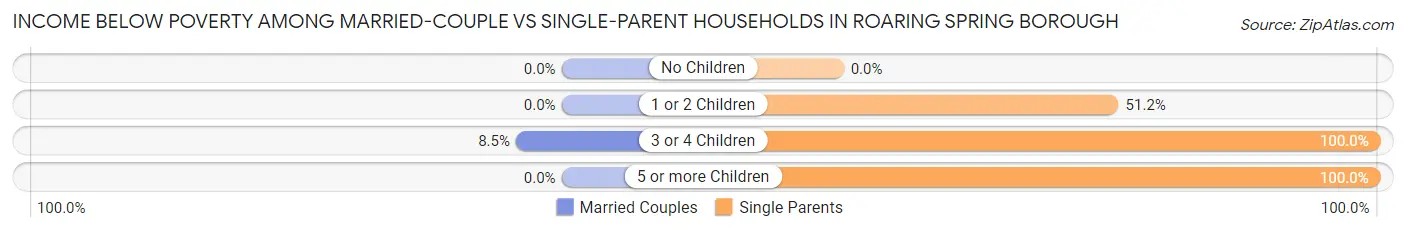
| Children | Married-Couple Families | Single-Parent Households |
| No Children | 0 (0.0%) | 0 (0.0%) |
| 1 or 2 Children | 0 (0.0%) | 63 (51.2%) |
| 3 or 4 Children | 4 (8.5%) | 13 (100.0%) |
| 5 or more Children | 0 (0.0%) | 3 (100.0%) |
| Total | 4 (0.8%) | 79 (31.0%) |
Race in Roaring Spring borough
The most populous races in Roaring Spring borough are White / Caucasian (2,348 | 93.5%), Two or more Races (125 | 5.0%), and Hispanic or Latino (78 | 3.1%).
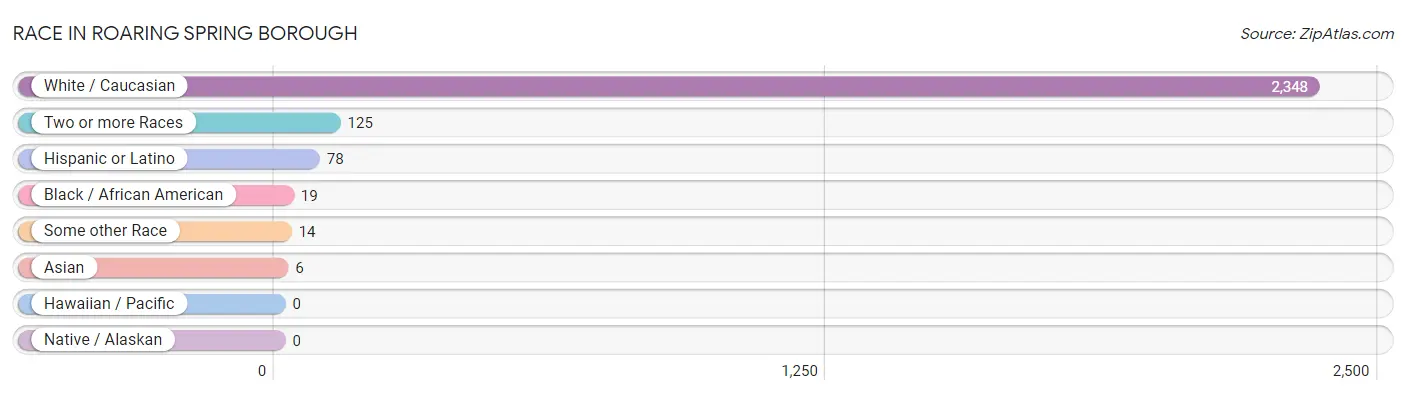
| Race | # Population | % Population |
| Asian | 6 | 0.2% |
| Black / African American | 19 | 0.8% |
| Hawaiian / Pacific | 0 | 0.0% |
| Hispanic or Latino | 78 | 3.1% |
| Native / Alaskan | 0 | 0.0% |
| White / Caucasian | 2,348 | 93.5% |
| Two or more Races | 125 | 5.0% |
| Some other Race | 14 | 0.6% |
| Total | 2,512 | 100.0% |
Ancestry in Roaring Spring borough
The most populous ancestries reported in Roaring Spring borough are German (1,036 | 41.2%), Irish (303 | 12.1%), Italian (193 | 7.7%), American (169 | 6.7%), and English (162 | 6.5%), together accounting for 74.2% of all Roaring Spring borough residents.
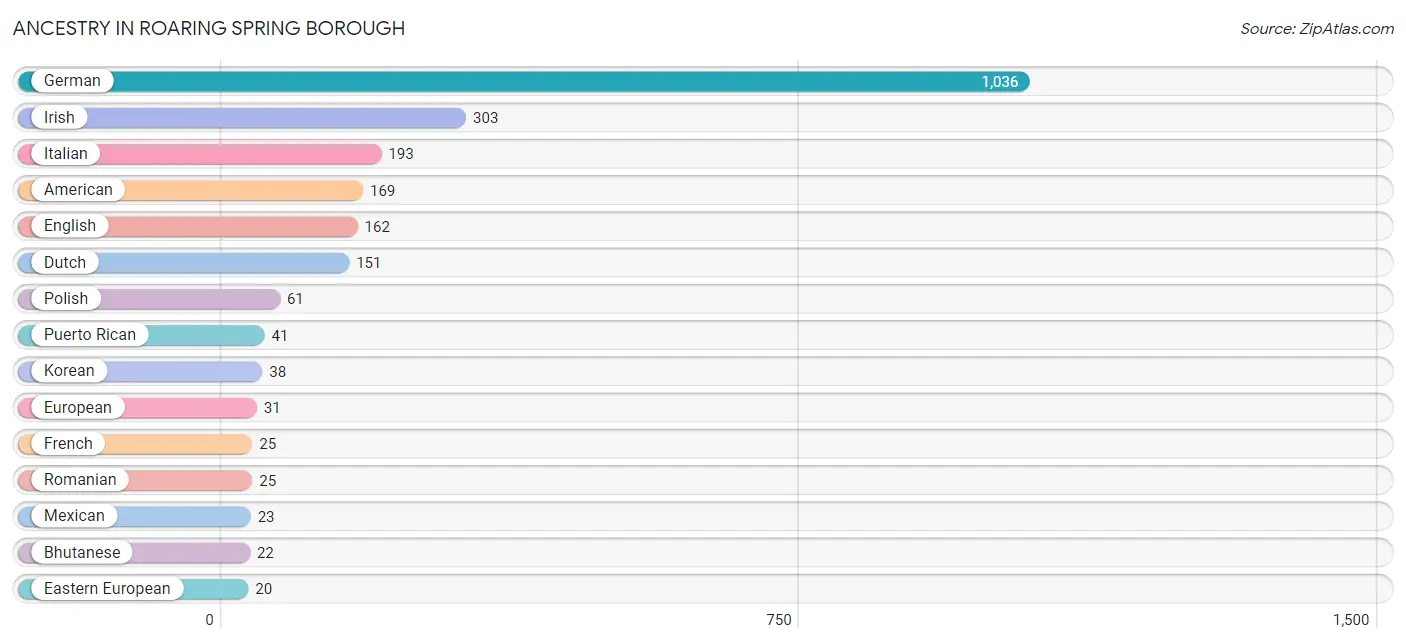
| Ancestry | # Population | % Population |
| American | 169 | 6.7% |
| Austrian | 9 | 0.4% |
| Bhutanese | 22 | 0.9% |
| British | 18 | 0.7% |
| Dutch | 151 | 6.0% |
| Eastern European | 20 | 0.8% |
| Ecuadorian | 14 | 0.6% |
| English | 162 | 6.5% |
| European | 31 | 1.2% |
| French | 25 | 1.0% |
| German | 1,036 | 41.2% |
| Irish | 303 | 12.1% |
| Italian | 193 | 7.7% |
| Korean | 38 | 1.5% |
| Malaysian | 6 | 0.2% |
| Mexican | 23 | 0.9% |
| Norwegian | 9 | 0.4% |
| Pakistani | 6 | 0.2% |
| Pennsylvania German | 3 | 0.1% |
| Polish | 61 | 2.4% |
| Puerto Rican | 41 | 1.6% |
| Romanian | 25 | 1.0% |
| Russian | 4 | 0.2% |
| Scandinavian | 5 | 0.2% |
| Scotch-Irish | 4 | 0.2% |
| Scottish | 3 | 0.1% |
| Slovak | 6 | 0.2% |
| South American | 14 | 0.6% |
| Swedish | 8 | 0.3% |
| Swiss | 5 | 0.2% |
| Welsh | 13 | 0.5% | View All 31 Rows |
Immigrants in Roaring Spring borough
The most numerous immigrant groups reported in Roaring Spring borough came from Ecuador (14 | 0.6%), Latin America (14 | 0.6%), South America (14 | 0.6%), Asia (6 | 0.2%), and Philippines (6 | 0.2%), together accounting for 2.2% of all Roaring Spring borough residents.
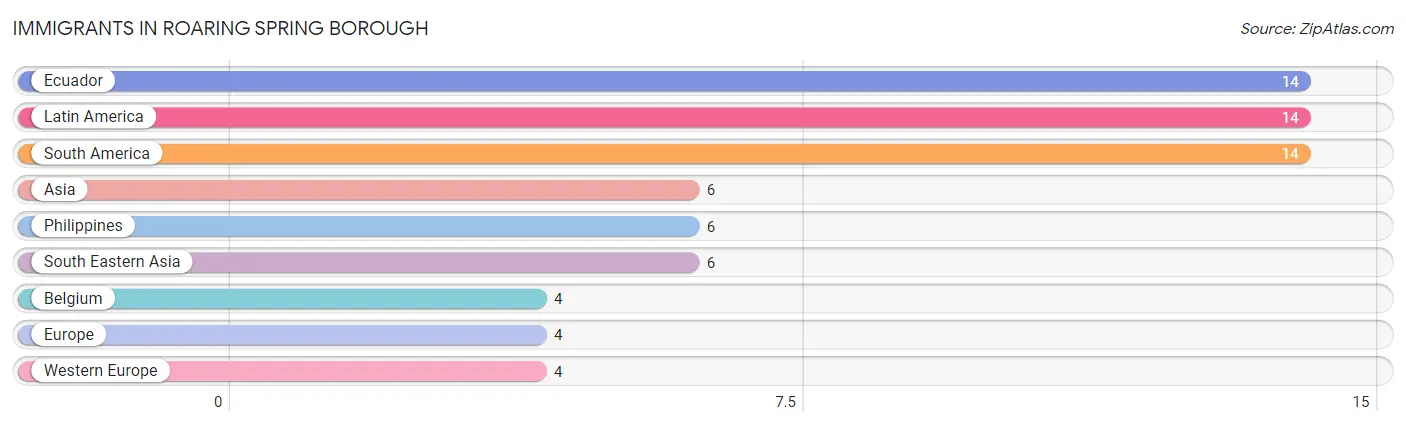
| Immigration Origin | # Population | % Population |
| Asia | 6 | 0.2% |
| Belgium | 4 | 0.2% |
| Ecuador | 14 | 0.6% |
| Europe | 4 | 0.2% |
| Latin America | 14 | 0.6% |
| Philippines | 6 | 0.2% |
| South America | 14 | 0.6% |
| South Eastern Asia | 6 | 0.2% |
| Western Europe | 4 | 0.2% | View All 9 Rows |
Sex and Age in Roaring Spring borough
Sex and Age in Roaring Spring borough
The most populous age groups in Roaring Spring borough are 25 to 29 Years (194 | 17.5%) for men and 25 to 29 Years (138 | 9.9%) for women.
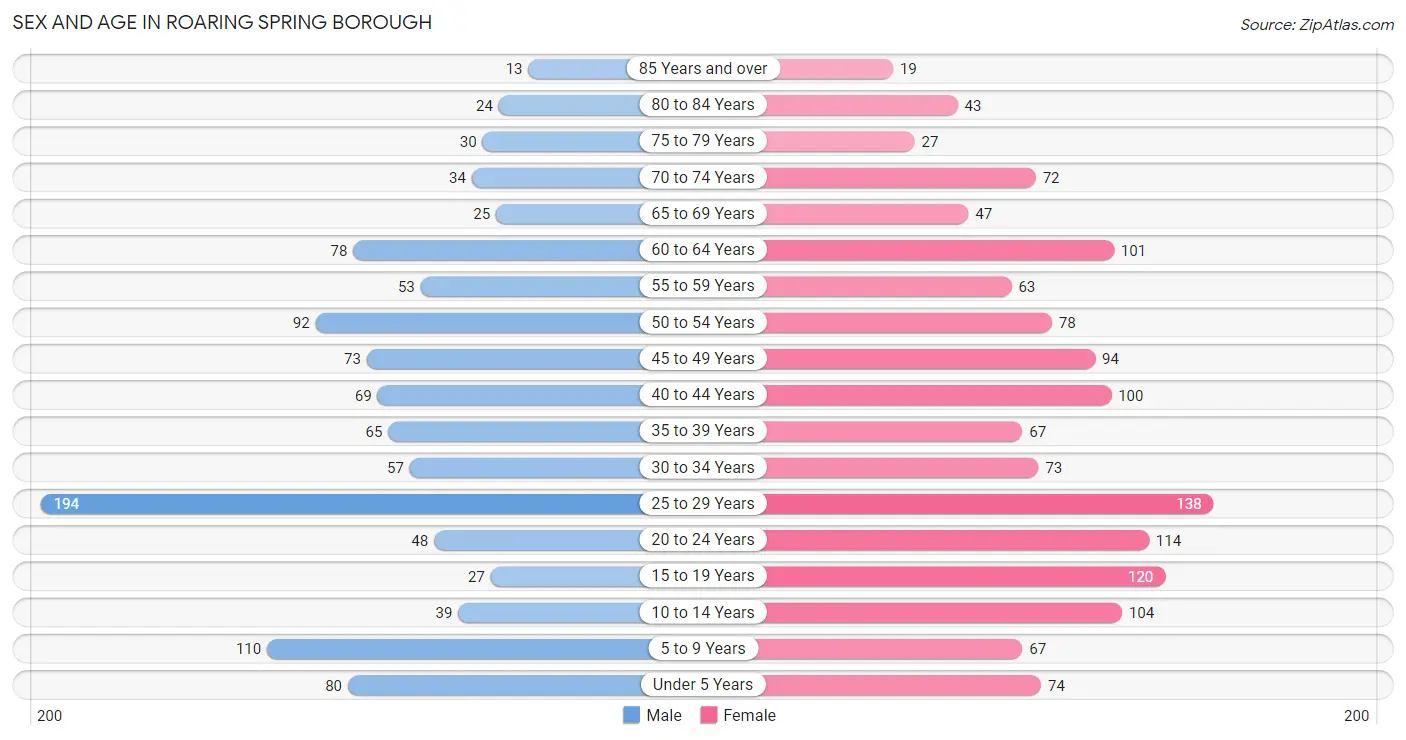
| Age Bracket | Male | Female |
| Under 5 Years | 80 (7.2%) | 74 (5.3%) |
| 5 to 9 Years | 110 (9.9%) | 67 (4.8%) |
| 10 to 14 Years | 39 (3.5%) | 104 (7.4%) |
| 15 to 19 Years | 27 (2.4%) | 120 (8.6%) |
| 20 to 24 Years | 48 (4.3%) | 114 (8.1%) |
| 25 to 29 Years | 194 (17.5%) | 138 (9.9%) |
| 30 to 34 Years | 57 (5.1%) | 73 (5.2%) |
| 35 to 39 Years | 65 (5.9%) | 67 (4.8%) |
| 40 to 44 Years | 69 (6.2%) | 100 (7.1%) |
| 45 to 49 Years | 73 (6.6%) | 94 (6.7%) |
| 50 to 54 Years | 92 (8.3%) | 78 (5.6%) |
| 55 to 59 Years | 53 (4.8%) | 63 (4.5%) |
| 60 to 64 Years | 78 (7.0%) | 101 (7.2%) |
| 65 to 69 Years | 25 (2.2%) | 47 (3.4%) |
| 70 to 74 Years | 34 (3.1%) | 72 (5.1%) |
| 75 to 79 Years | 30 (2.7%) | 27 (1.9%) |
| 80 to 84 Years | 24 (2.2%) | 43 (3.1%) |
| 85 Years and over | 13 (1.2%) | 19 (1.4%) |
| Total | 1,111 (100.0%) | 1,401 (100.0%) |
Families and Households in Roaring Spring borough
Median Family Size in Roaring Spring borough
The median family size in Roaring Spring borough is 2.98 persons per family, with single female/mother families (219 | 29.9%) accounting for the largest median family size of 3.06 persons per family. On the other hand, single male/father families (36 | 4.9%) represent the smallest median family size with 2.64 persons per family.
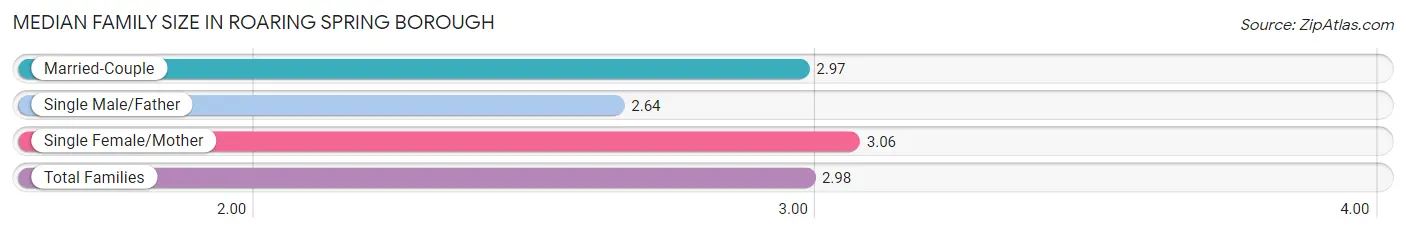
| Family Type | # Families | Family Size |
| Married-Couple | 477 (65.2%) | 2.97 |
| Single Male/Father | 36 (4.9%) | 2.64 |
| Single Female/Mother | 219 (29.9%) | 3.06 |
| Total Families | 732 (100.0%) | 2.98 |
Median Household Size in Roaring Spring borough
The median household size in Roaring Spring borough is 2.48 persons per household, with single female/mother households (219 | 21.7%) accounting for the largest median household size of 3.08 persons per household. non-family households (279 | 27.6%) represent the smallest median household size with 1.13 persons per household.
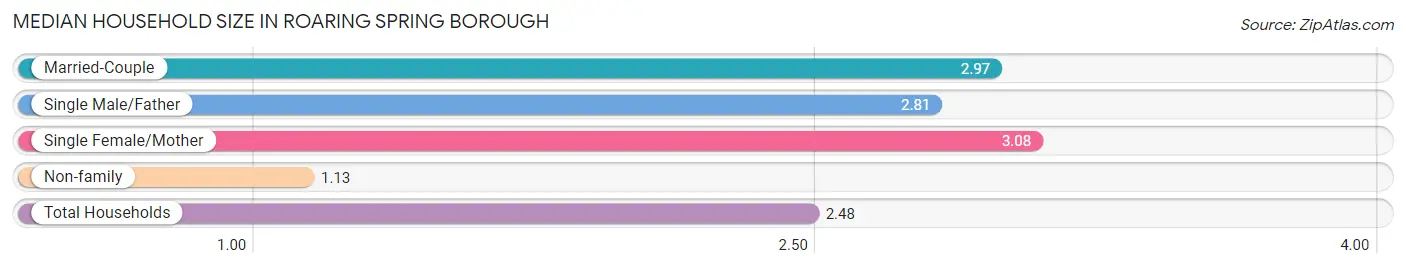
| Household Type | # Households | Household Size |
| Married-Couple | 477 (47.2%) | 2.97 |
| Single Male/Father | 36 (3.6%) | 2.81 |
| Single Female/Mother | 219 (21.7%) | 3.08 |
| Non-family | 279 (27.6%) | 1.13 |
| Total Households | 1,011 (100.0%) | 2.48 |
Household Size by Marriage Status in Roaring Spring borough
Out of a total of 1,011 households in Roaring Spring borough, 732 (72.4%) are family households, while 279 (27.6%) are nonfamily households. The most numerous type of family households are 2-person households, comprising 384, and the most common type of nonfamily households are 1-person households, comprising 248.
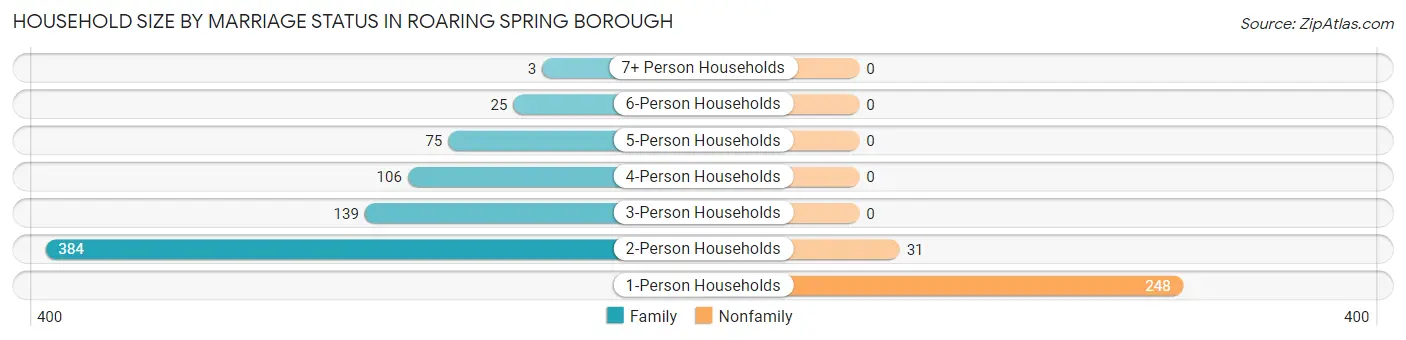
| Household Size | Family Households | Nonfamily Households |
| 1-Person Households | - | 248 (24.5%) |
| 2-Person Households | 384 (38.0%) | 31 (3.1%) |
| 3-Person Households | 139 (13.8%) | 0 (0.0%) |
| 4-Person Households | 106 (10.5%) | 0 (0.0%) |
| 5-Person Households | 75 (7.4%) | 0 (0.0%) |
| 6-Person Households | 25 (2.5%) | 0 (0.0%) |
| 7+ Person Households | 3 (0.3%) | 0 (0.0%) |
| Total | 732 (72.4%) | 279 (27.6%) |
Female Fertility in Roaring Spring borough
Fertility by Age in Roaring Spring borough
Average fertility rate in Roaring Spring borough is 31.0 births per 1,000 women. Women in the age bracket of 20 to 34 years have the highest fertility rate with 37.0 births per 1,000 women. Women in the age bracket of 20 to 34 years acount for 54.5% of all women with births.
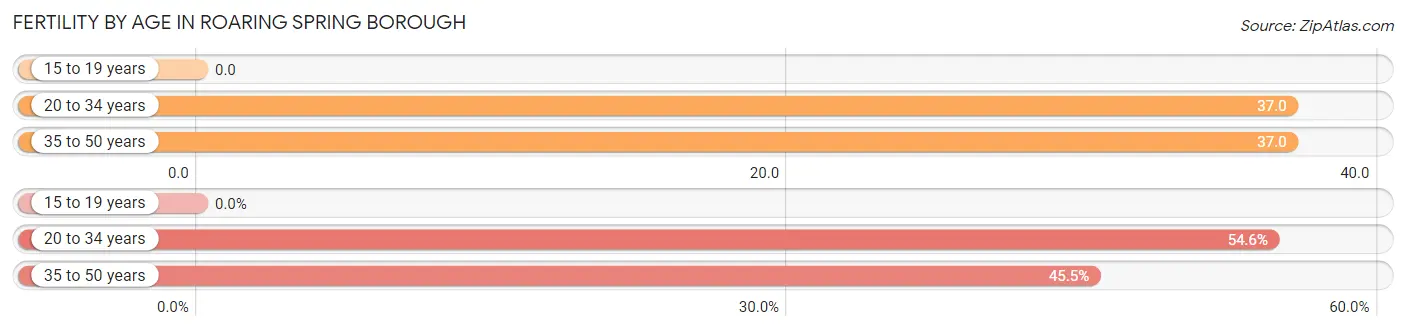
| Age Bracket | Women with Births | Births / 1,000 Women |
| 15 to 19 years | 0 (0.0%) | 0.0 |
| 20 to 34 years | 12 (54.5%) | 37.0 |
| 35 to 50 years | 10 (45.5%) | 37.0 |
| Total | 22 (100.0%) | 31.0 |
Fertility by Age by Marriage Status in Roaring Spring borough
86.4% of women with births (22) in Roaring Spring borough are married. The highest percentage of unmarried women with births falls into 35 to 50 years age bracket with 30.0% of them unmarried at the time of birth, while the lowest percentage of unmarried women with births belong to 20 to 34 years age bracket with 0.0% of them unmarried.
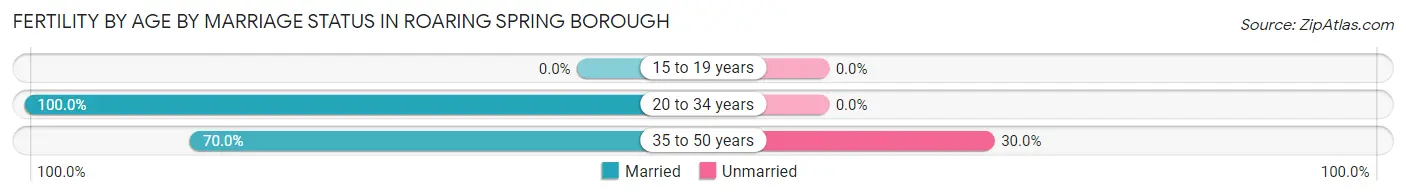
| Age Bracket | Married | Unmarried |
| 15 to 19 years | 0 (0.0%) | 0 (0.0%) |
| 20 to 34 years | 12 (100.0%) | 0 (0.0%) |
| 35 to 50 years | 7 (70.0%) | 3 (30.0%) |
| Total | 19 (86.4%) | 3 (13.6%) |
Fertility by Education in Roaring Spring borough
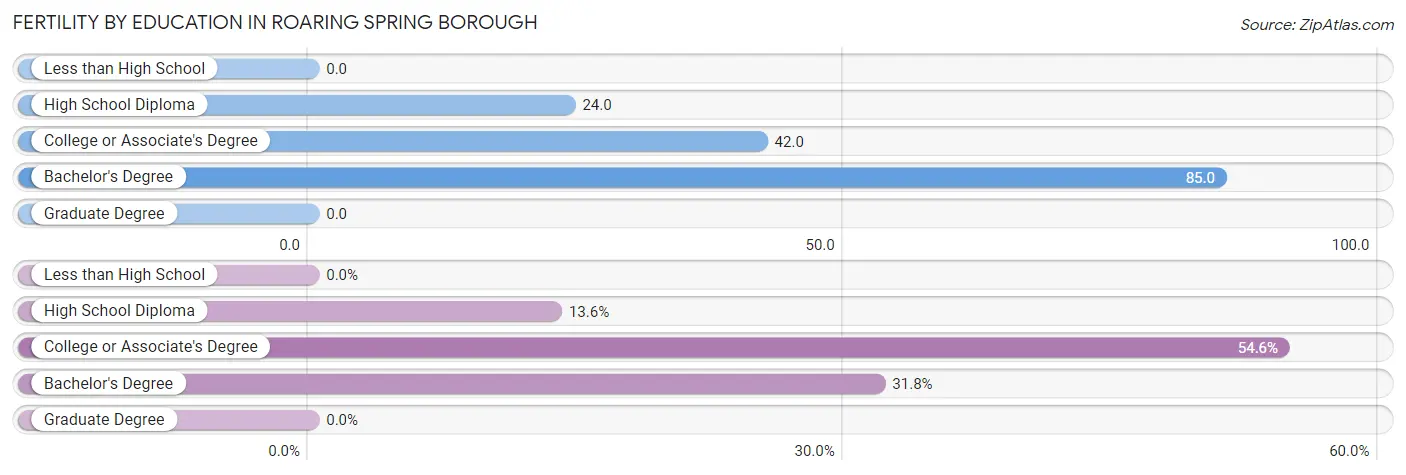
| Educational Attainment | Women with Births | Births / 1,000 Women |
| Less than High School | 0 (0.0%) | 0.0 |
| High School Diploma | 3 (13.6%) | 24.0 |
| College or Associate's Degree | 12 (54.5%) | 42.0 |
| Bachelor's Degree | 7 (31.8%) | 85.0 |
| Graduate Degree | 0 (0.0%) | 0.0 |
| Total | 22 (100.0%) | 31.0 |
Fertility by Education by Marriage Status in Roaring Spring borough
13.6% of women with births in Roaring Spring borough are unmarried. Women with the educational attainment of college or associate's degree are most likely to be married with 100.0% of them married at childbirth, while women with the educational attainment of high school diploma are least likely to be married with 100.0% of them unmarried at childbirth.
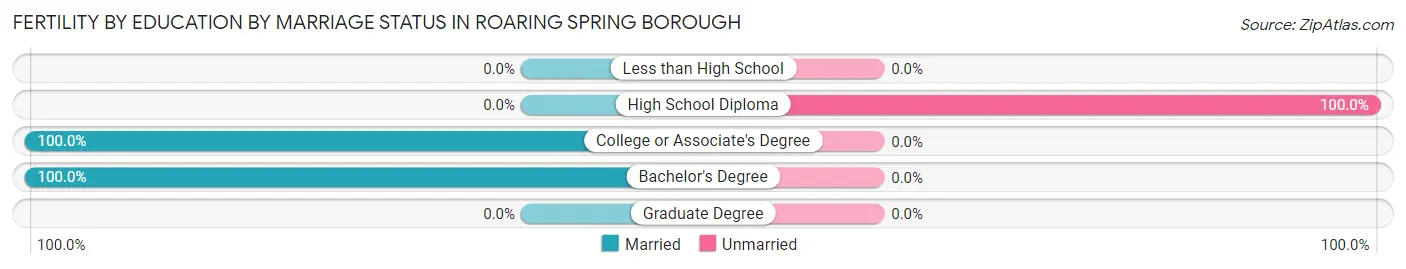
| Educational Attainment | Married | Unmarried |
| Less than High School | 0 (0.0%) | 0 (0.0%) |
| High School Diploma | 0 (0.0%) | 3 (100.0%) |
| College or Associate's Degree | 12 (100.0%) | 0 (0.0%) |
| Bachelor's Degree | 7 (100.0%) | 0 (0.0%) |
| Graduate Degree | 0 (0.0%) | 0 (0.0%) |
| Total | 19 (86.4%) | 3 (13.6%) |
Employment Characteristics in Roaring Spring borough
Employment by Class of Employer in Roaring Spring borough
Among the 1,308 employed individuals in Roaring Spring borough, private company employees (1,048 | 80.1%), not-for-profit organizations (117 | 8.9%), and local government employees (46 | 3.5%) make up the most common classes of employment.
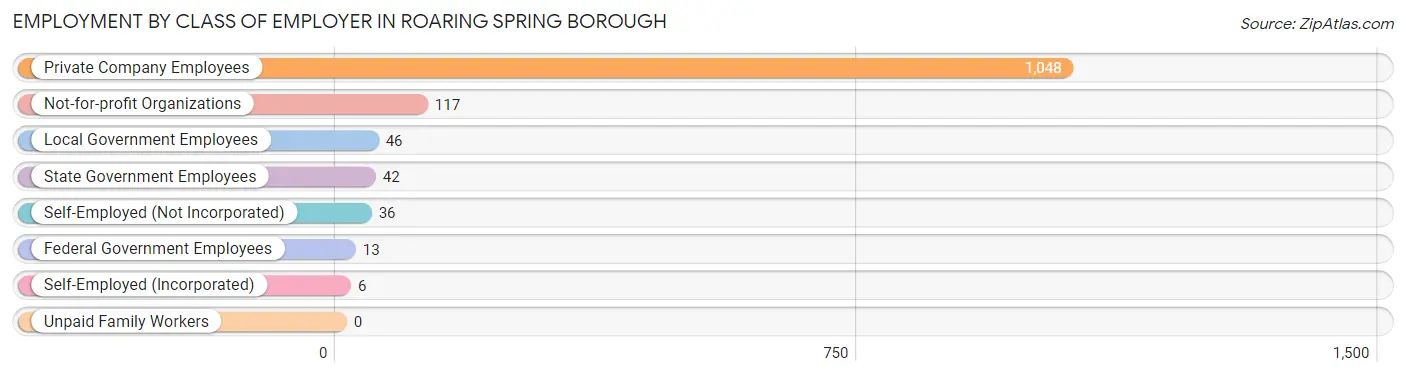
| Employer Class | # Employees | % Employees |
| Private Company Employees | 1,048 | 80.1% |
| Self-Employed (Incorporated) | 6 | 0.5% |
| Self-Employed (Not Incorporated) | 36 | 2.8% |
| Not-for-profit Organizations | 117 | 8.9% |
| Local Government Employees | 46 | 3.5% |
| State Government Employees | 42 | 3.2% |
| Federal Government Employees | 13 | 1.0% |
| Unpaid Family Workers | 0 | 0.0% |
| Total | 1,308 | 100.0% |
Employment Status by Age in Roaring Spring borough
According to the labor force statistics for Roaring Spring borough, out of the total population over 16 years of age (1,961), 71.5% or 1,402 individuals are in the labor force, with 5.7% or 80 of them unemployed. The age group with the highest labor force participation rate is 45 to 54 years, with 97.0% or 327 individuals in the labor force. Within the labor force, the 20 to 24 years age range has the highest percentage of unemployed individuals, with 21.9% or 32 of them being unemployed.
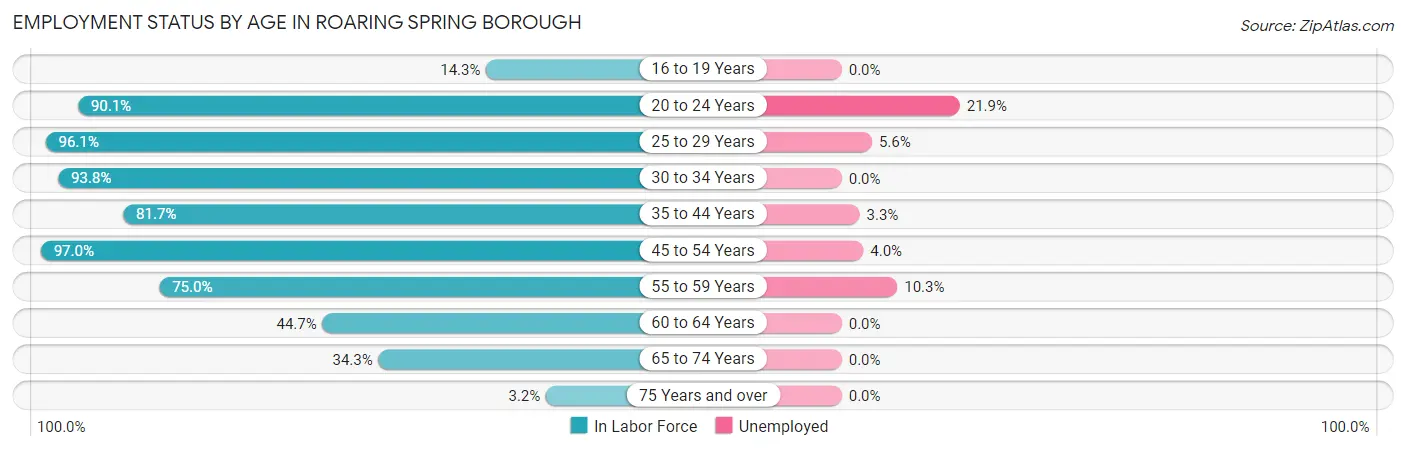
| Age Bracket | In Labor Force | Unemployed |
| 16 to 19 Years | 10 (14.3%) | 0 (0.0%) |
| 20 to 24 Years | 146 (90.1%) | 32 (21.9%) |
| 25 to 29 Years | 319 (96.1%) | 18 (5.6%) |
| 30 to 34 Years | 122 (93.8%) | 0 (0.0%) |
| 35 to 44 Years | 246 (81.7%) | 8 (3.3%) |
| 45 to 54 Years | 327 (97.0%) | 13 (4.0%) |
| 55 to 59 Years | 87 (75.0%) | 9 (10.3%) |
| 60 to 64 Years | 80 (44.7%) | 0 (0.0%) |
| 65 to 74 Years | 61 (34.3%) | 0 (0.0%) |
| 75 Years and over | 5 (3.2%) | 0 (0.0%) |
| Total | 1,402 (71.5%) | 80 (5.7%) |
Employment Status by Educational Attainment in Roaring Spring borough
According to labor force statistics for Roaring Spring borough, 84.7% of individuals (1,182) out of the total population between 25 and 64 years of age (1,395) are in the labor force, with 4.1% or 48 of them being unemployed. The group with the highest labor force participation rate are those with the educational attainment of bachelor's degree or higher, with 92.9% or 260 individuals in the labor force. Within the labor force, individuals with high school diploma education have the highest percentage of unemployment, with 6.7% or 24 of them being unemployed.
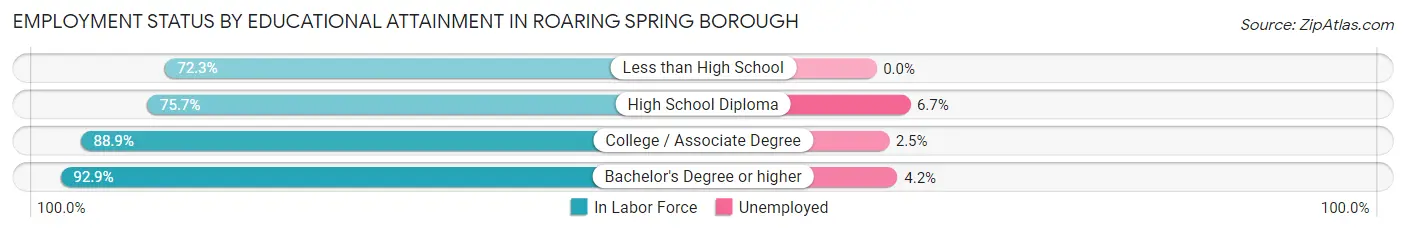
| Educational Attainment | In Labor Force | Unemployed |
| Less than High School | 34 (72.3%) | 0 (0.0%) |
| High School Diploma | 359 (75.7%) | 32 (6.7%) |
| College / Associate Degree | 528 (88.9%) | 15 (2.5%) |
| Bachelor's Degree or higher | 260 (92.9%) | 12 (4.2%) |
| Total | 1,182 (84.7%) | 57 (4.1%) |
Employment Occupations by Sex in Roaring Spring borough
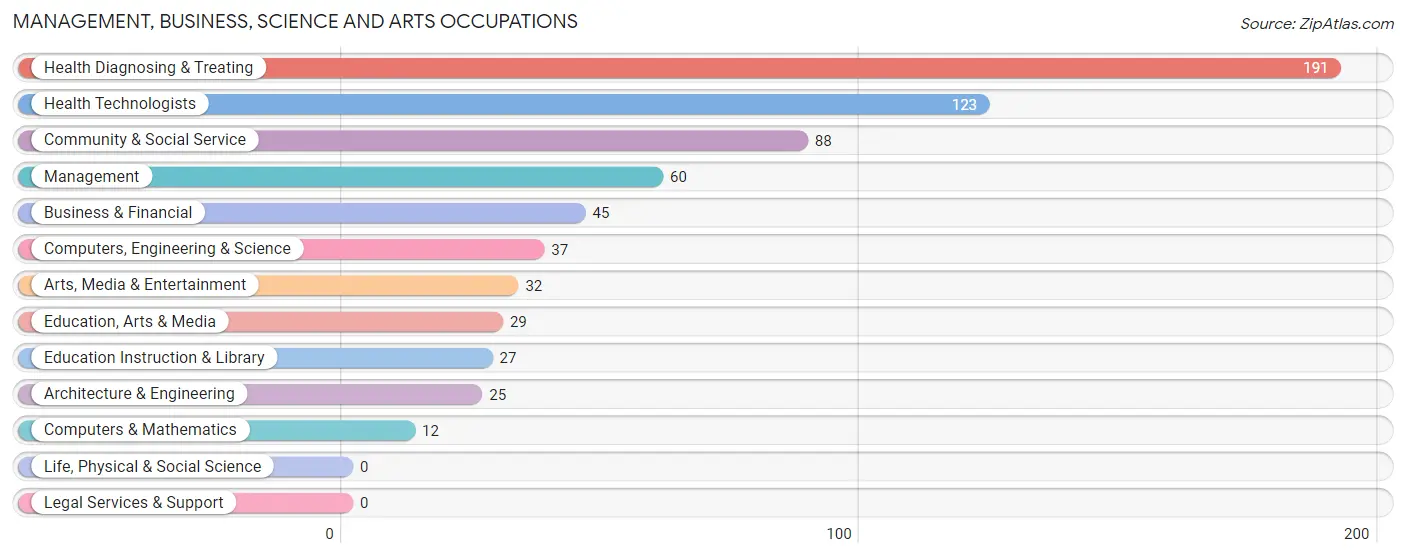
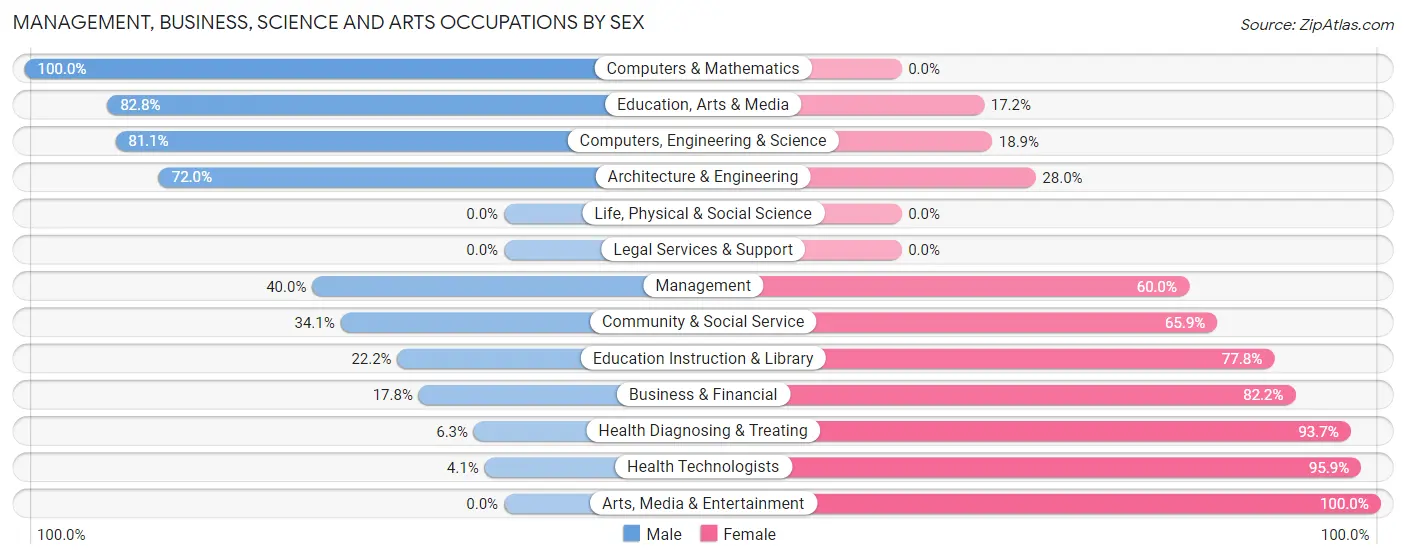
Management, Business, Science and Arts Occupations
The most common Management, Business, Science and Arts occupations in Roaring Spring borough are Health Diagnosing & Treating (191 | 14.4%), Health Technologists (123 | 9.3%), Community & Social Service (88 | 6.7%), Management (60 | 4.5%), and Business & Financial (45 | 3.4%).
Management, Business, Science and Arts Occupations by Sex
Within the Management, Business, Science and Arts occupations in Roaring Spring borough, the most male-oriented occupations are Computers & Mathematics (100.0%), Education, Arts & Media (82.8%), and Computers, Engineering & Science (81.1%), while the most female-oriented occupations are Arts, Media & Entertainment (100.0%), Health Technologists (95.9%), and Health Diagnosing & Treating (93.7%).
| Occupation | Male | Female |
| Management | 24 (40.0%) | 36 (60.0%) |
| Business & Financial | 8 (17.8%) | 37 (82.2%) |
| Computers, Engineering & Science | 30 (81.1%) | 7 (18.9%) |
| Computers & Mathematics | 12 (100.0%) | 0 (0.0%) |
| Architecture & Engineering | 18 (72.0%) | 7 (28.0%) |
| Life, Physical & Social Science | 0 (0.0%) | 0 (0.0%) |
| Community & Social Service | 30 (34.1%) | 58 (65.9%) |
| Education, Arts & Media | 24 (82.8%) | 5 (17.2%) |
| Legal Services & Support | 0 (0.0%) | 0 (0.0%) |
| Education Instruction & Library | 6 (22.2%) | 21 (77.8%) |
| Arts, Media & Entertainment | 0 (0.0%) | 32 (100.0%) |
| Health Diagnosing & Treating | 12 (6.3%) | 179 (93.7%) |
| Health Technologists | 5 (4.1%) | 118 (95.9%) |
| Total (Category) | 104 (24.7%) | 317 (75.3%) |
| Total (Overall) | 631 (47.7%) | 692 (52.3%) |
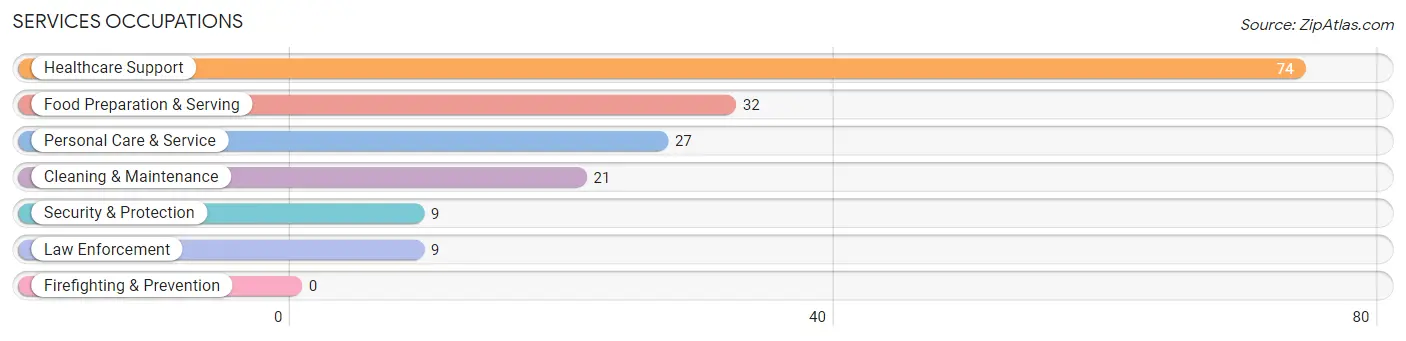
Services Occupations
The most common Services occupations in Roaring Spring borough are Healthcare Support (74 | 5.6%), Food Preparation & Serving (32 | 2.4%), Personal Care & Service (27 | 2.0%), Cleaning & Maintenance (21 | 1.6%), and Security & Protection (9 | 0.7%).
Services Occupations by Sex
Within the Services occupations in Roaring Spring borough, the most male-oriented occupations are Security & Protection (100.0%), Law Enforcement (100.0%), and Cleaning & Maintenance (71.4%), while the most female-oriented occupations are Personal Care & Service (100.0%), Food Preparation & Serving (84.4%), and Healthcare Support (64.9%).
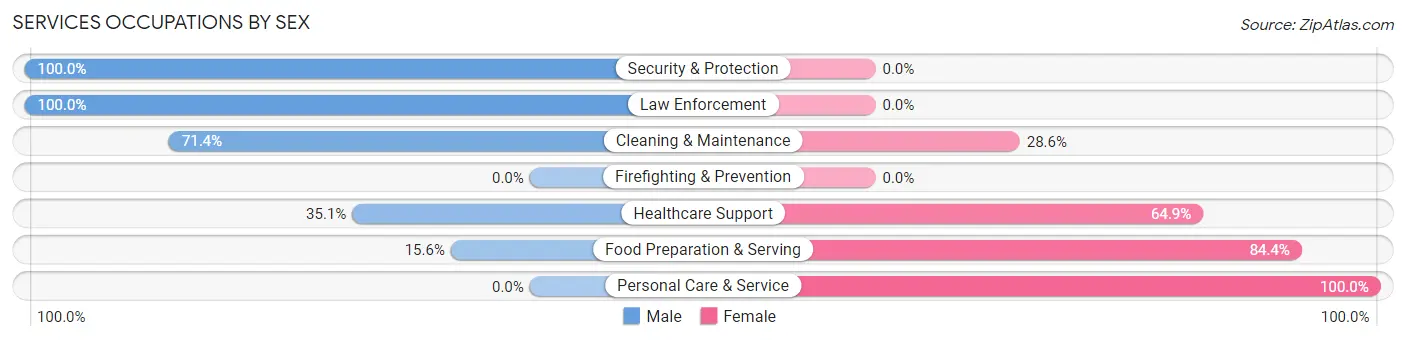
| Occupation | Male | Female |
| Healthcare Support | 26 (35.1%) | 48 (64.9%) |
| Security & Protection | 9 (100.0%) | 0 (0.0%) |
| Firefighting & Prevention | 0 (0.0%) | 0 (0.0%) |
| Law Enforcement | 9 (100.0%) | 0 (0.0%) |
| Food Preparation & Serving | 5 (15.6%) | 27 (84.4%) |
| Cleaning & Maintenance | 15 (71.4%) | 6 (28.6%) |
| Personal Care & Service | 0 (0.0%) | 27 (100.0%) |
| Total (Category) | 55 (33.7%) | 108 (66.3%) |
| Total (Overall) | 631 (47.7%) | 692 (52.3%) |
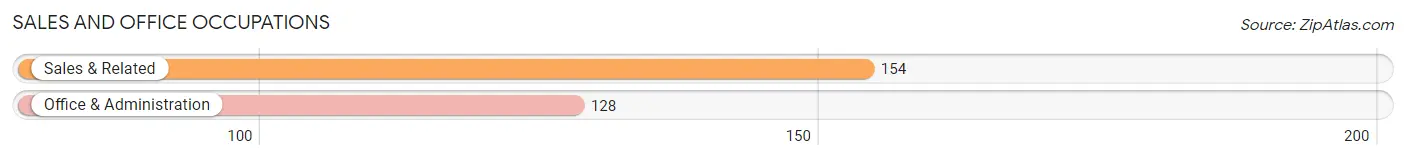
Sales and Office Occupations
The most common Sales and Office occupations in Roaring Spring borough are Sales & Related (154 | 11.6%), and Office & Administration (128 | 9.7%).
Sales and Office Occupations by Sex
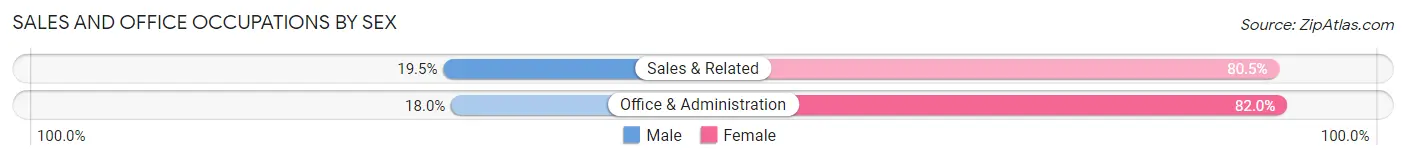
| Occupation | Male | Female |
| Sales & Related | 30 (19.5%) | 124 (80.5%) |
| Office & Administration | 23 (18.0%) | 105 (82.0%) |
| Total (Category) | 53 (18.8%) | 229 (81.2%) |
| Total (Overall) | 631 (47.7%) | 692 (52.3%) |
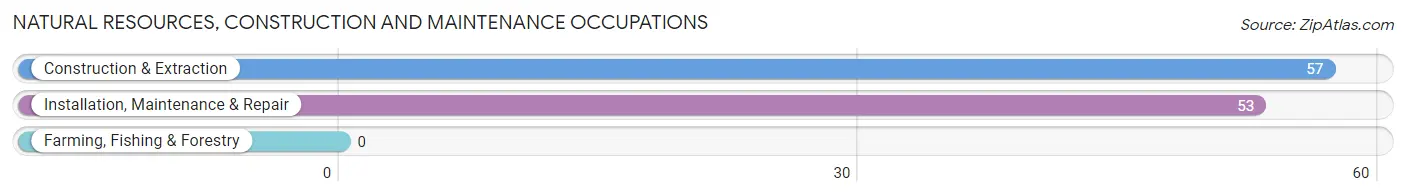
Natural Resources, Construction and Maintenance Occupations
The most common Natural Resources, Construction and Maintenance occupations in Roaring Spring borough are Construction & Extraction (57 | 4.3%), and Installation, Maintenance & Repair (53 | 4.0%).
Natural Resources, Construction and Maintenance Occupations by Sex
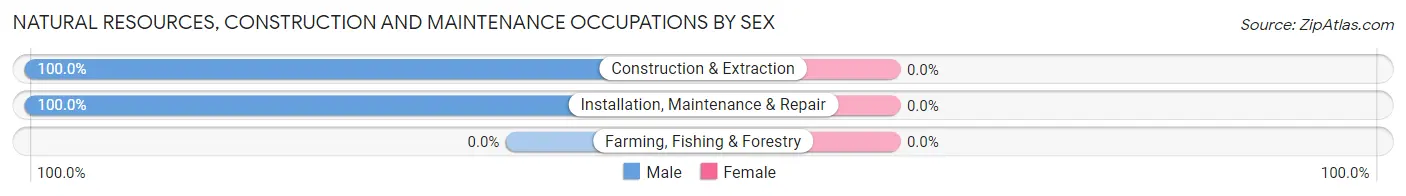
| Occupation | Male | Female |
| Farming, Fishing & Forestry | 0 (0.0%) | 0 (0.0%) |
| Construction & Extraction | 57 (100.0%) | 0 (0.0%) |
| Installation, Maintenance & Repair | 53 (100.0%) | 0 (0.0%) |
| Total (Category) | 110 (100.0%) | 0 (0.0%) |
| Total (Overall) | 631 (47.7%) | 692 (52.3%) |
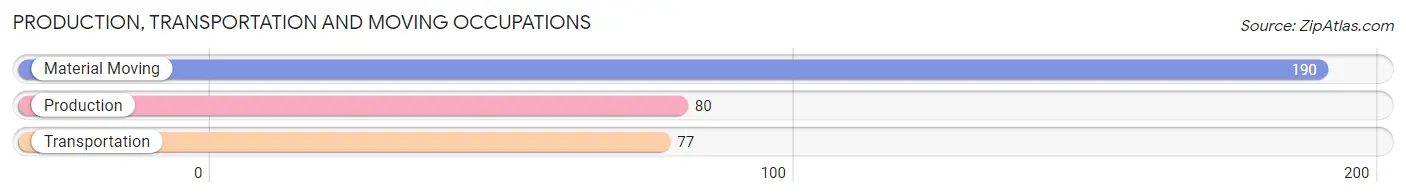
Production, Transportation and Moving Occupations
The most common Production, Transportation and Moving occupations in Roaring Spring borough are Material Moving (190 | 14.4%), Production (80 | 6.0%), and Transportation (77 | 5.8%).
Production, Transportation and Moving Occupations by Sex
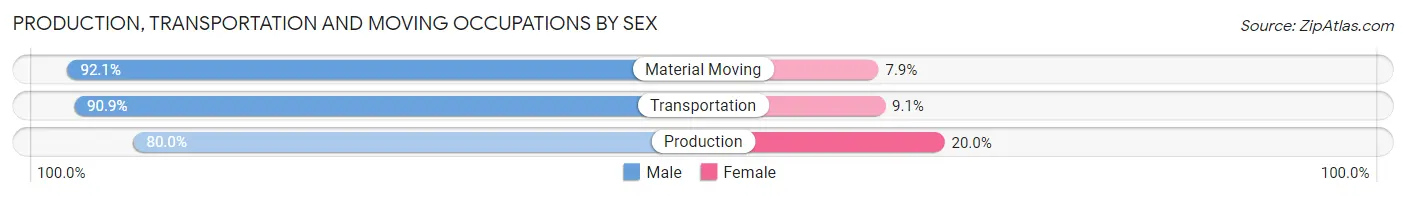
| Occupation | Male | Female |
| Production | 64 (80.0%) | 16 (20.0%) |
| Transportation | 70 (90.9%) | 7 (9.1%) |
| Material Moving | 175 (92.1%) | 15 (7.9%) |
| Total (Category) | 309 (89.0%) | 38 (11.0%) |
| Total (Overall) | 631 (47.7%) | 692 (52.3%) |
Employment Industries by Sex in Roaring Spring borough
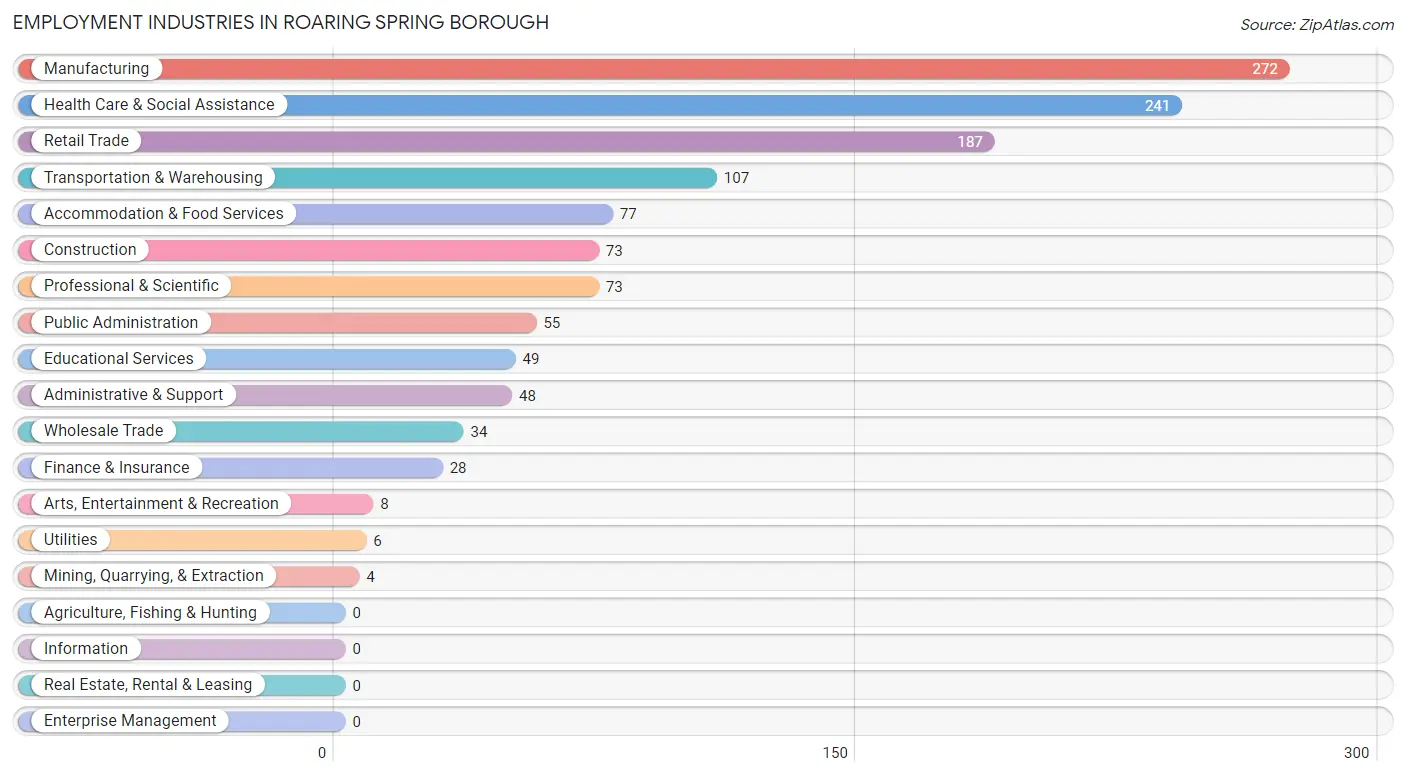
Employment Industries in Roaring Spring borough
The major employment industries in Roaring Spring borough include Manufacturing (272 | 20.6%), Health Care & Social Assistance (241 | 18.2%), Retail Trade (187 | 14.1%), Transportation & Warehousing (107 | 8.1%), and Accommodation & Food Services (77 | 5.8%).
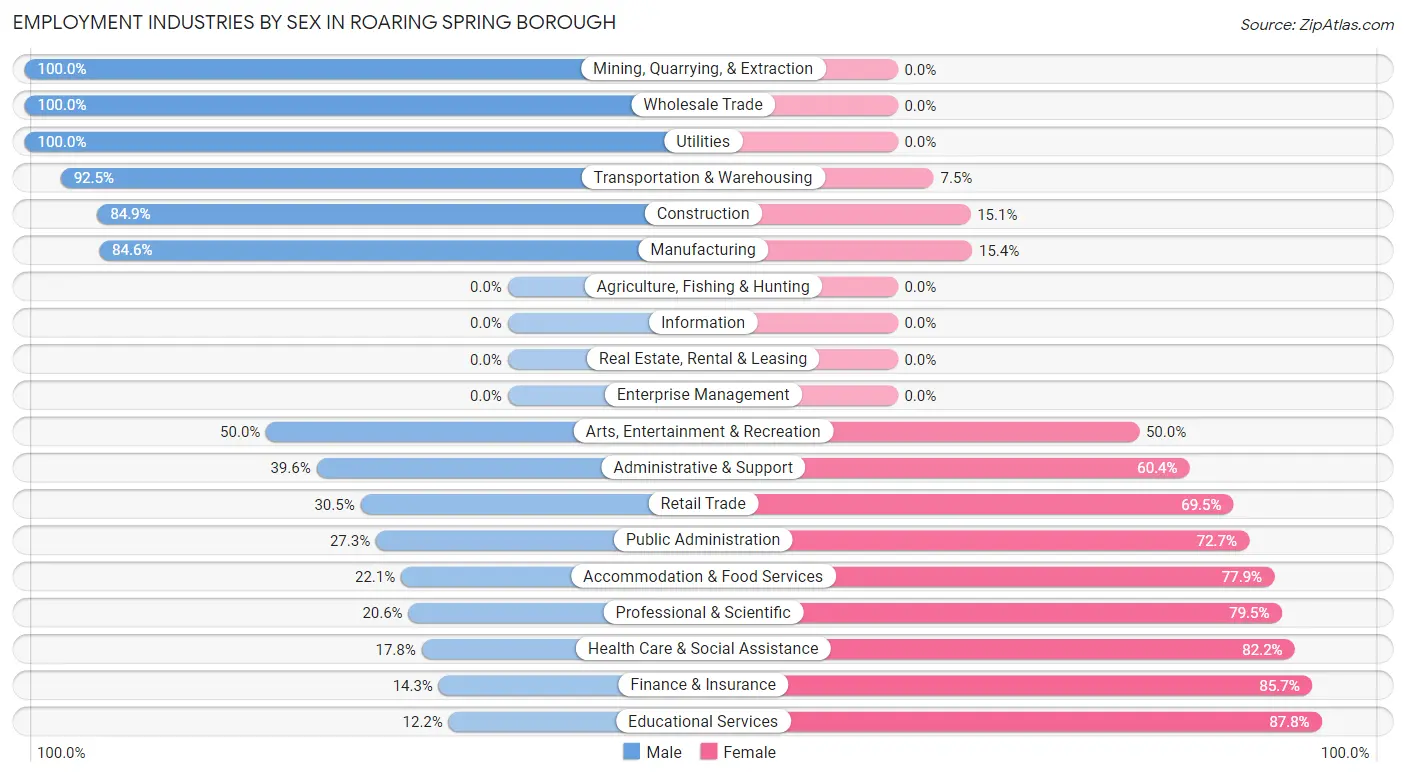
Employment Industries by Sex in Roaring Spring borough
The Roaring Spring borough industries that see more men than women are Mining, Quarrying, & Extraction (100.0%), Wholesale Trade (100.0%), and Utilities (100.0%), whereas the industries that tend to have a higher number of women are Educational Services (87.8%), Finance & Insurance (85.7%), and Health Care & Social Assistance (82.2%).
| Industry | Male | Female |
| Agriculture, Fishing & Hunting | 0 (0.0%) | 0 (0.0%) |
| Mining, Quarrying, & Extraction | 4 (100.0%) | 0 (0.0%) |
| Construction | 62 (84.9%) | 11 (15.1%) |
| Manufacturing | 230 (84.6%) | 42 (15.4%) |
| Wholesale Trade | 34 (100.0%) | 0 (0.0%) |
| Retail Trade | 57 (30.5%) | 130 (69.5%) |
| Transportation & Warehousing | 99 (92.5%) | 8 (7.5%) |
| Utilities | 6 (100.0%) | 0 (0.0%) |
| Information | 0 (0.0%) | 0 (0.0%) |
| Finance & Insurance | 4 (14.3%) | 24 (85.7%) |
| Real Estate, Rental & Leasing | 0 (0.0%) | 0 (0.0%) |
| Professional & Scientific | 15 (20.5%) | 58 (79.4%) |
| Enterprise Management | 0 (0.0%) | 0 (0.0%) |
| Administrative & Support | 19 (39.6%) | 29 (60.4%) |
| Educational Services | 6 (12.2%) | 43 (87.8%) |
| Health Care & Social Assistance | 43 (17.8%) | 198 (82.2%) |
| Arts, Entertainment & Recreation | 4 (50.0%) | 4 (50.0%) |
| Accommodation & Food Services | 17 (22.1%) | 60 (77.9%) |
| Public Administration | 15 (27.3%) | 40 (72.7%) |
| Total | 631 (47.7%) | 692 (52.3%) |
Education in Roaring Spring borough
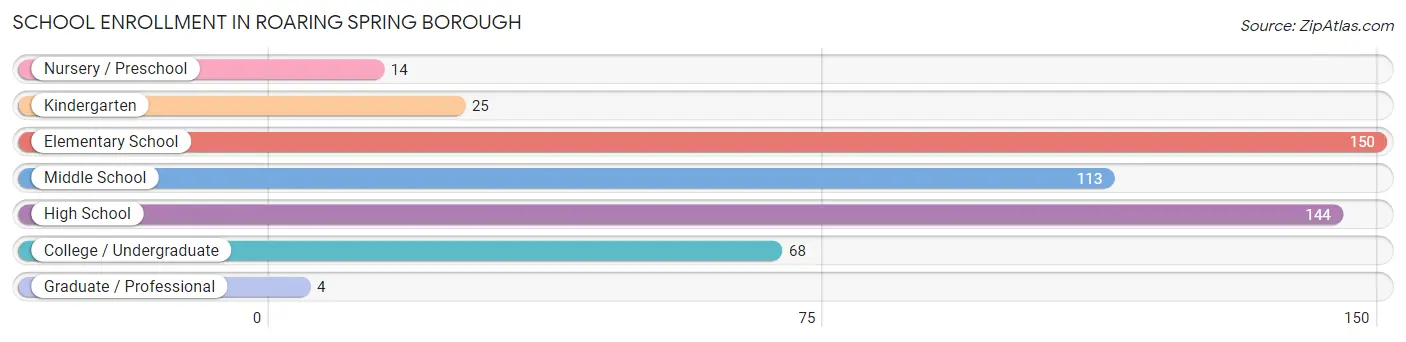
School Enrollment in Roaring Spring borough
The most common levels of schooling among the 518 students in Roaring Spring borough are elementary school (150 | 29.0%), high school (144 | 27.8%), and middle school (113 | 21.8%).
| School Level | # Students | % Students |
| Nursery / Preschool | 14 | 2.7% |
| Kindergarten | 25 | 4.8% |
| Elementary School | 150 | 29.0% |
| Middle School | 113 | 21.8% |
| High School | 144 | 27.8% |
| College / Undergraduate | 68 | 13.1% |
| Graduate / Professional | 4 | 0.8% |
| Total | 518 | 100.0% |
School Enrollment by Age by Funding Source in Roaring Spring borough
Out of a total of 518 students who are enrolled in schools in Roaring Spring borough, 33 (6.4%) attend a private institution, while the remaining 485 (93.6%) are enrolled in public schools. The age group of 10 to 14 year olds has the highest likelihood of being enrolled in private schools, with 14 (9.8% in the age bracket) enrolled. Conversely, the age group of 3 to 4 year olds has the lowest likelihood of being enrolled in a private school, with 4 (100.0% in the age bracket) attending a public institution.
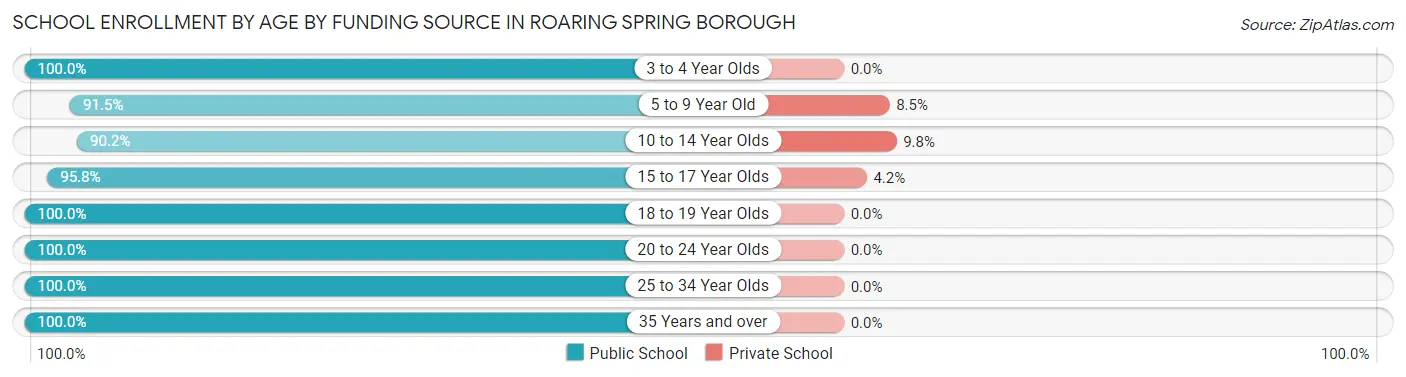
| Age Bracket | Public School | Private School |
| 3 to 4 Year Olds | 4 (100.0%) | 0 (0.0%) |
| 5 to 9 Year Old | 151 (91.5%) | 14 (8.5%) |
| 10 to 14 Year Olds | 129 (90.2%) | 14 (9.8%) |
| 15 to 17 Year Olds | 113 (95.8%) | 5 (4.2%) |
| 18 to 19 Year Olds | 28 (100.0%) | 0 (0.0%) |
| 20 to 24 Year Olds | 21 (100.0%) | 0 (0.0%) |
| 25 to 34 Year Olds | 22 (100.0%) | 0 (0.0%) |
| 35 Years and over | 17 (100.0%) | 0 (0.0%) |
| Total | 485 (93.6%) | 33 (6.4%) |
Educational Attainment by Field of Study in Roaring Spring borough
Science & technology (109 | 32.9%), business (48 | 14.5%), education (47 | 14.2%), arts & humanities (40 | 12.1%), and bio, nature & agricultural (19 | 5.7%) are the most common fields of study among 331 individuals in Roaring Spring borough who have obtained a bachelor's degree or higher.
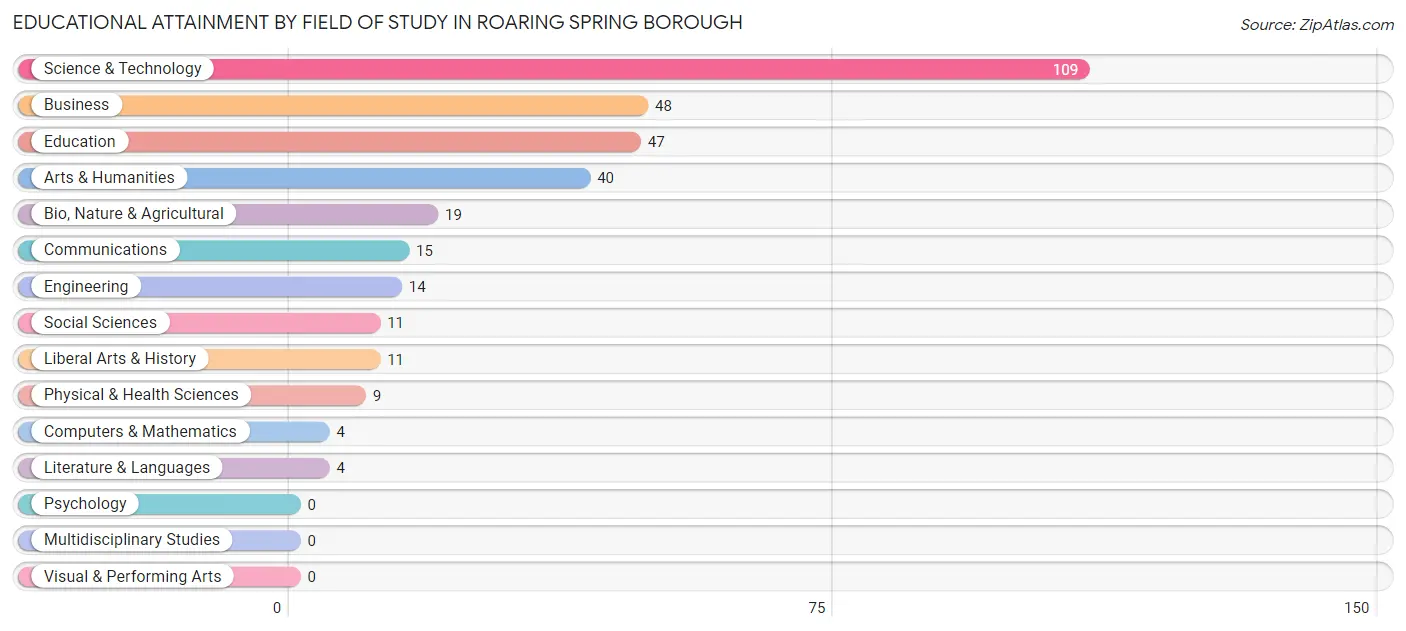
| Field of Study | # Graduates | % Graduates |
| Computers & Mathematics | 4 | 1.2% |
| Bio, Nature & Agricultural | 19 | 5.7% |
| Physical & Health Sciences | 9 | 2.7% |
| Psychology | 0 | 0.0% |
| Social Sciences | 11 | 3.3% |
| Engineering | 14 | 4.2% |
| Multidisciplinary Studies | 0 | 0.0% |
| Science & Technology | 109 | 32.9% |
| Business | 48 | 14.5% |
| Education | 47 | 14.2% |
| Literature & Languages | 4 | 1.2% |
| Liberal Arts & History | 11 | 3.3% |
| Visual & Performing Arts | 0 | 0.0% |
| Communications | 15 | 4.5% |
| Arts & Humanities | 40 | 12.1% |
| Total | 331 | 100.0% |
Transportation & Commute in Roaring Spring borough
Vehicle Availability by Sex in Roaring Spring borough
The most prevalent vehicle ownership categories in Roaring Spring borough are males with 2 vehicles (350, accounting for 56.5%) and females with 2 vehicles (316, making up 50.9%).
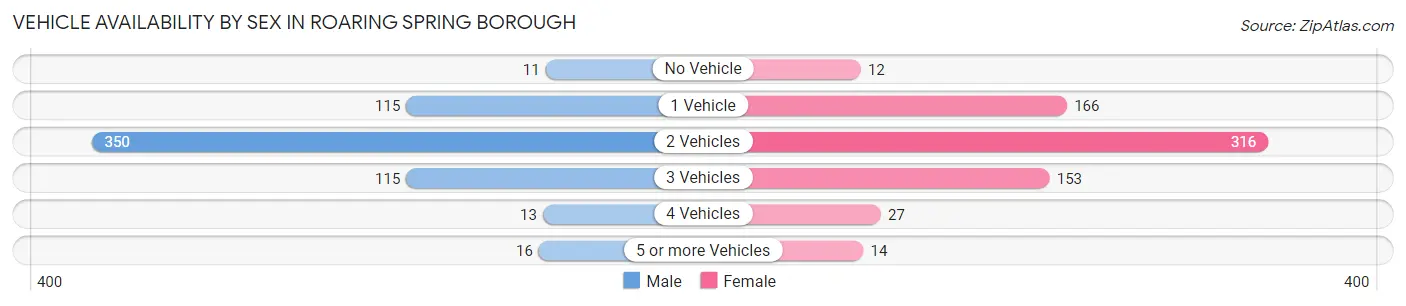
| Vehicles Available | Male | Female |
| No Vehicle | 11 (1.8%) | 12 (1.7%) |
| 1 Vehicle | 115 (18.5%) | 166 (24.1%) |
| 2 Vehicles | 350 (56.5%) | 316 (45.9%) |
| 3 Vehicles | 115 (18.5%) | 153 (22.2%) |
| 4 Vehicles | 13 (2.1%) | 27 (3.9%) |
| 5 or more Vehicles | 16 (2.6%) | 14 (2.0%) |
| Total | 620 (100.0%) | 688 (100.0%) |
Commute Time in Roaring Spring borough
The most frequently occuring commute durations in Roaring Spring borough are 15 to 19 minutes (211 commuters, 17.0%), 5 to 9 minutes (189 commuters, 15.2%), and 30 to 34 minutes (157 commuters, 12.7%).
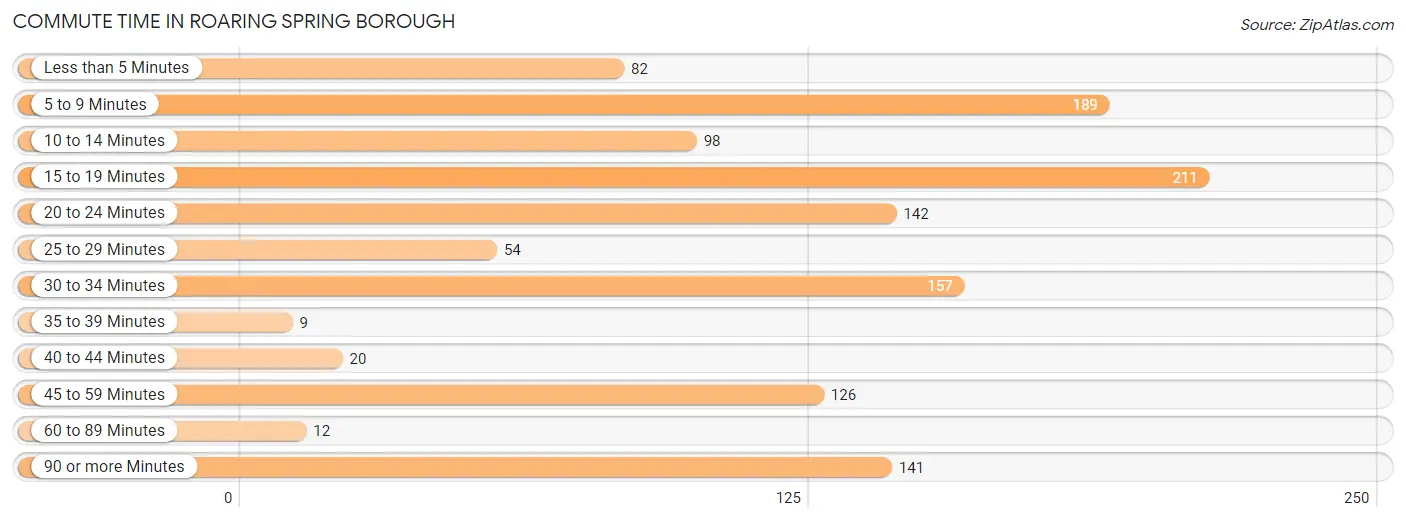
| Commute Time | # Commuters | % Commuters |
| Less than 5 Minutes | 82 | 6.6% |
| 5 to 9 Minutes | 189 | 15.2% |
| 10 to 14 Minutes | 98 | 7.9% |
| 15 to 19 Minutes | 211 | 17.0% |
| 20 to 24 Minutes | 142 | 11.4% |
| 25 to 29 Minutes | 54 | 4.3% |
| 30 to 34 Minutes | 157 | 12.7% |
| 35 to 39 Minutes | 9 | 0.7% |
| 40 to 44 Minutes | 20 | 1.6% |
| 45 to 59 Minutes | 126 | 10.2% |
| 60 to 89 Minutes | 12 | 1.0% |
| 90 or more Minutes | 141 | 11.4% |
Commute Time by Sex in Roaring Spring borough
The most common commute times in Roaring Spring borough are 15 to 19 minutes (141 commuters, 23.7%) for males and 5 to 9 minutes (109 commuters, 16.9%) for females.
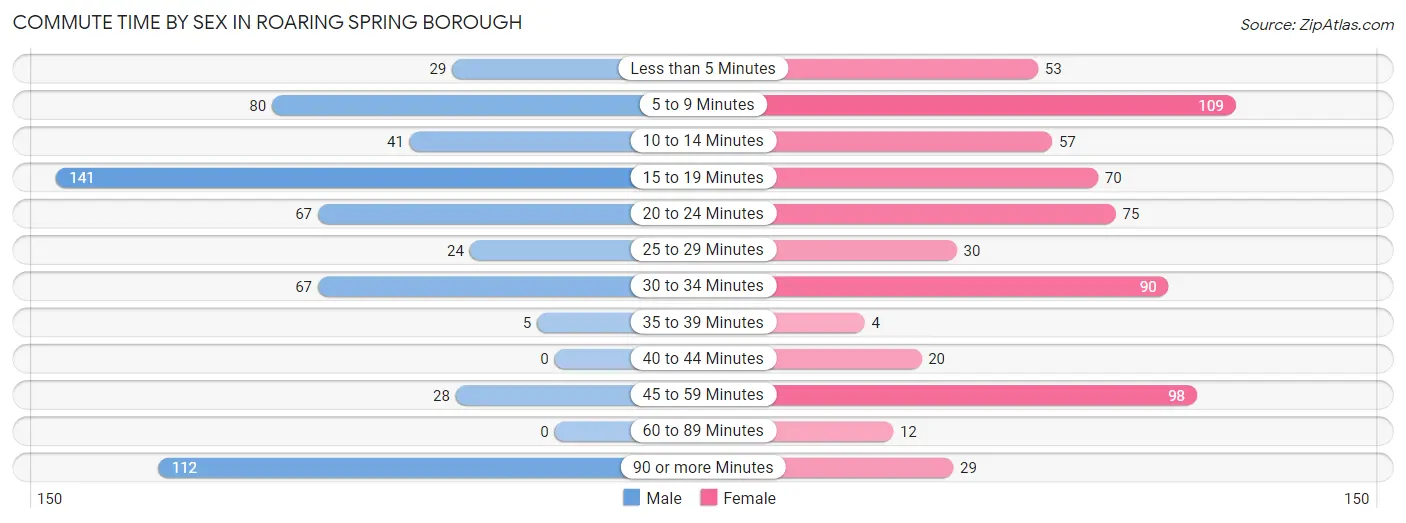
| Commute Time | Male | Female |
| Less than 5 Minutes | 29 (4.9%) | 53 (8.2%) |
| 5 to 9 Minutes | 80 (13.5%) | 109 (16.9%) |
| 10 to 14 Minutes | 41 (6.9%) | 57 (8.8%) |
| 15 to 19 Minutes | 141 (23.7%) | 70 (10.8%) |
| 20 to 24 Minutes | 67 (11.3%) | 75 (11.6%) |
| 25 to 29 Minutes | 24 (4.0%) | 30 (4.6%) |
| 30 to 34 Minutes | 67 (11.3%) | 90 (13.9%) |
| 35 to 39 Minutes | 5 (0.8%) | 4 (0.6%) |
| 40 to 44 Minutes | 0 (0.0%) | 20 (3.1%) |
| 45 to 59 Minutes | 28 (4.7%) | 98 (15.1%) |
| 60 to 89 Minutes | 0 (0.0%) | 12 (1.8%) |
| 90 or more Minutes | 112 (18.9%) | 29 (4.5%) |
Time of Departure to Work by Sex in Roaring Spring borough
The most frequent times of departure to work in Roaring Spring borough are 12:00 AM to 4:59 AM (162, 27.3%) for males and 7:00 AM to 7:29 AM (89, 13.8%) for females.
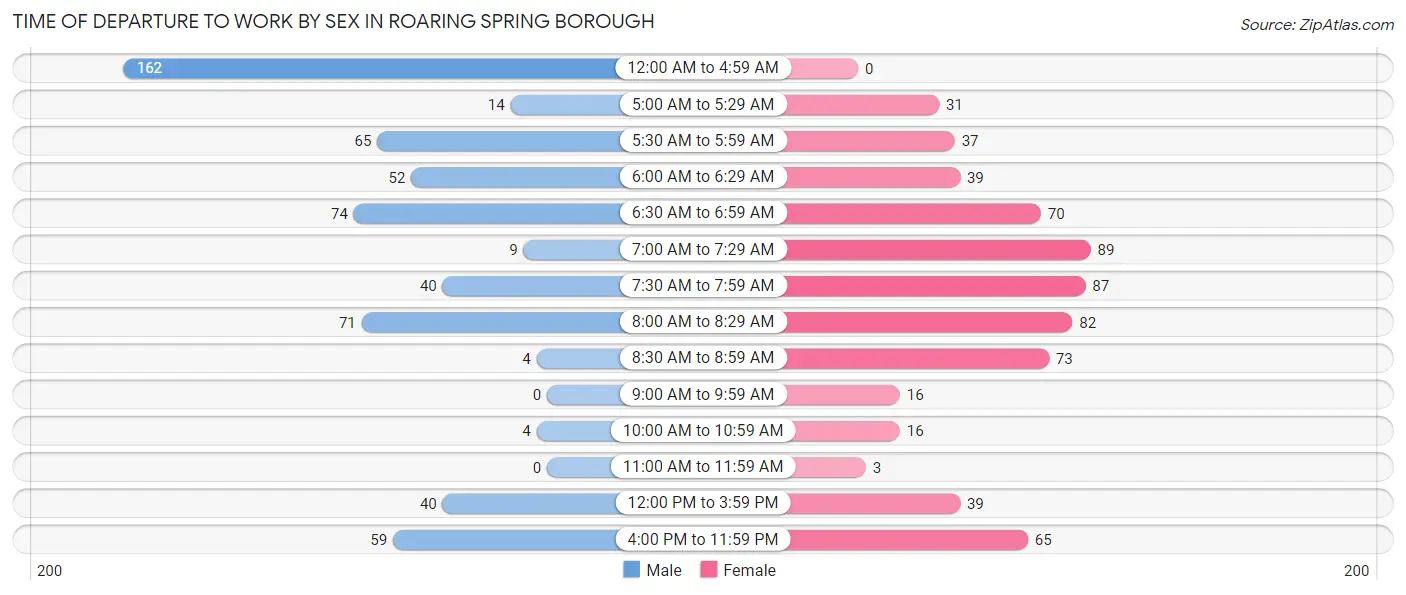
| Time of Departure | Male | Female |
| 12:00 AM to 4:59 AM | 162 (27.3%) | 0 (0.0%) |
| 5:00 AM to 5:29 AM | 14 (2.4%) | 31 (4.8%) |
| 5:30 AM to 5:59 AM | 65 (10.9%) | 37 (5.7%) |
| 6:00 AM to 6:29 AM | 52 (8.7%) | 39 (6.0%) |
| 6:30 AM to 6:59 AM | 74 (12.5%) | 70 (10.8%) |
| 7:00 AM to 7:29 AM | 9 (1.5%) | 89 (13.8%) |
| 7:30 AM to 7:59 AM | 40 (6.7%) | 87 (13.5%) |
| 8:00 AM to 8:29 AM | 71 (11.9%) | 82 (12.7%) |
| 8:30 AM to 8:59 AM | 4 (0.7%) | 73 (11.3%) |
| 9:00 AM to 9:59 AM | 0 (0.0%) | 16 (2.5%) |
| 10:00 AM to 10:59 AM | 4 (0.7%) | 16 (2.5%) |
| 11:00 AM to 11:59 AM | 0 (0.0%) | 3 (0.5%) |
| 12:00 PM to 3:59 PM | 40 (6.7%) | 39 (6.0%) |
| 4:00 PM to 11:59 PM | 59 (9.9%) | 65 (10.1%) |
| Total | 594 (100.0%) | 647 (100.0%) |
Housing Occupancy in Roaring Spring borough
Occupancy by Ownership in Roaring Spring borough
Of the total 1,011 dwellings in Roaring Spring borough, owner-occupied units account for 780 (77.1%), while renter-occupied units make up 231 (22.9%).
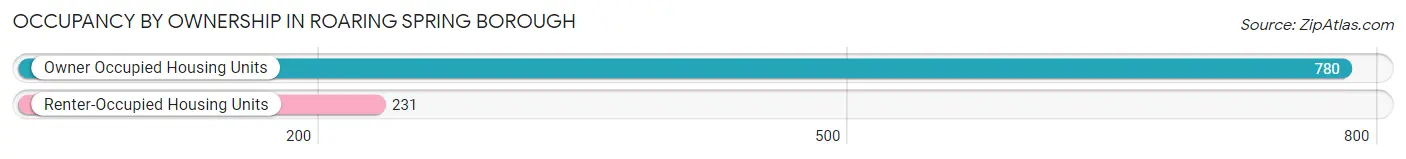
| Occupancy | # Housing Units | % Housing Units |
| Owner Occupied Housing Units | 780 | 77.1% |
| Renter-Occupied Housing Units | 231 | 22.9% |
| Total Occupied Housing Units | 1,011 | 100.0% |
Occupancy by Household Size in Roaring Spring borough
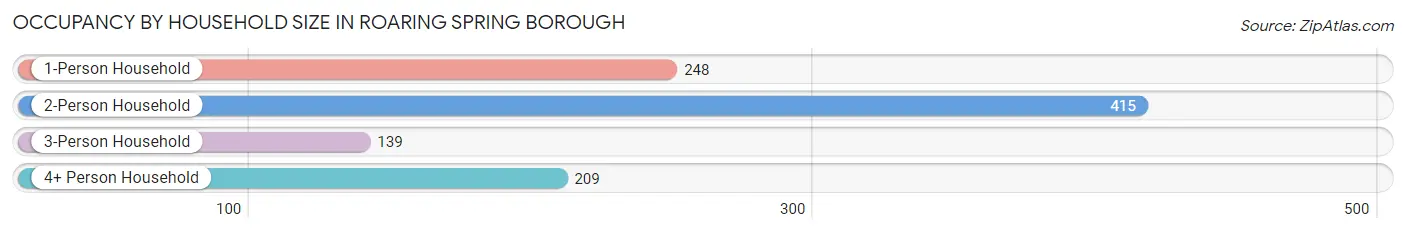
| Household Size | # Housing Units | % Housing Units |
| 1-Person Household | 248 | 24.5% |
| 2-Person Household | 415 | 41.0% |
| 3-Person Household | 139 | 13.8% |
| 4+ Person Household | 209 | 20.7% |
| Total Housing Units | 1,011 | 100.0% |
Occupancy by Ownership by Household Size in Roaring Spring borough
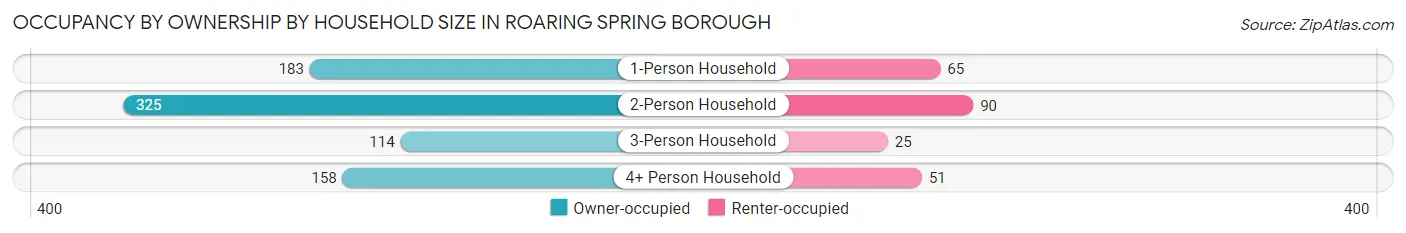
| Household Size | Owner-occupied | Renter-occupied |
| 1-Person Household | 183 (73.8%) | 65 (26.2%) |
| 2-Person Household | 325 (78.3%) | 90 (21.7%) |
| 3-Person Household | 114 (82.0%) | 25 (18.0%) |
| 4+ Person Household | 158 (75.6%) | 51 (24.4%) |
| Total Housing Units | 780 (77.1%) | 231 (22.9%) |
Occupancy by Educational Attainment in Roaring Spring borough
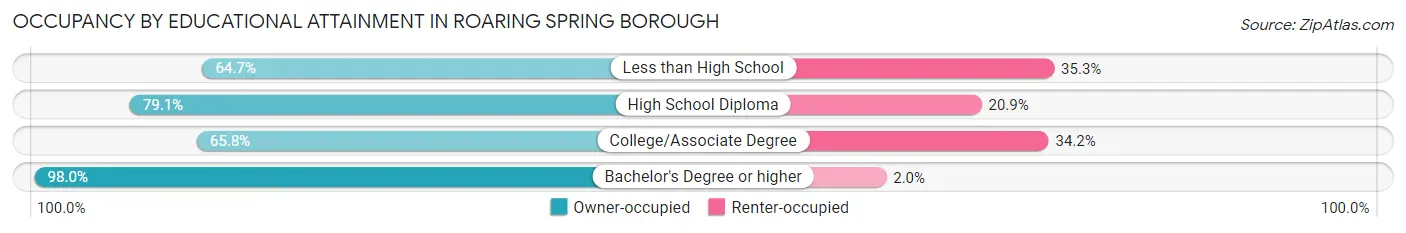
| Household Size | Owner-occupied | Renter-occupied |
| Less than High School | 44 (64.7%) | 24 (35.3%) |
| High School Diploma | 303 (79.1%) | 80 (20.9%) |
| College/Associate Degree | 237 (65.8%) | 123 (34.2%) |
| Bachelor's Degree or higher | 196 (98.0%) | 4 (2.0%) |
Occupancy by Age of Householder in Roaring Spring borough
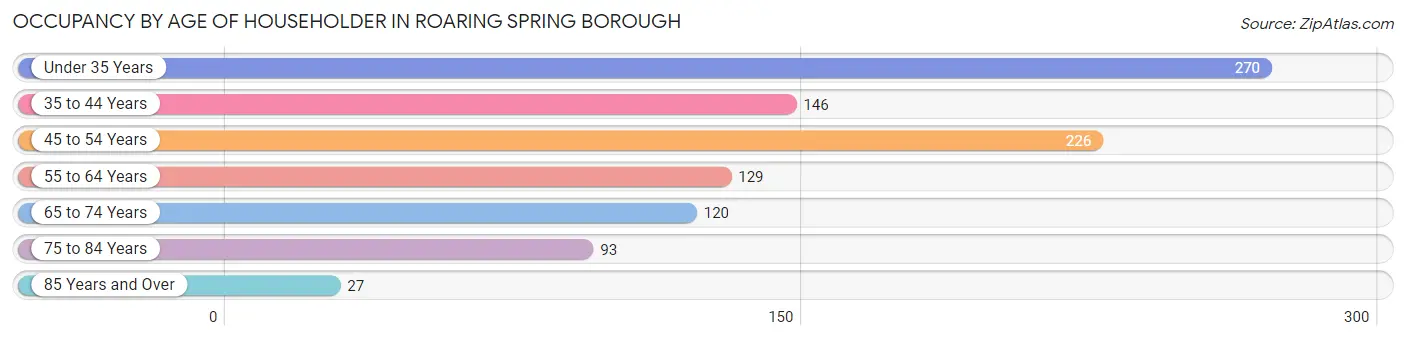
| Age Bracket | # Households | % Households |
| Under 35 Years | 270 | 26.7% |
| 35 to 44 Years | 146 | 14.4% |
| 45 to 54 Years | 226 | 22.4% |
| 55 to 64 Years | 129 | 12.8% |
| 65 to 74 Years | 120 | 11.9% |
| 75 to 84 Years | 93 | 9.2% |
| 85 Years and Over | 27 | 2.7% |
| Total | 1,011 | 100.0% |
Housing Finances in Roaring Spring borough
Median Income by Occupancy in Roaring Spring borough
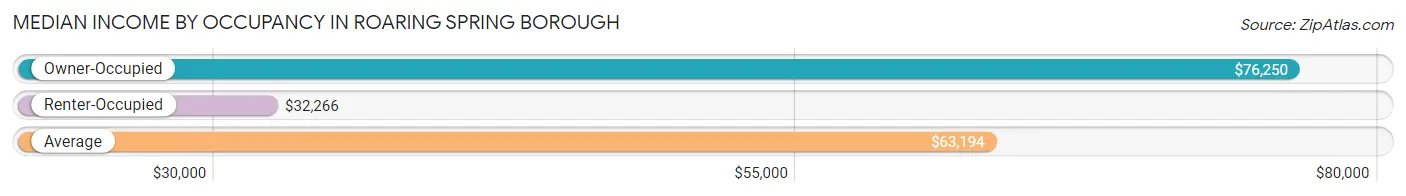
| Occupancy Type | # Households | Median Income |
| Owner-Occupied | 780 (77.1%) | $76,250 |
| Renter-Occupied | 231 (22.9%) | $32,266 |
| Average | 1,011 (100.0%) | $63,194 |
Occupancy by Householder Income Bracket in Roaring Spring borough
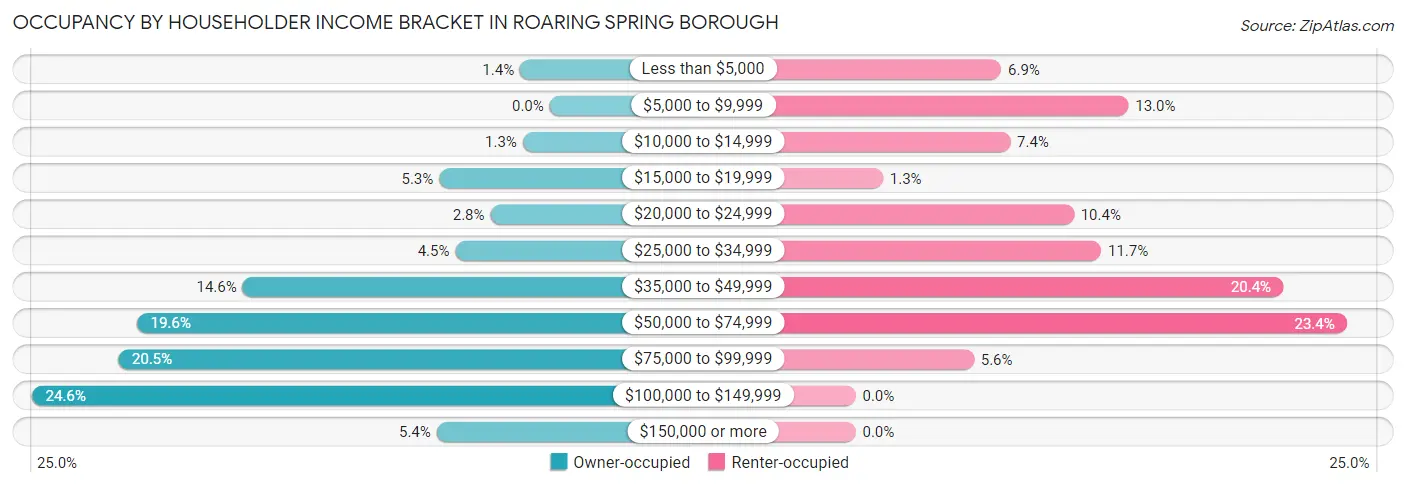
| Income Bracket | Owner-occupied | Renter-occupied |
| Less than $5,000 | 11 (1.4%) | 16 (6.9%) |
| $5,000 to $9,999 | 0 (0.0%) | 30 (13.0%) |
| $10,000 to $14,999 | 10 (1.3%) | 17 (7.4%) |
| $15,000 to $19,999 | 41 (5.3%) | 3 (1.3%) |
| $20,000 to $24,999 | 22 (2.8%) | 24 (10.4%) |
| $25,000 to $34,999 | 35 (4.5%) | 27 (11.7%) |
| $35,000 to $49,999 | 114 (14.6%) | 47 (20.3%) |
| $50,000 to $74,999 | 153 (19.6%) | 54 (23.4%) |
| $75,000 to $99,999 | 160 (20.5%) | 13 (5.6%) |
| $100,000 to $149,999 | 192 (24.6%) | 0 (0.0%) |
| $150,000 or more | 42 (5.4%) | 0 (0.0%) |
| Total | 780 (100.0%) | 231 (100.0%) |
Monthly Housing Cost Tiers in Roaring Spring borough
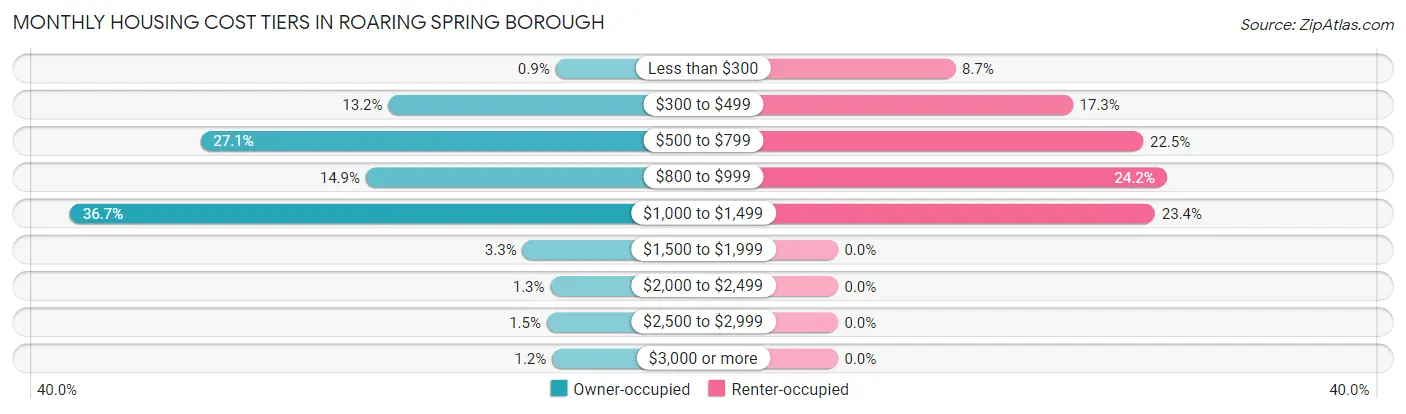
| Monthly Cost | Owner-occupied | Renter-occupied |
| Less than $300 | 7 (0.9%) | 20 (8.7%) |
| $300 to $499 | 103 (13.2%) | 40 (17.3%) |
| $500 to $799 | 211 (27.1%) | 52 (22.5%) |
| $800 to $999 | 116 (14.9%) | 56 (24.2%) |
| $1,000 to $1,499 | 286 (36.7%) | 54 (23.4%) |
| $1,500 to $1,999 | 26 (3.3%) | 0 (0.0%) |
| $2,000 to $2,499 | 10 (1.3%) | 0 (0.0%) |
| $2,500 to $2,999 | 12 (1.5%) | 0 (0.0%) |
| $3,000 or more | 9 (1.1%) | 0 (0.0%) |
| Total | 780 (100.0%) | 231 (100.0%) |
Physical Housing Characteristics in Roaring Spring borough
Housing Structures in Roaring Spring borough
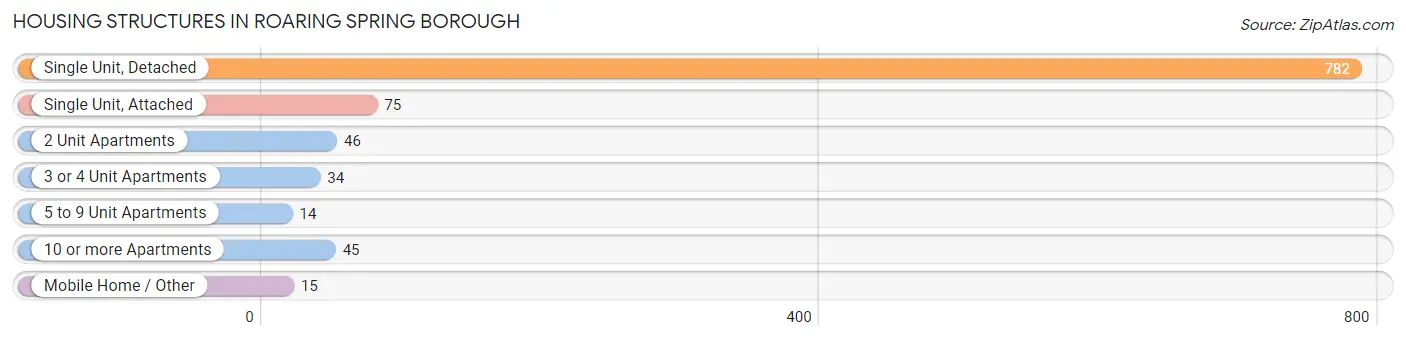
| Structure Type | # Housing Units | % Housing Units |
| Single Unit, Detached | 782 | 77.3% |
| Single Unit, Attached | 75 | 7.4% |
| 2 Unit Apartments | 46 | 4.5% |
| 3 or 4 Unit Apartments | 34 | 3.4% |
| 5 to 9 Unit Apartments | 14 | 1.4% |
| 10 or more Apartments | 45 | 4.4% |
| Mobile Home / Other | 15 | 1.5% |
| Total | 1,011 | 100.0% |
Housing Structures by Occupancy in Roaring Spring borough
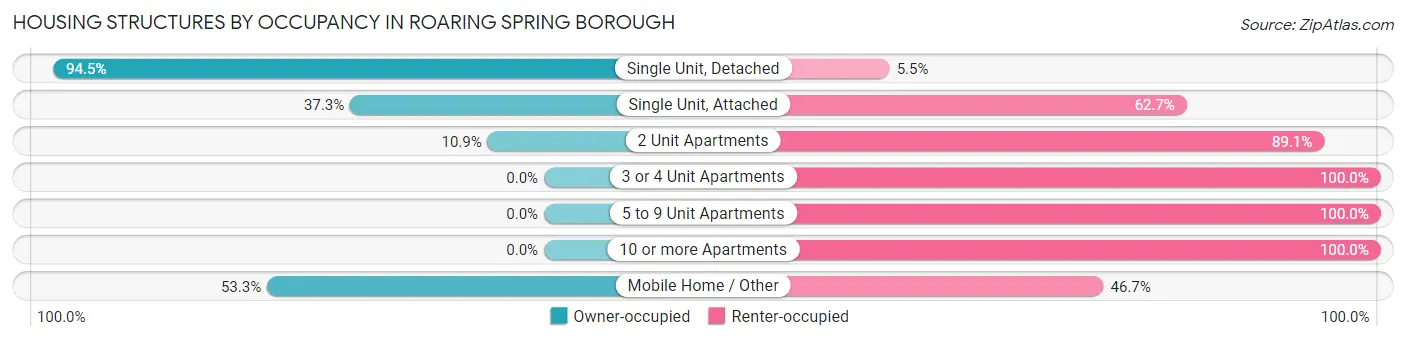
| Structure Type | Owner-occupied | Renter-occupied |
| Single Unit, Detached | 739 (94.5%) | 43 (5.5%) |
| Single Unit, Attached | 28 (37.3%) | 47 (62.7%) |
| 2 Unit Apartments | 5 (10.9%) | 41 (89.1%) |
| 3 or 4 Unit Apartments | 0 (0.0%) | 34 (100.0%) |
| 5 to 9 Unit Apartments | 0 (0.0%) | 14 (100.0%) |
| 10 or more Apartments | 0 (0.0%) | 45 (100.0%) |
| Mobile Home / Other | 8 (53.3%) | 7 (46.7%) |
| Total | 780 (77.1%) | 231 (22.9%) |
Housing Structures by Number of Rooms in Roaring Spring borough
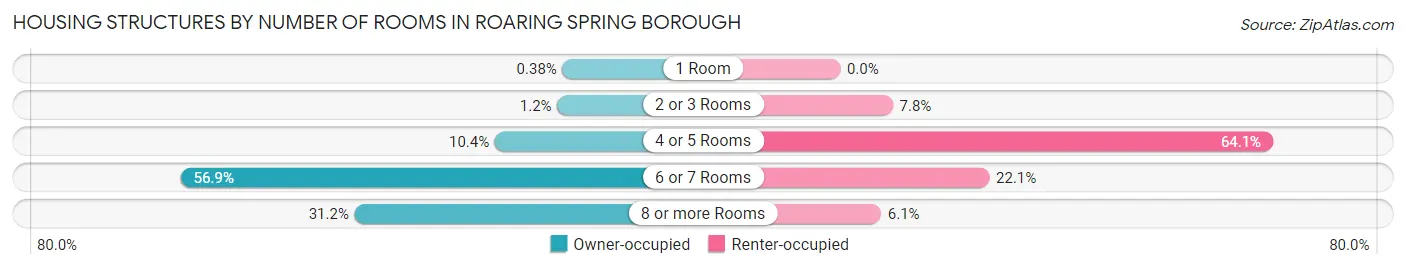
| Number of Rooms | Owner-occupied | Renter-occupied |
| 1 Room | 3 (0.4%) | 0 (0.0%) |
| 2 or 3 Rooms | 9 (1.1%) | 18 (7.8%) |
| 4 or 5 Rooms | 81 (10.4%) | 148 (64.1%) |
| 6 or 7 Rooms | 444 (56.9%) | 51 (22.1%) |
| 8 or more Rooms | 243 (31.1%) | 14 (6.1%) |
| Total | 780 (100.0%) | 231 (100.0%) |
Housing Structure by Heating Type in Roaring Spring borough
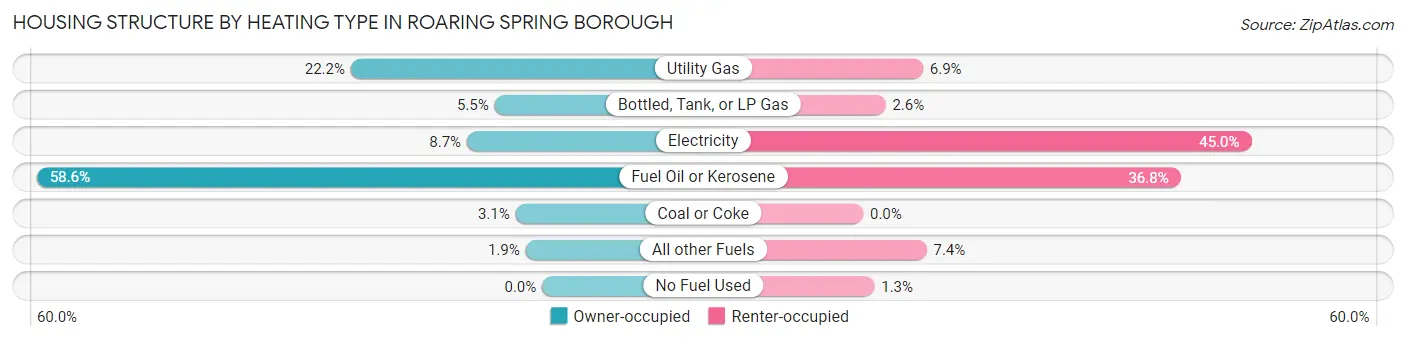
| Heating Type | Owner-occupied | Renter-occupied |
| Utility Gas | 173 (22.2%) | 16 (6.9%) |
| Bottled, Tank, or LP Gas | 43 (5.5%) | 6 (2.6%) |
| Electricity | 68 (8.7%) | 104 (45.0%) |
| Fuel Oil or Kerosene | 457 (58.6%) | 85 (36.8%) |
| Coal or Coke | 24 (3.1%) | 0 (0.0%) |
| All other Fuels | 15 (1.9%) | 17 (7.4%) |
| No Fuel Used | 0 (0.0%) | 3 (1.3%) |
| Total | 780 (100.0%) | 231 (100.0%) |
Household Vehicle Usage in Roaring Spring borough
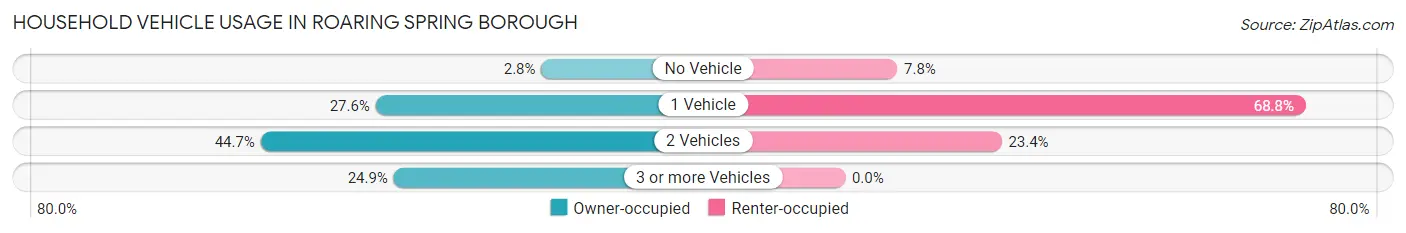
| Vehicles per Household | Owner-occupied | Renter-occupied |
| No Vehicle | 22 (2.8%) | 18 (7.8%) |
| 1 Vehicle | 215 (27.6%) | 159 (68.8%) |
| 2 Vehicles | 349 (44.7%) | 54 (23.4%) |
| 3 or more Vehicles | 194 (24.9%) | 0 (0.0%) |
| Total | 780 (100.0%) | 231 (100.0%) |
Real Estate & Mortgages in Roaring Spring borough
Real Estate and Mortgage Overview in Roaring Spring borough
| Characteristic | Without Mortgage | With Mortgage |
| Housing Units | 306 | 474 |
| Median Property Value | $139,300 | $134,100 |
| Median Household Income | $57,933 | $29 |
| Monthly Housing Costs | $610 | $9 |
| Real Estate Taxes | $2,290 | $0 |
Property Value by Mortgage Status in Roaring Spring borough
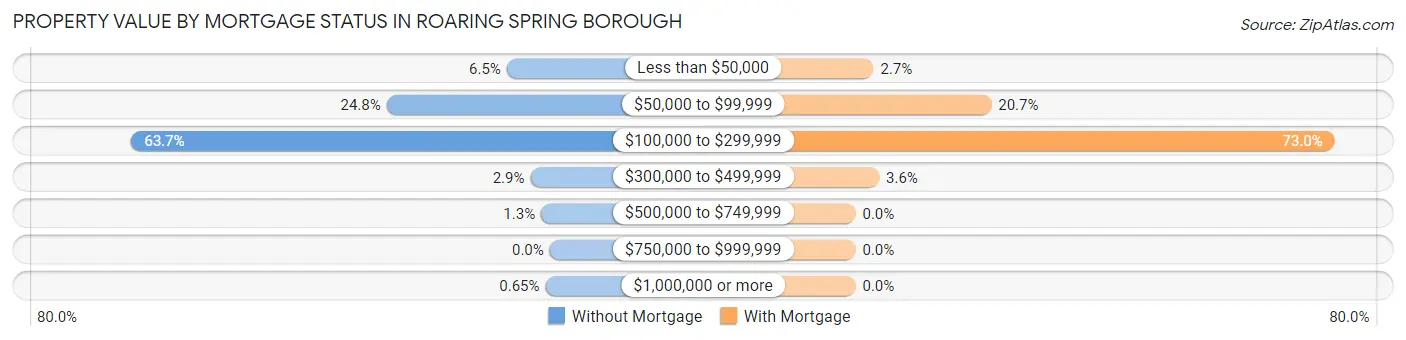
| Property Value | Without Mortgage | With Mortgage |
| Less than $50,000 | 20 (6.5%) | 13 (2.7%) |
| $50,000 to $99,999 | 76 (24.8%) | 98 (20.7%) |
| $100,000 to $299,999 | 195 (63.7%) | 346 (73.0%) |
| $300,000 to $499,999 | 9 (2.9%) | 17 (3.6%) |
| $500,000 to $749,999 | 4 (1.3%) | 0 (0.0%) |
| $750,000 to $999,999 | 0 (0.0%) | 0 (0.0%) |
| $1,000,000 or more | 2 (0.6%) | 0 (0.0%) |
| Total | 306 (100.0%) | 474 (100.0%) |
Household Income by Mortgage Status in Roaring Spring borough
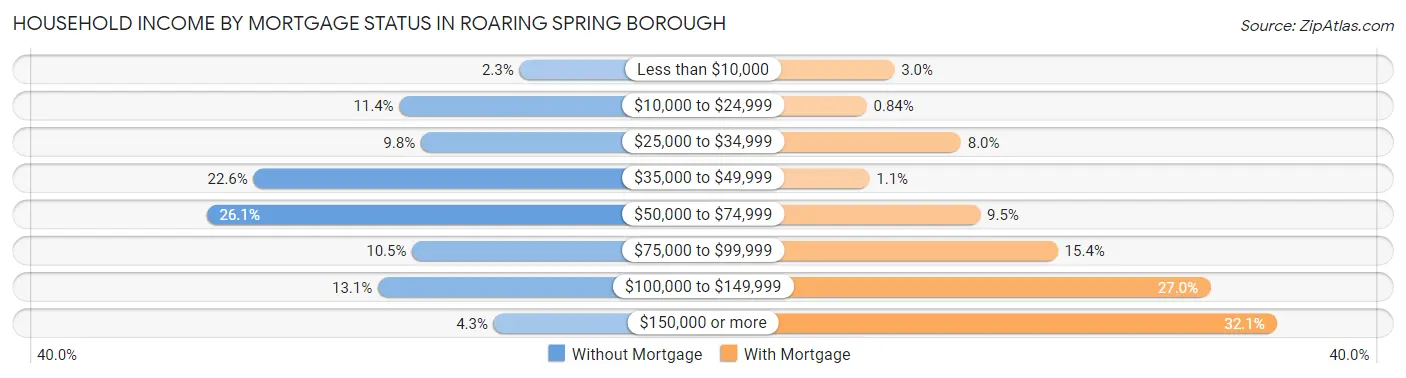
| Household Income | Without Mortgage | With Mortgage |
| Less than $10,000 | 7 (2.3%) | 14 (2.9%) |
| $10,000 to $24,999 | 35 (11.4%) | 4 (0.8%) |
| $25,000 to $34,999 | 30 (9.8%) | 38 (8.0%) |
| $35,000 to $49,999 | 69 (22.6%) | 5 (1.1%) |
| $50,000 to $74,999 | 80 (26.1%) | 45 (9.5%) |
| $75,000 to $99,999 | 32 (10.5%) | 73 (15.4%) |
| $100,000 to $149,999 | 40 (13.1%) | 128 (27.0%) |
| $150,000 or more | 13 (4.3%) | 152 (32.1%) |
| Total | 306 (100.0%) | 474 (100.0%) |
Property Value to Household Income Ratio in Roaring Spring borough
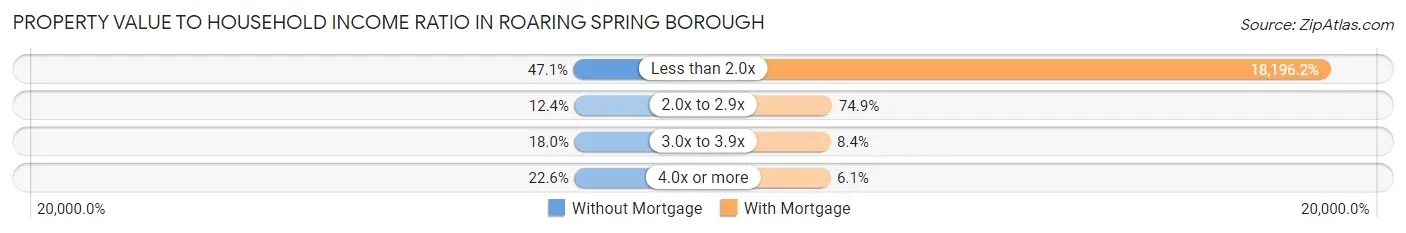
| Value-to-Income Ratio | Without Mortgage | With Mortgage |
| Less than 2.0x | 144 (47.1%) | 86,250 (18,196.2%) |
| 2.0x to 2.9x | 38 (12.4%) | 355 (74.9%) |
| 3.0x to 3.9x | 55 (18.0%) | 40 (8.4%) |
| 4.0x or more | 69 (22.6%) | 29 (6.1%) |
| Total | 306 (100.0%) | 474 (100.0%) |
Real Estate Taxes by Mortgage Status in Roaring Spring borough
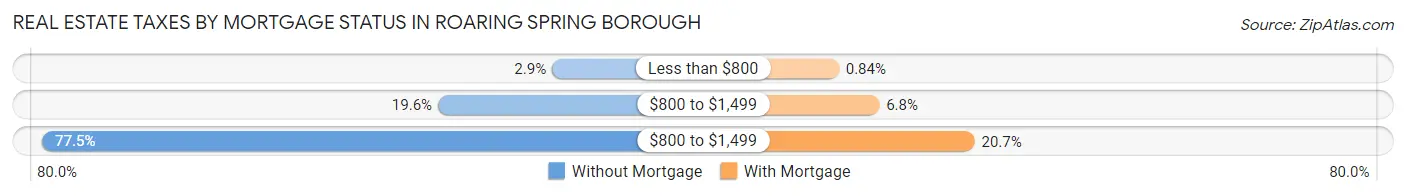
| Property Taxes | Without Mortgage | With Mortgage |
| Less than $800 | 9 (2.9%) | 4 (0.8%) |
| $800 to $1,499 | 60 (19.6%) | 32 (6.8%) |
| $800 to $1,499 | 237 (77.4%) | 98 (20.7%) |
| Total | 306 (100.0%) | 474 (100.0%) |
Health & Disability in Roaring Spring borough
Health Insurance Coverage by Age in Roaring Spring borough
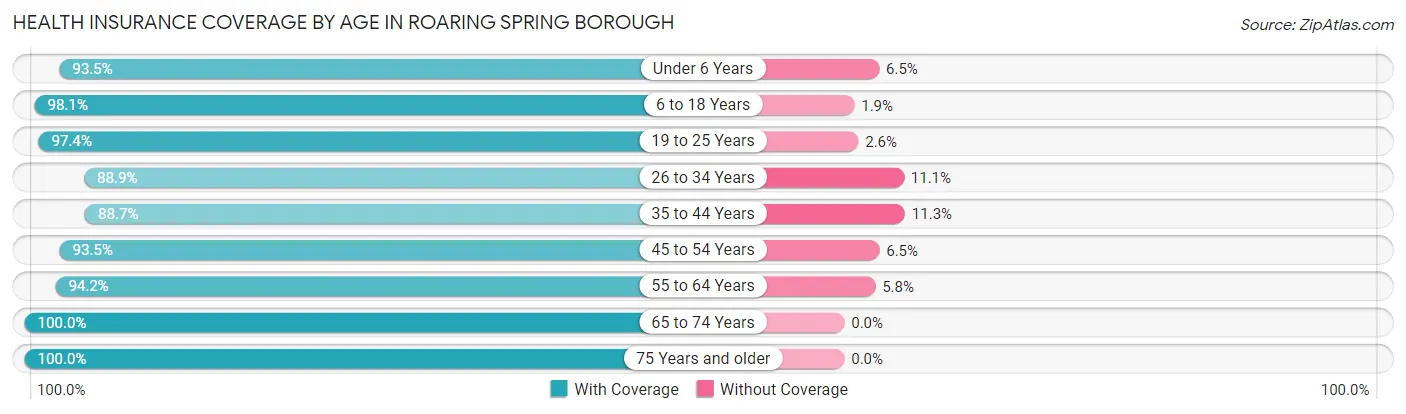
| Age Bracket | With Coverage | Without Coverage |
| Under 6 Years | 173 (93.5%) | 12 (6.5%) |
| 6 to 18 Years | 421 (98.1%) | 8 (1.9%) |
| 19 to 25 Years | 299 (97.4%) | 8 (2.6%) |
| 26 to 34 Years | 288 (88.9%) | 36 (11.1%) |
| 35 to 44 Years | 267 (88.7%) | 34 (11.3%) |
| 45 to 54 Years | 315 (93.5%) | 22 (6.5%) |
| 55 to 64 Years | 278 (94.2%) | 17 (5.8%) |
| 65 to 74 Years | 178 (100.0%) | 0 (0.0%) |
| 75 Years and older | 156 (100.0%) | 0 (0.0%) |
| Total | 2,375 (94.6%) | 137 (5.4%) |
Health Insurance Coverage by Citizenship Status in Roaring Spring borough
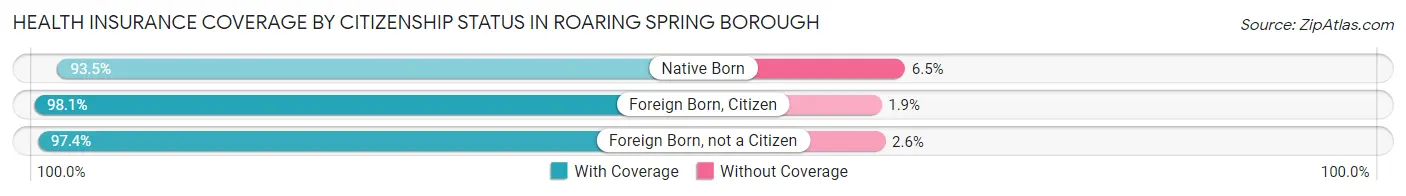
| Citizenship Status | With Coverage | Without Coverage |
| Native Born | 173 (93.5%) | 12 (6.5%) |
| Foreign Born, Citizen | 421 (98.1%) | 8 (1.9%) |
| Foreign Born, not a Citizen | 299 (97.4%) | 8 (2.6%) |
Health Insurance Coverage by Household Income in Roaring Spring borough
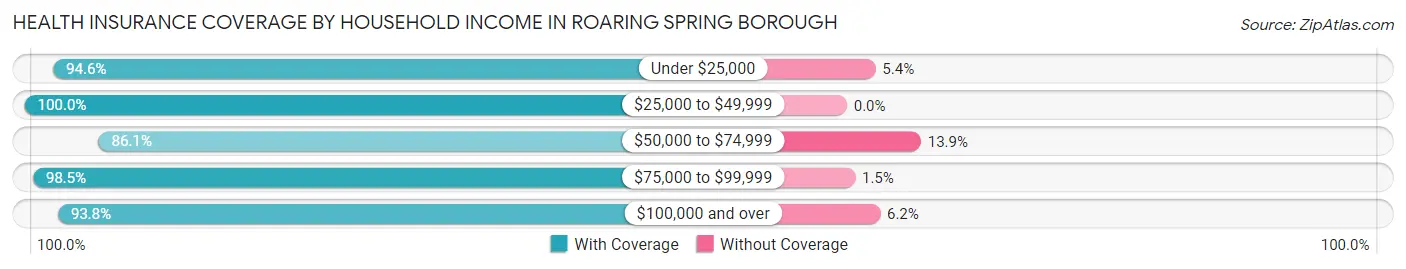
| Household Income | With Coverage | Without Coverage |
| Under $25,000 | 353 (94.6%) | 20 (5.4%) |
| $25,000 to $49,999 | 453 (100.0%) | 0 (0.0%) |
| $50,000 to $74,999 | 379 (86.1%) | 61 (13.9%) |
| $75,000 to $99,999 | 447 (98.5%) | 7 (1.5%) |
| $100,000 and over | 738 (93.8%) | 49 (6.2%) |
Public vs Private Health Insurance Coverage by Age in Roaring Spring borough
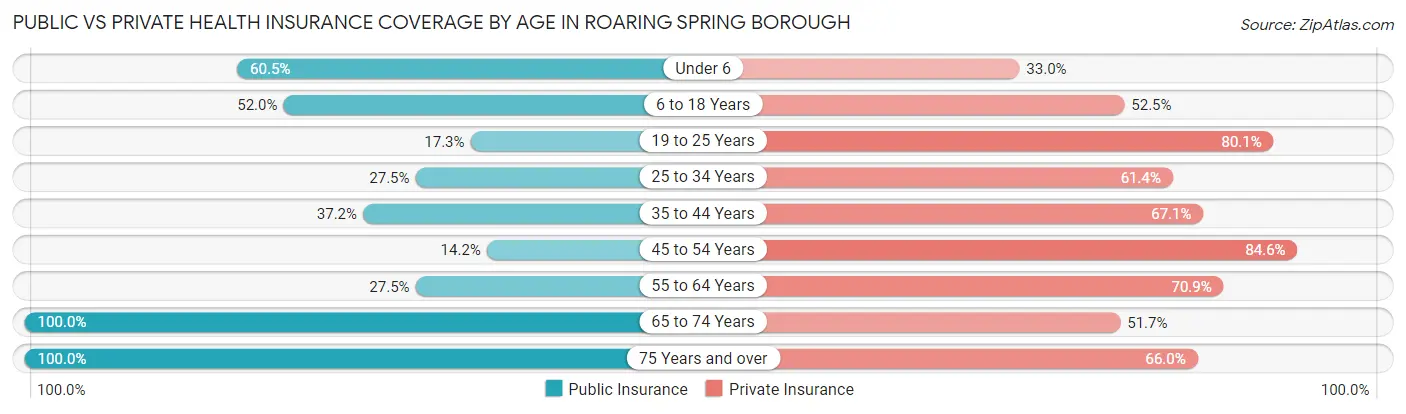
| Age Bracket | Public Insurance | Private Insurance |
| Under 6 | 112 (60.5%) | 61 (33.0%) |
| 6 to 18 Years | 223 (52.0%) | 225 (52.4%) |
| 19 to 25 Years | 53 (17.3%) | 246 (80.1%) |
| 25 to 34 Years | 89 (27.5%) | 199 (61.4%) |
| 35 to 44 Years | 112 (37.2%) | 202 (67.1%) |
| 45 to 54 Years | 48 (14.2%) | 285 (84.6%) |
| 55 to 64 Years | 81 (27.5%) | 209 (70.9%) |
| 65 to 74 Years | 178 (100.0%) | 92 (51.7%) |
| 75 Years and over | 156 (100.0%) | 103 (66.0%) |
| Total | 1,052 (41.9%) | 1,622 (64.6%) |
Disability Status by Sex by Age in Roaring Spring borough
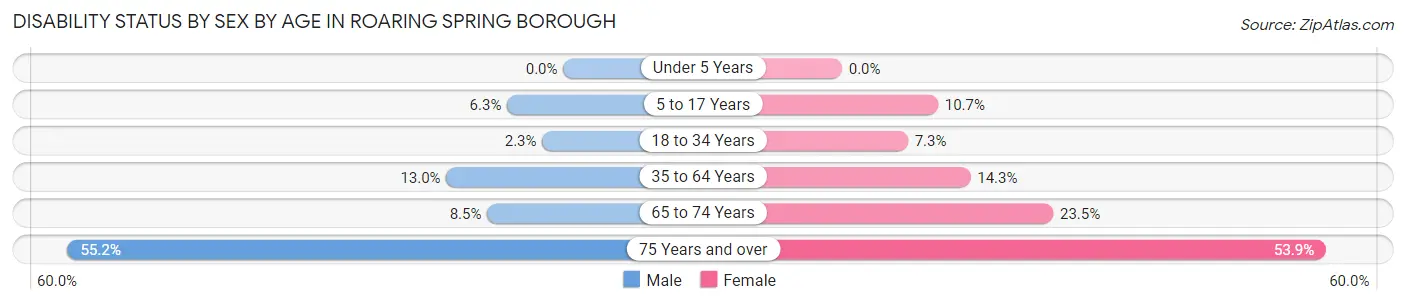
| Age Bracket | Male | Female |
| Under 5 Years | 0 (0.0%) | 0 (0.0%) |
| 5 to 17 Years | 11 (6.2%) | 28 (10.7%) |
| 18 to 34 Years | 7 (2.3%) | 26 (7.3%) |
| 35 to 64 Years | 56 (13.0%) | 72 (14.3%) |
| 65 to 74 Years | 5 (8.5%) | 28 (23.5%) |
| 75 Years and over | 37 (55.2%) | 48 (53.9%) |
Disability Class by Sex by Age in Roaring Spring borough
Disability Class: Hearing Difficulty
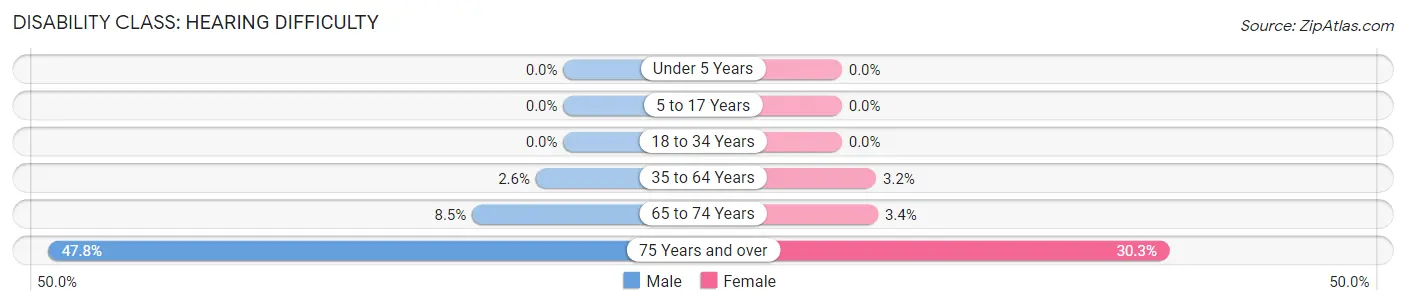
| Age Bracket | Male | Female |
| Under 5 Years | 0 (0.0%) | 0 (0.0%) |
| 5 to 17 Years | 0 (0.0%) | 0 (0.0%) |
| 18 to 34 Years | 0 (0.0%) | 0 (0.0%) |
| 35 to 64 Years | 11 (2.6%) | 16 (3.2%) |
| 65 to 74 Years | 5 (8.5%) | 4 (3.4%) |
| 75 Years and over | 32 (47.8%) | 27 (30.3%) |
Disability Class: Vision Difficulty
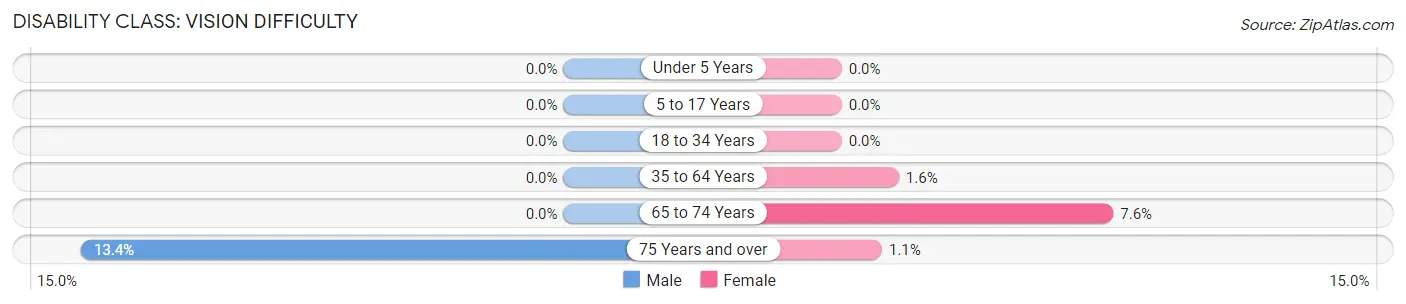
| Age Bracket | Male | Female |
| Under 5 Years | 0 (0.0%) | 0 (0.0%) |
| 5 to 17 Years | 0 (0.0%) | 0 (0.0%) |
| 18 to 34 Years | 0 (0.0%) | 0 (0.0%) |
| 35 to 64 Years | 0 (0.0%) | 8 (1.6%) |
| 65 to 74 Years | 0 (0.0%) | 9 (7.6%) |
| 75 Years and over | 9 (13.4%) | 1 (1.1%) |
Disability Class: Cognitive Difficulty
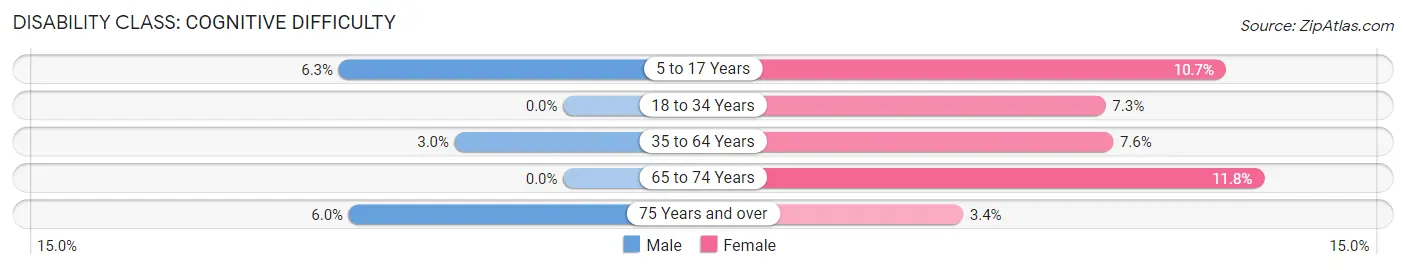
| Age Bracket | Male | Female |
| 5 to 17 Years | 11 (6.2%) | 28 (10.7%) |
| 18 to 34 Years | 0 (0.0%) | 26 (7.3%) |
| 35 to 64 Years | 13 (3.0%) | 38 (7.5%) |
| 65 to 74 Years | 0 (0.0%) | 14 (11.8%) |
| 75 Years and over | 4 (6.0%) | 3 (3.4%) |
Disability Class: Ambulatory Difficulty
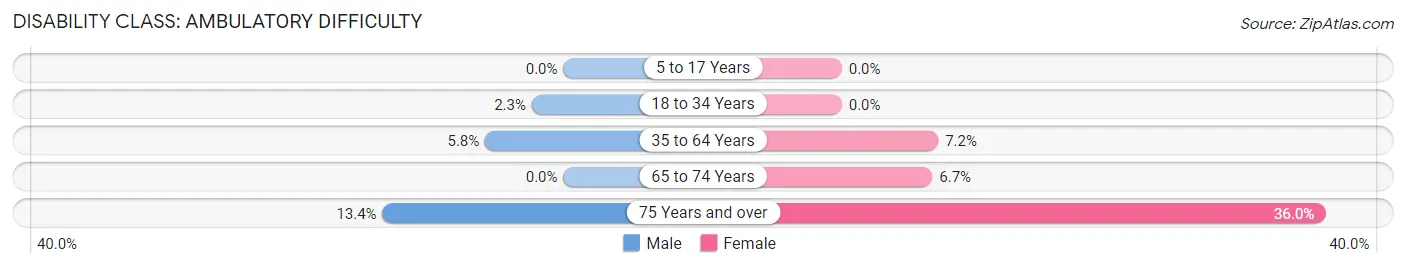
| Age Bracket | Male | Female |
| 5 to 17 Years | 0 (0.0%) | 0 (0.0%) |
| 18 to 34 Years | 7 (2.3%) | 0 (0.0%) |
| 35 to 64 Years | 25 (5.8%) | 36 (7.2%) |
| 65 to 74 Years | 0 (0.0%) | 8 (6.7%) |
| 75 Years and over | 9 (13.4%) | 32 (36.0%) |
Disability Class: Self-Care Difficulty
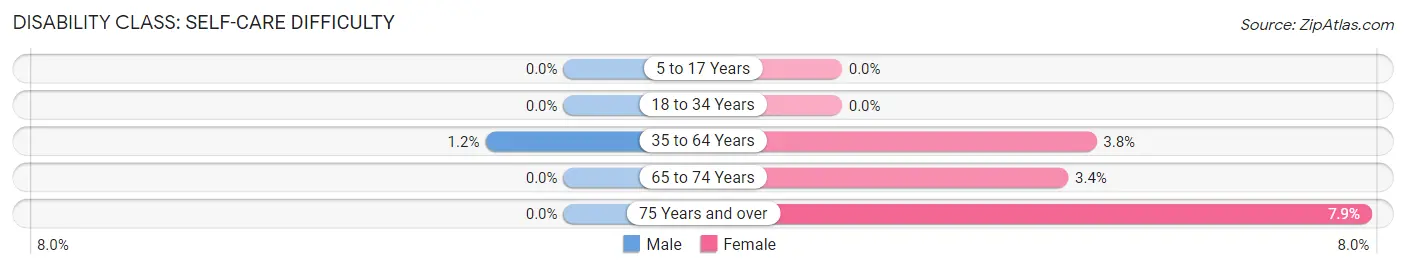
| Age Bracket | Male | Female |
| 5 to 17 Years | 0 (0.0%) | 0 (0.0%) |
| 18 to 34 Years | 0 (0.0%) | 0 (0.0%) |
| 35 to 64 Years | 5 (1.2%) | 19 (3.8%) |
| 65 to 74 Years | 0 (0.0%) | 4 (3.4%) |
| 75 Years and over | 0 (0.0%) | 7 (7.9%) |
Technology Access in Roaring Spring borough
Computing Device Access in Roaring Spring borough
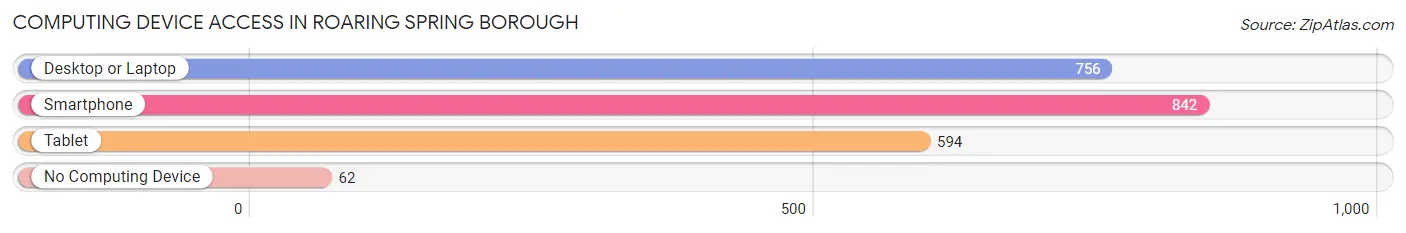
| Device Type | # Households | % Households |
| Desktop or Laptop | 756 | 74.8% |
| Smartphone | 842 | 83.3% |
| Tablet | 594 | 58.8% |
| No Computing Device | 62 | 6.1% |
| Total | 1,011 | 100.0% |
Internet Access in Roaring Spring borough
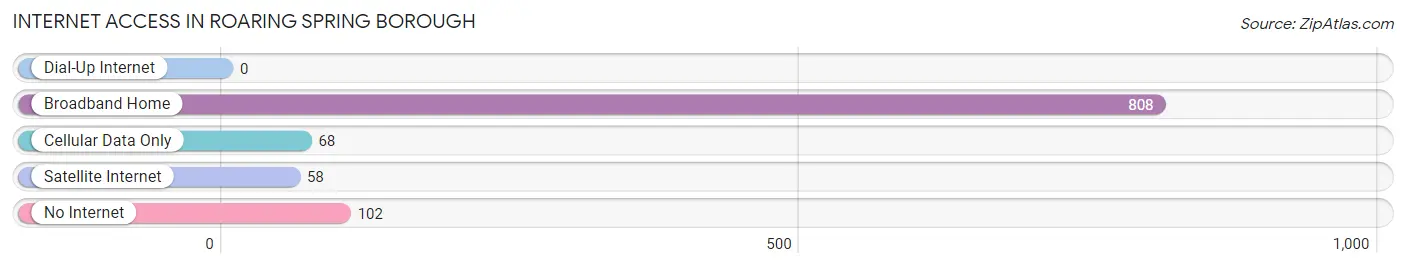
| Internet Type | # Households | % Households |
| Dial-Up Internet | 0 | 0.0% |
| Broadband Home | 808 | 79.9% |
| Cellular Data Only | 68 | 6.7% |
| Satellite Internet | 58 | 5.7% |
| No Internet | 102 | 10.1% |
| Total | 1,011 | 100.0% |
Roaring Spring borough Summary
Roaring Spring Borough is a small borough located in Blair County, Pennsylvania. It is situated in the foothills of the Allegheny Mountains, approximately 10 miles east of Altoona. The borough was founded in 1872 and has a population of approximately 2,000 people.
History
The area that is now Roaring Spring Borough was first settled in the late 1700s by German immigrants. The first settlers were Jacob and Mary (Kauffman) Miller, who arrived in 1790. The Millers built a log cabin and began farming the land. The area was known as Miller’s Settlement until 1872, when it was incorporated as Roaring Spring Borough.
The name “Roaring Spring” was derived from a nearby spring that was known for its loud roar. The spring was located near the intersection of what is now Main Street and Spring Street. The spring was a popular destination for locals and visitors alike, and it was the source of the borough’s water supply until the early 1900s.
The borough was home to several industries in the late 1800s and early 1900s, including a paper mill, a brickyard, a sawmill, and a flour mill. The paper mill was the largest employer in the borough and was the source of much of the borough’s economic growth. The paper mill closed in the 1950s, but the borough’s other industries continued to thrive.
Geography
Roaring Spring Borough is located in the foothills of the Allegheny Mountains in central Pennsylvania. The borough is situated in a valley between two mountain ridges, the Tussey Mountain to the north and the Allegheny Front to the south. The borough is approximately 10 miles east of Altoona and is bordered by Freedom Township to the north, Taylor Township to the east, and Greenfield Township to the south and west.
The borough is located in a humid continental climate zone, with cold winters and hot, humid summers. The average annual temperature is approximately 50 degrees Fahrenheit, and the average annual precipitation is approximately 40 inches.
Economy
The economy of Roaring Spring Borough is largely based on manufacturing and retail. The borough is home to several manufacturing companies, including a plastics manufacturer, a metal fabricator, and a printing company. The borough is also home to several retail stores, including a grocery store, a hardware store, and a pharmacy.
The borough is also home to several small businesses, including restaurants, auto repair shops, and a variety of other services. The borough is served by several major highways, including Interstate 99 and U.S. Route 22, which provide access to the larger cities of Altoona and State College.
Demographics
As of the 2010 census, the population of Roaring Spring Borough was 2,039. The racial makeup of the borough was 97.3% White, 0.7% African American, 0.2% Native American, 0.3% Asian, 0.1% Pacific Islander, 0.4% from other races, and 1.0% from two or more races. Hispanic or Latino of any race were 1.2% of the population.
The median household income in the borough was $41,944, and the median family income was $50,938. The per capita income was $20,945. About 8.3% of families and 10.2% of the population were below the poverty line, including 14.2% of those under age 18 and 8.2% of those age 65 or over.
Common Questions
What is Per Capita Income in Roaring Spring borough?
Per Capita income in Roaring Spring borough is $29,550.
What is the Median Family Income in Roaring Spring borough?
Median Family Income in Roaring Spring borough is $79,063.
What is the Median Household income in Roaring Spring borough?
Median Household Income in Roaring Spring borough is $63,194.
What is Income or Wage Gap in Roaring Spring borough?
Income or Wage Gap in Roaring Spring borough is 22.8%.
Women in Roaring Spring borough earn 77.2 cents for every dollar earned by a man.
What is Inequality or Gini Index in Roaring Spring borough?
Inequality or Gini Index in Roaring Spring borough is 0.37.
What is the Total Population of Roaring Spring borough?
Total Population of Roaring Spring borough is 2,512.
What is the Total Male Population of Roaring Spring borough?
Total Male Population of Roaring Spring borough is 1,111.
What is the Total Female Population of Roaring Spring borough?
Total Female Population of Roaring Spring borough is 1,401.
What is the Ratio of Males per 100 Females in Roaring Spring borough?
There are 79.30 Males per 100 Females in Roaring Spring borough.
What is the Ratio of Females per 100 Males in Roaring Spring borough?
There are 126.10 Females per 100 Males in Roaring Spring borough.
What is the Median Population Age in Roaring Spring borough?
Median Population Age in Roaring Spring borough is 36.1 Years.
What is the Average Family Size in Roaring Spring borough
Average Family Size in Roaring Spring borough is 3.0 People.
What is the Average Household Size in Roaring Spring borough
Average Household Size in Roaring Spring borough is 2.5 People.
How Large is the Labor Force in Roaring Spring borough?
There are 1,402 People in the Labor Forcein in Roaring Spring borough.
What is the Percentage of People in the Labor Force in Roaring Spring borough?
71.5% of People are in the Labor Force in Roaring Spring borough.
What is the Unemployment Rate in Roaring Spring borough?
Unemployment Rate in Roaring Spring borough is 5.7%.