Zip Codes with the Highest Percentage of Population Employed in Security & Protection in Rochester, NY

RELATED REPORTS & OPTIONS

Security & Protection
Population
Families and Households
Female Fertility
Female Fertility (Unmarried)
Race (Community Size)
Race (Percentage)
Ancestry (Community Size)
AfghanAfricanAlbanianAlsatianAmericanApacheArabArgentineanArmenianAustralianAustrianBahamianBarbadianBasqueBelgianBelizeanBhutaneseBlackfeetBolivianBrazilianBritishBritish West IndianBulgarianBurmeseCambodianCanadianCape VerdeanCelticCentral AmericanCentral American IndianCherokeeChileanChippewaChoctawColombianCosta RicanCroatianCubanCzechCzechoslovakianDanishDominicanDutchEastern EuropeanEcuadorianEgyptianEnglishEstonianEthiopianEuropeanFilipinoFinnishFrenchFrench CanadianGermanGhanaianGreekGuamanian / ChamorroGuatemalanGuyaneseHaitianHonduranHungarianIcelanderIndian (Asian)IndonesianIranianIraqiIrishIroquoisIsraeliItalianJamaicanJapaneseKenyanKoreanLatvianLebaneseLiberianLithuanianLuxembourgerMacedonianMalaysianMexicanMexican American IndianMongolianMoroccanNative HawaiianNavajoNicaraguanNigerianNorthern EuropeanNorwegianPakistaniPalestinianPanamanianParaguayanPennsylvania GermanPeruvianPolishPortuguesePuebloPuerto RicanRomanianRussianSalvadoranSamoanScandinavianScotch-IrishScottishSeminoleSerbianSlavicSlovakSloveneSomaliSouth AfricanSouth AmericanSouth American IndianSpaniardSpanishSri LankanSubsaharan AfricanSudaneseSwedishSwissSyrianThaiTrinidadian and TobagonianTurkishU.S. Virgin IslanderUkrainianVenezuelanVietnameseWelshWest IndianYugoslavianZimbabwean
Ancestry (Percentage)
AfghanAfricanAlbanianAlsatianAmericanApacheArabArgentineanArmenianAustralianAustrianBahamianBarbadianBasqueBelgianBelizeanBhutaneseBlackfeetBolivianBrazilianBritishBritish West IndianBulgarianBurmeseCambodianCanadianCape VerdeanCelticCentral AmericanCentral American IndianCherokeeChileanChippewaChoctawColombianCosta RicanCroatianCubanCzechCzechoslovakianDanishDominicanDutchEastern EuropeanEcuadorianEgyptianEnglishEstonianEthiopianEuropeanFilipinoFinnishFrenchFrench CanadianGermanGhanaianGreekGuamanian / ChamorroGuatemalanGuyaneseHaitianHonduranHungarianIcelanderIndian (Asian)IndonesianIranianIraqiIrishIroquoisIsraeliItalianJamaicanJapaneseKenyanKoreanLatvianLebaneseLiberianLithuanianLuxembourgerMacedonianMalaysianMexicanMexican American IndianMongolianMoroccanNative HawaiianNavajoNicaraguanNigerianNorthern EuropeanNorwegianPakistaniPalestinianPanamanianParaguayanPennsylvania GermanPeruvianPolishPortuguesePuebloPuerto RicanRomanianRussianSalvadoranSamoanScandinavianScotch-IrishScottishSeminoleSerbianSlavicSlovakSloveneSomaliSouth AfricanSouth AmericanSouth American IndianSpaniardSpanishSri LankanSubsaharan AfricanSudaneseSwedishSwissSyrianThaiTrinidadian and TobagonianTurkishU.S. Virgin IslanderUkrainianVenezuelanVietnameseWelshWest IndianYugoslavianZimbabwean
Immigrant Origin (Total)
AfghanistanAfricaAlbaniaArgentinaArmeniaAsiaAustraliaAustriaBangladeshBarbadosBelarusBelgiumBelizeBoliviaBosnia and HerzegovinaBrazilBulgariaBurma / MyanmarCambodiaCameroonCanadaCaribbeanCentral AmericaChileChinaColombiaCongoCosta RicaCroatiaCubaCzechoslovakiaDominican RepublicEastern AfricaEastern AsiaEastern EuropeEcuadorEgyptEl SalvadorEnglandEritreaEthiopiaEuropeFranceGermanyGhanaGreeceGrenadaGuatemalaGuyanaHaitiHondurasHong KongHungaryIndiaIranIraqIrelandIsraelItalyJamaicaJapanKazakhstanKenyaKoreaKuwaitLaosLatin AmericaLebanonLiberiaLithuaniaMalaysiaMexicoMiddle AfricaMoldovaMoroccoNepalNetherlandsNicaraguaNigeriaNorth MacedoniaNorthern AfricaNorthern EuropeOceaniaPakistanPanamaPeruPhilippinesPolandPortugalRomaniaRussiaSaudi ArabiaScotlandSenegalSerbiaSingaporeSomaliaSouth AfricaSouth AmericaSouth Central AsiaSouth Eastern AsiaSouthern EuropeSpainSri LankaSudanSwedenSyriaTaiwanThailandTrinidad and TobagoTurkeyUgandaUkraineUzbekistanVenezuelaVietnamWestern AfricaWestern AsiaWestern EuropeYemenZaireZimbabwe
Immigrant Origin (Percentage)
AfghanistanAfricaAlbaniaArgentinaArmeniaAsiaAustraliaAustriaBangladeshBarbadosBelarusBelgiumBelizeBoliviaBosnia and HerzegovinaBrazilBulgariaBurma / MyanmarCambodiaCameroonCanadaCaribbeanCentral AmericaChileChinaColombiaCongoCosta RicaCroatiaCubaCzechoslovakiaDominican RepublicEastern AfricaEastern AsiaEastern EuropeEcuadorEgyptEl SalvadorEnglandEritreaEthiopiaEuropeFranceGermanyGhanaGreeceGrenadaGuatemalaGuyanaHaitiHondurasHong KongHungaryIndiaIranIraqIrelandIsraelItalyJamaicaJapanKazakhstanKenyaKoreaKuwaitLaosLatin AmericaLebanonLiberiaLithuaniaMalaysiaMexicoMiddle AfricaMoldovaMoroccoNepalNetherlandsNicaraguaNigeriaNorth MacedoniaNorthern AfricaNorthern EuropeOceaniaPakistanPanamaPeruPhilippinesPolandPortugalRomaniaRussiaSaudi ArabiaScotlandSenegalSerbiaSingaporeSomaliaSouth AfricaSouth AmericaSouth Central AsiaSouth Eastern AsiaSouthern EuropeSpainSri LankaSudanSwedenSyriaTaiwanThailandTrinidad and TobagoTurkeyUgandaUkraineUzbekistanVenezuelaVietnamWestern AfricaWestern AsiaWestern EuropeYemenZaireZimbabwe
Income
Income (Families)
Income (Households)
Poverty
Poverty (Families)
Unemployment
Employment Occupations
Employment Industries
Employer Class
Commute Time
Commute Means
School Enrollment
Education by Degree Field
Occupancy
Finances
Physical Characteristics
Rochester
Compare Zip Codes
Comparison Subject

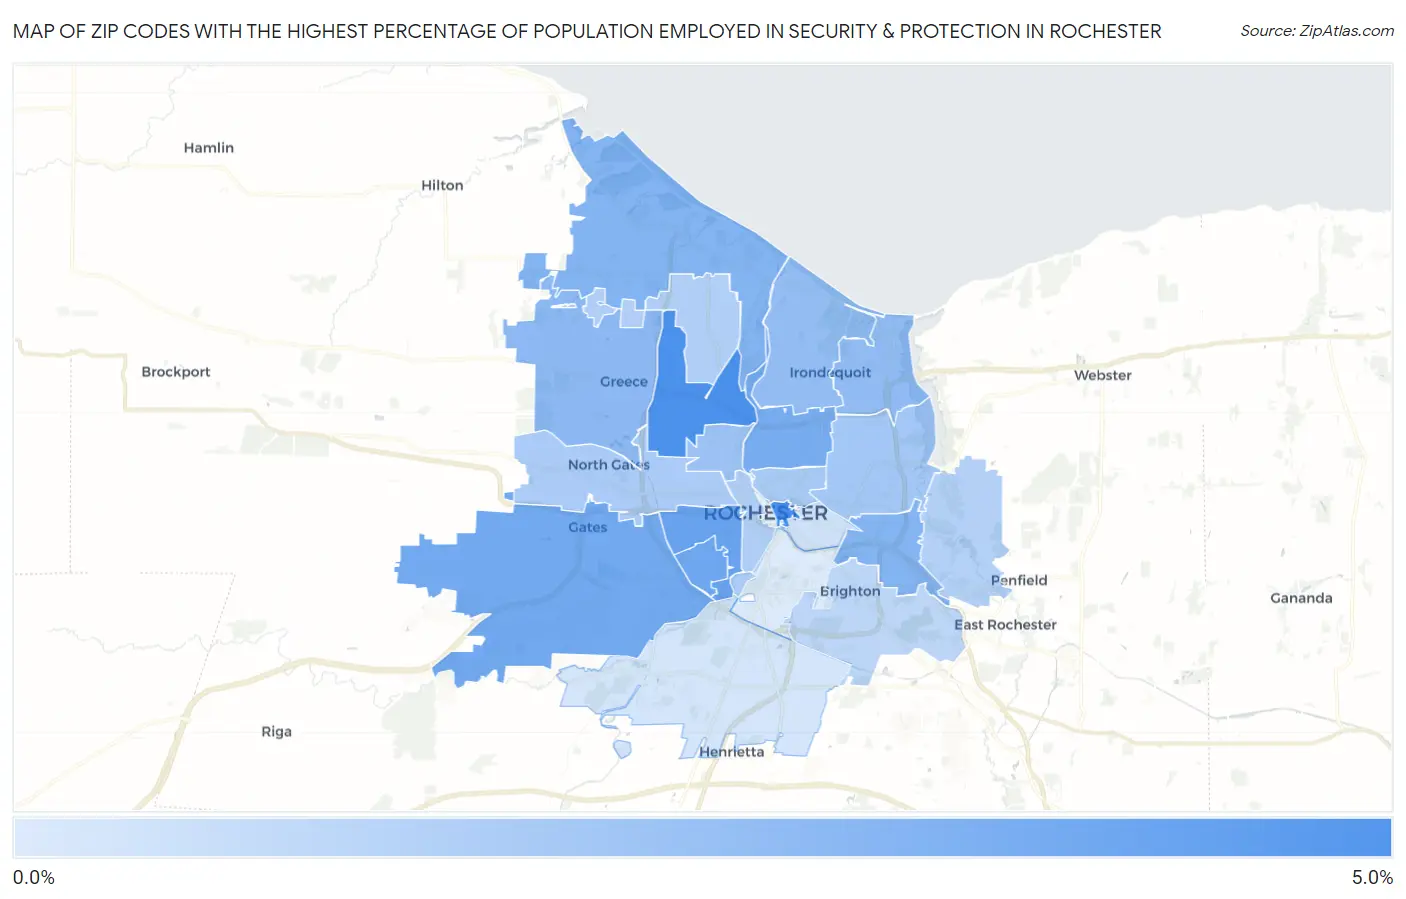
Map of Zip Codes with the Highest Percentage of Population Employed in Security & Protection in Rochester

0.0%
5.0%
Zip Codes with the Highest Percentage of Population Employed in Security & Protection in Rochester Map

Zip Codes with the Highest Percentage of Population Employed in Security & Protection in Rochester, NY

Zip Code % Employed vs State vs National
1.146044.6%2.9%(+1.72)#3002.1%(+2.49)#3,384
2.146154.5%2.9%(+1.57)#3352.1%(+2.34)#3,634
3.146113.7%2.9%(+0.809)#4702.1%(+1.57)#5,092
4.146193.6%2.9%(+0.645)#5052.1%(+1.41)#5,515
5.146243.4%2.9%(+0.479)#5432.1%(+1.24)#5,962
6.146213.3%2.9%(+0.370)#5742.1%(+1.13)#6,306
7.146123.0%2.9%(+0.051)#6472.1%(+0.814)#7,371
8.146102.9%2.9%(+0.037)#6512.1%(+0.801)#7,435
9.146262.7%2.9%(-0.172)#7222.1%(+0.591)#8,359
10.146222.6%2.9%(-0.325)#7692.1%(+0.438)#9,068
11.146172.5%2.9%(-0.368)#7822.1%(+0.395)#9,286
12.146132.2%2.9%(-0.669)#8842.1%(+0.095)#10,989
13.146092.0%2.9%(-0.862)#9452.1%(-0.099)#12,255
14.146051.9%2.9%(-0.978)#9762.1%(-0.214)#12,991
15.146061.9%2.9%(-1.04)#9942.1%(-0.276)#13,427
16.146271.8%2.9%(-1.08)#1,0102.1%(-0.317)#13,700
17.146081.8%2.9%(-1.14)#1,0272.1%(-0.377)#14,148
18.146161.7%2.9%(-1.22)#1,0562.1%(-0.455)#14,733
19.146251.6%2.9%(-1.27)#1,0722.1%(-0.511)#15,130
20.146181.4%2.9%(-1.50)#1,1322.1%(-0.739)#16,873
21.146070.85%2.9%(-2.06)#1,2902.1%(-1.29)#21,080
22.146230.74%2.9%(-2.17)#1,3072.1%(-1.41)#21,812
23.146200.51%2.9%(-2.40)#1,3582.1%(-1.64)#23,187

Common Questions

What are the Top 10 Zip Codes with the Highest Percentage of Population Employed in Security & Protection in Rochester, NY?
Top 10 Zip Codes with the Highest Percentage of Population Employed in Security & Protection in Rochester, NY are:
#1
4.6%
#2
4.5%
#3
3.7%
#4
3.6%
#5
3.4%
#6
3.3%
#7
3.0%
#8
2.9%
#9
2.7%
#10
2.6%
What zip code has the Highest Percentage of Population Employed in Security & Protection in Rochester, NY?
14604 has the Highest Percentage of Population Employed in Security & Protection in Rochester, NY with 4.6%.
What is the Percentage of Population Employed in Security & Protection in Rochester, NY?
Percentage of Population Employed in Security & Protection in Rochester is 2.3%.
What is the Percentage of Population Employed in Security & Protection in New York?
Percentage of Population Employed in Security & Protection in New York is 2.9%.
What is the Percentage of Population Employed in Security & Protection in the United States?
Percentage of Population Employed in Security & Protection in the United States is 2.1%.