Bellport, NY Map & Demographics
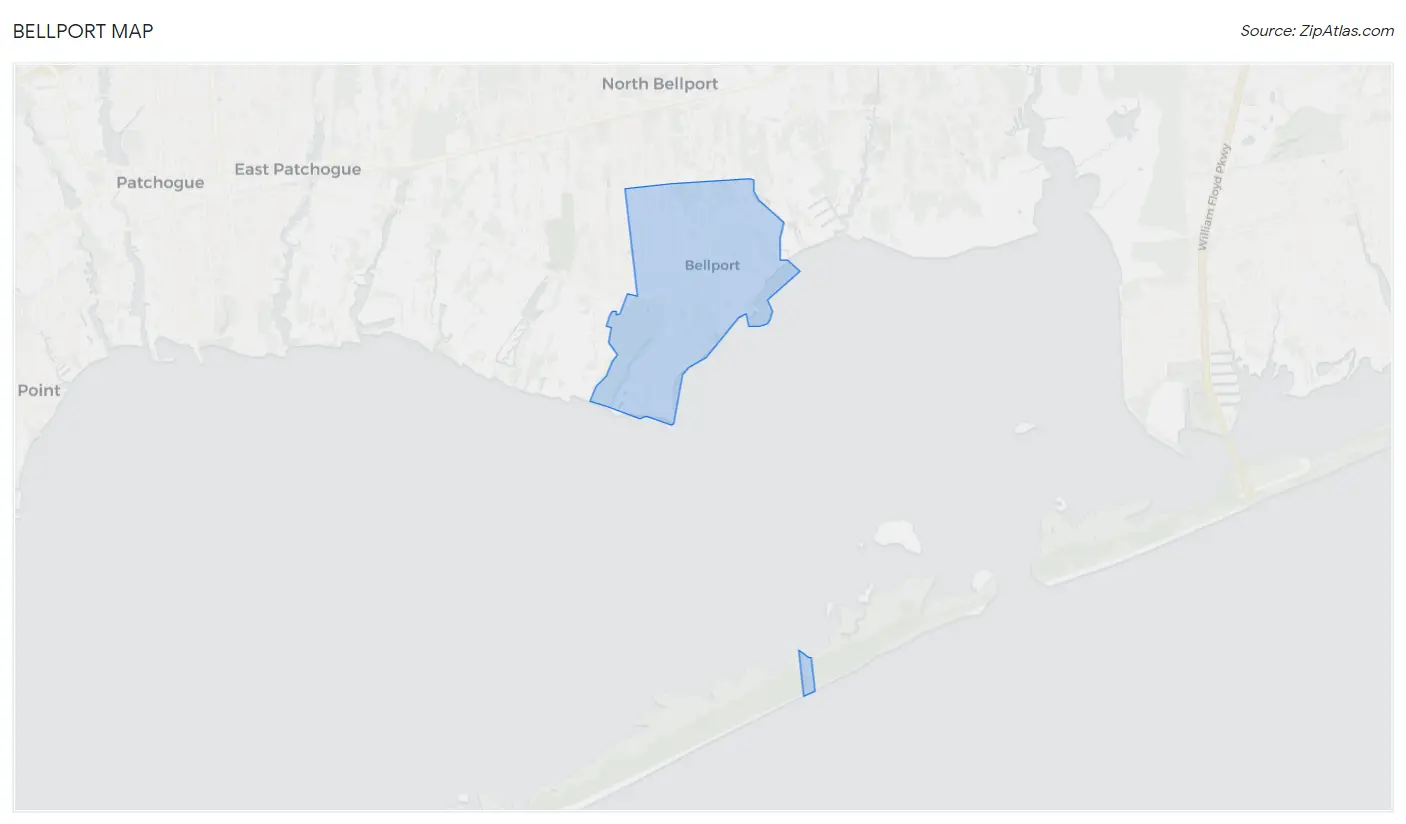
Bellport Map
Bellport Overview
$92,443
PER CAPITA INCOME
$180,625
AVG FAMILY INCOME
$131,719
AVG HOUSEHOLD INCOME
26.4%
WAGE / INCOME GAP [ % ]
73.6¢/ $1
WAGE / INCOME GAP [ $ ]
0.52
INEQUALITY / GINI INDEX
1,844
TOTAL POPULATION
957
MALE POPULATION
887
FEMALE POPULATION
107.89
MALES / 100 FEMALES
92.69
FEMALES / 100 MALES
57.1
MEDIAN AGE
2.7
AVG FAMILY SIZE
2.0
AVG HOUSEHOLD SIZE
966
LABOR FORCE [ PEOPLE ]
59.1%
PERCENT IN LABOR FORCE
3.0%
UNEMPLOYMENT RATE
Bellport Zip Codes
Bellport Area Codes
Income in Bellport
Income Overview in Bellport
Per Capita Income in Bellport is $92,443, while median incomes of families and households are $180,625 and $131,719 respectively.
| Characteristic | Number | Measure |
| Per Capita Income | 1,844 | $92,443 |
| Median Family Income | 506 | $180,625 |
| Mean Family Income | 506 | $260,642 |
| Median Household Income | 925 | $131,719 |
| Mean Household Income | 925 | $185,108 |
| Income Deficit | 506 | $0 |
| Wage / Income Gap (%) | 1,844 | 26.37% |
| Wage / Income Gap ($) | 1,844 | 73.63¢ per $1 |
| Gini / Inequality Index | 1,844 | 0.52 |
Earnings by Sex in Bellport
Average Earnings in Bellport are $88,657, $97,250 for men and $71,607 for women, a difference of 26.4%.
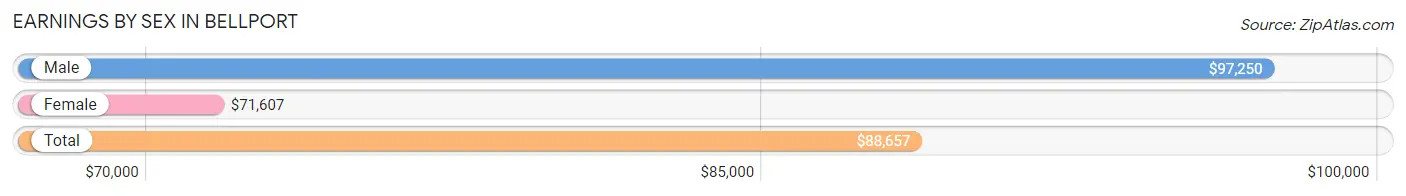
| Sex | Number | Average Earnings |
| Male | 577 (58.5%) | $97,250 |
| Female | 410 (41.5%) | $71,607 |
| Total | 987 (100.0%) | $88,657 |
Earnings by Sex by Income Bracket in Bellport
The most common earnings brackets in Bellport are $100,000+ for men (279 | 48.3%) and $100,000+ for women (162 | 39.5%).
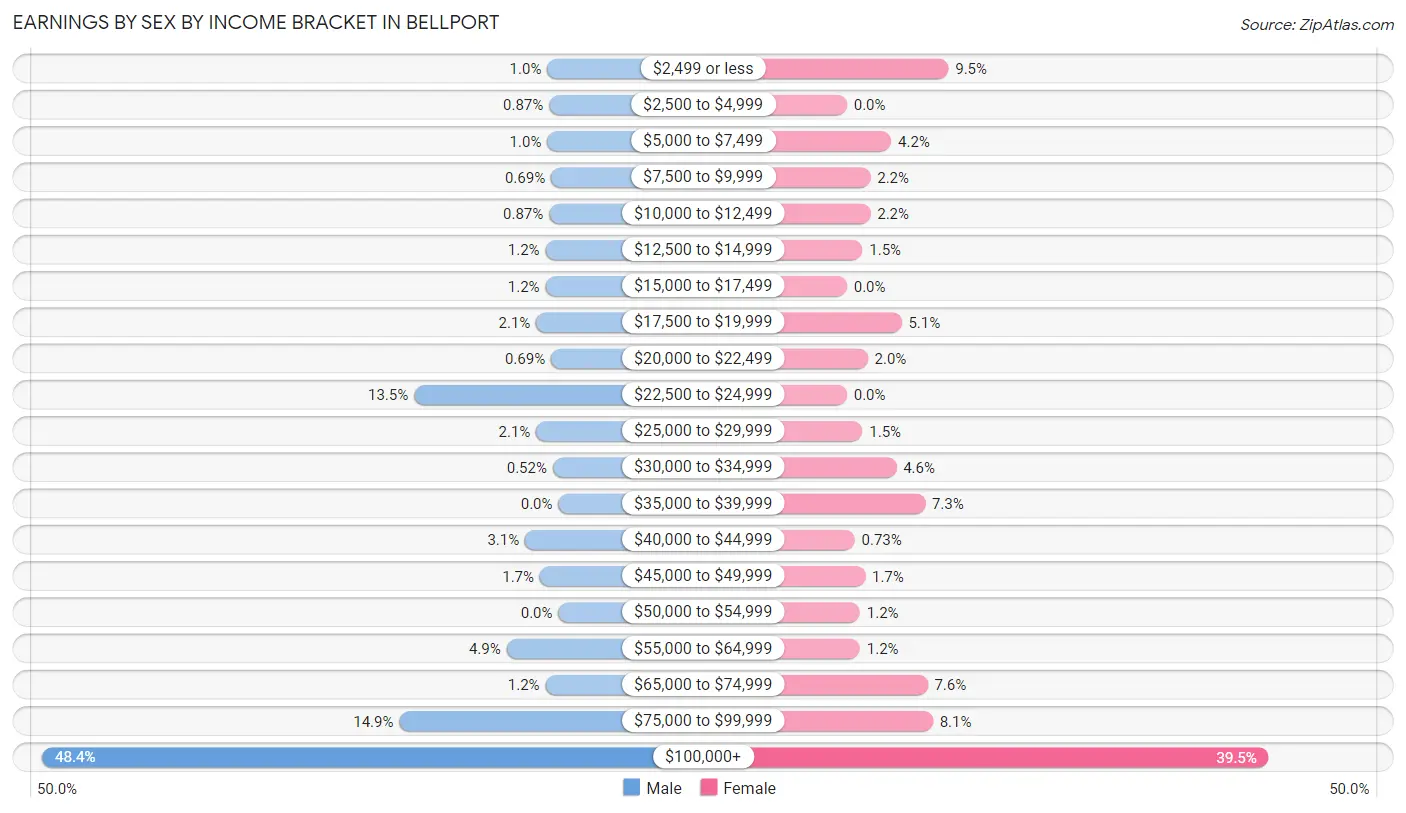
| Income | Male | Female |
| $2,499 or less | 6 (1.0%) | 39 (9.5%) |
| $2,500 to $4,999 | 5 (0.9%) | 0 (0.0%) |
| $5,000 to $7,499 | 6 (1.0%) | 17 (4.2%) |
| $7,500 to $9,999 | 4 (0.7%) | 9 (2.2%) |
| $10,000 to $12,499 | 5 (0.9%) | 9 (2.2%) |
| $12,500 to $14,999 | 7 (1.2%) | 6 (1.5%) |
| $15,000 to $17,499 | 7 (1.2%) | 0 (0.0%) |
| $17,500 to $19,999 | 12 (2.1%) | 21 (5.1%) |
| $20,000 to $22,499 | 4 (0.7%) | 8 (1.9%) |
| $22,500 to $24,999 | 78 (13.5%) | 0 (0.0%) |
| $25,000 to $29,999 | 12 (2.1%) | 6 (1.5%) |
| $30,000 to $34,999 | 3 (0.5%) | 19 (4.6%) |
| $35,000 to $39,999 | 0 (0.0%) | 30 (7.3%) |
| $40,000 to $44,999 | 18 (3.1%) | 3 (0.7%) |
| $45,000 to $49,999 | 10 (1.7%) | 7 (1.7%) |
| $50,000 to $54,999 | 0 (0.0%) | 5 (1.2%) |
| $55,000 to $64,999 | 28 (4.9%) | 5 (1.2%) |
| $65,000 to $74,999 | 7 (1.2%) | 31 (7.6%) |
| $75,000 to $99,999 | 86 (14.9%) | 33 (8.1%) |
| $100,000+ | 279 (48.3%) | 162 (39.5%) |
| Total | 577 (100.0%) | 410 (100.0%) |
Earnings by Sex by Educational Attainment in Bellport
Average earnings in Bellport are $99,028 for men and $88,839 for women, a difference of 10.3%. Men with an educational attainment of college or associate's degree enjoy the highest average annual earnings of $136,250, while those with bachelor's degree education earn the least with $78,098. Women with an educational attainment of graduate degree earn the most with the average annual earnings of $112,917, while those with college or associate's degree education have the smallest earnings of $44,583.
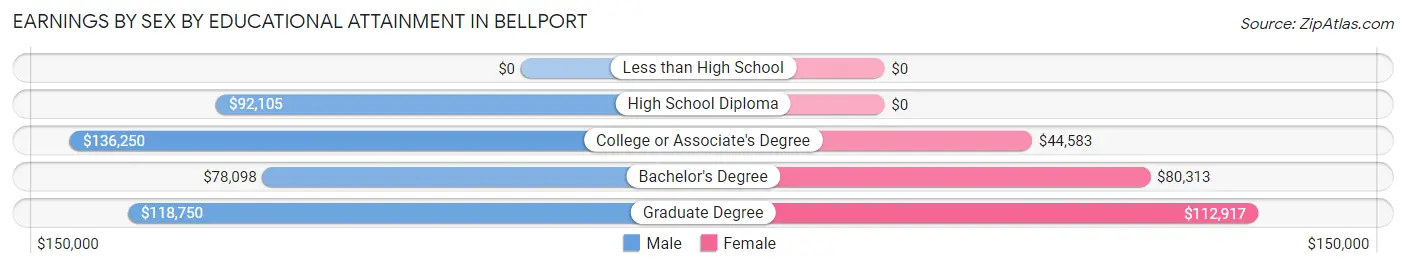
| Educational Attainment | Male Income | Female Income |
| Less than High School | - | - |
| High School Diploma | $92,105 | $0 |
| College or Associate's Degree | $136,250 | $44,583 |
| Bachelor's Degree | $78,098 | $80,313 |
| Graduate Degree | $118,750 | $112,917 |
| Total | $99,028 | $88,839 |
Family Income in Bellport
Family Income Brackets in Bellport
According to the Bellport family income data, there are 204 families falling into the $200,000+ income range, which is the most common income bracket and makes up 40.3% of all families.
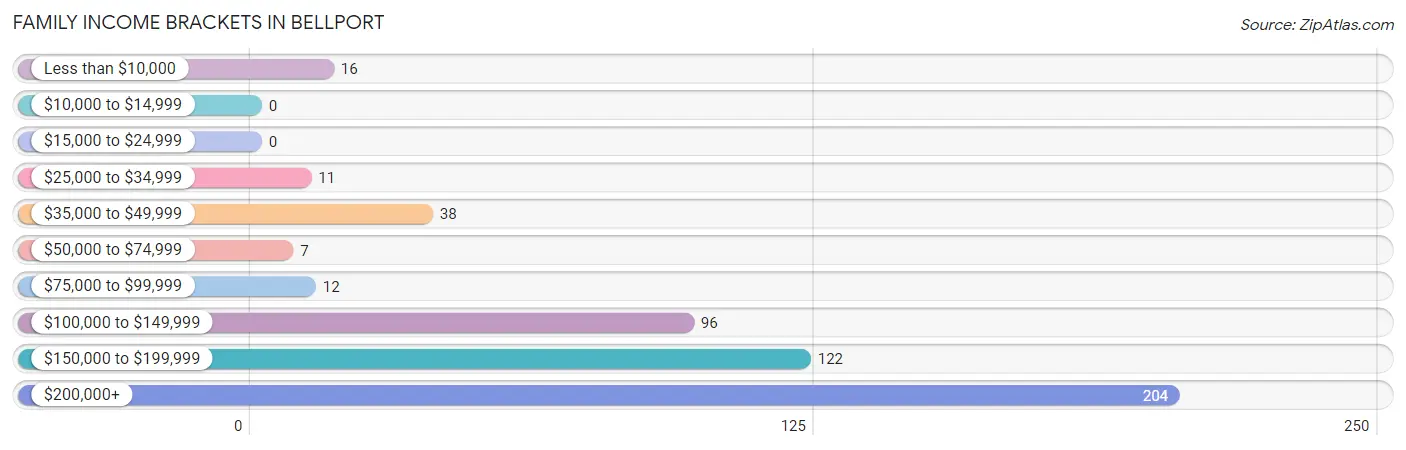
| Income Bracket | # Families | % Families |
| Less than $10,000 | 16 | 3.2% |
| $10,000 to $14,999 | 0 | 0.0% |
| $15,000 to $24,999 | 0 | 0.0% |
| $25,000 to $34,999 | 11 | 2.2% |
| $35,000 to $49,999 | 38 | 7.5% |
| $50,000 to $74,999 | 7 | 1.4% |
| $75,000 to $99,999 | 12 | 2.4% |
| $100,000 to $149,999 | 96 | 19.0% |
| $150,000 to $199,999 | 122 | 24.1% |
| $200,000+ | 204 | 40.3% |
Family Income by Famaliy Size in Bellport
4-person families (88 | 17.4%) account for the highest median family income in Bellport with $250,001 per family, while 2-person families (318 | 62.8%) have the highest median income of $90,625 per family member.
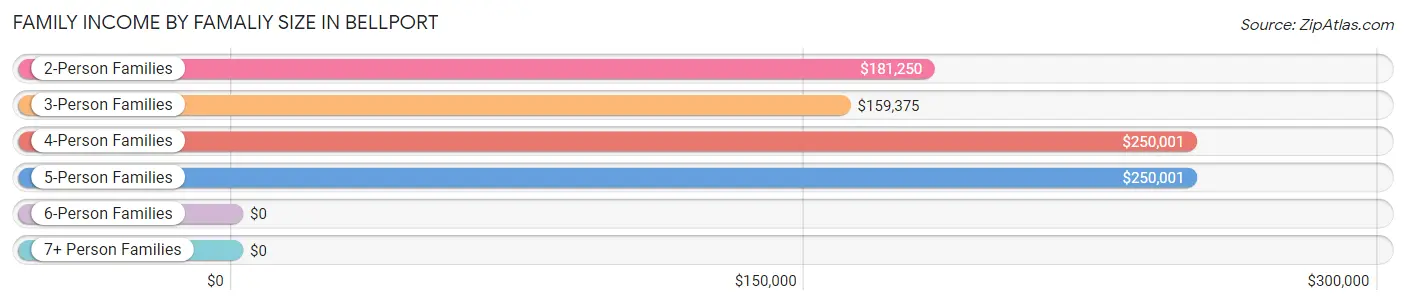
| Income Bracket | # Families | Median Income |
| 2-Person Families | 318 (62.8%) | $181,250 |
| 3-Person Families | 76 (15.0%) | $159,375 |
| 4-Person Families | 88 (17.4%) | $250,001 |
| 5-Person Families | 24 (4.7%) | $250,001 |
| 6-Person Families | 0 (0.0%) | $0 |
| 7+ Person Families | 0 (0.0%) | $0 |
| Total | 506 (100.0%) | $180,625 |
Family Income by Number of Earners in Bellport
The median family income in Bellport is $180,625, with families comprising 2 earners (202) having the highest median family income of $218,125, while families with no earners (108) have the lowest median family income of $120,000, accounting for 39.9% and 21.3% of families, respectively.
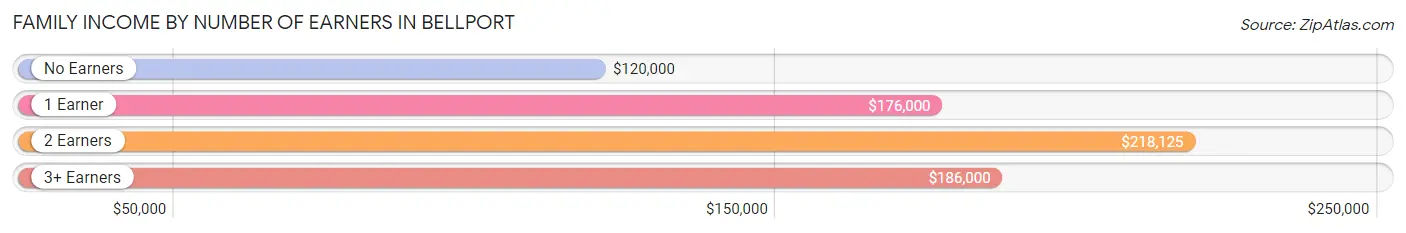
| Number of Earners | # Families | Median Income |
| No Earners | 108 (21.3%) | $120,000 |
| 1 Earner | 152 (30.0%) | $176,000 |
| 2 Earners | 202 (39.9%) | $218,125 |
| 3+ Earners | 44 (8.7%) | $186,000 |
| Total | 506 (100.0%) | $180,625 |
Household Income in Bellport
Household Income Brackets in Bellport
With 255 households falling in the category, the $200,000+ income range is the most frequent in Bellport, accounting for 27.6% of all households.
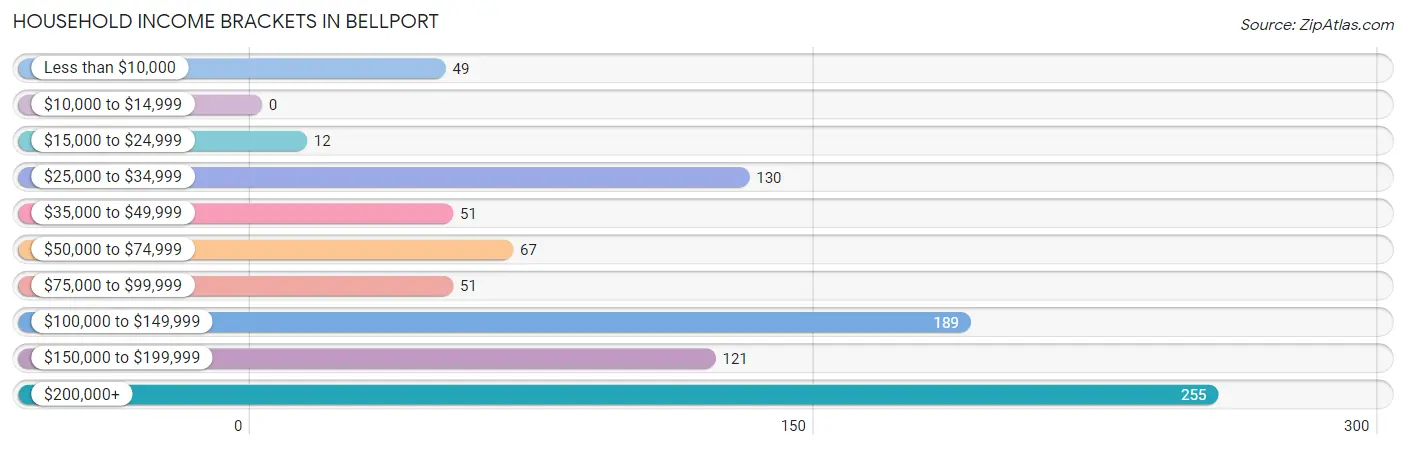
| Income Bracket | # Households | % Households |
| Less than $10,000 | 49 | 5.3% |
| $10,000 to $14,999 | 0 | 0.0% |
| $15,000 to $24,999 | 12 | 1.3% |
| $25,000 to $34,999 | 130 | 14.1% |
| $35,000 to $49,999 | 51 | 5.5% |
| $50,000 to $74,999 | 67 | 7.2% |
| $75,000 to $99,999 | 51 | 5.5% |
| $100,000 to $149,999 | 189 | 20.4% |
| $150,000 to $199,999 | 121 | 13.1% |
| $200,000+ | 255 | 27.6% |
Household Income by Householder Age in Bellport
The median household income in Bellport is $131,719, with the highest median household income of $185,250 found in the 25 to 44 years age bracket for the primary householder. A total of 85 households (9.2%) fall into this category.
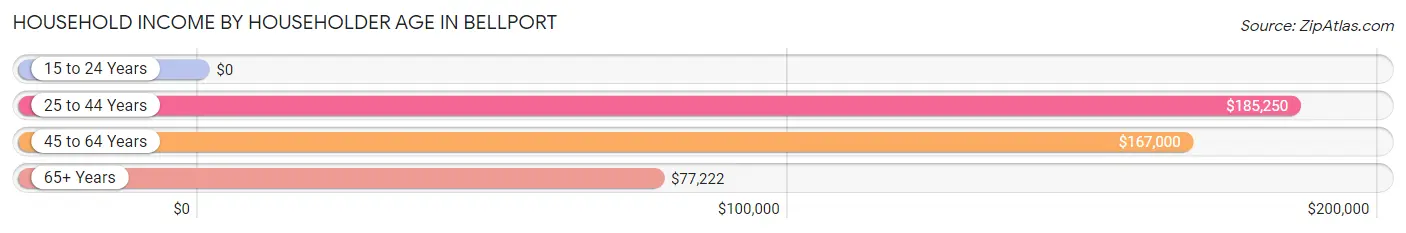
| Income Bracket | # Households | Median Income |
| 15 to 24 Years | 0 (0.0%) | $0 |
| 25 to 44 Years | 85 (9.2%) | $185,250 |
| 45 to 64 Years | 364 (39.4%) | $167,000 |
| 65+ Years | 476 (51.5%) | $77,222 |
| Total | 925 (100.0%) | $131,719 |
Poverty in Bellport
Income Below Poverty by Sex and Age in Bellport
With 1.9% poverty level for males and 9.3% for females among the residents of Bellport, 12 to 14 year old males and 12 to 14 year old females are the most vulnerable to poverty, with 12 males (18.8%) and 10 females (43.5%) in their respective age groups living below the poverty level.
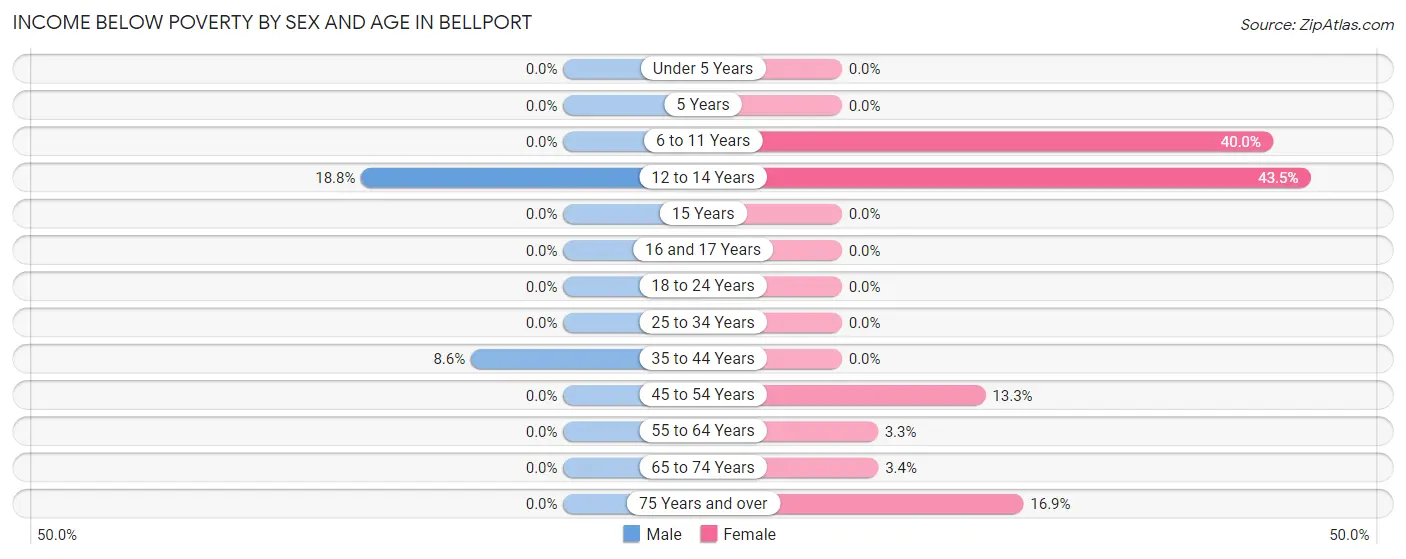
| Age Bracket | Male | Female |
| Under 5 Years | 0 (0.0%) | 0 (0.0%) |
| 5 Years | 0 (0.0%) | 0 (0.0%) |
| 6 to 11 Years | 0 (0.0%) | 14 (40.0%) |
| 12 to 14 Years | 12 (18.8%) | 10 (43.5%) |
| 15 Years | 0 (0.0%) | 0 (0.0%) |
| 16 and 17 Years | 0 (0.0%) | 0 (0.0%) |
| 18 to 24 Years | 0 (0.0%) | 0 (0.0%) |
| 25 to 34 Years | 0 (0.0%) | 0 (0.0%) |
| 35 to 44 Years | 6 (8.6%) | 0 (0.0%) |
| 45 to 54 Years | 0 (0.0%) | 16 (13.3%) |
| 55 to 64 Years | 0 (0.0%) | 6 (3.3%) |
| 65 to 74 Years | 0 (0.0%) | 5 (3.4%) |
| 75 Years and over | 0 (0.0%) | 31 (16.9%) |
| Total | 18 (1.9%) | 82 (9.3%) |
Income Above Poverty by Sex and Age in Bellport
According to the poverty statistics in Bellport, males aged under 5 years and females aged 5 years are the age groups that are most secure financially, with 100.0% of males and 100.0% of females in these age groups living above the poverty line.
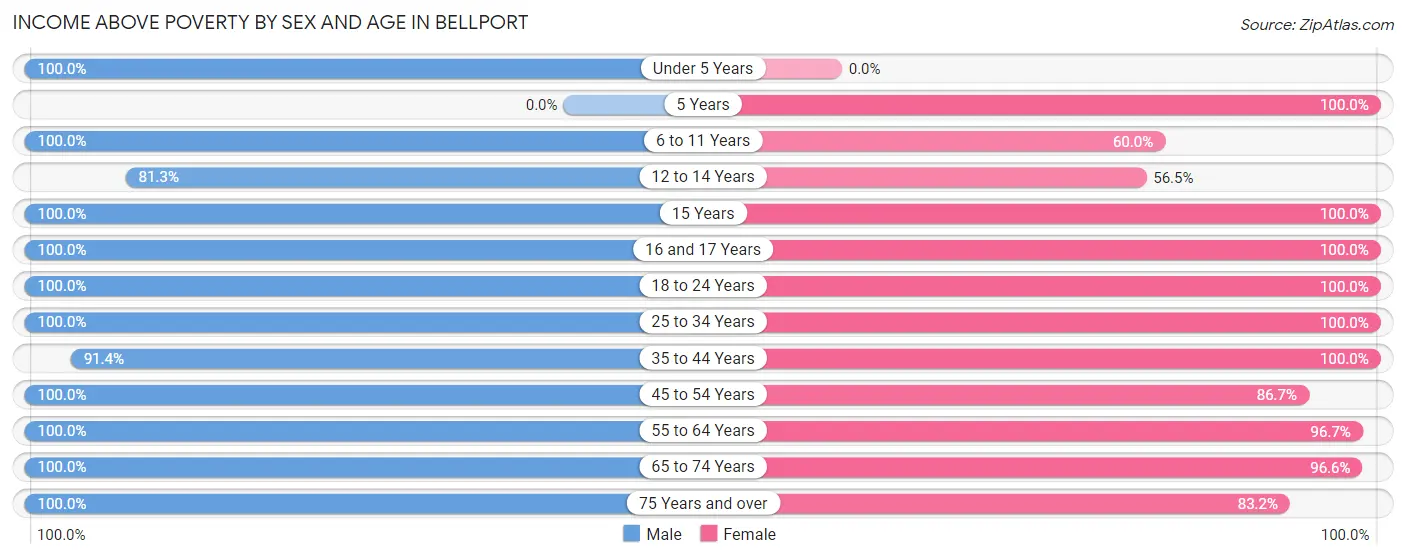
| Age Bracket | Male | Female |
| Under 5 Years | 15 (100.0%) | 0 (0.0%) |
| 5 Years | 0 (0.0%) | 7 (100.0%) |
| 6 to 11 Years | 34 (100.0%) | 21 (60.0%) |
| 12 to 14 Years | 52 (81.2%) | 13 (56.5%) |
| 15 Years | 19 (100.0%) | 12 (100.0%) |
| 16 and 17 Years | 31 (100.0%) | 28 (100.0%) |
| 18 to 24 Years | 29 (100.0%) | 58 (100.0%) |
| 25 to 34 Years | 61 (100.0%) | 37 (100.0%) |
| 35 to 44 Years | 64 (91.4%) | 54 (100.0%) |
| 45 to 54 Years | 96 (100.0%) | 104 (86.7%) |
| 55 to 64 Years | 224 (100.0%) | 174 (96.7%) |
| 65 to 74 Years | 216 (100.0%) | 143 (96.6%) |
| 75 Years and over | 98 (100.0%) | 153 (83.2%) |
| Total | 939 (98.1%) | 804 (90.7%) |
Income Below Poverty Among Married-Couple Families in Bellport
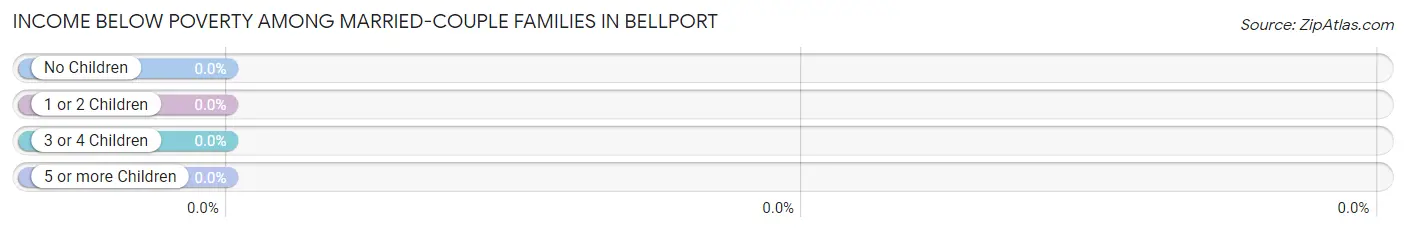
| Children | Above Poverty | Below Poverty |
| No Children | 299 (100.0%) | 0 (0.0%) |
| 1 or 2 Children | 80 (100.0%) | 0 (0.0%) |
| 3 or 4 Children | 17 (100.0%) | 0 (0.0%) |
| 5 or more Children | 0 (0.0%) | 0 (0.0%) |
| Total | 396 (100.0%) | 0 (0.0%) |
Income Below Poverty Among Single-Parent Households in Bellport
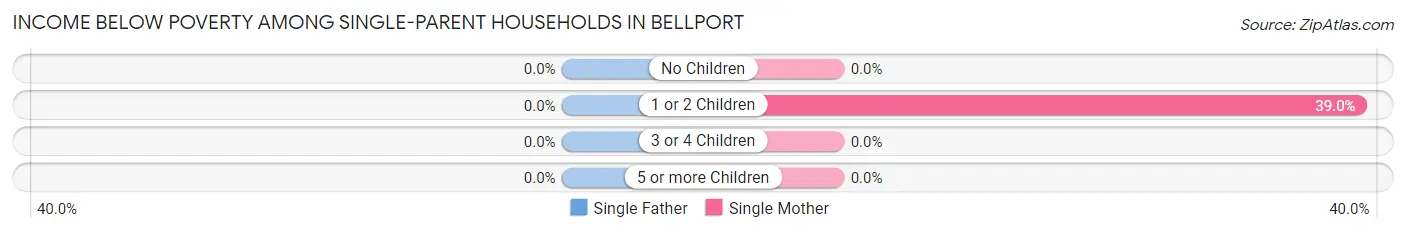
| Children | Single Father | Single Mother |
| No Children | 0 (0.0%) | 0 (0.0%) |
| 1 or 2 Children | 0 (0.0%) | 16 (39.0%) |
| 3 or 4 Children | 0 (0.0%) | 0 (0.0%) |
| 5 or more Children | 0 (0.0%) | 0 (0.0%) |
| Total | 0 (0.0%) | 16 (20.8%) |
Income Below Poverty Among Married-Couple vs Single-Parent Households in Bellport
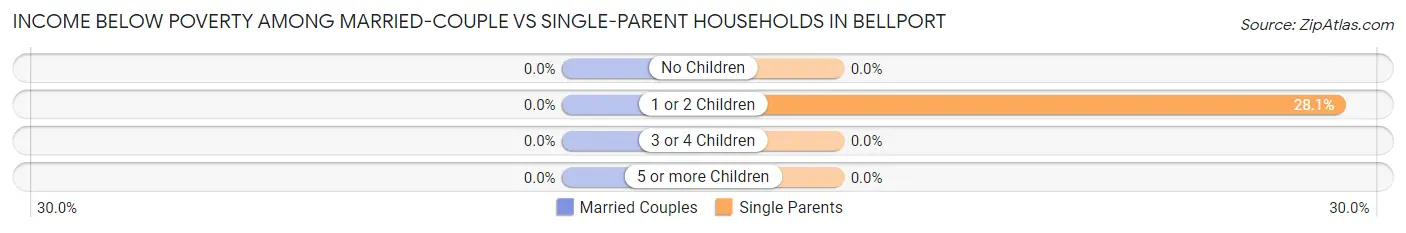
| Children | Married-Couple Families | Single-Parent Households |
| No Children | 0 (0.0%) | 0 (0.0%) |
| 1 or 2 Children | 0 (0.0%) | 16 (28.1%) |
| 3 or 4 Children | 0 (0.0%) | 0 (0.0%) |
| 5 or more Children | 0 (0.0%) | 0 (0.0%) |
| Total | 0 (0.0%) | 16 (14.5%) |
Race in Bellport
The most populous races in Bellport are White / Caucasian (1,682 | 91.2%), Two or more Races (89 | 4.8%), and Hispanic or Latino (68 | 3.7%).
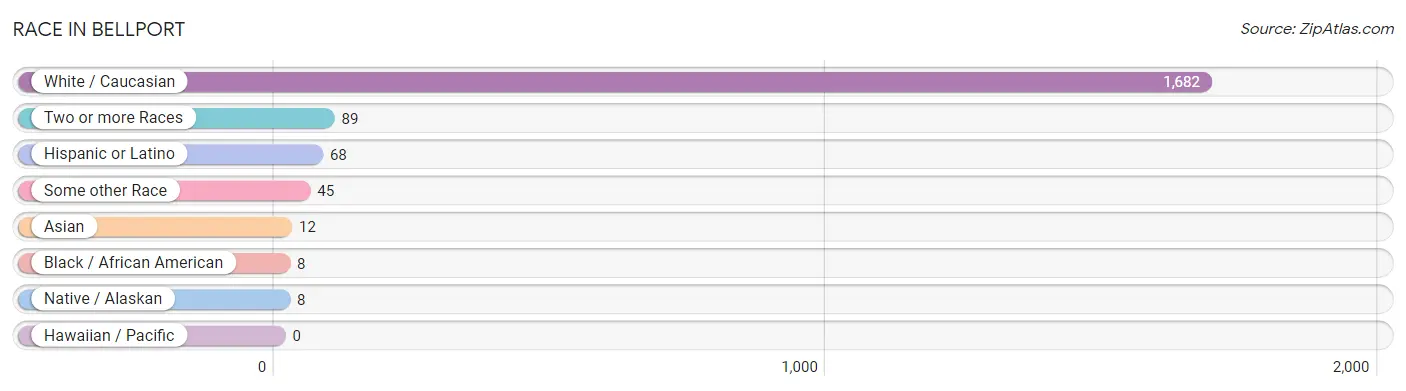
| Race | # Population | % Population |
| Asian | 12 | 0.6% |
| Black / African American | 8 | 0.4% |
| Hawaiian / Pacific | 0 | 0.0% |
| Hispanic or Latino | 68 | 3.7% |
| Native / Alaskan | 8 | 0.4% |
| White / Caucasian | 1,682 | 91.2% |
| Two or more Races | 89 | 4.8% |
| Some other Race | 45 | 2.4% |
| Total | 1,844 | 100.0% |
Ancestry in Bellport
The most populous ancestries reported in Bellport are Irish (662 | 35.9%), German (557 | 30.2%), Italian (344 | 18.7%), English (264 | 14.3%), and Polish (135 | 7.3%), together accounting for 106.4% of all Bellport residents.
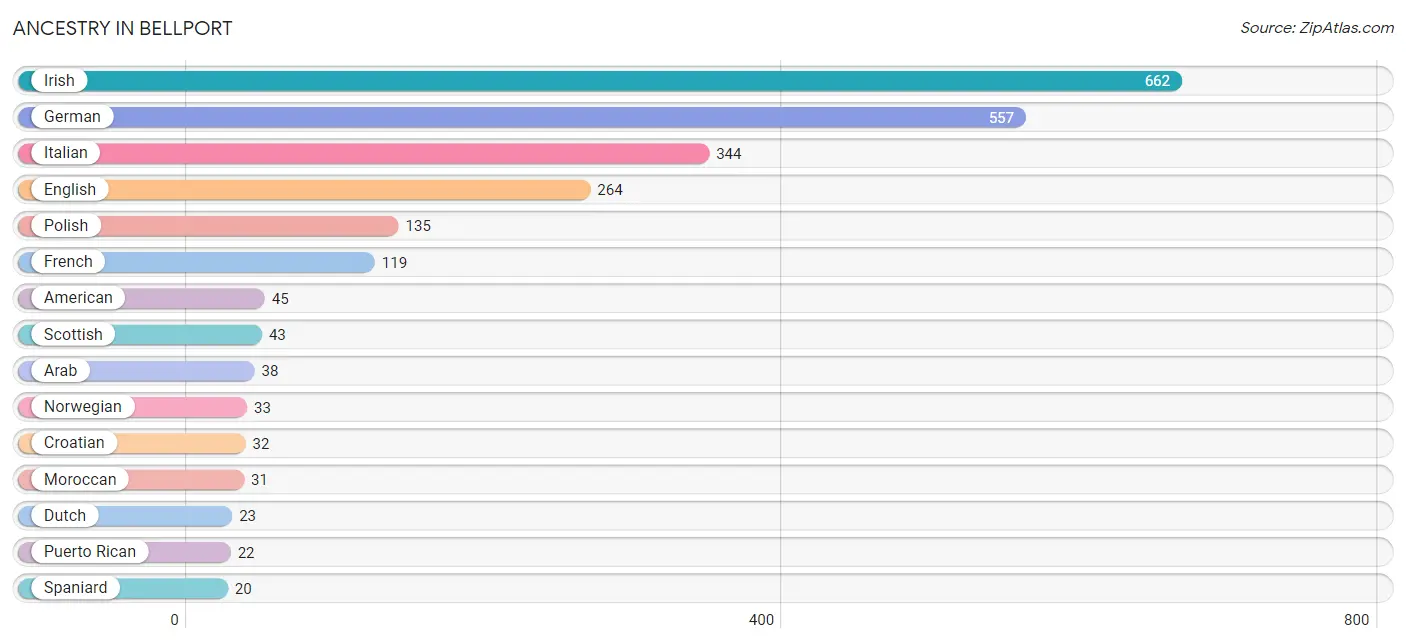
| Ancestry | # Population | % Population |
| American | 45 | 2.4% |
| Apache | 7 | 0.4% |
| Arab | 38 | 2.1% |
| Austrian | 16 | 0.9% |
| British | 18 | 1.0% |
| Burmese | 5 | 0.3% |
| Canadian | 6 | 0.3% |
| Central American | 8 | 0.4% |
| Central American Indian | 8 | 0.4% |
| Colombian | 1 | 0.1% |
| Croatian | 32 | 1.7% |
| Czechoslovakian | 11 | 0.6% |
| Dutch | 23 | 1.3% |
| Eastern European | 10 | 0.5% |
| English | 264 | 14.3% |
| European | 18 | 1.0% |
| French | 119 | 6.5% |
| German | 557 | 30.2% |
| Greek | 7 | 0.4% |
| Guatemalan | 8 | 0.4% |
| Hungarian | 13 | 0.7% |
| Indian (Asian) | 7 | 0.4% |
| Irish | 662 | 35.9% |
| Italian | 344 | 18.7% |
| Jamaican | 6 | 0.3% |
| Lebanese | 7 | 0.4% |
| Lithuanian | 7 | 0.4% |
| Moroccan | 31 | 1.7% |
| Norwegian | 33 | 1.8% |
| Pakistani | 1 | 0.1% |
| Polish | 135 | 7.3% |
| Puerto Rican | 22 | 1.2% |
| Romanian | 6 | 0.3% |
| Scotch-Irish | 10 | 0.5% |
| Scottish | 43 | 2.3% |
| Slovak | 3 | 0.2% |
| South American | 12 | 0.6% |
| Spaniard | 20 | 1.1% |
| Swedish | 4 | 0.2% |
| Swiss | 5 | 0.3% |
| Ukrainian | 12 | 0.6% |
| Venezuelan | 11 | 0.6% |
| Welsh | 13 | 0.7% | View All 43 Rows |
Immigrants in Bellport
The most numerous immigrant groups reported in Bellport came from Europe (26 | 1.4%), Latin America (19 | 1.0%), Northern Europe (13 | 0.7%), Asia (12 | 0.6%), and South America (12 | 0.6%), together accounting for 4.4% of all Bellport residents.
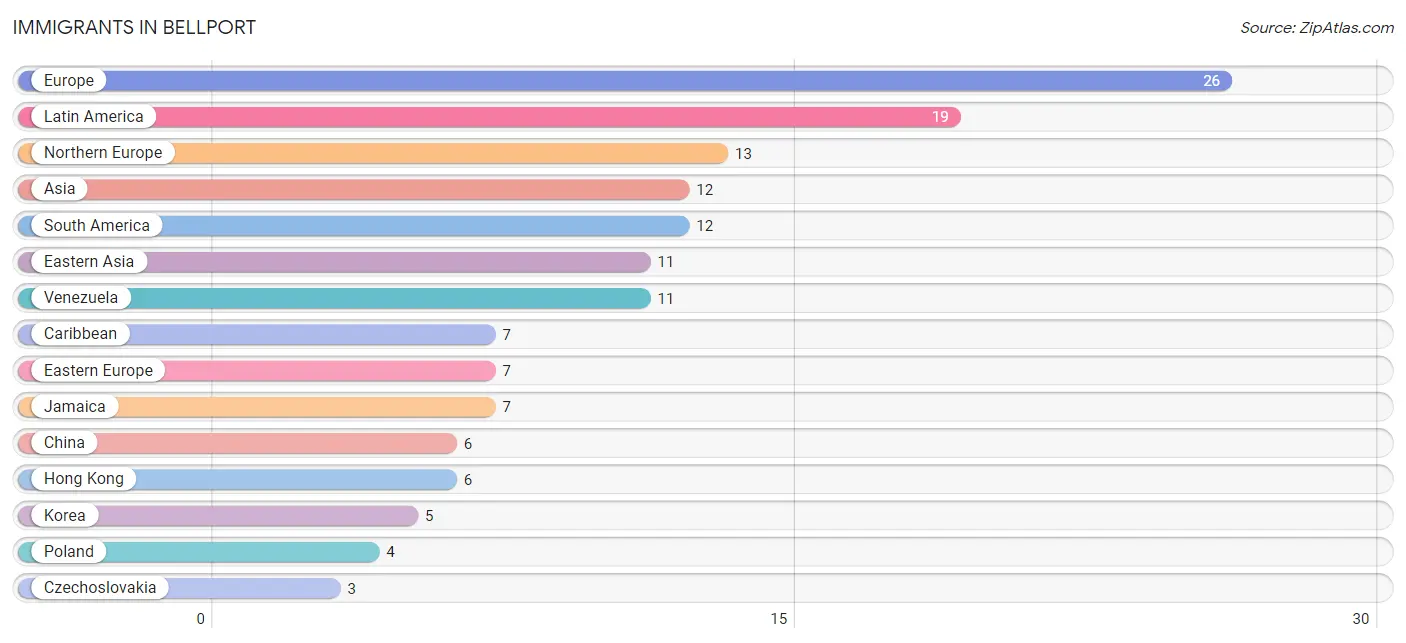
| Immigration Origin | # Population | % Population |
| Asia | 12 | 0.6% |
| Caribbean | 7 | 0.4% |
| China | 6 | 0.3% |
| Colombia | 1 | 0.1% |
| Czechoslovakia | 3 | 0.2% |
| Eastern Asia | 11 | 0.6% |
| Eastern Europe | 7 | 0.4% |
| Europe | 26 | 1.4% |
| Germany | 3 | 0.2% |
| Hong Kong | 6 | 0.3% |
| Italy | 3 | 0.2% |
| Jamaica | 7 | 0.4% |
| Korea | 5 | 0.3% |
| Latin America | 19 | 1.0% |
| Northern Europe | 13 | 0.7% |
| Poland | 4 | 0.2% |
| South America | 12 | 0.6% |
| South Eastern Asia | 1 | 0.1% |
| Southern Europe | 3 | 0.2% |
| Thailand | 1 | 0.1% |
| Venezuela | 11 | 0.6% |
| Western Europe | 3 | 0.2% | View All 22 Rows |
Sex and Age in Bellport
Sex and Age in Bellport
The most populous age groups in Bellport are 55 to 59 Years (176 | 18.4%) for men and 60 to 64 Years (117 | 13.2%) for women.
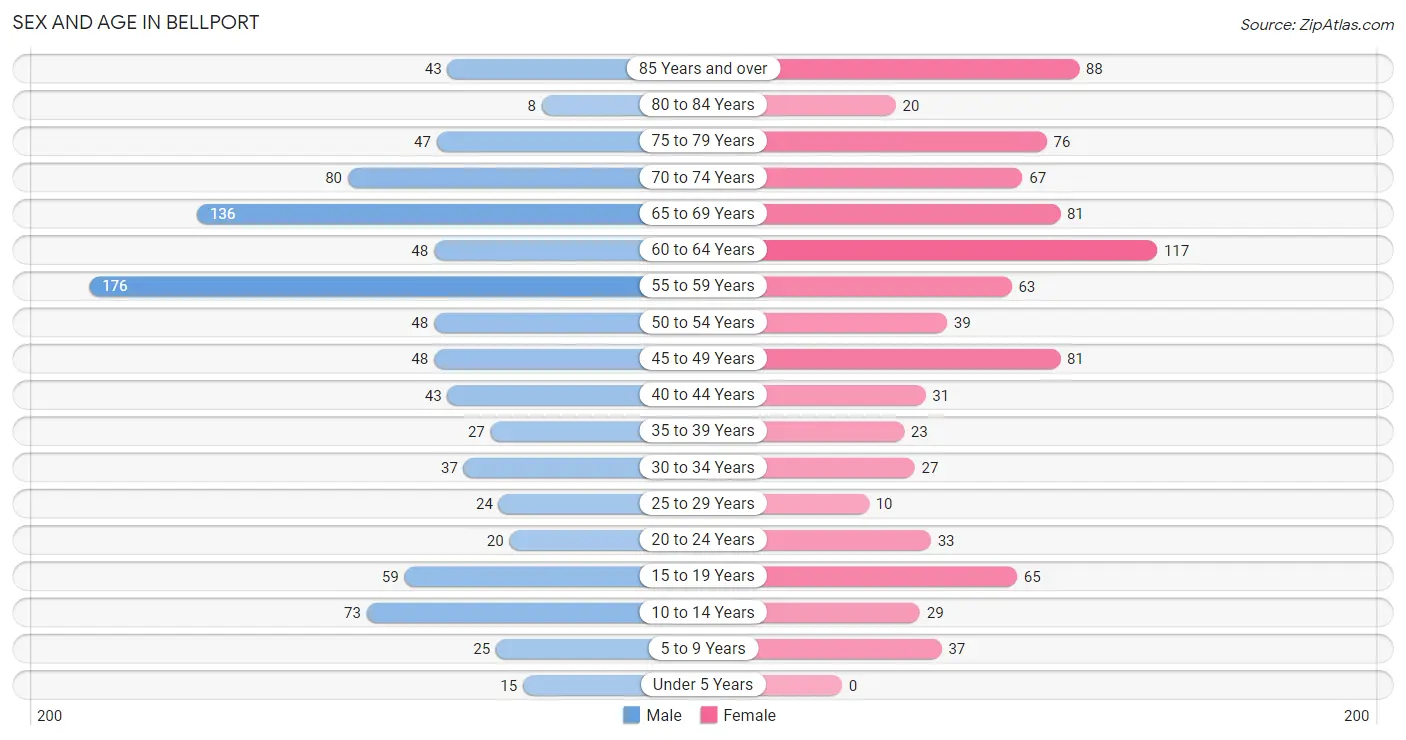
| Age Bracket | Male | Female |
| Under 5 Years | 15 (1.6%) | 0 (0.0%) |
| 5 to 9 Years | 25 (2.6%) | 37 (4.2%) |
| 10 to 14 Years | 73 (7.6%) | 29 (3.3%) |
| 15 to 19 Years | 59 (6.2%) | 65 (7.3%) |
| 20 to 24 Years | 20 (2.1%) | 33 (3.7%) |
| 25 to 29 Years | 24 (2.5%) | 10 (1.1%) |
| 30 to 34 Years | 37 (3.9%) | 27 (3.0%) |
| 35 to 39 Years | 27 (2.8%) | 23 (2.6%) |
| 40 to 44 Years | 43 (4.5%) | 31 (3.5%) |
| 45 to 49 Years | 48 (5.0%) | 81 (9.1%) |
| 50 to 54 Years | 48 (5.0%) | 39 (4.4%) |
| 55 to 59 Years | 176 (18.4%) | 63 (7.1%) |
| 60 to 64 Years | 48 (5.0%) | 117 (13.2%) |
| 65 to 69 Years | 136 (14.2%) | 81 (9.1%) |
| 70 to 74 Years | 80 (8.4%) | 67 (7.5%) |
| 75 to 79 Years | 47 (4.9%) | 76 (8.6%) |
| 80 to 84 Years | 8 (0.8%) | 20 (2.2%) |
| 85 Years and over | 43 (4.5%) | 88 (9.9%) |
| Total | 957 (100.0%) | 887 (100.0%) |
Families and Households in Bellport
Median Family Size in Bellport
The median family size in Bellport is 2.68 persons per family, with single female/mother families (77 | 15.2%) accounting for the largest median family size of 3.17 persons per family. On the other hand, single male/father families (33 | 6.5%) represent the smallest median family size with 2.33 persons per family.
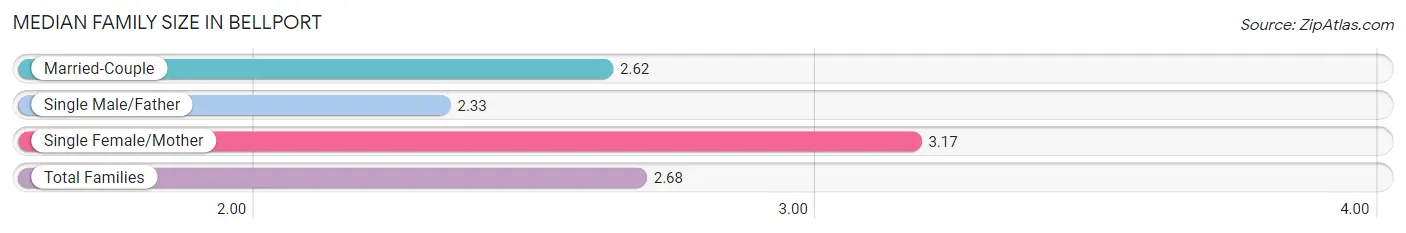
| Family Type | # Families | Family Size |
| Married-Couple | 396 (78.3%) | 2.62 |
| Single Male/Father | 33 (6.5%) | 2.33 |
| Single Female/Mother | 77 (15.2%) | 3.17 |
| Total Families | 506 (100.0%) | 2.68 |
Median Household Size in Bellport
The median household size in Bellport is 1.99 persons per household, with single female/mother households (77 | 8.3%) accounting for the largest median household size of 3.6 persons per household. non-family households (419 | 45.3%) represent the smallest median household size with 1.07 persons per household.
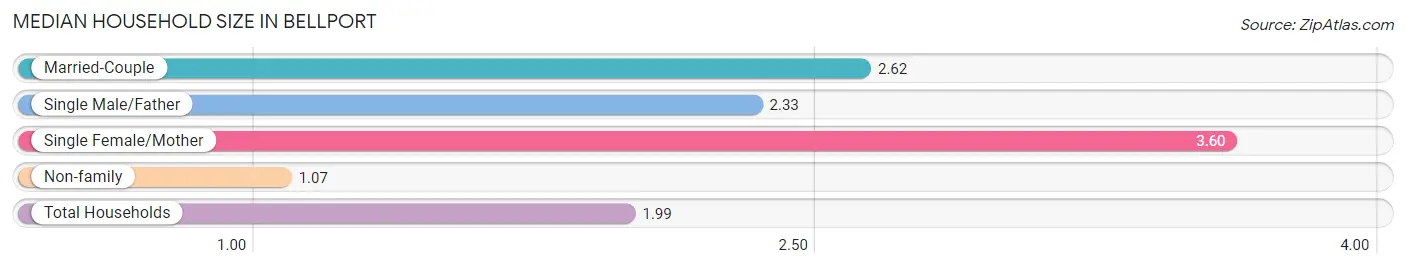
| Household Type | # Households | Household Size |
| Married-Couple | 396 (42.8%) | 2.62 |
| Single Male/Father | 33 (3.6%) | 2.33 |
| Single Female/Mother | 77 (8.3%) | 3.60 |
| Non-family | 419 (45.3%) | 1.07 |
| Total Households | 925 (100.0%) | 1.99 |
Household Size by Marriage Status in Bellport
Out of a total of 925 households in Bellport, 506 (54.7%) are family households, while 419 (45.3%) are nonfamily households. The most numerous type of family households are 2-person households, comprising 312, and the most common type of nonfamily households are 1-person households, comprising 390.
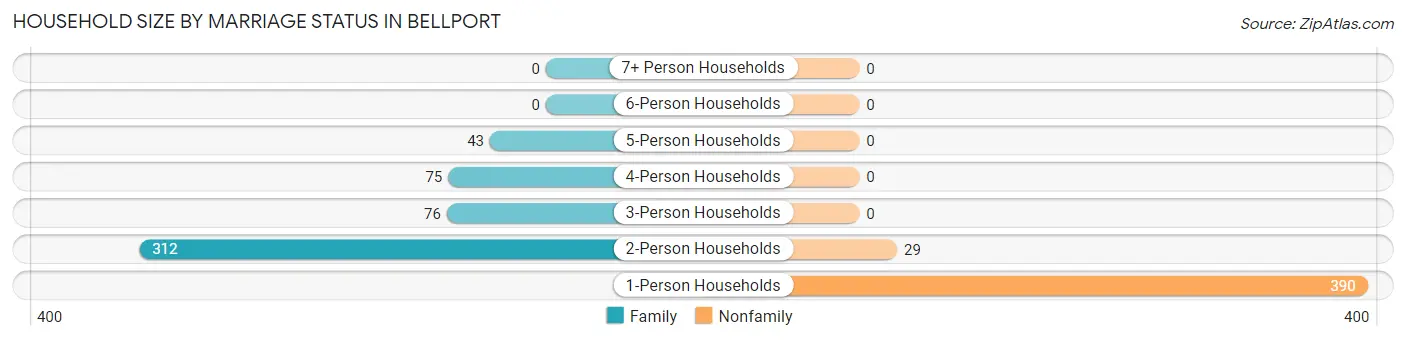
| Household Size | Family Households | Nonfamily Households |
| 1-Person Households | - | 390 (42.2%) |
| 2-Person Households | 312 (33.7%) | 29 (3.1%) |
| 3-Person Households | 76 (8.2%) | 0 (0.0%) |
| 4-Person Households | 75 (8.1%) | 0 (0.0%) |
| 5-Person Households | 43 (4.6%) | 0 (0.0%) |
| 6-Person Households | 0 (0.0%) | 0 (0.0%) |
| 7+ Person Households | 0 (0.0%) | 0 (0.0%) |
| Total | 506 (54.7%) | 419 (45.3%) |
Female Fertility in Bellport
Fertility by Age in Bellport
Average fertility rate in Bellport is 85.0 births per 1,000 women. Women in the age bracket of 35 to 50 years have the highest fertility rate with 170.0 births per 1,000 women. Women in the age bracket of 35 to 50 years acount for 100.0% of all women with births.
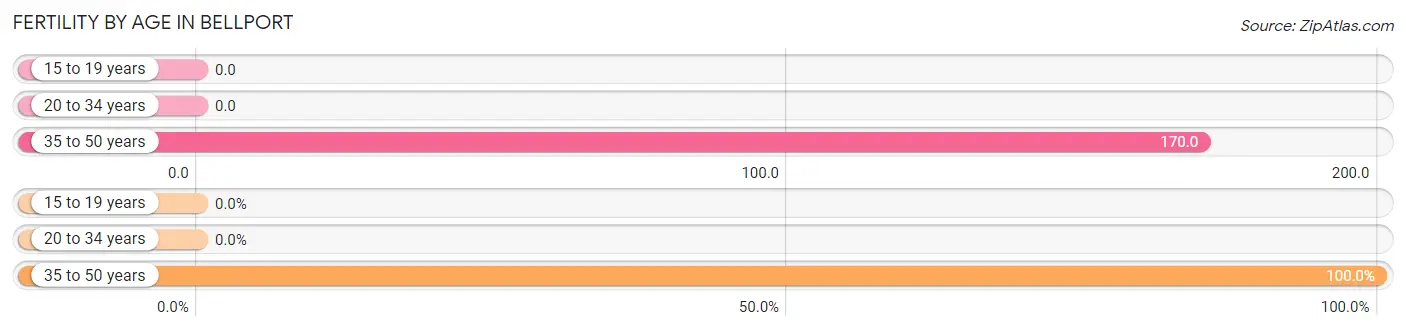
| Age Bracket | Women with Births | Births / 1,000 Women |
| 15 to 19 years | 0 (0.0%) | 0.0 |
| 20 to 34 years | 0 (0.0%) | 0.0 |
| 35 to 50 years | 23 (100.0%) | 170.0 |
| Total | 23 (100.0%) | 85.0 |
Fertility by Age by Marriage Status in Bellport
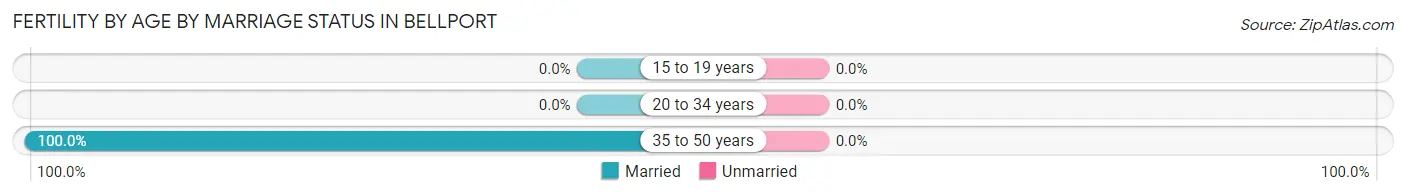
| Age Bracket | Married | Unmarried |
| 15 to 19 years | 0 (0.0%) | 0 (0.0%) |
| 20 to 34 years | 0 (0.0%) | 0 (0.0%) |
| 35 to 50 years | 23 (100.0%) | 0 (0.0%) |
| Total | 23 (100.0%) | 0 (0.0%) |
Fertility by Education in Bellport
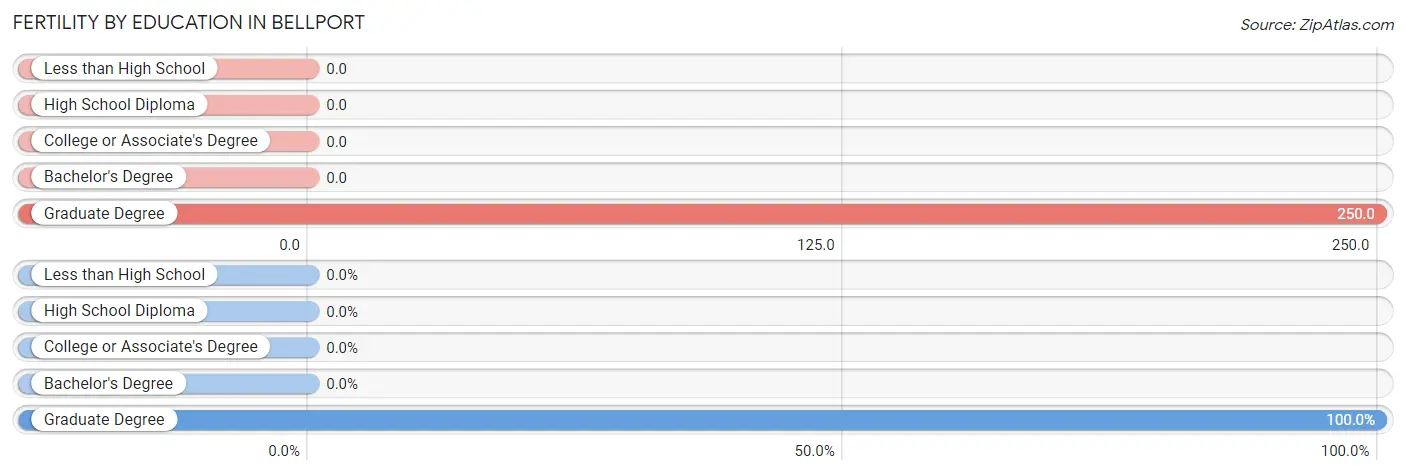
| Educational Attainment | Women with Births | Births / 1,000 Women |
| Less than High School | 0 (0.0%) | 0.0 |
| High School Diploma | 0 (0.0%) | 0.0 |
| College or Associate's Degree | 0 (0.0%) | 0.0 |
| Bachelor's Degree | 0 (0.0%) | 0.0 |
| Graduate Degree | 23 (100.0%) | 250.0 |
| Total | 23 (100.0%) | 85.0 |
Fertility by Education by Marriage Status in Bellport
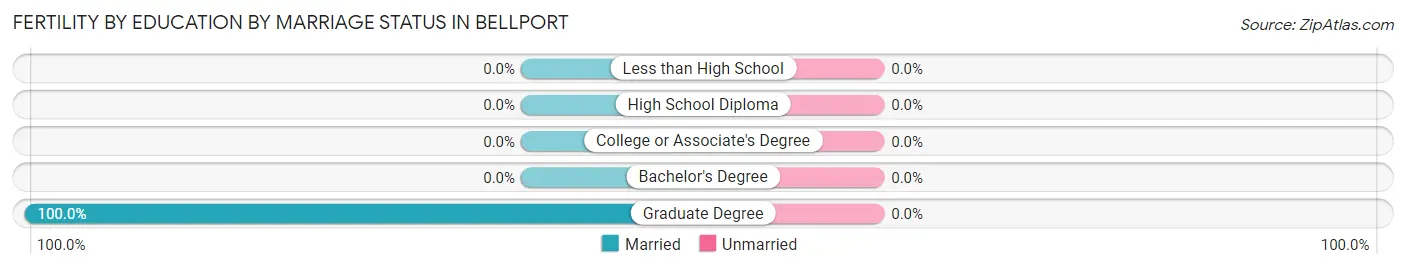
| Educational Attainment | Married | Unmarried |
| Less than High School | 0 (0.0%) | 0 (0.0%) |
| High School Diploma | 0 (0.0%) | 0 (0.0%) |
| College or Associate's Degree | 0 (0.0%) | 0 (0.0%) |
| Bachelor's Degree | 0 (0.0%) | 0 (0.0%) |
| Graduate Degree | 23 (100.0%) | 0 (0.0%) |
| Total | 23 (100.0%) | 0 (0.0%) |
Employment Characteristics in Bellport
Employment by Class of Employer in Bellport
Among the 856 employed individuals in Bellport, private company employees (354 | 41.4%), local government employees (197 | 23.0%), and not-for-profit organizations (99 | 11.6%) make up the most common classes of employment.
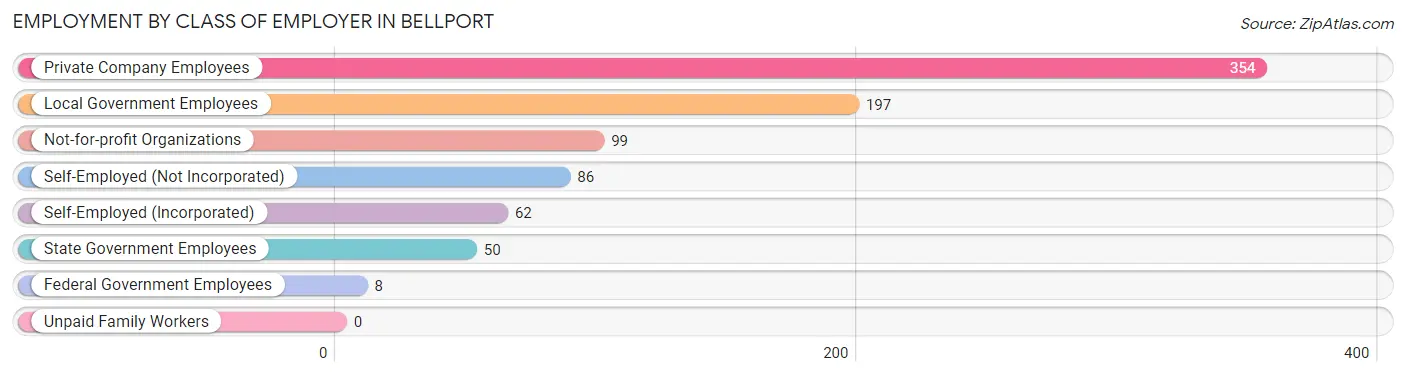
| Employer Class | # Employees | % Employees |
| Private Company Employees | 354 | 41.4% |
| Self-Employed (Incorporated) | 62 | 7.2% |
| Self-Employed (Not Incorporated) | 86 | 10.1% |
| Not-for-profit Organizations | 99 | 11.6% |
| Local Government Employees | 197 | 23.0% |
| State Government Employees | 50 | 5.8% |
| Federal Government Employees | 8 | 0.9% |
| Unpaid Family Workers | 0 | 0.0% |
| Total | 856 | 100.0% |
Employment Status by Age in Bellport
According to the labor force statistics for Bellport, out of the total population over 16 years of age (1,634), 59.1% or 966 individuals are in the labor force, with 3.0% or 29 of them unemployed. The age group with the highest labor force participation rate is 25 to 29 years, with 100.0% or 34 individuals in the labor force. Within the labor force, the 55 to 59 years age range has the highest percentage of unemployed individuals, with 6.3% or 13 of them being unemployed.
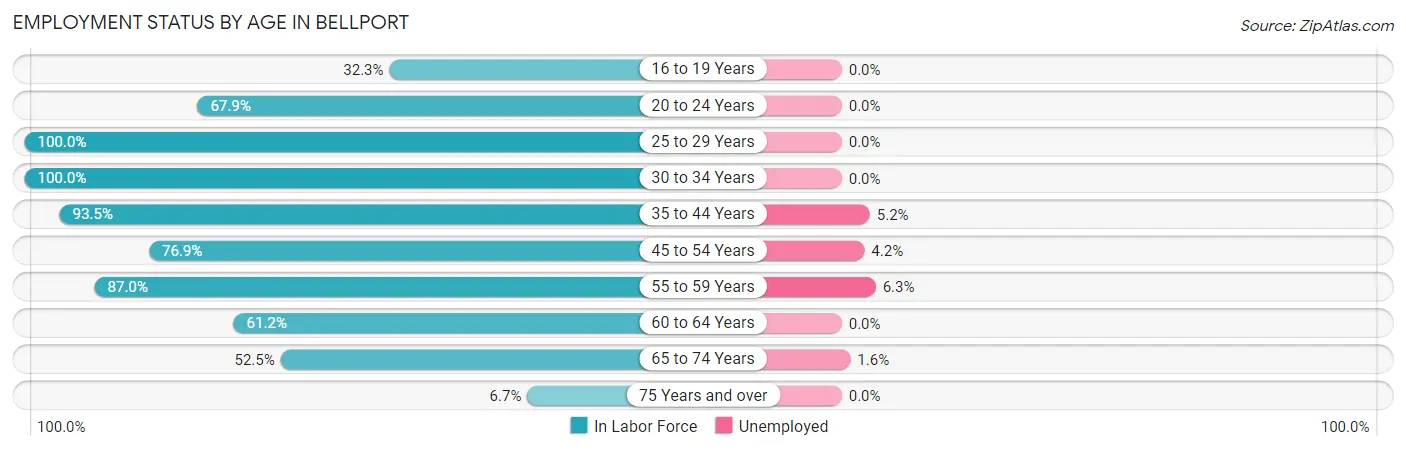
| Age Bracket | In Labor Force | Unemployed |
| 16 to 19 Years | 30 (32.3%) | 0 (0.0%) |
| 20 to 24 Years | 36 (67.9%) | 0 (0.0%) |
| 25 to 29 Years | 34 (100.0%) | 0 (0.0%) |
| 30 to 34 Years | 64 (100.0%) | 0 (0.0%) |
| 35 to 44 Years | 116 (93.5%) | 6 (5.2%) |
| 45 to 54 Years | 166 (76.9%) | 7 (4.2%) |
| 55 to 59 Years | 208 (87.0%) | 13 (6.3%) |
| 60 to 64 Years | 101 (61.2%) | 0 (0.0%) |
| 65 to 74 Years | 191 (52.5%) | 3 (1.6%) |
| 75 Years and over | 19 (6.7%) | 0 (0.0%) |
| Total | 966 (59.1%) | 29 (3.0%) |
Employment Status by Educational Attainment in Bellport
According to labor force statistics for Bellport, 81.8% of individuals (689) out of the total population between 25 and 64 years of age (842) are in the labor force, with 3.8% or 26 of them being unemployed. The group with the highest labor force participation rate are those with the educational attainment of bachelor's degree or higher, with 90.5% or 476 individuals in the labor force. Within the labor force, individuals with less than high school education have the highest percentage of unemployment, with 100.0% or 7 of them being unemployed.
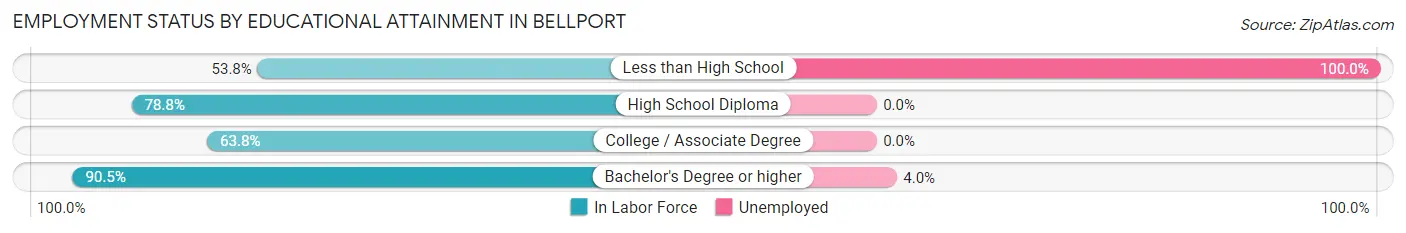
| Educational Attainment | In Labor Force | Unemployed |
| Less than High School | 7 (53.8%) | 13 (100.0%) |
| High School Diploma | 67 (78.8%) | 0 (0.0%) |
| College / Associate Degree | 139 (63.8%) | 0 (0.0%) |
| Bachelor's Degree or higher | 476 (90.5%) | 21 (4.0%) |
| Total | 689 (81.8%) | 32 (3.8%) |
Employment Occupations by Sex in Bellport
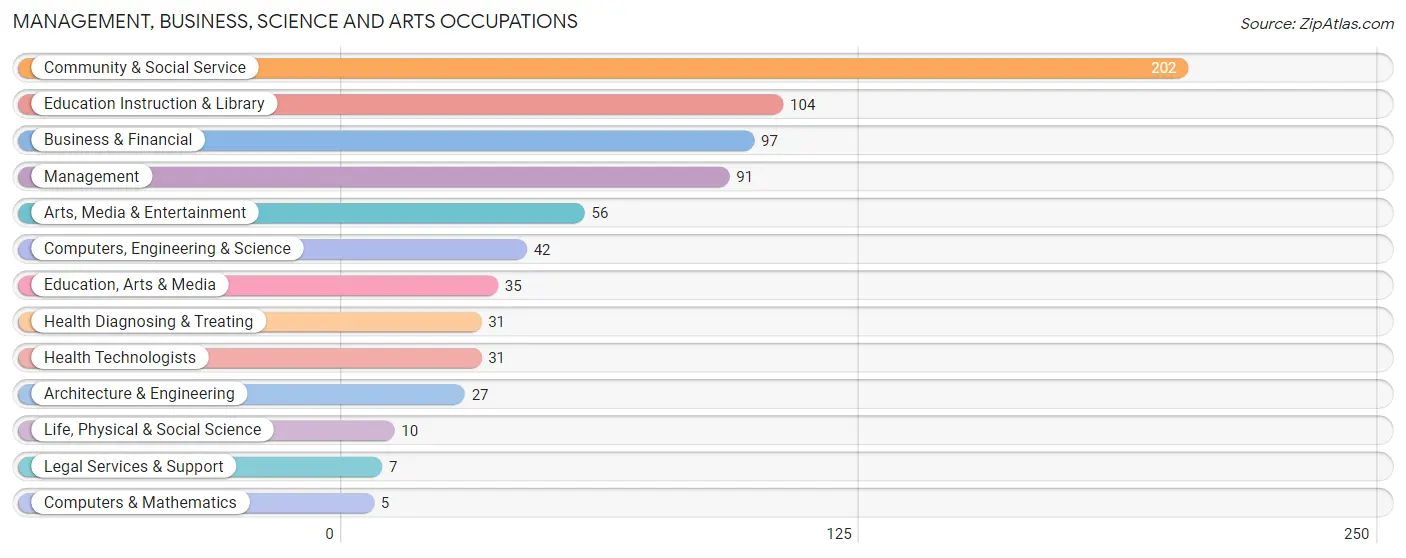
Management, Business, Science and Arts Occupations
The most common Management, Business, Science and Arts occupations in Bellport are Community & Social Service (202 | 21.6%), Education Instruction & Library (104 | 11.1%), Business & Financial (97 | 10.4%), Management (91 | 9.7%), and Arts, Media & Entertainment (56 | 6.0%).
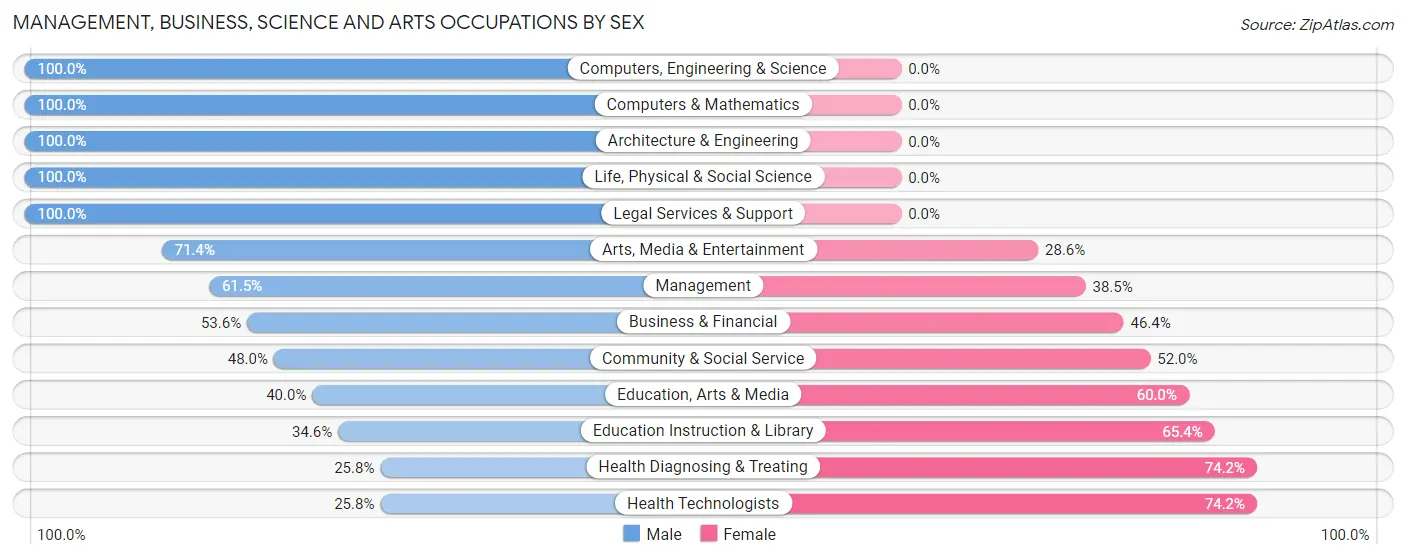
Management, Business, Science and Arts Occupations by Sex
Within the Management, Business, Science and Arts occupations in Bellport, the most male-oriented occupations are Computers, Engineering & Science (100.0%), Computers & Mathematics (100.0%), and Architecture & Engineering (100.0%), while the most female-oriented occupations are Health Diagnosing & Treating (74.2%), Health Technologists (74.2%), and Education Instruction & Library (65.4%).
| Occupation | Male | Female |
| Management | 56 (61.5%) | 35 (38.5%) |
| Business & Financial | 52 (53.6%) | 45 (46.4%) |
| Computers, Engineering & Science | 42 (100.0%) | 0 (0.0%) |
| Computers & Mathematics | 5 (100.0%) | 0 (0.0%) |
| Architecture & Engineering | 27 (100.0%) | 0 (0.0%) |
| Life, Physical & Social Science | 10 (100.0%) | 0 (0.0%) |
| Community & Social Service | 97 (48.0%) | 105 (52.0%) |
| Education, Arts & Media | 14 (40.0%) | 21 (60.0%) |
| Legal Services & Support | 7 (100.0%) | 0 (0.0%) |
| Education Instruction & Library | 36 (34.6%) | 68 (65.4%) |
| Arts, Media & Entertainment | 40 (71.4%) | 16 (28.6%) |
| Health Diagnosing & Treating | 8 (25.8%) | 23 (74.2%) |
| Health Technologists | 8 (25.8%) | 23 (74.2%) |
| Total (Category) | 255 (55.1%) | 208 (44.9%) |
| Total (Overall) | 545 (58.2%) | 391 (41.8%) |
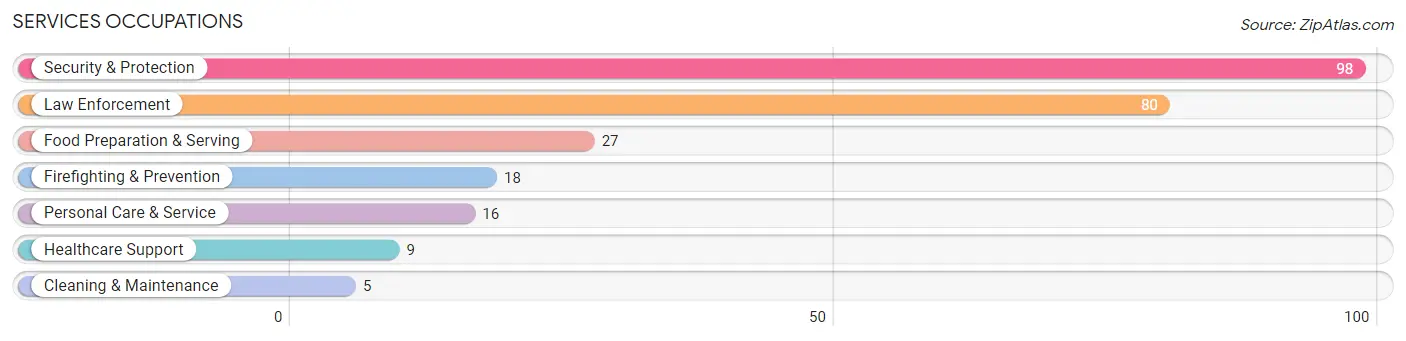
Services Occupations
The most common Services occupations in Bellport are Security & Protection (98 | 10.5%), Law Enforcement (80 | 8.6%), Food Preparation & Serving (27 | 2.9%), Firefighting & Prevention (18 | 1.9%), and Personal Care & Service (16 | 1.7%).
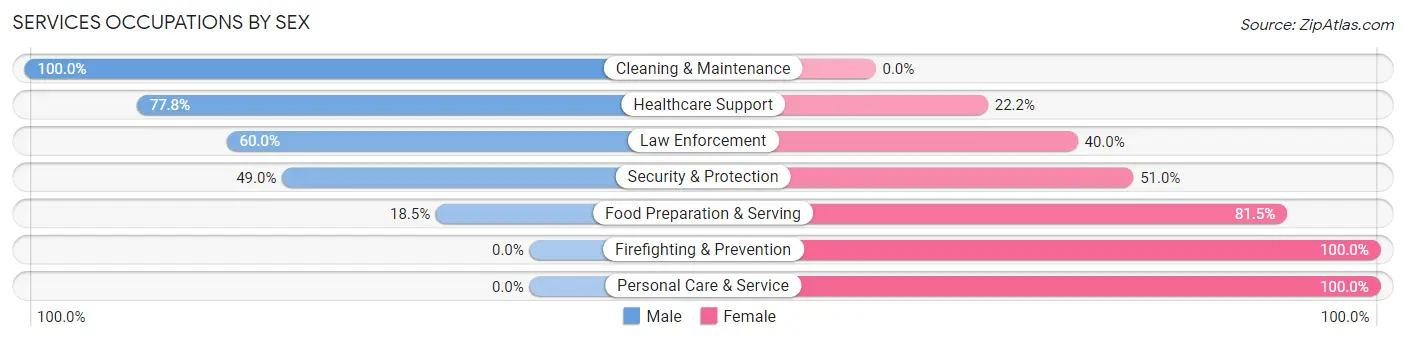
Services Occupations by Sex
Within the Services occupations in Bellport, the most male-oriented occupations are Cleaning & Maintenance (100.0%), Healthcare Support (77.8%), and Law Enforcement (60.0%), while the most female-oriented occupations are Firefighting & Prevention (100.0%), Personal Care & Service (100.0%), and Food Preparation & Serving (81.5%).
| Occupation | Male | Female |
| Healthcare Support | 7 (77.8%) | 2 (22.2%) |
| Security & Protection | 48 (49.0%) | 50 (51.0%) |
| Firefighting & Prevention | 0 (0.0%) | 18 (100.0%) |
| Law Enforcement | 48 (60.0%) | 32 (40.0%) |
| Food Preparation & Serving | 5 (18.5%) | 22 (81.5%) |
| Cleaning & Maintenance | 5 (100.0%) | 0 (0.0%) |
| Personal Care & Service | 0 (0.0%) | 16 (100.0%) |
| Total (Category) | 65 (41.9%) | 90 (58.1%) |
| Total (Overall) | 545 (58.2%) | 391 (41.8%) |
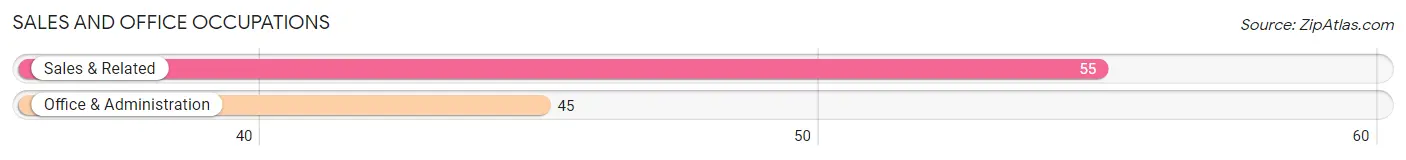
Sales and Office Occupations
The most common Sales and Office occupations in Bellport are Sales & Related (55 | 5.9%), and Office & Administration (45 | 4.8%).
Sales and Office Occupations by Sex

| Occupation | Male | Female |
| Sales & Related | 9 (16.4%) | 46 (83.6%) |
| Office & Administration | 18 (40.0%) | 27 (60.0%) |
| Total (Category) | 27 (27.0%) | 73 (73.0%) |
| Total (Overall) | 545 (58.2%) | 391 (41.8%) |
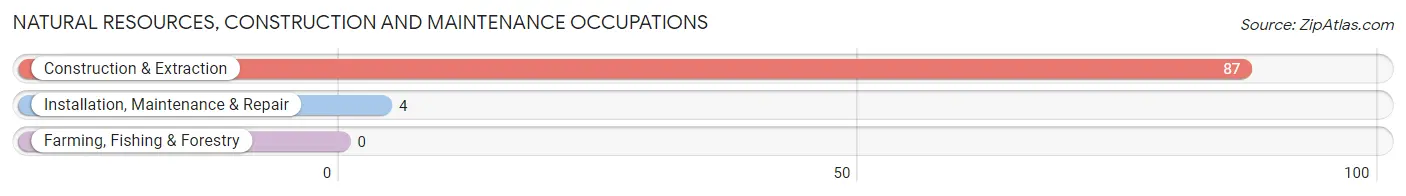
Natural Resources, Construction and Maintenance Occupations
The most common Natural Resources, Construction and Maintenance occupations in Bellport are Construction & Extraction (87 | 9.3%), and Installation, Maintenance & Repair (4 | 0.4%).
Natural Resources, Construction and Maintenance Occupations by Sex
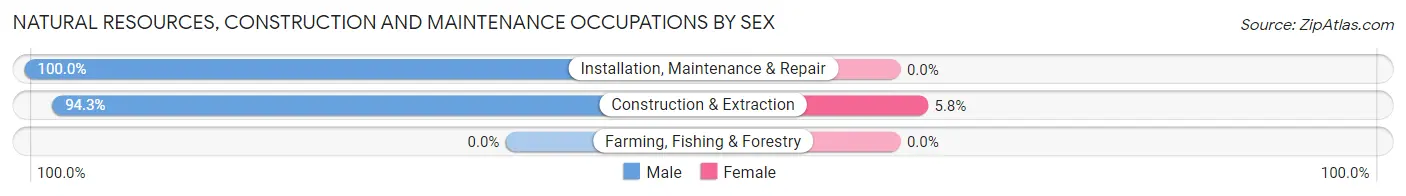
| Occupation | Male | Female |
| Farming, Fishing & Forestry | 0 (0.0%) | 0 (0.0%) |
| Construction & Extraction | 82 (94.3%) | 5 (5.8%) |
| Installation, Maintenance & Repair | 4 (100.0%) | 0 (0.0%) |
| Total (Category) | 86 (94.5%) | 5 (5.5%) |
| Total (Overall) | 545 (58.2%) | 391 (41.8%) |
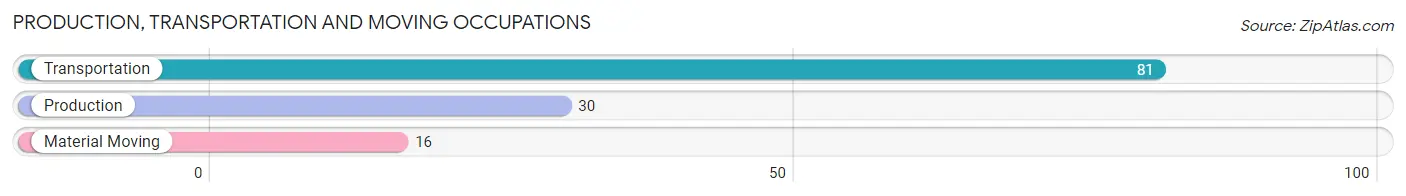
Production, Transportation and Moving Occupations
The most common Production, Transportation and Moving occupations in Bellport are Transportation (81 | 8.6%), Production (30 | 3.2%), and Material Moving (16 | 1.7%).
Production, Transportation and Moving Occupations by Sex
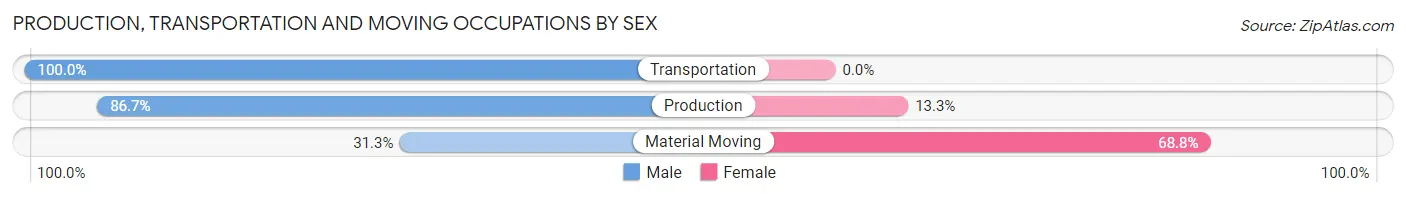
| Occupation | Male | Female |
| Production | 26 (86.7%) | 4 (13.3%) |
| Transportation | 81 (100.0%) | 0 (0.0%) |
| Material Moving | 5 (31.2%) | 11 (68.8%) |
| Total (Category) | 112 (88.2%) | 15 (11.8%) |
| Total (Overall) | 545 (58.2%) | 391 (41.8%) |
Employment Industries by Sex in Bellport
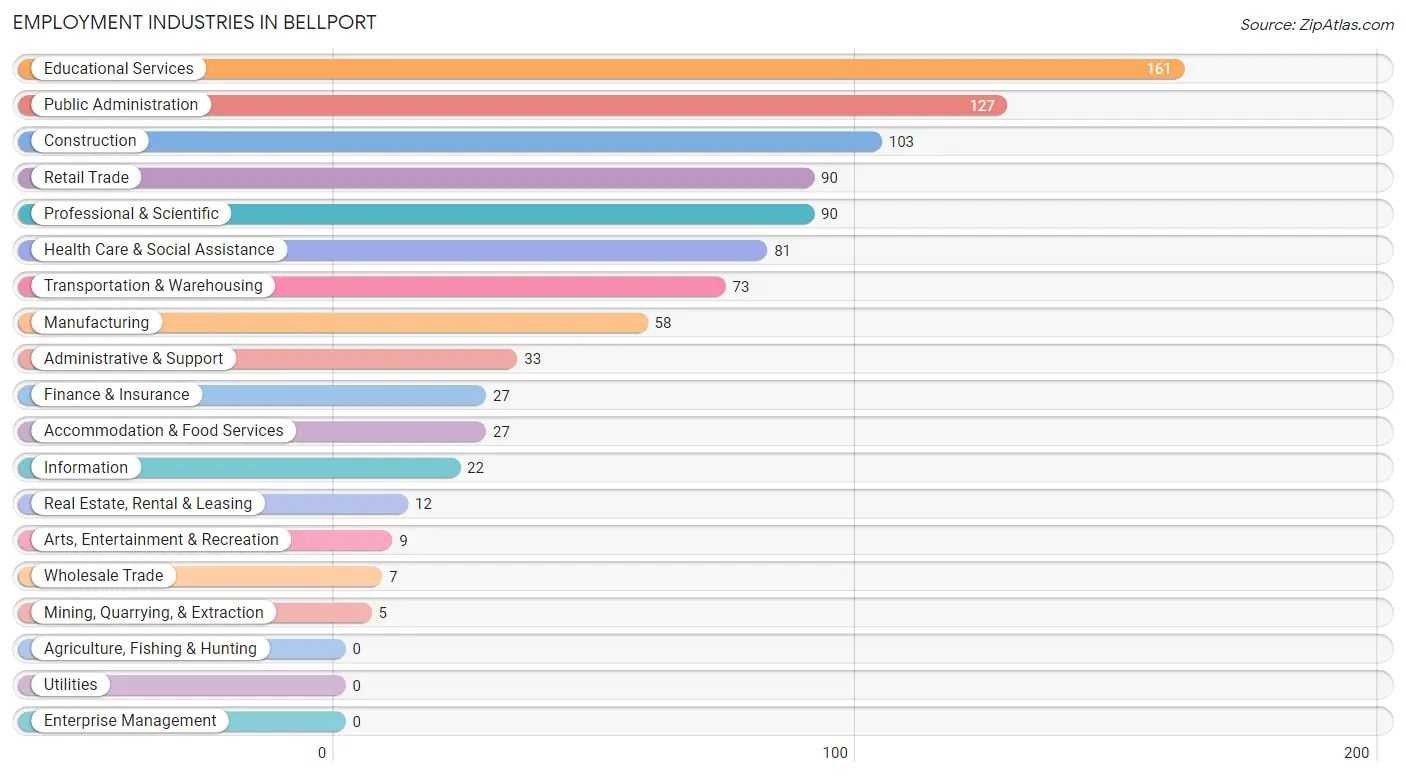
Employment Industries in Bellport
The major employment industries in Bellport include Educational Services (161 | 17.2%), Public Administration (127 | 13.6%), Construction (103 | 11.0%), Retail Trade (90 | 9.6%), and Professional & Scientific (90 | 9.6%).
Employment Industries by Sex in Bellport
The Bellport industries that see more men than women are Construction (100.0%), Transportation & Warehousing (100.0%), and Manufacturing (93.1%), whereas the industries that tend to have a higher number of women are Mining, Quarrying, & Extraction (100.0%), Wholesale Trade (100.0%), and Information (100.0%).
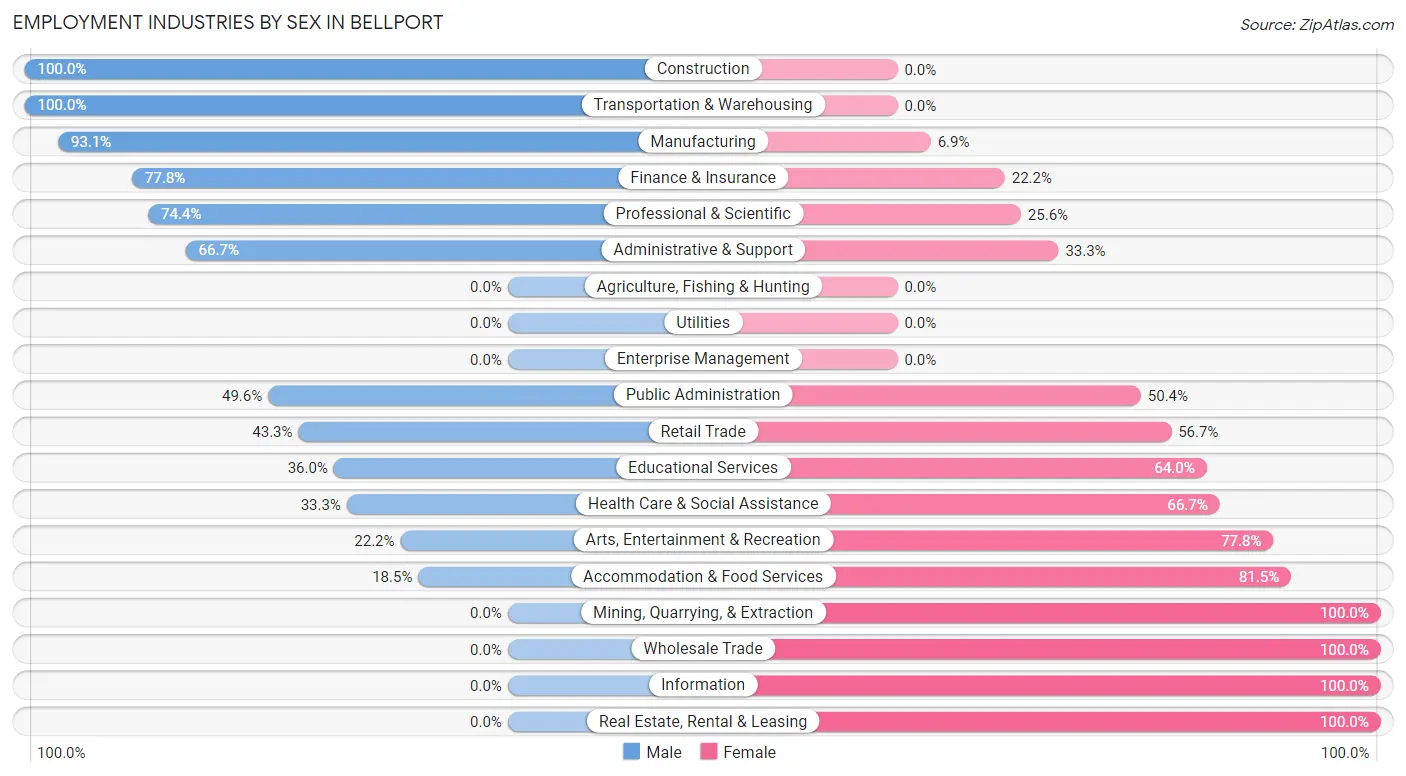
| Industry | Male | Female |
| Agriculture, Fishing & Hunting | 0 (0.0%) | 0 (0.0%) |
| Mining, Quarrying, & Extraction | 0 (0.0%) | 5 (100.0%) |
| Construction | 103 (100.0%) | 0 (0.0%) |
| Manufacturing | 54 (93.1%) | 4 (6.9%) |
| Wholesale Trade | 0 (0.0%) | 7 (100.0%) |
| Retail Trade | 39 (43.3%) | 51 (56.7%) |
| Transportation & Warehousing | 73 (100.0%) | 0 (0.0%) |
| Utilities | 0 (0.0%) | 0 (0.0%) |
| Information | 0 (0.0%) | 22 (100.0%) |
| Finance & Insurance | 21 (77.8%) | 6 (22.2%) |
| Real Estate, Rental & Leasing | 0 (0.0%) | 12 (100.0%) |
| Professional & Scientific | 67 (74.4%) | 23 (25.6%) |
| Enterprise Management | 0 (0.0%) | 0 (0.0%) |
| Administrative & Support | 22 (66.7%) | 11 (33.3%) |
| Educational Services | 58 (36.0%) | 103 (64.0%) |
| Health Care & Social Assistance | 27 (33.3%) | 54 (66.7%) |
| Arts, Entertainment & Recreation | 2 (22.2%) | 7 (77.8%) |
| Accommodation & Food Services | 5 (18.5%) | 22 (81.5%) |
| Public Administration | 63 (49.6%) | 64 (50.4%) |
| Total | 545 (58.2%) | 391 (41.8%) |
Education in Bellport
School Enrollment in Bellport
The most common levels of schooling among the 362 students in Bellport are high school (105 | 29.0%), middle school (91 | 25.1%), and college / undergraduate (78 | 21.5%).
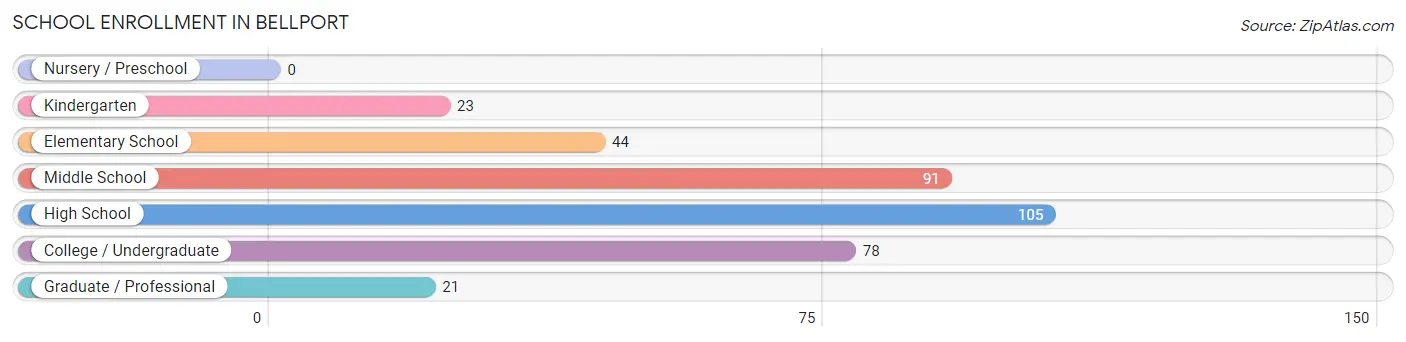
| School Level | # Students | % Students |
| Nursery / Preschool | 0 | 0.0% |
| Kindergarten | 23 | 6.4% |
| Elementary School | 44 | 12.1% |
| Middle School | 91 | 25.1% |
| High School | 105 | 29.0% |
| College / Undergraduate | 78 | 21.5% |
| Graduate / Professional | 21 | 5.8% |
| Total | 362 | 100.0% |
School Enrollment by Age by Funding Source in Bellport
Out of a total of 362 students who are enrolled in schools in Bellport, 93 (25.7%) attend a private institution, while the remaining 269 (74.3%) are enrolled in public schools. The age group of 18 to 19 year olds has the highest likelihood of being enrolled in private schools, with 25 (73.5% in the age bracket) enrolled. Conversely, the age group of 10 to 14 year olds has the lowest likelihood of being enrolled in a private school, with 102 (100.0% in the age bracket) attending a public institution.
| Age Bracket | Public School | Private School |
| 3 to 4 Year Olds | 0 (0.0%) | 0 (0.0%) |
| 5 to 9 Year Old | 23 (37.1%) | 39 (62.9%) |
| 10 to 14 Year Olds | 102 (100.0%) | 0 (0.0%) |
| 15 to 17 Year Olds | 90 (100.0%) | 0 (0.0%) |
| 18 to 19 Year Olds | 9 (26.5%) | 25 (73.5%) |
| 20 to 24 Year Olds | 25 (54.3%) | 21 (45.7%) |
| 25 to 34 Year Olds | 13 (100.0%) | 0 (0.0%) |
| 35 Years and over | 7 (46.7%) | 8 (53.3%) |
| Total | 269 (74.3%) | 93 (25.7%) |
Educational Attainment by Field of Study in Bellport
Education (226 | 22.4%), literature & languages (129 | 12.8%), business (101 | 10.0%), visual & performing arts (87 | 8.6%), and social sciences (69 | 6.9%) are the most common fields of study among 1,007 individuals in Bellport who have obtained a bachelor's degree or higher.
| Field of Study | # Graduates | % Graduates |
| Computers & Mathematics | 33 | 3.3% |
| Bio, Nature & Agricultural | 39 | 3.9% |
| Physical & Health Sciences | 43 | 4.3% |
| Psychology | 39 | 3.9% |
| Social Sciences | 69 | 6.9% |
| Engineering | 21 | 2.1% |
| Multidisciplinary Studies | 17 | 1.7% |
| Science & Technology | 58 | 5.8% |
| Business | 101 | 10.0% |
| Education | 226 | 22.4% |
| Literature & Languages | 129 | 12.8% |
| Liberal Arts & History | 67 | 6.7% |
| Visual & Performing Arts | 87 | 8.6% |
| Communications | 30 | 3.0% |
| Arts & Humanities | 48 | 4.8% |
| Total | 1,007 | 100.0% |
Transportation & Commute in Bellport
Vehicle Availability by Sex in Bellport
The most prevalent vehicle ownership categories in Bellport are males with 2 vehicles (224, accounting for 47.7%) and females with 2 vehicles (185, making up 58.0%).
| Vehicles Available | Male | Female |
| No Vehicle | 8 (1.7%) | 7 (1.8%) |
| 1 Vehicle | 82 (17.4%) | 73 (18.9%) |
| 2 Vehicles | 224 (47.7%) | 185 (47.9%) |
| 3 Vehicles | 123 (26.2%) | 68 (17.6%) |
| 4 Vehicles | 33 (7.0%) | 53 (13.7%) |
| 5 or more Vehicles | 0 (0.0%) | 0 (0.0%) |
| Total | 470 (100.0%) | 386 (100.0%) |
Commute Time in Bellport
The most frequently occuring commute durations in Bellport are 20 to 24 minutes (106 commuters, 15.6%), 30 to 34 minutes (105 commuters, 15.4%), and 10 to 14 minutes (94 commuters, 13.8%).
| Commute Time | # Commuters | % Commuters |
| Less than 5 Minutes | 42 | 6.2% |
| 5 to 9 Minutes | 54 | 7.9% |
| 10 to 14 Minutes | 94 | 13.8% |
| 15 to 19 Minutes | 80 | 11.7% |
| 20 to 24 Minutes | 106 | 15.6% |
| 25 to 29 Minutes | 17 | 2.5% |
| 30 to 34 Minutes | 105 | 15.4% |
| 35 to 39 Minutes | 8 | 1.2% |
| 40 to 44 Minutes | 43 | 6.3% |
| 45 to 59 Minutes | 58 | 8.5% |
| 60 to 89 Minutes | 34 | 5.0% |
| 90 or more Minutes | 40 | 5.9% |
Commute Time by Sex in Bellport
The most common commute times in Bellport are 30 to 34 minutes (62 commuters, 17.7%) for males and 20 to 24 minutes (79 commuters, 23.9%) for females.
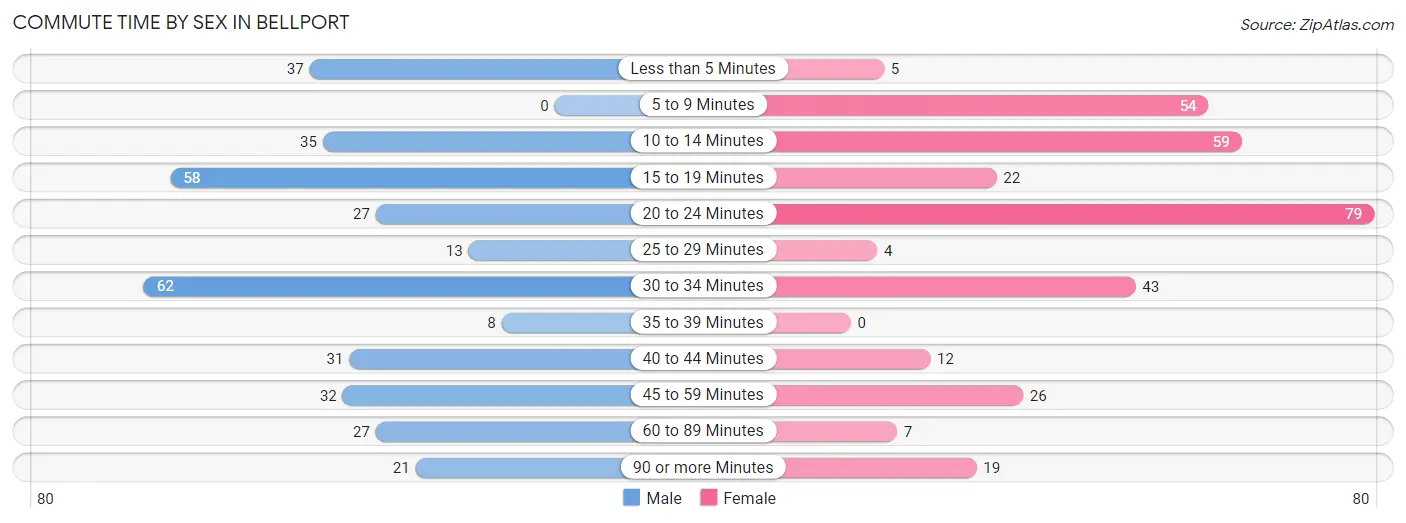
| Commute Time | Male | Female |
| Less than 5 Minutes | 37 (10.5%) | 5 (1.5%) |
| 5 to 9 Minutes | 0 (0.0%) | 54 (16.4%) |
| 10 to 14 Minutes | 35 (10.0%) | 59 (17.9%) |
| 15 to 19 Minutes | 58 (16.5%) | 22 (6.7%) |
| 20 to 24 Minutes | 27 (7.7%) | 79 (23.9%) |
| 25 to 29 Minutes | 13 (3.7%) | 4 (1.2%) |
| 30 to 34 Minutes | 62 (17.7%) | 43 (13.0%) |
| 35 to 39 Minutes | 8 (2.3%) | 0 (0.0%) |
| 40 to 44 Minutes | 31 (8.8%) | 12 (3.6%) |
| 45 to 59 Minutes | 32 (9.1%) | 26 (7.9%) |
| 60 to 89 Minutes | 27 (7.7%) | 7 (2.1%) |
| 90 or more Minutes | 21 (6.0%) | 19 (5.8%) |
Time of Departure to Work by Sex in Bellport
The most frequent times of departure to work in Bellport are 7:00 AM to 7:29 AM (54, 15.4%) for males and 12:00 PM to 3:59 PM (45, 13.6%) for females.
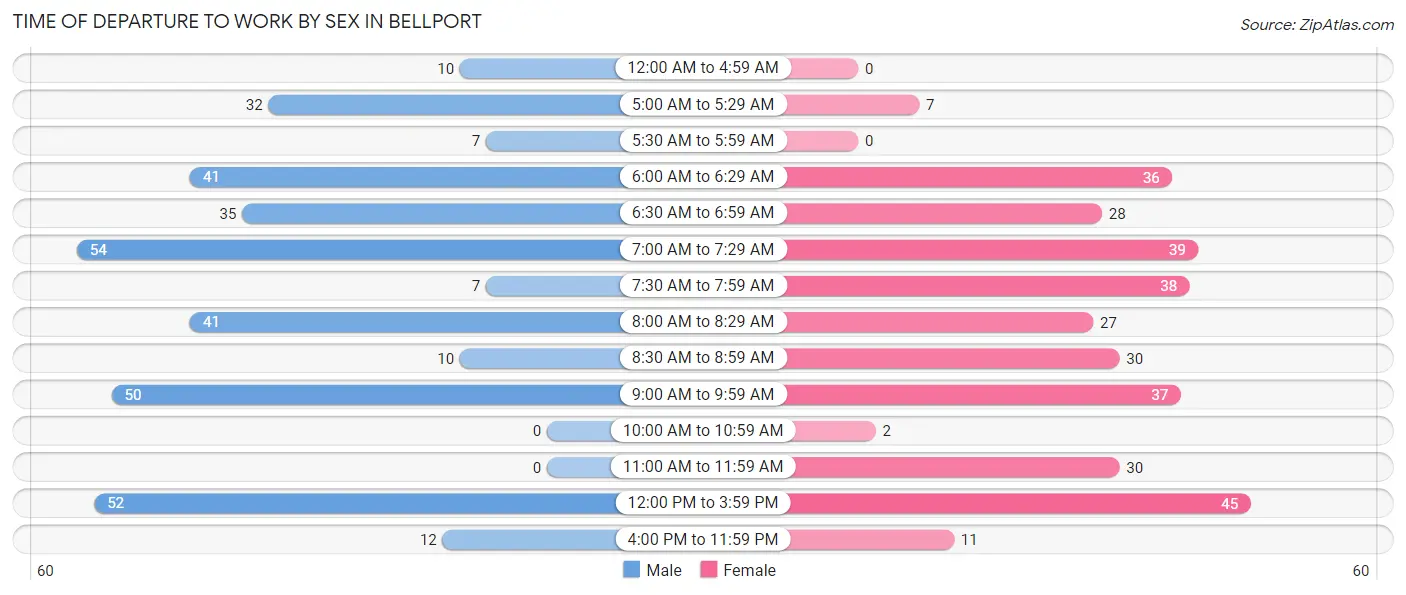
| Time of Departure | Male | Female |
| 12:00 AM to 4:59 AM | 10 (2.9%) | 0 (0.0%) |
| 5:00 AM to 5:29 AM | 32 (9.1%) | 7 (2.1%) |
| 5:30 AM to 5:59 AM | 7 (2.0%) | 0 (0.0%) |
| 6:00 AM to 6:29 AM | 41 (11.7%) | 36 (10.9%) |
| 6:30 AM to 6:59 AM | 35 (10.0%) | 28 (8.5%) |
| 7:00 AM to 7:29 AM | 54 (15.4%) | 39 (11.8%) |
| 7:30 AM to 7:59 AM | 7 (2.0%) | 38 (11.5%) |
| 8:00 AM to 8:29 AM | 41 (11.7%) | 27 (8.2%) |
| 8:30 AM to 8:59 AM | 10 (2.9%) | 30 (9.1%) |
| 9:00 AM to 9:59 AM | 50 (14.2%) | 37 (11.2%) |
| 10:00 AM to 10:59 AM | 0 (0.0%) | 2 (0.6%) |
| 11:00 AM to 11:59 AM | 0 (0.0%) | 30 (9.1%) |
| 12:00 PM to 3:59 PM | 52 (14.8%) | 45 (13.6%) |
| 4:00 PM to 11:59 PM | 12 (3.4%) | 11 (3.3%) |
| Total | 351 (100.0%) | 330 (100.0%) |
Housing Occupancy in Bellport
Occupancy by Ownership in Bellport
Of the total 925 dwellings in Bellport, owner-occupied units account for 822 (88.9%), while renter-occupied units make up 103 (11.1%).
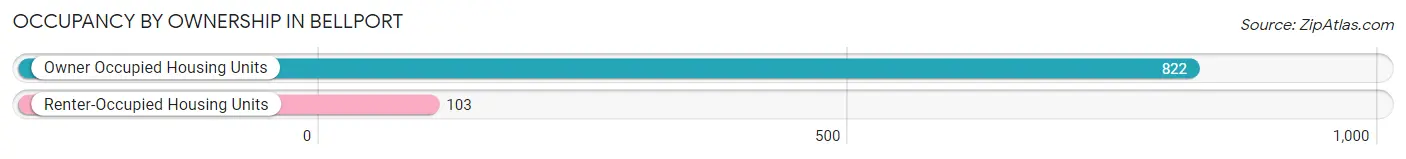
| Occupancy | # Housing Units | % Housing Units |
| Owner Occupied Housing Units | 822 | 88.9% |
| Renter-Occupied Housing Units | 103 | 11.1% |
| Total Occupied Housing Units | 925 | 100.0% |
Occupancy by Household Size in Bellport
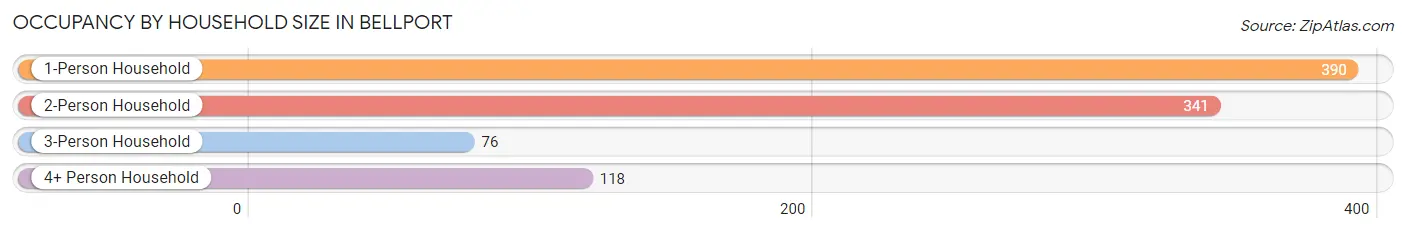
| Household Size | # Housing Units | % Housing Units |
| 1-Person Household | 390 | 42.2% |
| 2-Person Household | 341 | 36.9% |
| 3-Person Household | 76 | 8.2% |
| 4+ Person Household | 118 | 12.8% |
| Total Housing Units | 925 | 100.0% |
Occupancy by Ownership by Household Size in Bellport
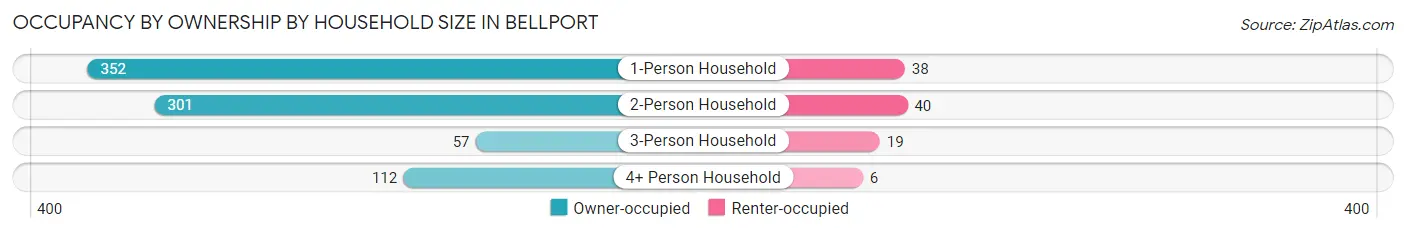
| Household Size | Owner-occupied | Renter-occupied |
| 1-Person Household | 352 (90.3%) | 38 (9.7%) |
| 2-Person Household | 301 (88.3%) | 40 (11.7%) |
| 3-Person Household | 57 (75.0%) | 19 (25.0%) |
| 4+ Person Household | 112 (94.9%) | 6 (5.1%) |
| Total Housing Units | 822 (88.9%) | 103 (11.1%) |
Occupancy by Educational Attainment in Bellport
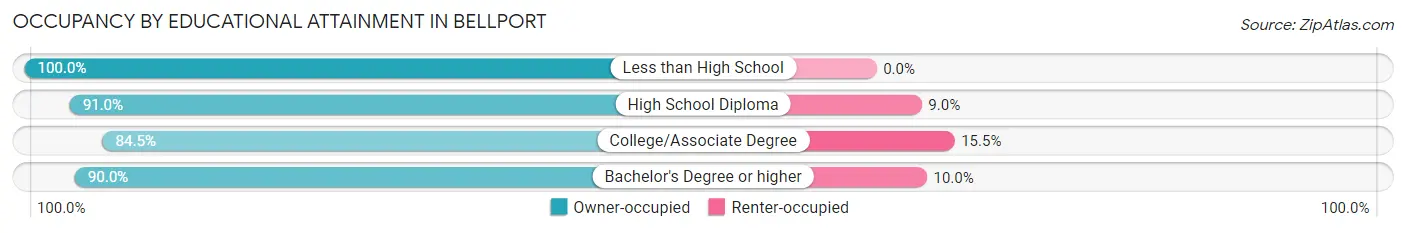
| Household Size | Owner-occupied | Renter-occupied |
| Less than High School | 17 (100.0%) | 0 (0.0%) |
| High School Diploma | 71 (91.0%) | 7 (9.0%) |
| College/Associate Degree | 202 (84.5%) | 37 (15.5%) |
| Bachelor's Degree or higher | 532 (90.0%) | 59 (10.0%) |
Occupancy by Age of Householder in Bellport
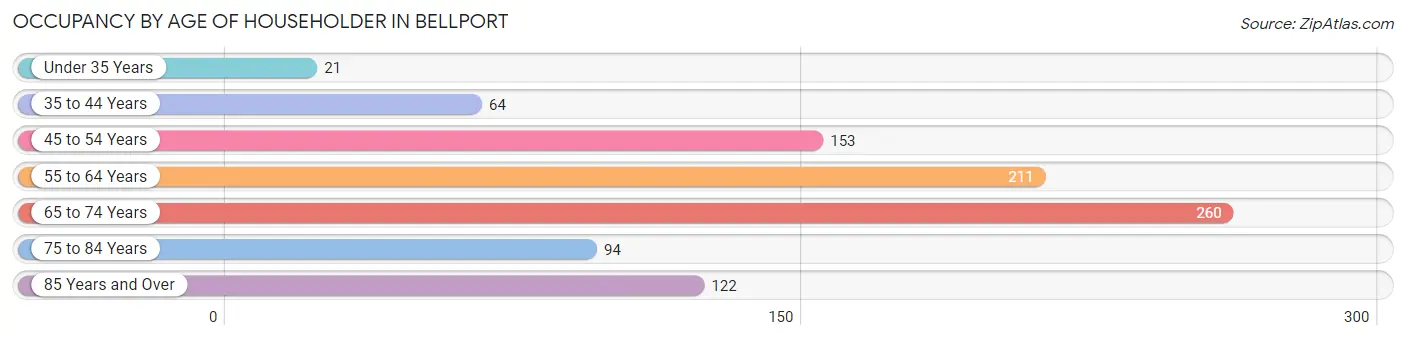
| Age Bracket | # Households | % Households |
| Under 35 Years | 21 | 2.3% |
| 35 to 44 Years | 64 | 6.9% |
| 45 to 54 Years | 153 | 16.5% |
| 55 to 64 Years | 211 | 22.8% |
| 65 to 74 Years | 260 | 28.1% |
| 75 to 84 Years | 94 | 10.2% |
| 85 Years and Over | 122 | 13.2% |
| Total | 925 | 100.0% |
Housing Finances in Bellport
Median Income by Occupancy in Bellport
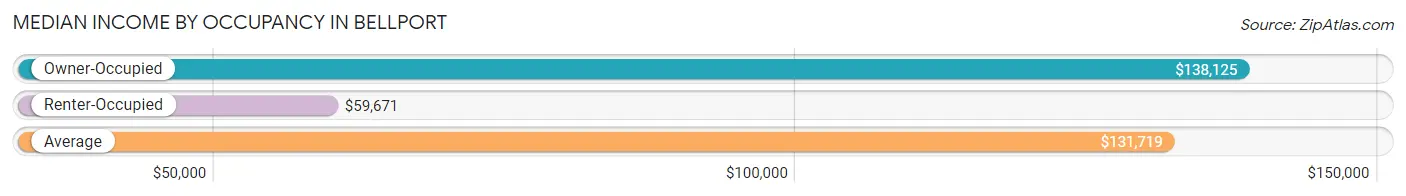
| Occupancy Type | # Households | Median Income |
| Owner-Occupied | 822 (88.9%) | $138,125 |
| Renter-Occupied | 103 (11.1%) | $59,671 |
| Average | 925 (100.0%) | $131,719 |
Occupancy by Householder Income Bracket in Bellport
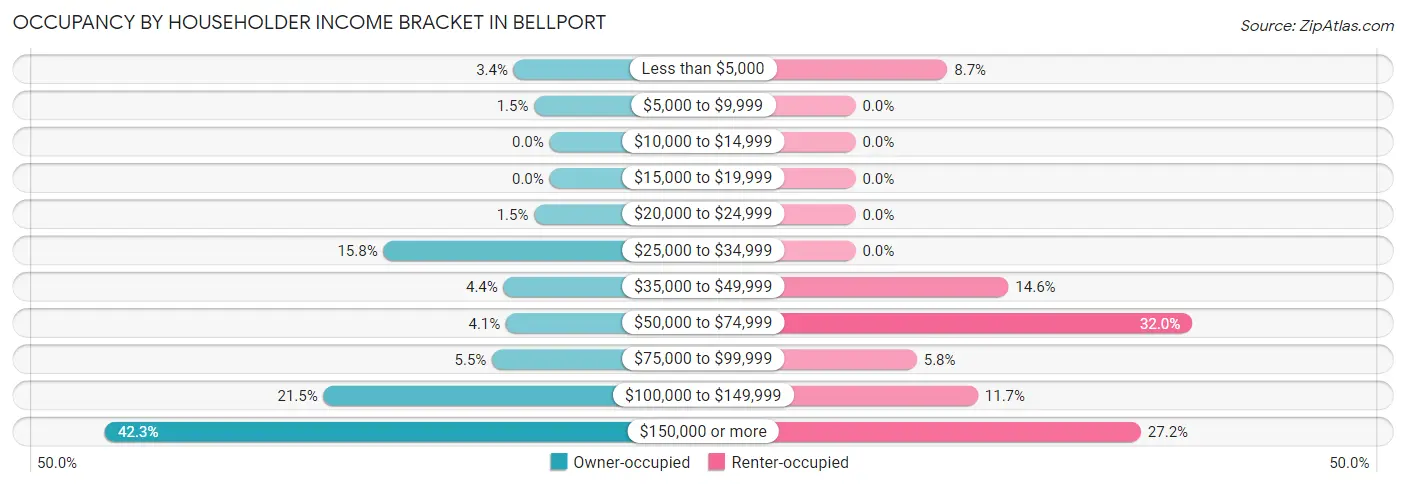
| Income Bracket | Owner-occupied | Renter-occupied |
| Less than $5,000 | 28 (3.4%) | 9 (8.7%) |
| $5,000 to $9,999 | 12 (1.5%) | 0 (0.0%) |
| $10,000 to $14,999 | 0 (0.0%) | 0 (0.0%) |
| $15,000 to $19,999 | 0 (0.0%) | 0 (0.0%) |
| $20,000 to $24,999 | 12 (1.5%) | 0 (0.0%) |
| $25,000 to $34,999 | 130 (15.8%) | 0 (0.0%) |
| $35,000 to $49,999 | 36 (4.4%) | 15 (14.6%) |
| $50,000 to $74,999 | 34 (4.1%) | 33 (32.0%) |
| $75,000 to $99,999 | 45 (5.5%) | 6 (5.8%) |
| $100,000 to $149,999 | 177 (21.5%) | 12 (11.7%) |
| $150,000 or more | 348 (42.3%) | 28 (27.2%) |
| Total | 822 (100.0%) | 103 (100.0%) |
Monthly Housing Cost Tiers in Bellport
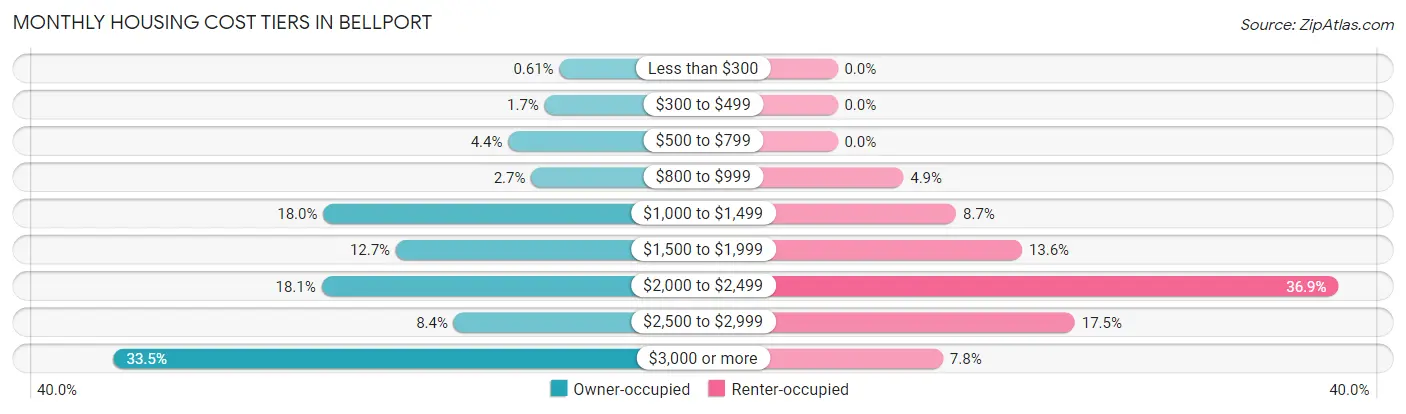
| Monthly Cost | Owner-occupied | Renter-occupied |
| Less than $300 | 5 (0.6%) | 0 (0.0%) |
| $300 to $499 | 14 (1.7%) | 0 (0.0%) |
| $500 to $799 | 36 (4.4%) | 0 (0.0%) |
| $800 to $999 | 22 (2.7%) | 5 (4.9%) |
| $1,000 to $1,499 | 148 (18.0%) | 9 (8.7%) |
| $1,500 to $1,999 | 104 (12.7%) | 14 (13.6%) |
| $2,000 to $2,499 | 149 (18.1%) | 38 (36.9%) |
| $2,500 to $2,999 | 69 (8.4%) | 18 (17.5%) |
| $3,000 or more | 275 (33.5%) | 8 (7.8%) |
| Total | 822 (100.0%) | 103 (100.0%) |
Physical Housing Characteristics in Bellport
Housing Structures in Bellport
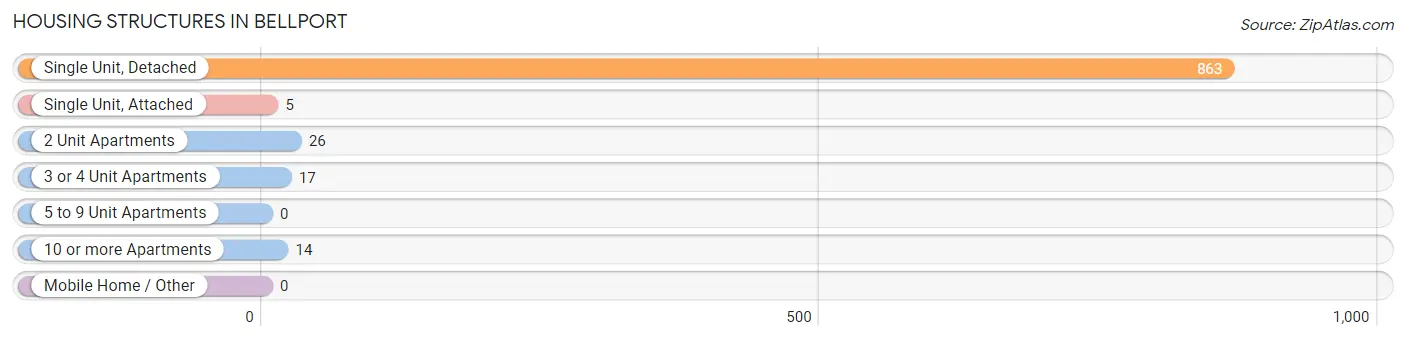
| Structure Type | # Housing Units | % Housing Units |
| Single Unit, Detached | 863 | 93.3% |
| Single Unit, Attached | 5 | 0.5% |
| 2 Unit Apartments | 26 | 2.8% |
| 3 or 4 Unit Apartments | 17 | 1.8% |
| 5 to 9 Unit Apartments | 0 | 0.0% |
| 10 or more Apartments | 14 | 1.5% |
| Mobile Home / Other | 0 | 0.0% |
| Total | 925 | 100.0% |
Housing Structures by Occupancy in Bellport
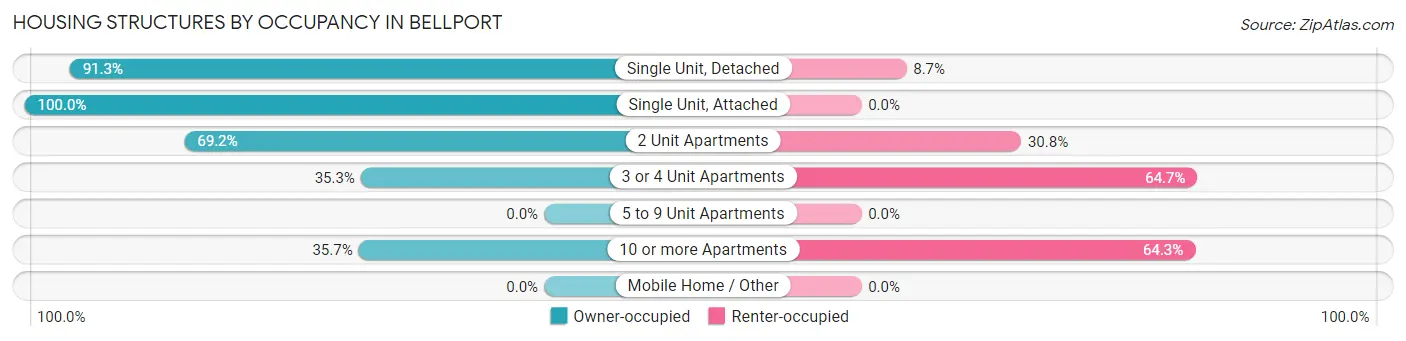
| Structure Type | Owner-occupied | Renter-occupied |
| Single Unit, Detached | 788 (91.3%) | 75 (8.7%) |
| Single Unit, Attached | 5 (100.0%) | 0 (0.0%) |
| 2 Unit Apartments | 18 (69.2%) | 8 (30.8%) |
| 3 or 4 Unit Apartments | 6 (35.3%) | 11 (64.7%) |
| 5 to 9 Unit Apartments | 0 (0.0%) | 0 (0.0%) |
| 10 or more Apartments | 5 (35.7%) | 9 (64.3%) |
| Mobile Home / Other | 0 (0.0%) | 0 (0.0%) |
| Total | 822 (88.9%) | 103 (11.1%) |
Housing Structures by Number of Rooms in Bellport
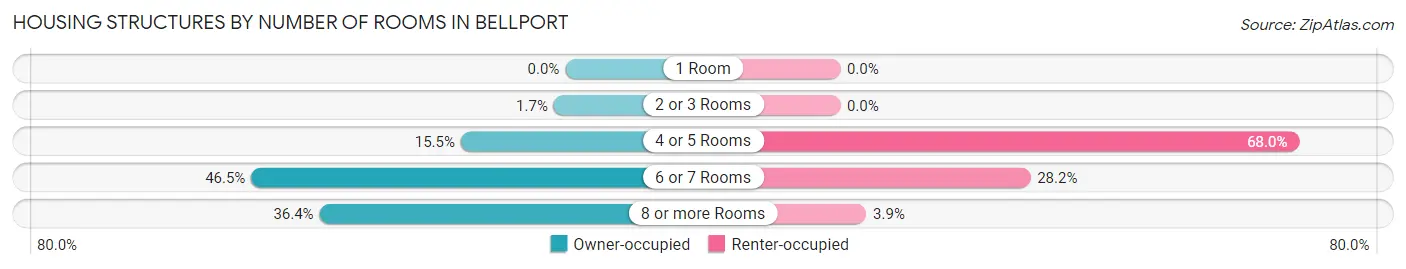
| Number of Rooms | Owner-occupied | Renter-occupied |
| 1 Room | 0 (0.0%) | 0 (0.0%) |
| 2 or 3 Rooms | 14 (1.7%) | 0 (0.0%) |
| 4 or 5 Rooms | 127 (15.4%) | 70 (68.0%) |
| 6 or 7 Rooms | 382 (46.5%) | 29 (28.2%) |
| 8 or more Rooms | 299 (36.4%) | 4 (3.9%) |
| Total | 822 (100.0%) | 103 (100.0%) |
Housing Structure by Heating Type in Bellport
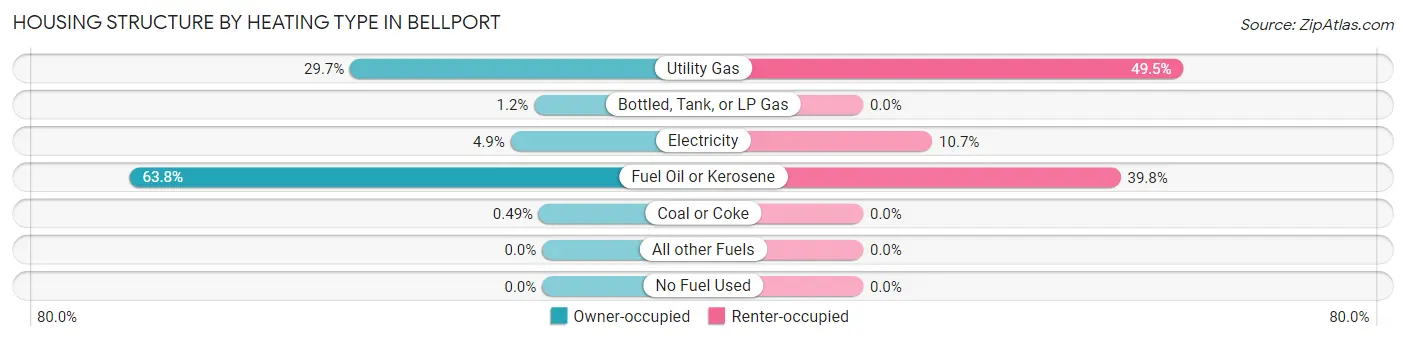
| Heating Type | Owner-occupied | Renter-occupied |
| Utility Gas | 244 (29.7%) | 51 (49.5%) |
| Bottled, Tank, or LP Gas | 10 (1.2%) | 0 (0.0%) |
| Electricity | 40 (4.9%) | 11 (10.7%) |
| Fuel Oil or Kerosene | 524 (63.7%) | 41 (39.8%) |
| Coal or Coke | 4 (0.5%) | 0 (0.0%) |
| All other Fuels | 0 (0.0%) | 0 (0.0%) |
| No Fuel Used | 0 (0.0%) | 0 (0.0%) |
| Total | 822 (100.0%) | 103 (100.0%) |
Household Vehicle Usage in Bellport
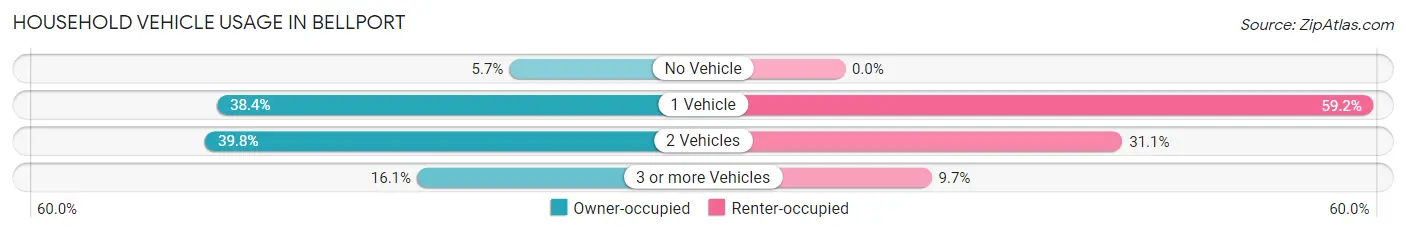
| Vehicles per Household | Owner-occupied | Renter-occupied |
| No Vehicle | 47 (5.7%) | 0 (0.0%) |
| 1 Vehicle | 316 (38.4%) | 61 (59.2%) |
| 2 Vehicles | 327 (39.8%) | 32 (31.1%) |
| 3 or more Vehicles | 132 (16.1%) | 10 (9.7%) |
| Total | 822 (100.0%) | 103 (100.0%) |
Real Estate & Mortgages in Bellport
Real Estate and Mortgage Overview in Bellport
| Characteristic | Without Mortgage | With Mortgage |
| Housing Units | 473 | 349 |
| Median Property Value | $715,800 | $616,300 |
| Median Household Income | $75,750 | $243 |
| Monthly Housing Costs | $1,501 | $221 |
| Real Estate Taxes | $10,001 | $0 |
Property Value by Mortgage Status in Bellport
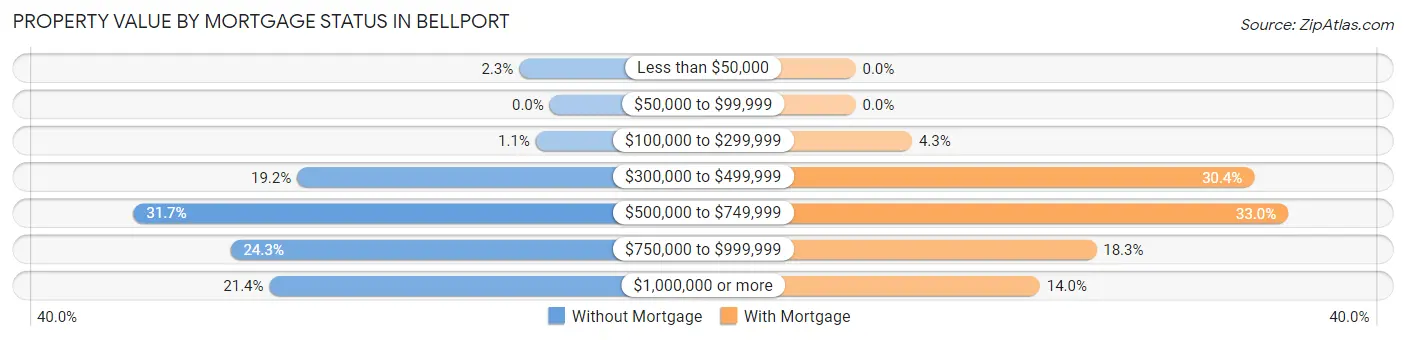
| Property Value | Without Mortgage | With Mortgage |
| Less than $50,000 | 11 (2.3%) | 0 (0.0%) |
| $50,000 to $99,999 | 0 (0.0%) | 0 (0.0%) |
| $100,000 to $299,999 | 5 (1.1%) | 15 (4.3%) |
| $300,000 to $499,999 | 91 (19.2%) | 106 (30.4%) |
| $500,000 to $749,999 | 150 (31.7%) | 115 (33.0%) |
| $750,000 to $999,999 | 115 (24.3%) | 64 (18.3%) |
| $1,000,000 or more | 101 (21.3%) | 49 (14.0%) |
| Total | 473 (100.0%) | 349 (100.0%) |
Household Income by Mortgage Status in Bellport
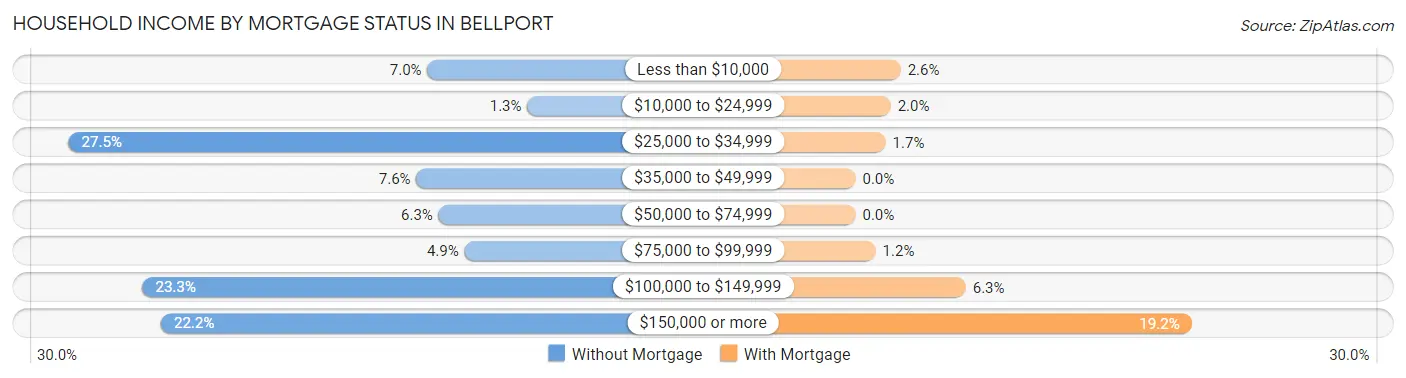
| Household Income | Without Mortgage | With Mortgage |
| Less than $10,000 | 33 (7.0%) | 9 (2.6%) |
| $10,000 to $24,999 | 6 (1.3%) | 7 (2.0%) |
| $25,000 to $34,999 | 130 (27.5%) | 6 (1.7%) |
| $35,000 to $49,999 | 36 (7.6%) | 0 (0.0%) |
| $50,000 to $74,999 | 30 (6.3%) | 0 (0.0%) |
| $75,000 to $99,999 | 23 (4.9%) | 4 (1.1%) |
| $100,000 to $149,999 | 110 (23.3%) | 22 (6.3%) |
| $150,000 or more | 105 (22.2%) | 67 (19.2%) |
| Total | 473 (100.0%) | 349 (100.0%) |
Property Value to Household Income Ratio in Bellport
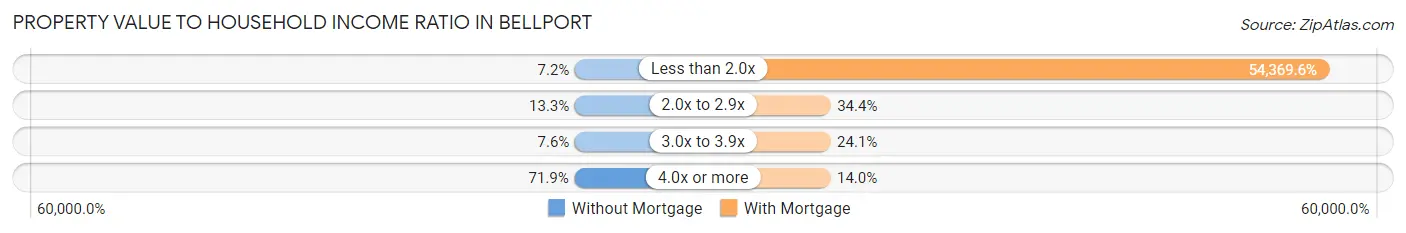
| Value-to-Income Ratio | Without Mortgage | With Mortgage |
| Less than 2.0x | 34 (7.2%) | 189,750 (54,369.6%) |
| 2.0x to 2.9x | 63 (13.3%) | 120 (34.4%) |
| 3.0x to 3.9x | 36 (7.6%) | 84 (24.1%) |
| 4.0x or more | 340 (71.9%) | 49 (14.0%) |
| Total | 473 (100.0%) | 349 (100.0%) |
Real Estate Taxes by Mortgage Status in Bellport
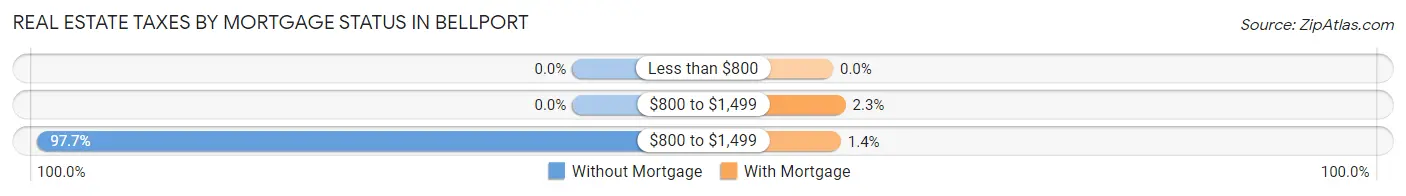
| Property Taxes | Without Mortgage | With Mortgage |
| Less than $800 | 0 (0.0%) | 0 (0.0%) |
| $800 to $1,499 | 0 (0.0%) | 8 (2.3%) |
| $800 to $1,499 | 462 (97.7%) | 5 (1.4%) |
| Total | 473 (100.0%) | 349 (100.0%) |
Health & Disability in Bellport
Health Insurance Coverage by Age in Bellport
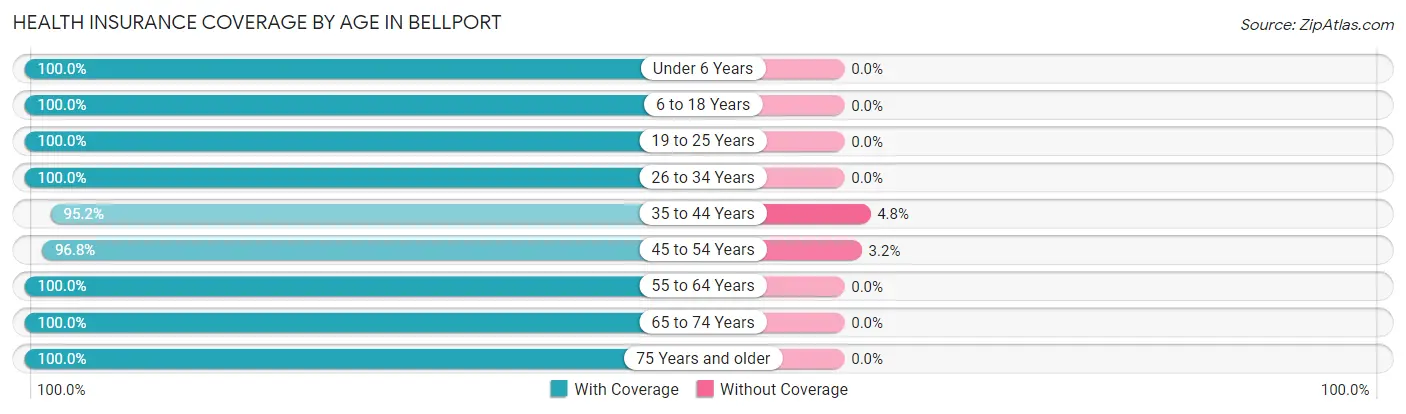
| Age Bracket | With Coverage | Without Coverage |
| Under 6 Years | 22 (100.0%) | 0 (0.0%) |
| 6 to 18 Years | 247 (100.0%) | 0 (0.0%) |
| 19 to 25 Years | 87 (100.0%) | 0 (0.0%) |
| 26 to 34 Years | 98 (100.0%) | 0 (0.0%) |
| 35 to 44 Years | 118 (95.2%) | 6 (4.8%) |
| 45 to 54 Years | 209 (96.8%) | 7 (3.2%) |
| 55 to 64 Years | 404 (100.0%) | 0 (0.0%) |
| 65 to 74 Years | 364 (100.0%) | 0 (0.0%) |
| 75 Years and older | 282 (100.0%) | 0 (0.0%) |
| Total | 1,831 (99.3%) | 13 (0.7%) |
Health Insurance Coverage by Citizenship Status in Bellport
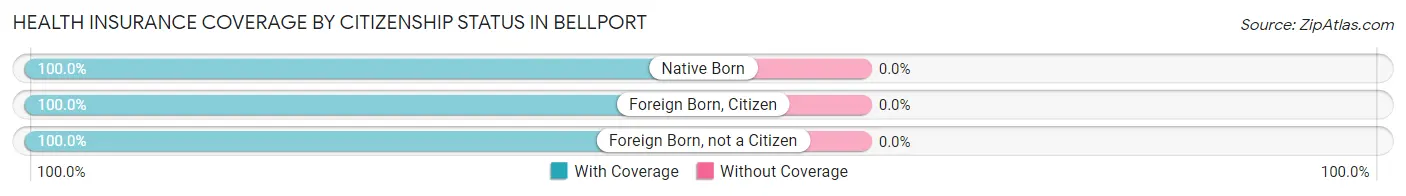
| Citizenship Status | With Coverage | Without Coverage |
| Native Born | 22 (100.0%) | 0 (0.0%) |
| Foreign Born, Citizen | 247 (100.0%) | 0 (0.0%) |
| Foreign Born, not a Citizen | 87 (100.0%) | 0 (0.0%) |
Health Insurance Coverage by Household Income in Bellport
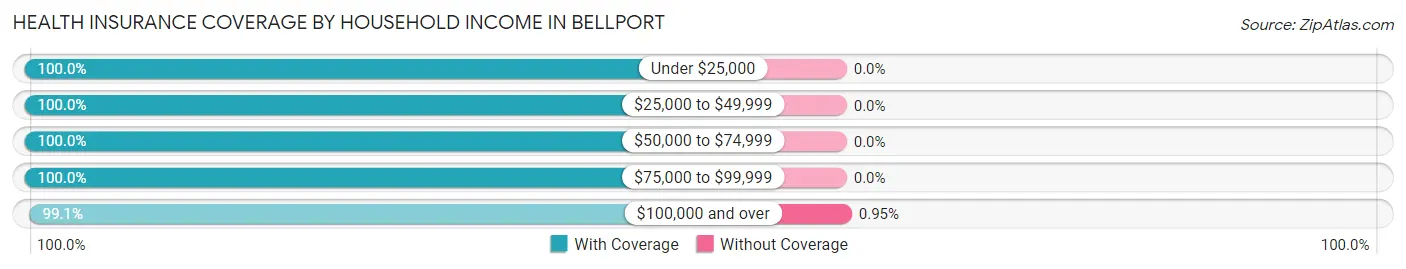
| Household Income | With Coverage | Without Coverage |
| Under $25,000 | 97 (100.0%) | 0 (0.0%) |
| $25,000 to $49,999 | 226 (100.0%) | 0 (0.0%) |
| $50,000 to $74,999 | 76 (100.0%) | 0 (0.0%) |
| $75,000 to $99,999 | 78 (100.0%) | 0 (0.0%) |
| $100,000 and over | 1,349 (99.1%) | 13 (0.9%) |
Public vs Private Health Insurance Coverage by Age in Bellport
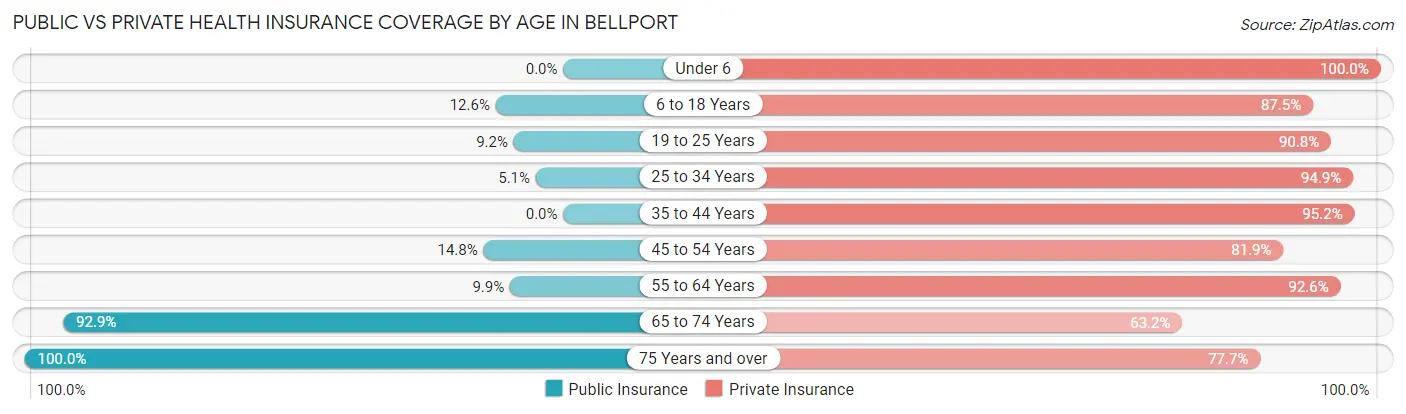
| Age Bracket | Public Insurance | Private Insurance |
| Under 6 | 0 (0.0%) | 22 (100.0%) |
| 6 to 18 Years | 31 (12.6%) | 216 (87.5%) |
| 19 to 25 Years | 8 (9.2%) | 79 (90.8%) |
| 25 to 34 Years | 5 (5.1%) | 93 (94.9%) |
| 35 to 44 Years | 0 (0.0%) | 118 (95.2%) |
| 45 to 54 Years | 32 (14.8%) | 177 (81.9%) |
| 55 to 64 Years | 40 (9.9%) | 374 (92.6%) |
| 65 to 74 Years | 338 (92.9%) | 230 (63.2%) |
| 75 Years and over | 282 (100.0%) | 219 (77.7%) |
| Total | 736 (39.9%) | 1,528 (82.9%) |
Disability Status by Sex by Age in Bellport
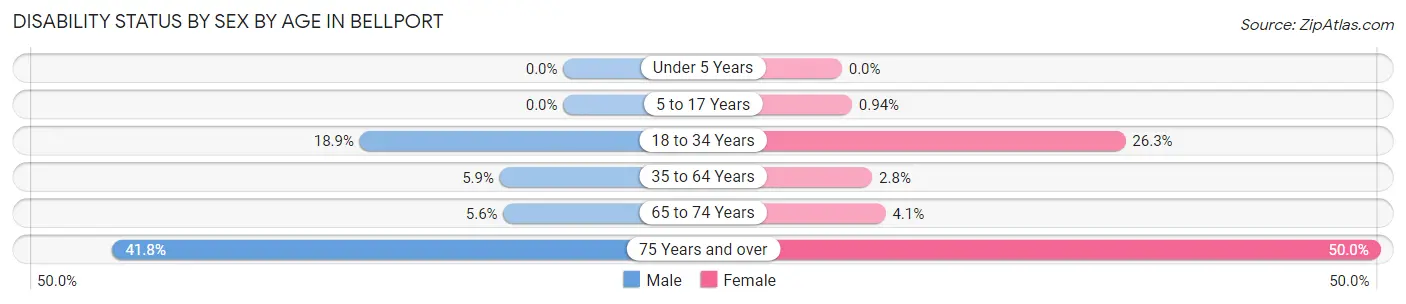
| Age Bracket | Male | Female |
| Under 5 Years | 0 (0.0%) | 0 (0.0%) |
| 5 to 17 Years | 0 (0.0%) | 1 (0.9%) |
| 18 to 34 Years | 17 (18.9%) | 25 (26.3%) |
| 35 to 64 Years | 23 (5.9%) | 10 (2.8%) |
| 65 to 74 Years | 12 (5.6%) | 6 (4.1%) |
| 75 Years and over | 41 (41.8%) | 92 (50.0%) |
Disability Class by Sex by Age in Bellport
Disability Class: Hearing Difficulty
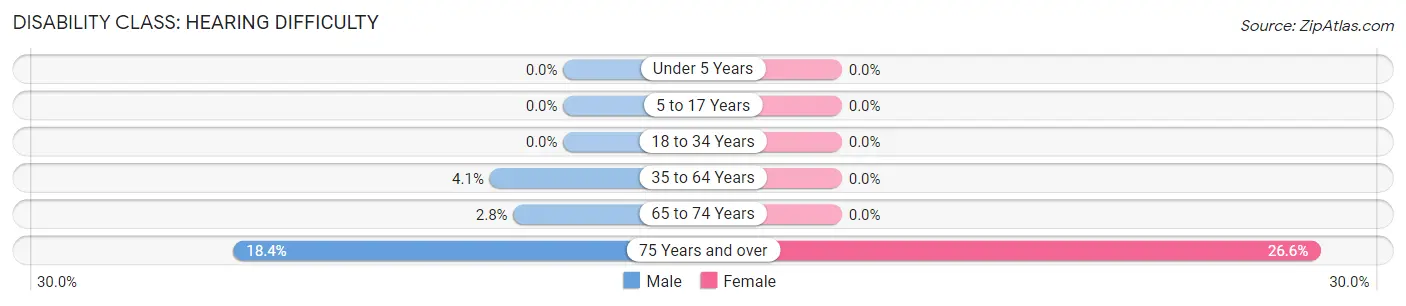
| Age Bracket | Male | Female |
| Under 5 Years | 0 (0.0%) | 0 (0.0%) |
| 5 to 17 Years | 0 (0.0%) | 0 (0.0%) |
| 18 to 34 Years | 0 (0.0%) | 0 (0.0%) |
| 35 to 64 Years | 16 (4.1%) | 0 (0.0%) |
| 65 to 74 Years | 6 (2.8%) | 0 (0.0%) |
| 75 Years and over | 18 (18.4%) | 49 (26.6%) |
Disability Class: Vision Difficulty
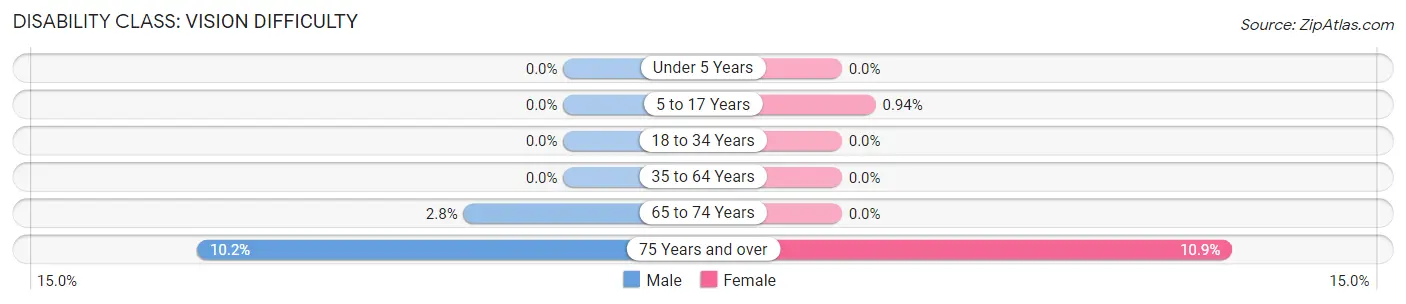
| Age Bracket | Male | Female |
| Under 5 Years | 0 (0.0%) | 0 (0.0%) |
| 5 to 17 Years | 0 (0.0%) | 1 (0.9%) |
| 18 to 34 Years | 0 (0.0%) | 0 (0.0%) |
| 35 to 64 Years | 0 (0.0%) | 0 (0.0%) |
| 65 to 74 Years | 6 (2.8%) | 0 (0.0%) |
| 75 Years and over | 10 (10.2%) | 20 (10.9%) |
Disability Class: Cognitive Difficulty
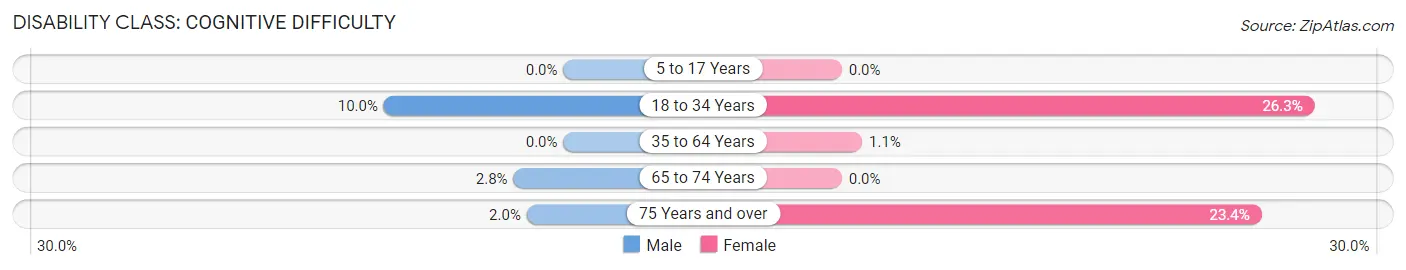
| Age Bracket | Male | Female |
| 5 to 17 Years | 0 (0.0%) | 0 (0.0%) |
| 18 to 34 Years | 9 (10.0%) | 25 (26.3%) |
| 35 to 64 Years | 0 (0.0%) | 4 (1.1%) |
| 65 to 74 Years | 6 (2.8%) | 0 (0.0%) |
| 75 Years and over | 2 (2.0%) | 43 (23.4%) |
Disability Class: Ambulatory Difficulty
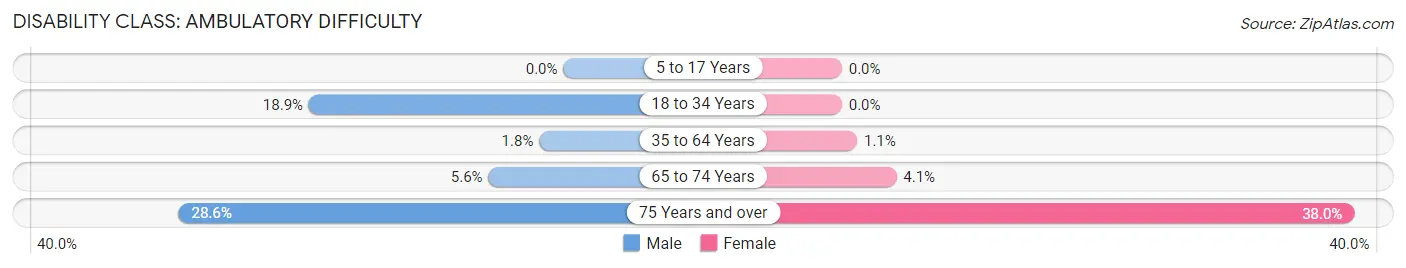
| Age Bracket | Male | Female |
| 5 to 17 Years | 0 (0.0%) | 0 (0.0%) |
| 18 to 34 Years | 17 (18.9%) | 0 (0.0%) |
| 35 to 64 Years | 7 (1.8%) | 4 (1.1%) |
| 65 to 74 Years | 12 (5.6%) | 6 (4.1%) |
| 75 Years and over | 28 (28.6%) | 70 (38.0%) |
Disability Class: Self-Care Difficulty
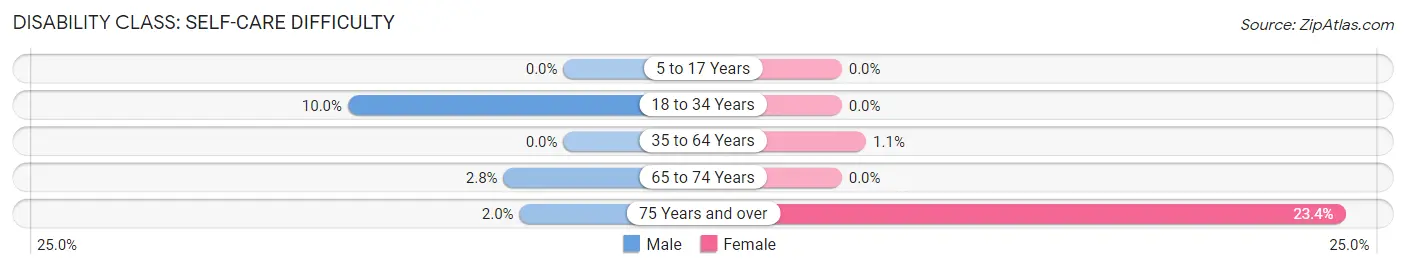
| Age Bracket | Male | Female |
| 5 to 17 Years | 0 (0.0%) | 0 (0.0%) |
| 18 to 34 Years | 9 (10.0%) | 0 (0.0%) |
| 35 to 64 Years | 0 (0.0%) | 4 (1.1%) |
| 65 to 74 Years | 6 (2.8%) | 0 (0.0%) |
| 75 Years and over | 2 (2.0%) | 43 (23.4%) |
Technology Access in Bellport
Computing Device Access in Bellport
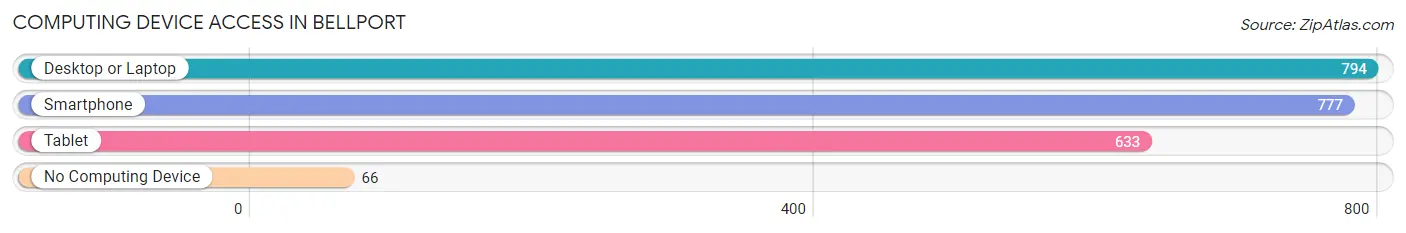
| Device Type | # Households | % Households |
| Desktop or Laptop | 794 | 85.8% |
| Smartphone | 777 | 84.0% |
| Tablet | 633 | 68.4% |
| No Computing Device | 66 | 7.1% |
| Total | 925 | 100.0% |
Internet Access in Bellport
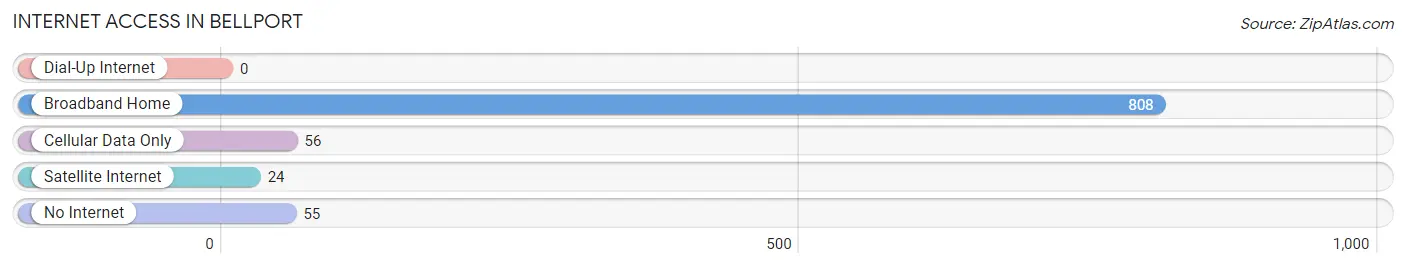
| Internet Type | # Households | % Households |
| Dial-Up Internet | 0 | 0.0% |
| Broadband Home | 808 | 87.4% |
| Cellular Data Only | 56 | 6.0% |
| Satellite Internet | 24 | 2.6% |
| No Internet | 55 | 5.9% |
| Total | 925 | 100.0% |
Bellport Summary
Bellport, NY is a small village located in the Town of Brookhaven in Suffolk County, New York. It is situated on the south shore of Long Island, approximately 60 miles east of New York City. The village is bordered by the Great South Bay to the north, the hamlet of Brookhaven to the east, and the hamlet of East Patchogue to the west. The population of Bellport was 2,084 as of the 2010 census.
History
The area that is now known as Bellport was originally inhabited by the Secatogue Indians, a branch of the Algonquin tribe. The first European settlers arrived in the area in the late 1600s, and the village was officially founded in 1852. The village was named after the Bell family, who were among the first settlers in the area.
The village grew steadily throughout the 19th century, and by the early 20th century, it had become a popular summer resort destination. The village was home to several large hotels, as well as a number of smaller inns and boarding houses. The village also had a thriving commercial fishing industry, and was home to several boatyards.
In the 1950s, the village began to decline as a resort destination, and many of the hotels and inns closed. However, the village experienced a resurgence in the 1970s, when it became a popular destination for artists and writers. Today, Bellport is a popular destination for tourists and vacationers, and is home to a number of art galleries, restaurants, and shops.
Geography
Bellport is located at 40°45'N 73°2'W (40.75, -73.03). The village has a total area of 1.2 square miles, all of which is land. The village is located on the south shore of Long Island, approximately 60 miles east of New York City. It is bordered by the Great South Bay to the north, the hamlet of Brookhaven to the east, and the hamlet of East Patchogue to the west.
The village is located in a temperate climate zone, with hot, humid summers and mild winters. The average temperature in the summer is around 75°F, and the average temperature in the winter is around 40°F. The average annual precipitation is around 45 inches.
Economy
The economy of Bellport is largely based on tourism and retail. The village is home to a number of art galleries, restaurants, and shops, which attract visitors from all over the region. The village also has a thriving commercial fishing industry, and is home to several boatyards.
Demographics
As of the 2010 census, the population of Bellport was 2,084. The racial makeup of the village was 87.3% White, 5.2% African American, 0.7% Native American, 1.2% Asian, 0.1% Pacific Islander, 3.2% from other races, and 2.5% from two or more races. Hispanic or Latino of any race were 8.2% of the population.
The median household income in Bellport was $68,750, and the median family income was $76,250. The per capita income was $31,945. About 5.2% of families and 7.2% of the population were below the poverty line, including 8.3% of those under age 18 and 4.2% of those age 65 or over.
Common Questions
What is Per Capita Income in Bellport?
Per Capita income in Bellport is $92,443.
What is the Median Family Income in Bellport?
Median Family Income in Bellport is $180,625.
What is the Median Household income in Bellport?
Median Household Income in Bellport is $131,719.
What is Income or Wage Gap in Bellport?
Income or Wage Gap in Bellport is 26.4%.
Women in Bellport earn 73.6 cents for every dollar earned by a man.
What is Inequality or Gini Index in Bellport?
Inequality or Gini Index in Bellport is 0.52.
What is the Total Population of Bellport?
Total Population of Bellport is 1,844.
What is the Total Male Population of Bellport?
Total Male Population of Bellport is 957.
What is the Total Female Population of Bellport?
Total Female Population of Bellport is 887.
What is the Ratio of Males per 100 Females in Bellport?
There are 107.89 Males per 100 Females in Bellport.
What is the Ratio of Females per 100 Males in Bellport?
There are 92.69 Females per 100 Males in Bellport.
What is the Median Population Age in Bellport?
Median Population Age in Bellport is 57.1 Years.
What is the Average Family Size in Bellport
Average Family Size in Bellport is 2.7 People.
What is the Average Household Size in Bellport
Average Household Size in Bellport is 2.0 People.
How Large is the Labor Force in Bellport?
There are 966 People in the Labor Forcein in Bellport.
What is the Percentage of People in the Labor Force in Bellport?
59.1% of People are in the Labor Force in Bellport.
What is the Unemployment Rate in Bellport?
Unemployment Rate in Bellport is 3.0%.