Zip Codes with the Highest Percentage of Population Employed in Security & Protection in New York, NY

RELATED REPORTS & OPTIONS

Security & Protection
Population
Families and Households
Female Fertility
Female Fertility (Unmarried)
Race (Community Size)
Race (Percentage)
Ancestry (Community Size)
AfghanAfricanAlbanianAlsatianAmericanApacheArabArgentineanArmenianAssyrian / Chaldean / SyriacAustralianAustrianBahamianBarbadianBasqueBelgianBelizeanBermudanBhutaneseBlackfeetBolivianBrazilianBritishBritish West IndianBulgarianBurmeseCajunCambodianCanadianCape VerdeanCarpatho RusynCelticCentral AmericanCentral American IndianCherokeeChickasawChileanChippewaChoctawColombianCosta RicanCreekCroatianCubanCypriotCzechCzechoslovakianDanishDelawareDominicanDutchDutch West IndianEastern EuropeanEcuadorianEgyptianEnglishEstonianEthiopianEuropeanFilipinoFinnishFrenchFrench American IndianFrench CanadianGermanGhanaianGreekGuamanian / ChamorroGuatemalanGuyaneseHaitianHmongHonduranHungarianIcelanderIndian (Asian)IndonesianIranianIraqiIrishIroquoisIsraeliItalianJamaicanJapaneseJordanianKenyanKoreanLaotianLatvianLebaneseLiberianLithuanianLuxembourgerMacedonianMalaysianMalteseMexicanMexican American IndianMongolianMoroccanNative HawaiianNew ZealanderNicaraguanNigerianNorthern EuropeanNorwegianOkinawanPakistaniPalestinianPanamanianParaguayanPennsylvania GermanPeruvianPolishPortuguesePuebloPuerto RicanRomanianRussianSalvadoranSamoanScandinavianScotch-IrishScottishSenegaleseSerbianSierra LeoneanSiouxSlavicSlovakSloveneSomaliSouth AfricanSouth AmericanSouth American IndianSoviet UnionSpaniardSpanishSpanish AmericanSpanish American IndianSri LankanSubsaharan AfricanSudaneseSwedishSwissSyrianThaiTrinidadian and TobagonianTurkishU.S. Virgin IslanderUgandanUkrainianUruguayanVenezuelanVietnameseWelshWest IndianYugoslavianZimbabwean
Ancestry (Percentage)
AfghanAfricanAlbanianAlsatianAmericanApacheArabArgentineanArmenianAssyrian / Chaldean / SyriacAustralianAustrianBahamianBarbadianBasqueBelgianBelizeanBermudanBhutaneseBlackfeetBolivianBrazilianBritishBritish West IndianBulgarianBurmeseCajunCambodianCanadianCape VerdeanCarpatho RusynCelticCentral AmericanCentral American IndianCherokeeChickasawChileanChippewaChoctawColombianCosta RicanCreekCroatianCubanCypriotCzechCzechoslovakianDanishDelawareDominicanDutchDutch West IndianEastern EuropeanEcuadorianEgyptianEnglishEstonianEthiopianEuropeanFilipinoFinnishFrenchFrench American IndianFrench CanadianGermanGhanaianGreekGuamanian / ChamorroGuatemalanGuyaneseHaitianHmongHonduranHungarianIcelanderIndian (Asian)IndonesianIranianIraqiIrishIroquoisIsraeliItalianJamaicanJapaneseJordanianKenyanKoreanLaotianLatvianLebaneseLiberianLithuanianLuxembourgerMacedonianMalaysianMalteseMexicanMexican American IndianMongolianMoroccanNative HawaiianNew ZealanderNicaraguanNigerianNorthern EuropeanNorwegianOkinawanPakistaniPalestinianPanamanianParaguayanPennsylvania GermanPeruvianPolishPortuguesePuebloPuerto RicanRomanianRussianSalvadoranSamoanScandinavianScotch-IrishScottishSenegaleseSerbianSierra LeoneanSiouxSlavicSlovakSloveneSomaliSouth AfricanSouth AmericanSouth American IndianSoviet UnionSpaniardSpanishSpanish AmericanSpanish American IndianSri LankanSubsaharan AfricanSudaneseSwedishSwissSyrianThaiTrinidadian and TobagonianTurkishU.S. Virgin IslanderUgandanUkrainianUruguayanVenezuelanVietnameseWelshWest IndianYugoslavianZimbabwean
Immigrant Origin (Total)
AfghanistanAfricaAlbaniaArgentinaArmeniaAsiaAustraliaAustriaBahamasBangladeshBarbadosBelarusBelgiumBelizeBoliviaBosnia and HerzegovinaBrazilBulgariaBurma / MyanmarCambodiaCameroonCanadaCaribbeanCentral AmericaChileChinaColombiaCongoCosta RicaCroatiaCubaCzechoslovakiaDenmarkDominicaDominican RepublicEastern AfricaEastern AsiaEastern EuropeEcuadorEgyptEl SalvadorEnglandEritreaEthiopiaEuropeFranceGermanyGhanaGreeceGrenadaGuatemalaGuyanaHaitiHondurasHong KongHungaryIndiaIndonesiaIranIraqIrelandIsraelItalyJamaicaJapanJordanKazakhstanKenyaKoreaKuwaitLatin AmericaLatviaLebanonLiberiaLithuaniaMalaysiaMexicoMiddle AfricaMoldovaMoroccoNepalNetherlandsNicaraguaNigeriaNorth MacedoniaNorthern AfricaNorthern EuropeNorwayOceaniaPakistanPanamaPeruPhilippinesPolandPortugalRomaniaRussiaSaudi ArabiaScotlandSenegalSerbiaSierra LeoneSingaporeSomaliaSouth AfricaSouth AmericaSouth Central AsiaSouth Eastern AsiaSouthern EuropeSpainSri LankaSt. Vincent and the GrenadinesSudanSwedenSwitzerlandSyriaTaiwanThailandTrinidad and TobagoTurkeyUgandaUkraineUruguayUzbekistanVenezuelaVietnamWest IndiesWestern AfricaWestern AsiaWestern EuropeYemenZaireZimbabwe
Immigrant Origin (Percentage)
AfghanistanAfricaAlbaniaArgentinaArmeniaAsiaAustraliaAustriaBahamasBangladeshBarbadosBelarusBelgiumBelizeBoliviaBosnia and HerzegovinaBrazilBulgariaBurma / MyanmarCambodiaCameroonCanadaCaribbeanCentral AmericaChileChinaColombiaCongoCosta RicaCroatiaCubaCzechoslovakiaDenmarkDominicaDominican RepublicEastern AfricaEastern AsiaEastern EuropeEcuadorEgyptEl SalvadorEnglandEritreaEthiopiaEuropeFranceGermanyGhanaGreeceGrenadaGuatemalaGuyanaHaitiHondurasHong KongHungaryIndiaIndonesiaIranIraqIrelandIsraelItalyJamaicaJapanJordanKazakhstanKenyaKoreaKuwaitLatin AmericaLatviaLebanonLiberiaLithuaniaMalaysiaMexicoMiddle AfricaMoldovaMoroccoNepalNetherlandsNicaraguaNigeriaNorth MacedoniaNorthern AfricaNorthern EuropeNorwayOceaniaPakistanPanamaPeruPhilippinesPolandPortugalRomaniaRussiaSaudi ArabiaScotlandSenegalSerbiaSierra LeoneSingaporeSomaliaSouth AfricaSouth AmericaSouth Central AsiaSouth Eastern AsiaSouthern EuropeSpainSri LankaSt. Vincent and the GrenadinesSudanSwedenSwitzerlandSyriaTaiwanThailandTrinidad and TobagoTurkeyUgandaUkraineUruguayUzbekistanVenezuelaVietnamWest IndiesWestern AfricaWestern AsiaWestern EuropeYemenZaireZimbabwe
Income
Income (Families)
Income (Households)
Poverty
Poverty (Families)
Unemployment
Employment Occupations
Employment Industries
Employer Class
Commute Time
Commute Means
School Enrollment
Education by Degree Field
Occupancy
Finances
Physical Characteristics
New York
Compare Zip Codes
Comparison Subject

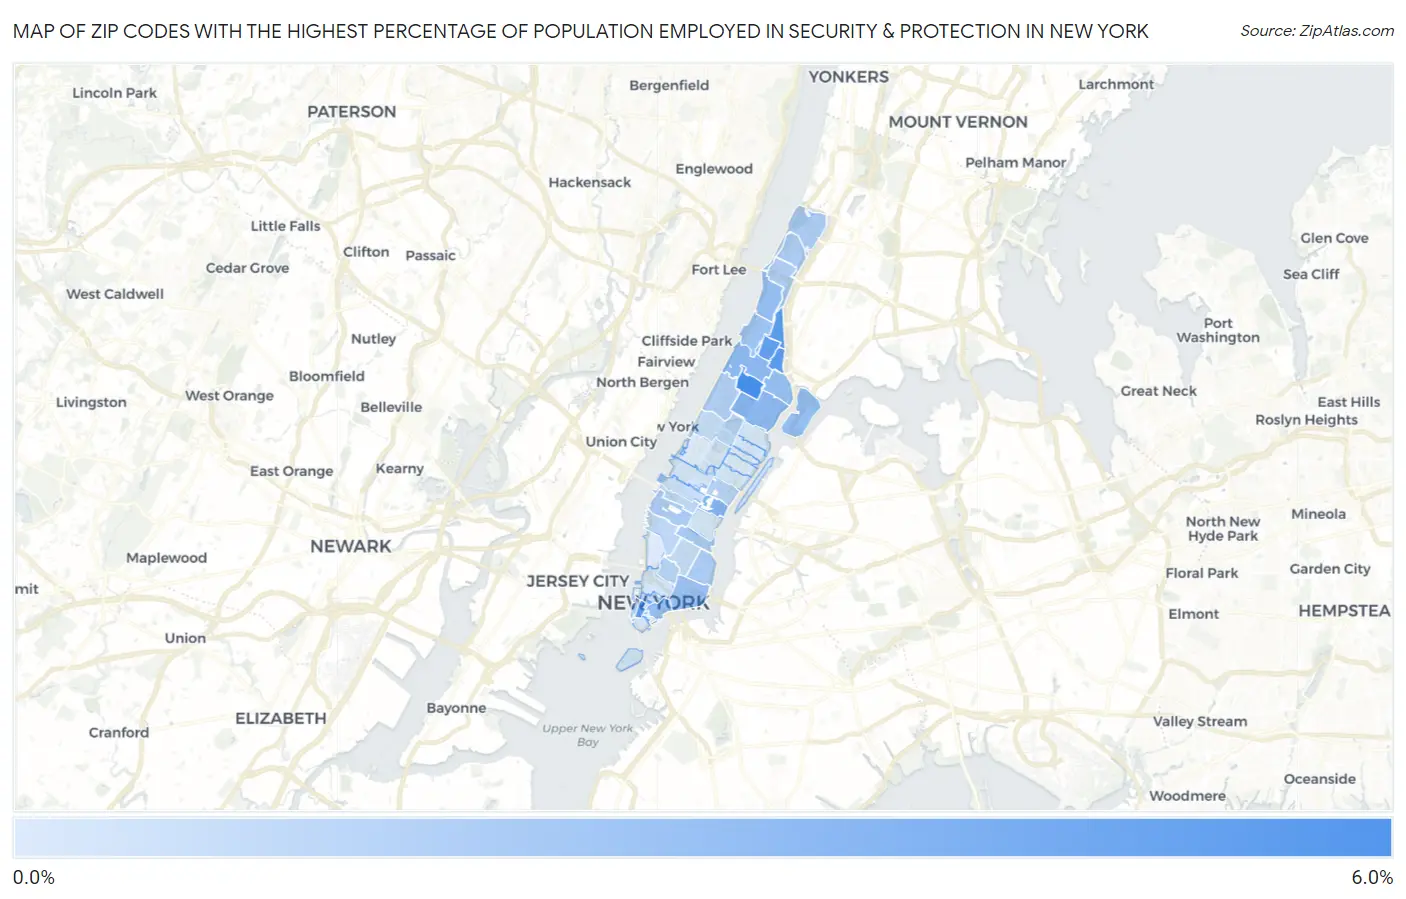
Map of Zip Codes with the Highest Percentage of Population Employed in Security & Protection in New York

0.0%
6.0%
Zip Codes with the Highest Percentage of Population Employed in Security & Protection in New York Map

Zip Codes with the Highest Percentage of Population Employed in Security & Protection in New York, NY

Zip Code % Employed vs State vs National
1.100265.2%2.9%(+2.24)#2372.1%(+3.00)#2,760
2.100374.6%2.9%(+1.69)#3112.1%(+2.45)#3,442
3.100394.6%2.9%(+1.64)#3152.1%(+2.41)#3,518
4.100064.3%2.9%(+1.43)#3562.1%(+2.19)#3,877
5.100304.3%2.9%(+1.40)#3622.1%(+2.16)#3,937
6.100173.2%2.9%(+0.249)#6022.1%(+1.01)#6,661
7.100272.9%2.9%(-0.051)#6812.1%(+0.712)#7,820
8.100292.8%2.9%(-0.070)#6872.1%(+0.693)#7,911
9.100382.6%2.9%(-0.351)#7752.1%(+0.412)#9,201
10.100322.6%2.9%(-0.353)#7782.1%(+0.410)#9,214
11.100352.5%2.9%(-0.418)#8002.1%(+0.345)#9,544
12.100022.3%2.9%(-0.611)#8712.1%(+0.152)#10,645
13.100312.3%2.9%(-0.619)#8742.1%(+0.144)#10,695
14.100101.9%2.9%(-0.970)#9732.1%(-0.207)#12,943
15.100341.8%2.9%(-1.07)#1,0062.1%(-0.309)#13,651
16.100011.8%2.9%(-1.10)#1,0122.1%(-0.335)#13,831
17.100091.8%2.9%(-1.10)#1,0132.1%(-0.337)#13,848
18.100401.8%2.9%(-1.10)#1,0142.1%(-0.340)#13,871
19.100331.7%2.9%(-1.17)#1,0412.1%(-0.405)#14,362
20.100251.7%2.9%(-1.18)#1,0422.1%(-0.417)#14,445
21.102801.6%2.9%(-1.30)#1,0802.1%(-0.540)#15,345
22.100121.5%2.9%(-1.41)#1,1112.1%(-0.648)#16,201
23.100221.5%2.9%(-1.42)#1,1142.1%(-0.654)#16,254
24.100181.3%2.9%(-1.62)#1,1662.1%(-0.860)#17,836
25.100111.2%2.9%(-1.68)#1,1832.1%(-0.922)#18,310
26.100241.1%2.9%(-1.82)#1,2242.1%(-1.05)#19,327
27.100031.1%2.9%(-1.84)#1,2302.1%(-1.07)#19,478
28.100070.98%2.9%(-1.93)#1,2612.1%(-1.17)#20,207
29.100360.90%2.9%(-2.02)#1,2822.1%(-1.25)#20,821
30.100190.64%2.9%(-2.27)#1,3292.1%(-1.51)#22,435
31.100440.62%2.9%(-2.29)#1,3342.1%(-1.53)#22,530
32.100160.56%2.9%(-2.35)#1,3442.1%(-1.59)#22,903
33.100650.54%2.9%(-2.37)#1,3502.1%(-1.61)#23,041
34.101280.53%2.9%(-2.39)#1,3532.1%(-1.62)#23,097
35.100040.51%2.9%(-2.40)#1,3572.1%(-1.64)#23,168
36.100280.48%2.9%(-2.43)#1,3652.1%(-1.67)#23,320
37.100130.44%2.9%(-2.47)#1,3712.1%(-1.71)#23,541
38.100750.43%2.9%(-2.48)#1,3722.1%(-1.72)#23,597
39.100210.38%2.9%(-2.53)#1,3812.1%(-1.77)#23,829
40.100140.29%2.9%(-2.62)#1,3902.1%(-1.86)#24,221
41.100230.25%2.9%(-2.66)#1,3982.1%(-1.89)#24,344

Common Questions

What are the Top 10 Zip Codes with the Highest Percentage of Population Employed in Security & Protection in New York, NY?
Top 10 Zip Codes with the Highest Percentage of Population Employed in Security & Protection in New York, NY are:
#1
5.2%
#2
4.6%
#3
4.6%
#4
4.3%
#5
4.3%
#6
3.2%
#7
2.9%
#8
2.8%
#9
2.6%
#10
2.6%
What zip code has the Highest Percentage of Population Employed in Security & Protection in New York, NY?
10026 has the Highest Percentage of Population Employed in Security & Protection in New York, NY with 5.2%.
What is the Percentage of Population Employed in Security & Protection in New York, NY?
Percentage of Population Employed in Security & Protection in New York is 2.9%.
What is the Percentage of Population Employed in Security & Protection in New York?
Percentage of Population Employed in Security & Protection in New York is 2.9%.
What is the Percentage of Population Employed in Security & Protection in the United States?
Percentage of Population Employed in Security & Protection in the United States is 2.1%.