Wampsville, NY Map & Demographics
Wampsville Map
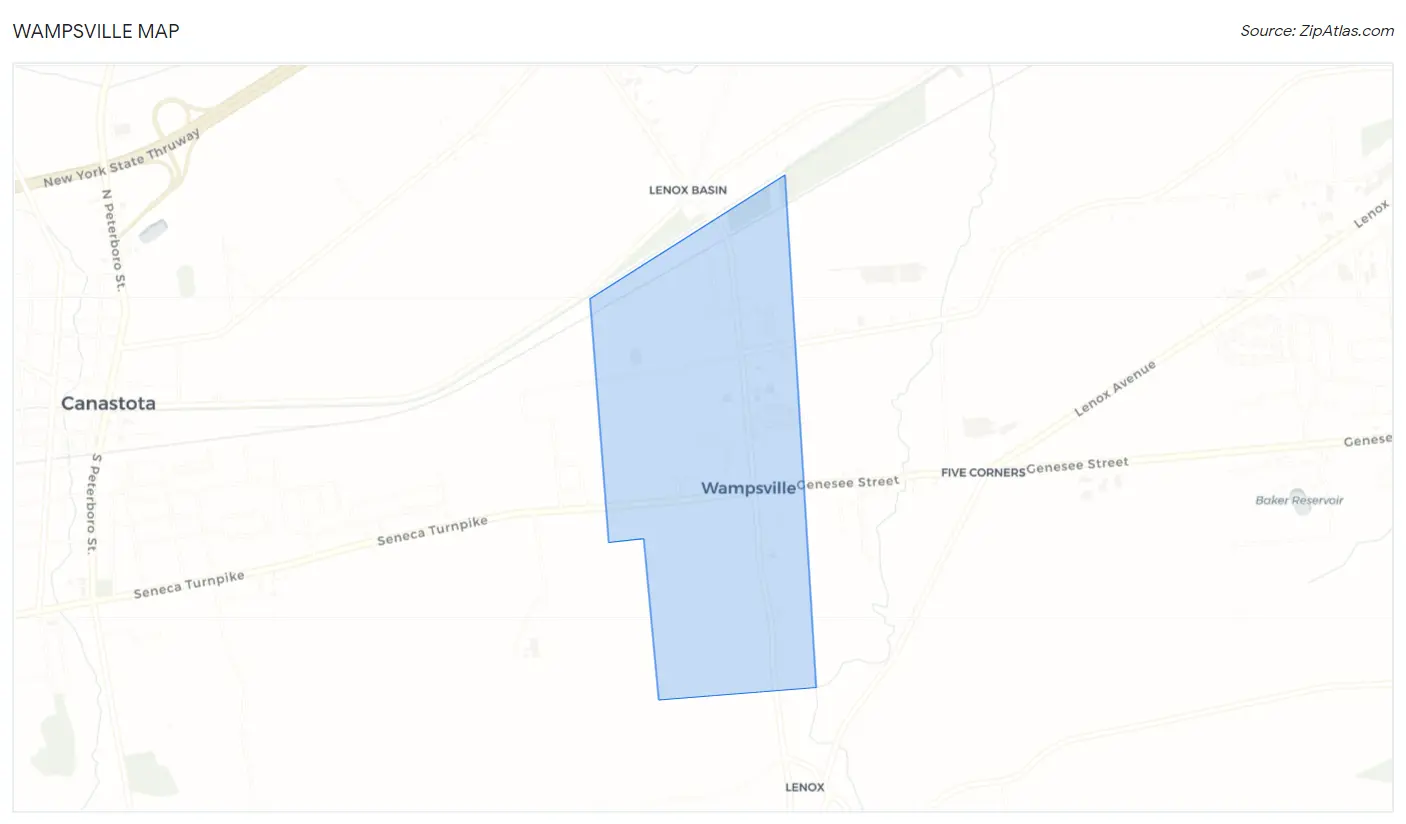
Wampsville Overview
$27,127
PER CAPITA INCOME
$90,500
AVG FAMILY INCOME
$67,188
AVG HOUSEHOLD INCOME
27.0%
WAGE / INCOME GAP [ % ]
73.0¢/ $1
WAGE / INCOME GAP [ $ ]
0.35
INEQUALITY / GINI INDEX
590
TOTAL POPULATION
273
MALE POPULATION
317
FEMALE POPULATION
86.12
MALES / 100 FEMALES
116.12
FEMALES / 100 MALES
48.1
MEDIAN AGE
3.2
AVG FAMILY SIZE
2.7
AVG HOUSEHOLD SIZE
261
LABOR FORCE [ PEOPLE ]
50.7%
PERCENT IN LABOR FORCE
3.8%
UNEMPLOYMENT RATE
Wampsville Zip Codes
Wampsville Area Codes
Income in Wampsville
Income Overview in Wampsville
Per Capita Income in Wampsville is $27,127, while median incomes of families and households are $90,500 and $67,188 respectively.
| Characteristic | Number | Measure |
| Per Capita Income | 590 | $27,127 |
| Median Family Income | 142 | $90,500 |
| Mean Family Income | 142 | $88,994 |
| Median Household Income | 190 | $67,188 |
| Mean Household Income | 190 | $76,183 |
| Income Deficit | 142 | $0 |
| Wage / Income Gap (%) | 590 | 26.96% |
| Wage / Income Gap ($) | 590 | 73.04¢ per $1 |
| Gini / Inequality Index | 590 | 0.35 |
Earnings by Sex in Wampsville
Average Earnings in Wampsville are $36,058, $33,000 for men and $45,179 for women, a difference of 27.0%.
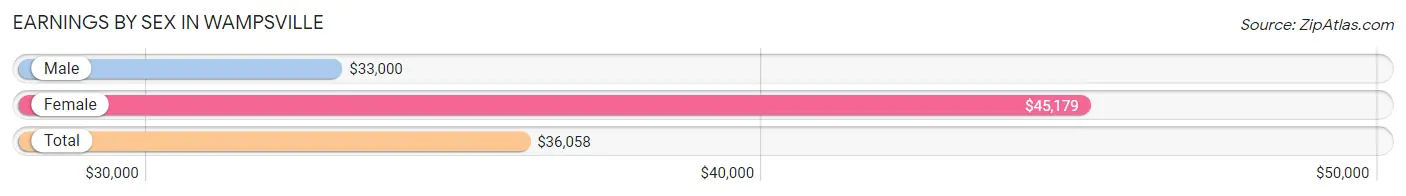
| Sex | Number | Average Earnings |
| Male | 138 (49.1%) | $33,000 |
| Female | 143 (50.9%) | $45,179 |
| Total | 281 (100.0%) | $36,058 |
Earnings by Sex by Income Bracket in Wampsville
The most common earnings brackets in Wampsville are $75,000 to $99,999 for men (24 | 17.4%) and $75,000 to $99,999 for women (21 | 14.7%).
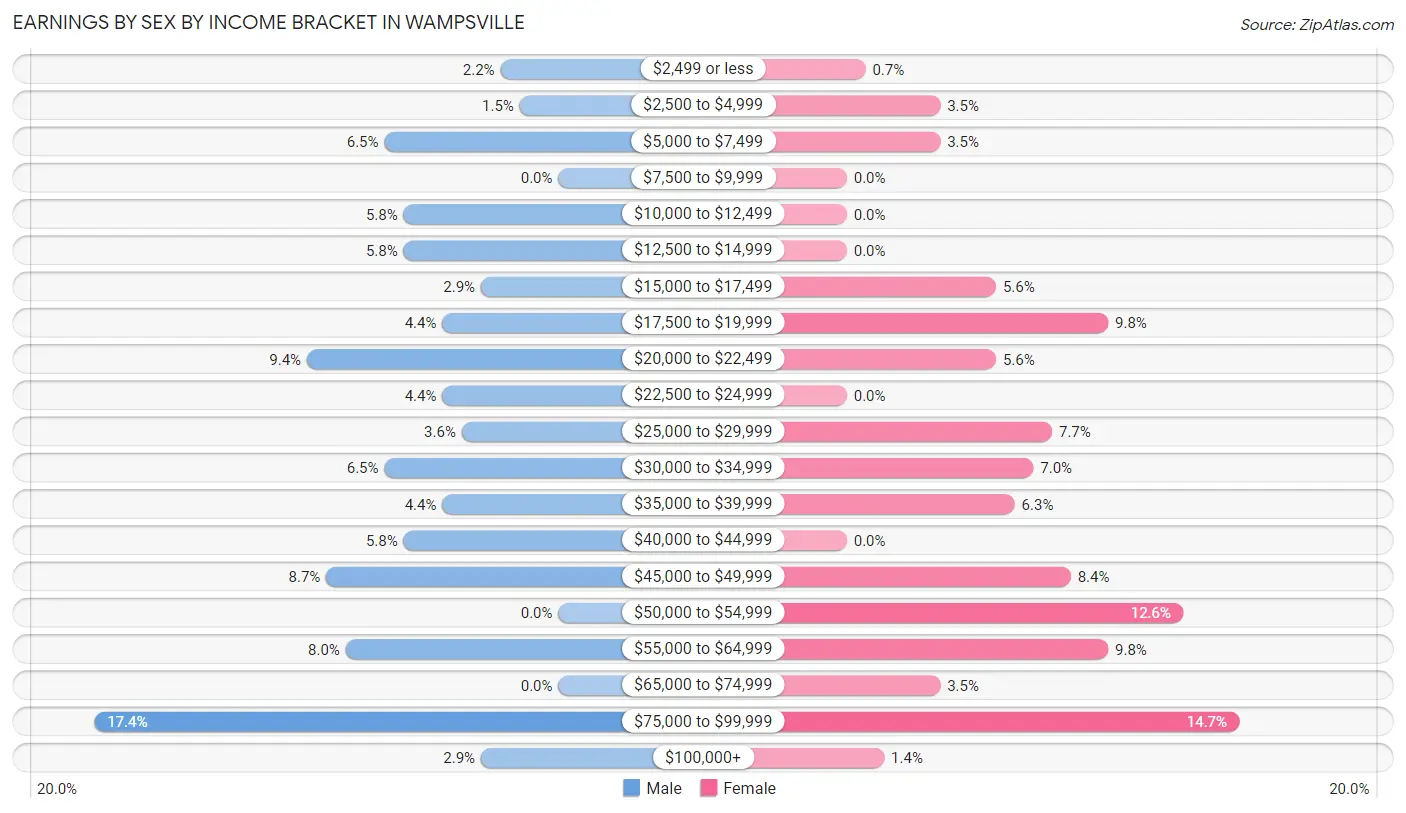
| Income | Male | Female |
| $2,499 or less | 3 (2.2%) | 1 (0.7%) |
| $2,500 to $4,999 | 2 (1.5%) | 5 (3.5%) |
| $5,000 to $7,499 | 9 (6.5%) | 5 (3.5%) |
| $7,500 to $9,999 | 0 (0.0%) | 0 (0.0%) |
| $10,000 to $12,499 | 8 (5.8%) | 0 (0.0%) |
| $12,500 to $14,999 | 8 (5.8%) | 0 (0.0%) |
| $15,000 to $17,499 | 4 (2.9%) | 8 (5.6%) |
| $17,500 to $19,999 | 6 (4.3%) | 14 (9.8%) |
| $20,000 to $22,499 | 13 (9.4%) | 8 (5.6%) |
| $22,500 to $24,999 | 6 (4.3%) | 0 (0.0%) |
| $25,000 to $29,999 | 5 (3.6%) | 11 (7.7%) |
| $30,000 to $34,999 | 9 (6.5%) | 10 (7.0%) |
| $35,000 to $39,999 | 6 (4.3%) | 9 (6.3%) |
| $40,000 to $44,999 | 8 (5.8%) | 0 (0.0%) |
| $45,000 to $49,999 | 12 (8.7%) | 12 (8.4%) |
| $50,000 to $54,999 | 0 (0.0%) | 18 (12.6%) |
| $55,000 to $64,999 | 11 (8.0%) | 14 (9.8%) |
| $65,000 to $74,999 | 0 (0.0%) | 5 (3.5%) |
| $75,000 to $99,999 | 24 (17.4%) | 21 (14.7%) |
| $100,000+ | 4 (2.9%) | 2 (1.4%) |
| Total | 138 (100.0%) | 143 (100.0%) |
Earnings by Sex by Educational Attainment in Wampsville
Average earnings in Wampsville are $38,125 for men and $50,234 for women, a difference of 24.1%. Men with an educational attainment of college or associate's degree enjoy the highest average annual earnings of $56,250, while those with bachelor's degree education earn the least with $19,167. Women with an educational attainment of graduate degree earn the most with the average annual earnings of $81,250, while those with high school diploma education have the smallest earnings of $19,659.
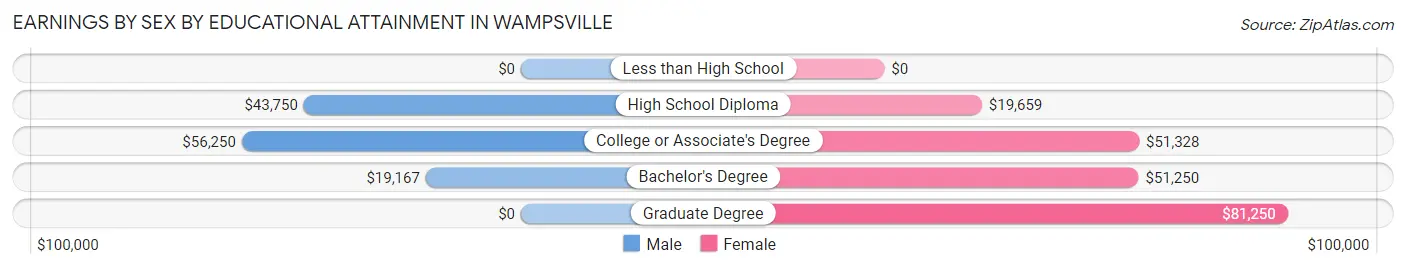
| Educational Attainment | Male Income | Female Income |
| Less than High School | - | - |
| High School Diploma | $43,750 | $19,659 |
| College or Associate's Degree | $56,250 | $51,328 |
| Bachelor's Degree | $19,167 | $51,250 |
| Graduate Degree | - | - |
| Total | $38,125 | $50,234 |
Family Income in Wampsville
Family Income Brackets in Wampsville
According to the Wampsville family income data, there are 42 families falling into the $100,000 to $149,999 income range, which is the most common income bracket and makes up 29.6% of all families.
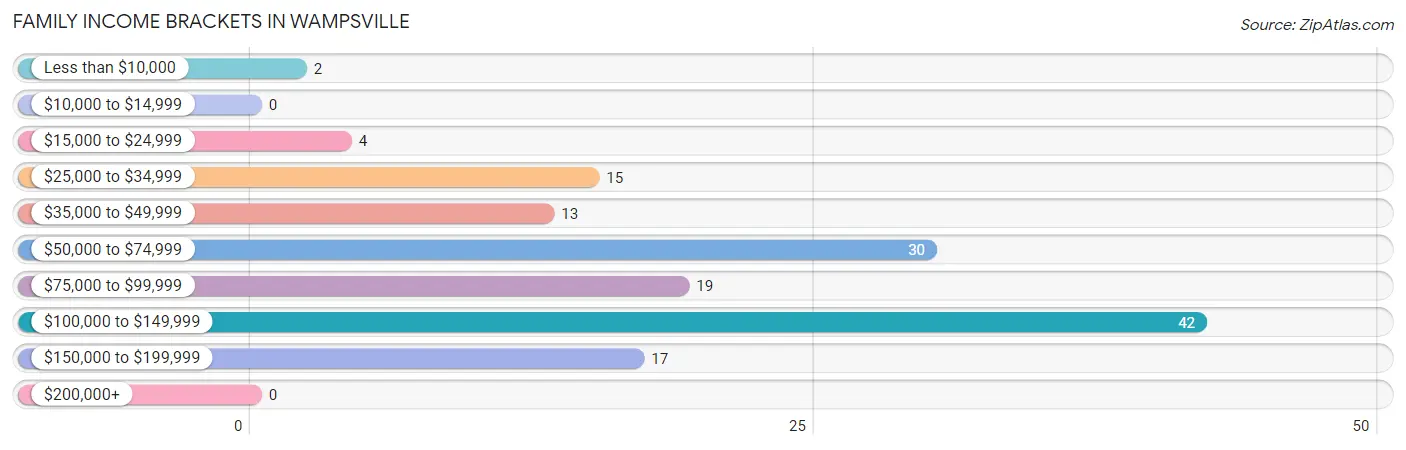
| Income Bracket | # Families | % Families |
| Less than $10,000 | 2 | 1.4% |
| $10,000 to $14,999 | 0 | 0.0% |
| $15,000 to $24,999 | 4 | 2.8% |
| $25,000 to $34,999 | 15 | 10.6% |
| $35,000 to $49,999 | 13 | 9.2% |
| $50,000 to $74,999 | 30 | 21.1% |
| $75,000 to $99,999 | 19 | 13.4% |
| $100,000 to $149,999 | 42 | 29.6% |
| $150,000 to $199,999 | 17 | 12.0% |
| $200,000+ | 0 | 0.0% |
Family Income by Famaliy Size in Wampsville
4-person families (20 | 14.1%) account for the highest median family income in Wampsville with $108,500 per family, while 3-person families (32 | 22.5%) have the highest median income of $36,111 per family member.
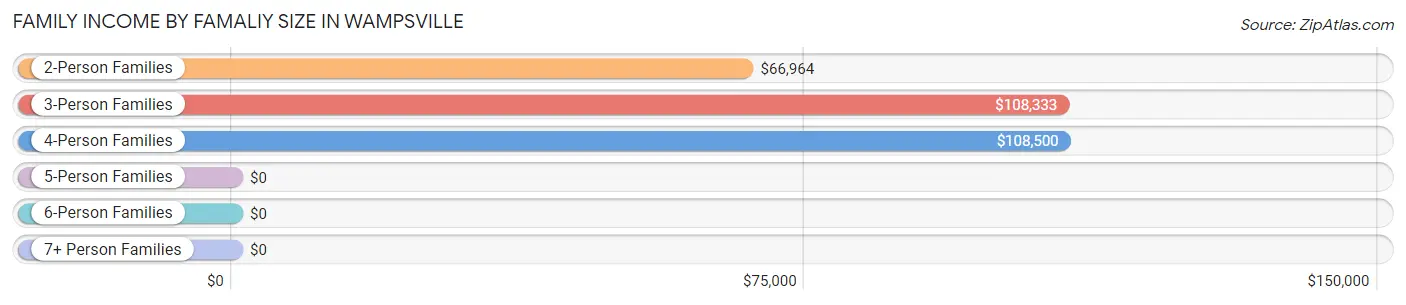
| Income Bracket | # Families | Median Income |
| 2-Person Families | 75 (52.8%) | $66,964 |
| 3-Person Families | 32 (22.5%) | $108,333 |
| 4-Person Families | 20 (14.1%) | $108,500 |
| 5-Person Families | 7 (4.9%) | $0 |
| 6-Person Families | 0 (0.0%) | $0 |
| 7+ Person Families | 8 (5.6%) | $0 |
| Total | 142 (100.0%) | $90,500 |
Family Income by Number of Earners in Wampsville
The median family income in Wampsville is $90,500, with families comprising 3+ earners (29) having the highest median family income of $126,875, while families with no earners (28) have the lowest median family income of $41,250, accounting for 20.4% and 19.7% of families, respectively.
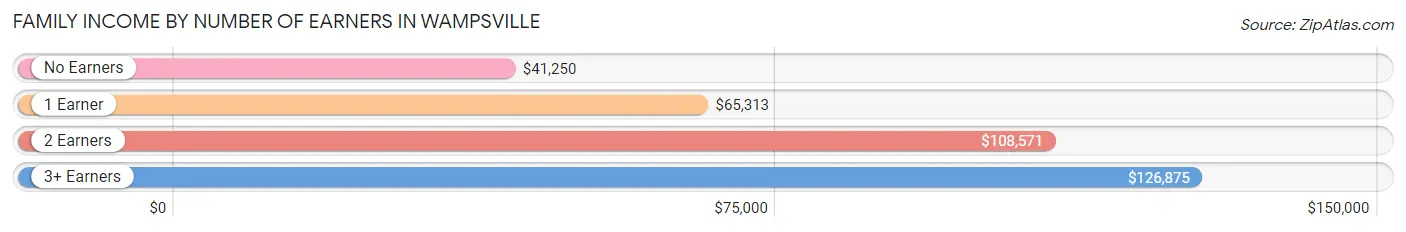
| Number of Earners | # Families | Median Income |
| No Earners | 28 (19.7%) | $41,250 |
| 1 Earner | 45 (31.7%) | $65,313 |
| 2 Earners | 40 (28.2%) | $108,571 |
| 3+ Earners | 29 (20.4%) | $126,875 |
| Total | 142 (100.0%) | $90,500 |
Household Income in Wampsville
Household Income Brackets in Wampsville
With 41 households falling in the category, the $50,000 to $74,999 income range is the most frequent in Wampsville, accounting for 21.6% of all households.
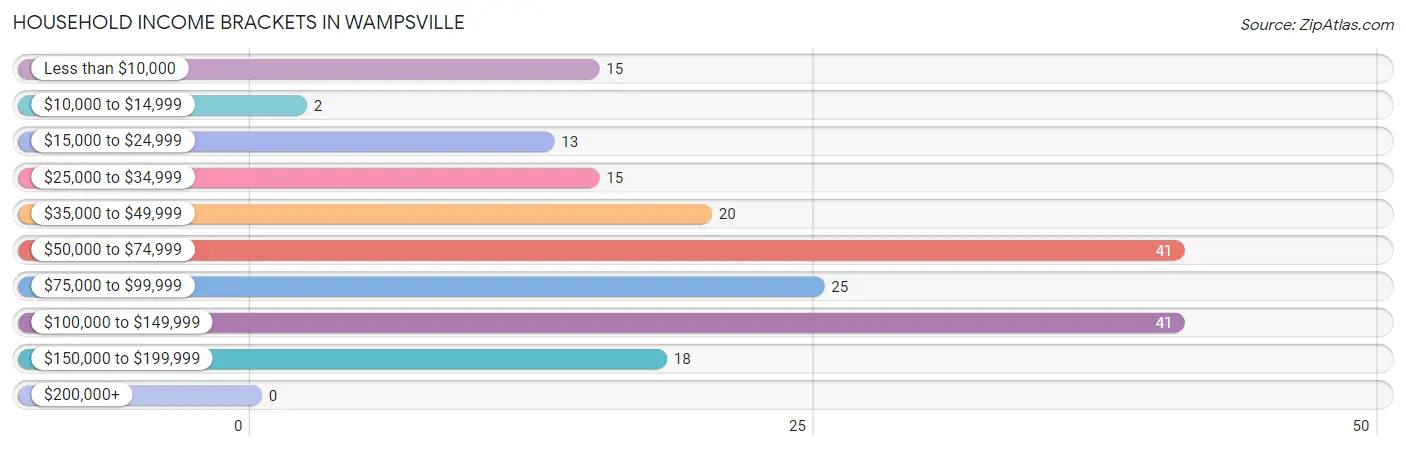
| Income Bracket | # Households | % Households |
| Less than $10,000 | 15 | 7.9% |
| $10,000 to $14,999 | 2 | 1.1% |
| $15,000 to $24,999 | 13 | 6.8% |
| $25,000 to $34,999 | 15 | 7.9% |
| $35,000 to $49,999 | 20 | 10.5% |
| $50,000 to $74,999 | 41 | 21.6% |
| $75,000 to $99,999 | 25 | 13.2% |
| $100,000 to $149,999 | 41 | 21.6% |
| $150,000 to $199,999 | 18 | 9.5% |
| $200,000+ | 0 | 0.0% |
Household Income by Householder Age in Wampsville
The median household income in Wampsville is $67,188, with the highest median household income of $112,500 found in the 25 to 44 years age bracket for the primary householder. A total of 38 households (20.0%) fall into this category. Meanwhile, the 15 to 24 years age bracket for the primary householder has the lowest median household income of $0, with 1 households (0.5%) in this group.
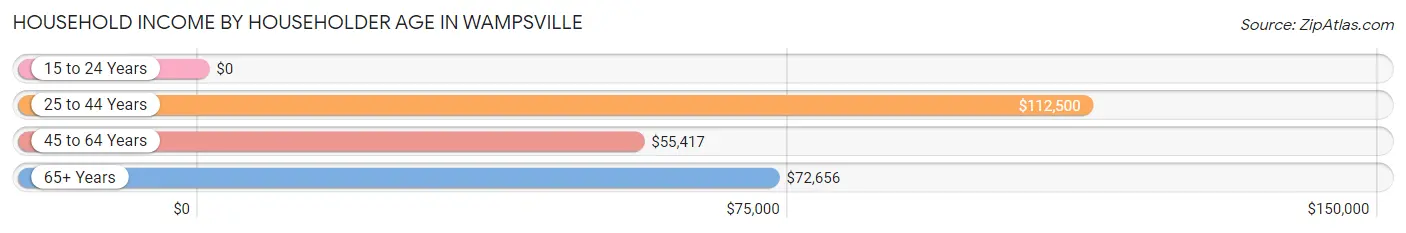
| Income Bracket | # Households | Median Income |
| 15 to 24 Years | 1 (0.5%) | $0 |
| 25 to 44 Years | 38 (20.0%) | $112,500 |
| 45 to 64 Years | 84 (44.2%) | $55,417 |
| 65+ Years | 67 (35.3%) | $72,656 |
| Total | 190 (100.0%) | $67,188 |
Poverty in Wampsville
Income Below Poverty by Sex and Age in Wampsville
With 5.2% poverty level for males and 7.9% for females among the residents of Wampsville, 6 to 11 year old males and under 5 year old females are the most vulnerable to poverty, with 3 males (50.0%) and 3 females (33.3%) in their respective age groups living below the poverty level.
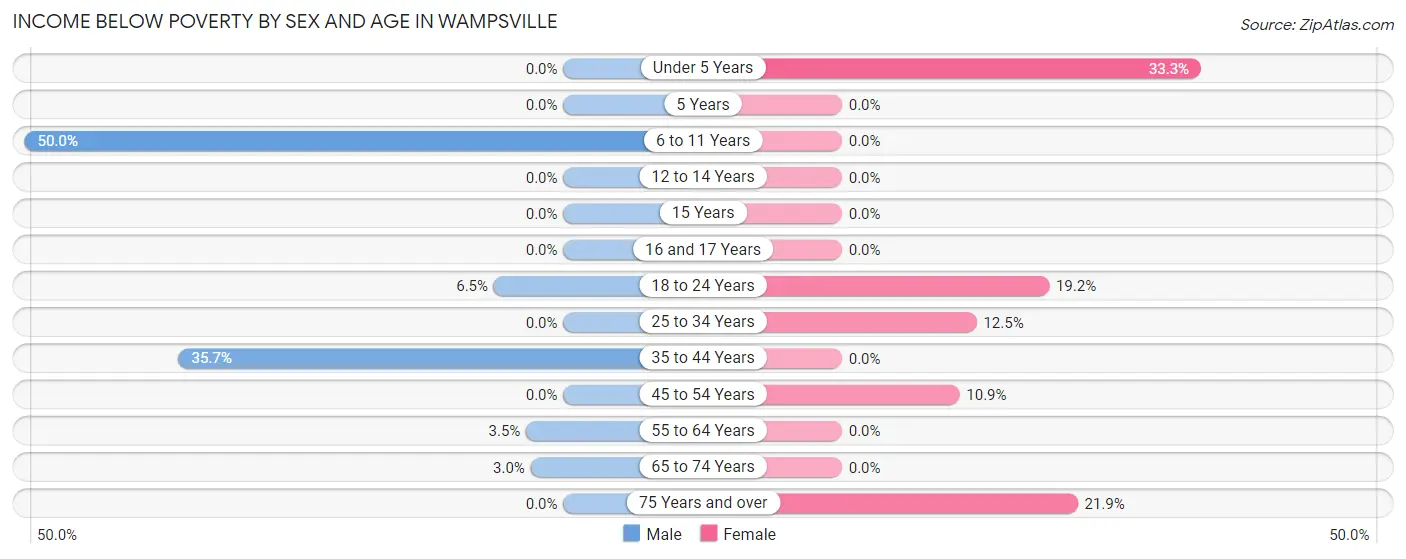
| Age Bracket | Male | Female |
| Under 5 Years | 0 (0.0%) | 3 (33.3%) |
| 5 Years | 0 (0.0%) | 0 (0.0%) |
| 6 to 11 Years | 3 (50.0%) | 0 (0.0%) |
| 12 to 14 Years | 0 (0.0%) | 0 (0.0%) |
| 15 Years | 0 (0.0%) | 0 (0.0%) |
| 16 and 17 Years | 0 (0.0%) | 0 (0.0%) |
| 18 to 24 Years | 2 (6.5%) | 5 (19.2%) |
| 25 to 34 Years | 0 (0.0%) | 2 (12.5%) |
| 35 to 44 Years | 5 (35.7%) | 0 (0.0%) |
| 45 to 54 Years | 0 (0.0%) | 6 (10.9%) |
| 55 to 64 Years | 1 (3.5%) | 0 (0.0%) |
| 65 to 74 Years | 1 (3.0%) | 0 (0.0%) |
| 75 Years and over | 0 (0.0%) | 7 (21.9%) |
| Total | 12 (5.2%) | 23 (7.9%) |
Income Above Poverty by Sex and Age in Wampsville
According to the poverty statistics in Wampsville, males aged under 5 years and females aged 6 to 11 years are the age groups that are most secure financially, with 100.0% of males and 100.0% of females in these age groups living above the poverty line.
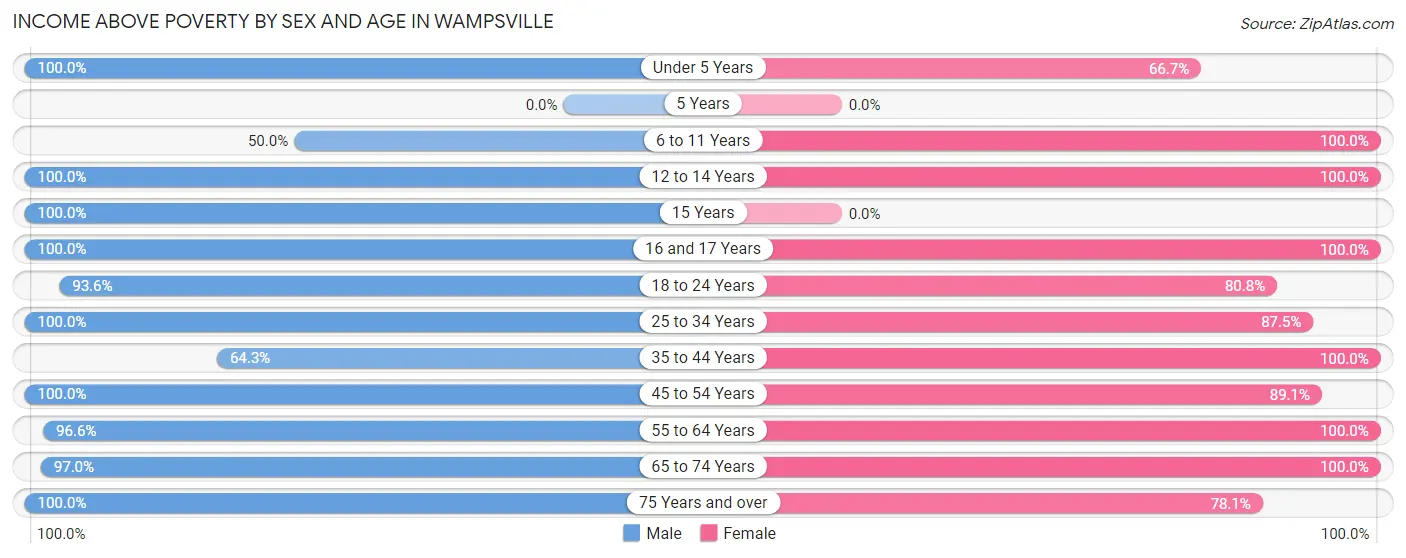
| Age Bracket | Male | Female |
| Under 5 Years | 3 (100.0%) | 6 (66.7%) |
| 5 Years | 0 (0.0%) | 0 (0.0%) |
| 6 to 11 Years | 3 (50.0%) | 18 (100.0%) |
| 12 to 14 Years | 12 (100.0%) | 23 (100.0%) |
| 15 Years | 4 (100.0%) | 0 (0.0%) |
| 16 and 17 Years | 3 (100.0%) | 12 (100.0%) |
| 18 to 24 Years | 29 (93.5%) | 21 (80.8%) |
| 25 to 34 Years | 19 (100.0%) | 14 (87.5%) |
| 35 to 44 Years | 9 (64.3%) | 32 (100.0%) |
| 45 to 54 Years | 44 (100.0%) | 49 (89.1%) |
| 55 to 64 Years | 28 (96.6%) | 45 (100.0%) |
| 65 to 74 Years | 32 (97.0%) | 23 (100.0%) |
| 75 Years and over | 32 (100.0%) | 25 (78.1%) |
| Total | 218 (94.8%) | 268 (92.1%) |
Income Below Poverty Among Married-Couple Families in Wampsville
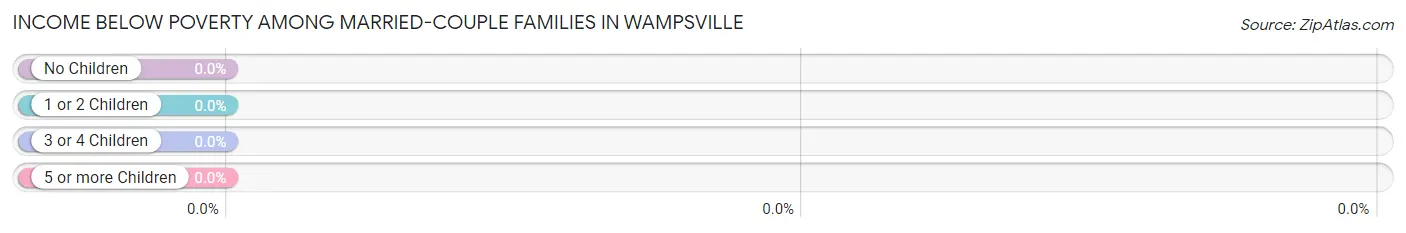
| Children | Above Poverty | Below Poverty |
| No Children | 71 (100.0%) | 0 (0.0%) |
| 1 or 2 Children | 30 (100.0%) | 0 (0.0%) |
| 3 or 4 Children | 8 (100.0%) | 0 (0.0%) |
| 5 or more Children | 0 (0.0%) | 0 (0.0%) |
| Total | 109 (100.0%) | 0 (0.0%) |
Income Below Poverty Among Single-Parent Households in Wampsville
According to the poverty data in Wampsville, 9.1% or 1 single-father households and 9.1% or 2 single-mother households are living below the poverty line. Among single-father households, those with no children have the highest poverty rate, with 1 households (12.5%) experiencing poverty. Likewise, among single-mother households, those with 1 or 2 children have the highest poverty rate, with 2 households (18.2%) falling below the poverty line.
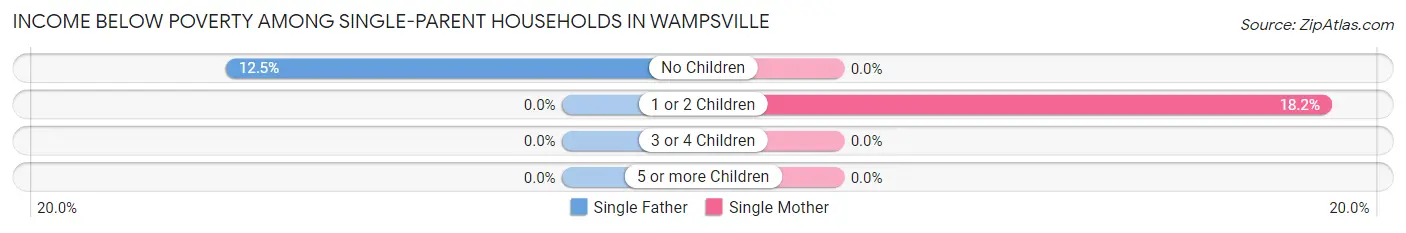
| Children | Single Father | Single Mother |
| No Children | 1 (12.5%) | 0 (0.0%) |
| 1 or 2 Children | 0 (0.0%) | 2 (18.2%) |
| 3 or 4 Children | 0 (0.0%) | 0 (0.0%) |
| 5 or more Children | 0 (0.0%) | 0 (0.0%) |
| Total | 1 (9.1%) | 2 (9.1%) |
Income Below Poverty Among Married-Couple vs Single-Parent Households in Wampsville
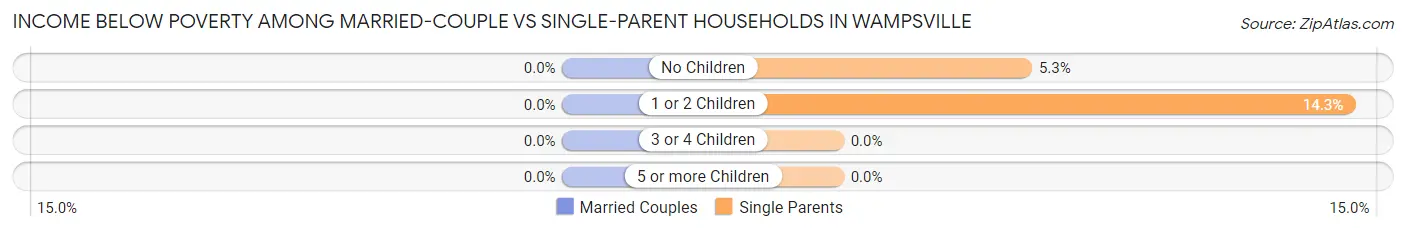
| Children | Married-Couple Families | Single-Parent Households |
| No Children | 0 (0.0%) | 1 (5.3%) |
| 1 or 2 Children | 0 (0.0%) | 2 (14.3%) |
| 3 or 4 Children | 0 (0.0%) | 0 (0.0%) |
| 5 or more Children | 0 (0.0%) | 0 (0.0%) |
| Total | 0 (0.0%) | 3 (9.1%) |
Race in Wampsville
The most populous races in Wampsville are White / Caucasian (543 | 92.0%), Black / African American (30 | 5.1%), and Hispanic or Latino (17 | 2.9%).
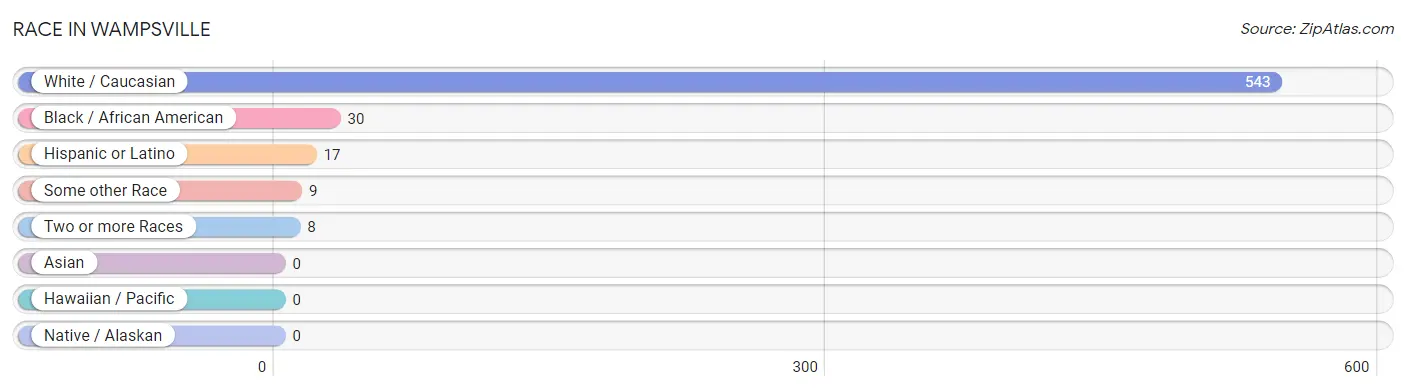
| Race | # Population | % Population |
| Asian | 0 | 0.0% |
| Black / African American | 30 | 5.1% |
| Hawaiian / Pacific | 0 | 0.0% |
| Hispanic or Latino | 17 | 2.9% |
| Native / Alaskan | 0 | 0.0% |
| White / Caucasian | 543 | 92.0% |
| Two or more Races | 8 | 1.4% |
| Some other Race | 9 | 1.5% |
| Total | 590 | 100.0% |
Ancestry in Wampsville
The most populous ancestries reported in Wampsville are American (194 | 32.9%), Irish (105 | 17.8%), English (83 | 14.1%), German (49 | 8.3%), and Italian (32 | 5.4%), together accounting for 78.5% of all Wampsville residents.
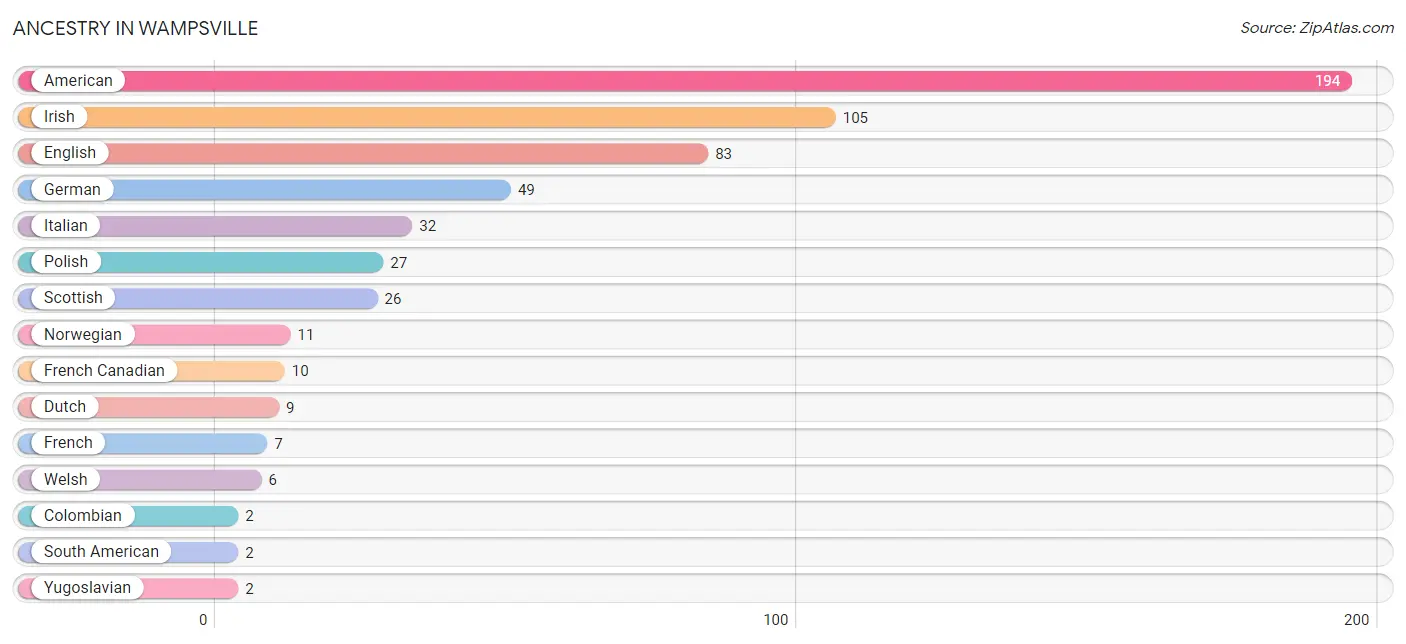
| Ancestry | # Population | % Population |
| American | 194 | 32.9% |
| Colombian | 2 | 0.3% |
| Dutch | 9 | 1.5% |
| English | 83 | 14.1% |
| French | 7 | 1.2% |
| French Canadian | 10 | 1.7% |
| German | 49 | 8.3% |
| Irish | 105 | 17.8% |
| Italian | 32 | 5.4% |
| Norwegian | 11 | 1.9% |
| Polish | 27 | 4.6% |
| Scottish | 26 | 4.4% |
| South American | 2 | 0.3% |
| Swedish | 1 | 0.2% |
| Welsh | 6 | 1.0% |
| Yugoslavian | 2 | 0.3% | View All 16 Rows |
Immigrants in Wampsville

| Immigration Origin | # Population | % Population | View All 0 Rows |
Sex and Age in Wampsville
Sex and Age in Wampsville
The most populous age groups in Wampsville are 50 to 54 Years (45 | 16.5%) for men and 50 to 54 Years (48 | 15.1%) for women.
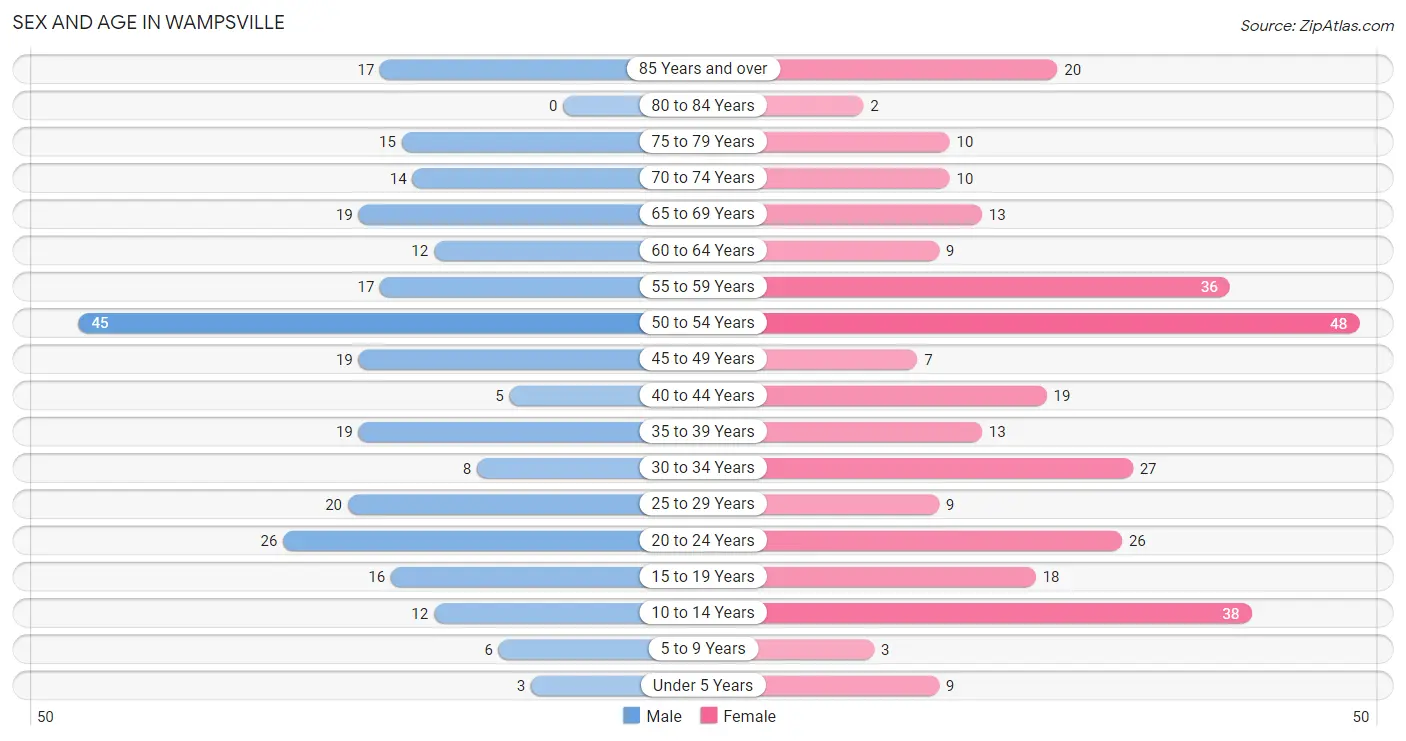
| Age Bracket | Male | Female |
| Under 5 Years | 3 (1.1%) | 9 (2.8%) |
| 5 to 9 Years | 6 (2.2%) | 3 (0.9%) |
| 10 to 14 Years | 12 (4.4%) | 38 (12.0%) |
| 15 to 19 Years | 16 (5.9%) | 18 (5.7%) |
| 20 to 24 Years | 26 (9.5%) | 26 (8.2%) |
| 25 to 29 Years | 20 (7.3%) | 9 (2.8%) |
| 30 to 34 Years | 8 (2.9%) | 27 (8.5%) |
| 35 to 39 Years | 19 (7.0%) | 13 (4.1%) |
| 40 to 44 Years | 5 (1.8%) | 19 (6.0%) |
| 45 to 49 Years | 19 (7.0%) | 7 (2.2%) |
| 50 to 54 Years | 45 (16.5%) | 48 (15.1%) |
| 55 to 59 Years | 17 (6.2%) | 36 (11.4%) |
| 60 to 64 Years | 12 (4.4%) | 9 (2.8%) |
| 65 to 69 Years | 19 (7.0%) | 13 (4.1%) |
| 70 to 74 Years | 14 (5.1%) | 10 (3.2%) |
| 75 to 79 Years | 15 (5.5%) | 10 (3.2%) |
| 80 to 84 Years | 0 (0.0%) | 2 (0.6%) |
| 85 Years and over | 17 (6.2%) | 20 (6.3%) |
| Total | 273 (100.0%) | 317 (100.0%) |
Families and Households in Wampsville
Median Family Size in Wampsville
The median family size in Wampsville is 3.17 persons per family, with single male/father families (11 | 7.7%) accounting for the largest median family size of 4.18 persons per family. On the other hand, single female/mother families (22 | 15.5%) represent the smallest median family size with 2.41 persons per family.
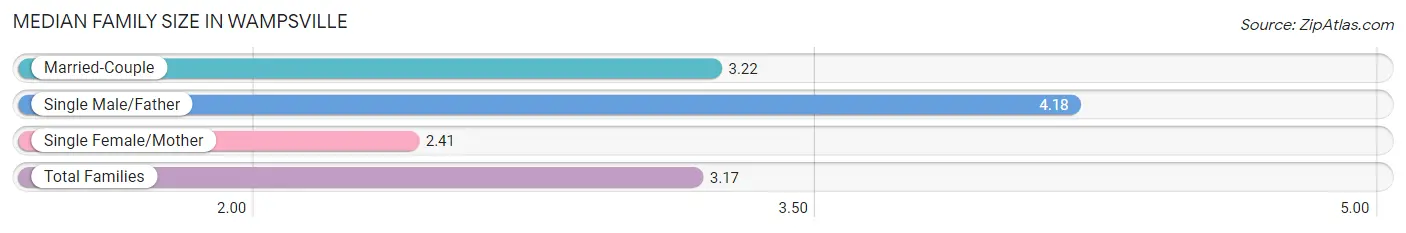
| Family Type | # Families | Family Size |
| Married-Couple | 109 (76.8%) | 3.22 |
| Single Male/Father | 11 (7.7%) | 4.18 |
| Single Female/Mother | 22 (15.5%) | 2.41 |
| Total Families | 142 (100.0%) | 3.17 |
Median Household Size in Wampsville
The median household size in Wampsville is 2.74 persons per household, with single male/father households (11 | 5.8%) accounting for the largest median household size of 4.18 persons per household. non-family households (48 | 25.3%) represent the smallest median household size with 1.19 persons per household.
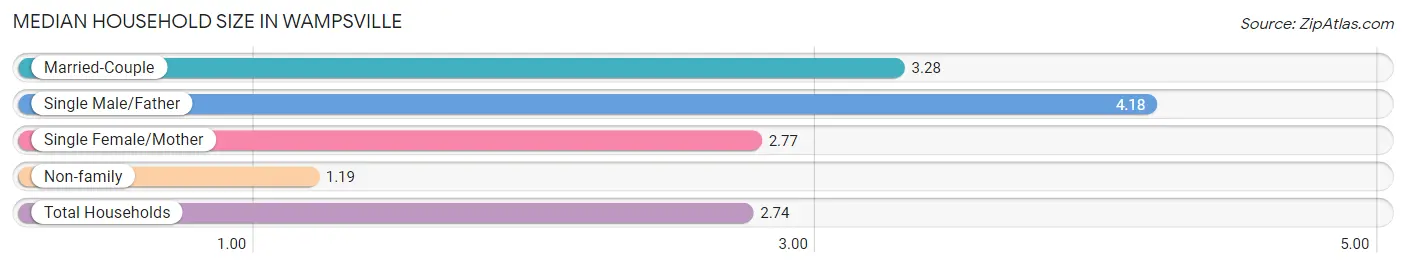
| Household Type | # Households | Household Size |
| Married-Couple | 109 (57.4%) | 3.28 |
| Single Male/Father | 11 (5.8%) | 4.18 |
| Single Female/Mother | 22 (11.6%) | 2.77 |
| Non-family | 48 (25.3%) | 1.19 |
| Total Households | 190 (100.0%) | 2.74 |
Household Size by Marriage Status in Wampsville
Out of a total of 190 households in Wampsville, 142 (74.7%) are family households, while 48 (25.3%) are nonfamily households. The most numerous type of family households are 2-person households, comprising 69, and the most common type of nonfamily households are 1-person households, comprising 43.
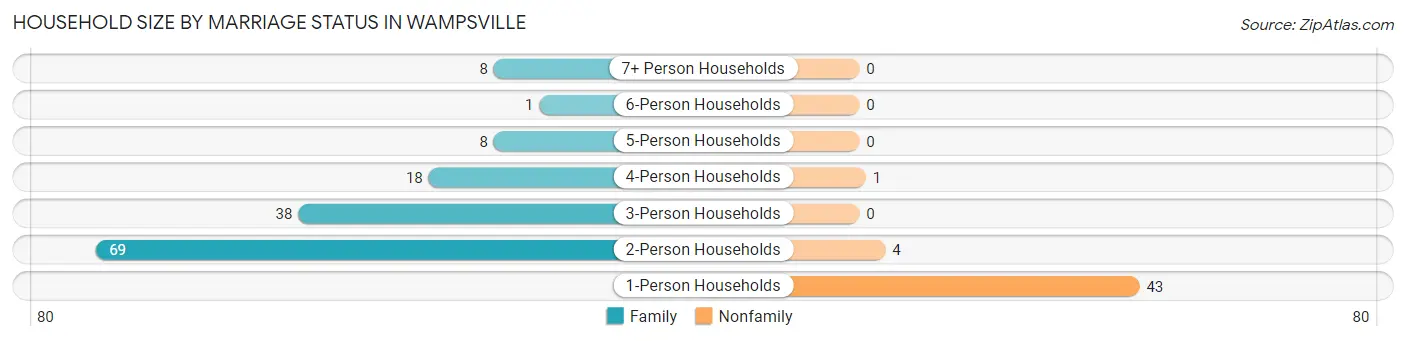
| Household Size | Family Households | Nonfamily Households |
| 1-Person Households | - | 43 (22.6%) |
| 2-Person Households | 69 (36.3%) | 4 (2.1%) |
| 3-Person Households | 38 (20.0%) | 0 (0.0%) |
| 4-Person Households | 18 (9.5%) | 1 (0.5%) |
| 5-Person Households | 8 (4.2%) | 0 (0.0%) |
| 6-Person Households | 1 (0.5%) | 0 (0.0%) |
| 7+ Person Households | 8 (4.2%) | 0 (0.0%) |
| Total | 142 (74.7%) | 48 (25.3%) |
Female Fertility in Wampsville
Fertility by Age in Wampsville
Average fertility rate in Wampsville is 160.0 births per 1,000 women. Women in the age bracket of 20 to 34 years have the highest fertility rate with 306.0 births per 1,000 women. Women in the age bracket of 20 to 34 years acount for 100.0% of all women with births.
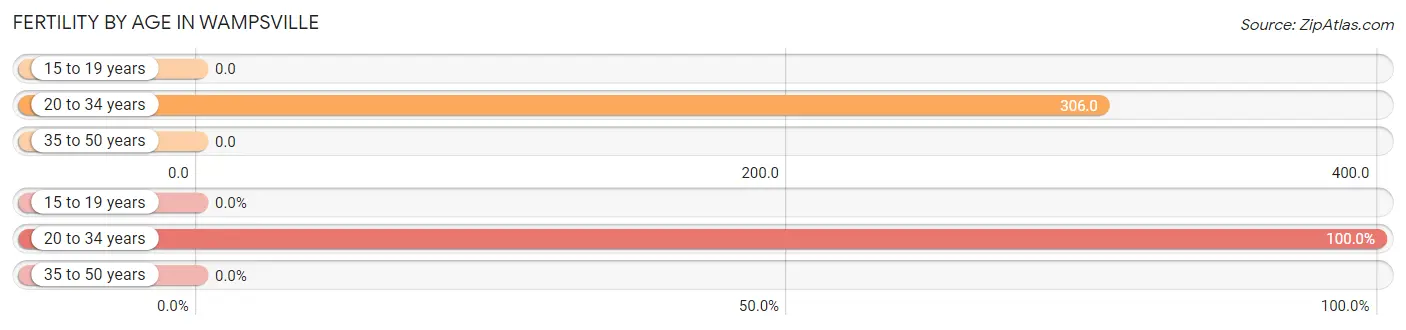
| Age Bracket | Women with Births | Births / 1,000 Women |
| 15 to 19 years | 0 (0.0%) | 0.0 |
| 20 to 34 years | 19 (100.0%) | 306.0 |
| 35 to 50 years | 0 (0.0%) | 0.0 |
| Total | 19 (100.0%) | 160.0 |
Fertility by Age by Marriage Status in Wampsville
10.5% of women with births (19) in Wampsville are married. The highest percentage of unmarried women with births falls into 20 to 34 years age bracket with 89.5% of them unmarried at the time of birth, while the lowest percentage of unmarried women with births belong to 20 to 34 years age bracket with 89.5% of them unmarried.
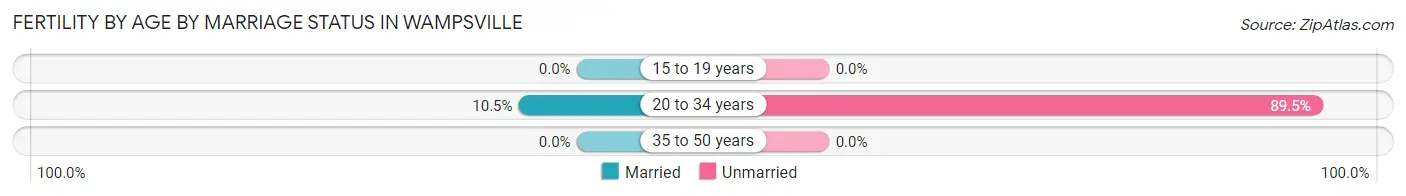
| Age Bracket | Married | Unmarried |
| 15 to 19 years | 0 (0.0%) | 0 (0.0%) |
| 20 to 34 years | 2 (10.5%) | 17 (89.5%) |
| 35 to 50 years | 0 (0.0%) | 0 (0.0%) |
| Total | 2 (10.5%) | 17 (89.5%) |
Fertility by Education in Wampsville
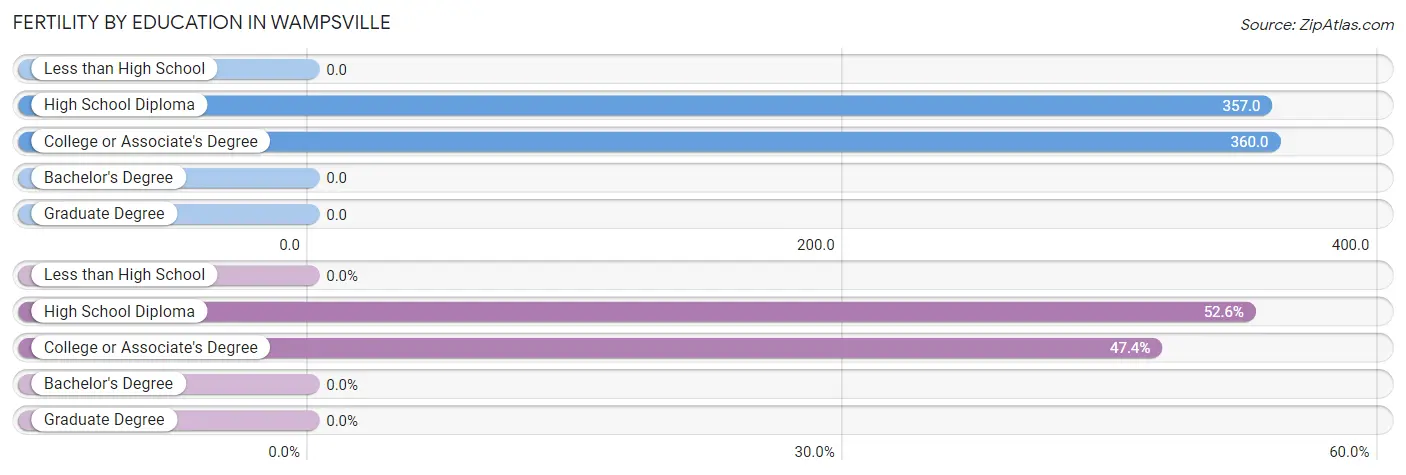
| Educational Attainment | Women with Births | Births / 1,000 Women |
| Less than High School | 0 (0.0%) | 0.0 |
| High School Diploma | 10 (52.6%) | 357.0 |
| College or Associate's Degree | 9 (47.4%) | 360.0 |
| Bachelor's Degree | 0 (0.0%) | 0.0 |
| Graduate Degree | 0 (0.0%) | 0.0 |
| Total | 19 (100.0%) | 160.0 |
Fertility by Education by Marriage Status in Wampsville
89.5% of women with births in Wampsville are unmarried. Women with the educational attainment of college or associate's degree are most likely to be married with 22.2% of them married at childbirth, while women with the educational attainment of high school diploma are least likely to be married with 100.0% of them unmarried at childbirth.
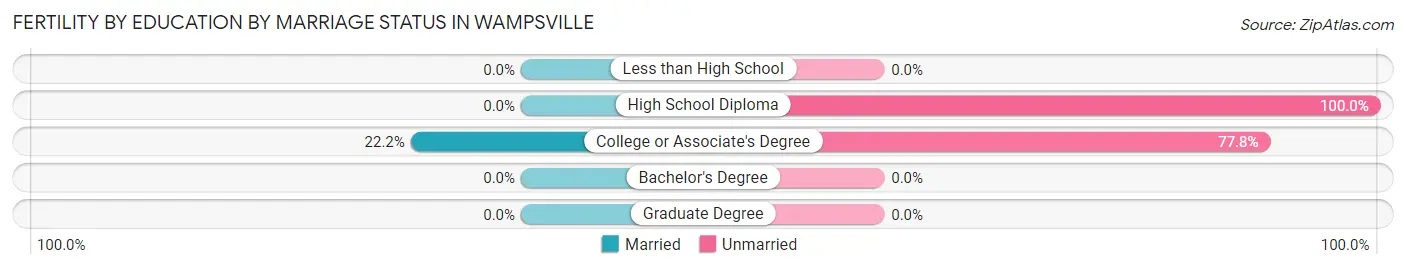
| Educational Attainment | Married | Unmarried |
| Less than High School | 0 (0.0%) | 0 (0.0%) |
| High School Diploma | 0 (0.0%) | 10 (100.0%) |
| College or Associate's Degree | 2 (22.2%) | 7 (77.8%) |
| Bachelor's Degree | 0 (0.0%) | 0 (0.0%) |
| Graduate Degree | 0 (0.0%) | 0 (0.0%) |
| Total | 2 (10.5%) | 17 (89.5%) |
Employment Characteristics in Wampsville
Employment by Class of Employer in Wampsville
Among the 245 employed individuals in Wampsville, private company employees (137 | 55.9%), not-for-profit organizations (30 | 12.2%), and local government employees (22 | 9.0%) make up the most common classes of employment.
| Employer Class | # Employees | % Employees |
| Private Company Employees | 137 | 55.9% |
| Self-Employed (Incorporated) | 11 | 4.5% |
| Self-Employed (Not Incorporated) | 20 | 8.2% |
| Not-for-profit Organizations | 30 | 12.2% |
| Local Government Employees | 22 | 9.0% |
| State Government Employees | 22 | 9.0% |
| Federal Government Employees | 3 | 1.2% |
| Unpaid Family Workers | 0 | 0.0% |
| Total | 245 | 100.0% |
Employment Status by Age in Wampsville
According to the labor force statistics for Wampsville, out of the total population over 16 years of age (515), 50.7% or 261 individuals are in the labor force, with 3.8% or 10 of them unemployed. The age group with the highest labor force participation rate is 55 to 59 years, with 77.4% or 41 individuals in the labor force. Within the labor force, the 16 to 19 years age range has the highest percentage of unemployed individuals, with 27.3% or 3 of them being unemployed.
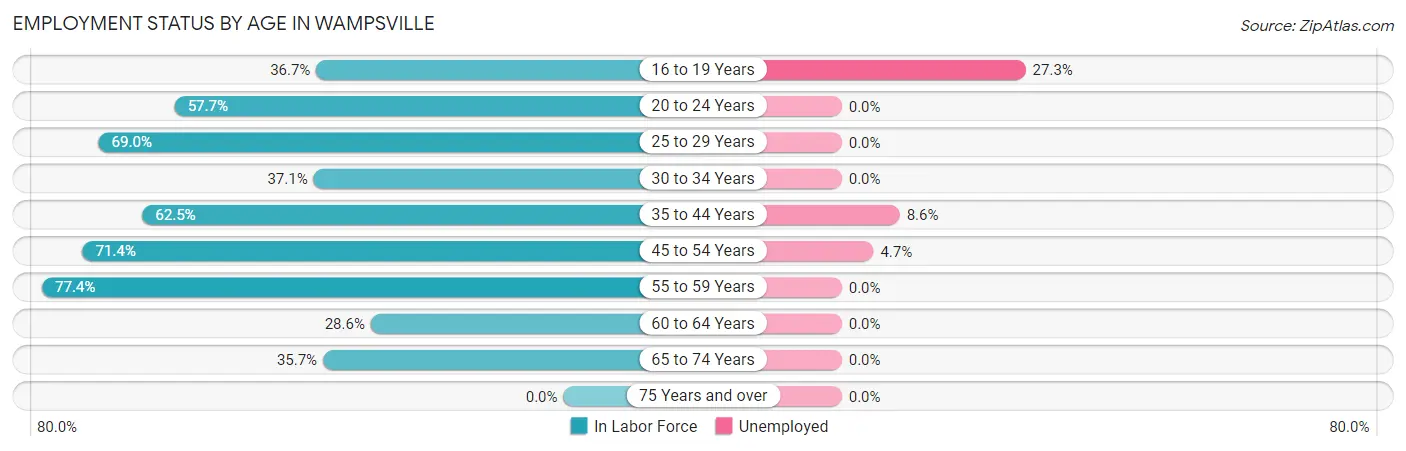
| Age Bracket | In Labor Force | Unemployed |
| 16 to 19 Years | 11 (36.7%) | 3 (27.3%) |
| 20 to 24 Years | 30 (57.7%) | 0 (0.0%) |
| 25 to 29 Years | 20 (69.0%) | 0 (0.0%) |
| 30 to 34 Years | 13 (37.1%) | 0 (0.0%) |
| 35 to 44 Years | 35 (62.5%) | 3 (8.6%) |
| 45 to 54 Years | 85 (71.4%) | 4 (4.7%) |
| 55 to 59 Years | 41 (77.4%) | 0 (0.0%) |
| 60 to 64 Years | 6 (28.6%) | 0 (0.0%) |
| 65 to 74 Years | 20 (35.7%) | 0 (0.0%) |
| 75 Years and over | 0 (0.0%) | 0 (0.0%) |
| Total | 261 (50.7%) | 10 (3.8%) |
Employment Status by Educational Attainment in Wampsville
According to labor force statistics for Wampsville, 63.9% of individuals (200) out of the total population between 25 and 64 years of age (313) are in the labor force, with 3.5% or 7 of them being unemployed. The group with the highest labor force participation rate are those with the educational attainment of bachelor's degree or higher, with 98.1% or 51 individuals in the labor force. Within the labor force, individuals with high school diploma education have the highest percentage of unemployment, with 9.6% or 7 of them being unemployed.
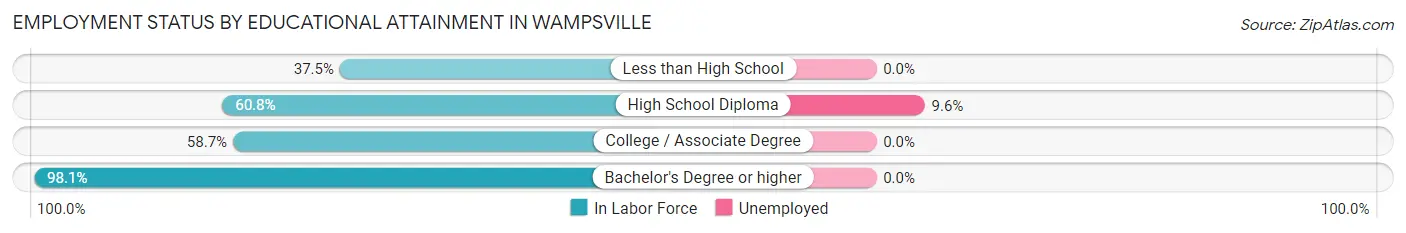
| Educational Attainment | In Labor Force | Unemployed |
| Less than High School | 12 (37.5%) | 0 (0.0%) |
| High School Diploma | 73 (60.8%) | 12 (9.6%) |
| College / Associate Degree | 64 (58.7%) | 0 (0.0%) |
| Bachelor's Degree or higher | 51 (98.1%) | 0 (0.0%) |
| Total | 200 (63.9%) | 11 (3.5%) |
Employment Occupations by Sex in Wampsville
Management, Business, Science and Arts Occupations
The most common Management, Business, Science and Arts occupations in Wampsville are Community & Social Service (52 | 20.7%), Education Instruction & Library (32 | 12.8%), Education, Arts & Media (14 | 5.6%), Management (11 | 4.4%), and Health Diagnosing & Treating (10 | 4.0%).
Management, Business, Science and Arts Occupations by Sex
Within the Management, Business, Science and Arts occupations in Wampsville, the most male-oriented occupations are Computers, Engineering & Science (100.0%), Computers & Mathematics (100.0%), and Architecture & Engineering (100.0%), while the most female-oriented occupations are Business & Financial (100.0%), Education Instruction & Library (100.0%), and Health Diagnosing & Treating (100.0%).
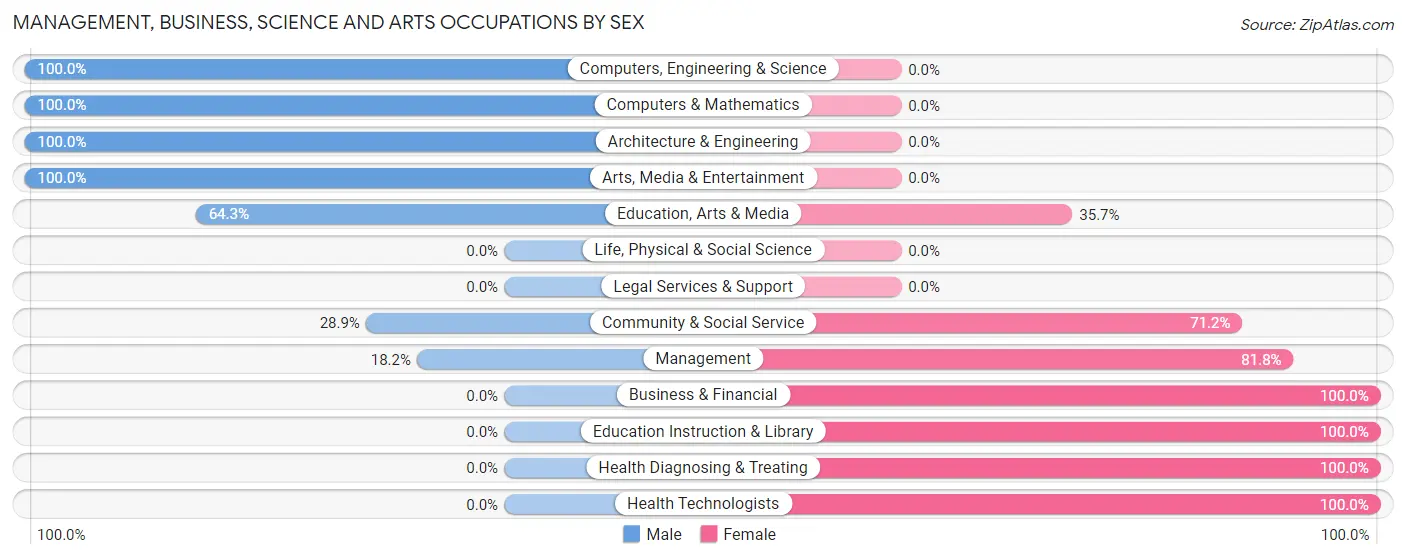
| Occupation | Male | Female |
| Management | 2 (18.2%) | 9 (81.8%) |
| Business & Financial | 0 (0.0%) | 2 (100.0%) |
| Computers, Engineering & Science | 5 (100.0%) | 0 (0.0%) |
| Computers & Mathematics | 2 (100.0%) | 0 (0.0%) |
| Architecture & Engineering | 3 (100.0%) | 0 (0.0%) |
| Life, Physical & Social Science | 0 (0.0%) | 0 (0.0%) |
| Community & Social Service | 15 (28.8%) | 37 (71.2%) |
| Education, Arts & Media | 9 (64.3%) | 5 (35.7%) |
| Legal Services & Support | 0 (0.0%) | 0 (0.0%) |
| Education Instruction & Library | 0 (0.0%) | 32 (100.0%) |
| Arts, Media & Entertainment | 6 (100.0%) | 0 (0.0%) |
| Health Diagnosing & Treating | 0 (0.0%) | 10 (100.0%) |
| Health Technologists | 0 (0.0%) | 4 (100.0%) |
| Total (Category) | 22 (27.5%) | 58 (72.5%) |
| Total (Overall) | 117 (46.6%) | 134 (53.4%) |
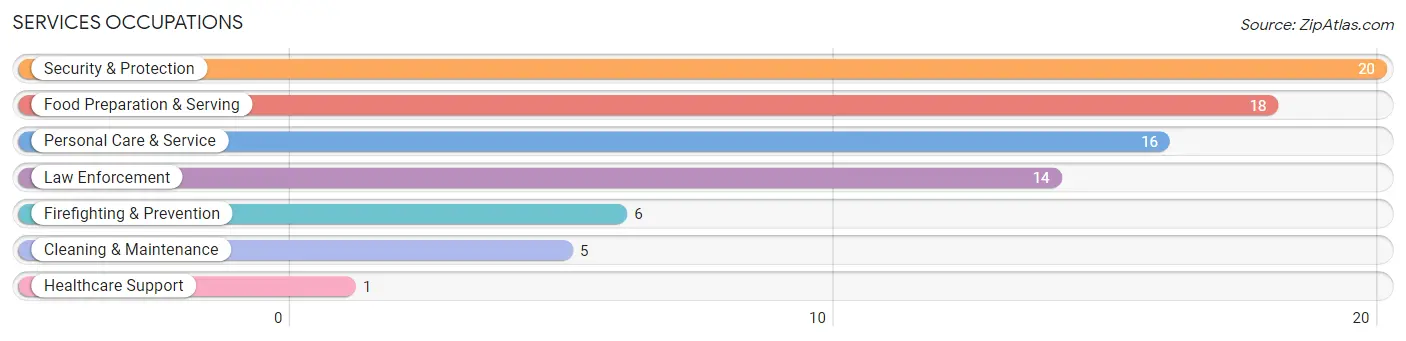
Services Occupations
The most common Services occupations in Wampsville are Security & Protection (20 | 8.0%), Food Preparation & Serving (18 | 7.2%), Personal Care & Service (16 | 6.4%), Law Enforcement (14 | 5.6%), and Firefighting & Prevention (6 | 2.4%).
Services Occupations by Sex
Within the Services occupations in Wampsville, the most male-oriented occupations are Firefighting & Prevention (100.0%), Cleaning & Maintenance (100.0%), and Security & Protection (85.0%), while the most female-oriented occupations are Healthcare Support (100.0%), Personal Care & Service (100.0%), and Food Preparation & Serving (77.8%).
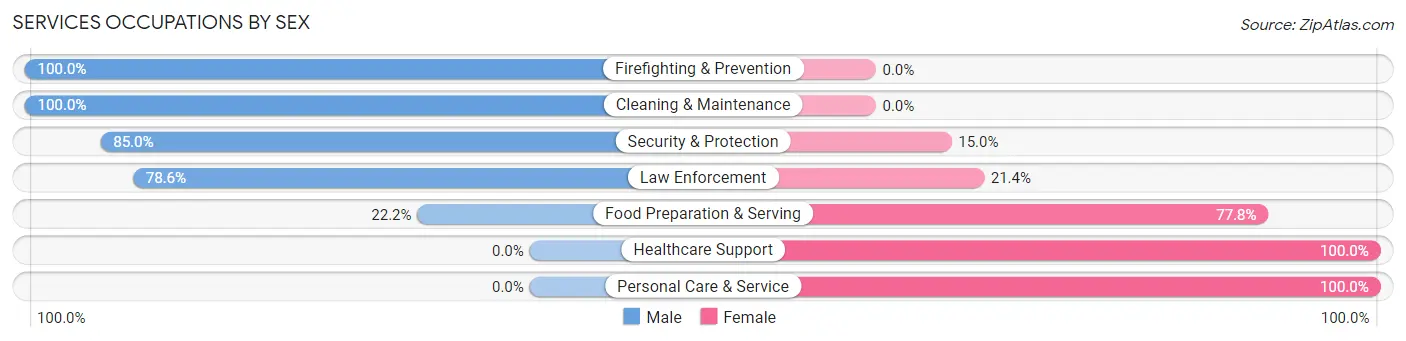
| Occupation | Male | Female |
| Healthcare Support | 0 (0.0%) | 1 (100.0%) |
| Security & Protection | 17 (85.0%) | 3 (15.0%) |
| Firefighting & Prevention | 6 (100.0%) | 0 (0.0%) |
| Law Enforcement | 11 (78.6%) | 3 (21.4%) |
| Food Preparation & Serving | 4 (22.2%) | 14 (77.8%) |
| Cleaning & Maintenance | 5 (100.0%) | 0 (0.0%) |
| Personal Care & Service | 0 (0.0%) | 16 (100.0%) |
| Total (Category) | 26 (43.3%) | 34 (56.7%) |
| Total (Overall) | 117 (46.6%) | 134 (53.4%) |
Sales and Office Occupations
The most common Sales and Office occupations in Wampsville are Sales & Related (30 | 11.9%), and Office & Administration (11 | 4.4%).
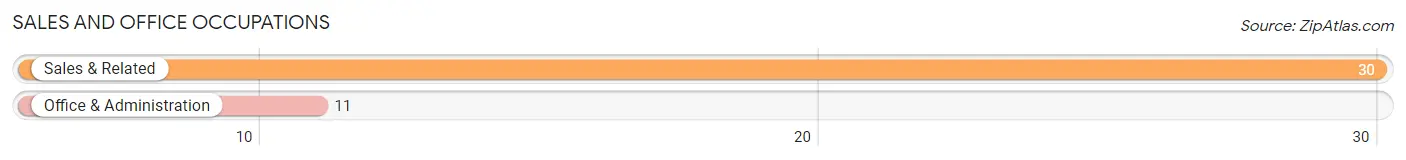
Sales and Office Occupations by Sex
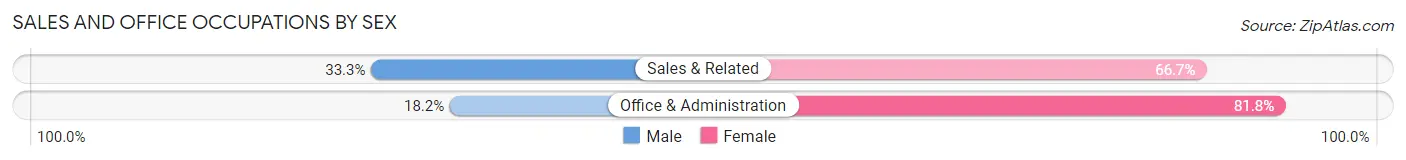
| Occupation | Male | Female |
| Sales & Related | 10 (33.3%) | 20 (66.7%) |
| Office & Administration | 2 (18.2%) | 9 (81.8%) |
| Total (Category) | 12 (29.3%) | 29 (70.7%) |
| Total (Overall) | 117 (46.6%) | 134 (53.4%) |
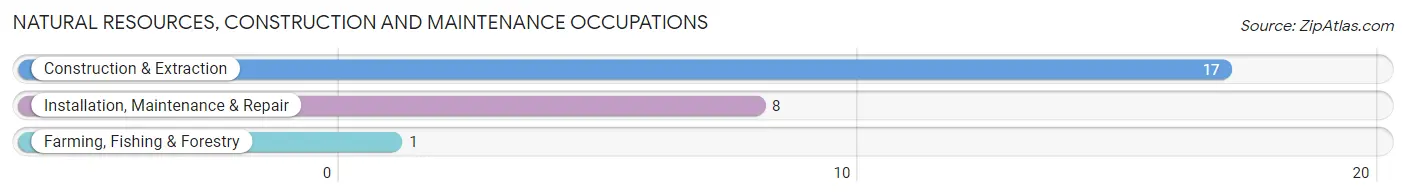
Natural Resources, Construction and Maintenance Occupations
The most common Natural Resources, Construction and Maintenance occupations in Wampsville are Construction & Extraction (17 | 6.8%), Installation, Maintenance & Repair (8 | 3.2%), and Farming, Fishing & Forestry (1 | 0.4%).
Natural Resources, Construction and Maintenance Occupations by Sex
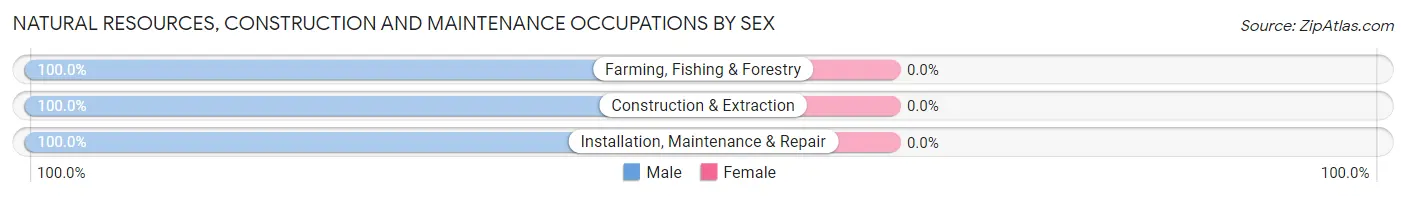
| Occupation | Male | Female |
| Farming, Fishing & Forestry | 1 (100.0%) | 0 (0.0%) |
| Construction & Extraction | 17 (100.0%) | 0 (0.0%) |
| Installation, Maintenance & Repair | 8 (100.0%) | 0 (0.0%) |
| Total (Category) | 26 (100.0%) | 0 (0.0%) |
| Total (Overall) | 117 (46.6%) | 134 (53.4%) |
Production, Transportation and Moving Occupations
The most common Production, Transportation and Moving occupations in Wampsville are Material Moving (23 | 9.2%), Production (16 | 6.4%), and Transportation (5 | 2.0%).
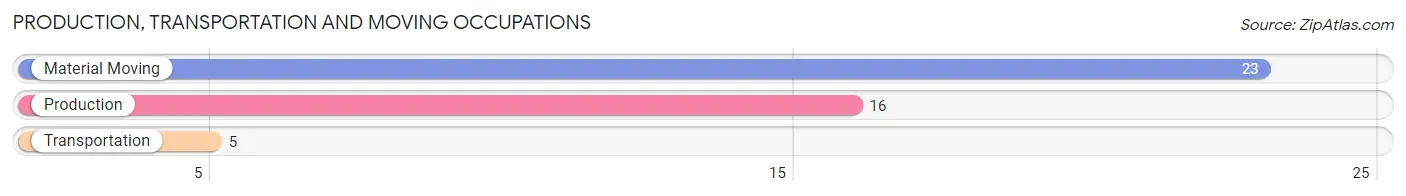
Production, Transportation and Moving Occupations by Sex
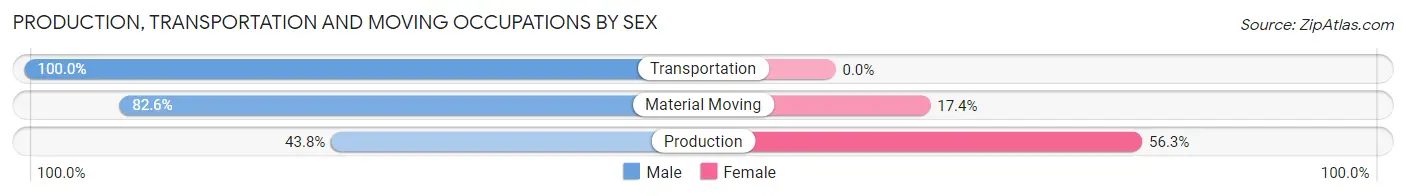
| Occupation | Male | Female |
| Production | 7 (43.8%) | 9 (56.2%) |
| Transportation | 5 (100.0%) | 0 (0.0%) |
| Material Moving | 19 (82.6%) | 4 (17.4%) |
| Total (Category) | 31 (70.5%) | 13 (29.5%) |
| Total (Overall) | 117 (46.6%) | 134 (53.4%) |
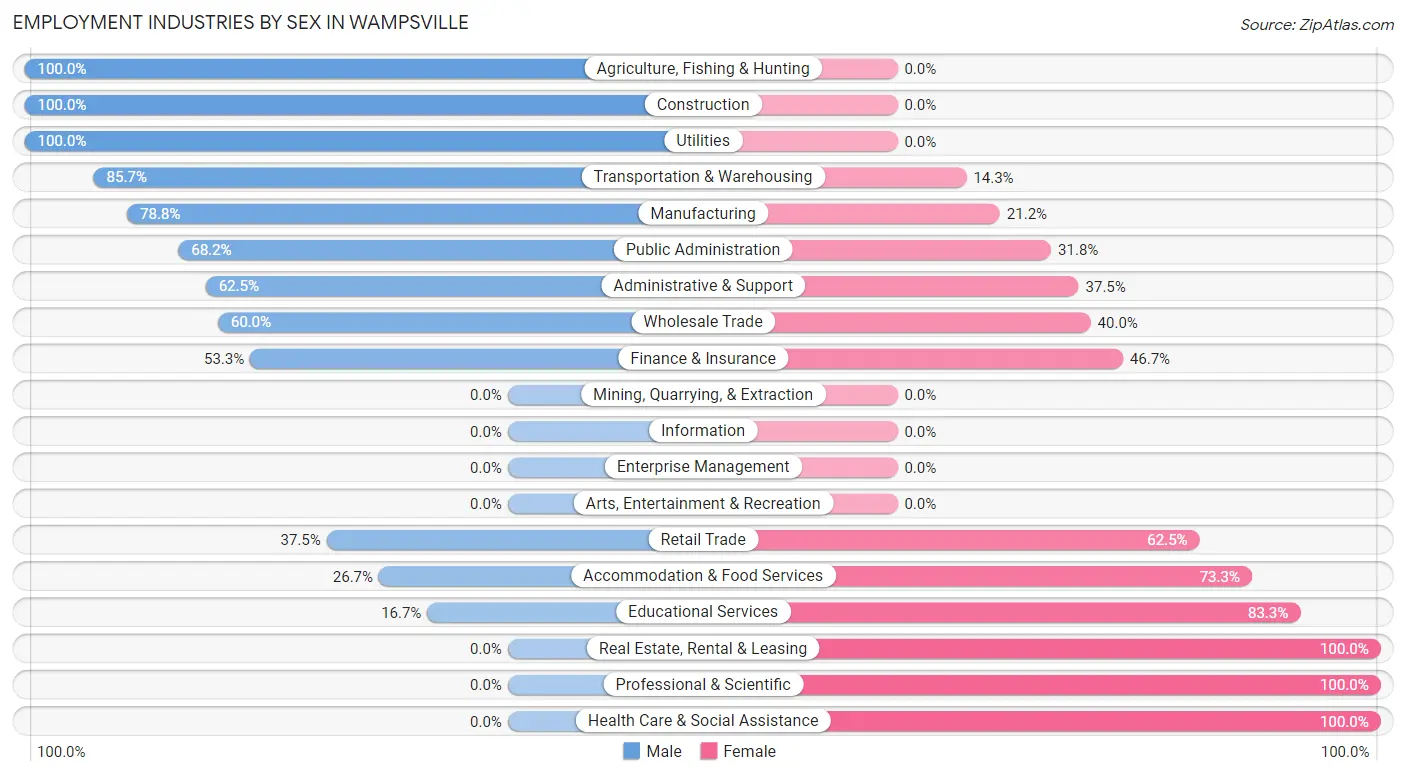
Employment Industries by Sex in Wampsville
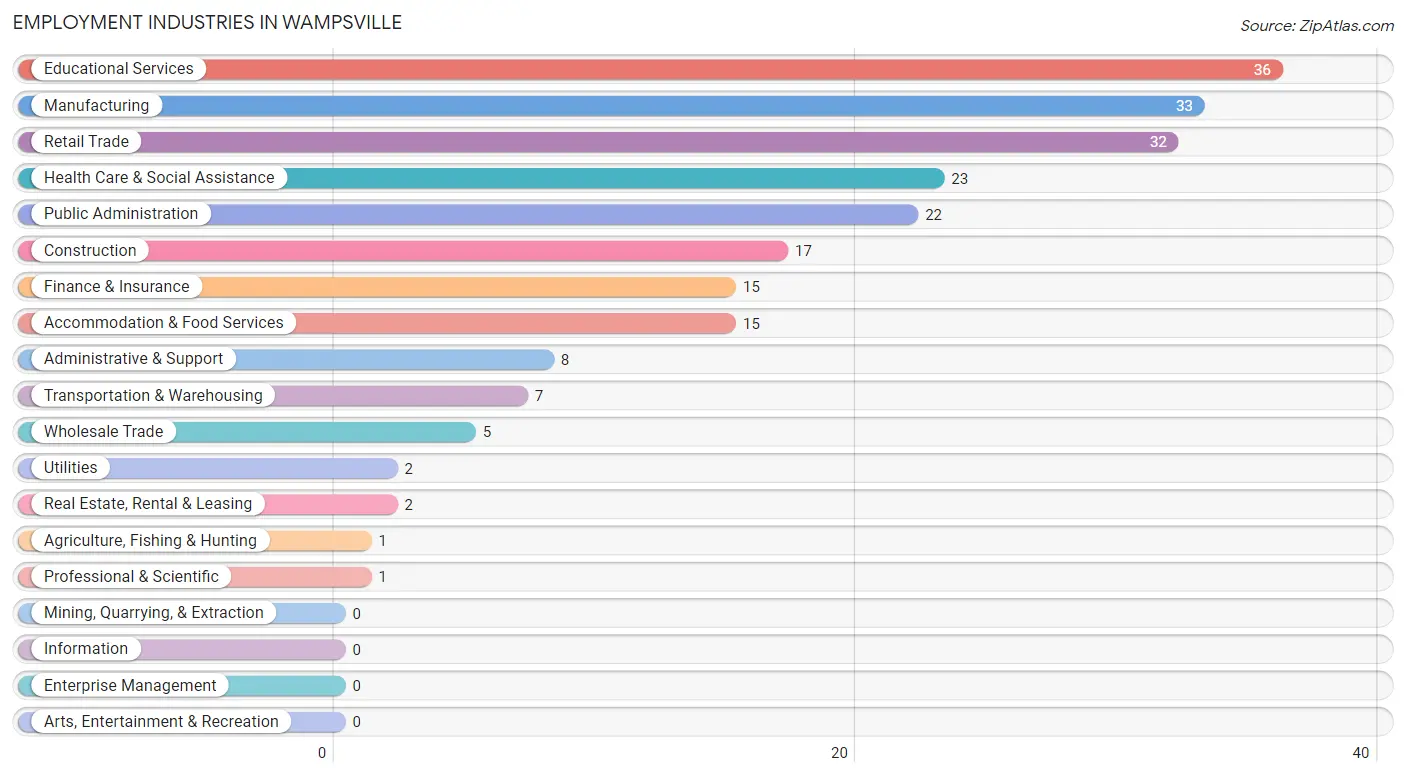
Employment Industries in Wampsville
The major employment industries in Wampsville include Educational Services (36 | 14.3%), Manufacturing (33 | 13.2%), Retail Trade (32 | 12.8%), Health Care & Social Assistance (23 | 9.2%), and Public Administration (22 | 8.8%).
Employment Industries by Sex in Wampsville
The Wampsville industries that see more men than women are Agriculture, Fishing & Hunting (100.0%), Construction (100.0%), and Utilities (100.0%), whereas the industries that tend to have a higher number of women are Real Estate, Rental & Leasing (100.0%), Professional & Scientific (100.0%), and Health Care & Social Assistance (100.0%).
| Industry | Male | Female |
| Agriculture, Fishing & Hunting | 1 (100.0%) | 0 (0.0%) |
| Mining, Quarrying, & Extraction | 0 (0.0%) | 0 (0.0%) |
| Construction | 17 (100.0%) | 0 (0.0%) |
| Manufacturing | 26 (78.8%) | 7 (21.2%) |
| Wholesale Trade | 3 (60.0%) | 2 (40.0%) |
| Retail Trade | 12 (37.5%) | 20 (62.5%) |
| Transportation & Warehousing | 6 (85.7%) | 1 (14.3%) |
| Utilities | 2 (100.0%) | 0 (0.0%) |
| Information | 0 (0.0%) | 0 (0.0%) |
| Finance & Insurance | 8 (53.3%) | 7 (46.7%) |
| Real Estate, Rental & Leasing | 0 (0.0%) | 2 (100.0%) |
| Professional & Scientific | 0 (0.0%) | 1 (100.0%) |
| Enterprise Management | 0 (0.0%) | 0 (0.0%) |
| Administrative & Support | 5 (62.5%) | 3 (37.5%) |
| Educational Services | 6 (16.7%) | 30 (83.3%) |
| Health Care & Social Assistance | 0 (0.0%) | 23 (100.0%) |
| Arts, Entertainment & Recreation | 0 (0.0%) | 0 (0.0%) |
| Accommodation & Food Services | 4 (26.7%) | 11 (73.3%) |
| Public Administration | 15 (68.2%) | 7 (31.8%) |
| Total | 117 (46.6%) | 134 (53.4%) |
Education in Wampsville
School Enrollment in Wampsville
The most common levels of schooling among the 112 students in Wampsville are middle school (53 | 47.3%), high school (27 | 24.1%), and college / undergraduate (20 | 17.9%).
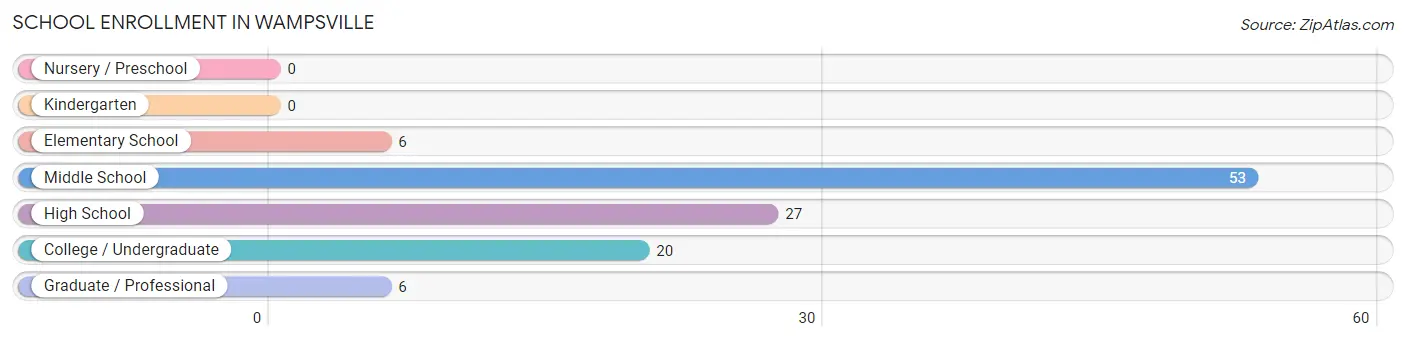
| School Level | # Students | % Students |
| Nursery / Preschool | 0 | 0.0% |
| Kindergarten | 0 | 0.0% |
| Elementary School | 6 | 5.4% |
| Middle School | 53 | 47.3% |
| High School | 27 | 24.1% |
| College / Undergraduate | 20 | 17.9% |
| Graduate / Professional | 6 | 5.4% |
| Total | 112 | 100.0% |
School Enrollment by Age by Funding Source in Wampsville
Out of a total of 112 students who are enrolled in schools in Wampsville, 33 (29.5%) attend a private institution, while the remaining 79 (70.5%) are enrolled in public schools. The age group of 25 to 34 year olds has the highest likelihood of being enrolled in private schools, with 4 (100.0% in the age bracket) enrolled. Conversely, the age group of 15 to 17 year olds has the lowest likelihood of being enrolled in a private school, with 19 (100.0% in the age bracket) attending a public institution.
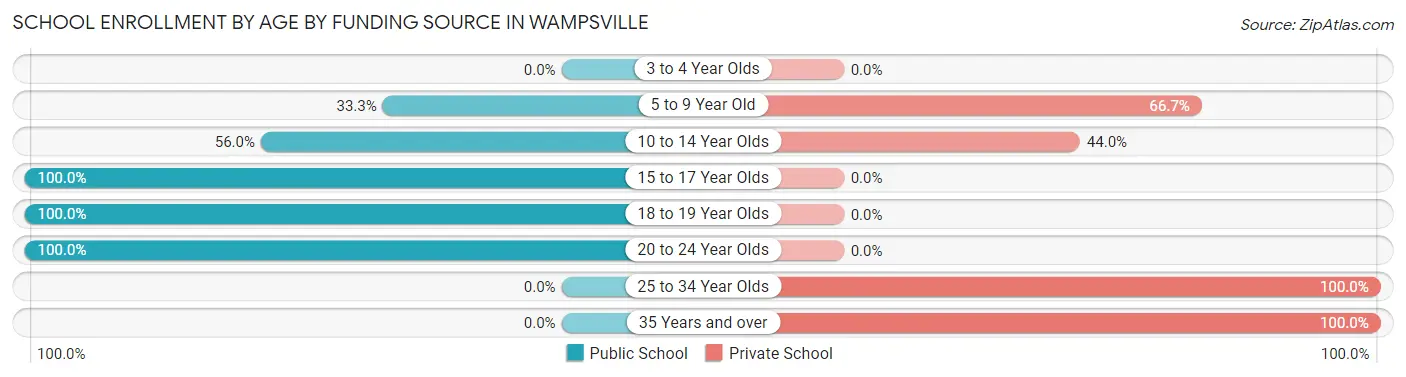
| Age Bracket | Public School | Private School |
| 3 to 4 Year Olds | 0 (0.0%) | 0 (0.0%) |
| 5 to 9 Year Old | 3 (33.3%) | 6 (66.7%) |
| 10 to 14 Year Olds | 28 (56.0%) | 22 (44.0%) |
| 15 to 17 Year Olds | 19 (100.0%) | 0 (0.0%) |
| 18 to 19 Year Olds | 10 (100.0%) | 0 (0.0%) |
| 20 to 24 Year Olds | 19 (100.0%) | 0 (0.0%) |
| 25 to 34 Year Olds | 0 (0.0%) | 4 (100.0%) |
| 35 Years and over | 0 (0.0%) | 1 (100.0%) |
| Total | 79 (70.5%) | 33 (29.5%) |
Educational Attainment by Field of Study in Wampsville
Education (13 | 18.8%), business (11 | 15.9%), bio, nature & agricultural (9 | 13.0%), arts & humanities (7 | 10.1%), and computers & mathematics (6 | 8.7%) are the most common fields of study among 69 individuals in Wampsville who have obtained a bachelor's degree or higher.
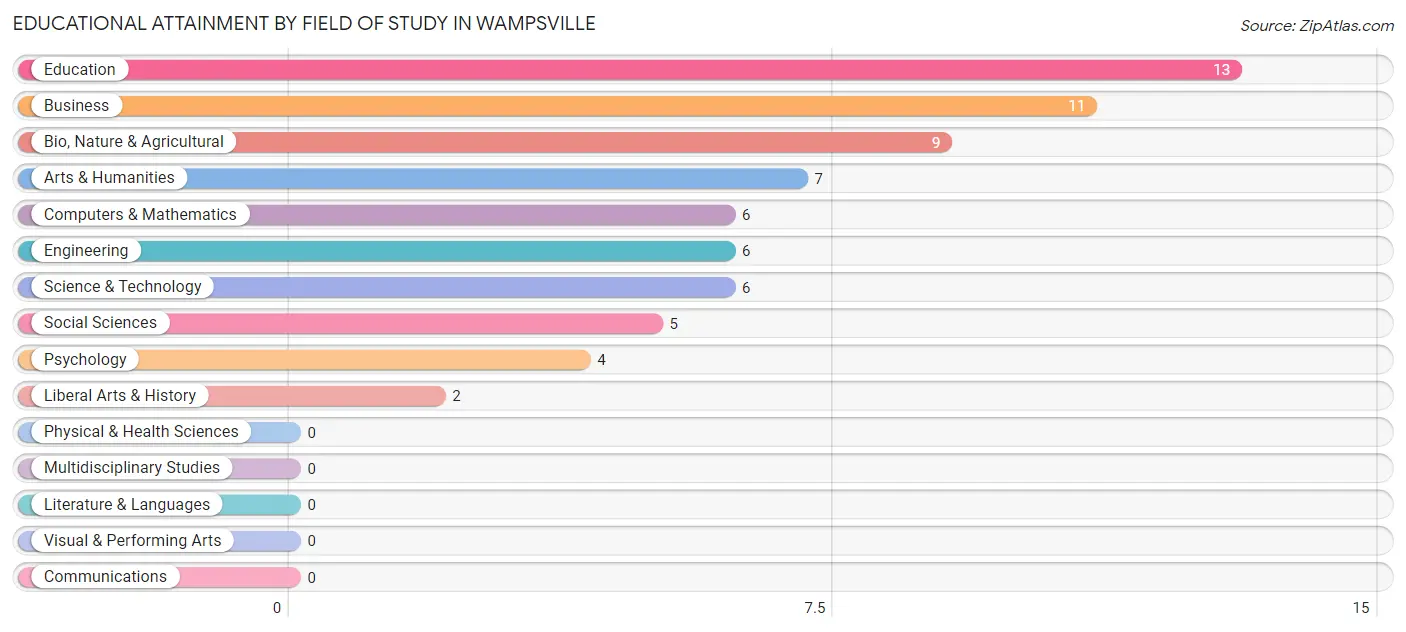
| Field of Study | # Graduates | % Graduates |
| Computers & Mathematics | 6 | 8.7% |
| Bio, Nature & Agricultural | 9 | 13.0% |
| Physical & Health Sciences | 0 | 0.0% |
| Psychology | 4 | 5.8% |
| Social Sciences | 5 | 7.2% |
| Engineering | 6 | 8.7% |
| Multidisciplinary Studies | 0 | 0.0% |
| Science & Technology | 6 | 8.7% |
| Business | 11 | 15.9% |
| Education | 13 | 18.8% |
| Literature & Languages | 0 | 0.0% |
| Liberal Arts & History | 2 | 2.9% |
| Visual & Performing Arts | 0 | 0.0% |
| Communications | 0 | 0.0% |
| Arts & Humanities | 7 | 10.1% |
| Total | 69 | 100.0% |
Transportation & Commute in Wampsville
Vehicle Availability by Sex in Wampsville
The most prevalent vehicle ownership categories in Wampsville are males with 2 vehicles (67, accounting for 57.3%) and females with 2 vehicles (86, making up 52.3%).
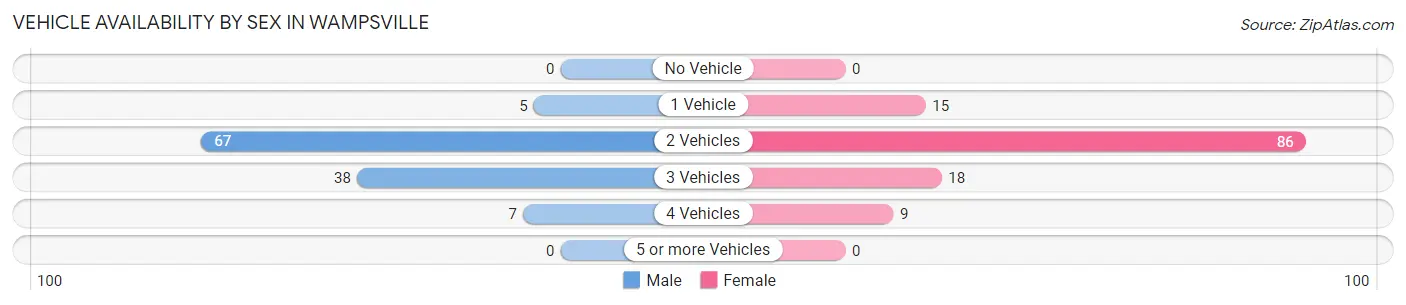
| Vehicles Available | Male | Female |
| No Vehicle | 0 (0.0%) | 0 (0.0%) |
| 1 Vehicle | 5 (4.3%) | 15 (11.7%) |
| 2 Vehicles | 67 (57.3%) | 86 (67.2%) |
| 3 Vehicles | 38 (32.5%) | 18 (14.1%) |
| 4 Vehicles | 7 (6.0%) | 9 (7.0%) |
| 5 or more Vehicles | 0 (0.0%) | 0 (0.0%) |
| Total | 117 (100.0%) | 128 (100.0%) |
Commute Time in Wampsville
The most frequently occuring commute durations in Wampsville are 5 to 9 minutes (55 commuters, 26.4%), 30 to 34 minutes (47 commuters, 22.6%), and 10 to 14 minutes (30 commuters, 14.4%).
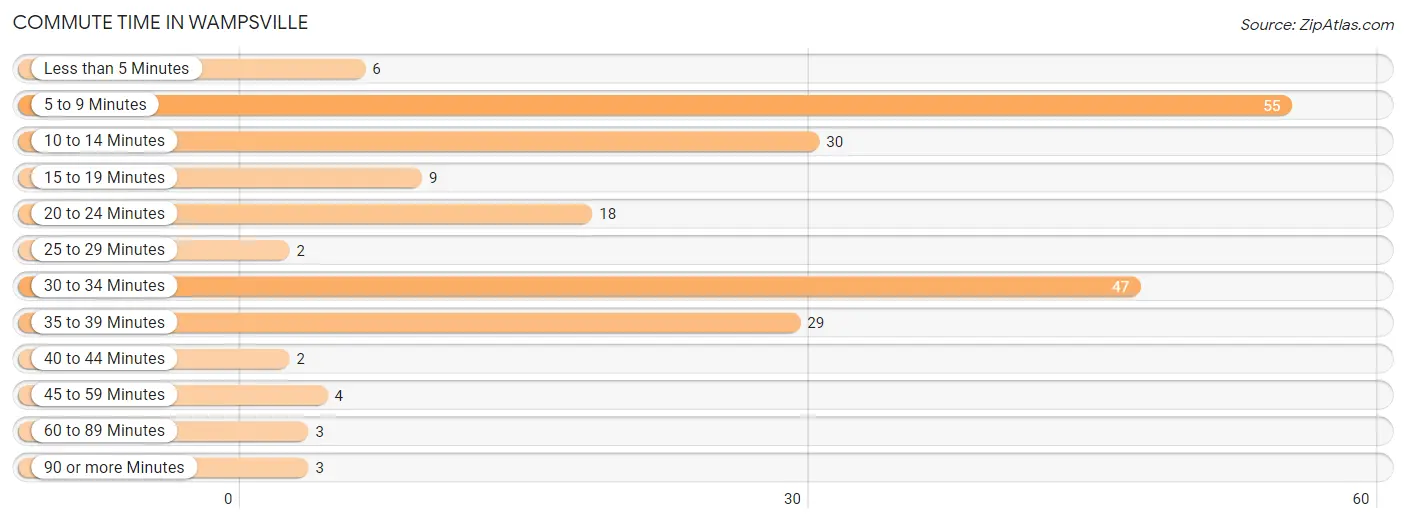
| Commute Time | # Commuters | % Commuters |
| Less than 5 Minutes | 6 | 2.9% |
| 5 to 9 Minutes | 55 | 26.4% |
| 10 to 14 Minutes | 30 | 14.4% |
| 15 to 19 Minutes | 9 | 4.3% |
| 20 to 24 Minutes | 18 | 8.6% |
| 25 to 29 Minutes | 2 | 1.0% |
| 30 to 34 Minutes | 47 | 22.6% |
| 35 to 39 Minutes | 29 | 13.9% |
| 40 to 44 Minutes | 2 | 1.0% |
| 45 to 59 Minutes | 4 | 1.9% |
| 60 to 89 Minutes | 3 | 1.4% |
| 90 or more Minutes | 3 | 1.4% |
Commute Time by Sex in Wampsville
The most common commute times in Wampsville are 5 to 9 minutes (37 commuters, 33.9%) for males and 10 to 14 minutes (22 commuters, 22.2%) for females.
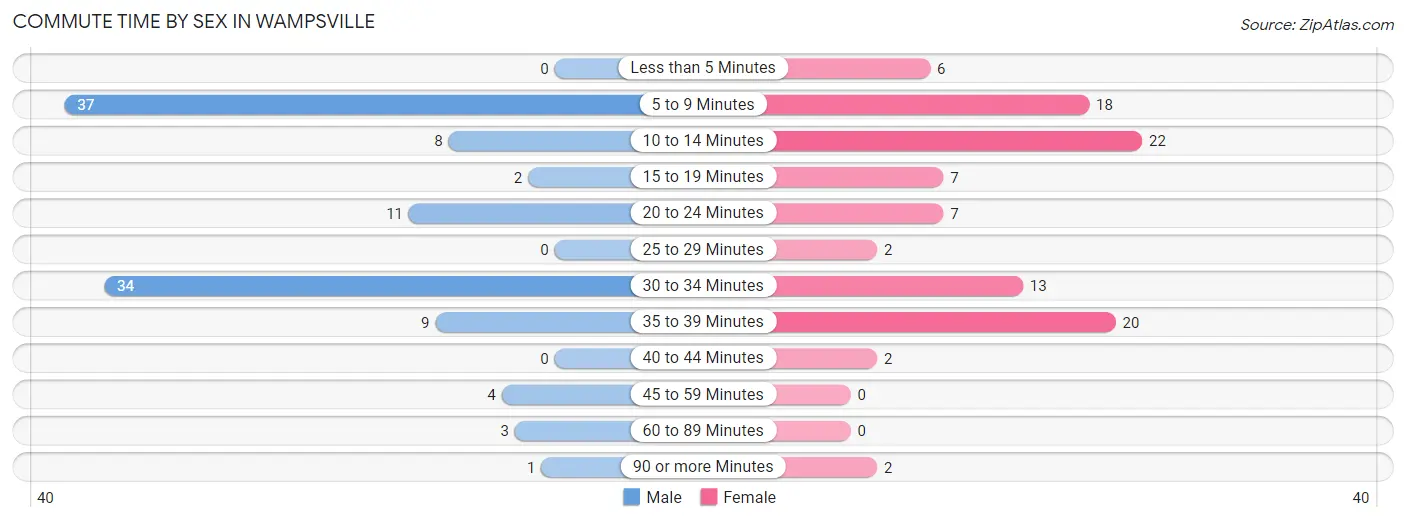
| Commute Time | Male | Female |
| Less than 5 Minutes | 0 (0.0%) | 6 (6.1%) |
| 5 to 9 Minutes | 37 (33.9%) | 18 (18.2%) |
| 10 to 14 Minutes | 8 (7.3%) | 22 (22.2%) |
| 15 to 19 Minutes | 2 (1.8%) | 7 (7.1%) |
| 20 to 24 Minutes | 11 (10.1%) | 7 (7.1%) |
| 25 to 29 Minutes | 0 (0.0%) | 2 (2.0%) |
| 30 to 34 Minutes | 34 (31.2%) | 13 (13.1%) |
| 35 to 39 Minutes | 9 (8.3%) | 20 (20.2%) |
| 40 to 44 Minutes | 0 (0.0%) | 2 (2.0%) |
| 45 to 59 Minutes | 4 (3.7%) | 0 (0.0%) |
| 60 to 89 Minutes | 3 (2.8%) | 0 (0.0%) |
| 90 or more Minutes | 1 (0.9%) | 2 (2.0%) |
Time of Departure to Work by Sex in Wampsville
The most frequent times of departure to work in Wampsville are 5:00 AM to 5:29 AM (17, 15.6%) for males and 8:00 AM to 8:29 AM (22, 22.2%) for females.
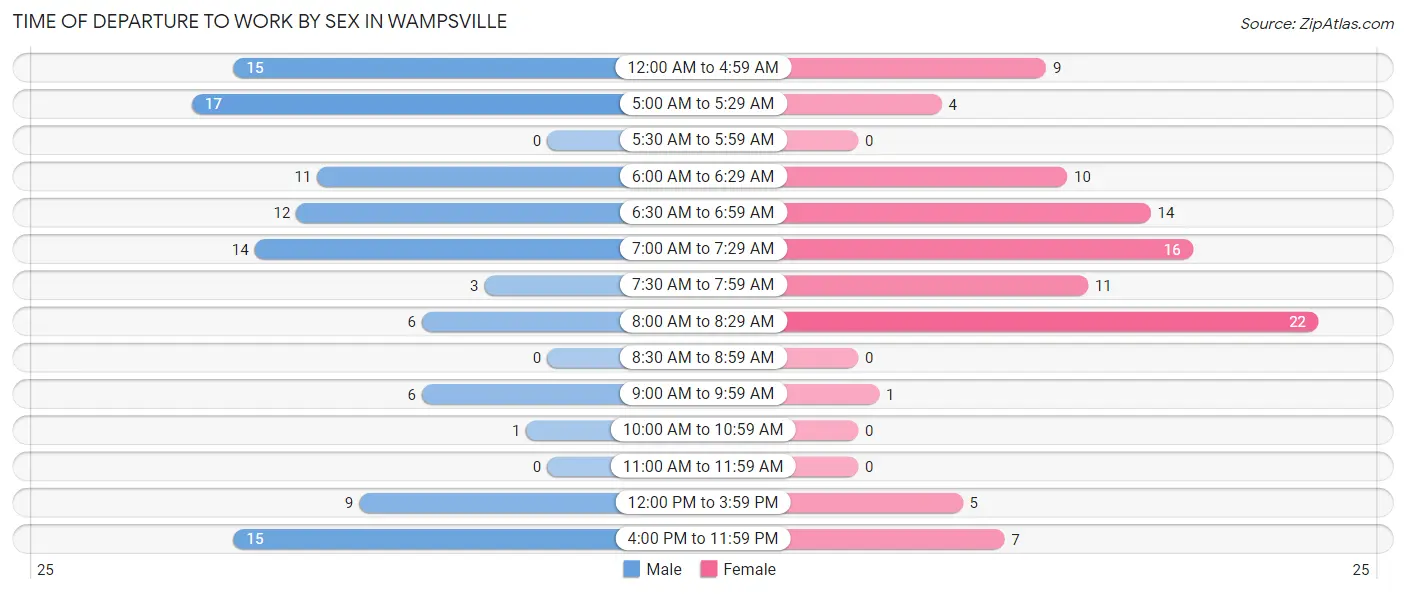
| Time of Departure | Male | Female |
| 12:00 AM to 4:59 AM | 15 (13.8%) | 9 (9.1%) |
| 5:00 AM to 5:29 AM | 17 (15.6%) | 4 (4.0%) |
| 5:30 AM to 5:59 AM | 0 (0.0%) | 0 (0.0%) |
| 6:00 AM to 6:29 AM | 11 (10.1%) | 10 (10.1%) |
| 6:30 AM to 6:59 AM | 12 (11.0%) | 14 (14.1%) |
| 7:00 AM to 7:29 AM | 14 (12.8%) | 16 (16.2%) |
| 7:30 AM to 7:59 AM | 3 (2.8%) | 11 (11.1%) |
| 8:00 AM to 8:29 AM | 6 (5.5%) | 22 (22.2%) |
| 8:30 AM to 8:59 AM | 0 (0.0%) | 0 (0.0%) |
| 9:00 AM to 9:59 AM | 6 (5.5%) | 1 (1.0%) |
| 10:00 AM to 10:59 AM | 1 (0.9%) | 0 (0.0%) |
| 11:00 AM to 11:59 AM | 0 (0.0%) | 0 (0.0%) |
| 12:00 PM to 3:59 PM | 9 (8.3%) | 5 (5.1%) |
| 4:00 PM to 11:59 PM | 15 (13.8%) | 7 (7.1%) |
| Total | 109 (100.0%) | 99 (100.0%) |
Housing Occupancy in Wampsville
Occupancy by Ownership in Wampsville
Of the total 190 dwellings in Wampsville, owner-occupied units account for 184 (96.8%), while renter-occupied units make up 6 (3.2%).
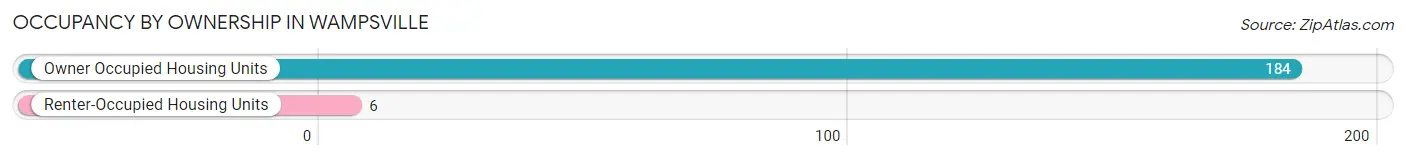
| Occupancy | # Housing Units | % Housing Units |
| Owner Occupied Housing Units | 184 | 96.8% |
| Renter-Occupied Housing Units | 6 | 3.2% |
| Total Occupied Housing Units | 190 | 100.0% |
Occupancy by Household Size in Wampsville
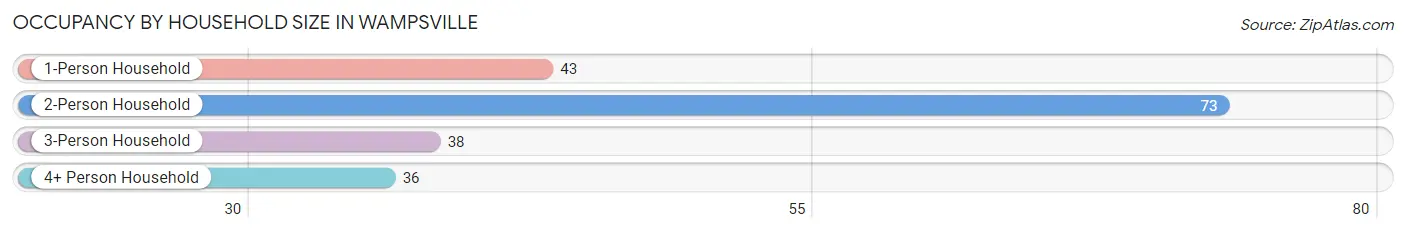
| Household Size | # Housing Units | % Housing Units |
| 1-Person Household | 43 | 22.6% |
| 2-Person Household | 73 | 38.4% |
| 3-Person Household | 38 | 20.0% |
| 4+ Person Household | 36 | 19.0% |
| Total Housing Units | 190 | 100.0% |
Occupancy by Ownership by Household Size in Wampsville
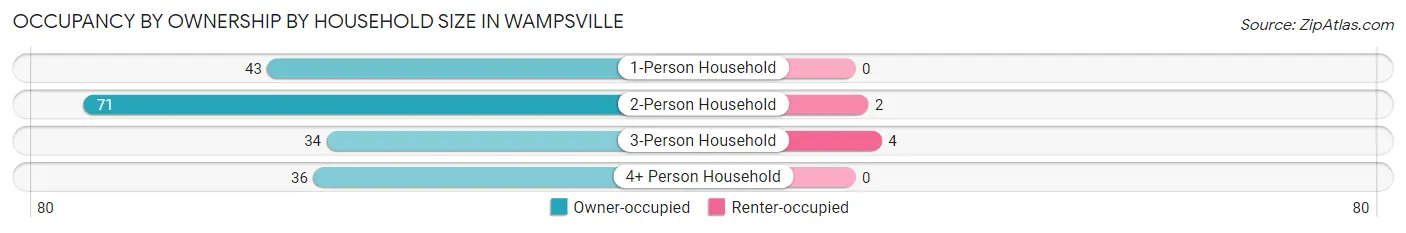
| Household Size | Owner-occupied | Renter-occupied |
| 1-Person Household | 43 (100.0%) | 0 (0.0%) |
| 2-Person Household | 71 (97.3%) | 2 (2.7%) |
| 3-Person Household | 34 (89.5%) | 4 (10.5%) |
| 4+ Person Household | 36 (100.0%) | 0 (0.0%) |
| Total Housing Units | 184 (96.8%) | 6 (3.2%) |
Occupancy by Educational Attainment in Wampsville
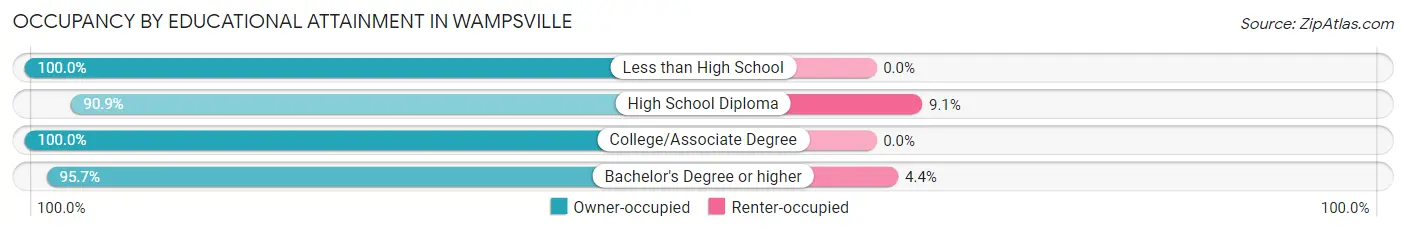
| Household Size | Owner-occupied | Renter-occupied |
| Less than High School | 18 (100.0%) | 0 (0.0%) |
| High School Diploma | 40 (90.9%) | 4 (9.1%) |
| College/Associate Degree | 82 (100.0%) | 0 (0.0%) |
| Bachelor's Degree or higher | 44 (95.7%) | 2 (4.3%) |
Occupancy by Age of Householder in Wampsville
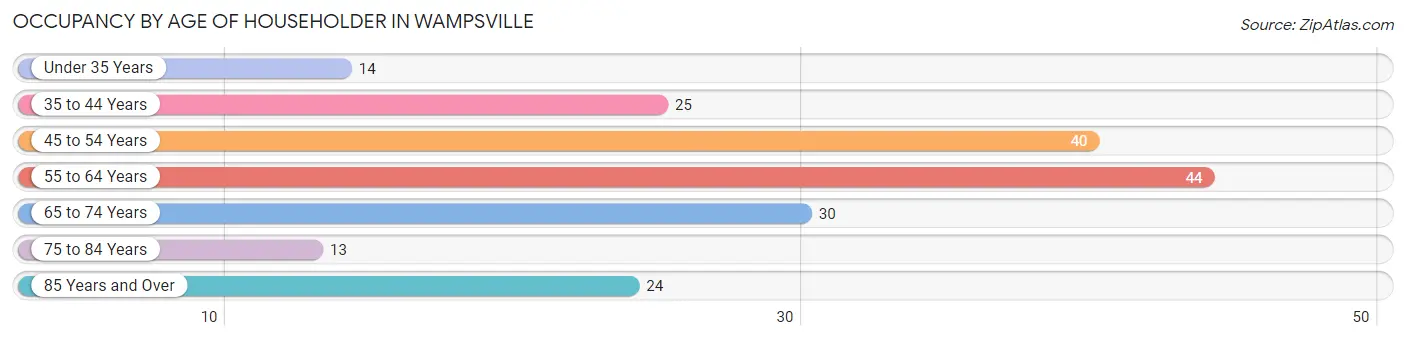
| Age Bracket | # Households | % Households |
| Under 35 Years | 14 | 7.4% |
| 35 to 44 Years | 25 | 13.2% |
| 45 to 54 Years | 40 | 21.0% |
| 55 to 64 Years | 44 | 23.2% |
| 65 to 74 Years | 30 | 15.8% |
| 75 to 84 Years | 13 | 6.8% |
| 85 Years and Over | 24 | 12.6% |
| Total | 190 | 100.0% |
Housing Finances in Wampsville
Median Income by Occupancy in Wampsville
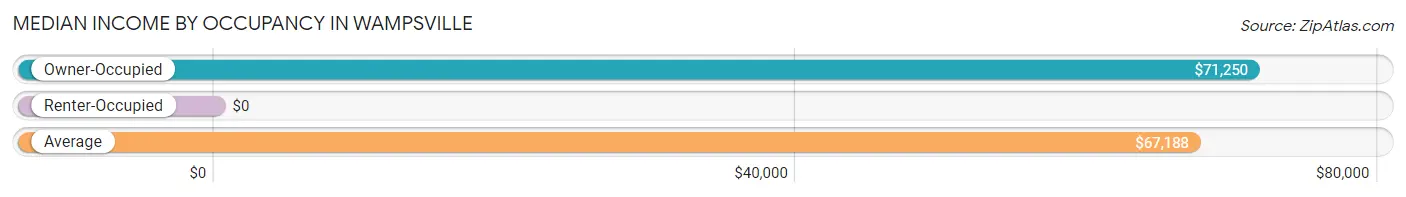
| Occupancy Type | # Households | Median Income |
| Owner-Occupied | 184 (96.8%) | $71,250 |
| Renter-Occupied | 6 (3.2%) | $0 |
| Average | 190 (100.0%) | $67,188 |
Occupancy by Householder Income Bracket in Wampsville
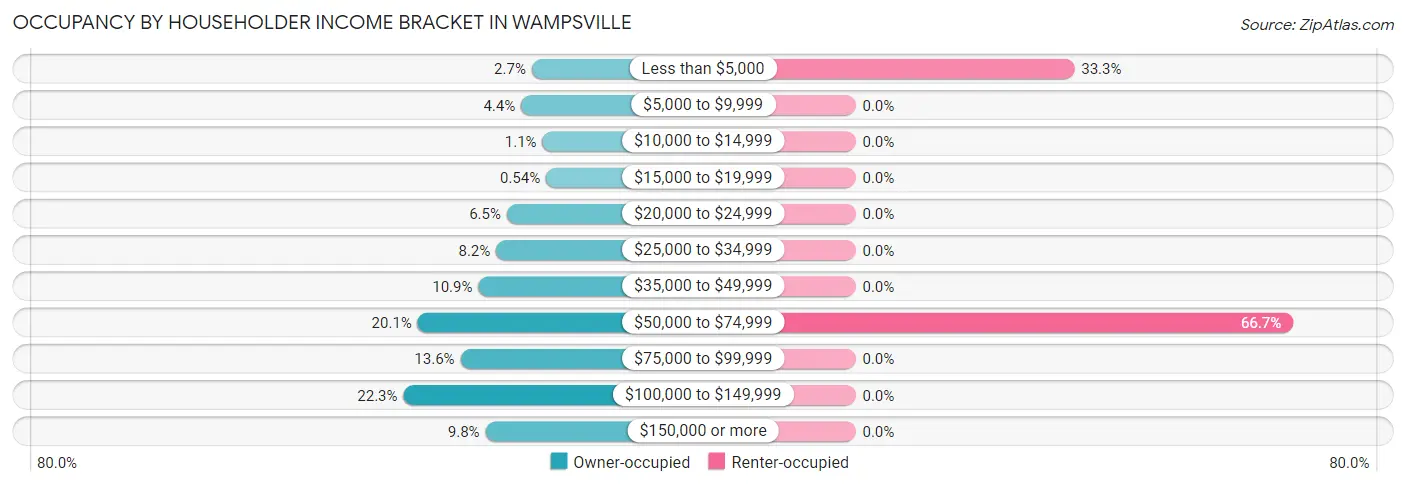
| Income Bracket | Owner-occupied | Renter-occupied |
| Less than $5,000 | 5 (2.7%) | 2 (33.3%) |
| $5,000 to $9,999 | 8 (4.3%) | 0 (0.0%) |
| $10,000 to $14,999 | 2 (1.1%) | 0 (0.0%) |
| $15,000 to $19,999 | 1 (0.5%) | 0 (0.0%) |
| $20,000 to $24,999 | 12 (6.5%) | 0 (0.0%) |
| $25,000 to $34,999 | 15 (8.2%) | 0 (0.0%) |
| $35,000 to $49,999 | 20 (10.9%) | 0 (0.0%) |
| $50,000 to $74,999 | 37 (20.1%) | 4 (66.7%) |
| $75,000 to $99,999 | 25 (13.6%) | 0 (0.0%) |
| $100,000 to $149,999 | 41 (22.3%) | 0 (0.0%) |
| $150,000 or more | 18 (9.8%) | 0 (0.0%) |
| Total | 184 (100.0%) | 6 (100.0%) |
Monthly Housing Cost Tiers in Wampsville
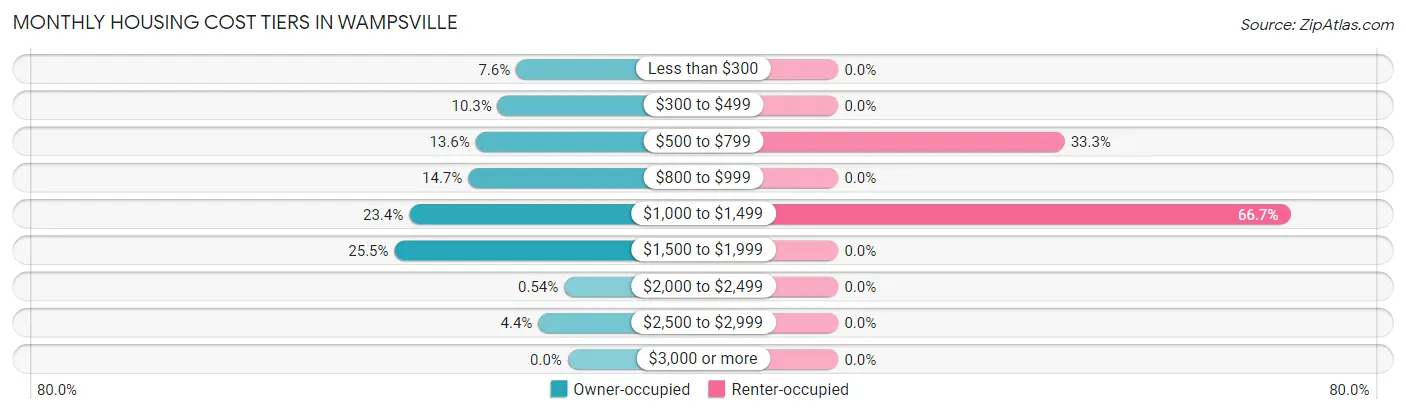
| Monthly Cost | Owner-occupied | Renter-occupied |
| Less than $300 | 14 (7.6%) | 0 (0.0%) |
| $300 to $499 | 19 (10.3%) | 0 (0.0%) |
| $500 to $799 | 25 (13.6%) | 2 (33.3%) |
| $800 to $999 | 27 (14.7%) | 0 (0.0%) |
| $1,000 to $1,499 | 43 (23.4%) | 4 (66.7%) |
| $1,500 to $1,999 | 47 (25.5%) | 0 (0.0%) |
| $2,000 to $2,499 | 1 (0.5%) | 0 (0.0%) |
| $2,500 to $2,999 | 8 (4.3%) | 0 (0.0%) |
| $3,000 or more | 0 (0.0%) | 0 (0.0%) |
| Total | 184 (100.0%) | 6 (100.0%) |
Physical Housing Characteristics in Wampsville
Housing Structures in Wampsville
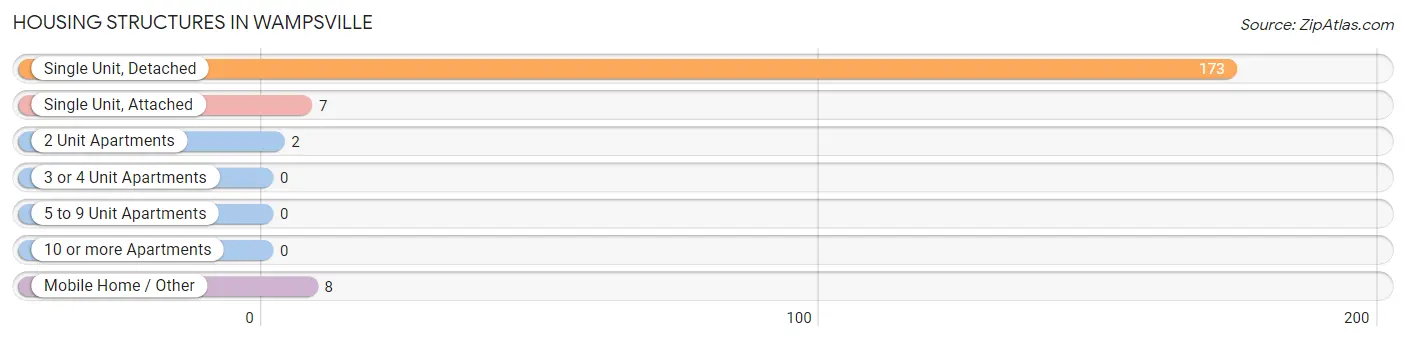
| Structure Type | # Housing Units | % Housing Units |
| Single Unit, Detached | 173 | 91.0% |
| Single Unit, Attached | 7 | 3.7% |
| 2 Unit Apartments | 2 | 1.1% |
| 3 or 4 Unit Apartments | 0 | 0.0% |
| 5 to 9 Unit Apartments | 0 | 0.0% |
| 10 or more Apartments | 0 | 0.0% |
| Mobile Home / Other | 8 | 4.2% |
| Total | 190 | 100.0% |
Housing Structures by Occupancy in Wampsville
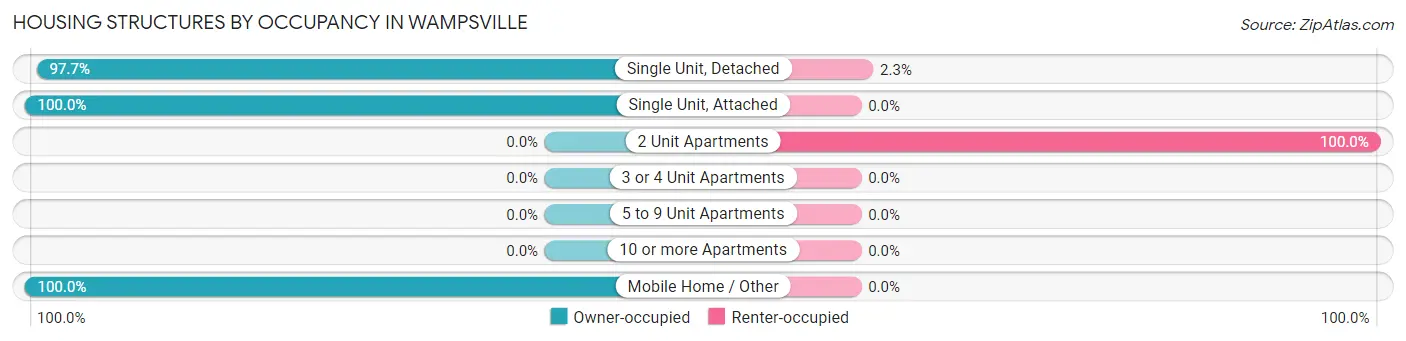
| Structure Type | Owner-occupied | Renter-occupied |
| Single Unit, Detached | 169 (97.7%) | 4 (2.3%) |
| Single Unit, Attached | 7 (100.0%) | 0 (0.0%) |
| 2 Unit Apartments | 0 (0.0%) | 2 (100.0%) |
| 3 or 4 Unit Apartments | 0 (0.0%) | 0 (0.0%) |
| 5 to 9 Unit Apartments | 0 (0.0%) | 0 (0.0%) |
| 10 or more Apartments | 0 (0.0%) | 0 (0.0%) |
| Mobile Home / Other | 8 (100.0%) | 0 (0.0%) |
| Total | 184 (96.8%) | 6 (3.2%) |
Housing Structures by Number of Rooms in Wampsville
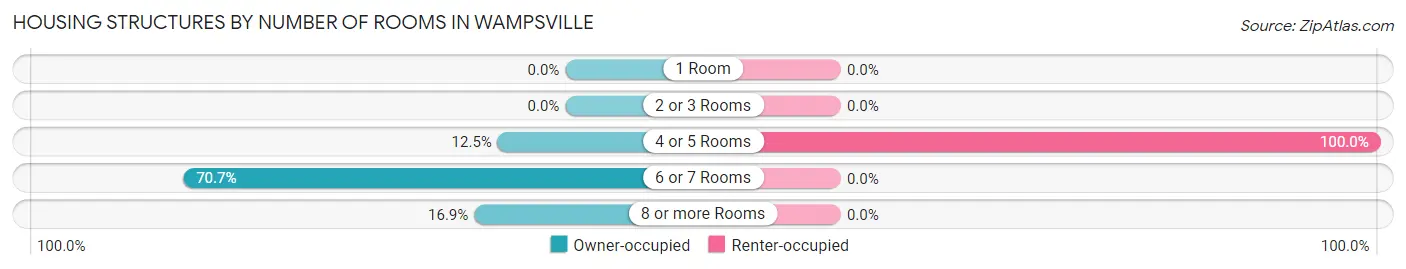
| Number of Rooms | Owner-occupied | Renter-occupied |
| 1 Room | 0 (0.0%) | 0 (0.0%) |
| 2 or 3 Rooms | 0 (0.0%) | 0 (0.0%) |
| 4 or 5 Rooms | 23 (12.5%) | 6 (100.0%) |
| 6 or 7 Rooms | 130 (70.7%) | 0 (0.0%) |
| 8 or more Rooms | 31 (16.9%) | 0 (0.0%) |
| Total | 184 (100.0%) | 6 (100.0%) |
Housing Structure by Heating Type in Wampsville
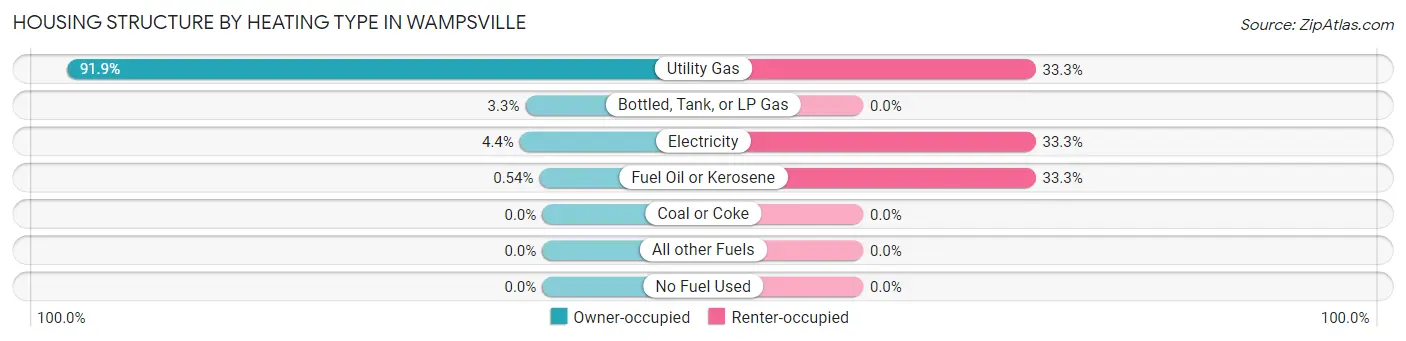
| Heating Type | Owner-occupied | Renter-occupied |
| Utility Gas | 169 (91.8%) | 2 (33.3%) |
| Bottled, Tank, or LP Gas | 6 (3.3%) | 0 (0.0%) |
| Electricity | 8 (4.3%) | 2 (33.3%) |
| Fuel Oil or Kerosene | 1 (0.5%) | 2 (33.3%) |
| Coal or Coke | 0 (0.0%) | 0 (0.0%) |
| All other Fuels | 0 (0.0%) | 0 (0.0%) |
| No Fuel Used | 0 (0.0%) | 0 (0.0%) |
| Total | 184 (100.0%) | 6 (100.0%) |
Household Vehicle Usage in Wampsville
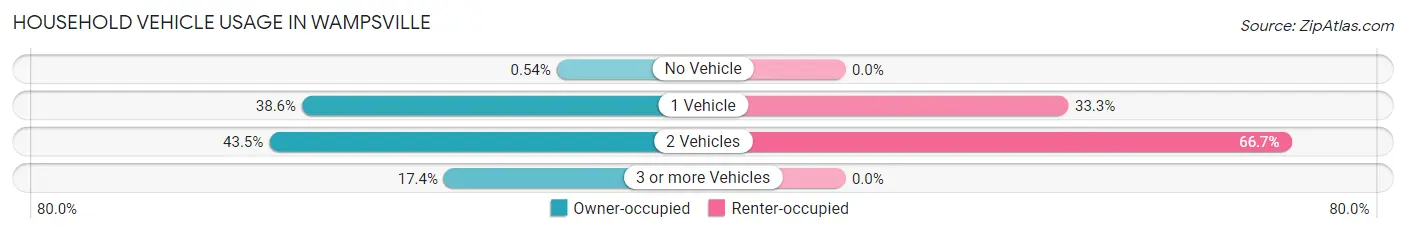
| Vehicles per Household | Owner-occupied | Renter-occupied |
| No Vehicle | 1 (0.5%) | 0 (0.0%) |
| 1 Vehicle | 71 (38.6%) | 2 (33.3%) |
| 2 Vehicles | 80 (43.5%) | 4 (66.7%) |
| 3 or more Vehicles | 32 (17.4%) | 0 (0.0%) |
| Total | 184 (100.0%) | 6 (100.0%) |
Real Estate & Mortgages in Wampsville
Real Estate and Mortgage Overview in Wampsville
| Characteristic | Without Mortgage | With Mortgage |
| Housing Units | 68 | 116 |
| Median Property Value | $156,300 | $141,200 |
| Median Household Income | $67,500 | $9 |
| Monthly Housing Costs | $517 | $0 |
| Real Estate Taxes | $2,900 | $0 |
Property Value by Mortgage Status in Wampsville
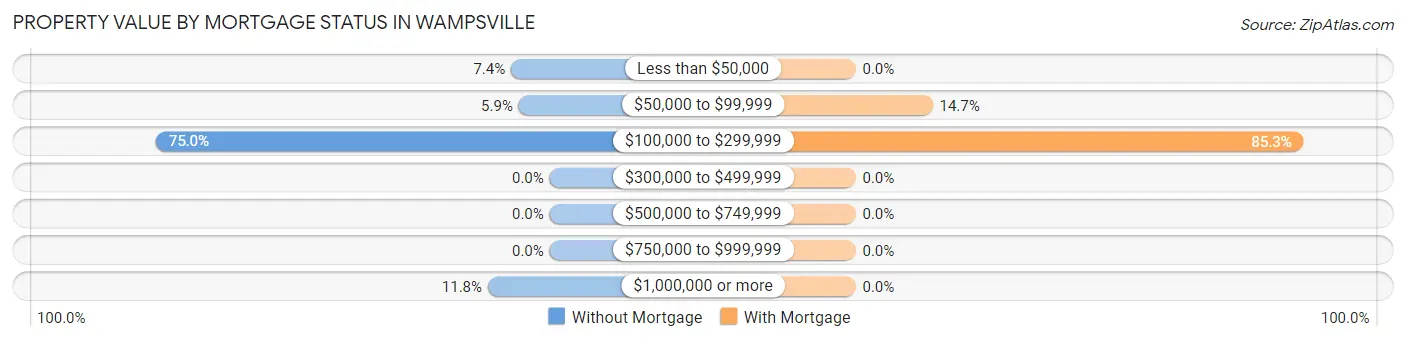
| Property Value | Without Mortgage | With Mortgage |
| Less than $50,000 | 5 (7.3%) | 0 (0.0%) |
| $50,000 to $99,999 | 4 (5.9%) | 17 (14.7%) |
| $100,000 to $299,999 | 51 (75.0%) | 99 (85.3%) |
| $300,000 to $499,999 | 0 (0.0%) | 0 (0.0%) |
| $500,000 to $749,999 | 0 (0.0%) | 0 (0.0%) |
| $750,000 to $999,999 | 0 (0.0%) | 0 (0.0%) |
| $1,000,000 or more | 8 (11.8%) | 0 (0.0%) |
| Total | 68 (100.0%) | 116 (100.0%) |
Household Income by Mortgage Status in Wampsville
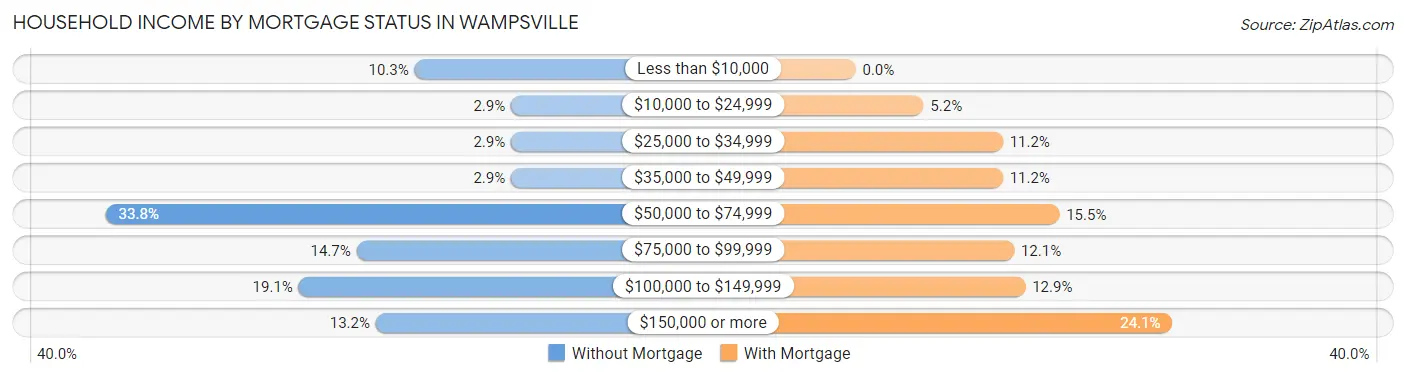
| Household Income | Without Mortgage | With Mortgage |
| Less than $10,000 | 7 (10.3%) | 0 (0.0%) |
| $10,000 to $24,999 | 2 (2.9%) | 6 (5.2%) |
| $25,000 to $34,999 | 2 (2.9%) | 13 (11.2%) |
| $35,000 to $49,999 | 2 (2.9%) | 13 (11.2%) |
| $50,000 to $74,999 | 23 (33.8%) | 18 (15.5%) |
| $75,000 to $99,999 | 10 (14.7%) | 14 (12.1%) |
| $100,000 to $149,999 | 13 (19.1%) | 15 (12.9%) |
| $150,000 or more | 9 (13.2%) | 28 (24.1%) |
| Total | 68 (100.0%) | 116 (100.0%) |
Property Value to Household Income Ratio in Wampsville
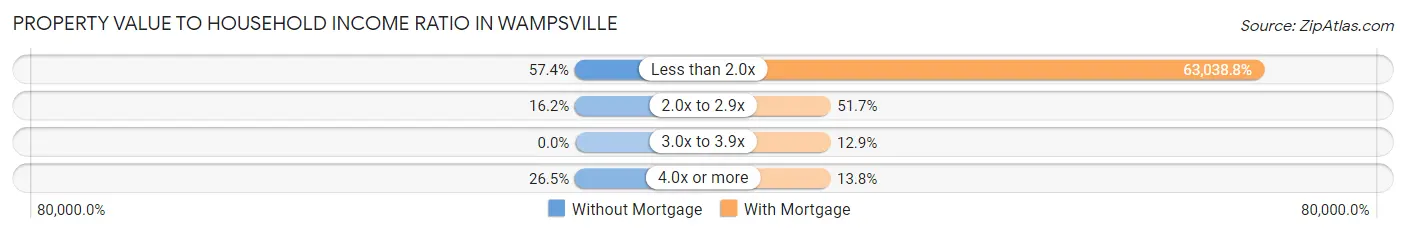
| Value-to-Income Ratio | Without Mortgage | With Mortgage |
| Less than 2.0x | 39 (57.4%) | 73,125 (63,038.8%) |
| 2.0x to 2.9x | 11 (16.2%) | 60 (51.7%) |
| 3.0x to 3.9x | 0 (0.0%) | 15 (12.9%) |
| 4.0x or more | 18 (26.5%) | 16 (13.8%) |
| Total | 68 (100.0%) | 116 (100.0%) |
Real Estate Taxes by Mortgage Status in Wampsville
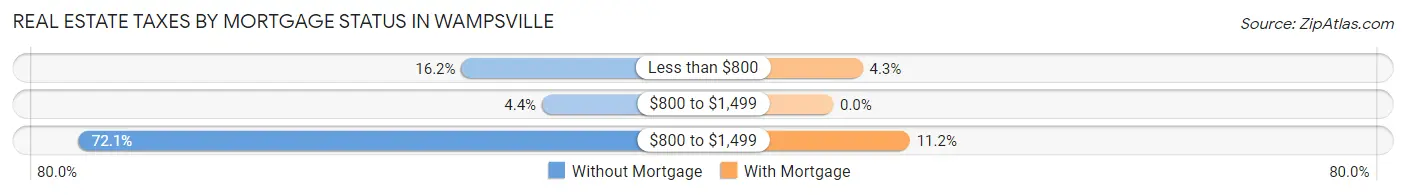
| Property Taxes | Without Mortgage | With Mortgage |
| Less than $800 | 11 (16.2%) | 5 (4.3%) |
| $800 to $1,499 | 3 (4.4%) | 0 (0.0%) |
| $800 to $1,499 | 49 (72.1%) | 13 (11.2%) |
| Total | 68 (100.0%) | 116 (100.0%) |
Health & Disability in Wampsville
Health Insurance Coverage by Age in Wampsville
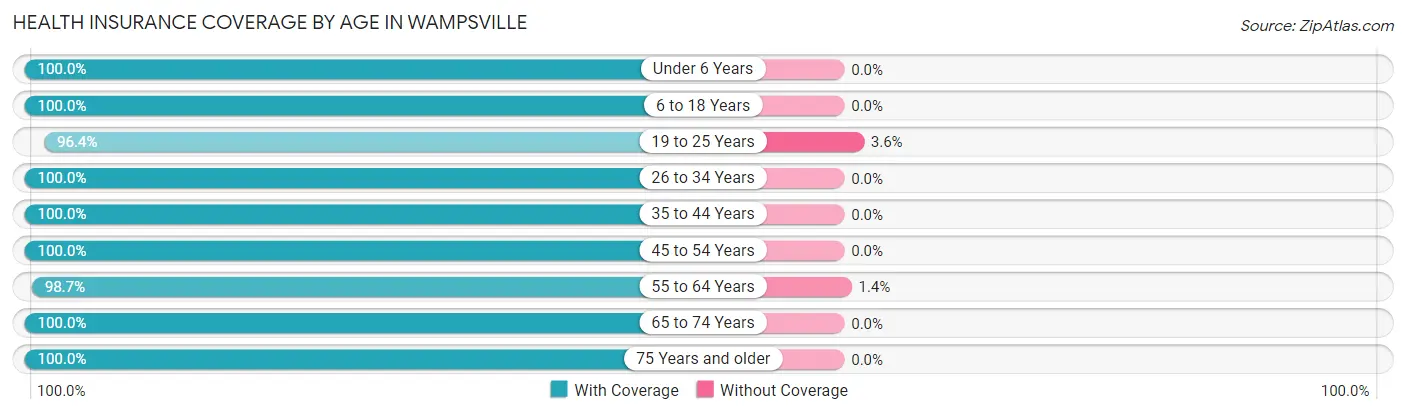
| Age Bracket | With Coverage | Without Coverage |
| Under 6 Years | 12 (100.0%) | 0 (0.0%) |
| 6 to 18 Years | 91 (100.0%) | 0 (0.0%) |
| 19 to 25 Years | 53 (96.4%) | 2 (3.6%) |
| 26 to 34 Years | 24 (100.0%) | 0 (0.0%) |
| 35 to 44 Years | 46 (100.0%) | 0 (0.0%) |
| 45 to 54 Years | 99 (100.0%) | 0 (0.0%) |
| 55 to 64 Years | 73 (98.7%) | 1 (1.3%) |
| 65 to 74 Years | 56 (100.0%) | 0 (0.0%) |
| 75 Years and older | 64 (100.0%) | 0 (0.0%) |
| Total | 518 (99.4%) | 3 (0.6%) |
Health Insurance Coverage by Citizenship Status in Wampsville
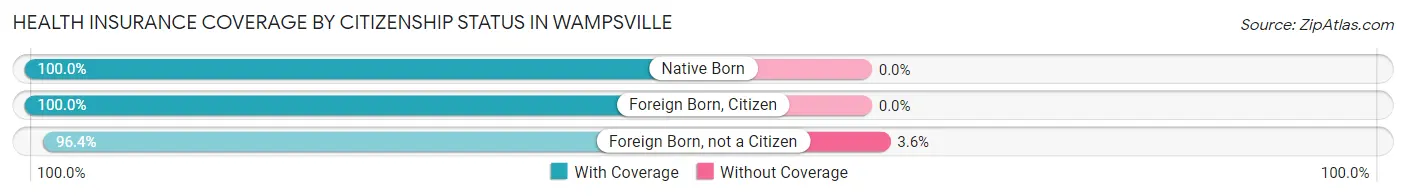
| Citizenship Status | With Coverage | Without Coverage |
| Native Born | 12 (100.0%) | 0 (0.0%) |
| Foreign Born, Citizen | 91 (100.0%) | 0 (0.0%) |
| Foreign Born, not a Citizen | 53 (96.4%) | 2 (3.6%) |
Health Insurance Coverage by Household Income in Wampsville
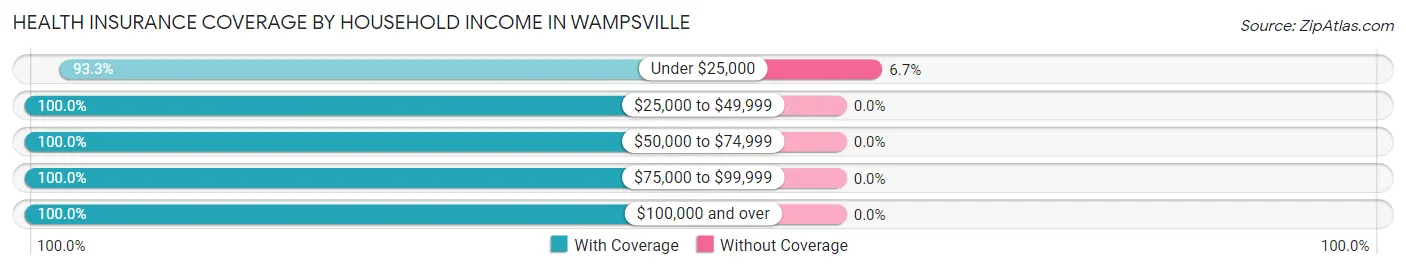
| Household Income | With Coverage | Without Coverage |
| Under $25,000 | 42 (93.3%) | 3 (6.7%) |
| $25,000 to $49,999 | 77 (100.0%) | 0 (0.0%) |
| $50,000 to $74,999 | 82 (100.0%) | 0 (0.0%) |
| $75,000 to $99,999 | 75 (100.0%) | 0 (0.0%) |
| $100,000 and over | 242 (100.0%) | 0 (0.0%) |
Public vs Private Health Insurance Coverage by Age in Wampsville
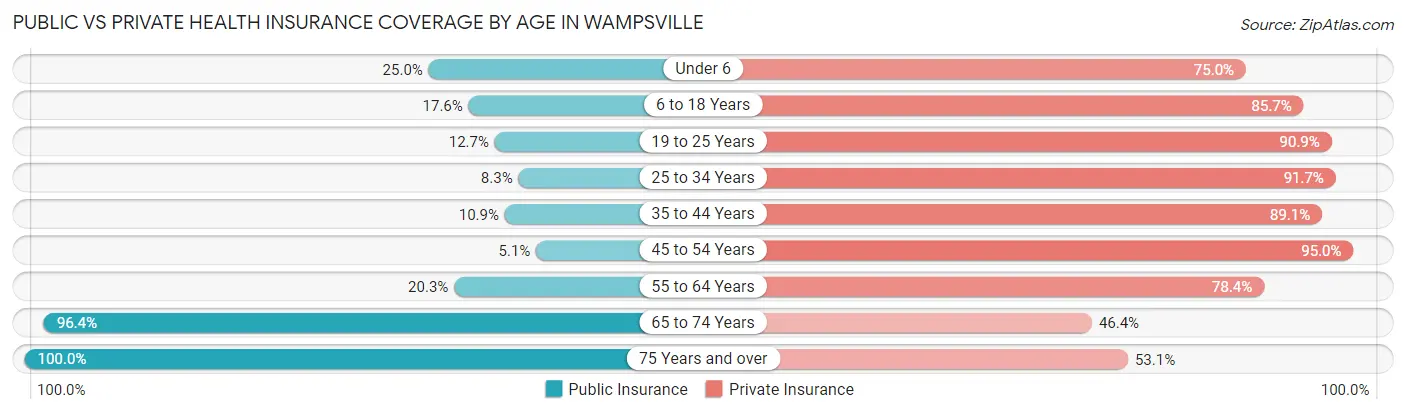
| Age Bracket | Public Insurance | Private Insurance |
| Under 6 | 3 (25.0%) | 9 (75.0%) |
| 6 to 18 Years | 16 (17.6%) | 78 (85.7%) |
| 19 to 25 Years | 7 (12.7%) | 50 (90.9%) |
| 25 to 34 Years | 2 (8.3%) | 22 (91.7%) |
| 35 to 44 Years | 5 (10.9%) | 41 (89.1%) |
| 45 to 54 Years | 5 (5.1%) | 94 (95.0%) |
| 55 to 64 Years | 15 (20.3%) | 58 (78.4%) |
| 65 to 74 Years | 54 (96.4%) | 26 (46.4%) |
| 75 Years and over | 64 (100.0%) | 34 (53.1%) |
| Total | 171 (32.8%) | 412 (79.1%) |
Disability Status by Sex by Age in Wampsville

| Age Bracket | Male | Female |
| Under 5 Years | 0 (0.0%) | 0 (0.0%) |
| 5 to 17 Years | 3 (12.0%) | 3 (5.7%) |
| 18 to 34 Years | 6 (12.0%) | 3 (7.1%) |
| 35 to 64 Years | 11 (12.6%) | 12 (9.1%) |
| 65 to 74 Years | 3 (9.1%) | 2 (8.7%) |
| 75 Years and over | 16 (50.0%) | 16 (50.0%) |
Disability Class by Sex by Age in Wampsville
Disability Class: Hearing Difficulty
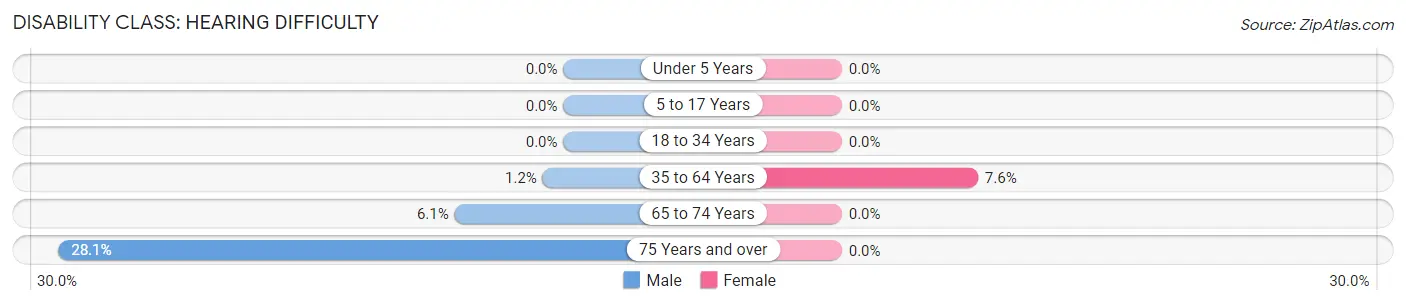
| Age Bracket | Male | Female |
| Under 5 Years | 0 (0.0%) | 0 (0.0%) |
| 5 to 17 Years | 0 (0.0%) | 0 (0.0%) |
| 18 to 34 Years | 0 (0.0%) | 0 (0.0%) |
| 35 to 64 Years | 1 (1.1%) | 10 (7.6%) |
| 65 to 74 Years | 2 (6.1%) | 0 (0.0%) |
| 75 Years and over | 9 (28.1%) | 0 (0.0%) |
Disability Class: Vision Difficulty
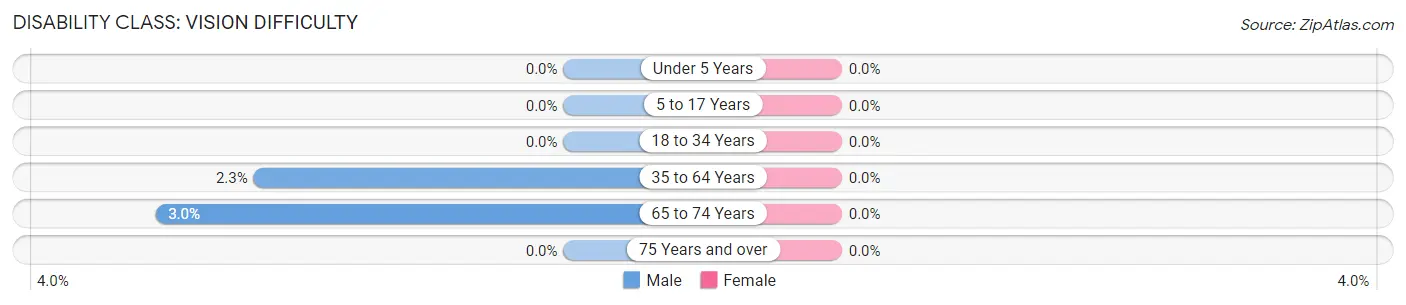
| Age Bracket | Male | Female |
| Under 5 Years | 0 (0.0%) | 0 (0.0%) |
| 5 to 17 Years | 0 (0.0%) | 0 (0.0%) |
| 18 to 34 Years | 0 (0.0%) | 0 (0.0%) |
| 35 to 64 Years | 2 (2.3%) | 0 (0.0%) |
| 65 to 74 Years | 1 (3.0%) | 0 (0.0%) |
| 75 Years and over | 0 (0.0%) | 0 (0.0%) |
Disability Class: Cognitive Difficulty
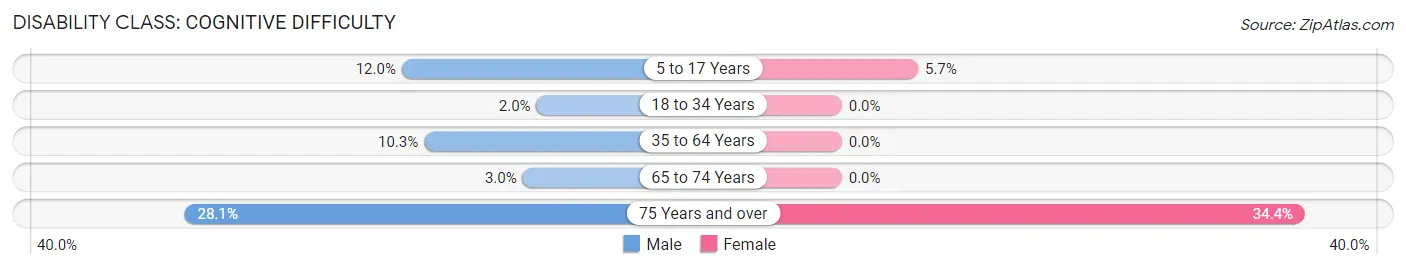
| Age Bracket | Male | Female |
| 5 to 17 Years | 3 (12.0%) | 3 (5.7%) |
| 18 to 34 Years | 1 (2.0%) | 0 (0.0%) |
| 35 to 64 Years | 9 (10.3%) | 0 (0.0%) |
| 65 to 74 Years | 1 (3.0%) | 0 (0.0%) |
| 75 Years and over | 9 (28.1%) | 11 (34.4%) |
Disability Class: Ambulatory Difficulty
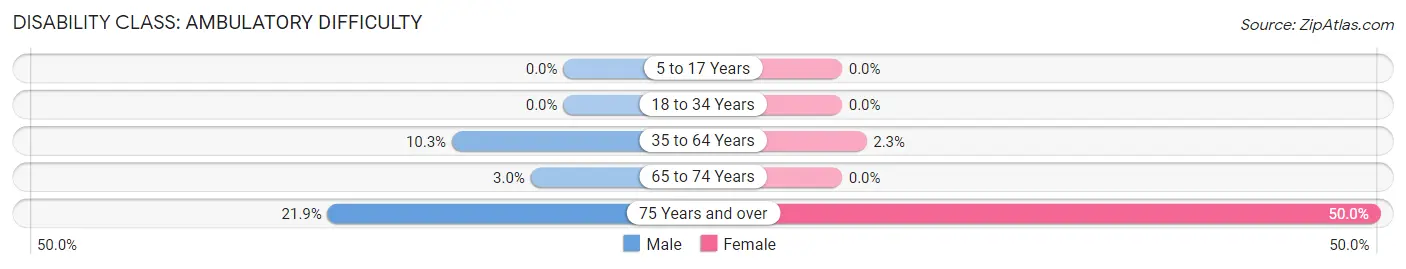
| Age Bracket | Male | Female |
| 5 to 17 Years | 0 (0.0%) | 0 (0.0%) |
| 18 to 34 Years | 0 (0.0%) | 0 (0.0%) |
| 35 to 64 Years | 9 (10.3%) | 3 (2.3%) |
| 65 to 74 Years | 1 (3.0%) | 0 (0.0%) |
| 75 Years and over | 7 (21.9%) | 16 (50.0%) |
Disability Class: Self-Care Difficulty
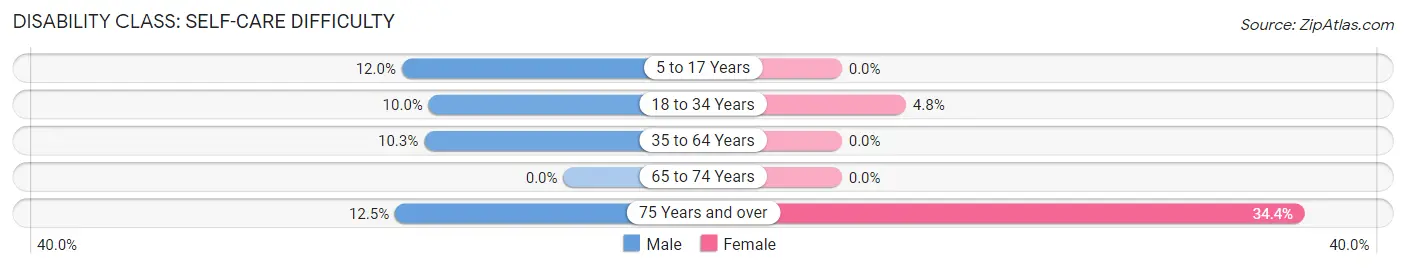
| Age Bracket | Male | Female |
| 5 to 17 Years | 3 (12.0%) | 0 (0.0%) |
| 18 to 34 Years | 5 (10.0%) | 2 (4.8%) |
| 35 to 64 Years | 9 (10.3%) | 0 (0.0%) |
| 65 to 74 Years | 0 (0.0%) | 0 (0.0%) |
| 75 Years and over | 4 (12.5%) | 11 (34.4%) |
Technology Access in Wampsville
Computing Device Access in Wampsville
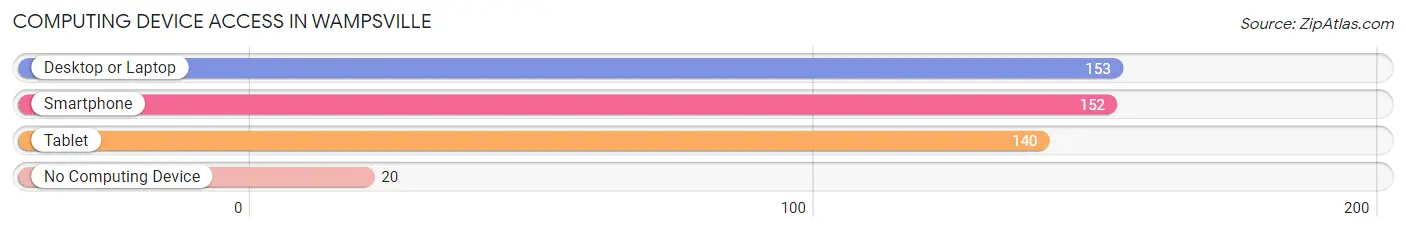
| Device Type | # Households | % Households |
| Desktop or Laptop | 153 | 80.5% |
| Smartphone | 152 | 80.0% |
| Tablet | 140 | 73.7% |
| No Computing Device | 20 | 10.5% |
| Total | 190 | 100.0% |
Internet Access in Wampsville
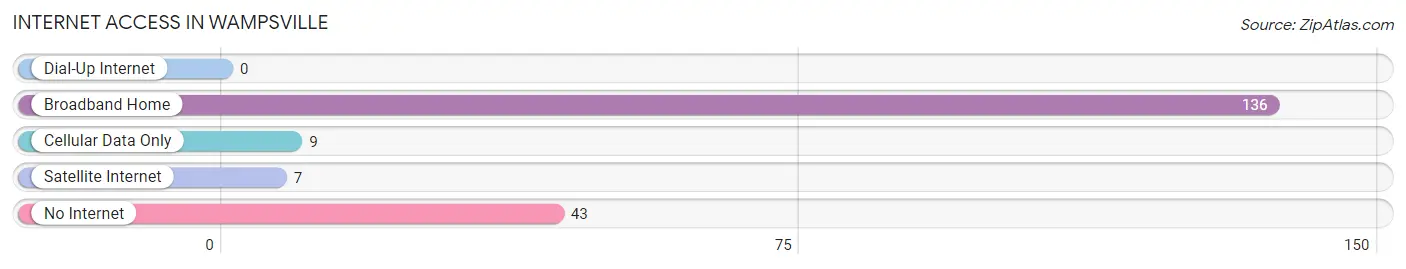
| Internet Type | # Households | % Households |
| Dial-Up Internet | 0 | 0.0% |
| Broadband Home | 136 | 71.6% |
| Cellular Data Only | 9 | 4.7% |
| Satellite Internet | 7 | 3.7% |
| No Internet | 43 | 22.6% |
| Total | 190 | 100.0% |
Wampsville Summary
Wampsville is a small village located in Madison County, New York. It is situated on the banks of the Oneida River, about 10 miles east of the city of Syracuse. The village has a population of about 1,000 people and is part of the larger town of Lenox.
History
The area that is now Wampsville was originally inhabited by the Oneida Nation, a Native American tribe. The first European settlers arrived in the area in the late 1700s, and the village was officially established in 1807. The village was named after the Wampanoag tribe, which had a settlement nearby.
The village grew slowly over the next few decades, and by the mid-1800s it had become a thriving agricultural community. The village was home to several mills, including a grist mill, a saw mill, and a woolen mill. The village also had a blacksmith shop, a general store, and a post office.
In the late 1800s, the village began to decline as the local economy shifted away from agriculture. The mills closed and the population began to decline. By the early 1900s, the village was largely abandoned.
In the 1950s, the village was revitalized when the state of New York began to build a new prison in the area. The prison, which is now known as the Madison Correctional Facility, opened in 1959 and has been a major employer in the area ever since.
Geography
Wampsville is located in the Finger Lakes region of New York, about 10 miles east of Syracuse. The village is situated on the banks of the Oneida River, which flows through the area. The village is surrounded by rolling hills and farmland.
The climate in Wampsville is typical of the Finger Lakes region, with cold winters and warm summers. The average annual temperature is around 50 degrees Fahrenheit.
Economy
The economy of Wampsville is largely based on the Madison Correctional Facility, which is the largest employer in the area. The prison employs over 500 people and provides a significant boost to the local economy.
In addition to the prison, the village is home to several small businesses, including a grocery store, a hardware store, and a few restaurants. The village also has a few small manufacturing companies.
Demographics
As of the 2010 census, the population of Wampsville was 1,000 people. The racial makeup of the village was 95.2% White, 1.2% African American, 0.7% Native American, 0.7% Asian, and 2.2% from other races.
The median household income in Wampsville was $41,250, and the median family income was $50,000. The per capita income was $20,000. About 10.2% of the population was below the poverty line.
Conclusion
Wampsville is a small village located in Madison County, New York. It is situated on the banks of the Oneida River, about 10 miles east of the city of Syracuse. The village has a population of about 1,000 people and is part of the larger town of Lenox. The economy of Wampsville is largely based on the Madison Correctional Facility, which is the largest employer in the area. The village is also home to several small businesses, including a grocery store, a hardware store, and a few restaurants. The racial makeup of the village is 95.2% White, 1.2% African American, 0.7% Native American, 0.7% Asian, and 2.2% from other races. The median household income in Wampsville was $41,250, and the median family income was $50,000.
Common Questions
What is Per Capita Income in Wampsville?
Per Capita income in Wampsville is $27,127.
What is the Median Family Income in Wampsville?
Median Family Income in Wampsville is $90,500.
What is the Median Household income in Wampsville?
Median Household Income in Wampsville is $67,188.
What is Income or Wage Gap in Wampsville?
Income or Wage Gap in Wampsville is 27.0%.
Women in Wampsville earn 73.0 cents for every dollar earned by a man.
What is Inequality or Gini Index in Wampsville?
Inequality or Gini Index in Wampsville is 0.35.
What is the Total Population of Wampsville?
Total Population of Wampsville is 590.
What is the Total Male Population of Wampsville?
Total Male Population of Wampsville is 273.
What is the Total Female Population of Wampsville?
Total Female Population of Wampsville is 317.
What is the Ratio of Males per 100 Females in Wampsville?
There are 86.12 Males per 100 Females in Wampsville.
What is the Ratio of Females per 100 Males in Wampsville?
There are 116.12 Females per 100 Males in Wampsville.
What is the Median Population Age in Wampsville?
Median Population Age in Wampsville is 48.1 Years.
What is the Average Family Size in Wampsville
Average Family Size in Wampsville is 3.2 People.
What is the Average Household Size in Wampsville
Average Household Size in Wampsville is 2.7 People.
How Large is the Labor Force in Wampsville?
There are 261 People in the Labor Forcein in Wampsville.
What is the Percentage of People in the Labor Force in Wampsville?
50.7% of People are in the Labor Force in Wampsville.
What is the Unemployment Rate in Wampsville?
Unemployment Rate in Wampsville is 3.8%.