Livingston Manor, NY Map & Demographics
Livingston Manor Map
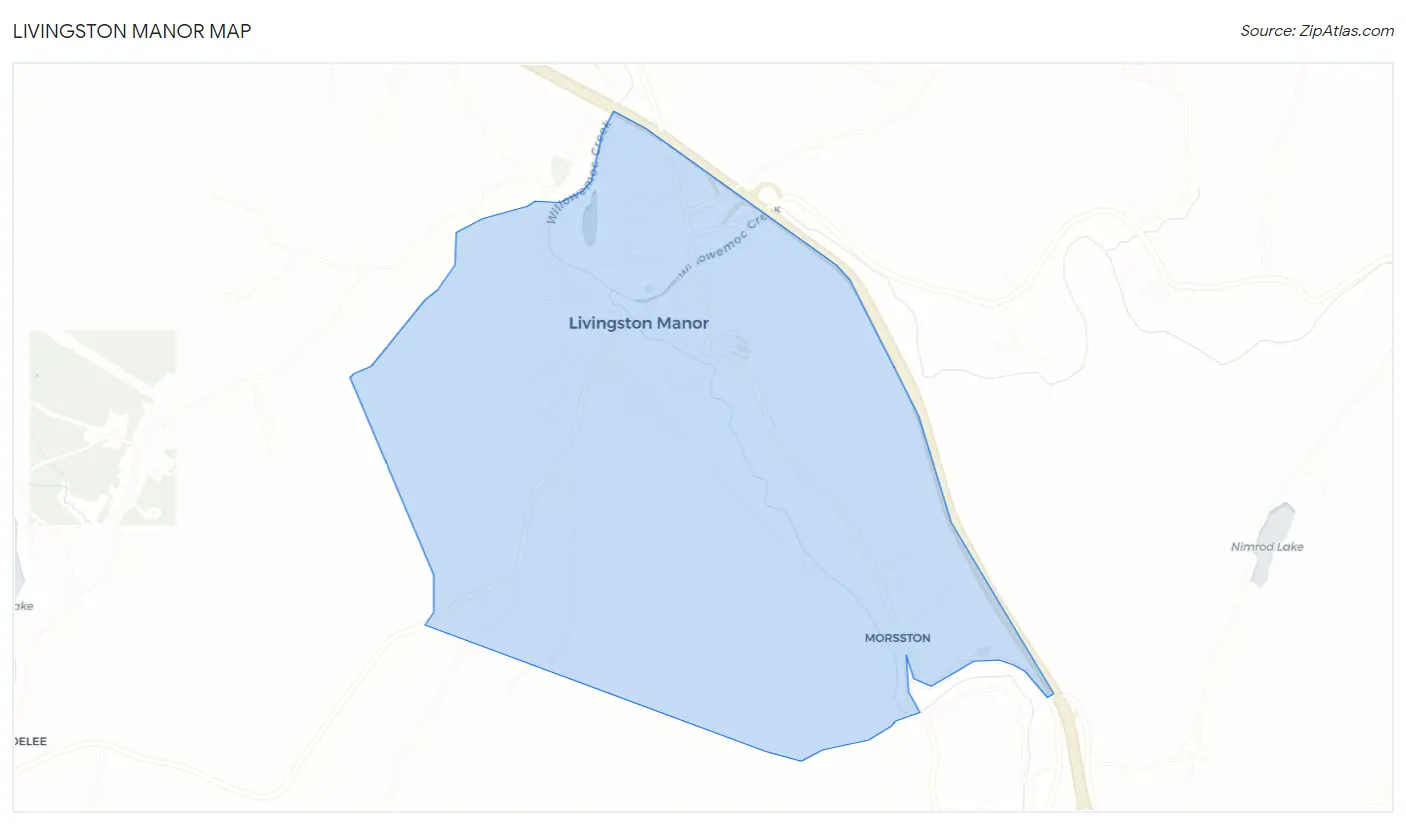
Livingston Manor Overview
$28,733
PER CAPITA INCOME
$76,324
AVG FAMILY INCOME
$50,197
AVG HOUSEHOLD INCOME
0.8%
WAGE / INCOME GAP [ % ]
99.2¢/ $1
WAGE / INCOME GAP [ $ ]
0.43
INEQUALITY / GINI INDEX
863
TOTAL POPULATION
305
MALE POPULATION
558
FEMALE POPULATION
54.66
MALES / 100 FEMALES
182.95
FEMALES / 100 MALES
50.3
MEDIAN AGE
3.1
AVG FAMILY SIZE
2.2
AVG HOUSEHOLD SIZE
389
LABOR FORCE [ PEOPLE ]
60.5%
PERCENT IN LABOR FORCE
Livingston Manor Zip Codes
Income in Livingston Manor
Income Overview in Livingston Manor
Per Capita Income in Livingston Manor is $28,733, while median incomes of families and households are $76,324 and $50,197 respectively.
| Characteristic | Number | Measure |
| Per Capita Income | 863 | $28,733 |
| Median Family Income | 218 | $76,324 |
| Mean Family Income | 218 | $81,718 |
| Median Household Income | 389 | $50,197 |
| Mean Household Income | 389 | $63,297 |
| Income Deficit | 218 | $0 |
| Wage / Income Gap (%) | 863 | 0.81% |
| Wage / Income Gap ($) | 863 | 99.19¢ per $1 |
| Gini / Inequality Index | 863 | 0.43 |
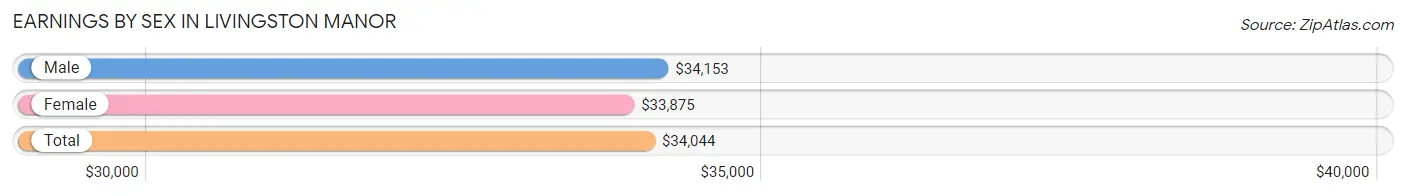
Earnings by Sex in Livingston Manor
Average Earnings in Livingston Manor are $34,044, $34,153 for men and $33,875 for women, a difference of 0.8%.
| Sex | Number | Average Earnings |
| Male | 199 (48.2%) | $34,153 |
| Female | 214 (51.8%) | $33,875 |
| Total | 413 (100.0%) | $34,044 |
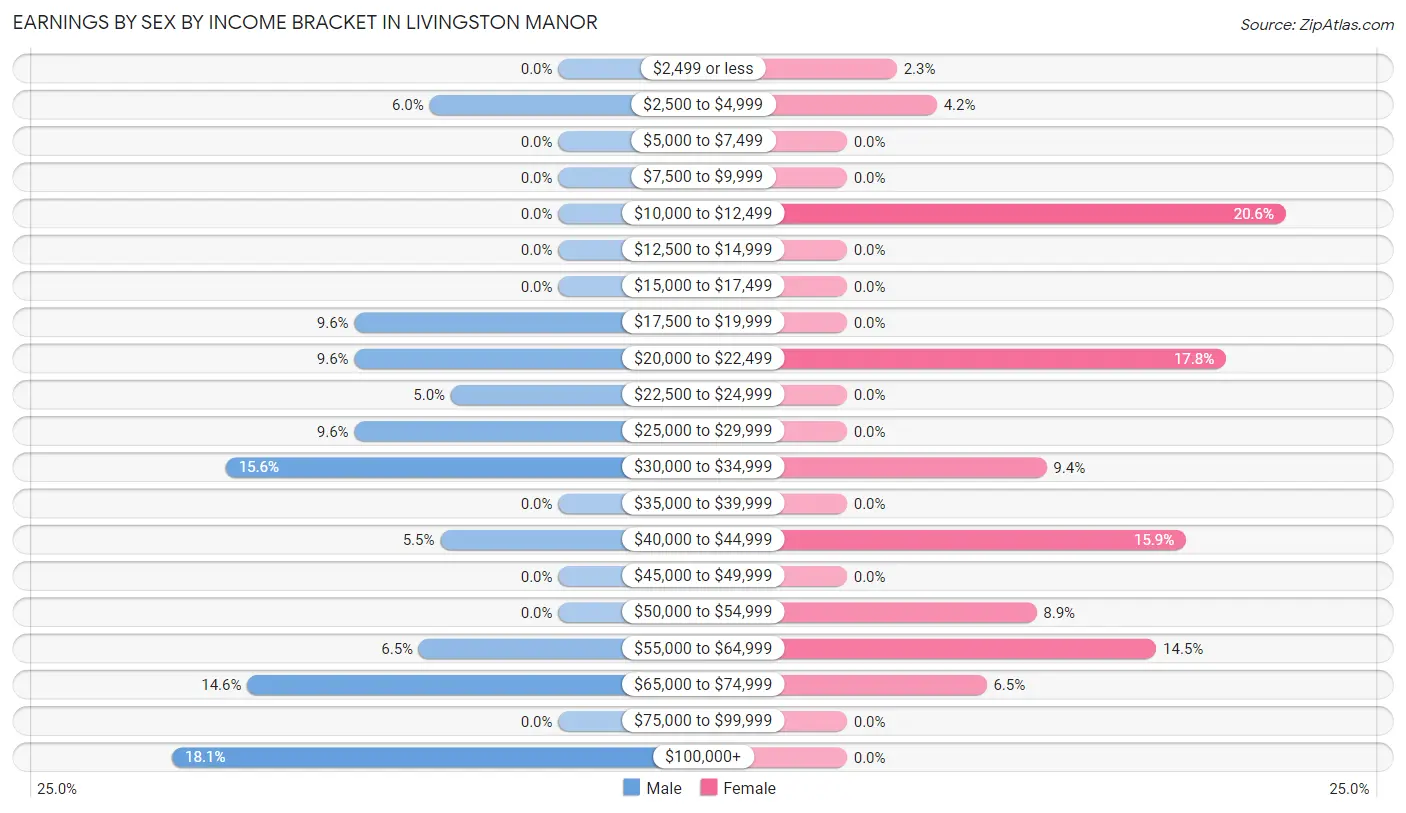
Earnings by Sex by Income Bracket in Livingston Manor
The most common earnings brackets in Livingston Manor are $100,000+ for men (36 | 18.1%) and $10,000 to $12,499 for women (44 | 20.6%).
| Income | Male | Female |
| $2,499 or less | 0 (0.0%) | 5 (2.3%) |
| $2,500 to $4,999 | 12 (6.0%) | 9 (4.2%) |
| $5,000 to $7,499 | 0 (0.0%) | 0 (0.0%) |
| $7,500 to $9,999 | 0 (0.0%) | 0 (0.0%) |
| $10,000 to $12,499 | 0 (0.0%) | 44 (20.6%) |
| $12,500 to $14,999 | 0 (0.0%) | 0 (0.0%) |
| $15,000 to $17,499 | 0 (0.0%) | 0 (0.0%) |
| $17,500 to $19,999 | 19 (9.6%) | 0 (0.0%) |
| $20,000 to $22,499 | 19 (9.6%) | 38 (17.8%) |
| $22,500 to $24,999 | 10 (5.0%) | 0 (0.0%) |
| $25,000 to $29,999 | 19 (9.6%) | 0 (0.0%) |
| $30,000 to $34,999 | 31 (15.6%) | 20 (9.3%) |
| $35,000 to $39,999 | 0 (0.0%) | 0 (0.0%) |
| $40,000 to $44,999 | 11 (5.5%) | 34 (15.9%) |
| $45,000 to $49,999 | 0 (0.0%) | 0 (0.0%) |
| $50,000 to $54,999 | 0 (0.0%) | 19 (8.9%) |
| $55,000 to $64,999 | 13 (6.5%) | 31 (14.5%) |
| $65,000 to $74,999 | 29 (14.6%) | 14 (6.5%) |
| $75,000 to $99,999 | 0 (0.0%) | 0 (0.0%) |
| $100,000+ | 36 (18.1%) | 0 (0.0%) |
| Total | 199 (100.0%) | 214 (100.0%) |
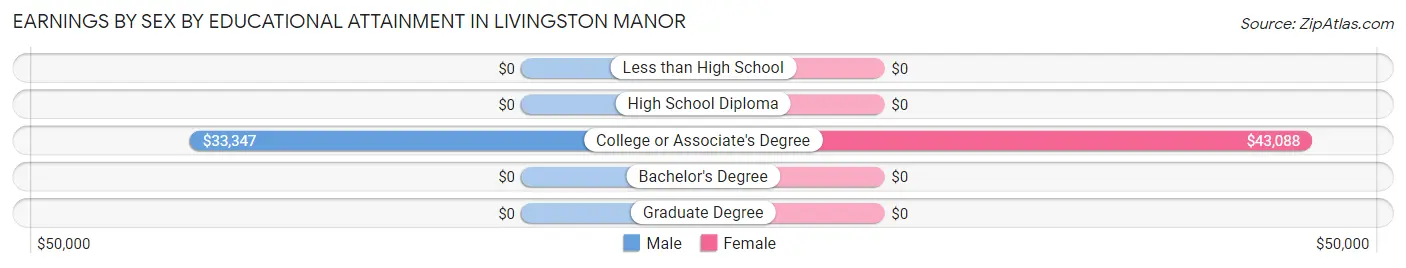
Earnings by Sex by Educational Attainment in Livingston Manor
| Educational Attainment | Male Income | Female Income |
| Less than High School | - | - |
| High School Diploma | - | - |
| College or Associate's Degree | $33,347 | $43,088 |
| Bachelor's Degree | - | - |
| Graduate Degree | - | - |
| Total | - | - |
Family Income in Livingston Manor
Family Income Brackets in Livingston Manor
According to the Livingston Manor family income data, there are 72 families falling into the $100,000 to $149,999 income range, which is the most common income bracket and makes up 33.0% of all families.
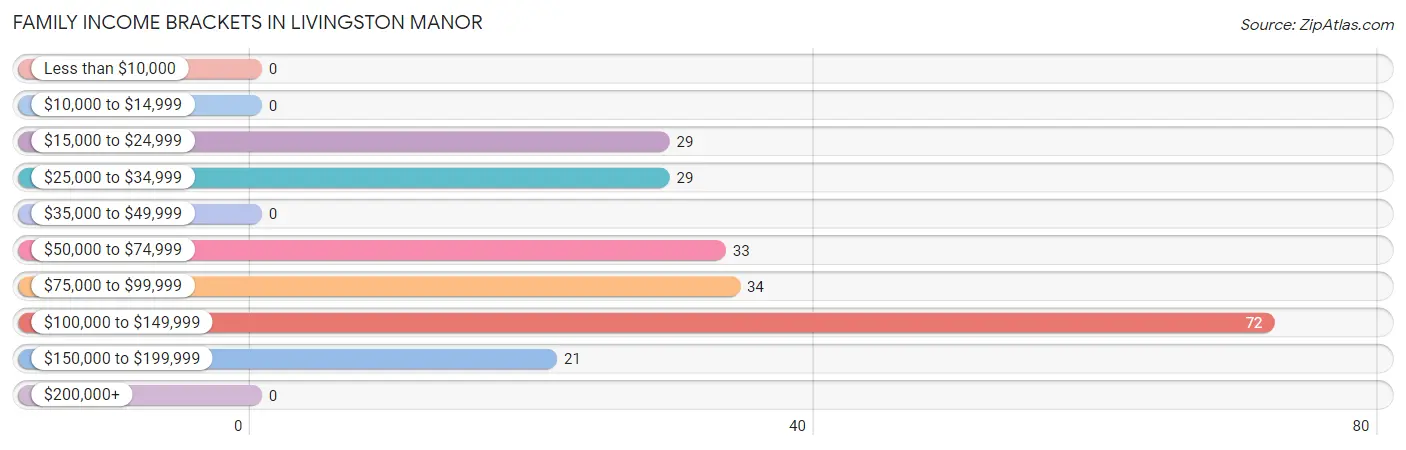
| Income Bracket | # Families | % Families |
| Less than $10,000 | 0 | 0.0% |
| $10,000 to $14,999 | 0 | 0.0% |
| $15,000 to $24,999 | 29 | 13.3% |
| $25,000 to $34,999 | 29 | 13.3% |
| $35,000 to $49,999 | 0 | 0.0% |
| $50,000 to $74,999 | 33 | 15.1% |
| $75,000 to $99,999 | 34 | 15.6% |
| $100,000 to $149,999 | 72 | 33.0% |
| $150,000 to $199,999 | 21 | 9.6% |
| $200,000+ | 0 | 0.0% |
Family Income by Famaliy Size in Livingston Manor
4-person families (49 | 22.5%) account for the highest median family income in Livingston Manor with $100,144 per family, while 4-person families (49 | 22.5%) have the highest median income of $25,036 per family member.
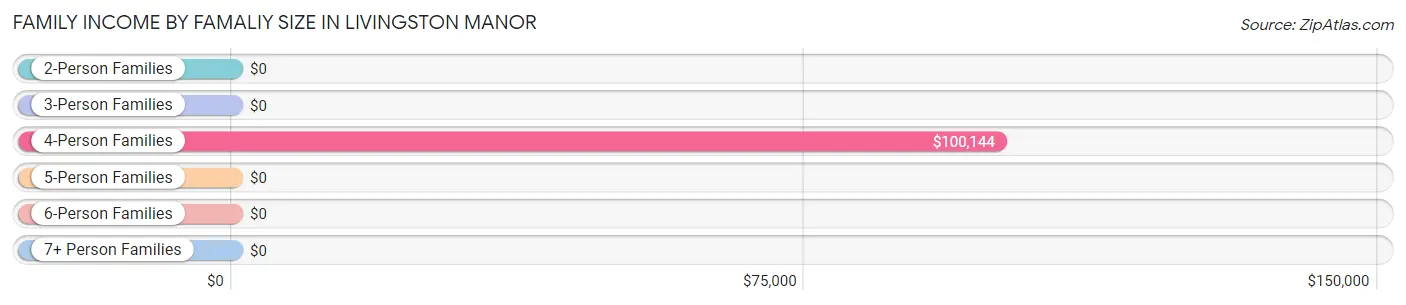
| Income Bracket | # Families | Median Income |
| 2-Person Families | 114 (52.3%) | $0 |
| 3-Person Families | 0 (0.0%) | $0 |
| 4-Person Families | 49 (22.5%) | $100,144 |
| 5-Person Families | 55 (25.2%) | $0 |
| 6-Person Families | 0 (0.0%) | $0 |
| 7+ Person Families | 0 (0.0%) | $0 |
| Total | 218 (100.0%) | $76,324 |
Family Income by Number of Earners in Livingston Manor
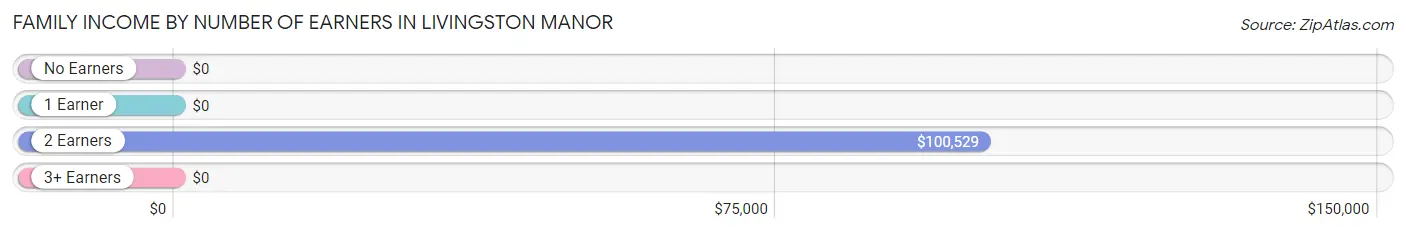
| Number of Earners | # Families | Median Income |
| No Earners | 29 (13.3%) | $0 |
| 1 Earner | 34 (15.6%) | $0 |
| 2 Earners | 145 (66.5%) | $100,529 |
| 3+ Earners | 10 (4.6%) | $0 |
| Total | 218 (100.0%) | $76,324 |
Household Income in Livingston Manor
Household Income Brackets in Livingston Manor
With 71 households falling in the category, the $25,000 to $34,999 income range is the most frequent in Livingston Manor, accounting for 18.2% of all households.
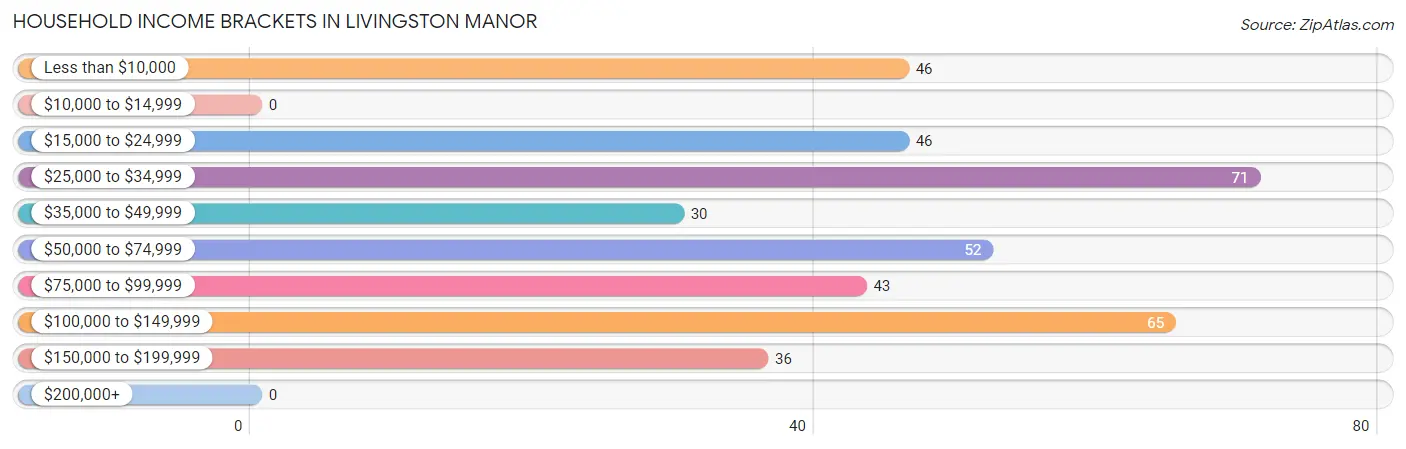
| Income Bracket | # Households | % Households |
| Less than $10,000 | 46 | 11.8% |
| $10,000 to $14,999 | 0 | 0.0% |
| $15,000 to $24,999 | 46 | 11.8% |
| $25,000 to $34,999 | 71 | 18.3% |
| $35,000 to $49,999 | 30 | 7.7% |
| $50,000 to $74,999 | 52 | 13.4% |
| $75,000 to $99,999 | 43 | 11.1% |
| $100,000 to $149,999 | 65 | 16.7% |
| $150,000 to $199,999 | 36 | 9.3% |
| $200,000+ | 0 | 0.0% |
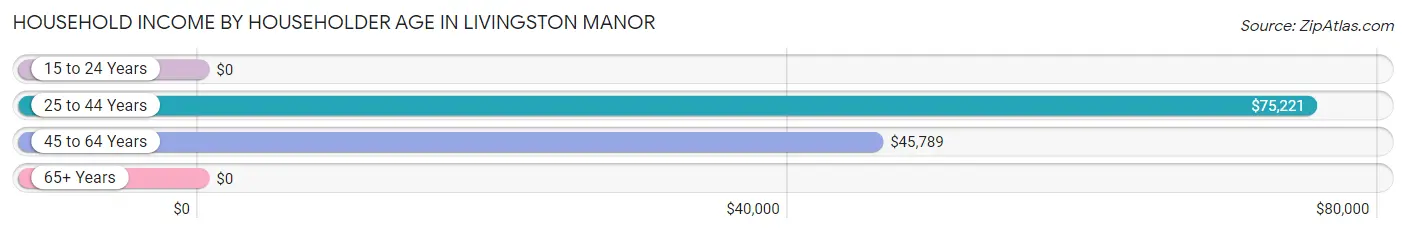
Household Income by Householder Age in Livingston Manor
The median household income in Livingston Manor is $50,197, with the highest median household income of $75,221 found in the 25 to 44 years age bracket for the primary householder. A total of 92 households (23.6%) fall into this category.
| Income Bracket | # Households | Median Income |
| 15 to 24 Years | 0 (0.0%) | $0 |
| 25 to 44 Years | 92 (23.6%) | $75,221 |
| 45 to 64 Years | 170 (43.7%) | $45,789 |
| 65+ Years | 127 (32.7%) | $0 |
| Total | 389 (100.0%) | $50,197 |
Poverty in Livingston Manor
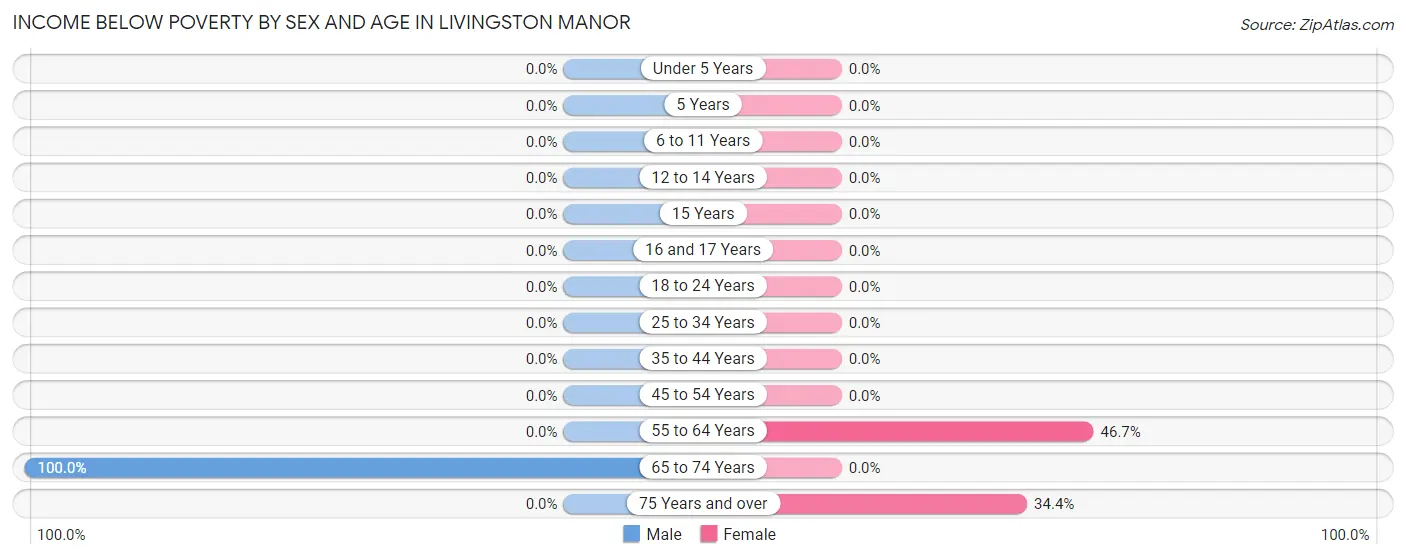
Income Below Poverty by Sex and Age in Livingston Manor
With 9.5% poverty level for males and 13.4% for females among the residents of Livingston Manor, 65 to 74 year old males and 55 to 64 year old females are the most vulnerable to poverty, with 29 males (100.0%) and 43 females (46.7%) in their respective age groups living below the poverty level.
| Age Bracket | Male | Female |
| Under 5 Years | 0 (0.0%) | 0 (0.0%) |
| 5 Years | 0 (0.0%) | 0 (0.0%) |
| 6 to 11 Years | 0 (0.0%) | 0 (0.0%) |
| 12 to 14 Years | 0 (0.0%) | 0 (0.0%) |
| 15 Years | 0 (0.0%) | 0 (0.0%) |
| 16 and 17 Years | 0 (0.0%) | 0 (0.0%) |
| 18 to 24 Years | 0 (0.0%) | 0 (0.0%) |
| 25 to 34 Years | 0 (0.0%) | 0 (0.0%) |
| 35 to 44 Years | 0 (0.0%) | 0 (0.0%) |
| 45 to 54 Years | 0 (0.0%) | 0 (0.0%) |
| 55 to 64 Years | 0 (0.0%) | 43 (46.7%) |
| 65 to 74 Years | 29 (100.0%) | 0 (0.0%) |
| 75 Years and over | 0 (0.0%) | 32 (34.4%) |
| Total | 29 (9.5%) | 75 (13.4%) |
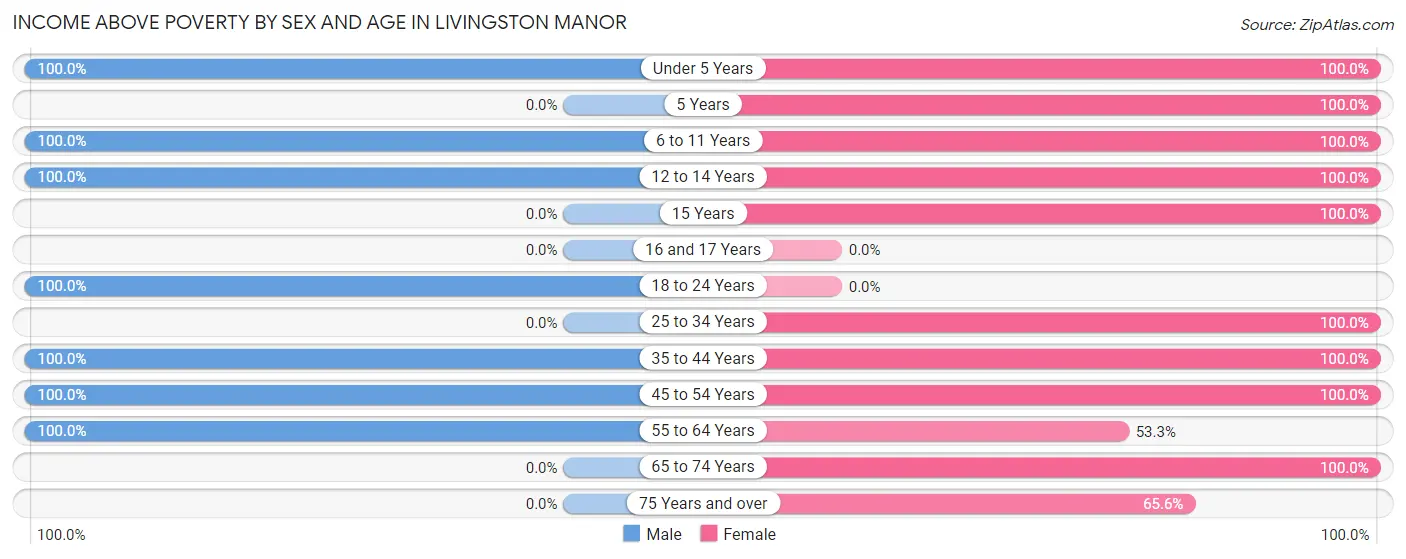
Income Above Poverty by Sex and Age in Livingston Manor
According to the poverty statistics in Livingston Manor, males aged under 5 years and females aged under 5 years are the age groups that are most secure financially, with 100.0% of males and 100.0% of females in these age groups living above the poverty line.
| Age Bracket | Male | Female |
| Under 5 Years | 11 (100.0%) | 55 (100.0%) |
| 5 Years | 0 (0.0%) | 26 (100.0%) |
| 6 to 11 Years | 59 (100.0%) | 10 (100.0%) |
| 12 to 14 Years | 7 (100.0%) | 34 (100.0%) |
| 15 Years | 0 (0.0%) | 18 (100.0%) |
| 16 and 17 Years | 0 (0.0%) | 0 (0.0%) |
| 18 to 24 Years | 31 (100.0%) | 0 (0.0%) |
| 25 to 34 Years | 0 (0.0%) | 39 (100.0%) |
| 35 to 44 Years | 70 (100.0%) | 51 (100.0%) |
| 45 to 54 Years | 50 (100.0%) | 73 (100.0%) |
| 55 to 64 Years | 48 (100.0%) | 49 (53.3%) |
| 65 to 74 Years | 0 (0.0%) | 67 (100.0%) |
| 75 Years and over | 0 (0.0%) | 61 (65.6%) |
| Total | 276 (90.5%) | 483 (86.6%) |
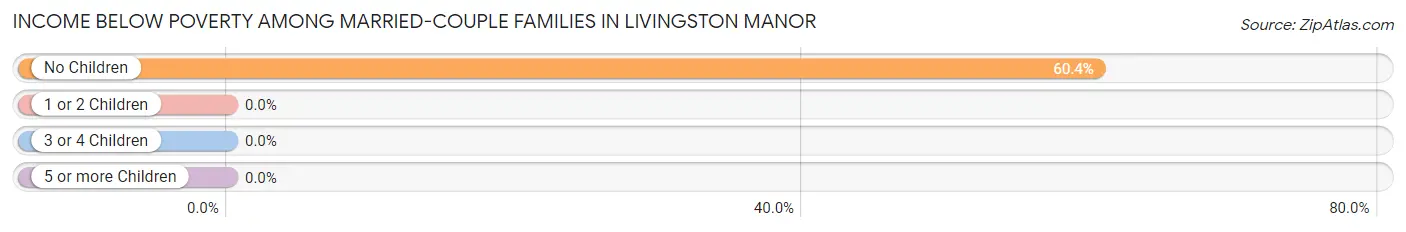
Income Below Poverty Among Married-Couple Families in Livingston Manor
The poverty statistics for married-couple families in Livingston Manor show that 23.0% or 29 of the total 126 families live below the poverty line. Families with no children have the highest poverty rate of 60.4%, comprising of 29 families. On the other hand, families with 1 or 2 children have the lowest poverty rate of 0.0%, which includes 0 families.
| Children | Above Poverty | Below Poverty |
| No Children | 19 (39.6%) | 29 (60.4%) |
| 1 or 2 Children | 23 (100.0%) | 0 (0.0%) |
| 3 or 4 Children | 55 (100.0%) | 0 (0.0%) |
| 5 or more Children | 0 (0.0%) | 0 (0.0%) |
| Total | 97 (77.0%) | 29 (23.0%) |
Income Below Poverty Among Single-Parent Households in Livingston Manor
| Children | Single Father | Single Mother |
| No Children | 0 (0.0%) | 0 (0.0%) |
| 1 or 2 Children | 0 (0.0%) | 0 (0.0%) |
| 3 or 4 Children | 0 (0.0%) | 0 (0.0%) |
| 5 or more Children | 0 (0.0%) | 0 (0.0%) |
| Total | 0 (0.0%) | 0 (0.0%) |
Income Below Poverty Among Married-Couple vs Single-Parent Households in Livingston Manor
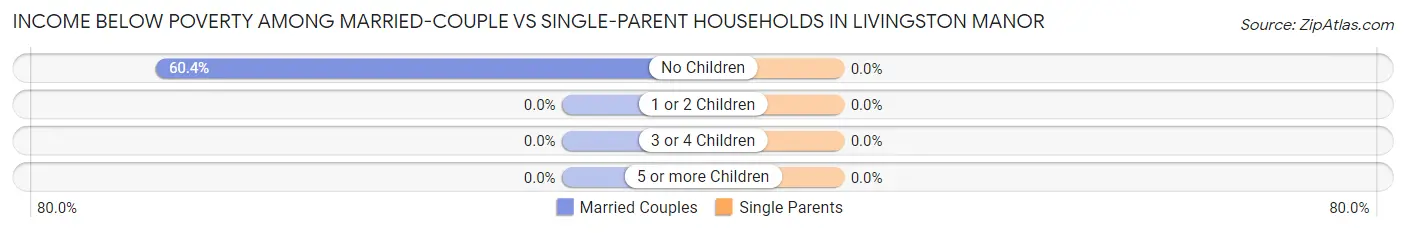
| Children | Married-Couple Families | Single-Parent Households |
| No Children | 29 (60.4%) | 0 (0.0%) |
| 1 or 2 Children | 0 (0.0%) | 0 (0.0%) |
| 3 or 4 Children | 0 (0.0%) | 0 (0.0%) |
| 5 or more Children | 0 (0.0%) | 0 (0.0%) |
| Total | 29 (23.0%) | 0 (0.0%) |
Race in Livingston Manor
The most populous races in Livingston Manor are White / Caucasian (698 | 80.9%), Two or more Races (135 | 15.6%), and Hispanic or Latino (66 | 7.6%).
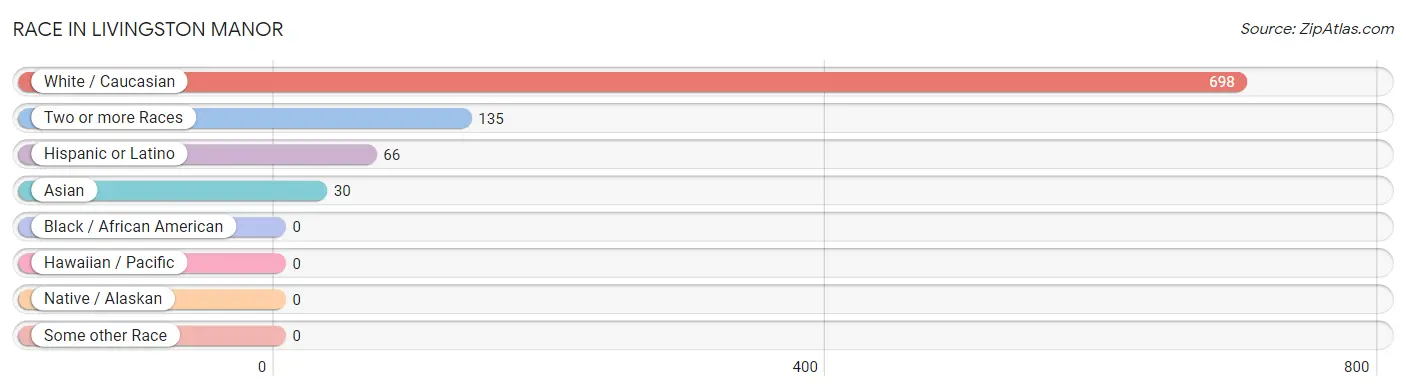
| Race | # Population | % Population |
| Asian | 30 | 3.5% |
| Black / African American | 0 | 0.0% |
| Hawaiian / Pacific | 0 | 0.0% |
| Hispanic or Latino | 66 | 7.6% |
| Native / Alaskan | 0 | 0.0% |
| White / Caucasian | 698 | 80.9% |
| Two or more Races | 135 | 15.6% |
| Some other Race | 0 | 0.0% |
| Total | 863 | 100.0% |
Ancestry in Livingston Manor
The most populous ancestries reported in Livingston Manor are German (124 | 14.4%), Irish (85 | 9.9%), American (72 | 8.3%), Brazilian (54 | 6.3%), and Ukrainian (39 | 4.5%), together accounting for 43.3% of all Livingston Manor residents.
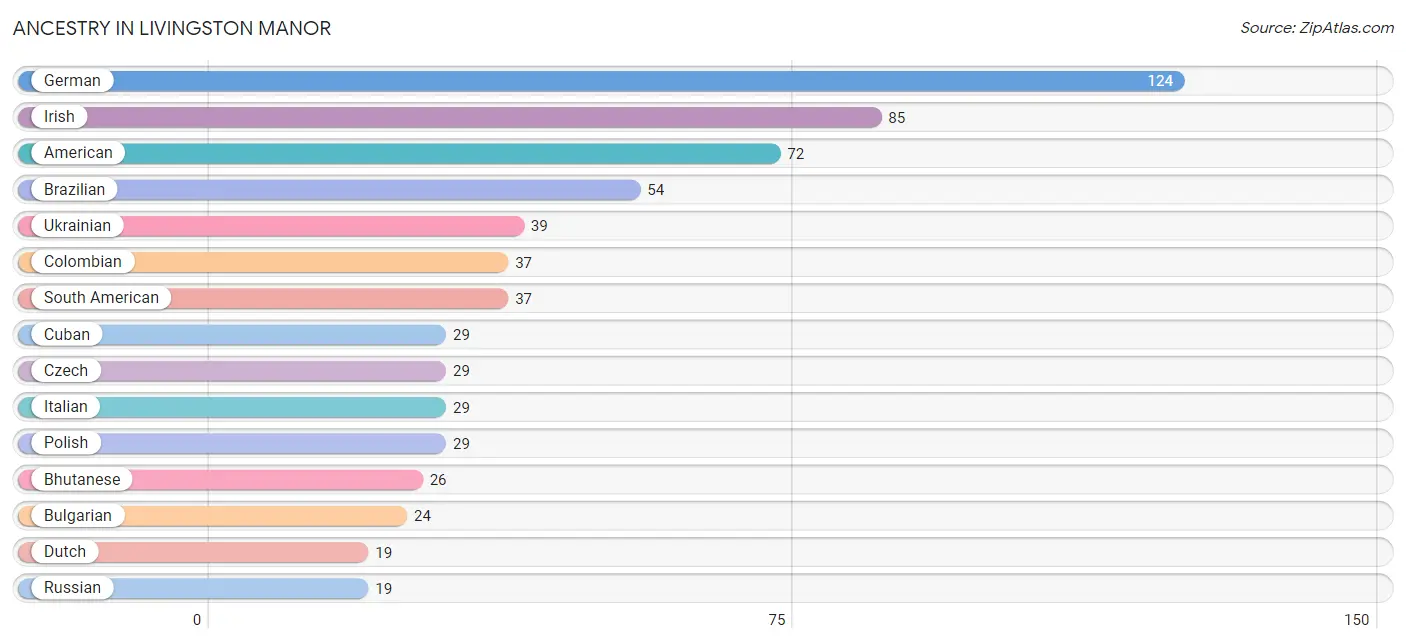
| Ancestry | # Population | % Population |
| American | 72 | 8.3% |
| Bhutanese | 26 | 3.0% |
| Brazilian | 54 | 6.3% |
| Bulgarian | 24 | 2.8% |
| Burmese | 14 | 1.6% |
| Colombian | 37 | 4.3% |
| Cuban | 29 | 3.4% |
| Czech | 29 | 3.4% |
| Dutch | 19 | 2.2% |
| English | 8 | 0.9% |
| German | 124 | 14.4% |
| Hungarian | 10 | 1.2% |
| Irish | 85 | 9.9% |
| Italian | 29 | 3.4% |
| Polish | 29 | 3.4% |
| Portuguese | 15 | 1.7% |
| Russian | 19 | 2.2% |
| Scottish | 19 | 2.2% |
| South American | 37 | 4.3% |
| Thai | 11 | 1.3% |
| Ukrainian | 39 | 4.5% | View All 21 Rows |
Immigrants in Livingston Manor
The most numerous immigrant groups reported in Livingston Manor came from Latin America (89 | 10.3%), South America (60 | 7.0%), Europe (54 | 6.3%), Brazil (46 | 5.3%), and Asia (30 | 3.5%), together accounting for 32.3% of all Livingston Manor residents.
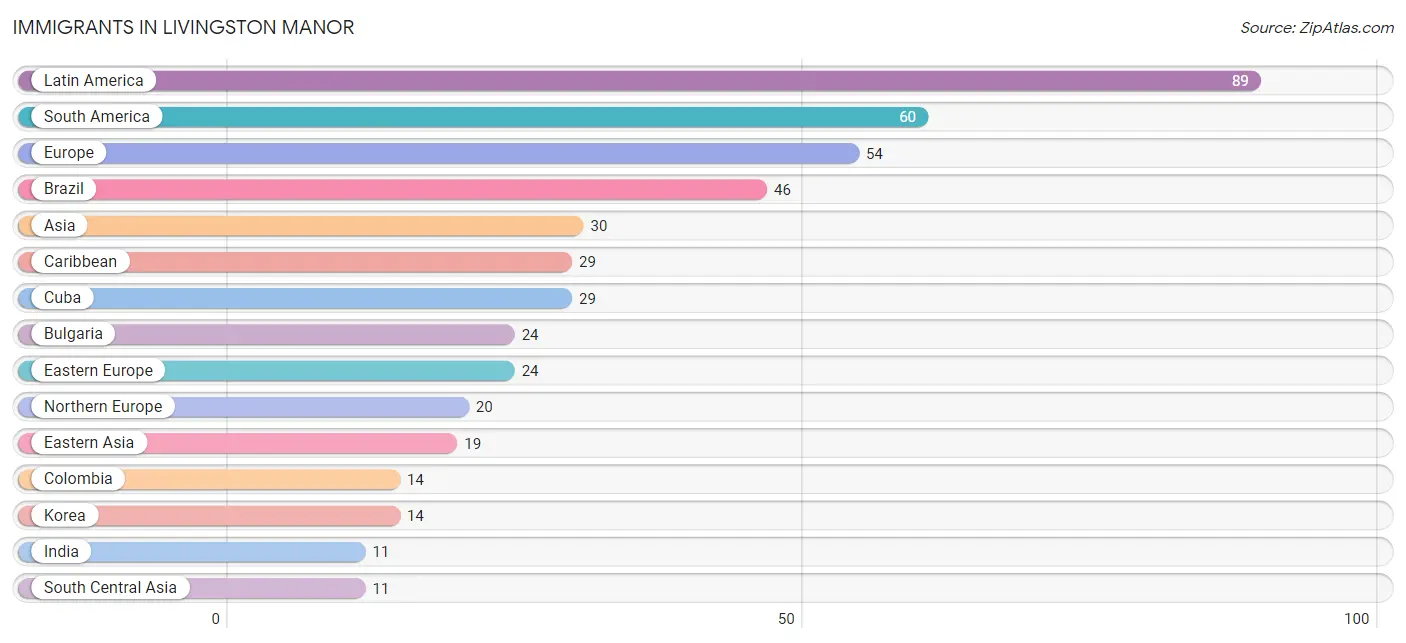
| Immigration Origin | # Population | % Population |
| Asia | 30 | 3.5% |
| Brazil | 46 | 5.3% |
| Bulgaria | 24 | 2.8% |
| Caribbean | 29 | 3.4% |
| Colombia | 14 | 1.6% |
| Cuba | 29 | 3.4% |
| Eastern Asia | 19 | 2.2% |
| Eastern Europe | 24 | 2.8% |
| Europe | 54 | 6.3% |
| Germany | 10 | 1.2% |
| India | 11 | 1.3% |
| Japan | 5 | 0.6% |
| Korea | 14 | 1.6% |
| Latin America | 89 | 10.3% |
| Northern Europe | 20 | 2.3% |
| South America | 60 | 7.0% |
| South Central Asia | 11 | 1.3% |
| Western Europe | 10 | 1.2% | View All 18 Rows |
Sex and Age in Livingston Manor
Sex and Age in Livingston Manor
The most populous age groups in Livingston Manor are 35 to 39 Years (70 | 23.0%) for men and 50 to 54 Years (73 | 13.1%) for women.
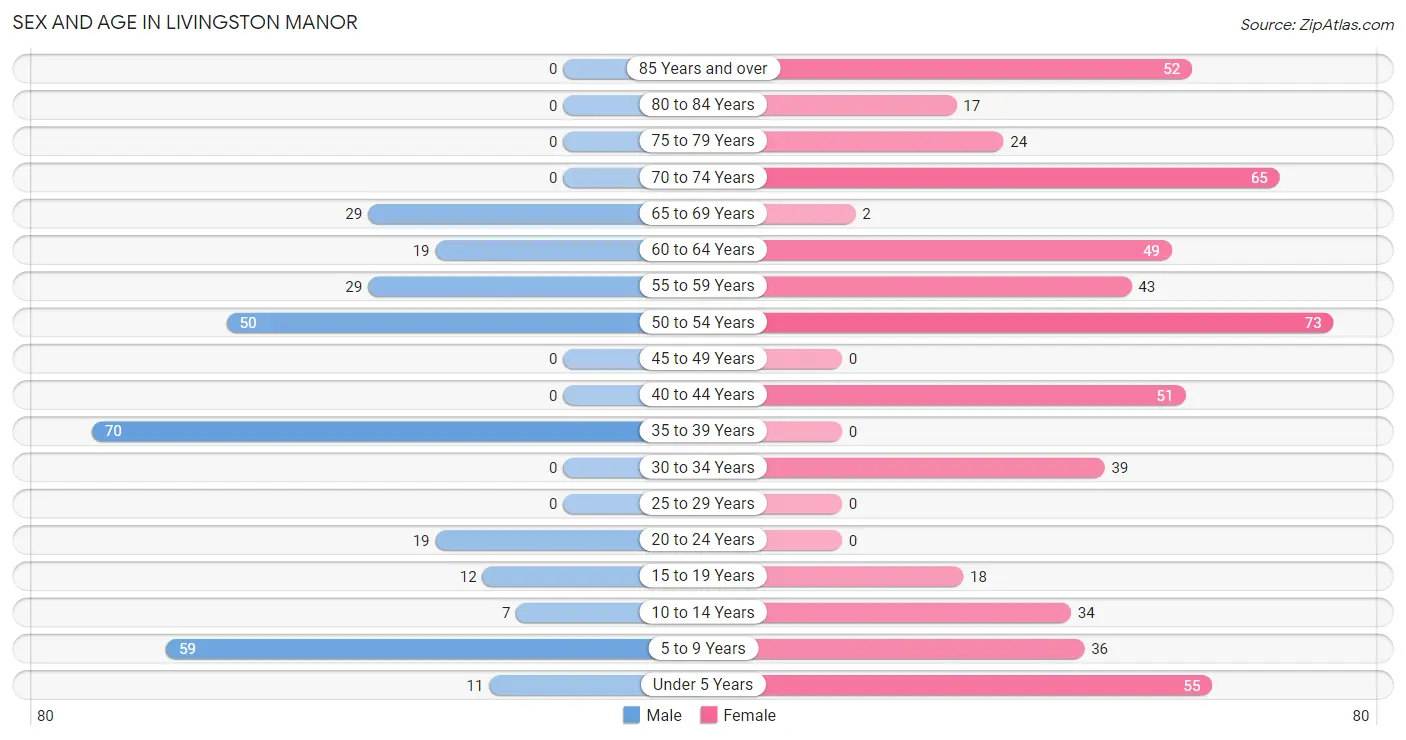
| Age Bracket | Male | Female |
| Under 5 Years | 11 (3.6%) | 55 (9.9%) |
| 5 to 9 Years | 59 (19.3%) | 36 (6.5%) |
| 10 to 14 Years | 7 (2.3%) | 34 (6.1%) |
| 15 to 19 Years | 12 (3.9%) | 18 (3.2%) |
| 20 to 24 Years | 19 (6.2%) | 0 (0.0%) |
| 25 to 29 Years | 0 (0.0%) | 0 (0.0%) |
| 30 to 34 Years | 0 (0.0%) | 39 (7.0%) |
| 35 to 39 Years | 70 (23.0%) | 0 (0.0%) |
| 40 to 44 Years | 0 (0.0%) | 51 (9.1%) |
| 45 to 49 Years | 0 (0.0%) | 0 (0.0%) |
| 50 to 54 Years | 50 (16.4%) | 73 (13.1%) |
| 55 to 59 Years | 29 (9.5%) | 43 (7.7%) |
| 60 to 64 Years | 19 (6.2%) | 49 (8.8%) |
| 65 to 69 Years | 29 (9.5%) | 2 (0.4%) |
| 70 to 74 Years | 0 (0.0%) | 65 (11.7%) |
| 75 to 79 Years | 0 (0.0%) | 24 (4.3%) |
| 80 to 84 Years | 0 (0.0%) | 17 (3.0%) |
| 85 Years and over | 0 (0.0%) | 52 (9.3%) |
| Total | 305 (100.0%) | 558 (100.0%) |
Families and Households in Livingston Manor
Median Family Size in Livingston Manor
The median family size in Livingston Manor is 3.10 persons per family, with married-couple families (126 | 57.8%) accounting for the largest median family size of 3.36 persons per family. On the other hand, single male/father families (15 | 6.9%) represent the smallest median family size with 2.53 persons per family.
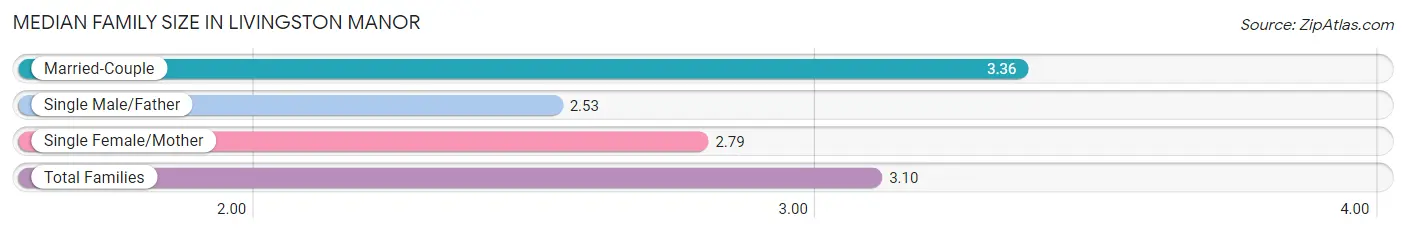
| Family Type | # Families | Family Size |
| Married-Couple | 126 (57.8%) | 3.36 |
| Single Male/Father | 15 (6.9%) | 2.53 |
| Single Female/Mother | 77 (35.3%) | 2.79 |
| Total Families | 218 (100.0%) | 3.10 |
Median Household Size in Livingston Manor
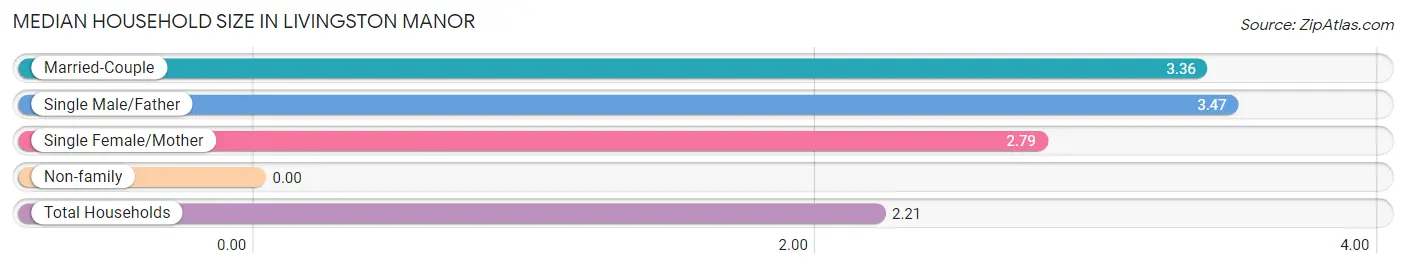
| Household Type | # Households | Household Size |
| Married-Couple | 126 (32.4%) | 3.36 |
| Single Male/Father | 15 (3.9%) | 3.47 |
| Single Female/Mother | 77 (19.8%) | 2.79 |
| Non-family | 171 (44.0%) | - |
| Total Households | 389 (100.0%) | 2.21 |
Household Size by Marriage Status in Livingston Manor
Out of a total of 389 households in Livingston Manor, 218 (56.0%) are family households, while 171 (44.0%) are nonfamily households. The most numerous type of family households are 2-person households, comprising 99, and the most common type of nonfamily households are 1-person households, comprising 171.
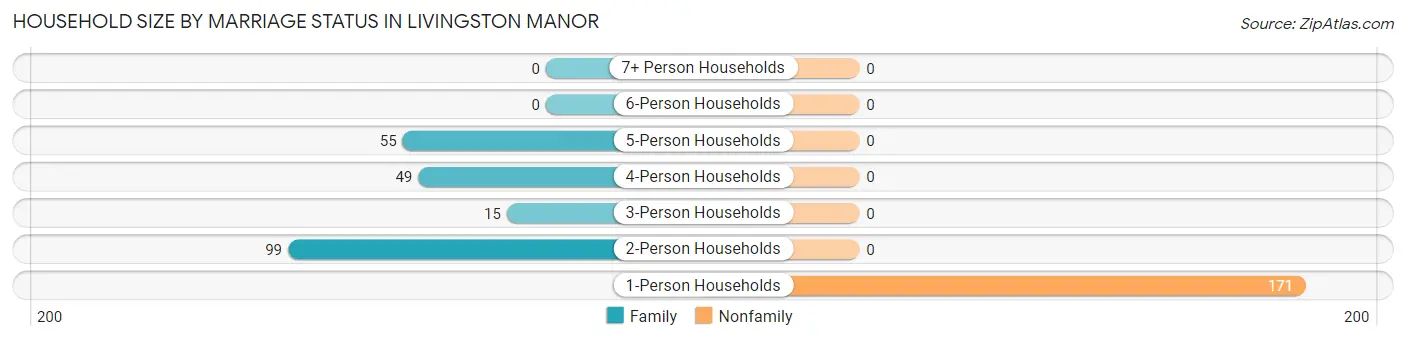
| Household Size | Family Households | Nonfamily Households |
| 1-Person Households | - | 171 (44.0%) |
| 2-Person Households | 99 (25.5%) | 0 (0.0%) |
| 3-Person Households | 15 (3.9%) | 0 (0.0%) |
| 4-Person Households | 49 (12.6%) | 0 (0.0%) |
| 5-Person Households | 55 (14.1%) | 0 (0.0%) |
| 6-Person Households | 0 (0.0%) | 0 (0.0%) |
| 7+ Person Households | 0 (0.0%) | 0 (0.0%) |
| Total | 218 (56.0%) | 171 (44.0%) |
Female Fertility in Livingston Manor
Fertility by Age in Livingston Manor
Average fertility rate in Livingston Manor is 227.0 births per 1,000 women. Women in the age bracket of 35 to 50 years have the highest fertility rate with 381.0 births per 1,000 women. Women in the age bracket of 35 to 50 years acount for 100.0% of all women with births.
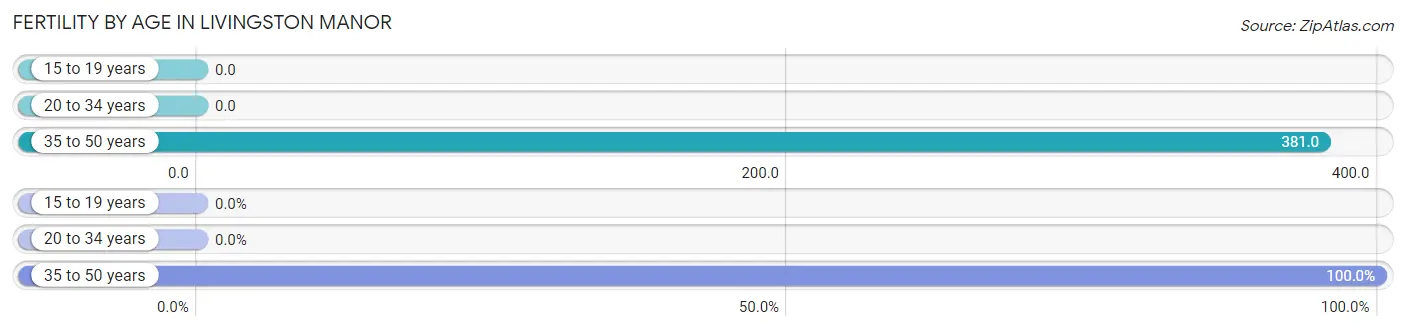
| Age Bracket | Women with Births | Births / 1,000 Women |
| 15 to 19 years | 0 (0.0%) | 0.0 |
| 20 to 34 years | 0 (0.0%) | 0.0 |
| 35 to 50 years | 32 (100.0%) | 381.0 |
| Total | 32 (100.0%) | 227.0 |
Fertility by Age by Marriage Status in Livingston Manor
56.2% of women with births (32) in Livingston Manor are married. The highest percentage of unmarried women with births falls into 35 to 50 years age bracket with 43.8% of them unmarried at the time of birth, while the lowest percentage of unmarried women with births belong to 35 to 50 years age bracket with 43.8% of them unmarried.
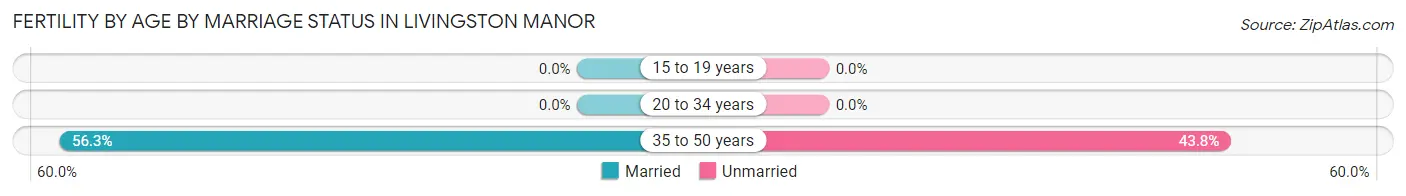
| Age Bracket | Married | Unmarried |
| 15 to 19 years | 0 (0.0%) | 0 (0.0%) |
| 20 to 34 years | 0 (0.0%) | 0 (0.0%) |
| 35 to 50 years | 18 (56.2%) | 14 (43.8%) |
| Total | 18 (56.2%) | 14 (43.8%) |
Fertility by Education in Livingston Manor
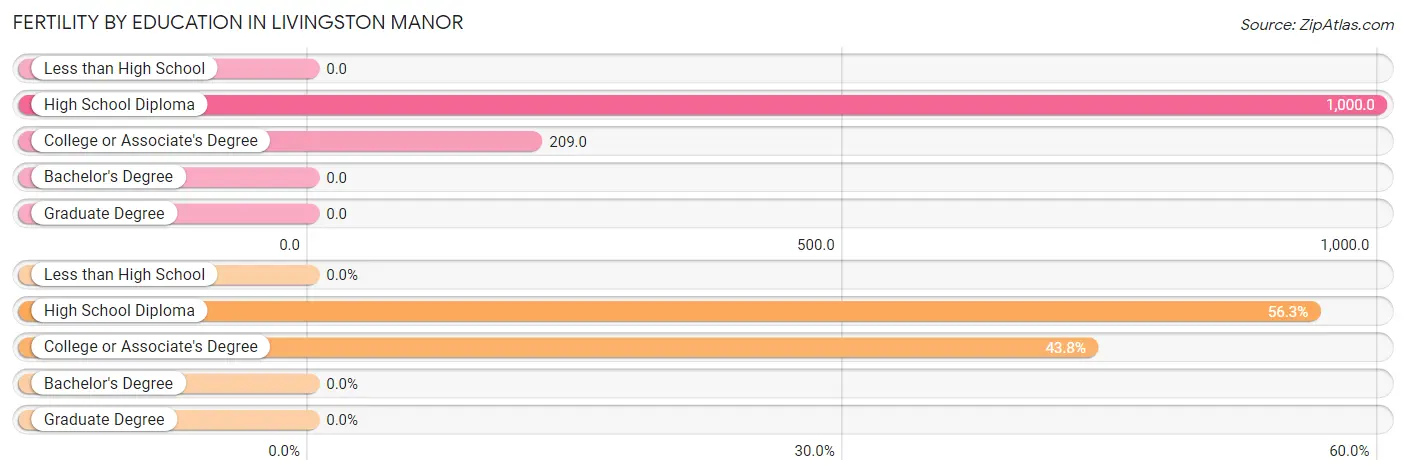
| Educational Attainment | Women with Births | Births / 1,000 Women |
| Less than High School | 0 (0.0%) | 0.0 |
| High School Diploma | 18 (56.2%) | 1,000.0 |
| College or Associate's Degree | 14 (43.8%) | 209.0 |
| Bachelor's Degree | 0 (0.0%) | 0.0 |
| Graduate Degree | 0 (0.0%) | 0.0 |
| Total | 32 (100.0%) | 227.0 |
Fertility by Education by Marriage Status in Livingston Manor
43.8% of women with births in Livingston Manor are unmarried. Women with the educational attainment of high school diploma are most likely to be married with 100.0% of them married at childbirth, while women with the educational attainment of college or associate's degree are least likely to be married with 100.0% of them unmarried at childbirth.
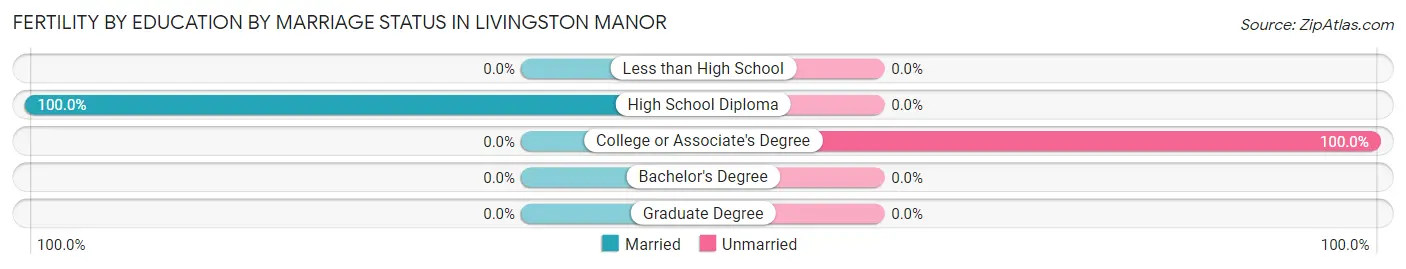
| Educational Attainment | Married | Unmarried |
| Less than High School | 0 (0.0%) | 0 (0.0%) |
| High School Diploma | 18 (100.0%) | 0 (0.0%) |
| College or Associate's Degree | 0 (0.0%) | 14 (100.0%) |
| Bachelor's Degree | 0 (0.0%) | 0 (0.0%) |
| Graduate Degree | 0 (0.0%) | 0 (0.0%) |
| Total | 18 (56.2%) | 14 (43.8%) |
Employment Characteristics in Livingston Manor
Employment by Class of Employer in Livingston Manor
Among the 389 employed individuals in Livingston Manor, private company employees (212 | 54.5%), local government employees (54 | 13.9%), and not-for-profit organizations (42 | 10.8%) make up the most common classes of employment.
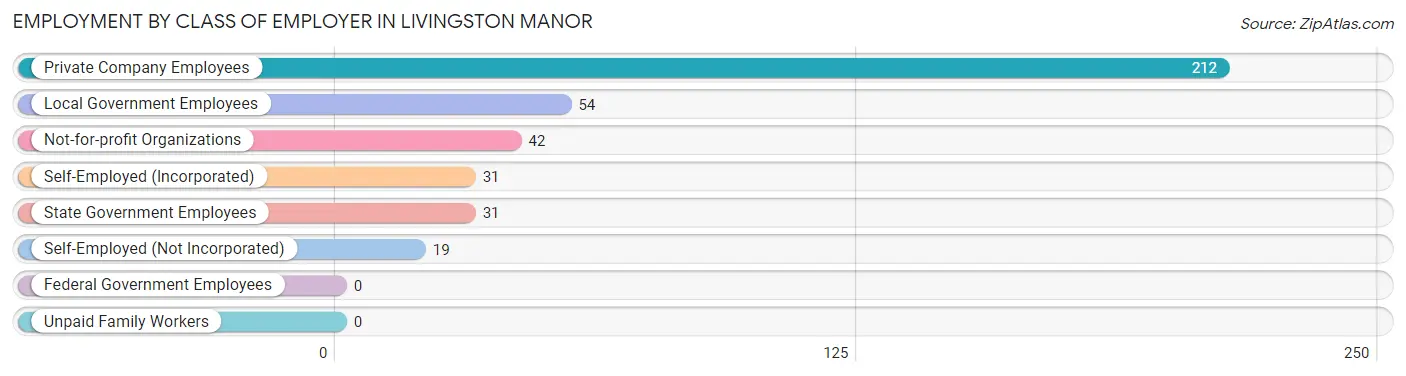
| Employer Class | # Employees | % Employees |
| Private Company Employees | 212 | 54.5% |
| Self-Employed (Incorporated) | 31 | 8.0% |
| Self-Employed (Not Incorporated) | 19 | 4.9% |
| Not-for-profit Organizations | 42 | 10.8% |
| Local Government Employees | 54 | 13.9% |
| State Government Employees | 31 | 8.0% |
| Federal Government Employees | 0 | 0.0% |
| Unpaid Family Workers | 0 | 0.0% |
| Total | 389 | 100.0% |
Employment Status by Age in Livingston Manor
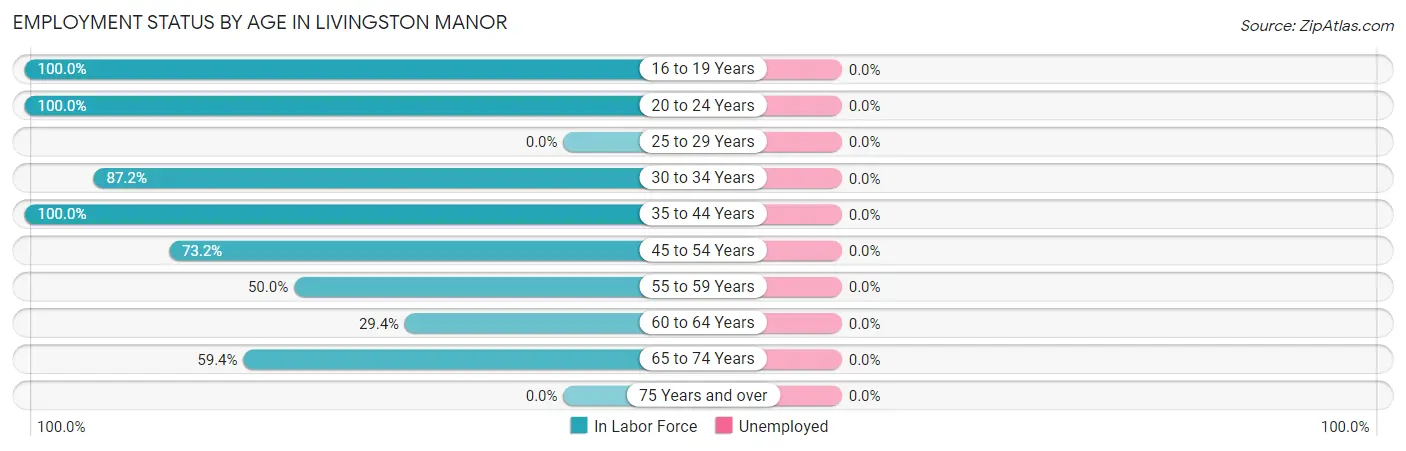
| Age Bracket | In Labor Force | Unemployed |
| 16 to 19 Years | 12 (100.0%) | 0 (0.0%) |
| 20 to 24 Years | 19 (100.0%) | 0 (0.0%) |
| 25 to 29 Years | 0 (0.0%) | 0 (0.0%) |
| 30 to 34 Years | 34 (87.2%) | 0 (0.0%) |
| 35 to 44 Years | 121 (100.0%) | 0 (0.0%) |
| 45 to 54 Years | 90 (73.2%) | 0 (0.0%) |
| 55 to 59 Years | 36 (50.0%) | 0 (0.0%) |
| 60 to 64 Years | 20 (29.4%) | 0 (0.0%) |
| 65 to 74 Years | 57 (59.4%) | 0 (0.0%) |
| 75 Years and over | 0 (0.0%) | 0 (0.0%) |
| Total | 389 (60.5%) | 0 (0.0%) |
Employment Status by Educational Attainment in Livingston Manor
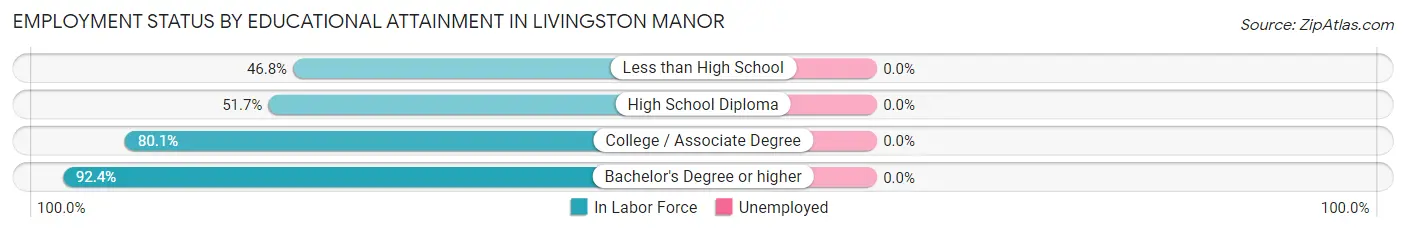
| Educational Attainment | In Labor Force | Unemployed |
| Less than High School | 29 (46.8%) | 0 (0.0%) |
| High School Diploma | 46 (51.7%) | 0 (0.0%) |
| College / Associate Degree | 165 (80.1%) | 0 (0.0%) |
| Bachelor's Degree or higher | 61 (92.4%) | 0 (0.0%) |
| Total | 301 (71.2%) | 0 (0.0%) |
Employment Occupations by Sex in Livingston Manor
Management, Business, Science and Arts Occupations
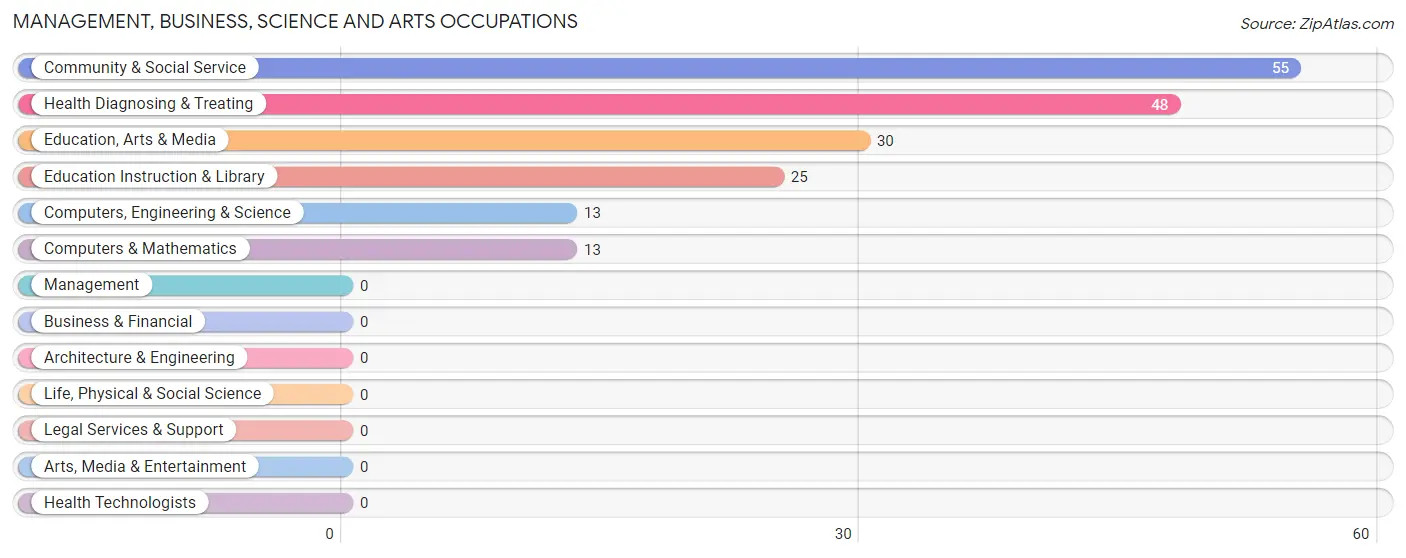
The most common Management, Business, Science and Arts occupations in Livingston Manor are Community & Social Service (55 | 14.1%), Health Diagnosing & Treating (48 | 12.3%), Education, Arts & Media (30 | 7.7%), Education Instruction & Library (25 | 6.4%), and Computers, Engineering & Science (13 | 3.3%).
Management, Business, Science and Arts Occupations by Sex
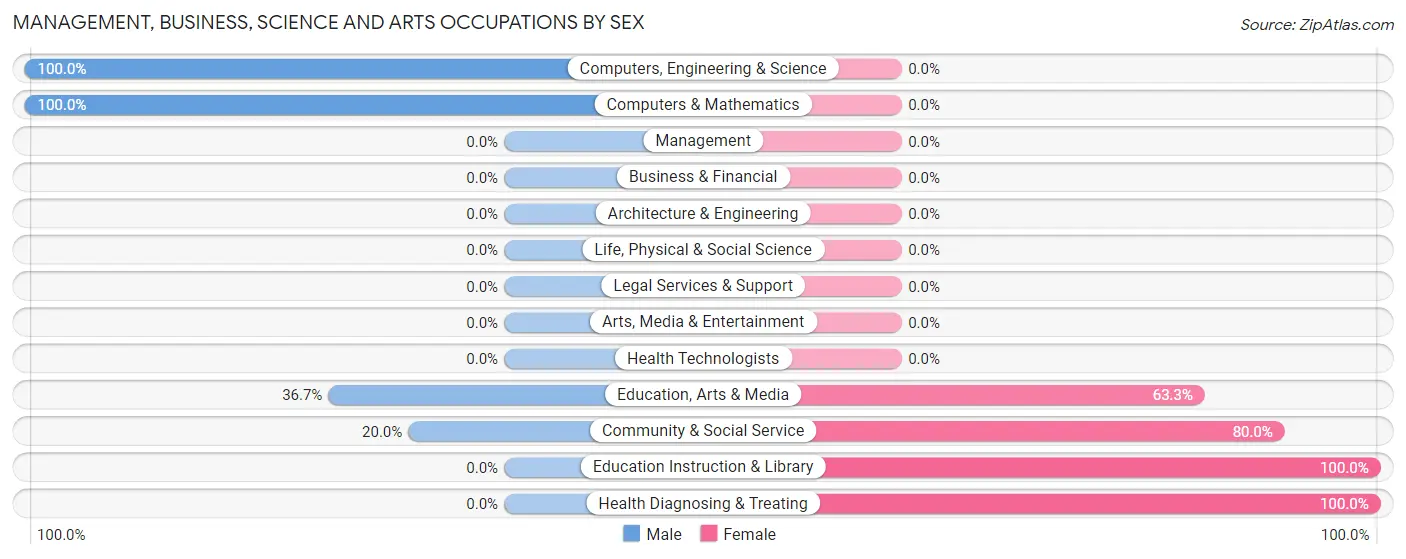
Within the Management, Business, Science and Arts occupations in Livingston Manor, the most male-oriented occupations are Computers, Engineering & Science (100.0%), Computers & Mathematics (100.0%), and Education, Arts & Media (36.7%), while the most female-oriented occupations are Education Instruction & Library (100.0%), Health Diagnosing & Treating (100.0%), and Community & Social Service (80.0%).
| Occupation | Male | Female |
| Management | 0 (0.0%) | 0 (0.0%) |
| Business & Financial | 0 (0.0%) | 0 (0.0%) |
| Computers, Engineering & Science | 13 (100.0%) | 0 (0.0%) |
| Computers & Mathematics | 13 (100.0%) | 0 (0.0%) |
| Architecture & Engineering | 0 (0.0%) | 0 (0.0%) |
| Life, Physical & Social Science | 0 (0.0%) | 0 (0.0%) |
| Community & Social Service | 11 (20.0%) | 44 (80.0%) |
| Education, Arts & Media | 11 (36.7%) | 19 (63.3%) |
| Legal Services & Support | 0 (0.0%) | 0 (0.0%) |
| Education Instruction & Library | 0 (0.0%) | 25 (100.0%) |
| Arts, Media & Entertainment | 0 (0.0%) | 0 (0.0%) |
| Health Diagnosing & Treating | 0 (0.0%) | 48 (100.0%) |
| Health Technologists | 0 (0.0%) | 0 (0.0%) |
| Total (Category) | 24 (20.7%) | 92 (79.3%) |
| Total (Overall) | 180 (46.3%) | 209 (53.7%) |
Services Occupations
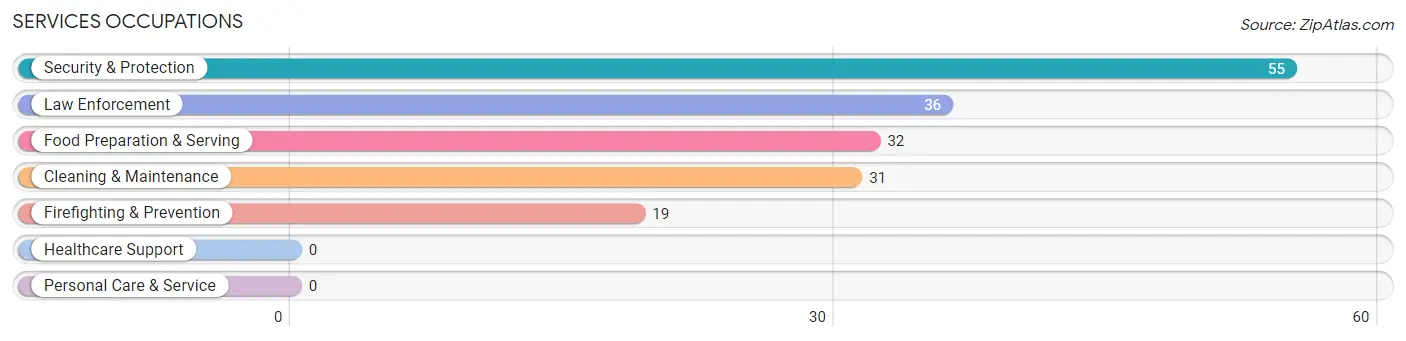
The most common Services occupations in Livingston Manor are Security & Protection (55 | 14.1%), Law Enforcement (36 | 9.2%), Food Preparation & Serving (32 | 8.2%), Cleaning & Maintenance (31 | 8.0%), and Firefighting & Prevention (19 | 4.9%).
Services Occupations by Sex
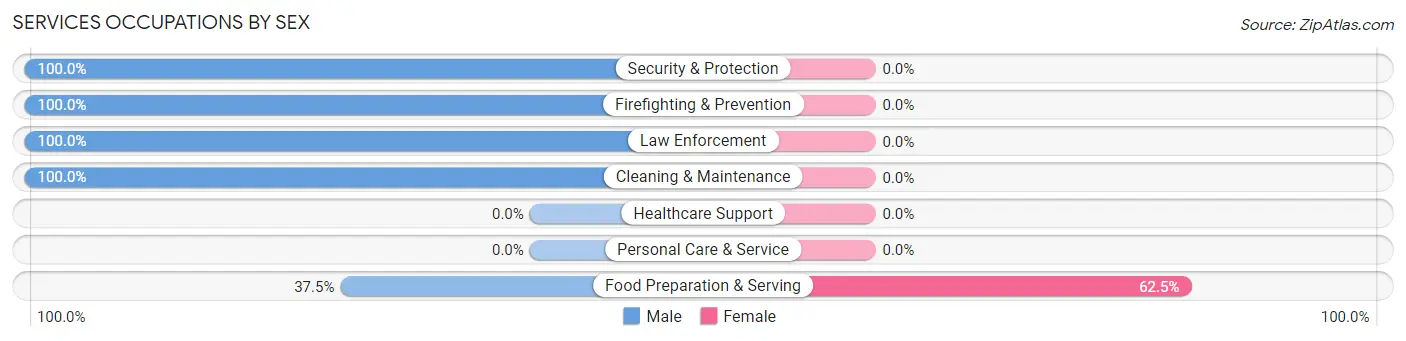
| Occupation | Male | Female |
| Healthcare Support | 0 (0.0%) | 0 (0.0%) |
| Security & Protection | 55 (100.0%) | 0 (0.0%) |
| Firefighting & Prevention | 19 (100.0%) | 0 (0.0%) |
| Law Enforcement | 36 (100.0%) | 0 (0.0%) |
| Food Preparation & Serving | 12 (37.5%) | 20 (62.5%) |
| Cleaning & Maintenance | 31 (100.0%) | 0 (0.0%) |
| Personal Care & Service | 0 (0.0%) | 0 (0.0%) |
| Total (Category) | 98 (83.1%) | 20 (17.0%) |
| Total (Overall) | 180 (46.3%) | 209 (53.7%) |
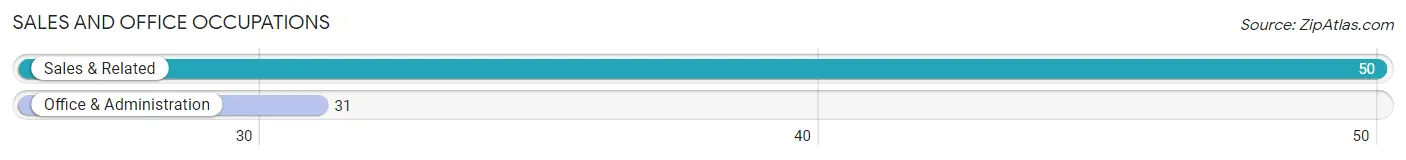
Sales and Office Occupations
The most common Sales and Office occupations in Livingston Manor are Sales & Related (50 | 12.9%), and Office & Administration (31 | 8.0%).
Sales and Office Occupations by Sex
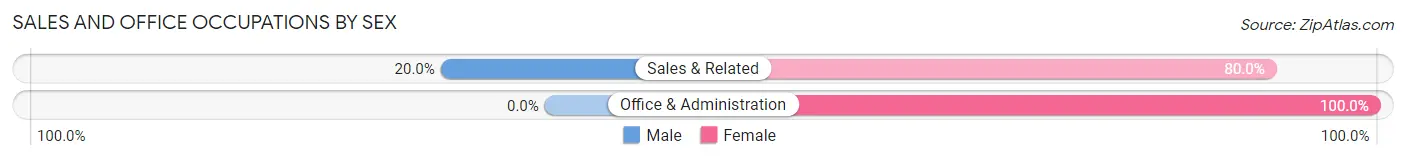
| Occupation | Male | Female |
| Sales & Related | 10 (20.0%) | 40 (80.0%) |
| Office & Administration | 0 (0.0%) | 31 (100.0%) |
| Total (Category) | 10 (12.3%) | 71 (87.6%) |
| Total (Overall) | 180 (46.3%) | 209 (53.7%) |
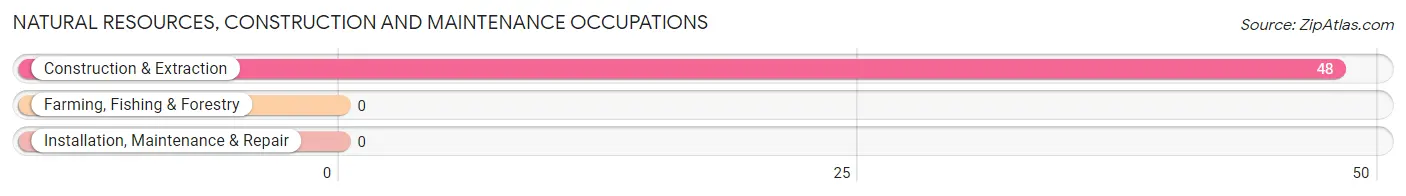
Natural Resources, Construction and Maintenance Occupations
The most common Natural Resources, Construction and Maintenance occupations in Livingston Manor are , and Construction & Extraction (48 | 12.3%).
Natural Resources, Construction and Maintenance Occupations by Sex
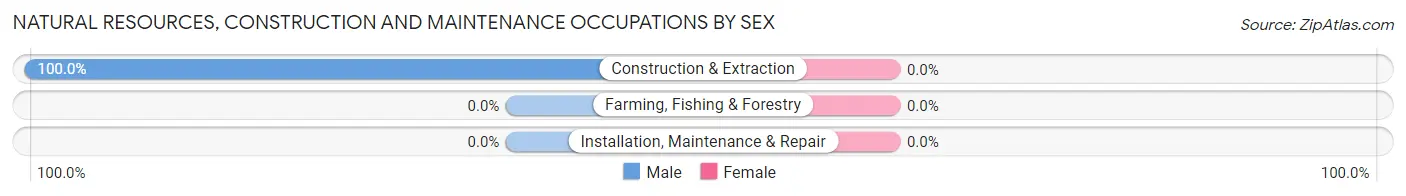
| Occupation | Male | Female |
| Farming, Fishing & Forestry | 0 (0.0%) | 0 (0.0%) |
| Construction & Extraction | 48 (100.0%) | 0 (0.0%) |
| Installation, Maintenance & Repair | 0 (0.0%) | 0 (0.0%) |
| Total (Category) | 48 (100.0%) | 0 (0.0%) |
| Total (Overall) | 180 (46.3%) | 209 (53.7%) |
Production, Transportation and Moving Occupations
The most common Production, Transportation and Moving occupations in Livingston Manor are , and Production (26 | 6.7%).
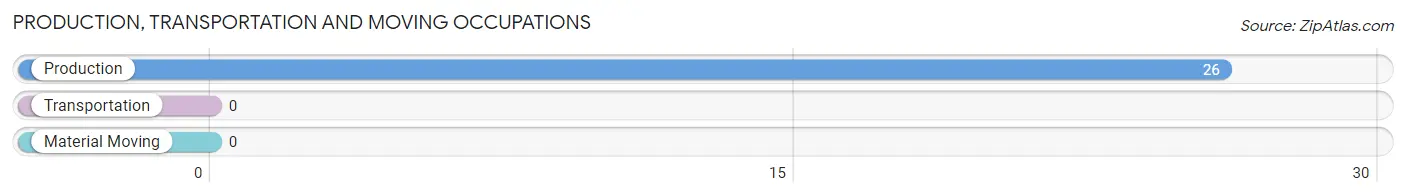
Production, Transportation and Moving Occupations by Sex
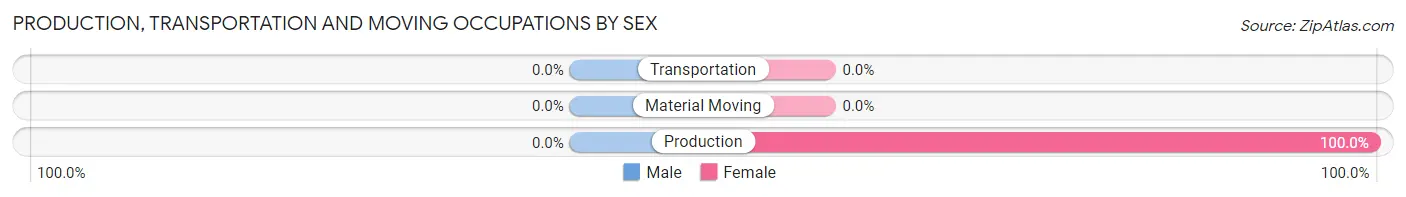
| Occupation | Male | Female |
| Production | 0 (0.0%) | 26 (100.0%) |
| Transportation | 0 (0.0%) | 0 (0.0%) |
| Material Moving | 0 (0.0%) | 0 (0.0%) |
| Total (Category) | 0 (0.0%) | 26 (100.0%) |
| Total (Overall) | 180 (46.3%) | 209 (53.7%) |
Employment Industries by Sex in Livingston Manor
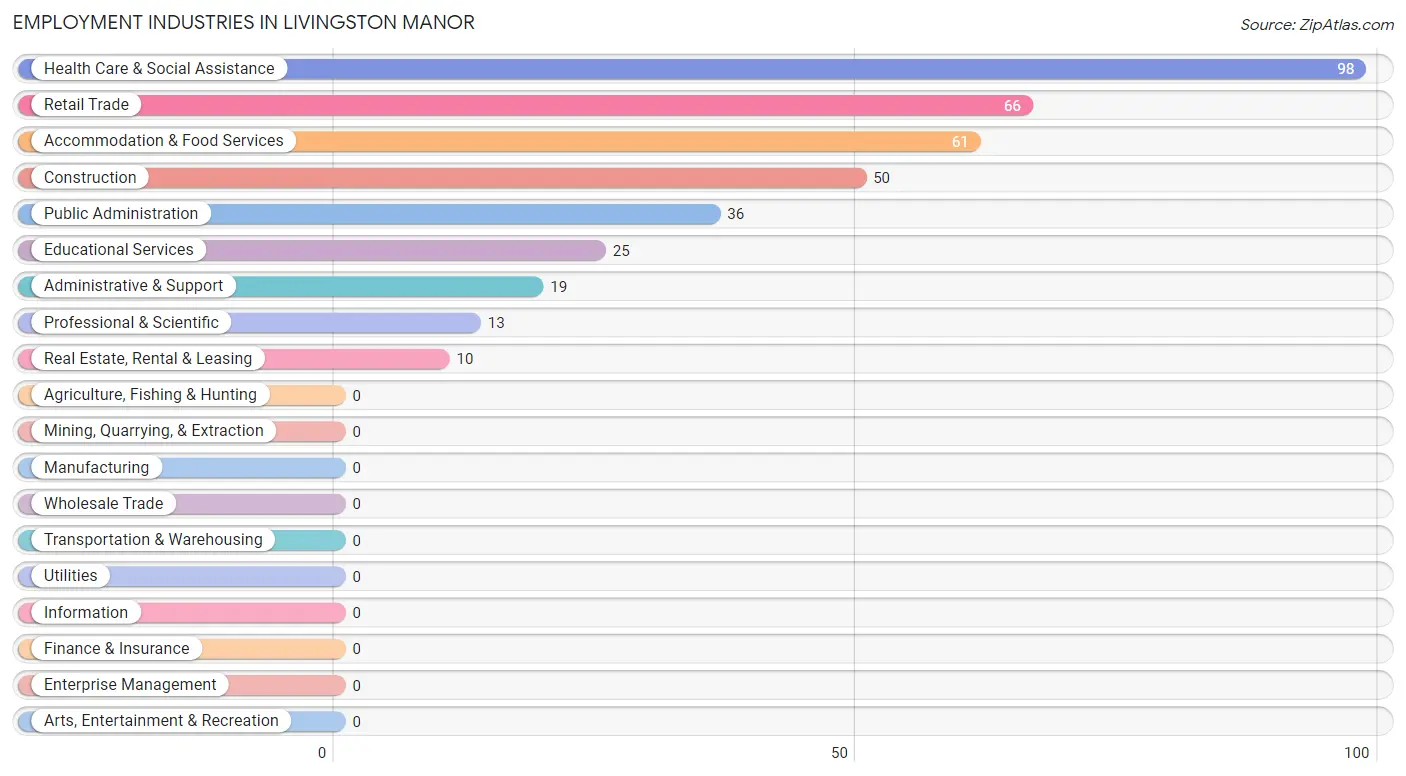
Employment Industries in Livingston Manor
The major employment industries in Livingston Manor include Health Care & Social Assistance (98 | 25.2%), Retail Trade (66 | 17.0%), Accommodation & Food Services (61 | 15.7%), Construction (50 | 12.9%), and Public Administration (36 | 9.2%).
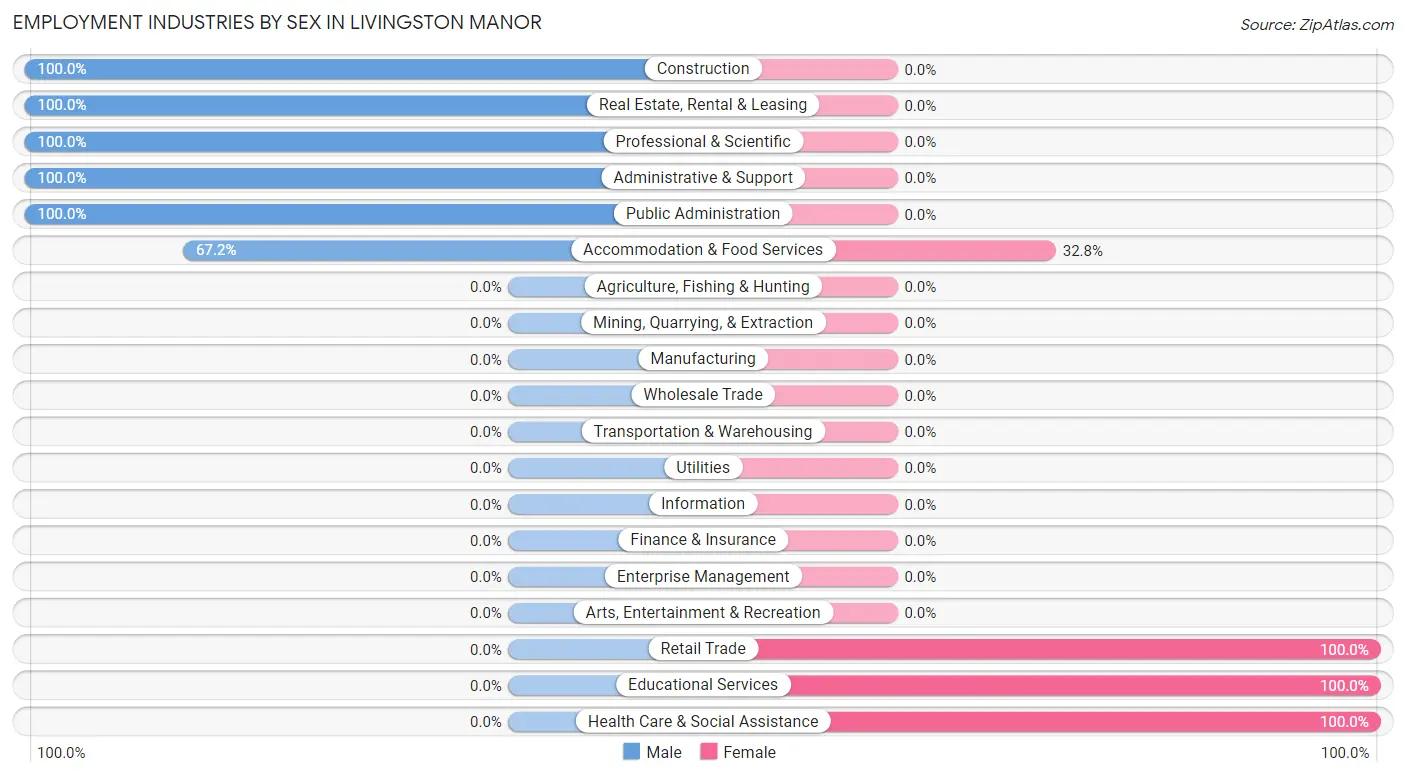
Employment Industries by Sex in Livingston Manor
The Livingston Manor industries that see more men than women are Construction (100.0%), Real Estate, Rental & Leasing (100.0%), and Professional & Scientific (100.0%), whereas the industries that tend to have a higher number of women are Retail Trade (100.0%), Educational Services (100.0%), and Health Care & Social Assistance (100.0%).
| Industry | Male | Female |
| Agriculture, Fishing & Hunting | 0 (0.0%) | 0 (0.0%) |
| Mining, Quarrying, & Extraction | 0 (0.0%) | 0 (0.0%) |
| Construction | 50 (100.0%) | 0 (0.0%) |
| Manufacturing | 0 (0.0%) | 0 (0.0%) |
| Wholesale Trade | 0 (0.0%) | 0 (0.0%) |
| Retail Trade | 0 (0.0%) | 66 (100.0%) |
| Transportation & Warehousing | 0 (0.0%) | 0 (0.0%) |
| Utilities | 0 (0.0%) | 0 (0.0%) |
| Information | 0 (0.0%) | 0 (0.0%) |
| Finance & Insurance | 0 (0.0%) | 0 (0.0%) |
| Real Estate, Rental & Leasing | 10 (100.0%) | 0 (0.0%) |
| Professional & Scientific | 13 (100.0%) | 0 (0.0%) |
| Enterprise Management | 0 (0.0%) | 0 (0.0%) |
| Administrative & Support | 19 (100.0%) | 0 (0.0%) |
| Educational Services | 0 (0.0%) | 25 (100.0%) |
| Health Care & Social Assistance | 0 (0.0%) | 98 (100.0%) |
| Arts, Entertainment & Recreation | 0 (0.0%) | 0 (0.0%) |
| Accommodation & Food Services | 41 (67.2%) | 20 (32.8%) |
| Public Administration | 36 (100.0%) | 0 (0.0%) |
| Total | 180 (46.3%) | 209 (53.7%) |
Education in Livingston Manor
School Enrollment in Livingston Manor
The most common levels of schooling among the 190 students in Livingston Manor are elementary school (69 | 36.3%), high school (35 | 18.4%), and kindergarten (26 | 13.7%).
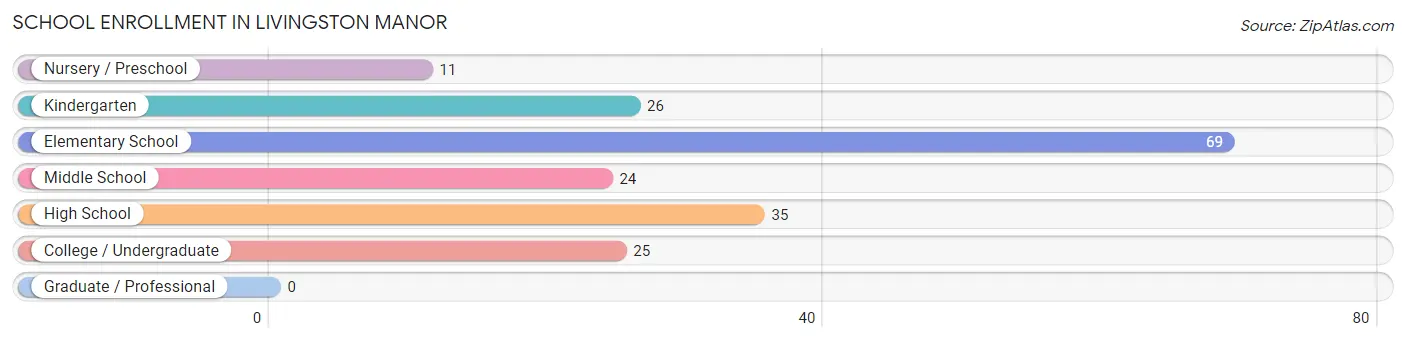
| School Level | # Students | % Students |
| Nursery / Preschool | 11 | 5.8% |
| Kindergarten | 26 | 13.7% |
| Elementary School | 69 | 36.3% |
| Middle School | 24 | 12.6% |
| High School | 35 | 18.4% |
| College / Undergraduate | 25 | 13.2% |
| Graduate / Professional | 0 | 0.0% |
| Total | 190 | 100.0% |
School Enrollment by Age by Funding Source in Livingston Manor
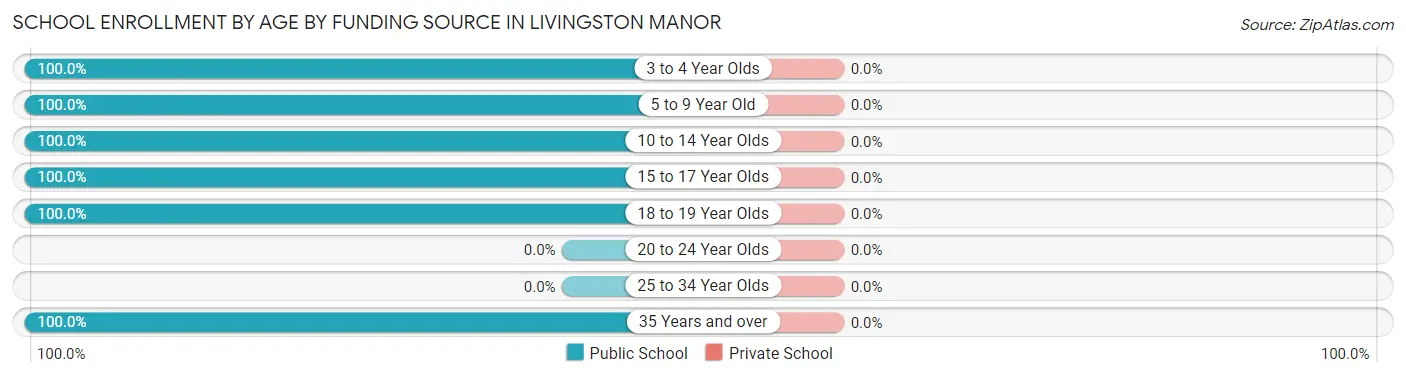
| Age Bracket | Public School | Private School |
| 3 to 4 Year Olds | 11 (100.0%) | 0 (0.0%) |
| 5 to 9 Year Old | 95 (100.0%) | 0 (0.0%) |
| 10 to 14 Year Olds | 41 (100.0%) | 0 (0.0%) |
| 15 to 17 Year Olds | 18 (100.0%) | 0 (0.0%) |
| 18 to 19 Year Olds | 12 (100.0%) | 0 (0.0%) |
| 20 to 24 Year Olds | 0 (0.0%) | 0 (0.0%) |
| 25 to 34 Year Olds | 0 (0.0%) | 0 (0.0%) |
| 35 Years and over | 13 (100.0%) | 0 (0.0%) |
| Total | 190 (100.0%) | 0 (0.0%) |
Educational Attainment by Field of Study in Livingston Manor
Education (50 | 41.3%), bio, nature & agricultural (31 | 25.6%), visual & performing arts (19 | 15.7%), science & technology (11 | 9.1%), and social sciences (5 | 4.1%) are the most common fields of study among 121 individuals in Livingston Manor who have obtained a bachelor's degree or higher.
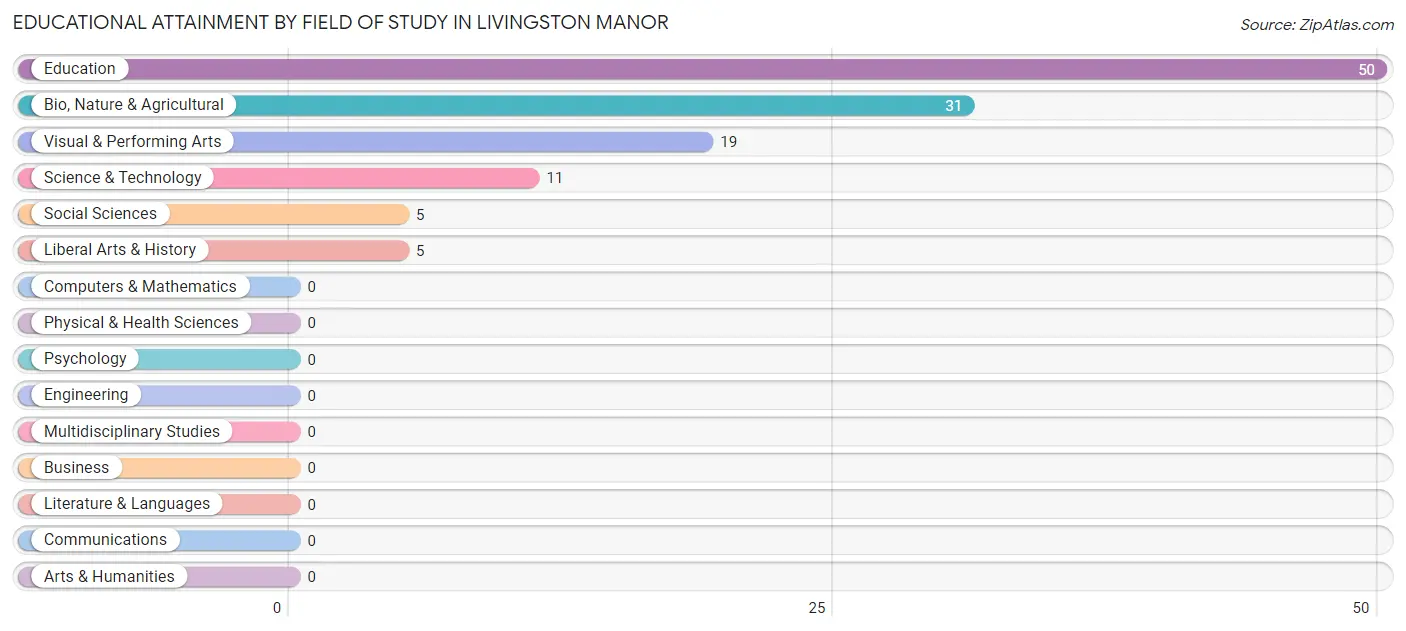
| Field of Study | # Graduates | % Graduates |
| Computers & Mathematics | 0 | 0.0% |
| Bio, Nature & Agricultural | 31 | 25.6% |
| Physical & Health Sciences | 0 | 0.0% |
| Psychology | 0 | 0.0% |
| Social Sciences | 5 | 4.1% |
| Engineering | 0 | 0.0% |
| Multidisciplinary Studies | 0 | 0.0% |
| Science & Technology | 11 | 9.1% |
| Business | 0 | 0.0% |
| Education | 50 | 41.3% |
| Literature & Languages | 0 | 0.0% |
| Liberal Arts & History | 5 | 4.1% |
| Visual & Performing Arts | 19 | 15.7% |
| Communications | 0 | 0.0% |
| Arts & Humanities | 0 | 0.0% |
| Total | 121 | 100.0% |
Transportation & Commute in Livingston Manor
Vehicle Availability by Sex in Livingston Manor
The most prevalent vehicle ownership categories in Livingston Manor are males with 2 vehicles (128, accounting for 71.1%) and females with 2 vehicles (112, making up 61.2%).
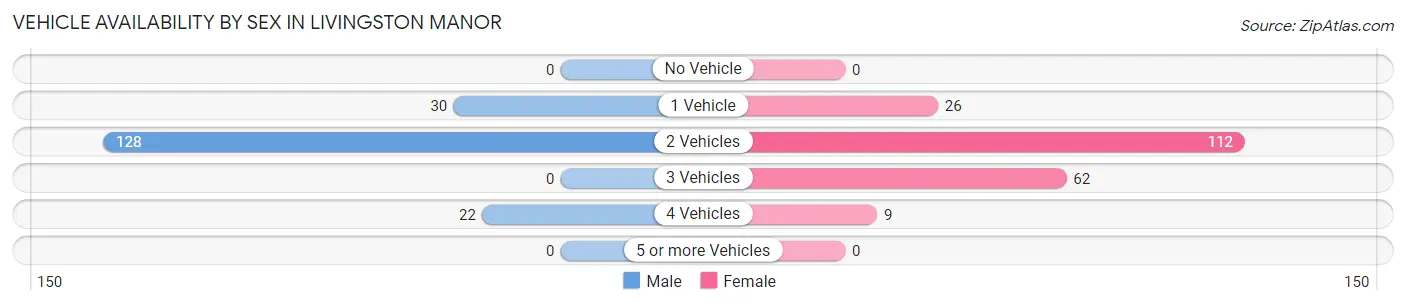
| Vehicles Available | Male | Female |
| No Vehicle | 0 (0.0%) | 0 (0.0%) |
| 1 Vehicle | 30 (16.7%) | 26 (12.4%) |
| 2 Vehicles | 128 (71.1%) | 112 (53.6%) |
| 3 Vehicles | 0 (0.0%) | 62 (29.7%) |
| 4 Vehicles | 22 (12.2%) | 9 (4.3%) |
| 5 or more Vehicles | 0 (0.0%) | 0 (0.0%) |
| Total | 180 (100.0%) | 209 (100.0%) |
Commute Time in Livingston Manor
The most frequently occuring commute durations in Livingston Manor are 25 to 29 minutes (94 commuters, 26.1%), 45 to 59 minutes (62 commuters, 17.2%), and 5 to 9 minutes (48 commuters, 13.3%).
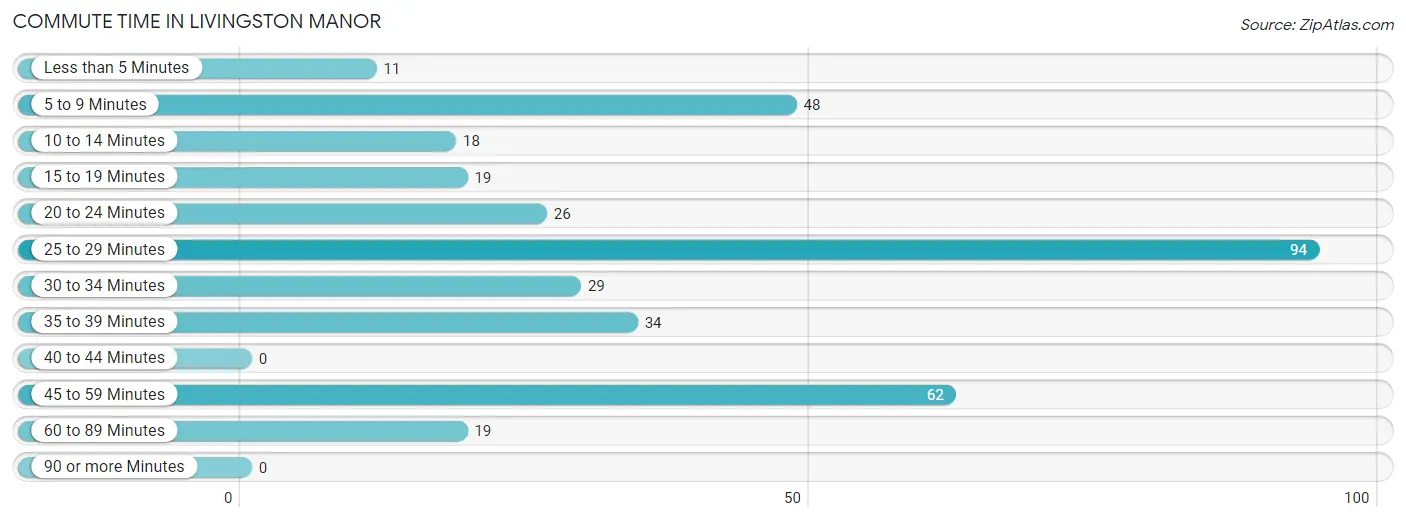
| Commute Time | # Commuters | % Commuters |
| Less than 5 Minutes | 11 | 3.1% |
| 5 to 9 Minutes | 48 | 13.3% |
| 10 to 14 Minutes | 18 | 5.0% |
| 15 to 19 Minutes | 19 | 5.3% |
| 20 to 24 Minutes | 26 | 7.2% |
| 25 to 29 Minutes | 94 | 26.1% |
| 30 to 34 Minutes | 29 | 8.1% |
| 35 to 39 Minutes | 34 | 9.4% |
| 40 to 44 Minutes | 0 | 0.0% |
| 45 to 59 Minutes | 62 | 17.2% |
| 60 to 89 Minutes | 19 | 5.3% |
| 90 or more Minutes | 0 | 0.0% |
Commute Time by Sex in Livingston Manor
The most common commute times in Livingston Manor are 25 to 29 minutes (94 commuters, 57.0%) for males and 45 to 59 minutes (62 commuters, 31.8%) for females.
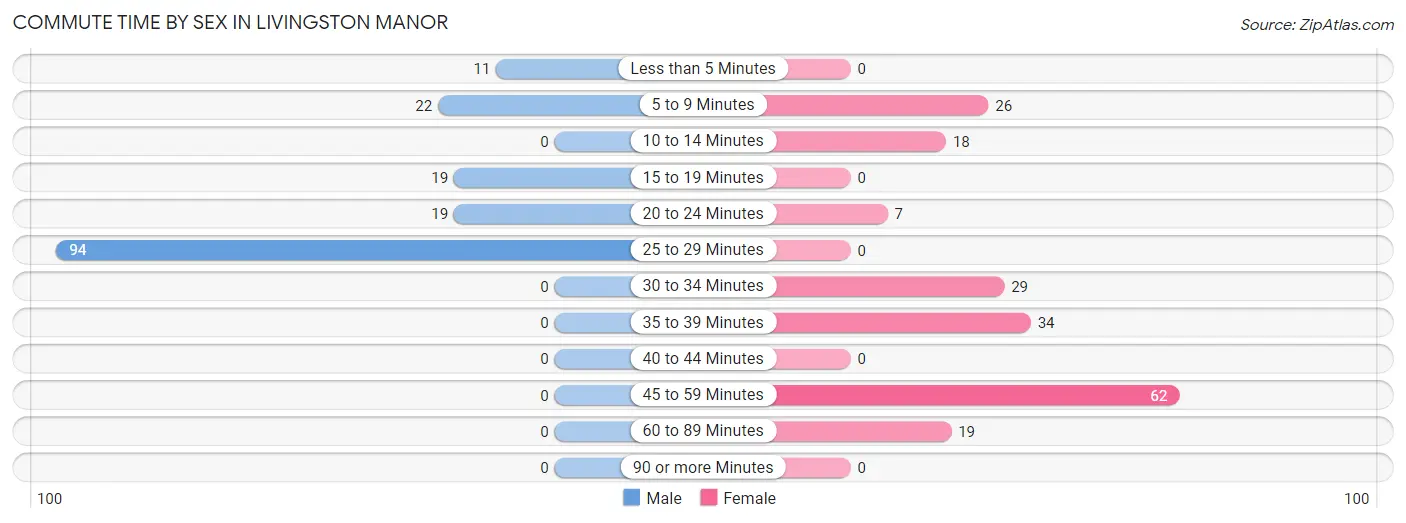
| Commute Time | Male | Female |
| Less than 5 Minutes | 11 (6.7%) | 0 (0.0%) |
| 5 to 9 Minutes | 22 (13.3%) | 26 (13.3%) |
| 10 to 14 Minutes | 0 (0.0%) | 18 (9.2%) |
| 15 to 19 Minutes | 19 (11.5%) | 0 (0.0%) |
| 20 to 24 Minutes | 19 (11.5%) | 7 (3.6%) |
| 25 to 29 Minutes | 94 (57.0%) | 0 (0.0%) |
| 30 to 34 Minutes | 0 (0.0%) | 29 (14.9%) |
| 35 to 39 Minutes | 0 (0.0%) | 34 (17.4%) |
| 40 to 44 Minutes | 0 (0.0%) | 0 (0.0%) |
| 45 to 59 Minutes | 0 (0.0%) | 62 (31.8%) |
| 60 to 89 Minutes | 0 (0.0%) | 19 (9.7%) |
| 90 or more Minutes | 0 (0.0%) | 0 (0.0%) |
Time of Departure to Work by Sex in Livingston Manor
The most frequent times of departure to work in Livingston Manor are 7:30 AM to 7:59 AM (61, 37.0%) for males and 10:00 AM to 10:59 AM (62, 31.8%) for females.
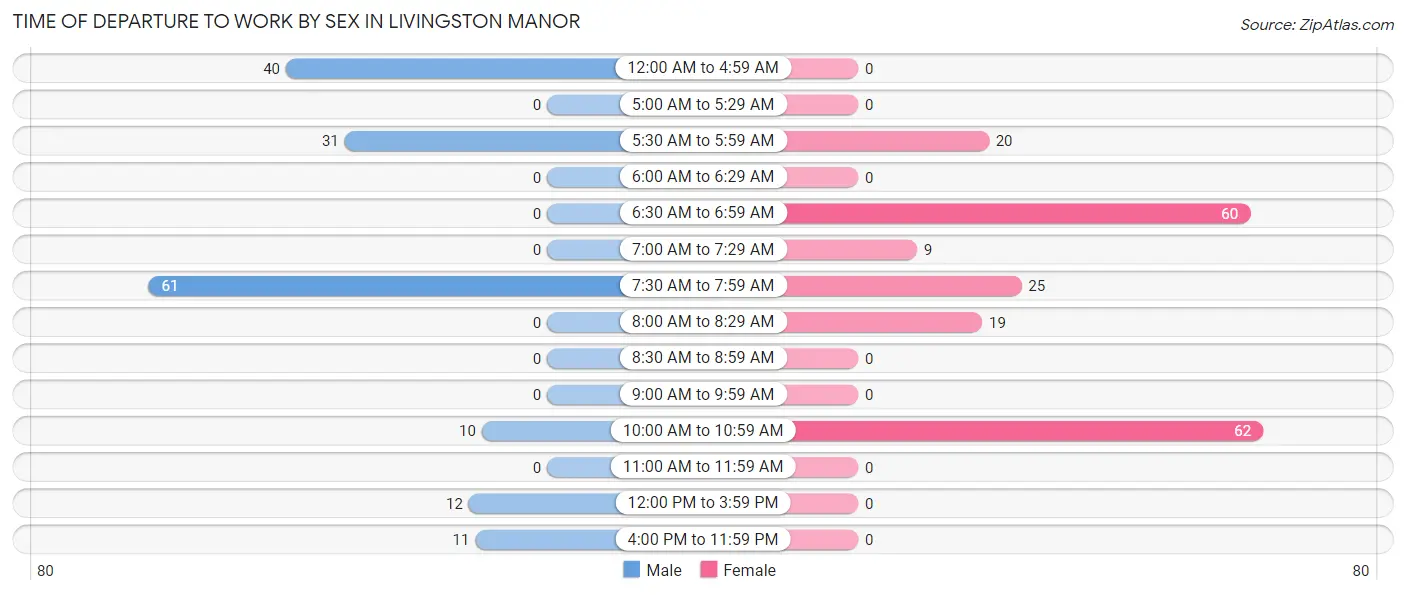
| Time of Departure | Male | Female |
| 12:00 AM to 4:59 AM | 40 (24.2%) | 0 (0.0%) |
| 5:00 AM to 5:29 AM | 0 (0.0%) | 0 (0.0%) |
| 5:30 AM to 5:59 AM | 31 (18.8%) | 20 (10.3%) |
| 6:00 AM to 6:29 AM | 0 (0.0%) | 0 (0.0%) |
| 6:30 AM to 6:59 AM | 0 (0.0%) | 60 (30.8%) |
| 7:00 AM to 7:29 AM | 0 (0.0%) | 9 (4.6%) |
| 7:30 AM to 7:59 AM | 61 (37.0%) | 25 (12.8%) |
| 8:00 AM to 8:29 AM | 0 (0.0%) | 19 (9.7%) |
| 8:30 AM to 8:59 AM | 0 (0.0%) | 0 (0.0%) |
| 9:00 AM to 9:59 AM | 0 (0.0%) | 0 (0.0%) |
| 10:00 AM to 10:59 AM | 10 (6.1%) | 62 (31.8%) |
| 11:00 AM to 11:59 AM | 0 (0.0%) | 0 (0.0%) |
| 12:00 PM to 3:59 PM | 12 (7.3%) | 0 (0.0%) |
| 4:00 PM to 11:59 PM | 11 (6.7%) | 0 (0.0%) |
| Total | 165 (100.0%) | 195 (100.0%) |
Housing Occupancy in Livingston Manor
Occupancy by Ownership in Livingston Manor
Of the total 389 dwellings in Livingston Manor, owner-occupied units account for 308 (79.2%), while renter-occupied units make up 81 (20.8%).
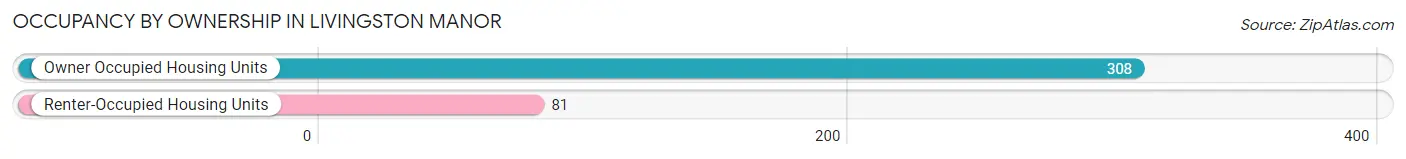
| Occupancy | # Housing Units | % Housing Units |
| Owner Occupied Housing Units | 308 | 79.2% |
| Renter-Occupied Housing Units | 81 | 20.8% |
| Total Occupied Housing Units | 389 | 100.0% |
Occupancy by Household Size in Livingston Manor
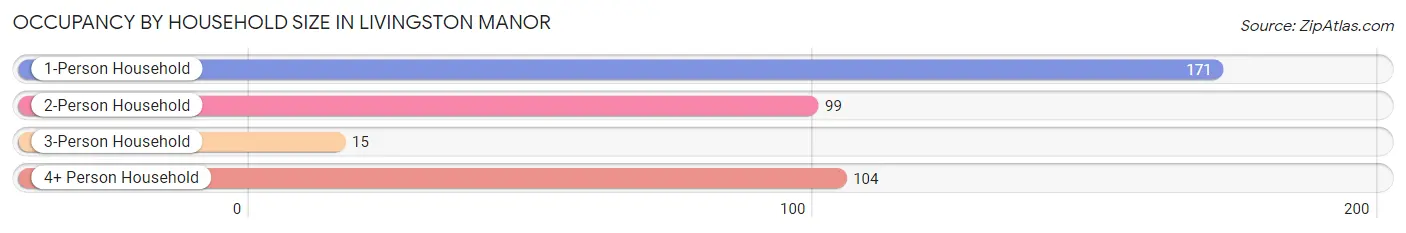
| Household Size | # Housing Units | % Housing Units |
| 1-Person Household | 171 | 44.0% |
| 2-Person Household | 99 | 25.5% |
| 3-Person Household | 15 | 3.9% |
| 4+ Person Household | 104 | 26.7% |
| Total Housing Units | 389 | 100.0% |
Occupancy by Ownership by Household Size in Livingston Manor
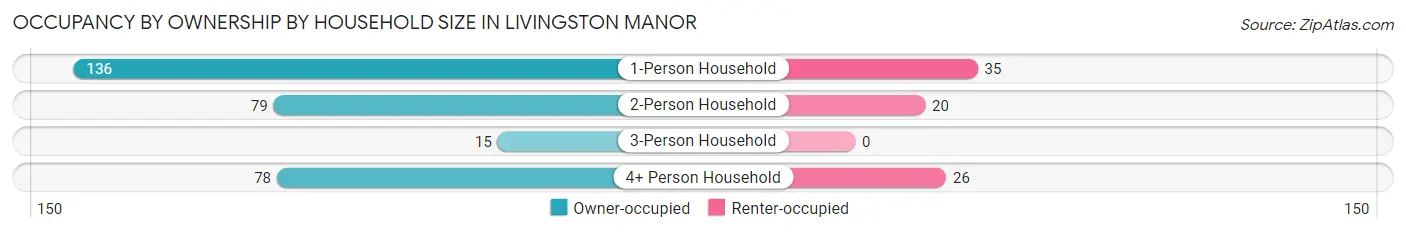
| Household Size | Owner-occupied | Renter-occupied |
| 1-Person Household | 136 (79.5%) | 35 (20.5%) |
| 2-Person Household | 79 (79.8%) | 20 (20.2%) |
| 3-Person Household | 15 (100.0%) | 0 (0.0%) |
| 4+ Person Household | 78 (75.0%) | 26 (25.0%) |
| Total Housing Units | 308 (79.2%) | 81 (20.8%) |
Occupancy by Educational Attainment in Livingston Manor
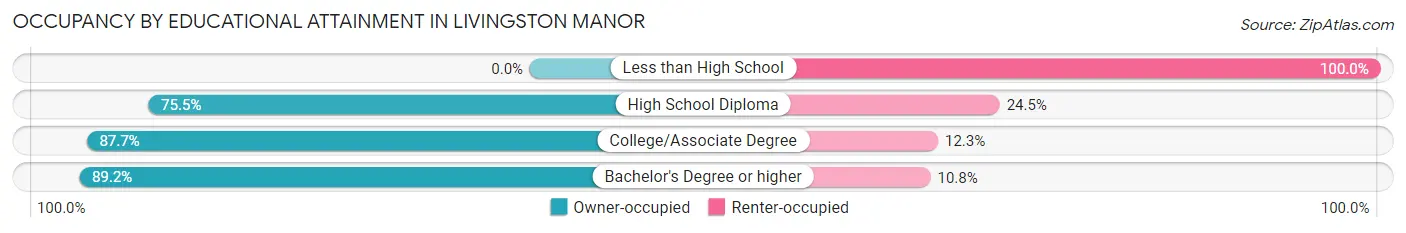
| Household Size | Owner-occupied | Renter-occupied |
| Less than High School | 0 (0.0%) | 26 (100.0%) |
| High School Diploma | 74 (75.5%) | 24 (24.5%) |
| College/Associate Degree | 143 (87.7%) | 20 (12.3%) |
| Bachelor's Degree or higher | 91 (89.2%) | 11 (10.8%) |
Occupancy by Age of Householder in Livingston Manor
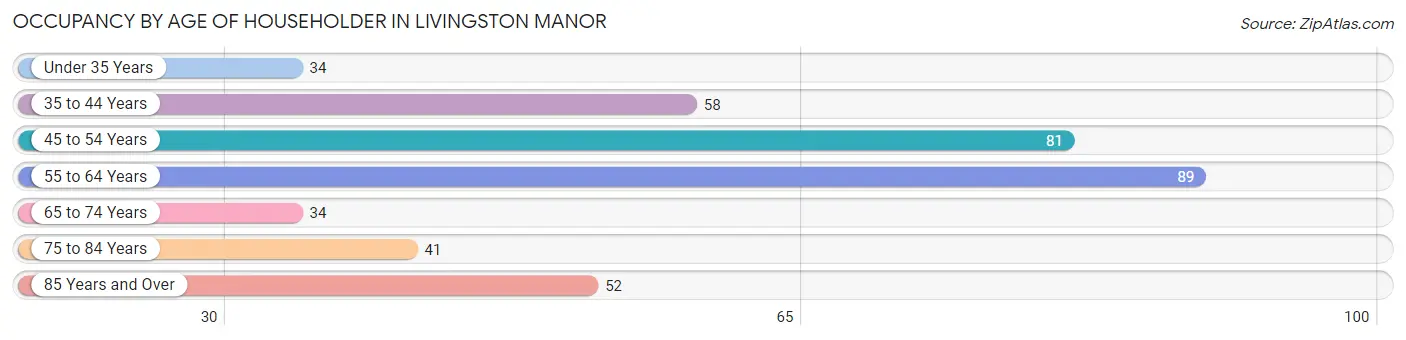
| Age Bracket | # Households | % Households |
| Under 35 Years | 34 | 8.7% |
| 35 to 44 Years | 58 | 14.9% |
| 45 to 54 Years | 81 | 20.8% |
| 55 to 64 Years | 89 | 22.9% |
| 65 to 74 Years | 34 | 8.7% |
| 75 to 84 Years | 41 | 10.5% |
| 85 Years and Over | 52 | 13.4% |
| Total | 389 | 100.0% |
Housing Finances in Livingston Manor
Median Income by Occupancy in Livingston Manor
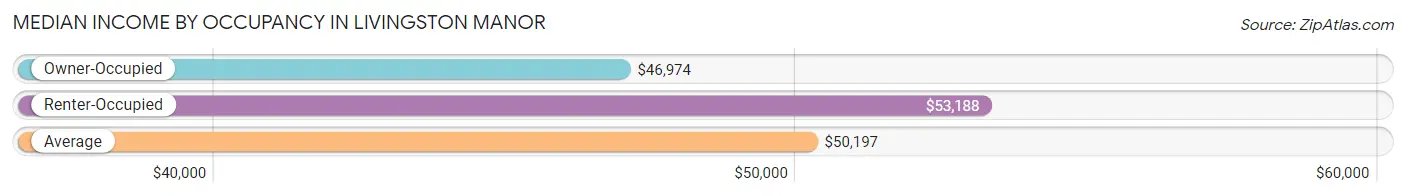
| Occupancy Type | # Households | Median Income |
| Owner-Occupied | 308 (79.2%) | $46,974 |
| Renter-Occupied | 81 (20.8%) | $53,188 |
| Average | 389 (100.0%) | $50,197 |
Occupancy by Householder Income Bracket in Livingston Manor
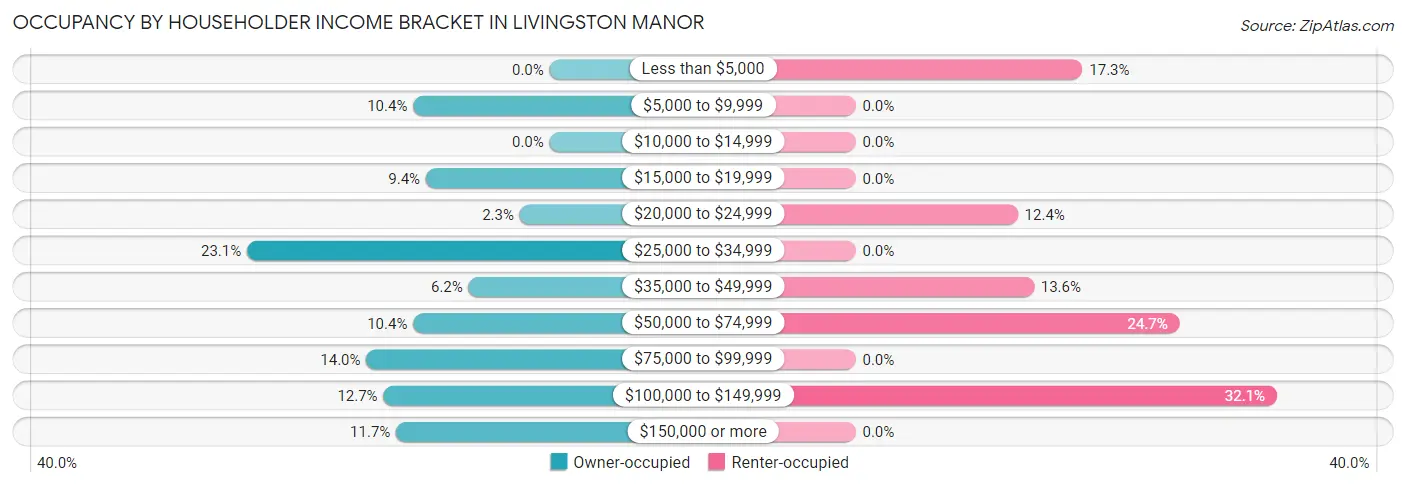
| Income Bracket | Owner-occupied | Renter-occupied |
| Less than $5,000 | 0 (0.0%) | 14 (17.3%) |
| $5,000 to $9,999 | 32 (10.4%) | 0 (0.0%) |
| $10,000 to $14,999 | 0 (0.0%) | 0 (0.0%) |
| $15,000 to $19,999 | 29 (9.4%) | 0 (0.0%) |
| $20,000 to $24,999 | 7 (2.3%) | 10 (12.3%) |
| $25,000 to $34,999 | 71 (23.1%) | 0 (0.0%) |
| $35,000 to $49,999 | 19 (6.2%) | 11 (13.6%) |
| $50,000 to $74,999 | 32 (10.4%) | 20 (24.7%) |
| $75,000 to $99,999 | 43 (14.0%) | 0 (0.0%) |
| $100,000 to $149,999 | 39 (12.7%) | 26 (32.1%) |
| $150,000 or more | 36 (11.7%) | 0 (0.0%) |
| Total | 308 (100.0%) | 81 (100.0%) |
Monthly Housing Cost Tiers in Livingston Manor
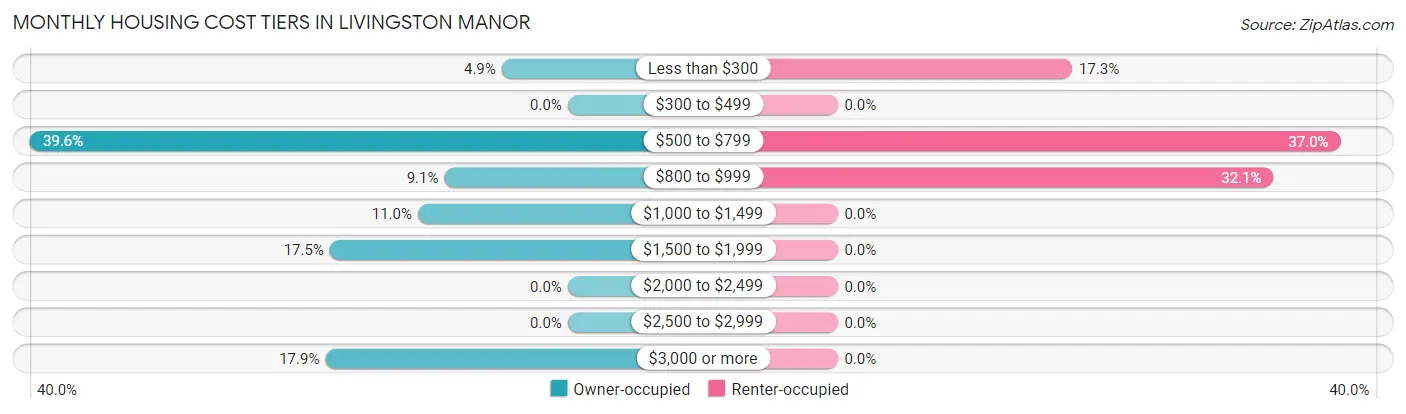
| Monthly Cost | Owner-occupied | Renter-occupied |
| Less than $300 | 15 (4.9%) | 14 (17.3%) |
| $300 to $499 | 0 (0.0%) | 0 (0.0%) |
| $500 to $799 | 122 (39.6%) | 30 (37.0%) |
| $800 to $999 | 28 (9.1%) | 26 (32.1%) |
| $1,000 to $1,499 | 34 (11.0%) | 0 (0.0%) |
| $1,500 to $1,999 | 54 (17.5%) | 0 (0.0%) |
| $2,000 to $2,499 | 0 (0.0%) | 0 (0.0%) |
| $2,500 to $2,999 | 0 (0.0%) | 0 (0.0%) |
| $3,000 or more | 55 (17.9%) | 0 (0.0%) |
| Total | 308 (100.0%) | 81 (100.0%) |
Physical Housing Characteristics in Livingston Manor
Housing Structures in Livingston Manor
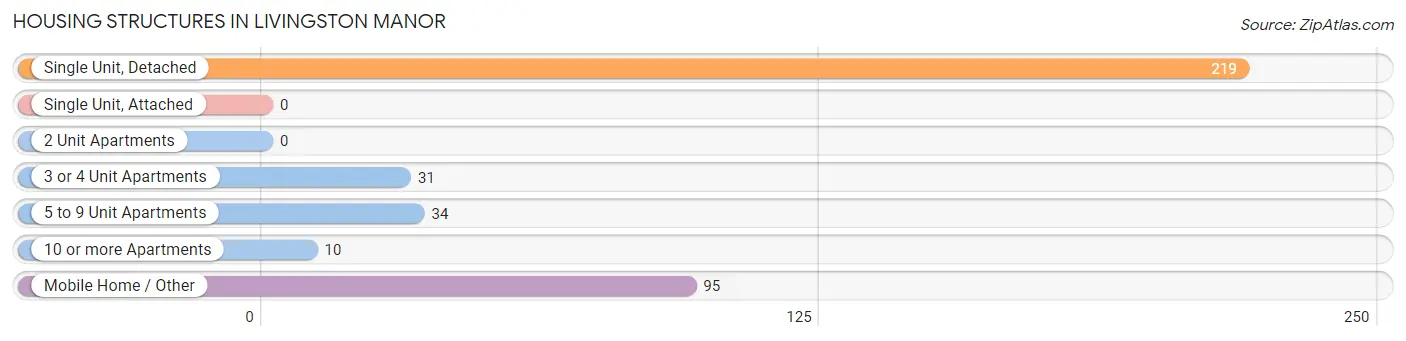
| Structure Type | # Housing Units | % Housing Units |
| Single Unit, Detached | 219 | 56.3% |
| Single Unit, Attached | 0 | 0.0% |
| 2 Unit Apartments | 0 | 0.0% |
| 3 or 4 Unit Apartments | 31 | 8.0% |
| 5 to 9 Unit Apartments | 34 | 8.7% |
| 10 or more Apartments | 10 | 2.6% |
| Mobile Home / Other | 95 | 24.4% |
| Total | 389 | 100.0% |
Housing Structures by Occupancy in Livingston Manor
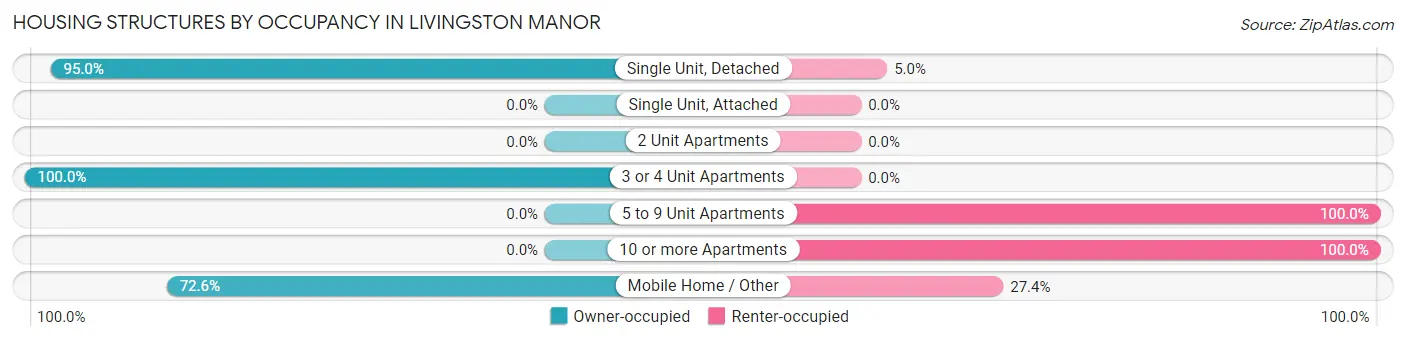
| Structure Type | Owner-occupied | Renter-occupied |
| Single Unit, Detached | 208 (95.0%) | 11 (5.0%) |
| Single Unit, Attached | 0 (0.0%) | 0 (0.0%) |
| 2 Unit Apartments | 0 (0.0%) | 0 (0.0%) |
| 3 or 4 Unit Apartments | 31 (100.0%) | 0 (0.0%) |
| 5 to 9 Unit Apartments | 0 (0.0%) | 34 (100.0%) |
| 10 or more Apartments | 0 (0.0%) | 10 (100.0%) |
| Mobile Home / Other | 69 (72.6%) | 26 (27.4%) |
| Total | 308 (79.2%) | 81 (20.8%) |
Housing Structures by Number of Rooms in Livingston Manor
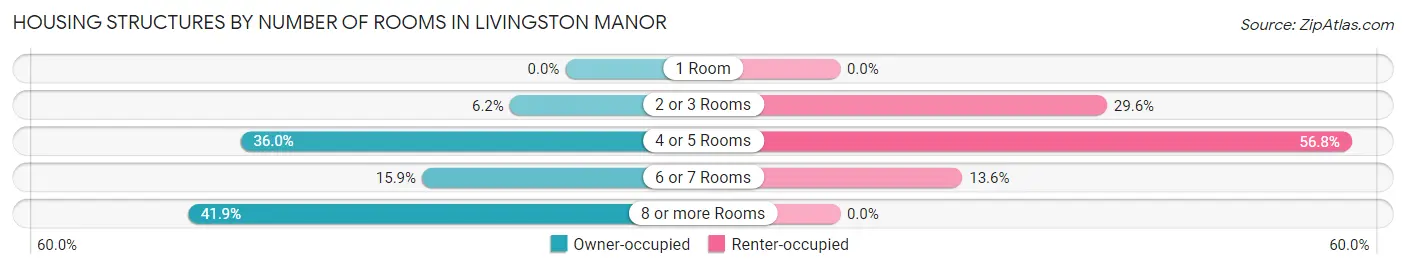
| Number of Rooms | Owner-occupied | Renter-occupied |
| 1 Room | 0 (0.0%) | 0 (0.0%) |
| 2 or 3 Rooms | 19 (6.2%) | 24 (29.6%) |
| 4 or 5 Rooms | 111 (36.0%) | 46 (56.8%) |
| 6 or 7 Rooms | 49 (15.9%) | 11 (13.6%) |
| 8 or more Rooms | 129 (41.9%) | 0 (0.0%) |
| Total | 308 (100.0%) | 81 (100.0%) |
Housing Structure by Heating Type in Livingston Manor
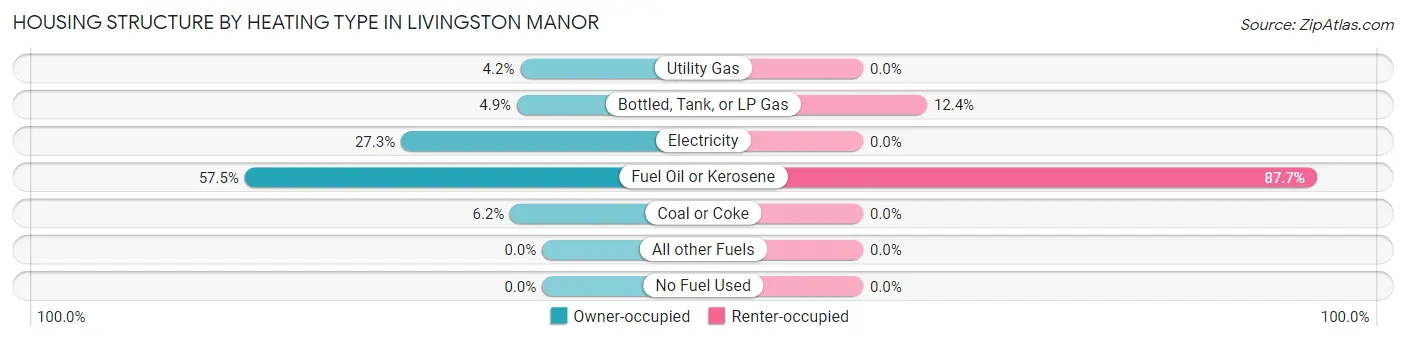
| Heating Type | Owner-occupied | Renter-occupied |
| Utility Gas | 13 (4.2%) | 0 (0.0%) |
| Bottled, Tank, or LP Gas | 15 (4.9%) | 10 (12.3%) |
| Electricity | 84 (27.3%) | 0 (0.0%) |
| Fuel Oil or Kerosene | 177 (57.5%) | 71 (87.6%) |
| Coal or Coke | 19 (6.2%) | 0 (0.0%) |
| All other Fuels | 0 (0.0%) | 0 (0.0%) |
| No Fuel Used | 0 (0.0%) | 0 (0.0%) |
| Total | 308 (100.0%) | 81 (100.0%) |
Household Vehicle Usage in Livingston Manor
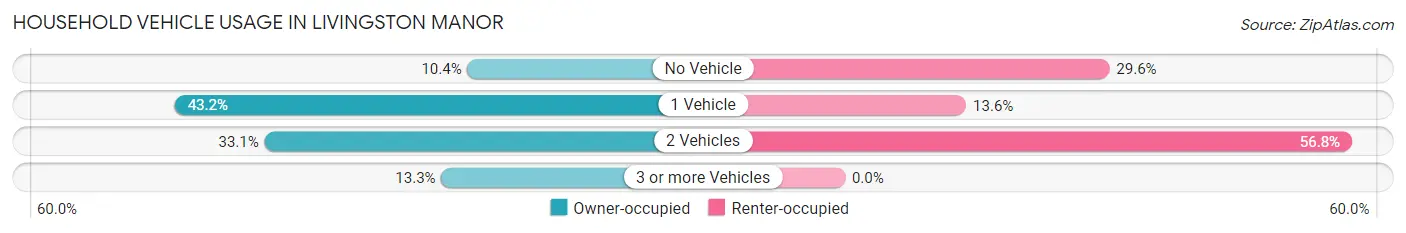
| Vehicles per Household | Owner-occupied | Renter-occupied |
| No Vehicle | 32 (10.4%) | 24 (29.6%) |
| 1 Vehicle | 133 (43.2%) | 11 (13.6%) |
| 2 Vehicles | 102 (33.1%) | 46 (56.8%) |
| 3 or more Vehicles | 41 (13.3%) | 0 (0.0%) |
| Total | 308 (100.0%) | 81 (100.0%) |
Real Estate & Mortgages in Livingston Manor
Real Estate and Mortgage Overview in Livingston Manor
| Characteristic | Without Mortgage | With Mortgage |
| Housing Units | 161 | 147 |
| Median Property Value | - | - |
| Median Household Income | $29,145 | $21 |
| Monthly Housing Costs | $583 | $55 |
| Real Estate Taxes | $3,453 | $31 |
Property Value by Mortgage Status in Livingston Manor
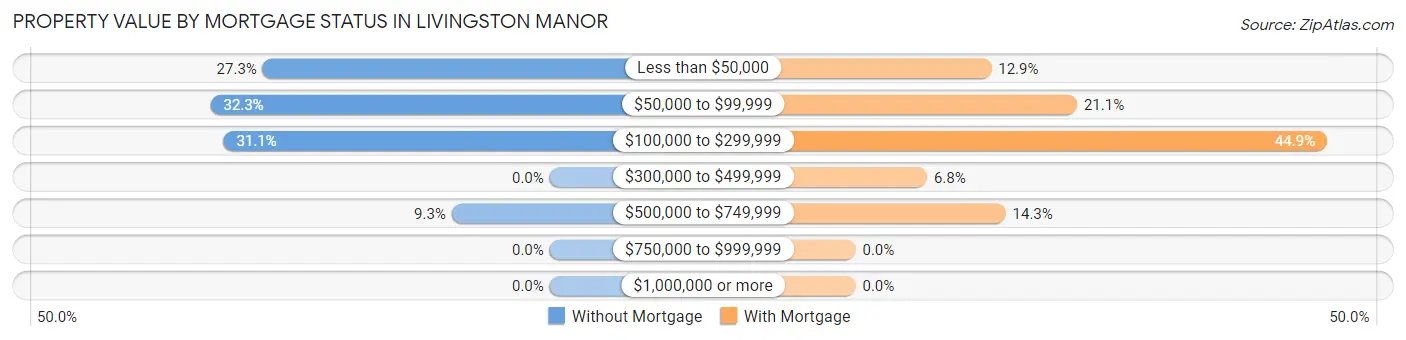
| Property Value | Without Mortgage | With Mortgage |
| Less than $50,000 | 44 (27.3%) | 19 (12.9%) |
| $50,000 to $99,999 | 52 (32.3%) | 31 (21.1%) |
| $100,000 to $299,999 | 50 (31.1%) | 66 (44.9%) |
| $300,000 to $499,999 | 0 (0.0%) | 10 (6.8%) |
| $500,000 to $749,999 | 15 (9.3%) | 21 (14.3%) |
| $750,000 to $999,999 | 0 (0.0%) | 0 (0.0%) |
| $1,000,000 or more | 0 (0.0%) | 0 (0.0%) |
| Total | 161 (100.0%) | 147 (100.0%) |
Household Income by Mortgage Status in Livingston Manor
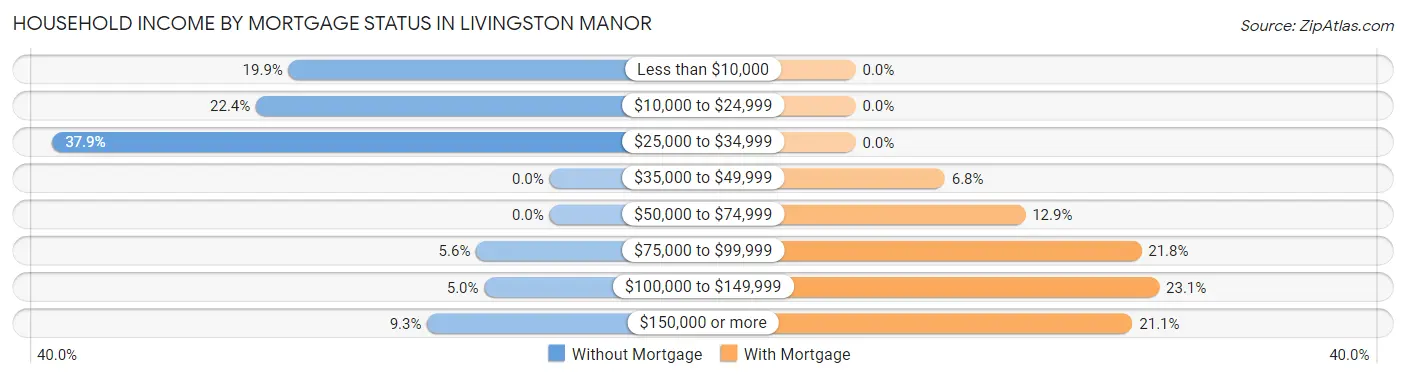
| Household Income | Without Mortgage | With Mortgage |
| Less than $10,000 | 32 (19.9%) | 0 (0.0%) |
| $10,000 to $24,999 | 36 (22.4%) | 0 (0.0%) |
| $25,000 to $34,999 | 61 (37.9%) | 0 (0.0%) |
| $35,000 to $49,999 | 0 (0.0%) | 10 (6.8%) |
| $50,000 to $74,999 | 0 (0.0%) | 19 (12.9%) |
| $75,000 to $99,999 | 9 (5.6%) | 32 (21.8%) |
| $100,000 to $149,999 | 8 (5.0%) | 34 (23.1%) |
| $150,000 or more | 15 (9.3%) | 31 (21.1%) |
| Total | 161 (100.0%) | 147 (100.0%) |
Property Value to Household Income Ratio in Livingston Manor
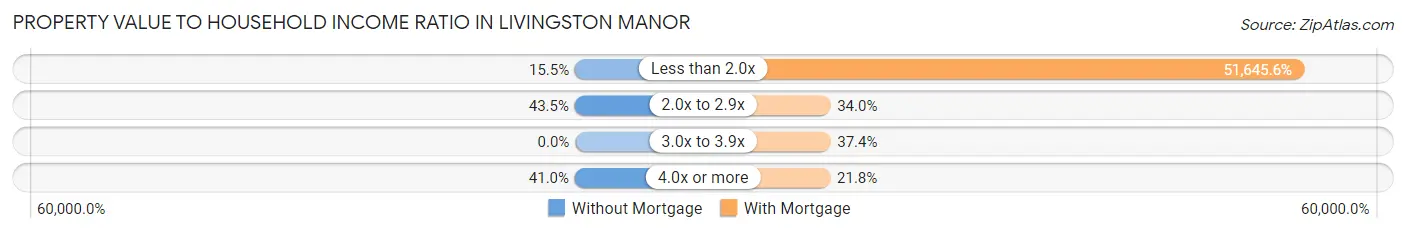
| Value-to-Income Ratio | Without Mortgage | With Mortgage |
| Less than 2.0x | 25 (15.5%) | 75,919 (51,645.6%) |
| 2.0x to 2.9x | 70 (43.5%) | 50 (34.0%) |
| 3.0x to 3.9x | 0 (0.0%) | 55 (37.4%) |
| 4.0x or more | 66 (41.0%) | 32 (21.8%) |
| Total | 161 (100.0%) | 147 (100.0%) |
Real Estate Taxes by Mortgage Status in Livingston Manor
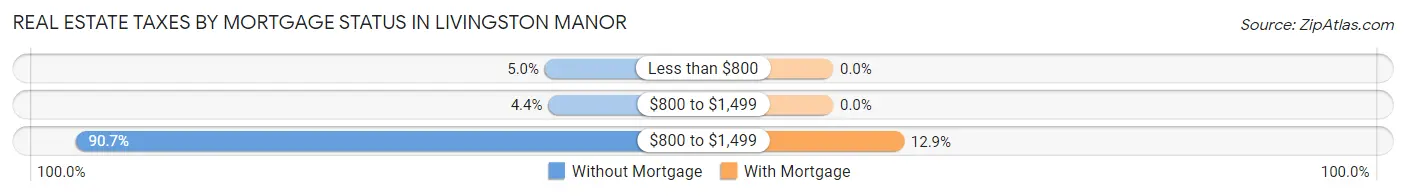
| Property Taxes | Without Mortgage | With Mortgage |
| Less than $800 | 8 (5.0%) | 0 (0.0%) |
| $800 to $1,499 | 7 (4.3%) | 0 (0.0%) |
| $800 to $1,499 | 146 (90.7%) | 19 (12.9%) |
| Total | 161 (100.0%) | 147 (100.0%) |
Health & Disability in Livingston Manor
Health Insurance Coverage by Age in Livingston Manor
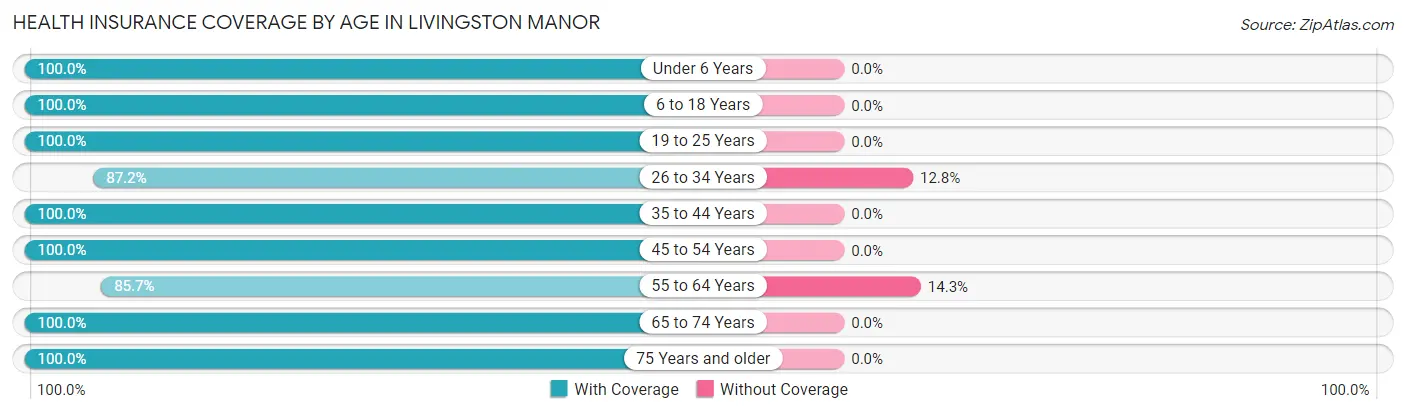
| Age Bracket | With Coverage | Without Coverage |
| Under 6 Years | 92 (100.0%) | 0 (0.0%) |
| 6 to 18 Years | 140 (100.0%) | 0 (0.0%) |
| 19 to 25 Years | 19 (100.0%) | 0 (0.0%) |
| 26 to 34 Years | 34 (87.2%) | 5 (12.8%) |
| 35 to 44 Years | 121 (100.0%) | 0 (0.0%) |
| 45 to 54 Years | 123 (100.0%) | 0 (0.0%) |
| 55 to 64 Years | 120 (85.7%) | 20 (14.3%) |
| 65 to 74 Years | 96 (100.0%) | 0 (0.0%) |
| 75 Years and older | 93 (100.0%) | 0 (0.0%) |
| Total | 838 (97.1%) | 25 (2.9%) |
Health Insurance Coverage by Citizenship Status in Livingston Manor
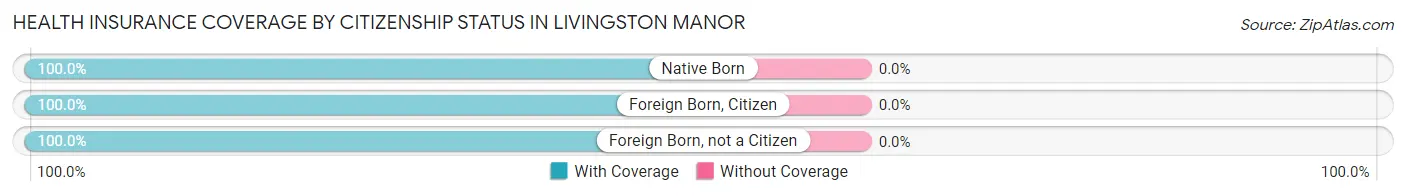
| Citizenship Status | With Coverage | Without Coverage |
| Native Born | 92 (100.0%) | 0 (0.0%) |
| Foreign Born, Citizen | 140 (100.0%) | 0 (0.0%) |
| Foreign Born, not a Citizen | 19 (100.0%) | 0 (0.0%) |
Health Insurance Coverage by Household Income in Livingston Manor
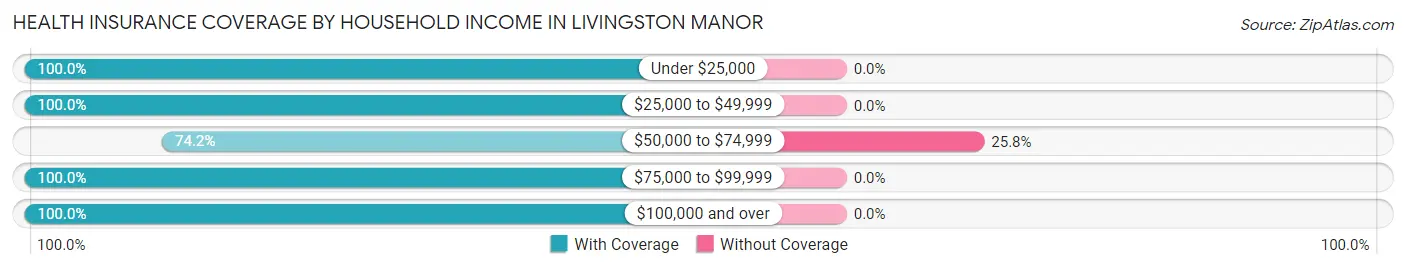
| Household Income | With Coverage | Without Coverage |
| Under $25,000 | 121 (100.0%) | 0 (0.0%) |
| $25,000 to $49,999 | 151 (100.0%) | 0 (0.0%) |
| $50,000 to $74,999 | 72 (74.2%) | 25 (25.8%) |
| $75,000 to $99,999 | 165 (100.0%) | 0 (0.0%) |
| $100,000 and over | 327 (100.0%) | 0 (0.0%) |
Public vs Private Health Insurance Coverage by Age in Livingston Manor
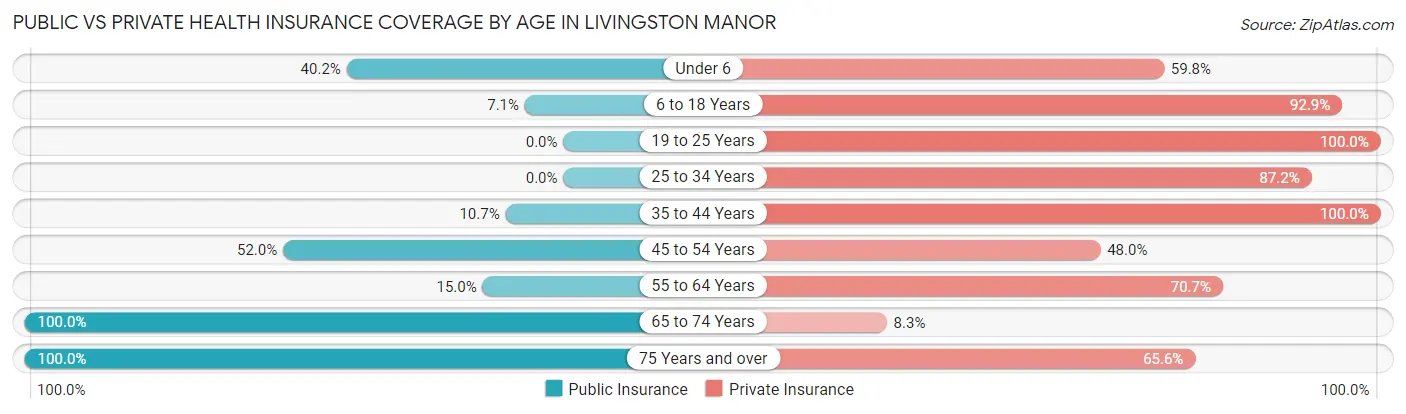
| Age Bracket | Public Insurance | Private Insurance |
| Under 6 | 37 (40.2%) | 55 (59.8%) |
| 6 to 18 Years | 10 (7.1%) | 130 (92.9%) |
| 19 to 25 Years | 0 (0.0%) | 19 (100.0%) |
| 25 to 34 Years | 0 (0.0%) | 34 (87.2%) |
| 35 to 44 Years | 13 (10.7%) | 121 (100.0%) |
| 45 to 54 Years | 64 (52.0%) | 59 (48.0%) |
| 55 to 64 Years | 21 (15.0%) | 99 (70.7%) |
| 65 to 74 Years | 96 (100.0%) | 8 (8.3%) |
| 75 Years and over | 93 (100.0%) | 61 (65.6%) |
| Total | 334 (38.7%) | 586 (67.9%) |
Disability Status by Sex by Age in Livingston Manor
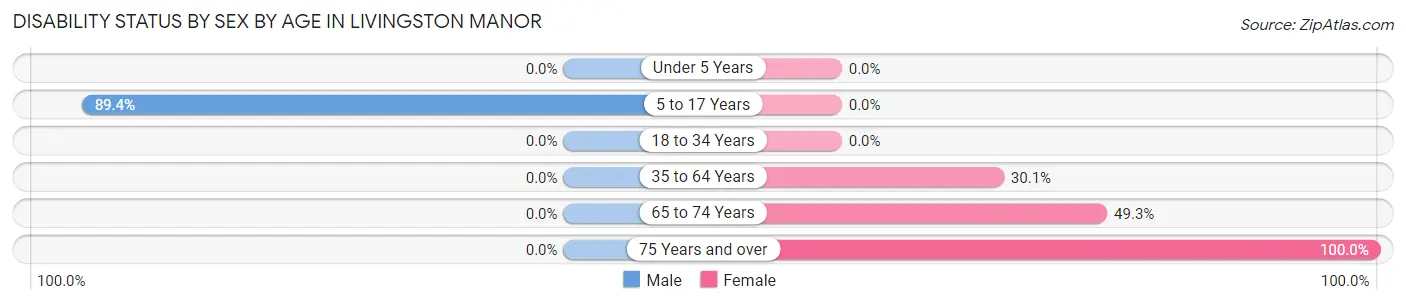
| Age Bracket | Male | Female |
| Under 5 Years | 0 (0.0%) | 0 (0.0%) |
| 5 to 17 Years | 59 (89.4%) | 0 (0.0%) |
| 18 to 34 Years | 0 (0.0%) | 0 (0.0%) |
| 35 to 64 Years | 0 (0.0%) | 65 (30.1%) |
| 65 to 74 Years | 0 (0.0%) | 33 (49.2%) |
| 75 Years and over | 0 (0.0%) | 93 (100.0%) |
Disability Class by Sex by Age in Livingston Manor
Disability Class: Hearing Difficulty
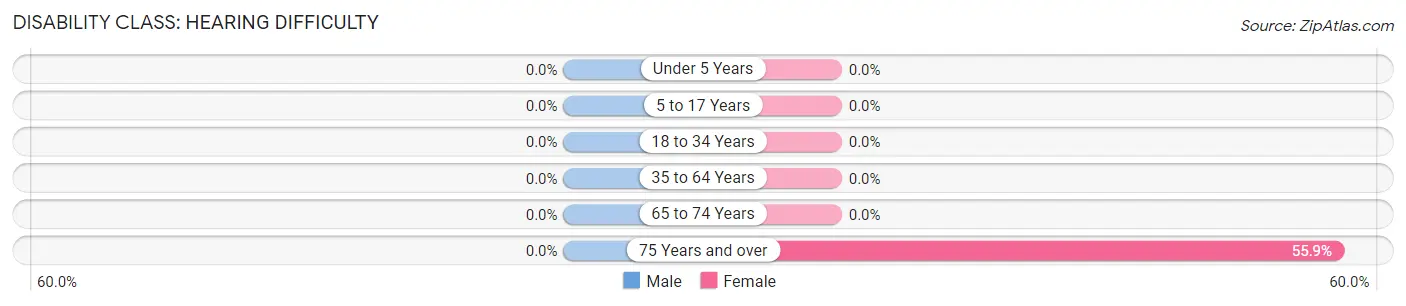
| Age Bracket | Male | Female |
| Under 5 Years | 0 (0.0%) | 0 (0.0%) |
| 5 to 17 Years | 0 (0.0%) | 0 (0.0%) |
| 18 to 34 Years | 0 (0.0%) | 0 (0.0%) |
| 35 to 64 Years | 0 (0.0%) | 0 (0.0%) |
| 65 to 74 Years | 0 (0.0%) | 0 (0.0%) |
| 75 Years and over | 0 (0.0%) | 52 (55.9%) |
Disability Class: Vision Difficulty
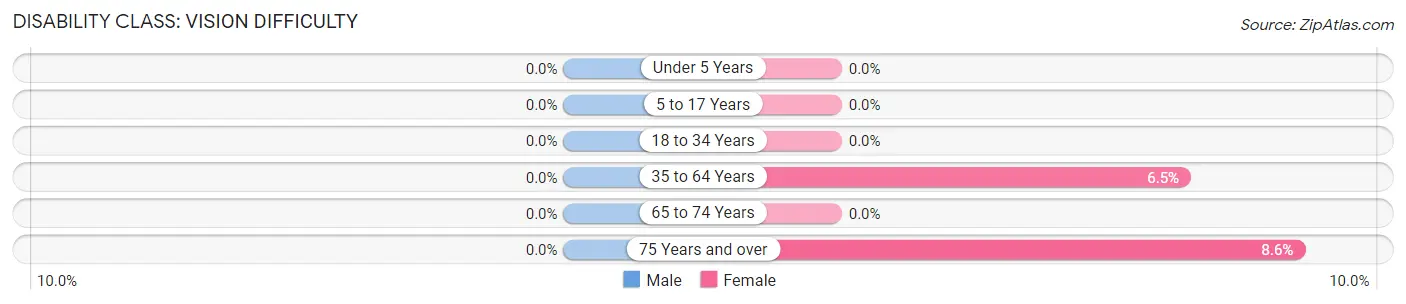
| Age Bracket | Male | Female |
| Under 5 Years | 0 (0.0%) | 0 (0.0%) |
| 5 to 17 Years | 0 (0.0%) | 0 (0.0%) |
| 18 to 34 Years | 0 (0.0%) | 0 (0.0%) |
| 35 to 64 Years | 0 (0.0%) | 14 (6.5%) |
| 65 to 74 Years | 0 (0.0%) | 0 (0.0%) |
| 75 Years and over | 0 (0.0%) | 8 (8.6%) |
Disability Class: Cognitive Difficulty
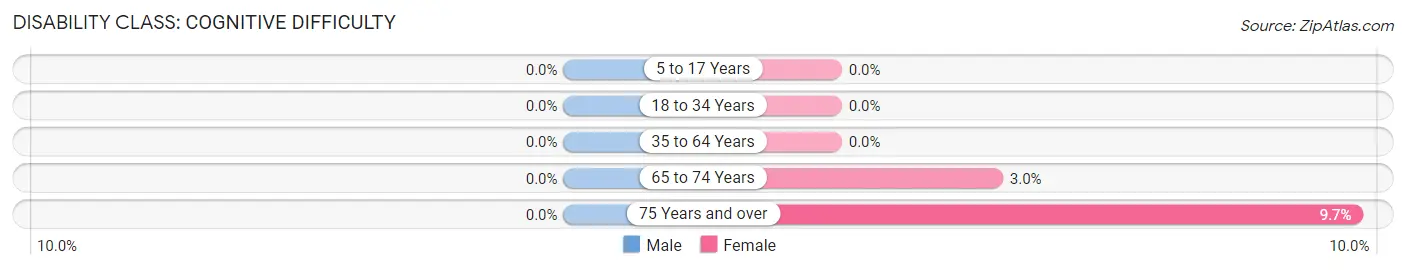
| Age Bracket | Male | Female |
| 5 to 17 Years | 0 (0.0%) | 0 (0.0%) |
| 18 to 34 Years | 0 (0.0%) | 0 (0.0%) |
| 35 to 64 Years | 0 (0.0%) | 0 (0.0%) |
| 65 to 74 Years | 0 (0.0%) | 2 (3.0%) |
| 75 Years and over | 0 (0.0%) | 9 (9.7%) |
Disability Class: Ambulatory Difficulty
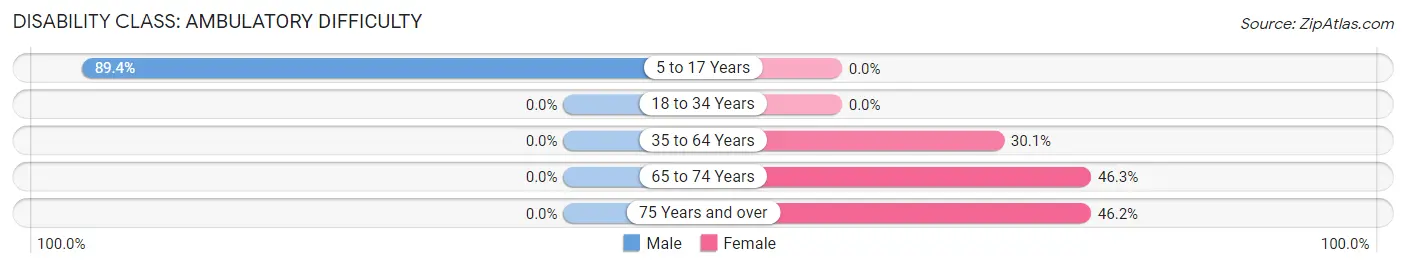
| Age Bracket | Male | Female |
| 5 to 17 Years | 59 (89.4%) | 0 (0.0%) |
| 18 to 34 Years | 0 (0.0%) | 0 (0.0%) |
| 35 to 64 Years | 0 (0.0%) | 65 (30.1%) |
| 65 to 74 Years | 0 (0.0%) | 31 (46.3%) |
| 75 Years and over | 0 (0.0%) | 43 (46.2%) |
Disability Class: Self-Care Difficulty
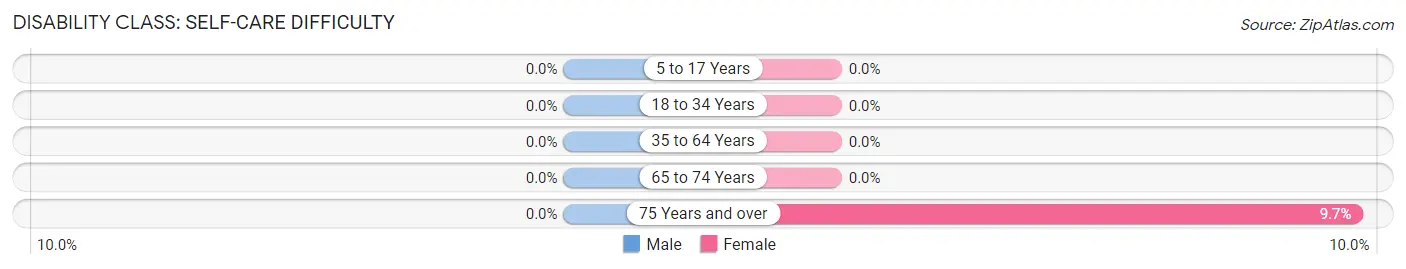
| Age Bracket | Male | Female |
| 5 to 17 Years | 0 (0.0%) | 0 (0.0%) |
| 18 to 34 Years | 0 (0.0%) | 0 (0.0%) |
| 35 to 64 Years | 0 (0.0%) | 0 (0.0%) |
| 65 to 74 Years | 0 (0.0%) | 0 (0.0%) |
| 75 Years and over | 0 (0.0%) | 9 (9.7%) |
Technology Access in Livingston Manor
Computing Device Access in Livingston Manor
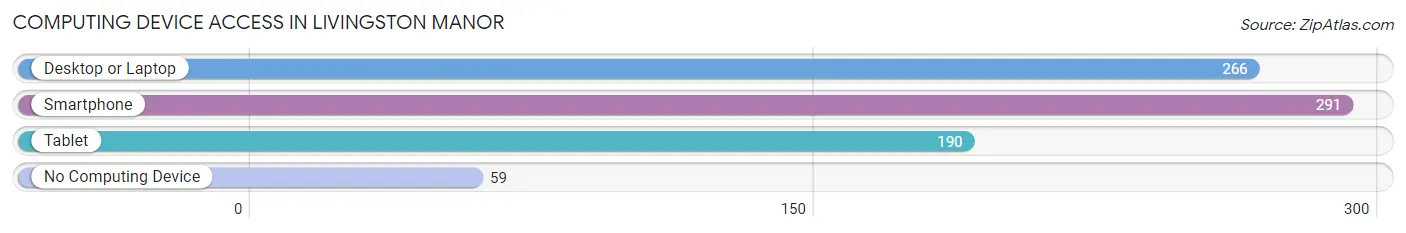
| Device Type | # Households | % Households |
| Desktop or Laptop | 266 | 68.4% |
| Smartphone | 291 | 74.8% |
| Tablet | 190 | 48.8% |
| No Computing Device | 59 | 15.2% |
| Total | 389 | 100.0% |
Internet Access in Livingston Manor
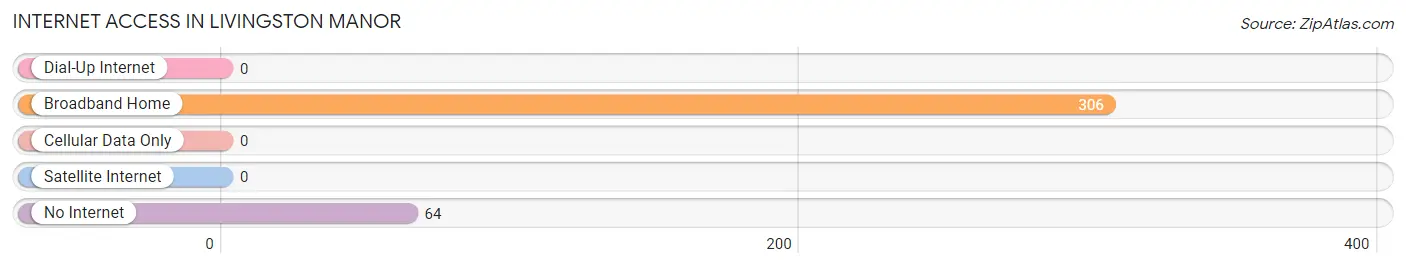
| Internet Type | # Households | % Households |
| Dial-Up Internet | 0 | 0.0% |
| Broadband Home | 306 | 78.7% |
| Cellular Data Only | 0 | 0.0% |
| Satellite Internet | 0 | 0.0% |
| No Internet | 64 | 16.5% |
| Total | 389 | 100.0% |
Livingston Manor Summary
Livingston Manor is a small hamlet located in Sullivan County, New York. It is situated in the Catskill Mountains, approximately two hours from New York City. The hamlet is home to a population of approximately 1,000 people and is known for its rural charm and natural beauty.
History
Livingston Manor was first settled in the late 1700s by a group of Dutch settlers. The hamlet was named after the Livingston family, who were prominent landowners in the area. The hamlet was originally a farming community, with the main crops being potatoes, corn, and hay. In the late 1800s, the hamlet began to grow as a tourist destination, with many people coming to the area to enjoy the natural beauty of the Catskill Mountains.
In the early 1900s, the hamlet began to experience a decline in population as many of the residents moved away to larger cities. However, in the late 1950s, the hamlet experienced a resurgence in popularity as a tourist destination. This was due to the opening of the nearby Belleayre Ski Center, which brought many visitors to the area.
Geography
Livingston Manor is located in the Catskill Mountains of Sullivan County, New York. The hamlet is situated at an elevation of 1,400 feet and is surrounded by the Catskill State Park. The hamlet is located approximately two hours from New York City and is accessible by car or bus.
The hamlet is home to a variety of natural features, including the Beaverkill River, which runs through the hamlet. The hamlet is also home to a variety of wildlife, including deer, bears, and wild turkeys.
Economy
Livingston Manor is primarily a tourist destination, with many visitors coming to the area to enjoy the natural beauty of the Catskill Mountains. The hamlet is home to a variety of businesses, including restaurants, shops, and lodging. The hamlet is also home to the Belleayre Ski Center, which is a popular destination for skiing and snowboarding.
The hamlet is also home to a variety of small businesses, including a local brewery, a winery, and a distillery. The hamlet is also home to a variety of art galleries and antique shops.
Demographics
As of the 2010 census, the population of Livingston Manor was 1,000 people. The median age of the population was 44.7 years, and the median household income was $45,000. The majority of the population (90%) was white, and the remaining 10% was made up of other races.
The hamlet is home to a variety of religious denominations, including Catholic, Protestant, and Jewish. The hamlet is also home to a variety of cultural events, including the annual Catskill Mountain Music Festival.
Conclusion
Livingston Manor is a small hamlet located in Sullivan County, New York. It is situated in the Catskill Mountains and is known for its rural charm and natural beauty. The hamlet is home to a population of approximately 1,000 people and is primarily a tourist destination. The hamlet is home to a variety of businesses, including restaurants, shops, and lodging. The hamlet is also home to a variety of small businesses, including a local brewery, a winery, and a distillery. The hamlet is also home to a variety of cultural events, including the annual Catskill Mountain Music Festival.
Common Questions
What is Per Capita Income in Livingston Manor?
Per Capita income in Livingston Manor is $28,733.
What is the Median Family Income in Livingston Manor?
Median Family Income in Livingston Manor is $76,324.
What is the Median Household income in Livingston Manor?
Median Household Income in Livingston Manor is $50,197.
What is Income or Wage Gap in Livingston Manor?
Income or Wage Gap in Livingston Manor is 0.8%.
Women in Livingston Manor earn 99.2 cents for every dollar earned by a man.
What is Inequality or Gini Index in Livingston Manor?
Inequality or Gini Index in Livingston Manor is 0.43.
What is the Total Population of Livingston Manor?
Total Population of Livingston Manor is 863.
What is the Total Male Population of Livingston Manor?
Total Male Population of Livingston Manor is 305.
What is the Total Female Population of Livingston Manor?
Total Female Population of Livingston Manor is 558.
What is the Ratio of Males per 100 Females in Livingston Manor?
There are 54.66 Males per 100 Females in Livingston Manor.
What is the Ratio of Females per 100 Males in Livingston Manor?
There are 182.95 Females per 100 Males in Livingston Manor.
What is the Median Population Age in Livingston Manor?
Median Population Age in Livingston Manor is 50.3 Years.
What is the Average Family Size in Livingston Manor
Average Family Size in Livingston Manor is 3.1 People.
What is the Average Household Size in Livingston Manor
Average Household Size in Livingston Manor is 2.2 People.
How Large is the Labor Force in Livingston Manor?
There are 389 People in the Labor Forcein in Livingston Manor.
What is the Percentage of People in the Labor Force in Livingston Manor?
60.5% of People are in the Labor Force in Livingston Manor.