Balmville, NY Map & Demographics
Balmville Map
Balmville Overview
$42,739
PER CAPITA INCOME
$120,833
AVG FAMILY INCOME
$98,646
AVG HOUSEHOLD INCOME
26.8%
WAGE / INCOME GAP [ % ]
73.2¢/ $1
WAGE / INCOME GAP [ $ ]
0.41
INEQUALITY / GINI INDEX
3,781
TOTAL POPULATION
1,958
MALE POPULATION
1,823
FEMALE POPULATION
107.41
MALES / 100 FEMALES
93.11
FEMALES / 100 MALES
47.3
MEDIAN AGE
3.3
AVG FAMILY SIZE
2.9
AVG HOUSEHOLD SIZE
1,932
LABOR FORCE [ PEOPLE ]
61.3%
PERCENT IN LABOR FORCE
5.6%
UNEMPLOYMENT RATE
Income in Balmville
Income Overview in Balmville
Per Capita Income in Balmville is $42,739, while median incomes of families and households are $120,833 and $98,646 respectively.
| Characteristic | Number | Measure |
| Per Capita Income | 3,781 | $42,739 |
| Median Family Income | 936 | $120,833 |
| Mean Family Income | 936 | $129,080 |
| Median Household Income | 1,283 | $98,646 |
| Mean Household Income | 1,283 | $118,700 |
| Income Deficit | 936 | $0 |
| Wage / Income Gap (%) | 3,781 | 26.84% |
| Wage / Income Gap ($) | 3,781 | 73.16¢ per $1 |
| Gini / Inequality Index | 3,781 | 0.41 |
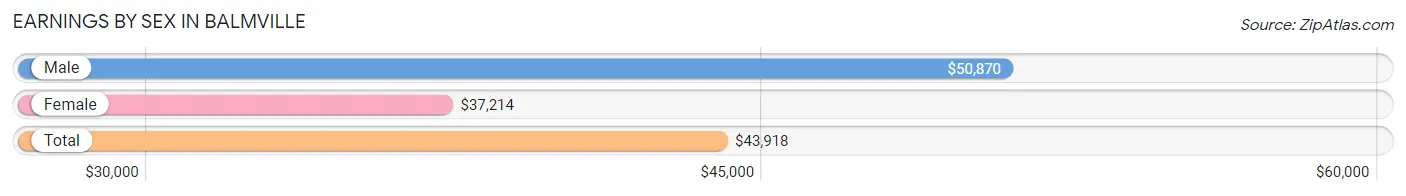
Earnings by Sex in Balmville
Average Earnings in Balmville are $43,918, $50,870 for men and $37,214 for women, a difference of 26.8%.
| Sex | Number | Average Earnings |
| Male | 986 (50.1%) | $50,870 |
| Female | 980 (49.8%) | $37,214 |
| Total | 1,966 (100.0%) | $43,918 |
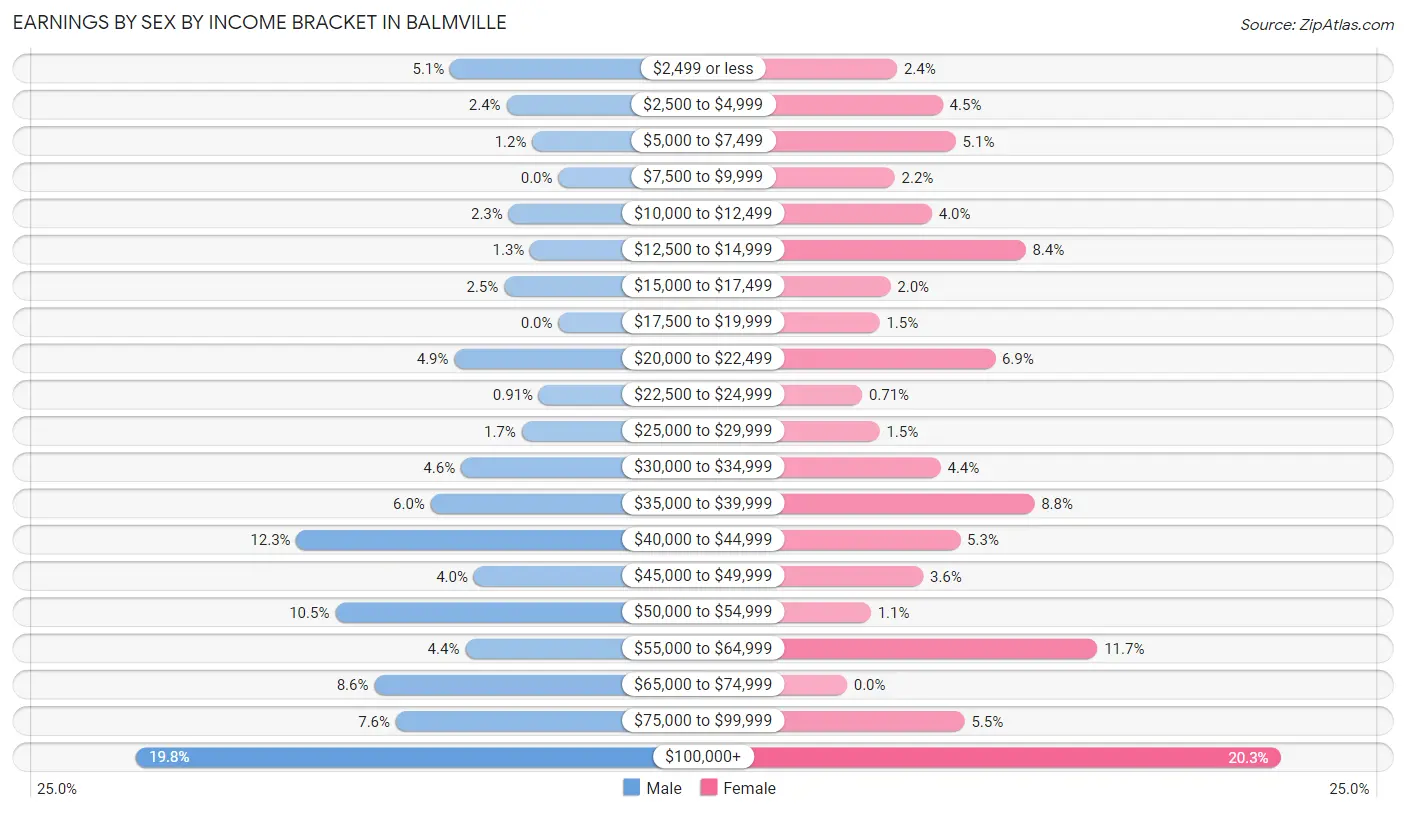
Earnings by Sex by Income Bracket in Balmville
The most common earnings brackets in Balmville are $100,000+ for men (195 | 19.8%) and $100,000+ for women (199 | 20.3%).
| Income | Male | Female |
| $2,499 or less | 50 (5.1%) | 23 (2.4%) |
| $2,500 to $4,999 | 24 (2.4%) | 44 (4.5%) |
| $5,000 to $7,499 | 12 (1.2%) | 50 (5.1%) |
| $7,500 to $9,999 | 0 (0.0%) | 22 (2.2%) |
| $10,000 to $12,499 | 23 (2.3%) | 39 (4.0%) |
| $12,500 to $14,999 | 13 (1.3%) | 82 (8.4%) |
| $15,000 to $17,499 | 25 (2.5%) | 20 (2.0%) |
| $17,500 to $19,999 | 0 (0.0%) | 15 (1.5%) |
| $20,000 to $22,499 | 48 (4.9%) | 68 (6.9%) |
| $22,500 to $24,999 | 9 (0.9%) | 7 (0.7%) |
| $25,000 to $29,999 | 17 (1.7%) | 15 (1.5%) |
| $30,000 to $34,999 | 45 (4.6%) | 43 (4.4%) |
| $35,000 to $39,999 | 59 (6.0%) | 86 (8.8%) |
| $40,000 to $44,999 | 121 (12.3%) | 52 (5.3%) |
| $45,000 to $49,999 | 39 (4.0%) | 35 (3.6%) |
| $50,000 to $54,999 | 103 (10.4%) | 11 (1.1%) |
| $55,000 to $64,999 | 43 (4.4%) | 115 (11.7%) |
| $65,000 to $74,999 | 85 (8.6%) | 0 (0.0%) |
| $75,000 to $99,999 | 75 (7.6%) | 54 (5.5%) |
| $100,000+ | 195 (19.8%) | 199 (20.3%) |
| Total | 986 (100.0%) | 980 (100.0%) |
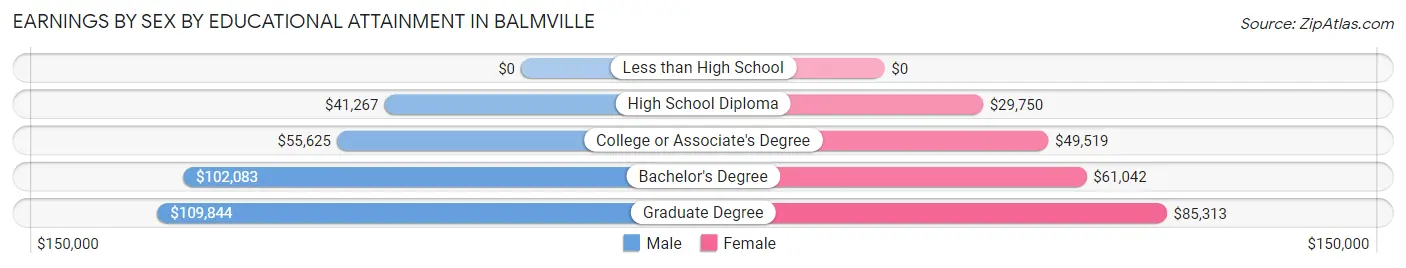
Earnings by Sex by Educational Attainment in Balmville
Average earnings in Balmville are $53,609 for men and $42,853 for women, a difference of 20.1%. Men with an educational attainment of graduate degree enjoy the highest average annual earnings of $109,844, while those with high school diploma education earn the least with $41,267. Women with an educational attainment of graduate degree earn the most with the average annual earnings of $85,313, while those with high school diploma education have the smallest earnings of $29,750.
| Educational Attainment | Male Income | Female Income |
| Less than High School | - | - |
| High School Diploma | $41,267 | $29,750 |
| College or Associate's Degree | $55,625 | $49,519 |
| Bachelor's Degree | $102,083 | $61,042 |
| Graduate Degree | $109,844 | $85,313 |
| Total | $53,609 | $42,853 |
Family Income in Balmville
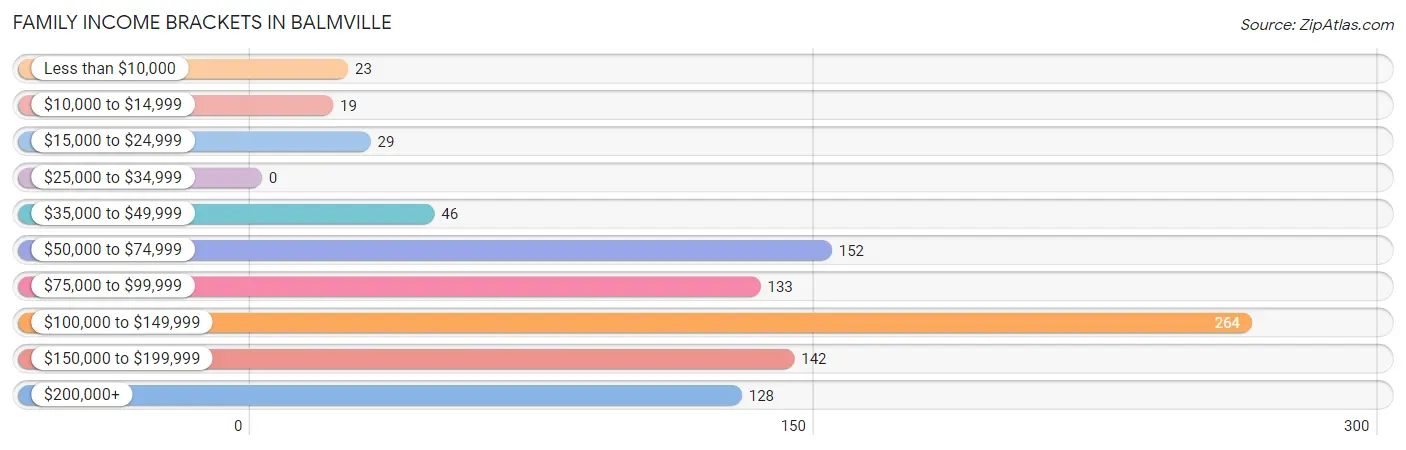
Family Income Brackets in Balmville
According to the Balmville family income data, there are 264 families falling into the $100,000 to $149,999 income range, which is the most common income bracket and makes up 28.2% of all families.
| Income Bracket | # Families | % Families |
| Less than $10,000 | 23 | 2.5% |
| $10,000 to $14,999 | 19 | 2.0% |
| $15,000 to $24,999 | 29 | 3.1% |
| $25,000 to $34,999 | 0 | 0.0% |
| $35,000 to $49,999 | 46 | 4.9% |
| $50,000 to $74,999 | 152 | 16.2% |
| $75,000 to $99,999 | 133 | 14.2% |
| $100,000 to $149,999 | 264 | 28.2% |
| $150,000 to $199,999 | 142 | 15.2% |
| $200,000+ | 128 | 13.7% |
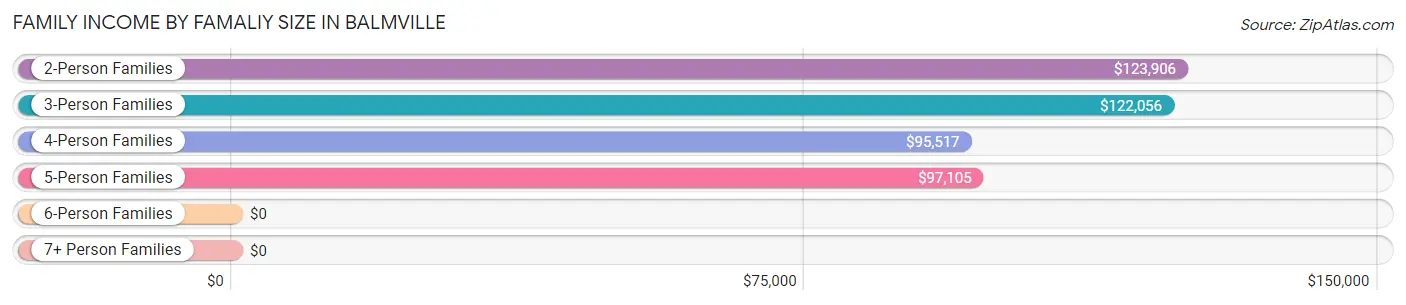
Family Income by Famaliy Size in Balmville
2-person families (423 | 45.2%) account for the highest median family income in Balmville with $123,906 per family, while 2-person families (423 | 45.2%) have the highest median income of $61,953 per family member.
| Income Bracket | # Families | Median Income |
| 2-Person Families | 423 (45.2%) | $123,906 |
| 3-Person Families | 286 (30.6%) | $122,056 |
| 4-Person Families | 92 (9.8%) | $95,517 |
| 5-Person Families | 64 (6.8%) | $97,105 |
| 6-Person Families | 55 (5.9%) | $0 |
| 7+ Person Families | 16 (1.7%) | $0 |
| Total | 936 (100.0%) | $120,833 |
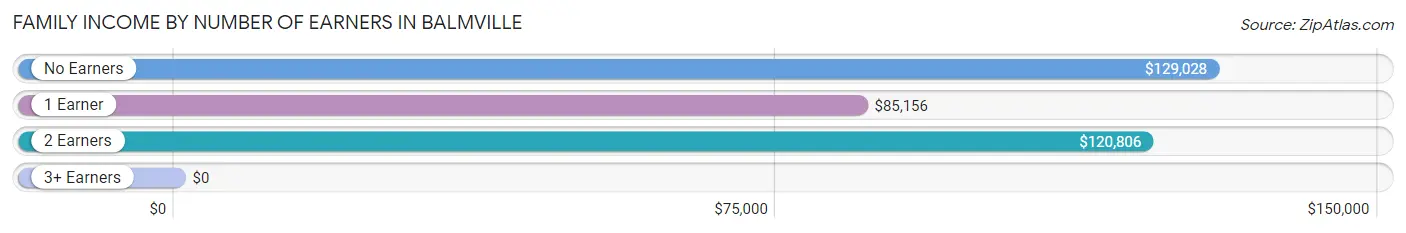
Family Income by Number of Earners in Balmville
| Number of Earners | # Families | Median Income |
| No Earners | 121 (12.9%) | $129,028 |
| 1 Earner | 233 (24.9%) | $85,156 |
| 2 Earners | 519 (55.4%) | $120,806 |
| 3+ Earners | 63 (6.7%) | $0 |
| Total | 936 (100.0%) | $120,833 |
Household Income in Balmville
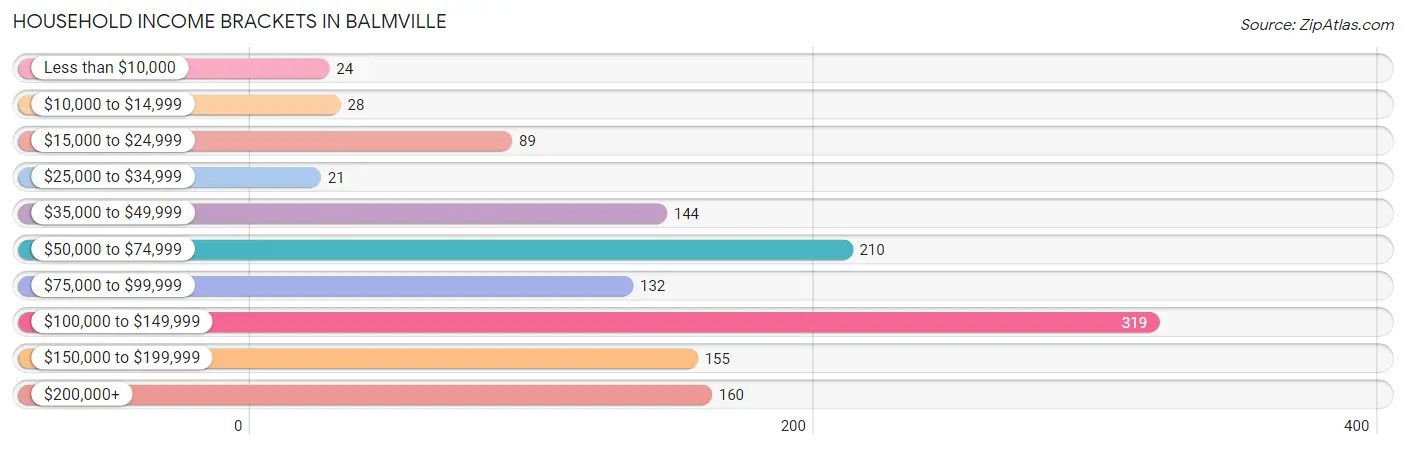
Household Income Brackets in Balmville
With 319 households falling in the category, the $100,000 to $149,999 income range is the most frequent in Balmville, accounting for 24.9% of all households. In contrast, only 21 households (1.6%) fall into the $25,000 to $34,999 income bracket, making it the least populous group.
| Income Bracket | # Households | % Households |
| Less than $10,000 | 24 | 1.9% |
| $10,000 to $14,999 | 28 | 2.2% |
| $15,000 to $24,999 | 89 | 6.9% |
| $25,000 to $34,999 | 21 | 1.6% |
| $35,000 to $49,999 | 144 | 11.2% |
| $50,000 to $74,999 | 210 | 16.4% |
| $75,000 to $99,999 | 132 | 10.3% |
| $100,000 to $149,999 | 319 | 24.9% |
| $150,000 to $199,999 | 155 | 12.1% |
| $200,000+ | 160 | 12.5% |
Household Income by Householder Age in Balmville
The median household income in Balmville is $98,646, with the highest median household income of $121,111 found in the 25 to 44 years age bracket for the primary householder. A total of 242 households (18.9%) fall into this category. Meanwhile, the 15 to 24 years age bracket for the primary householder has the lowest median household income of $0, with 16 households (1.3%) in this group.
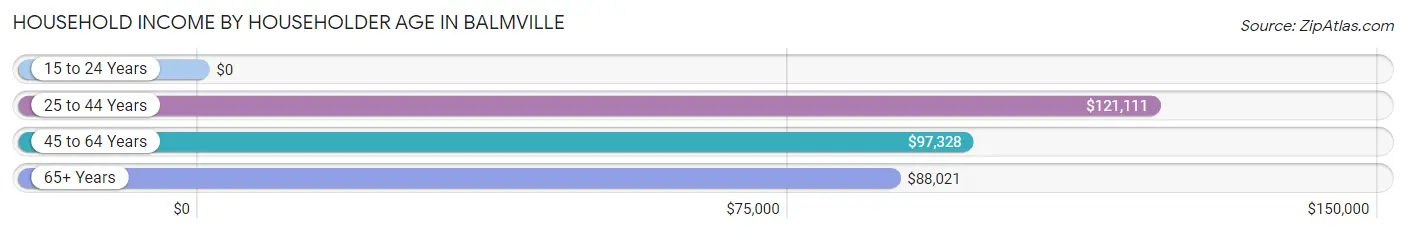
| Income Bracket | # Households | Median Income |
| 15 to 24 Years | 16 (1.3%) | $0 |
| 25 to 44 Years | 242 (18.9%) | $121,111 |
| 45 to 64 Years | 650 (50.7%) | $97,328 |
| 65+ Years | 375 (29.2%) | $88,021 |
| Total | 1,283 (100.0%) | $98,646 |
Poverty in Balmville
Income Below Poverty by Sex and Age in Balmville
With 3.4% poverty level for males and 7.5% for females among the residents of Balmville, 65 to 74 year old males and 18 to 24 year old females are the most vulnerable to poverty, with 23 males (13.7%) and 22 females (22.5%) in their respective age groups living below the poverty level.
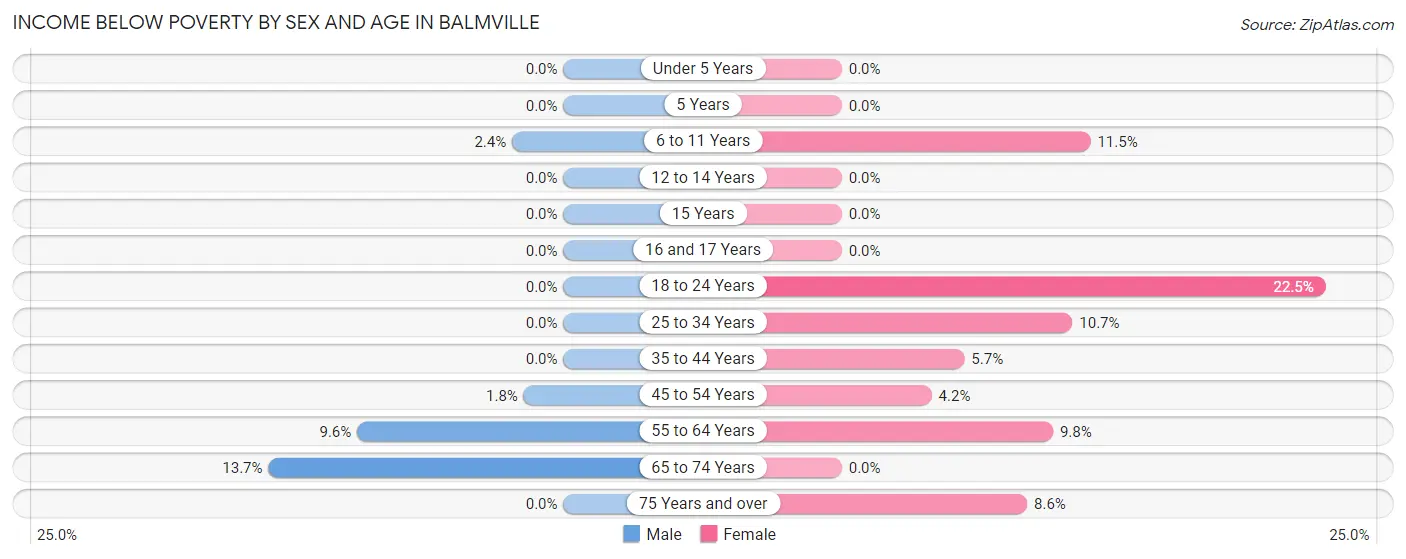
| Age Bracket | Male | Female |
| Under 5 Years | 0 (0.0%) | 0 (0.0%) |
| 5 Years | 0 (0.0%) | 0 (0.0%) |
| 6 to 11 Years | 6 (2.4%) | 6 (11.5%) |
| 12 to 14 Years | 0 (0.0%) | 0 (0.0%) |
| 15 Years | 0 (0.0%) | 0 (0.0%) |
| 16 and 17 Years | 0 (0.0%) | 0 (0.0%) |
| 18 to 24 Years | 0 (0.0%) | 22 (22.5%) |
| 25 to 34 Years | 0 (0.0%) | 20 (10.7%) |
| 35 to 44 Years | 0 (0.0%) | 14 (5.7%) |
| 45 to 54 Years | 7 (1.8%) | 14 (4.2%) |
| 55 to 64 Years | 29 (9.6%) | 35 (9.8%) |
| 65 to 74 Years | 23 (13.7%) | 0 (0.0%) |
| 75 Years and over | 0 (0.0%) | 24 (8.6%) |
| Total | 65 (3.4%) | 135 (7.5%) |
Income Above Poverty by Sex and Age in Balmville
According to the poverty statistics in Balmville, males aged under 5 years and females aged under 5 years are the age groups that are most secure financially, with 100.0% of males and 100.0% of females in these age groups living above the poverty line.
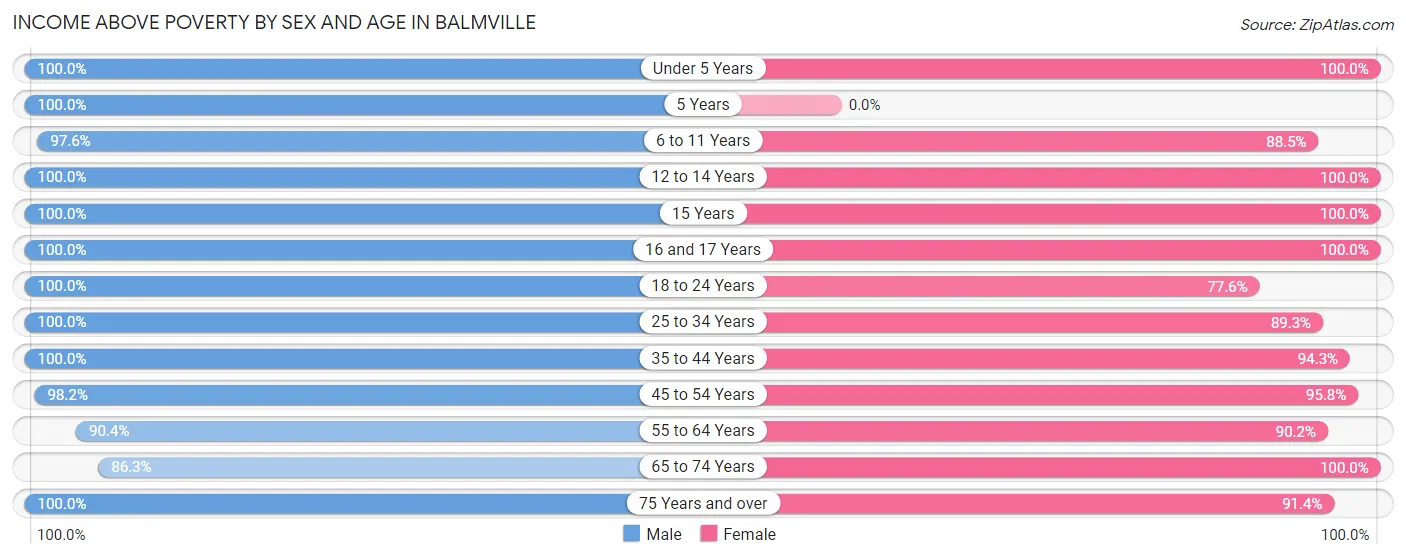
| Age Bracket | Male | Female |
| Under 5 Years | 73 (100.0%) | 69 (100.0%) |
| 5 Years | 15 (100.0%) | 0 (0.0%) |
| 6 to 11 Years | 246 (97.6%) | 46 (88.5%) |
| 12 to 14 Years | 64 (100.0%) | 33 (100.0%) |
| 15 Years | 10 (100.0%) | 29 (100.0%) |
| 16 and 17 Years | 59 (100.0%) | 7 (100.0%) |
| 18 to 24 Years | 155 (100.0%) | 76 (77.5%) |
| 25 to 34 Years | 270 (100.0%) | 167 (89.3%) |
| 35 to 44 Years | 107 (100.0%) | 232 (94.3%) |
| 45 to 54 Years | 373 (98.2%) | 322 (95.8%) |
| 55 to 64 Years | 274 (90.4%) | 322 (90.2%) |
| 65 to 74 Years | 145 (86.3%) | 113 (100.0%) |
| 75 Years and over | 86 (100.0%) | 255 (91.4%) |
| Total | 1,877 (96.7%) | 1,671 (92.5%) |
Income Below Poverty Among Married-Couple Families in Balmville
The poverty statistics for married-couple families in Balmville show that 4.9% or 30 of the total 617 families live below the poverty line. Families with 1 or 2 children have the highest poverty rate of 6.6%, comprising of 7 families. On the other hand, families with 3 or 4 children have the lowest poverty rate of 0.0%, which includes 0 families.
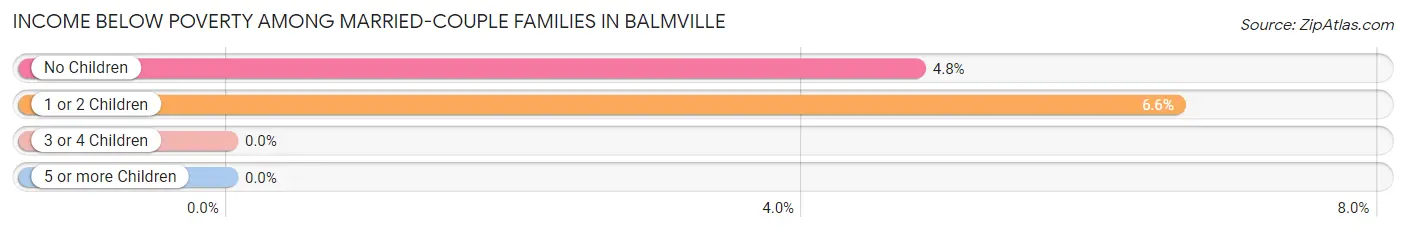
| Children | Above Poverty | Below Poverty |
| No Children | 457 (95.2%) | 23 (4.8%) |
| 1 or 2 Children | 99 (93.4%) | 7 (6.6%) |
| 3 or 4 Children | 31 (100.0%) | 0 (0.0%) |
| 5 or more Children | 0 (0.0%) | 0 (0.0%) |
| Total | 587 (95.1%) | 30 (4.9%) |
Income Below Poverty Among Single-Parent Households in Balmville
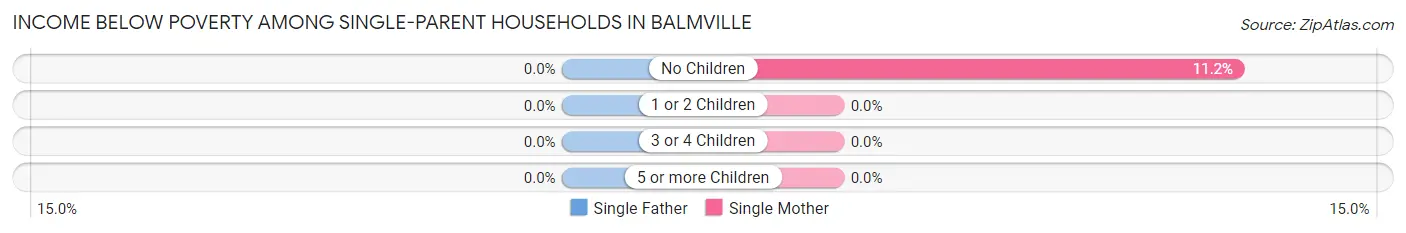
| Children | Single Father | Single Mother |
| No Children | 0 (0.0%) | 12 (11.2%) |
| 1 or 2 Children | 0 (0.0%) | 0 (0.0%) |
| 3 or 4 Children | 0 (0.0%) | 0 (0.0%) |
| 5 or more Children | 0 (0.0%) | 0 (0.0%) |
| Total | 0 (0.0%) | 12 (4.4%) |
Income Below Poverty Among Married-Couple vs Single-Parent Households in Balmville
The poverty data for Balmville shows that 30 of the married-couple family households (4.9%) and 12 of the single-parent households (3.8%) are living below the poverty level. Within the married-couple family households, those with 1 or 2 children have the highest poverty rate, with 7 households (6.6%) falling below the poverty line. Among the single-parent households, those with no children have the highest poverty rate, with 12 household (10.1%) living below poverty.
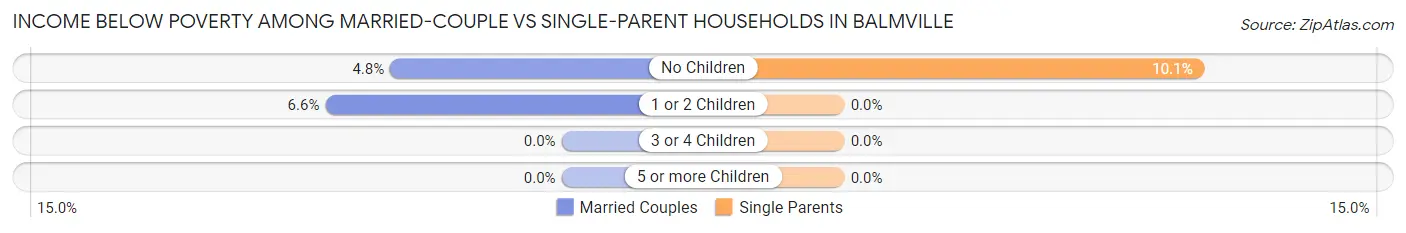
| Children | Married-Couple Families | Single-Parent Households |
| No Children | 23 (4.8%) | 12 (10.1%) |
| 1 or 2 Children | 7 (6.6%) | 0 (0.0%) |
| 3 or 4 Children | 0 (0.0%) | 0 (0.0%) |
| 5 or more Children | 0 (0.0%) | 0 (0.0%) |
| Total | 30 (4.9%) | 12 (3.8%) |
Race in Balmville
The most populous races in Balmville are White / Caucasian (1,917 | 50.7%), Black / African American (941 | 24.9%), and Hispanic or Latino (835 | 22.1%).
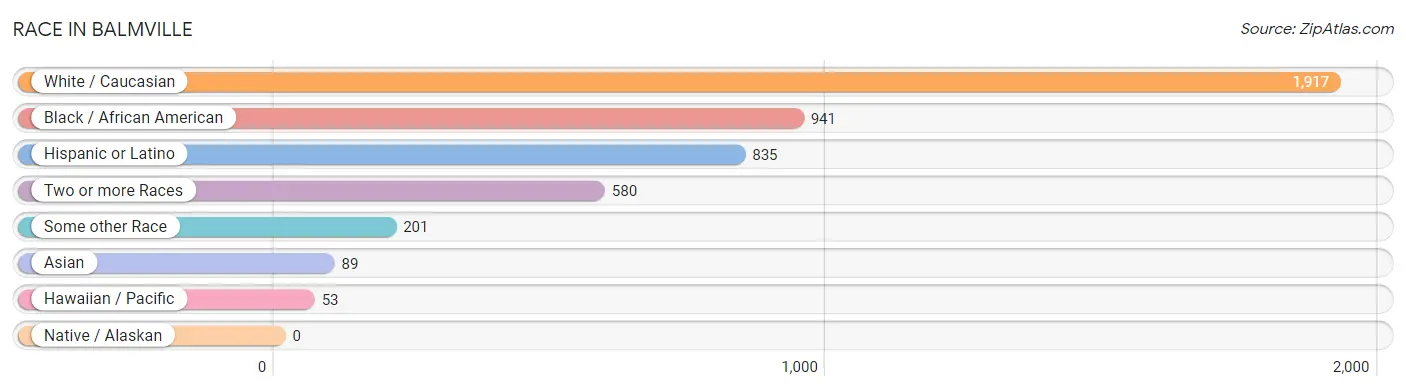
| Race | # Population | % Population |
| Asian | 89 | 2.4% |
| Black / African American | 941 | 24.9% |
| Hawaiian / Pacific | 53 | 1.4% |
| Hispanic or Latino | 835 | 22.1% |
| Native / Alaskan | 0 | 0.0% |
| White / Caucasian | 1,917 | 50.7% |
| Two or more Races | 580 | 15.3% |
| Some other Race | 201 | 5.3% |
| Total | 3,781 | 100.0% |
Ancestry in Balmville
The most populous ancestries reported in Balmville are Irish (690 | 18.2%), Italian (468 | 12.4%), South American (301 | 8.0%), Jamaican (264 | 7.0%), and Peruvian (264 | 7.0%), together accounting for 52.5% of all Balmville residents.
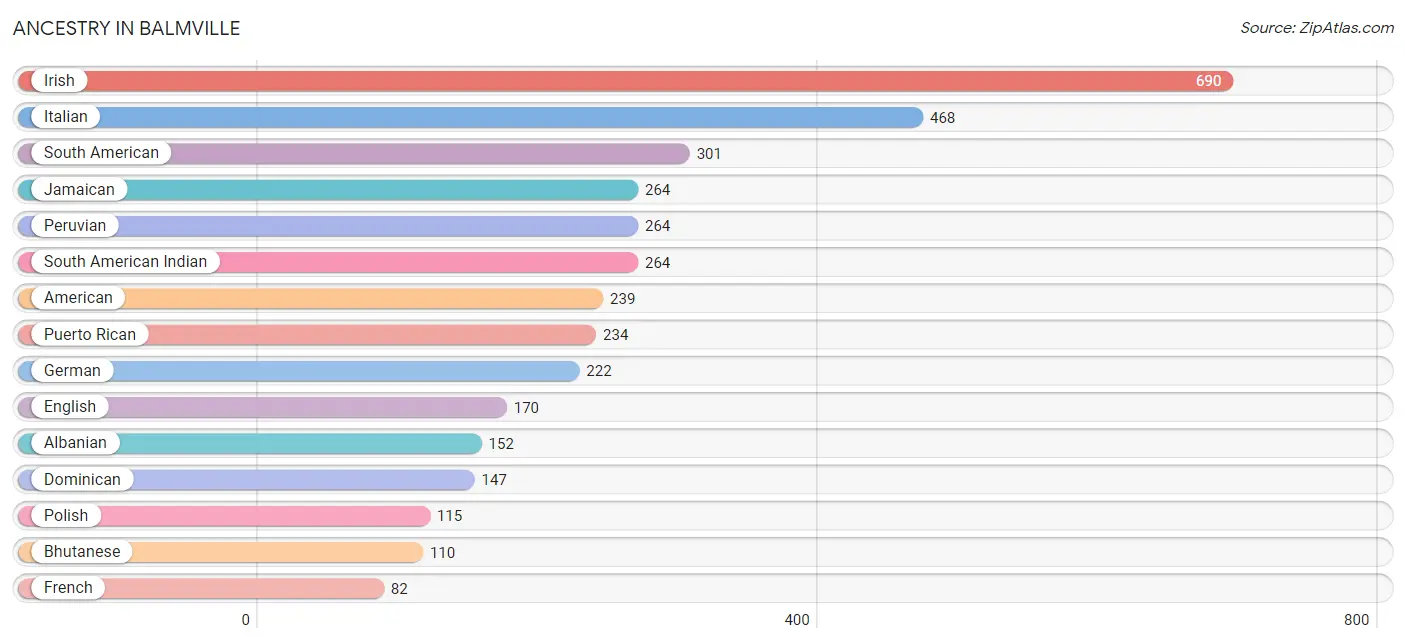
| Ancestry | # Population | % Population |
| Albanian | 152 | 4.0% |
| American | 239 | 6.3% |
| Arab | 41 | 1.1% |
| Austrian | 7 | 0.2% |
| Bhutanese | 110 | 2.9% |
| British | 42 | 1.1% |
| Burmese | 8 | 0.2% |
| Central American | 55 | 1.5% |
| Central American Indian | 37 | 1.0% |
| Colombian | 26 | 0.7% |
| Cypriot | 13 | 0.3% |
| Czech | 8 | 0.2% |
| Dominican | 147 | 3.9% |
| Dutch | 49 | 1.3% |
| Eastern European | 29 | 0.8% |
| Ecuadorian | 11 | 0.3% |
| English | 170 | 4.5% |
| European | 15 | 0.4% |
| French | 82 | 2.2% |
| French Canadian | 9 | 0.2% |
| German | 222 | 5.9% |
| Hungarian | 20 | 0.5% |
| Indian (Asian) | 56 | 1.5% |
| Irish | 690 | 18.2% |
| Italian | 468 | 12.4% |
| Jamaican | 264 | 7.0% |
| Lebanese | 41 | 1.1% |
| Mexican | 23 | 0.6% |
| Nicaraguan | 29 | 0.8% |
| Northern European | 7 | 0.2% |
| Peruvian | 264 | 7.0% |
| Polish | 115 | 3.0% |
| Portuguese | 17 | 0.4% |
| Puerto Rican | 234 | 6.2% |
| Romanian | 9 | 0.2% |
| Russian | 32 | 0.9% |
| Salvadoran | 26 | 0.7% |
| Samoan | 53 | 1.4% |
| Scandinavian | 30 | 0.8% |
| Scottish | 19 | 0.5% |
| Seminole | 6 | 0.2% |
| South American | 301 | 8.0% |
| South American Indian | 264 | 7.0% |
| Spaniard | 10 | 0.3% |
| Spanish | 29 | 0.8% |
| Swedish | 31 | 0.8% |
| Turkish | 12 | 0.3% |
| Ukrainian | 22 | 0.6% | View All 48 Rows |
Immigrants in Balmville
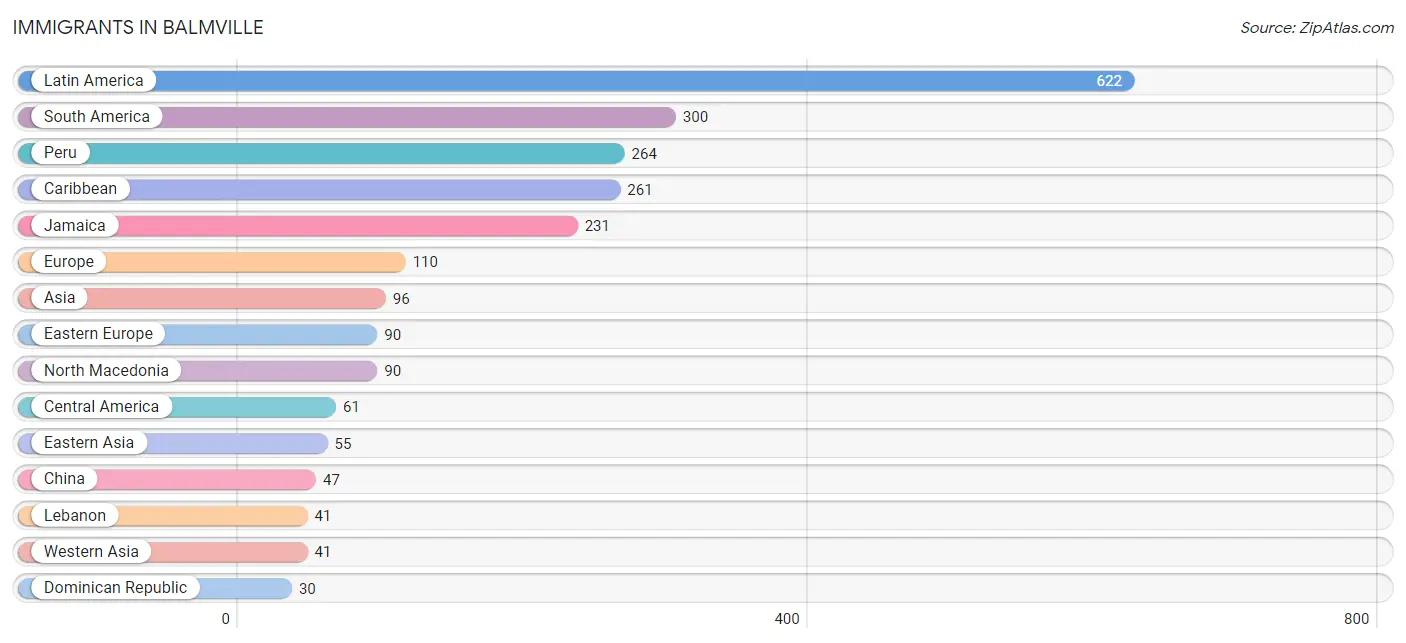
The most numerous immigrant groups reported in Balmville came from Latin America (622 | 16.5%), South America (300 | 7.9%), Peru (264 | 7.0%), Caribbean (261 | 6.9%), and Jamaica (231 | 6.1%), together accounting for 44.4% of all Balmville residents.
| Immigration Origin | # Population | % Population |
| Asia | 96 | 2.5% |
| Canada | 12 | 0.3% |
| Caribbean | 261 | 6.9% |
| Central America | 61 | 1.6% |
| Chile | 17 | 0.4% |
| China | 47 | 1.2% |
| Colombia | 19 | 0.5% |
| Dominican Republic | 30 | 0.8% |
| Eastern Asia | 55 | 1.5% |
| Eastern Europe | 90 | 2.4% |
| El Salvador | 26 | 0.7% |
| Europe | 110 | 2.9% |
| France | 20 | 0.5% |
| Jamaica | 231 | 6.1% |
| Korea | 8 | 0.2% |
| Latin America | 622 | 16.5% |
| Lebanon | 41 | 1.1% |
| Mexico | 23 | 0.6% |
| Nicaragua | 12 | 0.3% |
| North Macedonia | 90 | 2.4% |
| Peru | 264 | 7.0% |
| South America | 300 | 7.9% |
| Western Asia | 41 | 1.1% |
| Western Europe | 20 | 0.5% | View All 24 Rows |
Sex and Age in Balmville
Sex and Age in Balmville
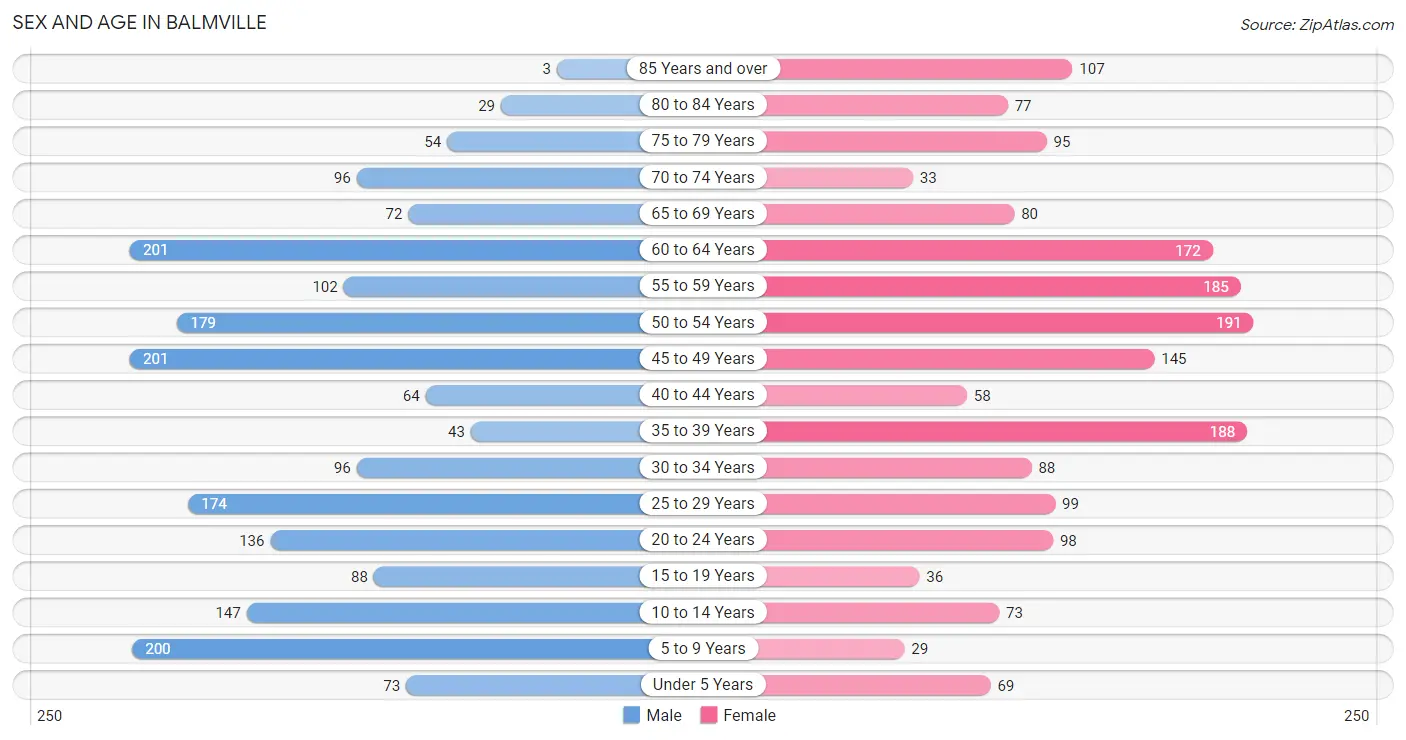
The most populous age groups in Balmville are 45 to 49 Years (201 | 10.3%) for men and 50 to 54 Years (191 | 10.5%) for women.
| Age Bracket | Male | Female |
| Under 5 Years | 73 (3.7%) | 69 (3.8%) |
| 5 to 9 Years | 200 (10.2%) | 29 (1.6%) |
| 10 to 14 Years | 147 (7.5%) | 73 (4.0%) |
| 15 to 19 Years | 88 (4.5%) | 36 (2.0%) |
| 20 to 24 Years | 136 (7.0%) | 98 (5.4%) |
| 25 to 29 Years | 174 (8.9%) | 99 (5.4%) |
| 30 to 34 Years | 96 (4.9%) | 88 (4.8%) |
| 35 to 39 Years | 43 (2.2%) | 188 (10.3%) |
| 40 to 44 Years | 64 (3.3%) | 58 (3.2%) |
| 45 to 49 Years | 201 (10.3%) | 145 (8.0%) |
| 50 to 54 Years | 179 (9.1%) | 191 (10.5%) |
| 55 to 59 Years | 102 (5.2%) | 185 (10.2%) |
| 60 to 64 Years | 201 (10.3%) | 172 (9.4%) |
| 65 to 69 Years | 72 (3.7%) | 80 (4.4%) |
| 70 to 74 Years | 96 (4.9%) | 33 (1.8%) |
| 75 to 79 Years | 54 (2.8%) | 95 (5.2%) |
| 80 to 84 Years | 29 (1.5%) | 77 (4.2%) |
| 85 Years and over | 3 (0.2%) | 107 (5.9%) |
| Total | 1,958 (100.0%) | 1,823 (100.0%) |
Families and Households in Balmville
Median Family Size in Balmville
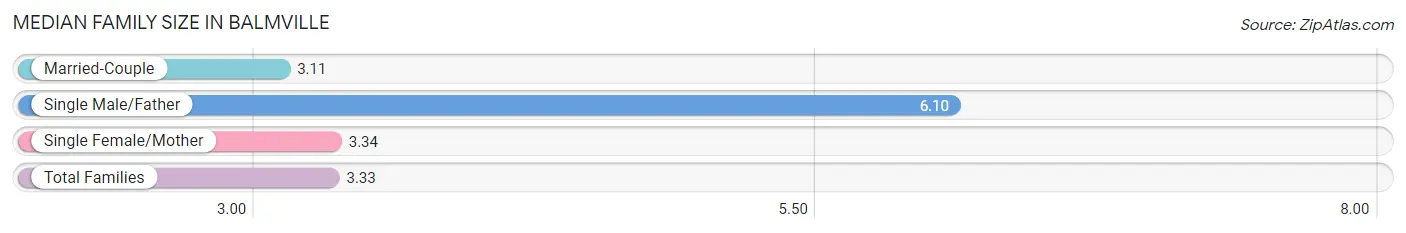
The median family size in Balmville is 3.33 persons per family, with single male/father families (48 | 5.1%) accounting for the largest median family size of 6.1 persons per family. On the other hand, married-couple families (617 | 65.9%) represent the smallest median family size with 3.11 persons per family.
| Family Type | # Families | Family Size |
| Married-Couple | 617 (65.9%) | 3.11 |
| Single Male/Father | 48 (5.1%) | 6.10 |
| Single Female/Mother | 271 (28.9%) | 3.34 |
| Total Families | 936 (100.0%) | 3.33 |
Median Household Size in Balmville
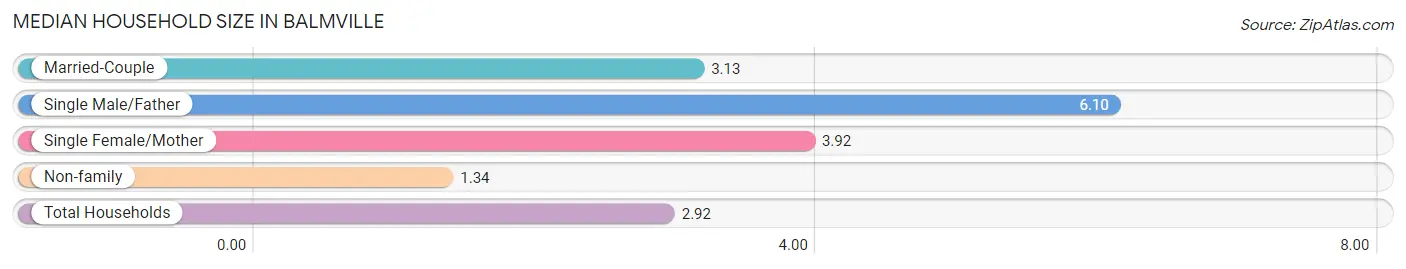
The median household size in Balmville is 2.92 persons per household, with single male/father households (48 | 3.7%) accounting for the largest median household size of 6.1 persons per household. non-family households (347 | 27.1%) represent the smallest median household size with 1.34 persons per household.
| Household Type | # Households | Household Size |
| Married-Couple | 617 (48.1%) | 3.13 |
| Single Male/Father | 48 (3.7%) | 6.10 |
| Single Female/Mother | 271 (21.1%) | 3.92 |
| Non-family | 347 (27.1%) | 1.34 |
| Total Households | 1,283 (100.0%) | 2.92 |
Household Size by Marriage Status in Balmville
Out of a total of 1,283 households in Balmville, 936 (73.0%) are family households, while 347 (27.1%) are nonfamily households. The most numerous type of family households are 2-person households, comprising 372, and the most common type of nonfamily households are 1-person households, comprising 268.
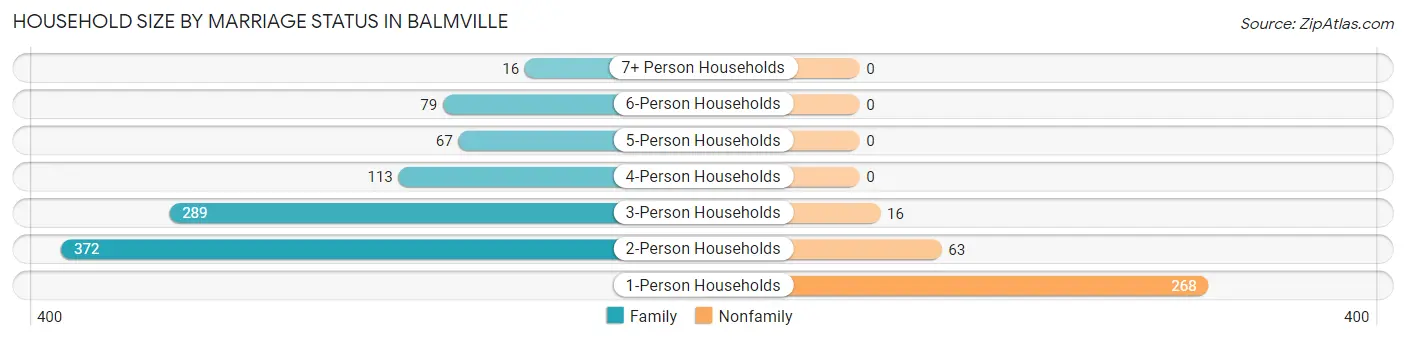
| Household Size | Family Households | Nonfamily Households |
| 1-Person Households | - | 268 (20.9%) |
| 2-Person Households | 372 (29.0%) | 63 (4.9%) |
| 3-Person Households | 289 (22.5%) | 16 (1.3%) |
| 4-Person Households | 113 (8.8%) | 0 (0.0%) |
| 5-Person Households | 67 (5.2%) | 0 (0.0%) |
| 6-Person Households | 79 (6.2%) | 0 (0.0%) |
| 7+ Person Households | 16 (1.3%) | 0 (0.0%) |
| Total | 936 (73.0%) | 347 (27.1%) |
Female Fertility in Balmville
Fertility by Age in Balmville
| Age Bracket | Women with Births | Births / 1,000 Women |
| 15 to 19 years | 0 (0.0%) | 0.0 |
| 20 to 34 years | 0 (0.0%) | 0.0 |
| 35 to 50 years | 0 (0.0%) | 0.0 |
| Total | 0 (0.0%) | 0.0 |
Fertility by Age by Marriage Status in Balmville
| Age Bracket | Married | Unmarried |
| 15 to 19 years | 0 (0.0%) | 0 (0.0%) |
| 20 to 34 years | 0 (0.0%) | 0 (0.0%) |
| 35 to 50 years | 0 (0.0%) | 0 (0.0%) |
| Total | 0 (0.0%) | 0 (0.0%) |
Fertility by Education in Balmville
| Educational Attainment | Women with Births | Births / 1,000 Women |
| Less than High School | 0 (0.0%) | 0.0 |
| High School Diploma | 0 (0.0%) | 0.0 |
| College or Associate's Degree | 0 (0.0%) | 0.0 |
| Bachelor's Degree | 0 (0.0%) | 0.0 |
| Graduate Degree | 0 (0.0%) | 0.0 |
| Total | 0 (0.0%) | 0.0 |
Fertility by Education by Marriage Status in Balmville
| Educational Attainment | Married | Unmarried |
| Less than High School | 0 (0.0%) | 0 (0.0%) |
| High School Diploma | 0 (0.0%) | 0 (0.0%) |
| College or Associate's Degree | 0 (0.0%) | 0 (0.0%) |
| Bachelor's Degree | 0 (0.0%) | 0 (0.0%) |
| Graduate Degree | 0 (0.0%) | 0 (0.0%) |
| Total | 0 (0.0%) | 0 (0.0%) |
Employment Characteristics in Balmville
Employment by Class of Employer in Balmville
Among the 1,812 employed individuals in Balmville, private company employees (1,108 | 61.2%), not-for-profit organizations (246 | 13.6%), and local government employees (208 | 11.5%) make up the most common classes of employment.
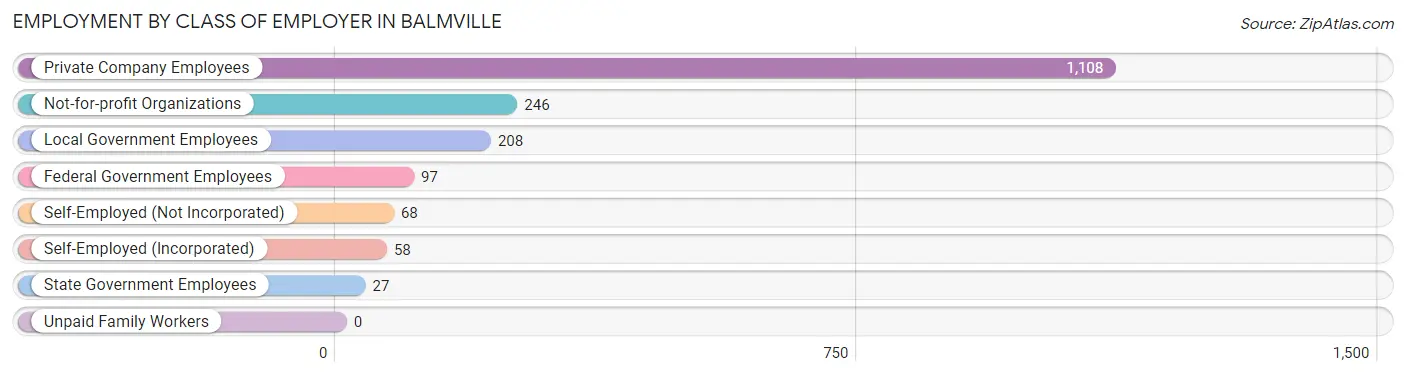
| Employer Class | # Employees | % Employees |
| Private Company Employees | 1,108 | 61.2% |
| Self-Employed (Incorporated) | 58 | 3.2% |
| Self-Employed (Not Incorporated) | 68 | 3.7% |
| Not-for-profit Organizations | 246 | 13.6% |
| Local Government Employees | 208 | 11.5% |
| State Government Employees | 27 | 1.5% |
| Federal Government Employees | 97 | 5.3% |
| Unpaid Family Workers | 0 | 0.0% |
| Total | 1,812 | 100.0% |
Employment Status by Age in Balmville
According to the labor force statistics for Balmville, out of the total population over 16 years of age (3,151), 61.3% or 1,932 individuals are in the labor force, with 5.6% or 108 of them unemployed. The age group with the highest labor force participation rate is 35 to 44 years, with 96.0% or 339 individuals in the labor force. Within the labor force, the 20 to 24 years age range has the highest percentage of unemployed individuals, with 19.9% or 37 of them being unemployed.
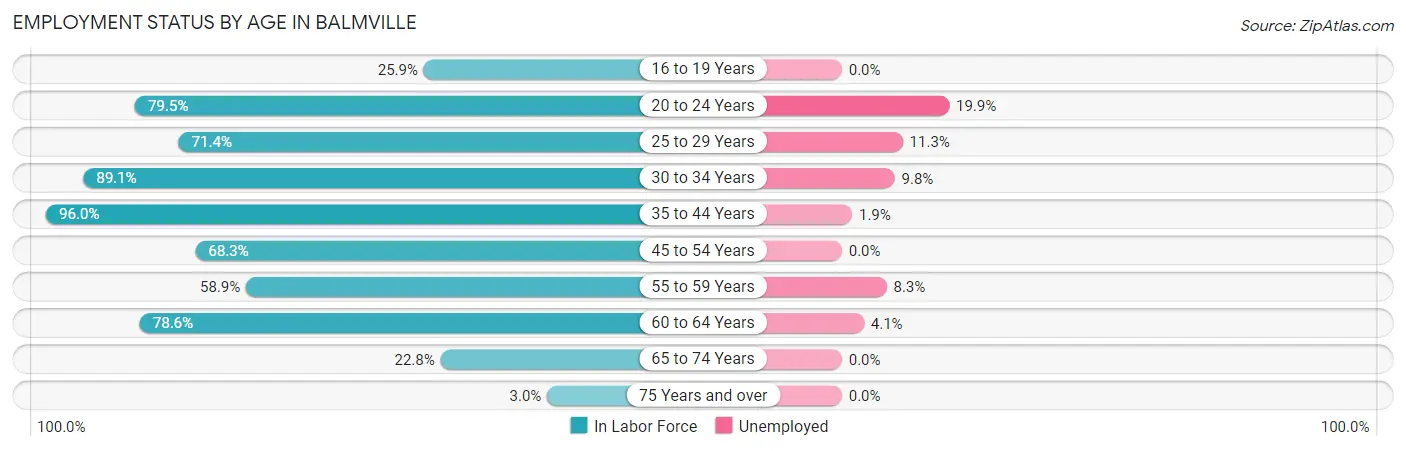
| Age Bracket | In Labor Force | Unemployed |
| 16 to 19 Years | 22 (25.9%) | 0 (0.0%) |
| 20 to 24 Years | 186 (79.5%) | 37 (19.9%) |
| 25 to 29 Years | 195 (71.4%) | 22 (11.3%) |
| 30 to 34 Years | 164 (89.1%) | 16 (9.8%) |
| 35 to 44 Years | 339 (96.0%) | 6 (1.9%) |
| 45 to 54 Years | 489 (68.3%) | 0 (0.0%) |
| 55 to 59 Years | 169 (58.9%) | 14 (8.3%) |
| 60 to 64 Years | 293 (78.6%) | 12 (4.1%) |
| 65 to 74 Years | 64 (22.8%) | 0 (0.0%) |
| 75 Years and over | 11 (3.0%) | 0 (0.0%) |
| Total | 1,932 (61.3%) | 108 (5.6%) |
Employment Status by Educational Attainment in Balmville
According to labor force statistics for Balmville, 75.4% of individuals (1,648) out of the total population between 25 and 64 years of age (2,186) are in the labor force, with 4.3% or 71 of them being unemployed. The group with the highest labor force participation rate are those with the educational attainment of bachelor's degree or higher, with 84.7% or 581 individuals in the labor force. Within the labor force, individuals with less than high school education have the highest percentage of unemployment, with 12.7% or 14 of them being unemployed.
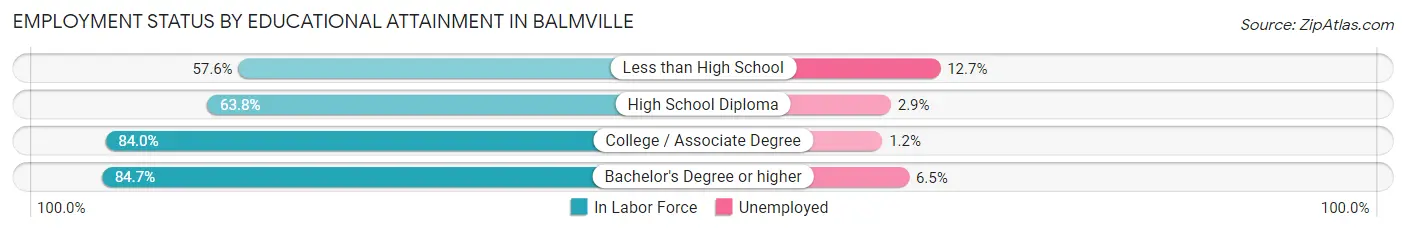
| Educational Attainment | In Labor Force | Unemployed |
| Less than High School | 110 (57.6%) | 24 (12.7%) |
| High School Diploma | 448 (63.8%) | 20 (2.9%) |
| College / Associate Degree | 510 (84.0%) | 7 (1.2%) |
| Bachelor's Degree or higher | 581 (84.7%) | 45 (6.5%) |
| Total | 1,648 (75.4%) | 94 (4.3%) |
Employment Occupations by Sex in Balmville
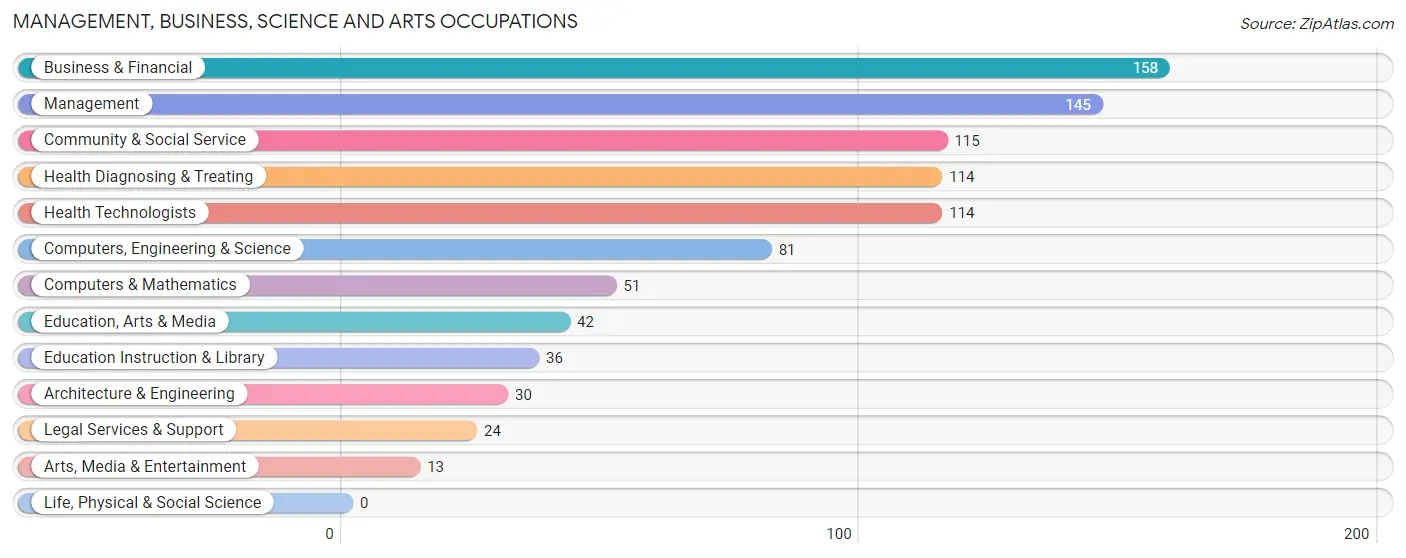
Management, Business, Science and Arts Occupations
The most common Management, Business, Science and Arts occupations in Balmville are Business & Financial (158 | 8.7%), Management (145 | 8.0%), Community & Social Service (115 | 6.4%), Health Diagnosing & Treating (114 | 6.3%), and Health Technologists (114 | 6.3%).
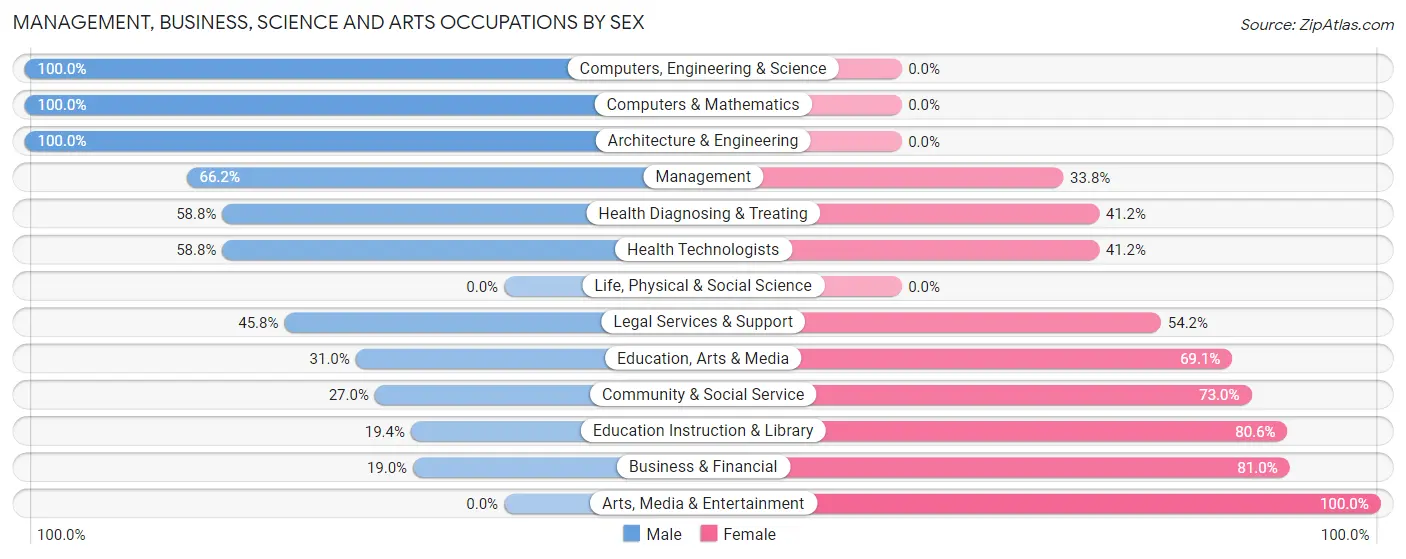
Management, Business, Science and Arts Occupations by Sex
Within the Management, Business, Science and Arts occupations in Balmville, the most male-oriented occupations are Computers, Engineering & Science (100.0%), Computers & Mathematics (100.0%), and Architecture & Engineering (100.0%), while the most female-oriented occupations are Arts, Media & Entertainment (100.0%), Business & Financial (81.0%), and Education Instruction & Library (80.6%).
| Occupation | Male | Female |
| Management | 96 (66.2%) | 49 (33.8%) |
| Business & Financial | 30 (19.0%) | 128 (81.0%) |
| Computers, Engineering & Science | 81 (100.0%) | 0 (0.0%) |
| Computers & Mathematics | 51 (100.0%) | 0 (0.0%) |
| Architecture & Engineering | 30 (100.0%) | 0 (0.0%) |
| Life, Physical & Social Science | 0 (0.0%) | 0 (0.0%) |
| Community & Social Service | 31 (27.0%) | 84 (73.0%) |
| Education, Arts & Media | 13 (30.9%) | 29 (69.1%) |
| Legal Services & Support | 11 (45.8%) | 13 (54.2%) |
| Education Instruction & Library | 7 (19.4%) | 29 (80.6%) |
| Arts, Media & Entertainment | 0 (0.0%) | 13 (100.0%) |
| Health Diagnosing & Treating | 67 (58.8%) | 47 (41.2%) |
| Health Technologists | 67 (58.8%) | 47 (41.2%) |
| Total (Category) | 305 (49.8%) | 308 (50.2%) |
| Total (Overall) | 883 (48.9%) | 924 (51.1%) |
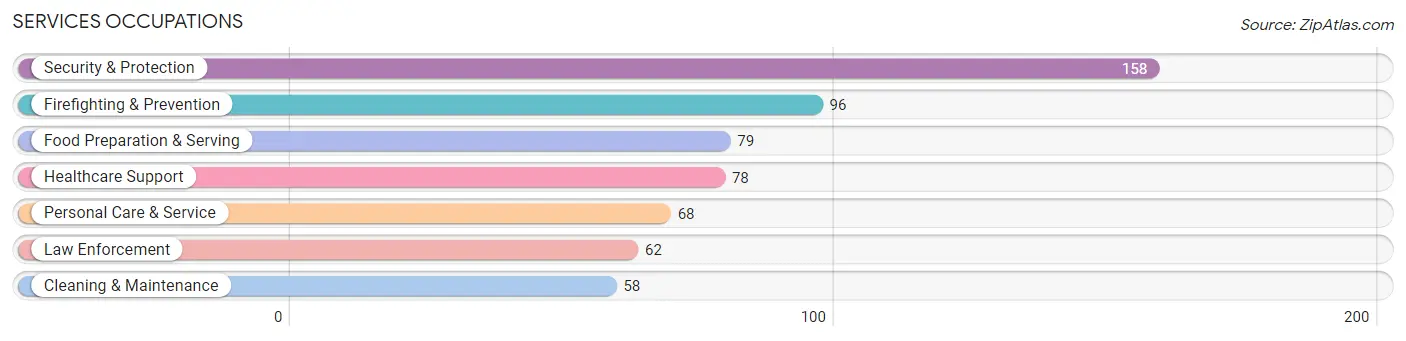
Services Occupations
The most common Services occupations in Balmville are Security & Protection (158 | 8.7%), Firefighting & Prevention (96 | 5.3%), Food Preparation & Serving (79 | 4.4%), Healthcare Support (78 | 4.3%), and Personal Care & Service (68 | 3.8%).
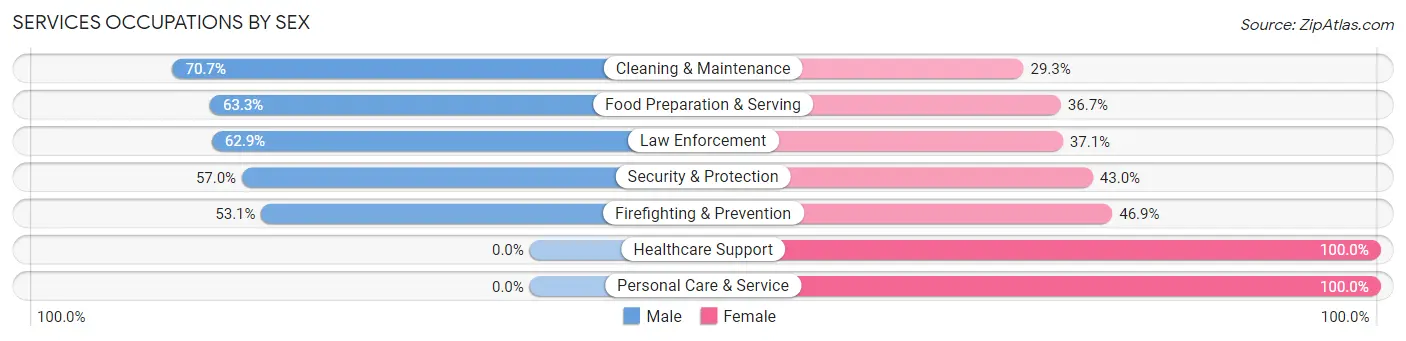
Services Occupations by Sex
Within the Services occupations in Balmville, the most male-oriented occupations are Cleaning & Maintenance (70.7%), Food Preparation & Serving (63.3%), and Law Enforcement (62.9%), while the most female-oriented occupations are Healthcare Support (100.0%), Personal Care & Service (100.0%), and Firefighting & Prevention (46.9%).
| Occupation | Male | Female |
| Healthcare Support | 0 (0.0%) | 78 (100.0%) |
| Security & Protection | 90 (57.0%) | 68 (43.0%) |
| Firefighting & Prevention | 51 (53.1%) | 45 (46.9%) |
| Law Enforcement | 39 (62.9%) | 23 (37.1%) |
| Food Preparation & Serving | 50 (63.3%) | 29 (36.7%) |
| Cleaning & Maintenance | 41 (70.7%) | 17 (29.3%) |
| Personal Care & Service | 0 (0.0%) | 68 (100.0%) |
| Total (Category) | 181 (41.0%) | 260 (59.0%) |
| Total (Overall) | 883 (48.9%) | 924 (51.1%) |
Sales and Office Occupations
The most common Sales and Office occupations in Balmville are Sales & Related (212 | 11.7%), and Office & Administration (188 | 10.4%).

Sales and Office Occupations by Sex
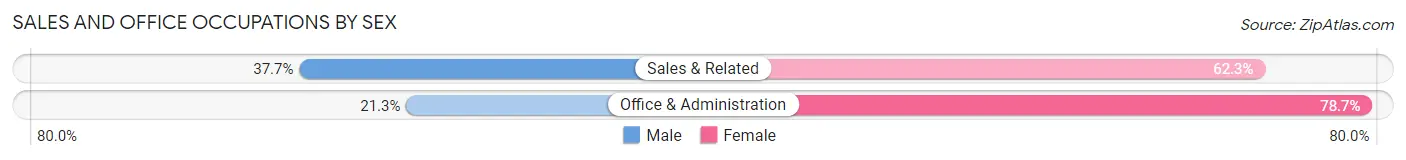
| Occupation | Male | Female |
| Sales & Related | 80 (37.7%) | 132 (62.3%) |
| Office & Administration | 40 (21.3%) | 148 (78.7%) |
| Total (Category) | 120 (30.0%) | 280 (70.0%) |
| Total (Overall) | 883 (48.9%) | 924 (51.1%) |
Natural Resources, Construction and Maintenance Occupations
The most common Natural Resources, Construction and Maintenance occupations in Balmville are Installation, Maintenance & Repair (83 | 4.6%), and Construction & Extraction (38 | 2.1%).

Natural Resources, Construction and Maintenance Occupations by Sex

| Occupation | Male | Female |
| Farming, Fishing & Forestry | 0 (0.0%) | 0 (0.0%) |
| Construction & Extraction | 38 (100.0%) | 0 (0.0%) |
| Installation, Maintenance & Repair | 83 (100.0%) | 0 (0.0%) |
| Total (Category) | 121 (100.0%) | 0 (0.0%) |
| Total (Overall) | 883 (48.9%) | 924 (51.1%) |
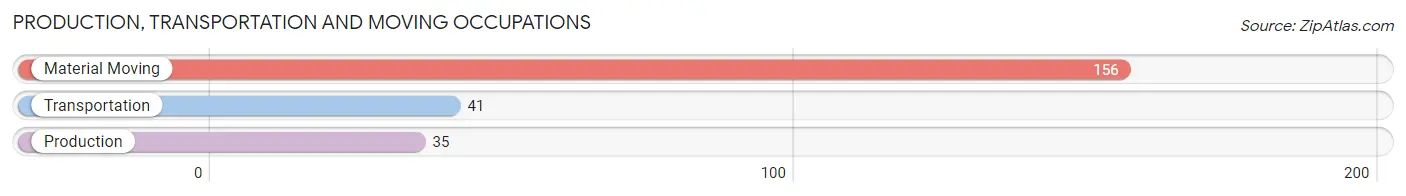
Production, Transportation and Moving Occupations
The most common Production, Transportation and Moving occupations in Balmville are Material Moving (156 | 8.6%), Transportation (41 | 2.3%), and Production (35 | 1.9%).
Production, Transportation and Moving Occupations by Sex
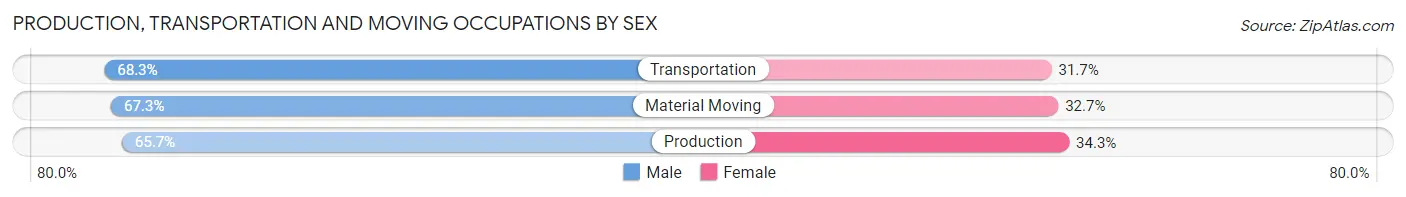
| Occupation | Male | Female |
| Production | 23 (65.7%) | 12 (34.3%) |
| Transportation | 28 (68.3%) | 13 (31.7%) |
| Material Moving | 105 (67.3%) | 51 (32.7%) |
| Total (Category) | 156 (67.2%) | 76 (32.8%) |
| Total (Overall) | 883 (48.9%) | 924 (51.1%) |
Employment Industries by Sex in Balmville
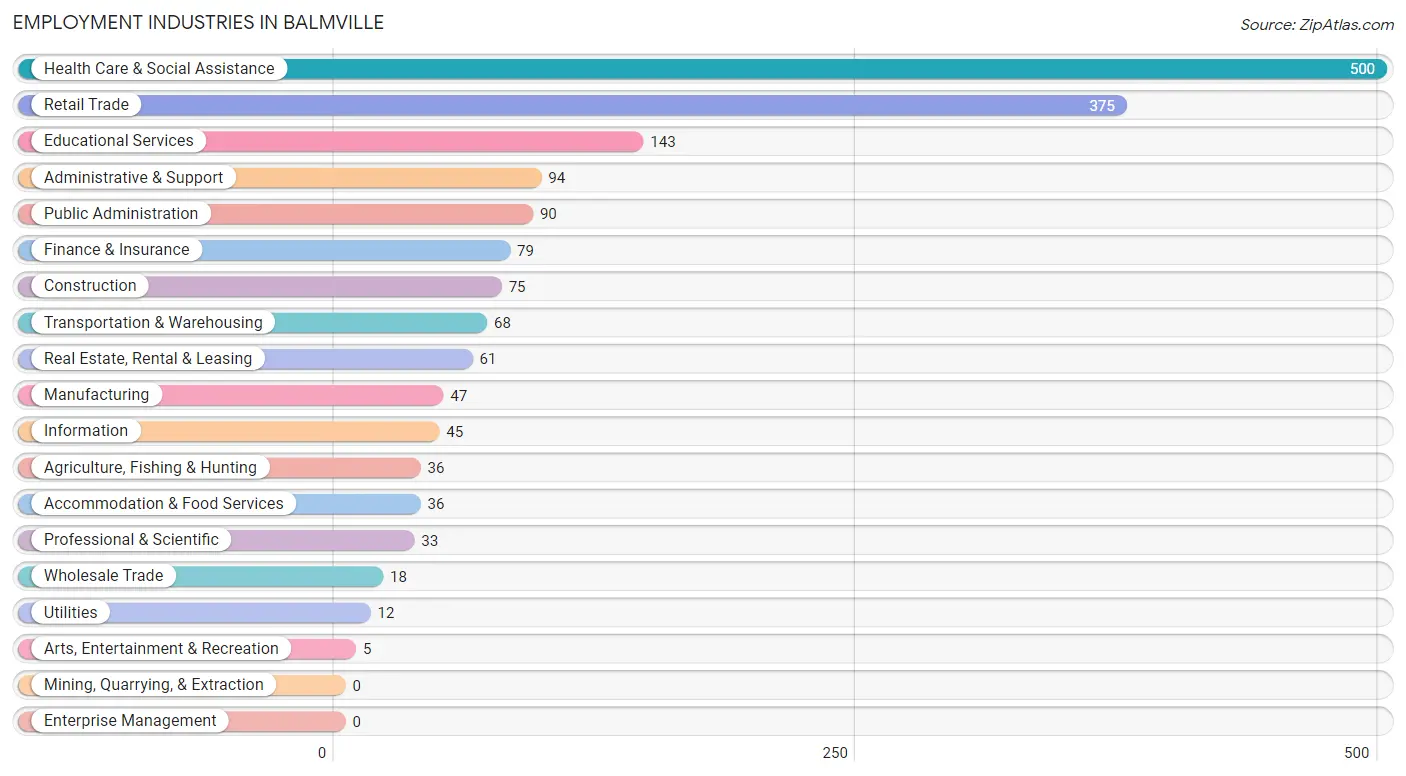
Employment Industries in Balmville
The major employment industries in Balmville include Health Care & Social Assistance (500 | 27.7%), Retail Trade (375 | 20.7%), Educational Services (143 | 7.9%), Administrative & Support (94 | 5.2%), and Public Administration (90 | 5.0%).
Employment Industries by Sex in Balmville
The Balmville industries that see more men than women are Construction (100.0%), Utilities (100.0%), and Professional & Scientific (100.0%), whereas the industries that tend to have a higher number of women are Wholesale Trade (100.0%), Real Estate, Rental & Leasing (100.0%), and Arts, Entertainment & Recreation (100.0%).
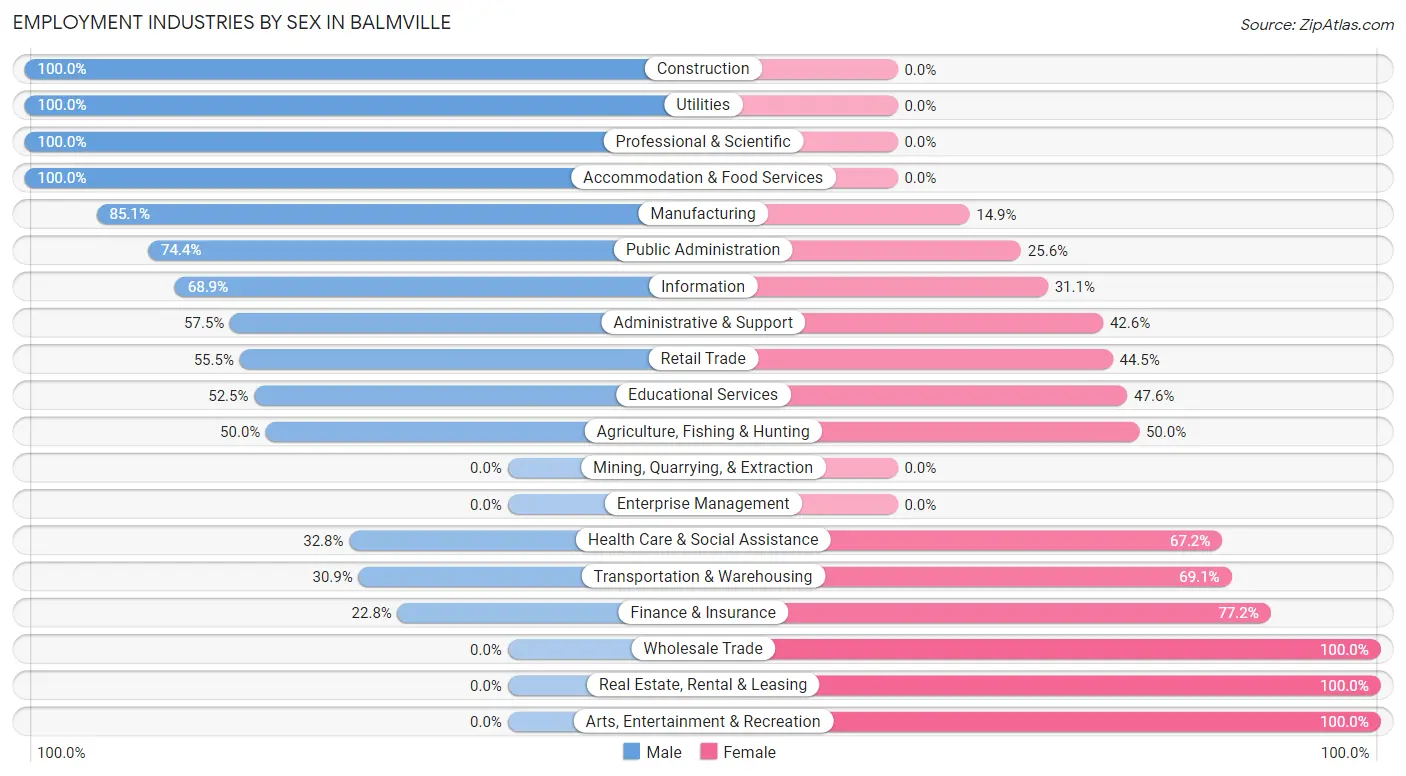
| Industry | Male | Female |
| Agriculture, Fishing & Hunting | 18 (50.0%) | 18 (50.0%) |
| Mining, Quarrying, & Extraction | 0 (0.0%) | 0 (0.0%) |
| Construction | 75 (100.0%) | 0 (0.0%) |
| Manufacturing | 40 (85.1%) | 7 (14.9%) |
| Wholesale Trade | 0 (0.0%) | 18 (100.0%) |
| Retail Trade | 208 (55.5%) | 167 (44.5%) |
| Transportation & Warehousing | 21 (30.9%) | 47 (69.1%) |
| Utilities | 12 (100.0%) | 0 (0.0%) |
| Information | 31 (68.9%) | 14 (31.1%) |
| Finance & Insurance | 18 (22.8%) | 61 (77.2%) |
| Real Estate, Rental & Leasing | 0 (0.0%) | 61 (100.0%) |
| Professional & Scientific | 33 (100.0%) | 0 (0.0%) |
| Enterprise Management | 0 (0.0%) | 0 (0.0%) |
| Administrative & Support | 54 (57.5%) | 40 (42.5%) |
| Educational Services | 75 (52.4%) | 68 (47.5%) |
| Health Care & Social Assistance | 164 (32.8%) | 336 (67.2%) |
| Arts, Entertainment & Recreation | 0 (0.0%) | 5 (100.0%) |
| Accommodation & Food Services | 36 (100.0%) | 0 (0.0%) |
| Public Administration | 67 (74.4%) | 23 (25.6%) |
| Total | 883 (48.9%) | 924 (51.1%) |
Education in Balmville
School Enrollment in Balmville
The most common levels of schooling among the 741 students in Balmville are elementary school (246 | 33.2%), high school (179 | 24.2%), and middle school (164 | 22.1%).
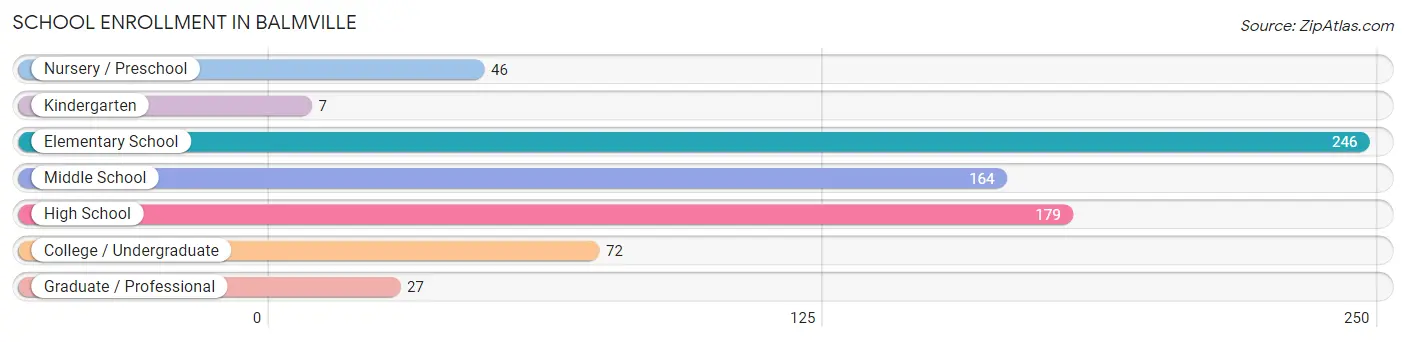
| School Level | # Students | % Students |
| Nursery / Preschool | 46 | 6.2% |
| Kindergarten | 7 | 0.9% |
| Elementary School | 246 | 33.2% |
| Middle School | 164 | 22.1% |
| High School | 179 | 24.2% |
| College / Undergraduate | 72 | 9.7% |
| Graduate / Professional | 27 | 3.6% |
| Total | 741 | 100.0% |
School Enrollment by Age by Funding Source in Balmville
Out of a total of 741 students who are enrolled in schools in Balmville, 62 (8.4%) attend a private institution, while the remaining 679 (91.6%) are enrolled in public schools. The age group of 3 to 4 year olds has the highest likelihood of being enrolled in private schools, with 8 (25.8% in the age bracket) enrolled. Conversely, the age group of 10 to 14 year olds has the lowest likelihood of being enrolled in a private school, with 220 (100.0% in the age bracket) attending a public institution.
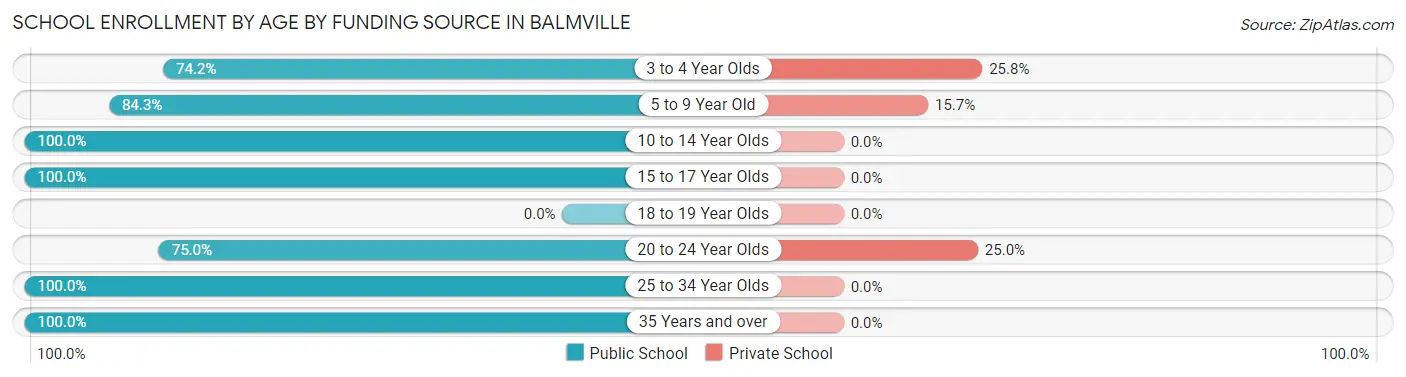
| Age Bracket | Public School | Private School |
| 3 to 4 Year Olds | 23 (74.2%) | 8 (25.8%) |
| 5 to 9 Year Old | 193 (84.3%) | 36 (15.7%) |
| 10 to 14 Year Olds | 220 (100.0%) | 0 (0.0%) |
| 15 to 17 Year Olds | 105 (100.0%) | 0 (0.0%) |
| 18 to 19 Year Olds | 0 (0.0%) | 0 (0.0%) |
| 20 to 24 Year Olds | 54 (75.0%) | 18 (25.0%) |
| 25 to 34 Year Olds | 78 (100.0%) | 0 (0.0%) |
| 35 Years and over | 6 (100.0%) | 0 (0.0%) |
| Total | 679 (91.6%) | 62 (8.4%) |
Educational Attainment by Field of Study in Balmville
Education (150 | 15.9%), business (134 | 14.2%), social sciences (129 | 13.7%), engineering (90 | 9.5%), and liberal arts & history (79 | 8.4%) are the most common fields of study among 944 individuals in Balmville who have obtained a bachelor's degree or higher.
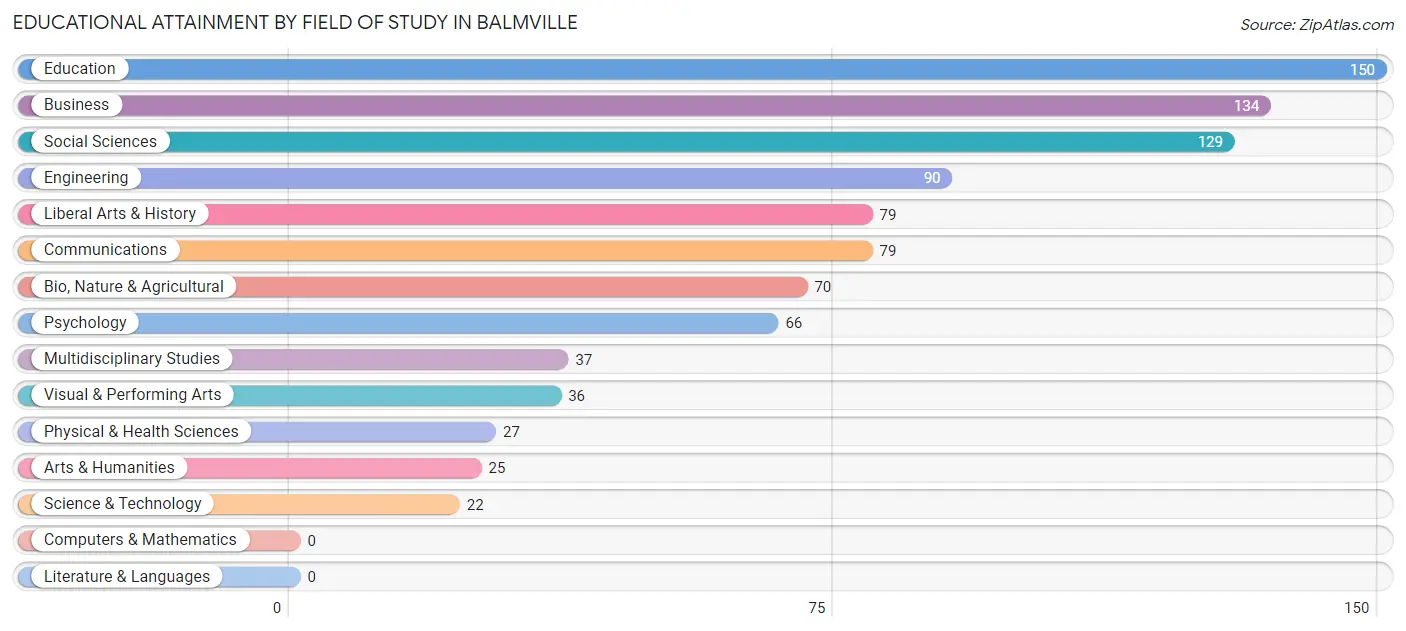
| Field of Study | # Graduates | % Graduates |
| Computers & Mathematics | 0 | 0.0% |
| Bio, Nature & Agricultural | 70 | 7.4% |
| Physical & Health Sciences | 27 | 2.9% |
| Psychology | 66 | 7.0% |
| Social Sciences | 129 | 13.7% |
| Engineering | 90 | 9.5% |
| Multidisciplinary Studies | 37 | 3.9% |
| Science & Technology | 22 | 2.3% |
| Business | 134 | 14.2% |
| Education | 150 | 15.9% |
| Literature & Languages | 0 | 0.0% |
| Liberal Arts & History | 79 | 8.4% |
| Visual & Performing Arts | 36 | 3.8% |
| Communications | 79 | 8.4% |
| Arts & Humanities | 25 | 2.6% |
| Total | 944 | 100.0% |
Transportation & Commute in Balmville
Vehicle Availability by Sex in Balmville
The most prevalent vehicle ownership categories in Balmville are males with 2 vehicles (369, accounting for 41.2%) and females with 2 vehicles (257, making up 40.5%).
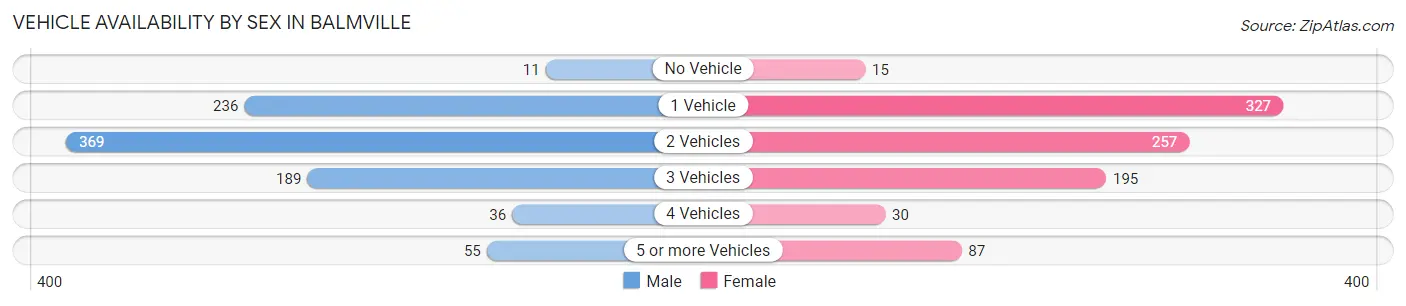
| Vehicles Available | Male | Female |
| No Vehicle | 11 (1.2%) | 15 (1.7%) |
| 1 Vehicle | 236 (26.3%) | 327 (35.9%) |
| 2 Vehicles | 369 (41.2%) | 257 (28.2%) |
| 3 Vehicles | 189 (21.1%) | 195 (21.4%) |
| 4 Vehicles | 36 (4.0%) | 30 (3.3%) |
| 5 or more Vehicles | 55 (6.1%) | 87 (9.6%) |
| Total | 896 (100.0%) | 911 (100.0%) |
Commute Time in Balmville
The most frequently occuring commute durations in Balmville are 10 to 14 minutes (284 commuters, 17.6%), 60 to 89 minutes (243 commuters, 15.0%), and 5 to 9 minutes (229 commuters, 14.2%).
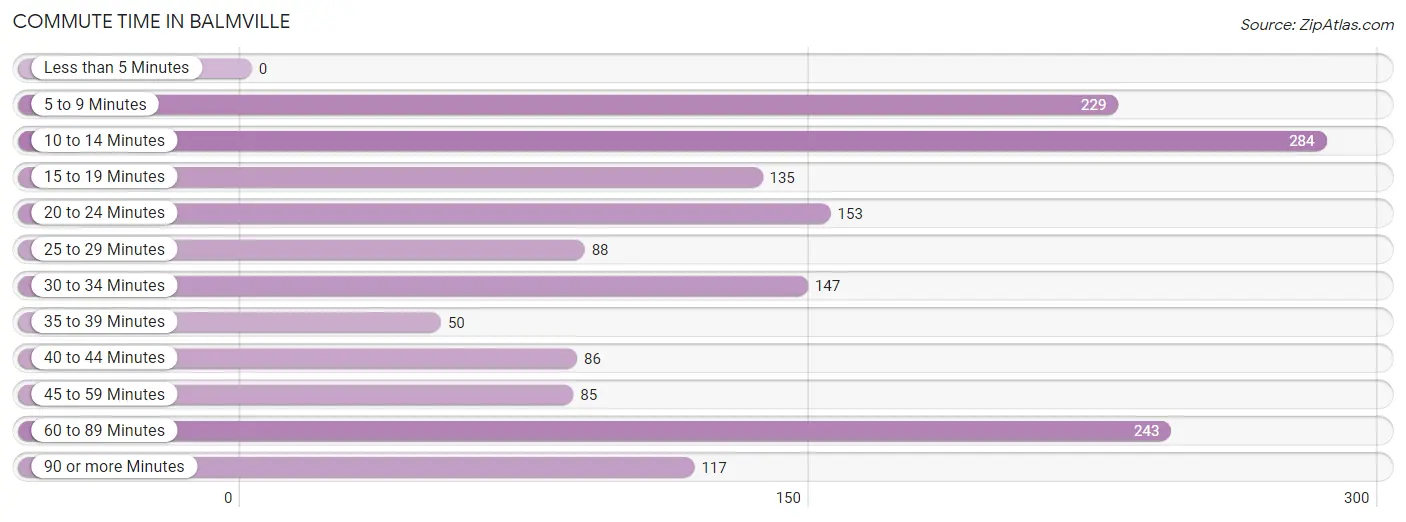
| Commute Time | # Commuters | % Commuters |
| Less than 5 Minutes | 0 | 0.0% |
| 5 to 9 Minutes | 229 | 14.2% |
| 10 to 14 Minutes | 284 | 17.6% |
| 15 to 19 Minutes | 135 | 8.4% |
| 20 to 24 Minutes | 153 | 9.5% |
| 25 to 29 Minutes | 88 | 5.4% |
| 30 to 34 Minutes | 147 | 9.1% |
| 35 to 39 Minutes | 50 | 3.1% |
| 40 to 44 Minutes | 86 | 5.3% |
| 45 to 59 Minutes | 85 | 5.3% |
| 60 to 89 Minutes | 243 | 15.0% |
| 90 or more Minutes | 117 | 7.2% |
Commute Time by Sex in Balmville
The most common commute times in Balmville are 60 to 89 minutes (150 commuters, 18.1%) for males and 10 to 14 minutes (137 commuters, 17.3%) for females.
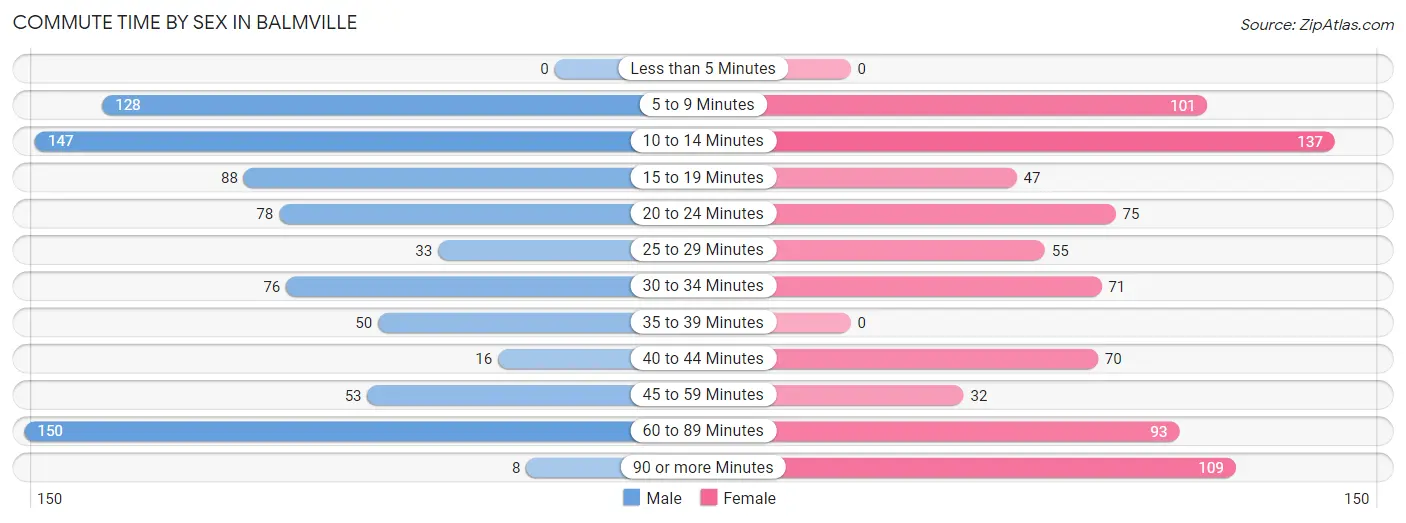
| Commute Time | Male | Female |
| Less than 5 Minutes | 0 (0.0%) | 0 (0.0%) |
| 5 to 9 Minutes | 128 (15.5%) | 101 (12.8%) |
| 10 to 14 Minutes | 147 (17.8%) | 137 (17.3%) |
| 15 to 19 Minutes | 88 (10.6%) | 47 (5.9%) |
| 20 to 24 Minutes | 78 (9.4%) | 75 (9.5%) |
| 25 to 29 Minutes | 33 (4.0%) | 55 (7.0%) |
| 30 to 34 Minutes | 76 (9.2%) | 71 (9.0%) |
| 35 to 39 Minutes | 50 (6.0%) | 0 (0.0%) |
| 40 to 44 Minutes | 16 (1.9%) | 70 (8.9%) |
| 45 to 59 Minutes | 53 (6.4%) | 32 (4.1%) |
| 60 to 89 Minutes | 150 (18.1%) | 93 (11.8%) |
| 90 or more Minutes | 8 (1.0%) | 109 (13.8%) |
Time of Departure to Work by Sex in Balmville
The most frequent times of departure to work in Balmville are 7:00 AM to 7:29 AM (218, 26.4%) for males and 6:30 AM to 6:59 AM (199, 25.2%) for females.
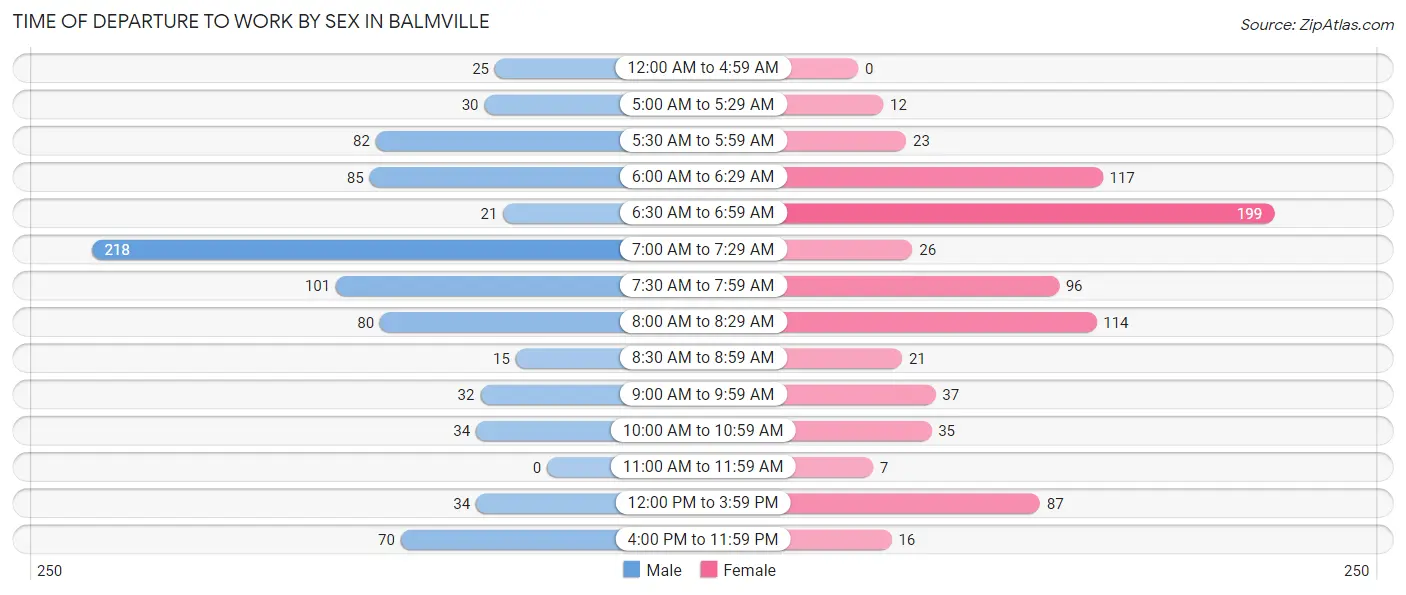
| Time of Departure | Male | Female |
| 12:00 AM to 4:59 AM | 25 (3.0%) | 0 (0.0%) |
| 5:00 AM to 5:29 AM | 30 (3.6%) | 12 (1.5%) |
| 5:30 AM to 5:59 AM | 82 (9.9%) | 23 (2.9%) |
| 6:00 AM to 6:29 AM | 85 (10.3%) | 117 (14.8%) |
| 6:30 AM to 6:59 AM | 21 (2.5%) | 199 (25.2%) |
| 7:00 AM to 7:29 AM | 218 (26.4%) | 26 (3.3%) |
| 7:30 AM to 7:59 AM | 101 (12.2%) | 96 (12.1%) |
| 8:00 AM to 8:29 AM | 80 (9.7%) | 114 (14.4%) |
| 8:30 AM to 8:59 AM | 15 (1.8%) | 21 (2.7%) |
| 9:00 AM to 9:59 AM | 32 (3.9%) | 37 (4.7%) |
| 10:00 AM to 10:59 AM | 34 (4.1%) | 35 (4.4%) |
| 11:00 AM to 11:59 AM | 0 (0.0%) | 7 (0.9%) |
| 12:00 PM to 3:59 PM | 34 (4.1%) | 87 (11.0%) |
| 4:00 PM to 11:59 PM | 70 (8.5%) | 16 (2.0%) |
| Total | 827 (100.0%) | 790 (100.0%) |
Housing Occupancy in Balmville
Occupancy by Ownership in Balmville
Of the total 1,283 dwellings in Balmville, owner-occupied units account for 936 (73.0%), while renter-occupied units make up 347 (27.1%).
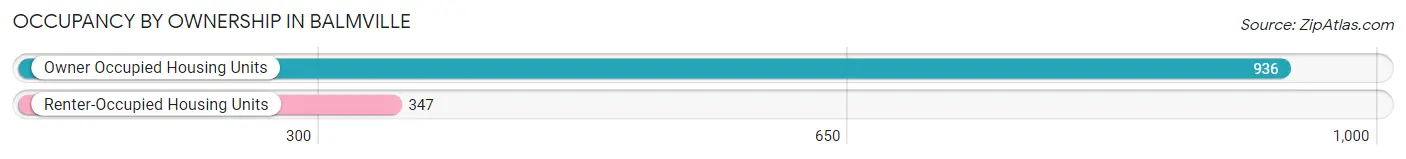
| Occupancy | # Housing Units | % Housing Units |
| Owner Occupied Housing Units | 936 | 73.0% |
| Renter-Occupied Housing Units | 347 | 27.1% |
| Total Occupied Housing Units | 1,283 | 100.0% |
Occupancy by Household Size in Balmville
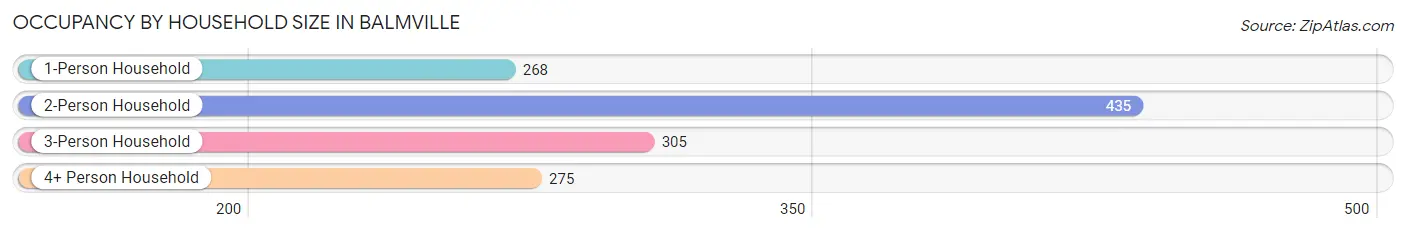
| Household Size | # Housing Units | % Housing Units |
| 1-Person Household | 268 | 20.9% |
| 2-Person Household | 435 | 33.9% |
| 3-Person Household | 305 | 23.8% |
| 4+ Person Household | 275 | 21.4% |
| Total Housing Units | 1,283 | 100.0% |
Occupancy by Ownership by Household Size in Balmville
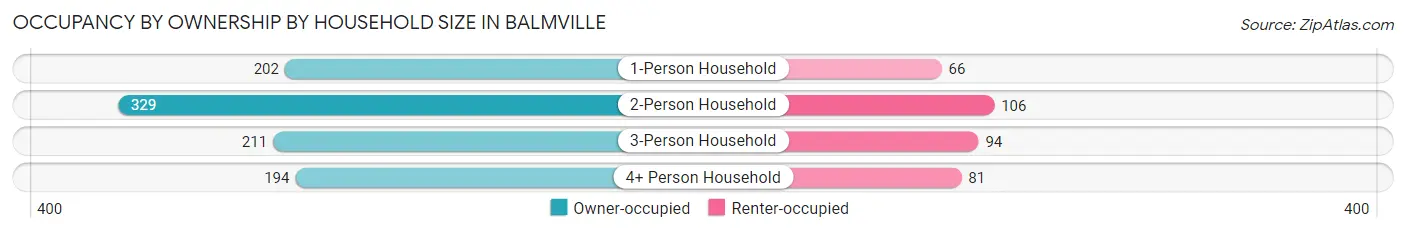
| Household Size | Owner-occupied | Renter-occupied |
| 1-Person Household | 202 (75.4%) | 66 (24.6%) |
| 2-Person Household | 329 (75.6%) | 106 (24.4%) |
| 3-Person Household | 211 (69.2%) | 94 (30.8%) |
| 4+ Person Household | 194 (70.6%) | 81 (29.4%) |
| Total Housing Units | 936 (73.0%) | 347 (27.1%) |
Occupancy by Educational Attainment in Balmville
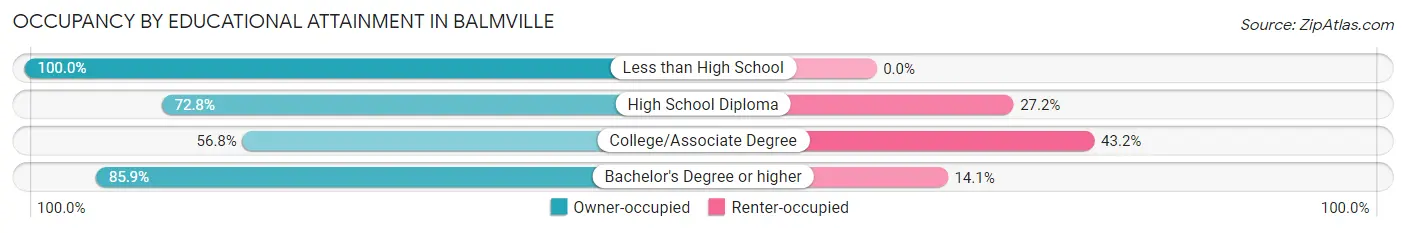
| Household Size | Owner-occupied | Renter-occupied |
| Less than High School | 28 (100.0%) | 0 (0.0%) |
| High School Diploma | 252 (72.8%) | 94 (27.2%) |
| College/Associate Degree | 243 (56.8%) | 185 (43.2%) |
| Bachelor's Degree or higher | 413 (85.9%) | 68 (14.1%) |
Occupancy by Age of Householder in Balmville
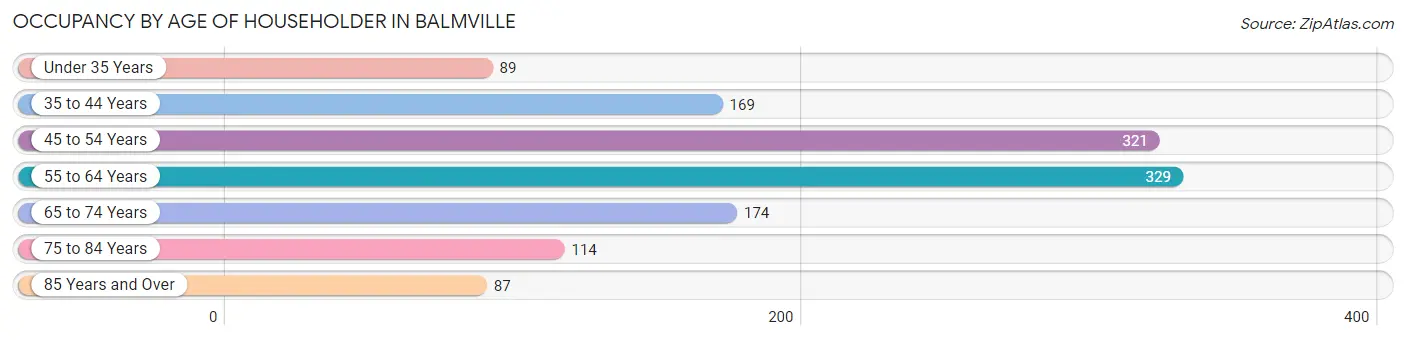
| Age Bracket | # Households | % Households |
| Under 35 Years | 89 | 6.9% |
| 35 to 44 Years | 169 | 13.2% |
| 45 to 54 Years | 321 | 25.0% |
| 55 to 64 Years | 329 | 25.6% |
| 65 to 74 Years | 174 | 13.6% |
| 75 to 84 Years | 114 | 8.9% |
| 85 Years and Over | 87 | 6.8% |
| Total | 1,283 | 100.0% |
Housing Finances in Balmville
Median Income by Occupancy in Balmville
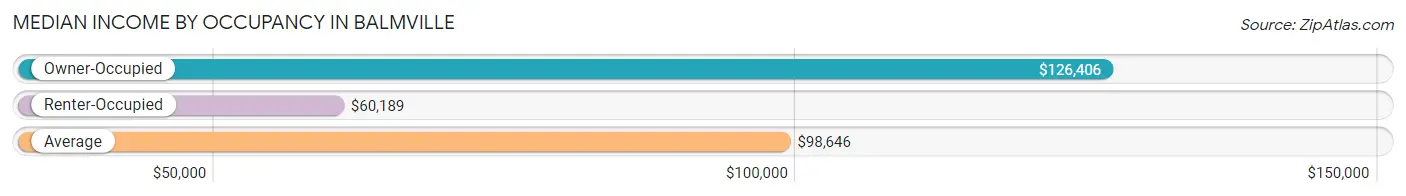
| Occupancy Type | # Households | Median Income |
| Owner-Occupied | 936 (73.0%) | $126,406 |
| Renter-Occupied | 347 (27.1%) | $60,189 |
| Average | 1,283 (100.0%) | $98,646 |
Occupancy by Householder Income Bracket in Balmville
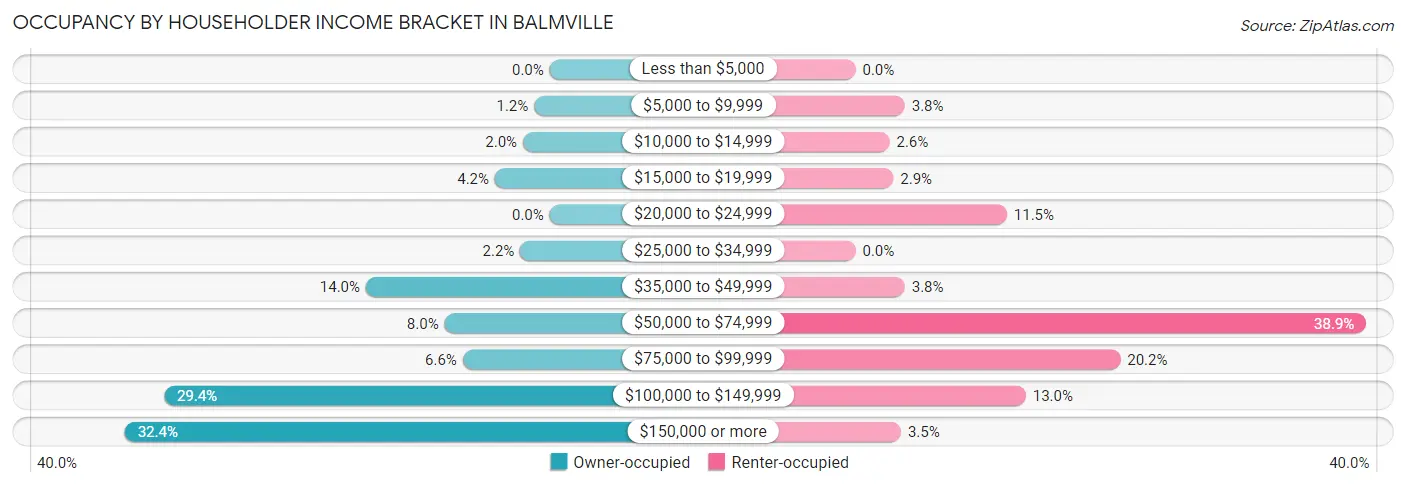
| Income Bracket | Owner-occupied | Renter-occupied |
| Less than $5,000 | 0 (0.0%) | 0 (0.0%) |
| $5,000 to $9,999 | 11 (1.2%) | 13 (3.7%) |
| $10,000 to $14,999 | 19 (2.0%) | 9 (2.6%) |
| $15,000 to $19,999 | 39 (4.2%) | 10 (2.9%) |
| $20,000 to $24,999 | 0 (0.0%) | 40 (11.5%) |
| $25,000 to $34,999 | 21 (2.2%) | 0 (0.0%) |
| $35,000 to $49,999 | 131 (14.0%) | 13 (3.7%) |
| $50,000 to $74,999 | 75 (8.0%) | 135 (38.9%) |
| $75,000 to $99,999 | 62 (6.6%) | 70 (20.2%) |
| $100,000 to $149,999 | 275 (29.4%) | 45 (13.0%) |
| $150,000 or more | 303 (32.4%) | 12 (3.5%) |
| Total | 936 (100.0%) | 347 (100.0%) |
Monthly Housing Cost Tiers in Balmville
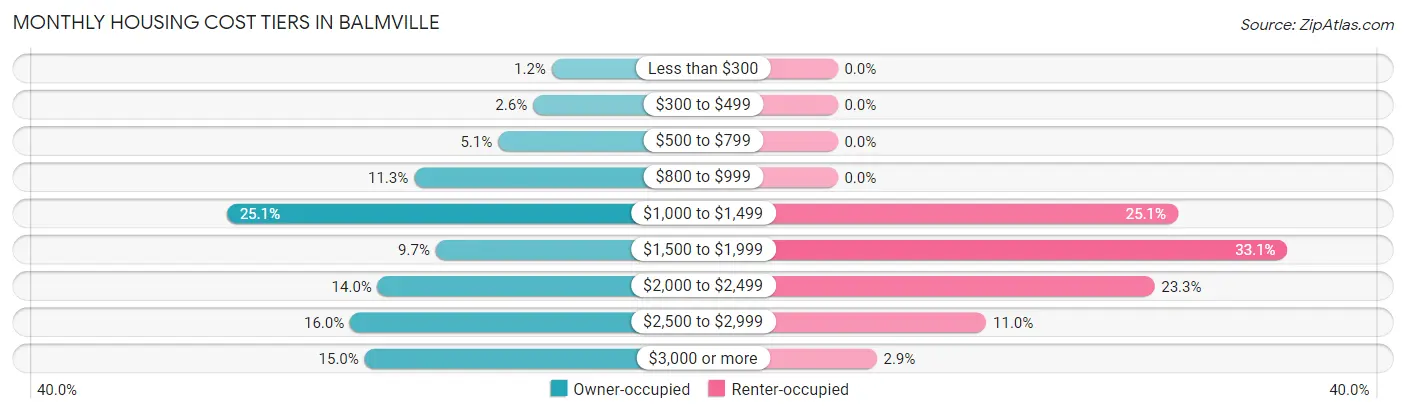
| Monthly Cost | Owner-occupied | Renter-occupied |
| Less than $300 | 11 (1.2%) | 0 (0.0%) |
| $300 to $499 | 24 (2.6%) | 0 (0.0%) |
| $500 to $799 | 48 (5.1%) | 0 (0.0%) |
| $800 to $999 | 106 (11.3%) | 0 (0.0%) |
| $1,000 to $1,499 | 235 (25.1%) | 87 (25.1%) |
| $1,500 to $1,999 | 91 (9.7%) | 115 (33.1%) |
| $2,000 to $2,499 | 131 (14.0%) | 81 (23.3%) |
| $2,500 to $2,999 | 150 (16.0%) | 38 (11.0%) |
| $3,000 or more | 140 (15.0%) | 10 (2.9%) |
| Total | 936 (100.0%) | 347 (100.0%) |
Physical Housing Characteristics in Balmville
Housing Structures in Balmville
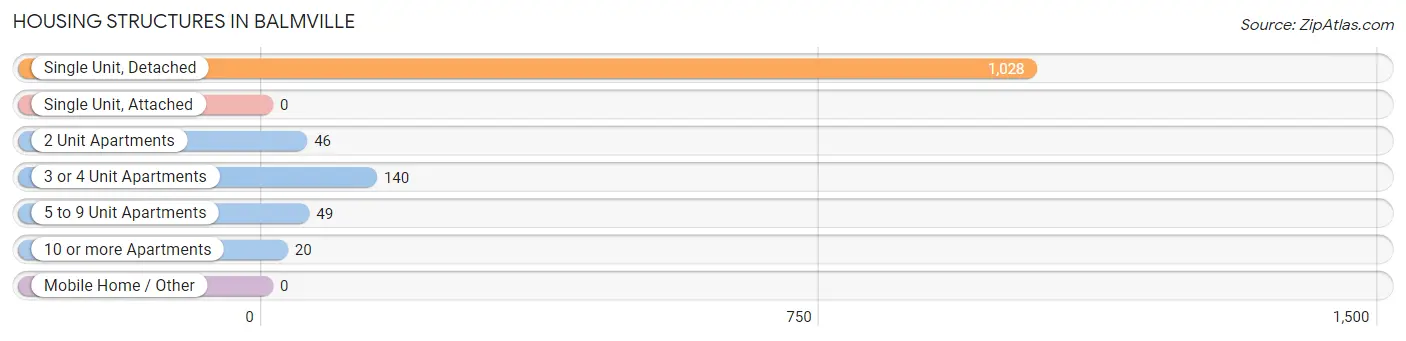
| Structure Type | # Housing Units | % Housing Units |
| Single Unit, Detached | 1,028 | 80.1% |
| Single Unit, Attached | 0 | 0.0% |
| 2 Unit Apartments | 46 | 3.6% |
| 3 or 4 Unit Apartments | 140 | 10.9% |
| 5 to 9 Unit Apartments | 49 | 3.8% |
| 10 or more Apartments | 20 | 1.6% |
| Mobile Home / Other | 0 | 0.0% |
| Total | 1,283 | 100.0% |
Housing Structures by Occupancy in Balmville
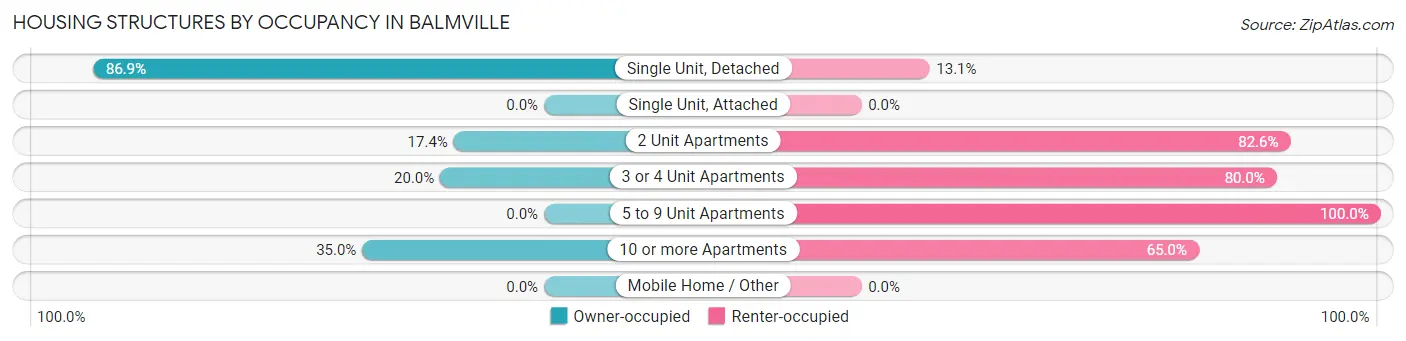
| Structure Type | Owner-occupied | Renter-occupied |
| Single Unit, Detached | 893 (86.9%) | 135 (13.1%) |
| Single Unit, Attached | 0 (0.0%) | 0 (0.0%) |
| 2 Unit Apartments | 8 (17.4%) | 38 (82.6%) |
| 3 or 4 Unit Apartments | 28 (20.0%) | 112 (80.0%) |
| 5 to 9 Unit Apartments | 0 (0.0%) | 49 (100.0%) |
| 10 or more Apartments | 7 (35.0%) | 13 (65.0%) |
| Mobile Home / Other | 0 (0.0%) | 0 (0.0%) |
| Total | 936 (73.0%) | 347 (27.1%) |
Housing Structures by Number of Rooms in Balmville
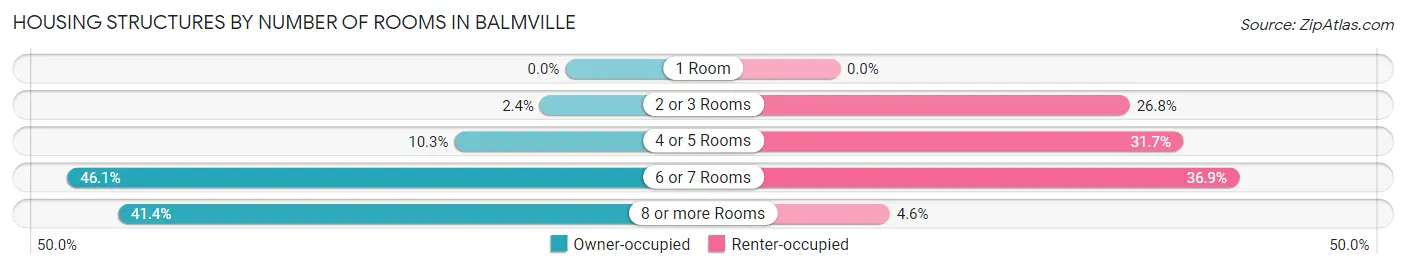
| Number of Rooms | Owner-occupied | Renter-occupied |
| 1 Room | 0 (0.0%) | 0 (0.0%) |
| 2 or 3 Rooms | 22 (2.4%) | 93 (26.8%) |
| 4 or 5 Rooms | 96 (10.3%) | 110 (31.7%) |
| 6 or 7 Rooms | 431 (46.1%) | 128 (36.9%) |
| 8 or more Rooms | 387 (41.3%) | 16 (4.6%) |
| Total | 936 (100.0%) | 347 (100.0%) |
Housing Structure by Heating Type in Balmville
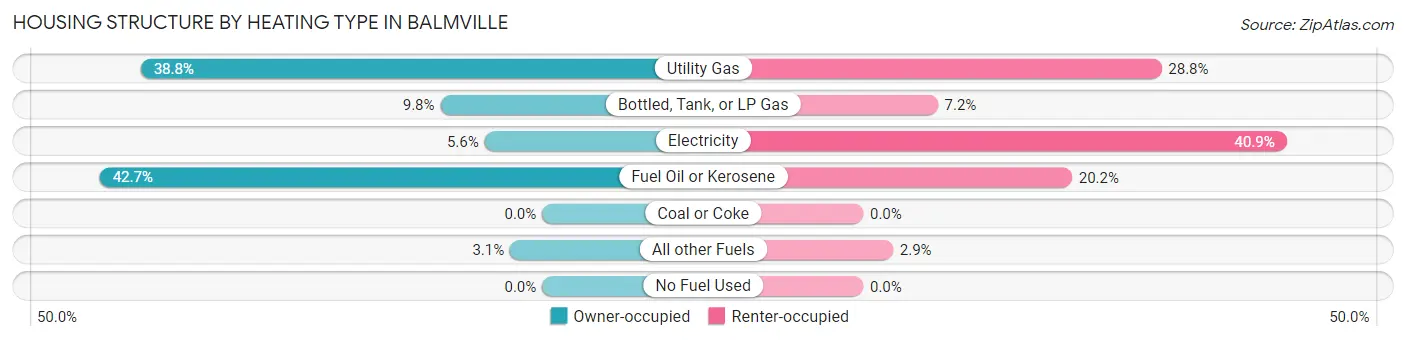
| Heating Type | Owner-occupied | Renter-occupied |
| Utility Gas | 363 (38.8%) | 100 (28.8%) |
| Bottled, Tank, or LP Gas | 92 (9.8%) | 25 (7.2%) |
| Electricity | 52 (5.6%) | 142 (40.9%) |
| Fuel Oil or Kerosene | 400 (42.7%) | 70 (20.2%) |
| Coal or Coke | 0 (0.0%) | 0 (0.0%) |
| All other Fuels | 29 (3.1%) | 10 (2.9%) |
| No Fuel Used | 0 (0.0%) | 0 (0.0%) |
| Total | 936 (100.0%) | 347 (100.0%) |
Household Vehicle Usage in Balmville
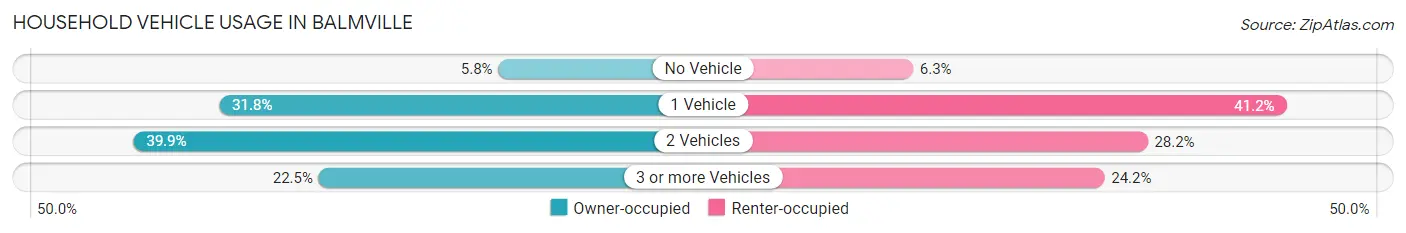
| Vehicles per Household | Owner-occupied | Renter-occupied |
| No Vehicle | 54 (5.8%) | 22 (6.3%) |
| 1 Vehicle | 298 (31.8%) | 143 (41.2%) |
| 2 Vehicles | 373 (39.9%) | 98 (28.2%) |
| 3 or more Vehicles | 211 (22.5%) | 84 (24.2%) |
| Total | 936 (100.0%) | 347 (100.0%) |
Real Estate & Mortgages in Balmville
Real Estate and Mortgage Overview in Balmville
| Characteristic | Without Mortgage | With Mortgage |
| Housing Units | 413 | 523 |
| Median Property Value | $401,600 | $350,000 |
| Median Household Income | $82,604 | $194 |
| Monthly Housing Costs | $1,222 | $140 |
| Real Estate Taxes | $7,370 | $0 |
Property Value by Mortgage Status in Balmville
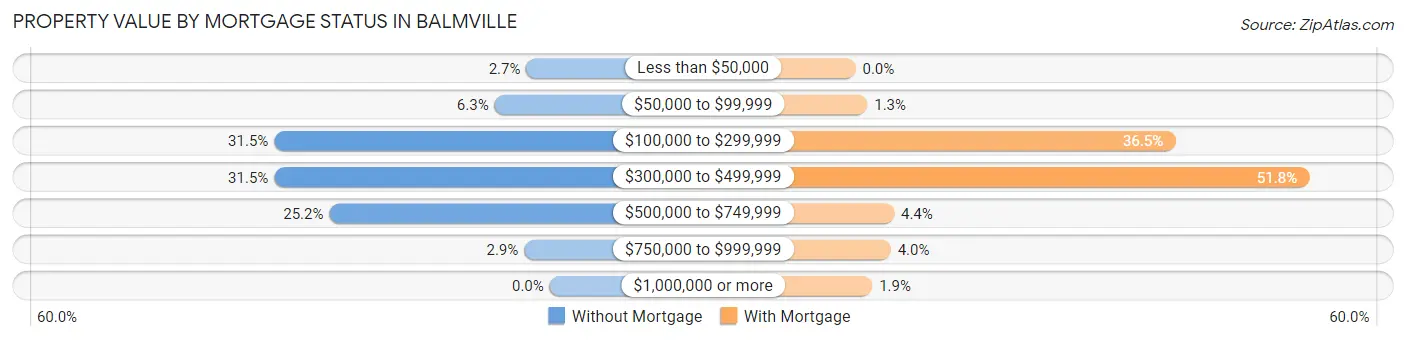
| Property Value | Without Mortgage | With Mortgage |
| Less than $50,000 | 11 (2.7%) | 0 (0.0%) |
| $50,000 to $99,999 | 26 (6.3%) | 7 (1.3%) |
| $100,000 to $299,999 | 130 (31.5%) | 191 (36.5%) |
| $300,000 to $499,999 | 130 (31.5%) | 271 (51.8%) |
| $500,000 to $749,999 | 104 (25.2%) | 23 (4.4%) |
| $750,000 to $999,999 | 12 (2.9%) | 21 (4.0%) |
| $1,000,000 or more | 0 (0.0%) | 10 (1.9%) |
| Total | 413 (100.0%) | 523 (100.0%) |
Household Income by Mortgage Status in Balmville
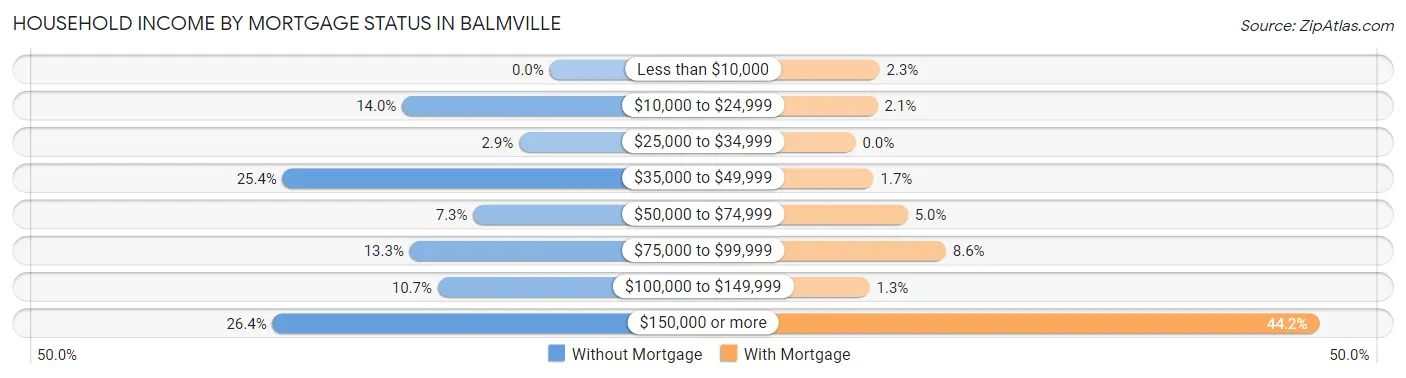
| Household Income | Without Mortgage | With Mortgage |
| Less than $10,000 | 0 (0.0%) | 12 (2.3%) |
| $10,000 to $24,999 | 58 (14.0%) | 11 (2.1%) |
| $25,000 to $34,999 | 12 (2.9%) | 0 (0.0%) |
| $35,000 to $49,999 | 105 (25.4%) | 9 (1.7%) |
| $50,000 to $74,999 | 30 (7.3%) | 26 (5.0%) |
| $75,000 to $99,999 | 55 (13.3%) | 45 (8.6%) |
| $100,000 to $149,999 | 44 (10.6%) | 7 (1.3%) |
| $150,000 or more | 109 (26.4%) | 231 (44.2%) |
| Total | 413 (100.0%) | 523 (100.0%) |
Property Value to Household Income Ratio in Balmville
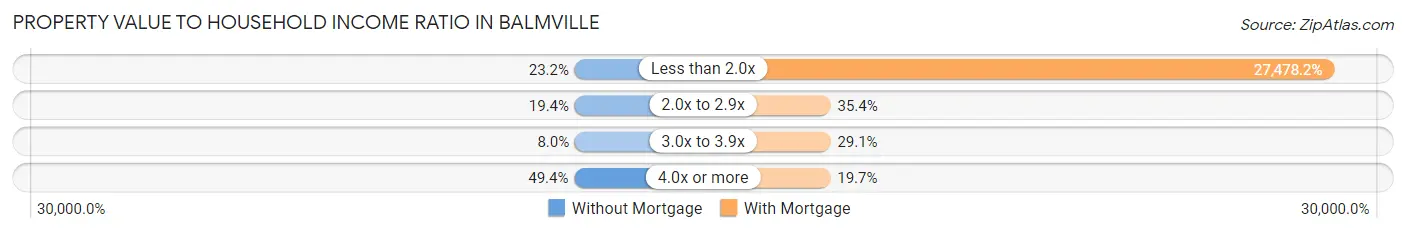
| Value-to-Income Ratio | Without Mortgage | With Mortgage |
| Less than 2.0x | 96 (23.2%) | 143,711 (27,478.2%) |
| 2.0x to 2.9x | 80 (19.4%) | 185 (35.4%) |
| 3.0x to 3.9x | 33 (8.0%) | 152 (29.1%) |
| 4.0x or more | 204 (49.4%) | 103 (19.7%) |
| Total | 413 (100.0%) | 523 (100.0%) |
Real Estate Taxes by Mortgage Status in Balmville

| Property Taxes | Without Mortgage | With Mortgage |
| Less than $800 | 0 (0.0%) | 0 (0.0%) |
| $800 to $1,499 | 24 (5.8%) | 11 (2.1%) |
| $800 to $1,499 | 378 (91.5%) | 21 (4.0%) |
| Total | 413 (100.0%) | 523 (100.0%) |
Health & Disability in Balmville
Health Insurance Coverage by Age in Balmville
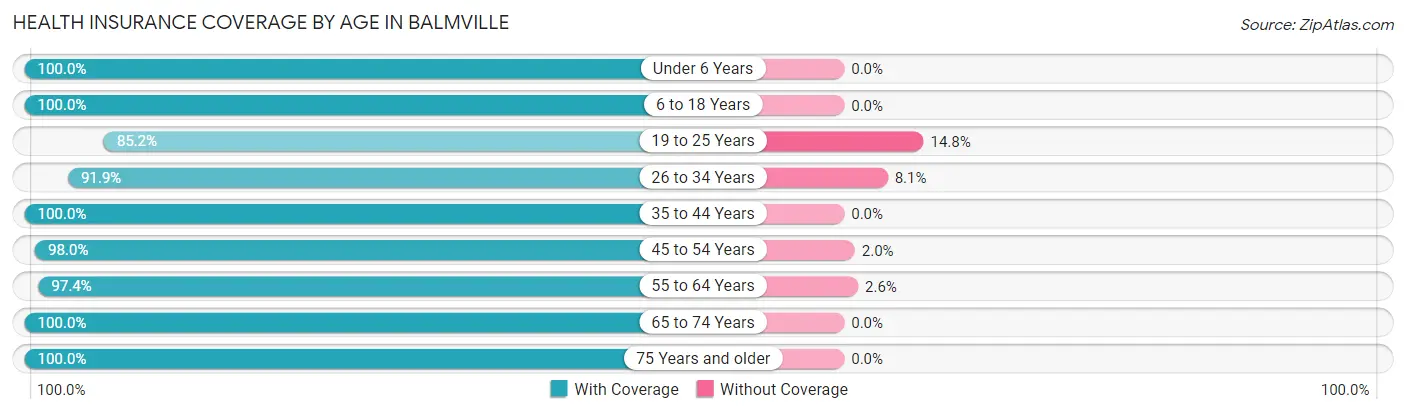
| Age Bracket | With Coverage | Without Coverage |
| Under 6 Years | 157 (100.0%) | 0 (0.0%) |
| 6 to 18 Years | 558 (100.0%) | 0 (0.0%) |
| 19 to 25 Years | 294 (85.2%) | 51 (14.8%) |
| 26 to 34 Years | 318 (91.9%) | 28 (8.1%) |
| 35 to 44 Years | 335 (100.0%) | 0 (0.0%) |
| 45 to 54 Years | 702 (98.0%) | 14 (2.0%) |
| 55 to 64 Years | 643 (97.4%) | 17 (2.6%) |
| 65 to 74 Years | 281 (100.0%) | 0 (0.0%) |
| 75 Years and older | 365 (100.0%) | 0 (0.0%) |
| Total | 3,653 (97.1%) | 110 (2.9%) |
Health Insurance Coverage by Citizenship Status in Balmville
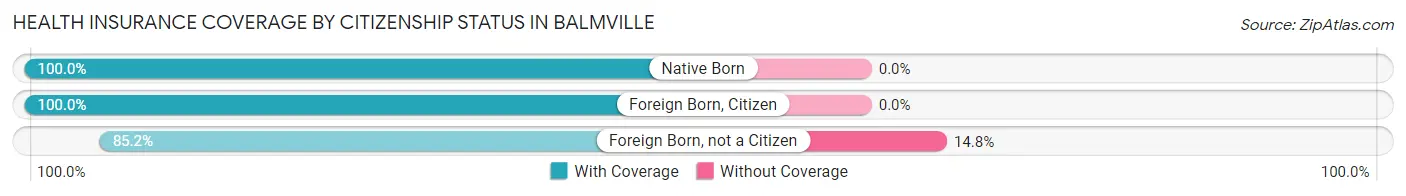
| Citizenship Status | With Coverage | Without Coverage |
| Native Born | 157 (100.0%) | 0 (0.0%) |
| Foreign Born, Citizen | 558 (100.0%) | 0 (0.0%) |
| Foreign Born, not a Citizen | 294 (85.2%) | 51 (14.8%) |
Health Insurance Coverage by Household Income in Balmville
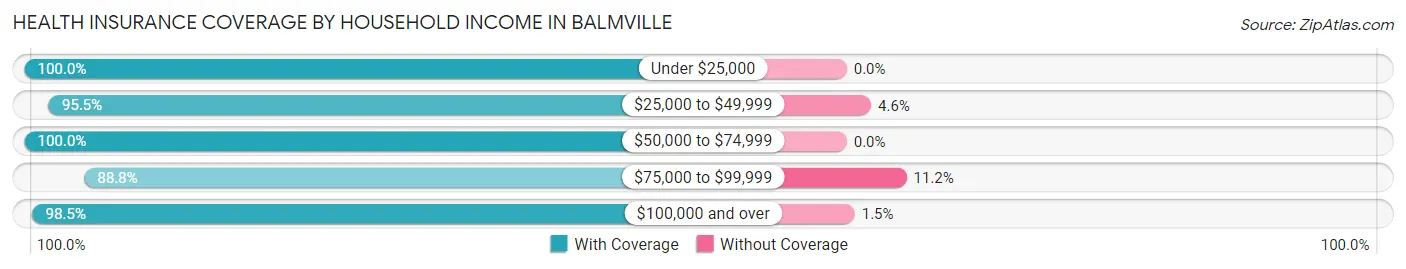
| Household Income | With Coverage | Without Coverage |
| Under $25,000 | 219 (100.0%) | 0 (0.0%) |
| $25,000 to $49,999 | 252 (95.5%) | 12 (4.5%) |
| $50,000 to $74,999 | 644 (100.0%) | 0 (0.0%) |
| $75,000 to $99,999 | 539 (88.8%) | 68 (11.2%) |
| $100,000 and over | 1,970 (98.5%) | 30 (1.5%) |
Public vs Private Health Insurance Coverage by Age in Balmville
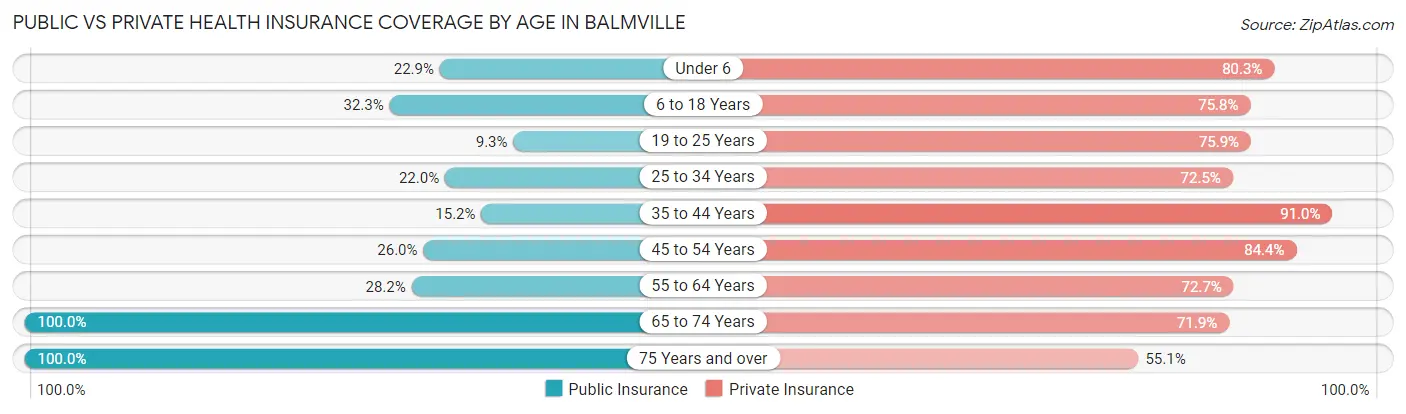
| Age Bracket | Public Insurance | Private Insurance |
| Under 6 | 36 (22.9%) | 126 (80.2%) |
| 6 to 18 Years | 180 (32.3%) | 423 (75.8%) |
| 19 to 25 Years | 32 (9.3%) | 262 (75.9%) |
| 25 to 34 Years | 76 (22.0%) | 251 (72.5%) |
| 35 to 44 Years | 51 (15.2%) | 305 (91.0%) |
| 45 to 54 Years | 186 (26.0%) | 604 (84.4%) |
| 55 to 64 Years | 186 (28.2%) | 480 (72.7%) |
| 65 to 74 Years | 281 (100.0%) | 202 (71.9%) |
| 75 Years and over | 365 (100.0%) | 201 (55.1%) |
| Total | 1,393 (37.0%) | 2,854 (75.8%) |
Disability Status by Sex by Age in Balmville
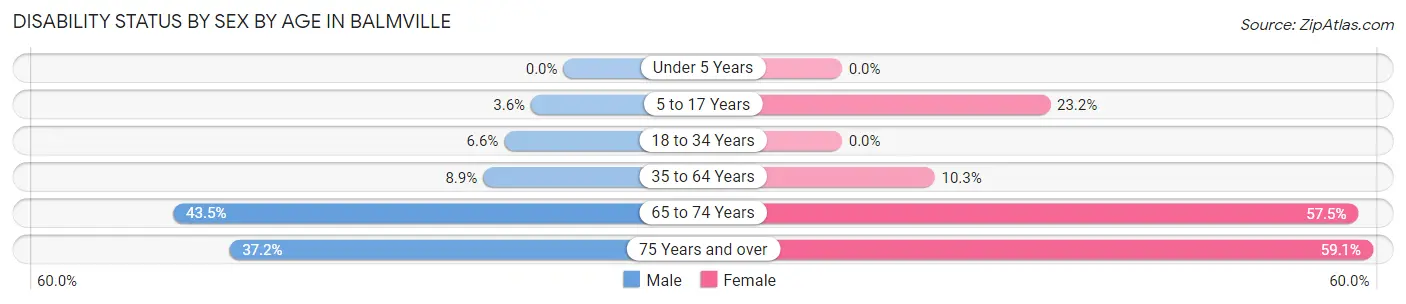
| Age Bracket | Male | Female |
| Under 5 Years | 0 (0.0%) | 0 (0.0%) |
| 5 to 17 Years | 15 (3.6%) | 32 (23.2%) |
| 18 to 34 Years | 28 (6.6%) | 0 (0.0%) |
| 35 to 64 Years | 69 (8.9%) | 97 (10.3%) |
| 65 to 74 Years | 73 (43.4%) | 65 (57.5%) |
| 75 Years and over | 32 (37.2%) | 165 (59.1%) |
Disability Class by Sex by Age in Balmville
Disability Class: Hearing Difficulty
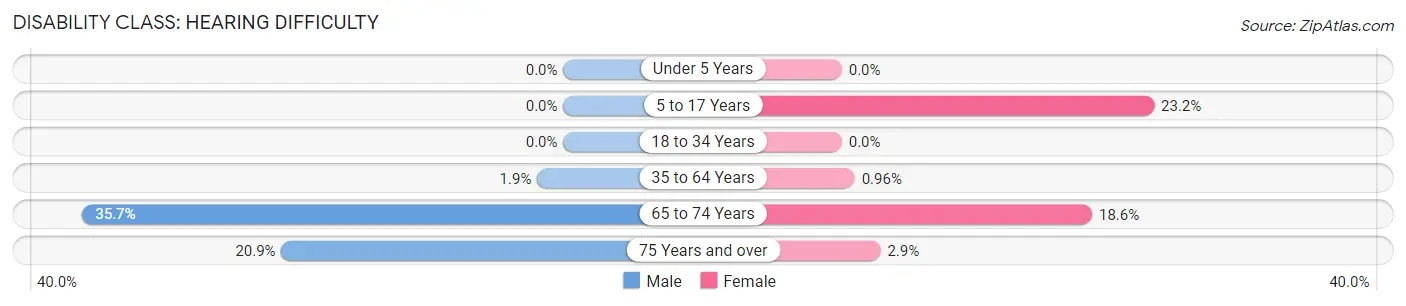
| Age Bracket | Male | Female |
| Under 5 Years | 0 (0.0%) | 0 (0.0%) |
| 5 to 17 Years | 0 (0.0%) | 32 (23.2%) |
| 18 to 34 Years | 0 (0.0%) | 0 (0.0%) |
| 35 to 64 Years | 15 (1.9%) | 9 (1.0%) |
| 65 to 74 Years | 60 (35.7%) | 21 (18.6%) |
| 75 Years and over | 18 (20.9%) | 8 (2.9%) |
Disability Class: Vision Difficulty
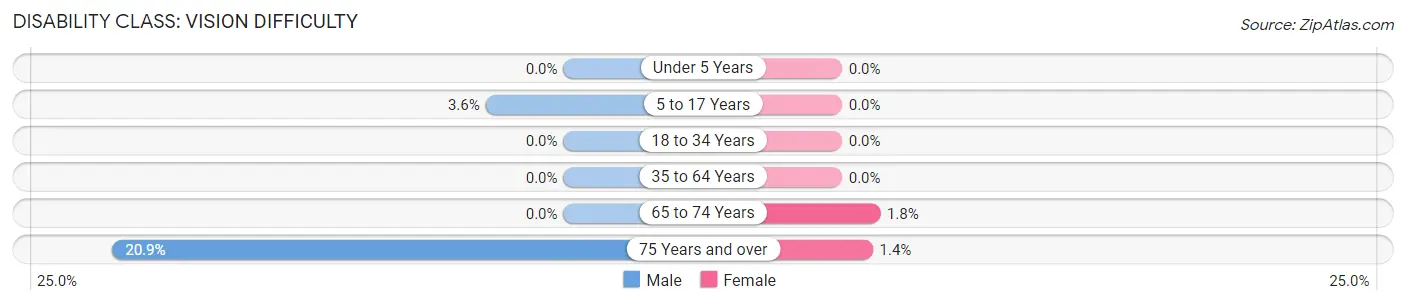
| Age Bracket | Male | Female |
| Under 5 Years | 0 (0.0%) | 0 (0.0%) |
| 5 to 17 Years | 15 (3.6%) | 0 (0.0%) |
| 18 to 34 Years | 0 (0.0%) | 0 (0.0%) |
| 35 to 64 Years | 0 (0.0%) | 0 (0.0%) |
| 65 to 74 Years | 0 (0.0%) | 2 (1.8%) |
| 75 Years and over | 18 (20.9%) | 4 (1.4%) |
Disability Class: Cognitive Difficulty
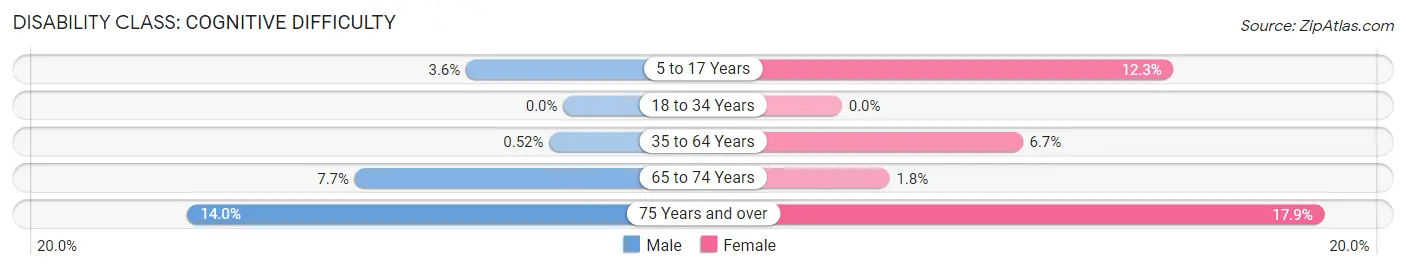
| Age Bracket | Male | Female |
| 5 to 17 Years | 15 (3.6%) | 17 (12.3%) |
| 18 to 34 Years | 0 (0.0%) | 0 (0.0%) |
| 35 to 64 Years | 4 (0.5%) | 63 (6.7%) |
| 65 to 74 Years | 13 (7.7%) | 2 (1.8%) |
| 75 Years and over | 12 (14.0%) | 50 (17.9%) |
Disability Class: Ambulatory Difficulty
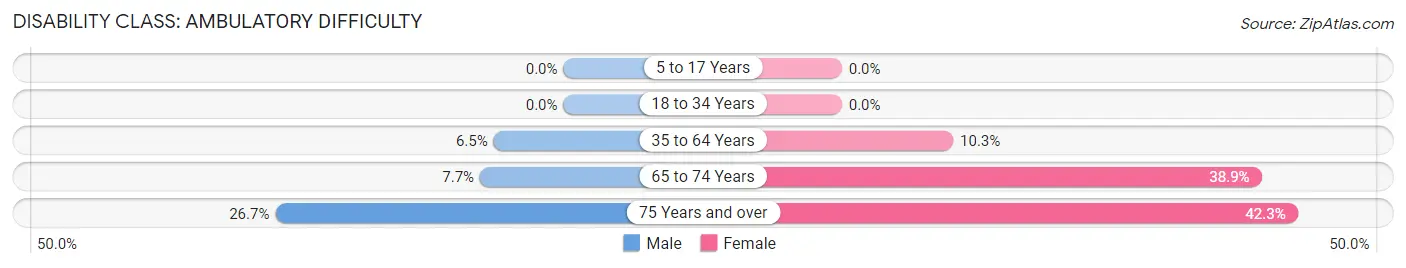
| Age Bracket | Male | Female |
| 5 to 17 Years | 0 (0.0%) | 0 (0.0%) |
| 18 to 34 Years | 0 (0.0%) | 0 (0.0%) |
| 35 to 64 Years | 50 (6.5%) | 97 (10.3%) |
| 65 to 74 Years | 13 (7.7%) | 44 (38.9%) |
| 75 Years and over | 23 (26.7%) | 118 (42.3%) |
Disability Class: Self-Care Difficulty
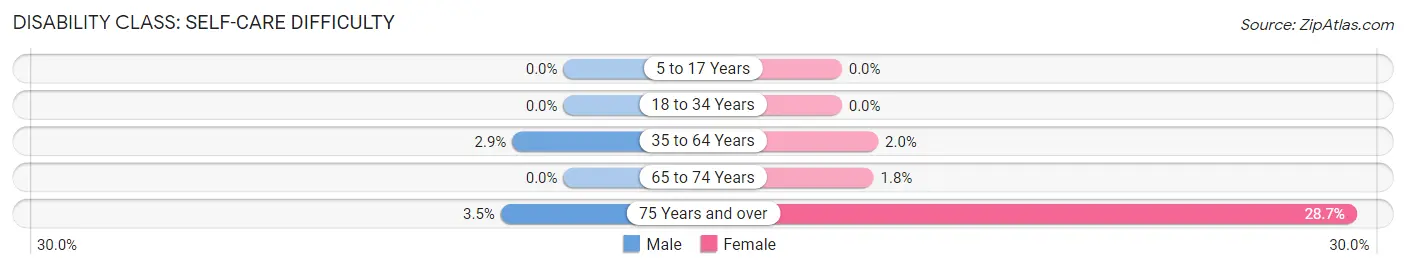
| Age Bracket | Male | Female |
| 5 to 17 Years | 0 (0.0%) | 0 (0.0%) |
| 18 to 34 Years | 0 (0.0%) | 0 (0.0%) |
| 35 to 64 Years | 22 (2.9%) | 19 (2.0%) |
| 65 to 74 Years | 0 (0.0%) | 2 (1.8%) |
| 75 Years and over | 3 (3.5%) | 80 (28.7%) |
Technology Access in Balmville
Computing Device Access in Balmville
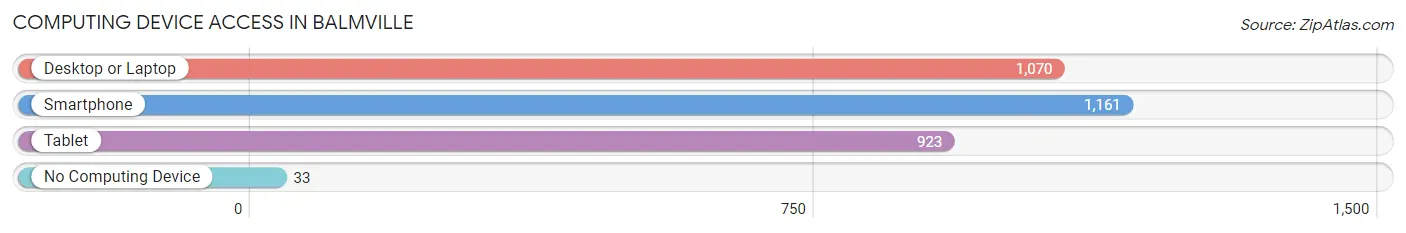
| Device Type | # Households | % Households |
| Desktop or Laptop | 1,070 | 83.4% |
| Smartphone | 1,161 | 90.5% |
| Tablet | 923 | 71.9% |
| No Computing Device | 33 | 2.6% |
| Total | 1,283 | 100.0% |
Internet Access in Balmville
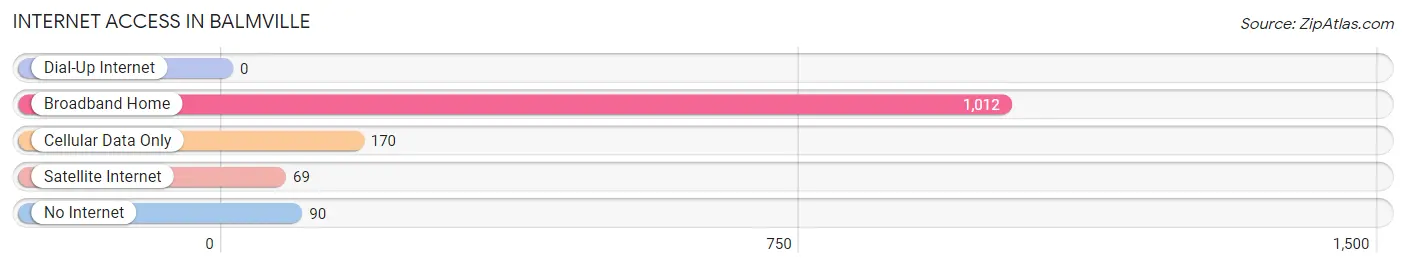
| Internet Type | # Households | % Households |
| Dial-Up Internet | 0 | 0.0% |
| Broadband Home | 1,012 | 78.9% |
| Cellular Data Only | 170 | 13.3% |
| Satellite Internet | 69 | 5.4% |
| No Internet | 90 | 7.0% |
| Total | 1,283 | 100.0% |
Balmville Summary
History
The hamlet of Balmville is located in the Town of Newburgh, Orange County, New York. It is situated on the west bank of the Hudson River, just north of the City of Newburgh. The area was first settled in the late 1700s by the Balm family, who were of Dutch descent. The Balm family owned a large tract of land in the area, which was known as Balmville.
The hamlet of Balmville was officially established in 1809, when the Balm family donated land for the construction of a church. The church, which was named St. John's Episcopal Church, still stands today and is the oldest church in the Town of Newburgh.
In the early 1800s, Balmville was a thriving agricultural community. The area was known for its apple orchards, which produced a variety of apples, including the famous Balmville Red. The Balmville Red was a popular variety of apple that was widely exported throughout the United States.
In the late 1800s, Balmville began to experience a period of industrialization. The hamlet was home to several factories, including a paper mill, a brickyard, and a tannery. These factories provided employment for many of the local residents.
In the early 1900s, Balmville experienced a period of growth and prosperity. The hamlet was home to several stores, a post office, a bank, and a hotel. The hamlet also had its own fire department and a volunteer ambulance corps.
Geography
Balmville is located in the Town of Newburgh, Orange County, New York. It is situated on the west bank of the Hudson River, just north of the City of Newburgh. The hamlet is bordered by the hamlets of Newburgh, Vails Gate, and Balmville.
The terrain of Balmville is mostly flat, with some rolling hills. The area is mostly wooded, with some open fields. The hamlet is home to several parks, including Balmville Park, which is located on the banks of the Hudson River.
Economy
The economy of Balmville is largely based on tourism and retail. The hamlet is home to several restaurants, shops, and other businesses. The hamlet is also home to several historic sites, including St. John's Episcopal Church and the Balmville Tree.
The hamlet is also home to several industrial businesses, including a paper mill, a brickyard, and a tannery. These businesses provide employment for many of the local residents.
Demographics
As of the 2010 census, the population of Balmville was 2,845. The population is mostly white (90.2%), with a small percentage of African Americans (3.2%) and Hispanics (2.7%). The median household income is $60,938, and the median age is 43.
The hamlet is home to several churches, including St. John's Episcopal Church, which is the oldest church in the Town of Newburgh. The hamlet is also home to several schools, including Balmville Elementary School and Balmville Middle School.
Common Questions
What is Per Capita Income in Balmville?
Per Capita income in Balmville is $42,739.
What is the Median Family Income in Balmville?
Median Family Income in Balmville is $120,833.
What is the Median Household income in Balmville?
Median Household Income in Balmville is $98,646.
What is Income or Wage Gap in Balmville?
Income or Wage Gap in Balmville is 26.8%.
Women in Balmville earn 73.2 cents for every dollar earned by a man.
What is Inequality or Gini Index in Balmville?
Inequality or Gini Index in Balmville is 0.41.
What is the Total Population of Balmville?
Total Population of Balmville is 3,781.
What is the Total Male Population of Balmville?
Total Male Population of Balmville is 1,958.
What is the Total Female Population of Balmville?
Total Female Population of Balmville is 1,823.
What is the Ratio of Males per 100 Females in Balmville?
There are 107.41 Males per 100 Females in Balmville.
What is the Ratio of Females per 100 Males in Balmville?
There are 93.11 Females per 100 Males in Balmville.
What is the Median Population Age in Balmville?
Median Population Age in Balmville is 47.3 Years.
What is the Average Family Size in Balmville
Average Family Size in Balmville is 3.3 People.
What is the Average Household Size in Balmville
Average Household Size in Balmville is 2.9 People.
How Large is the Labor Force in Balmville?
There are 1,932 People in the Labor Forcein in Balmville.
What is the Percentage of People in the Labor Force in Balmville?
61.3% of People are in the Labor Force in Balmville.
What is the Unemployment Rate in Balmville?
Unemployment Rate in Balmville is 5.6%.