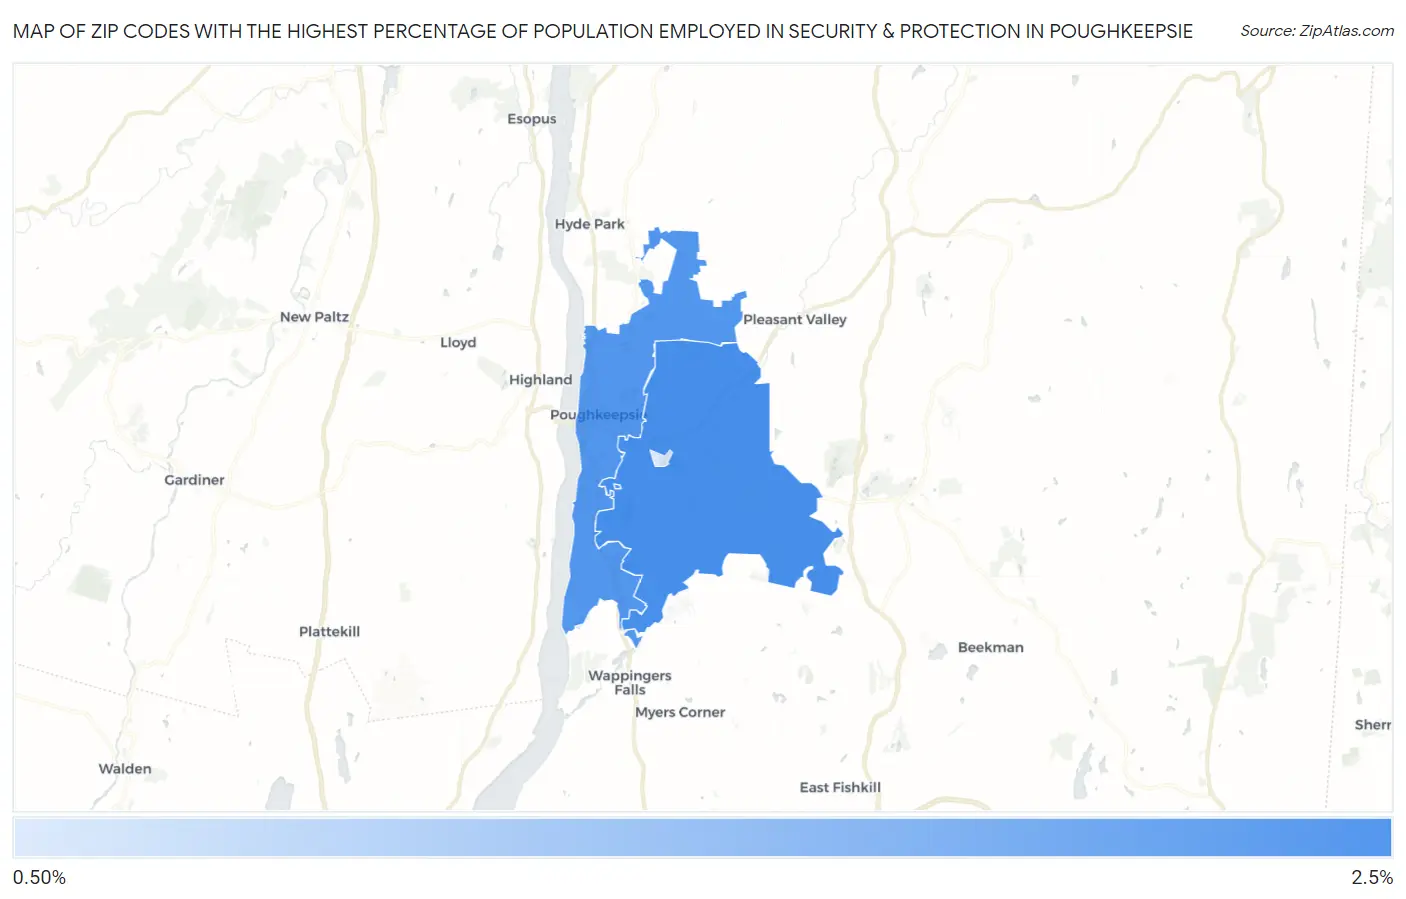
Zip Codes with the Highest Percentage of Population Employed in Security & Protection in Poughkeepsie, NY
RELATED REPORTS & OPTIONS
Security & Protection
Poughkeepsie
Compare Zip Codes
Map of Zip Codes with the Highest Percentage of Population Employed in Security & Protection in Poughkeepsie
0.64%
2.3%
Zip Codes with the Highest Percentage of Population Employed in Security & Protection in Poughkeepsie, NY
| Zip Code | % Employed | vs State | vs National | |
| 1. | 12603 | 2.3% | 2.9%(-0.655)#880 | 2.1%(+0.108)#10,905 |
| 2. | 12601 | 2.1% | 2.9%(-0.774)#923 | 2.1%(-0.011)#11,645 |
| 3. | 12604 | 0.64% | 2.9%(-2.28)#1,331 | 2.1%(-1.51)#22,467 |
1
Common Questions
What are the Top Zip Codes with the Highest Percentage of Population Employed in Security & Protection in Poughkeepsie, NY?
Top Zip Codes with the Highest Percentage of Population Employed in Security & Protection in Poughkeepsie, NY are:
What zip code has the Highest Percentage of Population Employed in Security & Protection in Poughkeepsie, NY?
12603 has the Highest Percentage of Population Employed in Security & Protection in Poughkeepsie, NY with 2.3%.
What is the Percentage of Population Employed in Security & Protection in Poughkeepsie, NY?
Percentage of Population Employed in Security & Protection in Poughkeepsie is 2.8%.
What is the Percentage of Population Employed in Security & Protection in New York?
Percentage of Population Employed in Security & Protection in New York is 2.9%.
What is the Percentage of Population Employed in Security & Protection in the United States?
Percentage of Population Employed in Security & Protection in the United States is 2.1%.