Ripley, NY Map & Demographics
Ripley Map
Ripley Overview
$23,929
PER CAPITA INCOME
$54,000
AVG FAMILY INCOME
$48,958
AVG HOUSEHOLD INCOME
51.3%
WAGE / INCOME GAP [ % ]
48.7¢/ $1
WAGE / INCOME GAP [ $ ]
$12,819
FAMILY INCOME DEFICIT
0.38
INEQUALITY / GINI INDEX
964
TOTAL POPULATION
458
MALE POPULATION
506
FEMALE POPULATION
90.51
MALES / 100 FEMALES
110.48
FEMALES / 100 MALES
36.1
MEDIAN AGE
3.1
AVG FAMILY SIZE
2.8
AVG HOUSEHOLD SIZE
430
LABOR FORCE [ PEOPLE ]
58.8%
PERCENT IN LABOR FORCE
2.1%
UNEMPLOYMENT RATE
Ripley Zip Codes
Ripley Area Codes
Income in Ripley
Income Overview in Ripley
Per Capita Income in Ripley is $23,929, while median incomes of families and households are $54,000 and $48,958 respectively.
| Characteristic | Number | Measure |
| Per Capita Income | 964 | $23,929 |
| Median Family Income | 274 | $54,000 |
| Mean Family Income | 274 | $68,910 |
| Median Household Income | 349 | $48,958 |
| Mean Household Income | 349 | $63,290 |
| Income Deficit | 274 | $12,819 |
| Wage / Income Gap (%) | 964 | 51.25% |
| Wage / Income Gap ($) | 964 | 48.75¢ per $1 |
| Gini / Inequality Index | 964 | 0.38 |
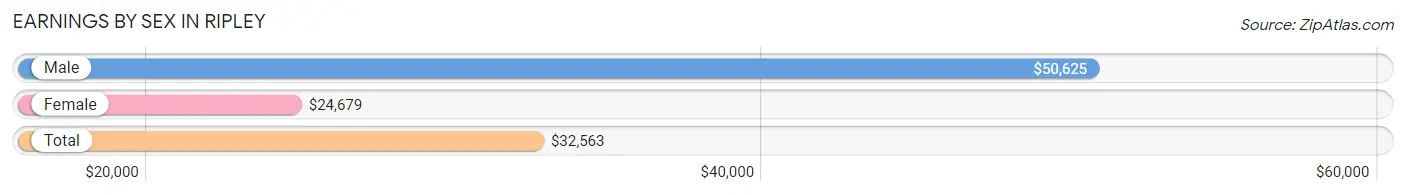
Earnings by Sex in Ripley
Average Earnings in Ripley are $32,563, $50,625 for men and $24,679 for women, a difference of 51.2%.
| Sex | Number | Average Earnings |
| Male | 200 (45.2%) | $50,625 |
| Female | 243 (54.8%) | $24,679 |
| Total | 443 (100.0%) | $32,563 |
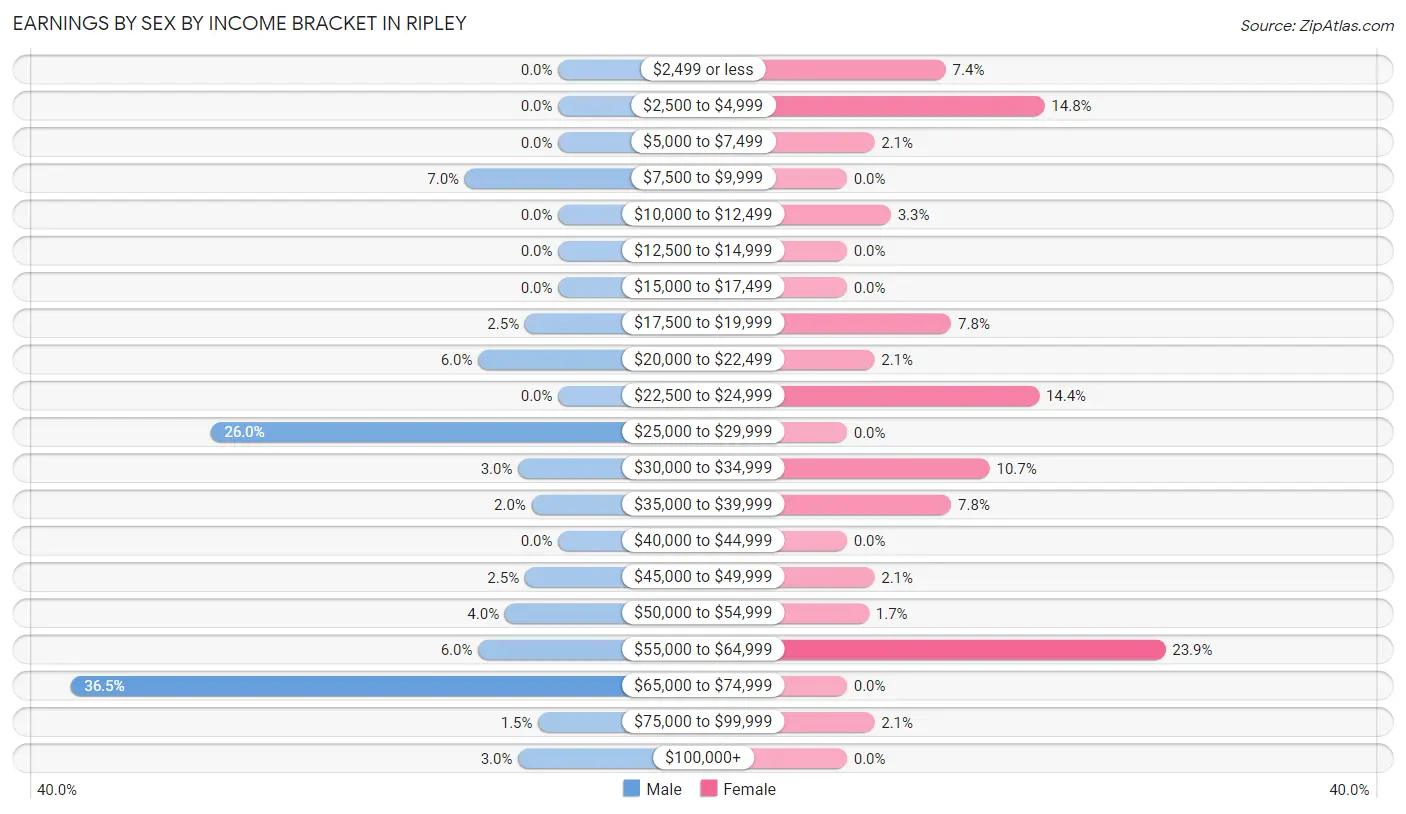
Earnings by Sex by Income Bracket in Ripley
The most common earnings brackets in Ripley are $65,000 to $74,999 for men (73 | 36.5%) and $55,000 to $64,999 for women (58 | 23.9%).
| Income | Male | Female |
| $2,499 or less | 0 (0.0%) | 18 (7.4%) |
| $2,500 to $4,999 | 0 (0.0%) | 36 (14.8%) |
| $5,000 to $7,499 | 0 (0.0%) | 5 (2.1%) |
| $7,500 to $9,999 | 14 (7.0%) | 0 (0.0%) |
| $10,000 to $12,499 | 0 (0.0%) | 8 (3.3%) |
| $12,500 to $14,999 | 0 (0.0%) | 0 (0.0%) |
| $15,000 to $17,499 | 0 (0.0%) | 0 (0.0%) |
| $17,500 to $19,999 | 5 (2.5%) | 19 (7.8%) |
| $20,000 to $22,499 | 12 (6.0%) | 5 (2.1%) |
| $22,500 to $24,999 | 0 (0.0%) | 35 (14.4%) |
| $25,000 to $29,999 | 52 (26.0%) | 0 (0.0%) |
| $30,000 to $34,999 | 6 (3.0%) | 26 (10.7%) |
| $35,000 to $39,999 | 4 (2.0%) | 19 (7.8%) |
| $40,000 to $44,999 | 0 (0.0%) | 0 (0.0%) |
| $45,000 to $49,999 | 5 (2.5%) | 5 (2.1%) |
| $50,000 to $54,999 | 8 (4.0%) | 4 (1.7%) |
| $55,000 to $64,999 | 12 (6.0%) | 58 (23.9%) |
| $65,000 to $74,999 | 73 (36.5%) | 0 (0.0%) |
| $75,000 to $99,999 | 3 (1.5%) | 5 (2.1%) |
| $100,000+ | 6 (3.0%) | 0 (0.0%) |
| Total | 200 (100.0%) | 243 (100.0%) |
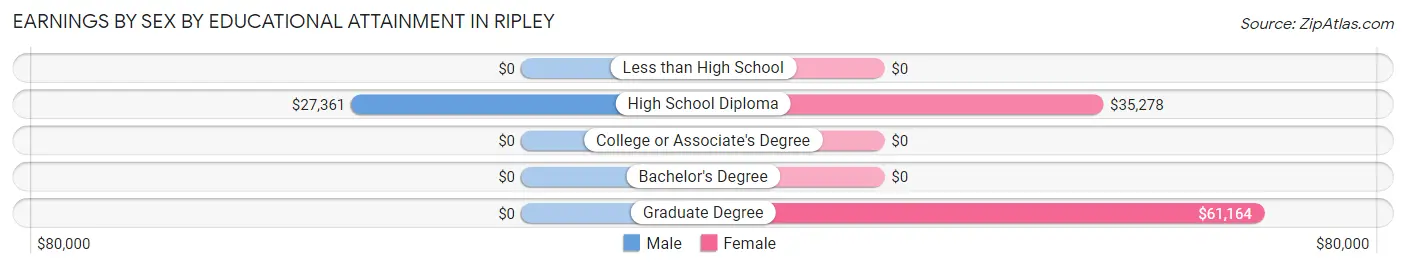
Earnings by Sex by Educational Attainment in Ripley
Average earnings in Ripley are $45,500 for men and $35,694 for women, a difference of 21.5%. Men with an educational attainment of high school diploma enjoy the highest average annual earnings of $27,361, while those with high school diploma education earn the least with $27,361. Women with an educational attainment of graduate degree earn the most with the average annual earnings of $61,164, while those with high school diploma education have the smallest earnings of $35,278.
| Educational Attainment | Male Income | Female Income |
| Less than High School | - | - |
| High School Diploma | $27,361 | $35,278 |
| College or Associate's Degree | - | - |
| Bachelor's Degree | - | - |
| Graduate Degree | - | - |
| Total | $45,500 | $35,694 |
Family Income in Ripley
Family Income Brackets in Ripley
According to the Ripley family income data, there are 87 families falling into the $100,000 to $149,999 income range, which is the most common income bracket and makes up 31.8% of all families.
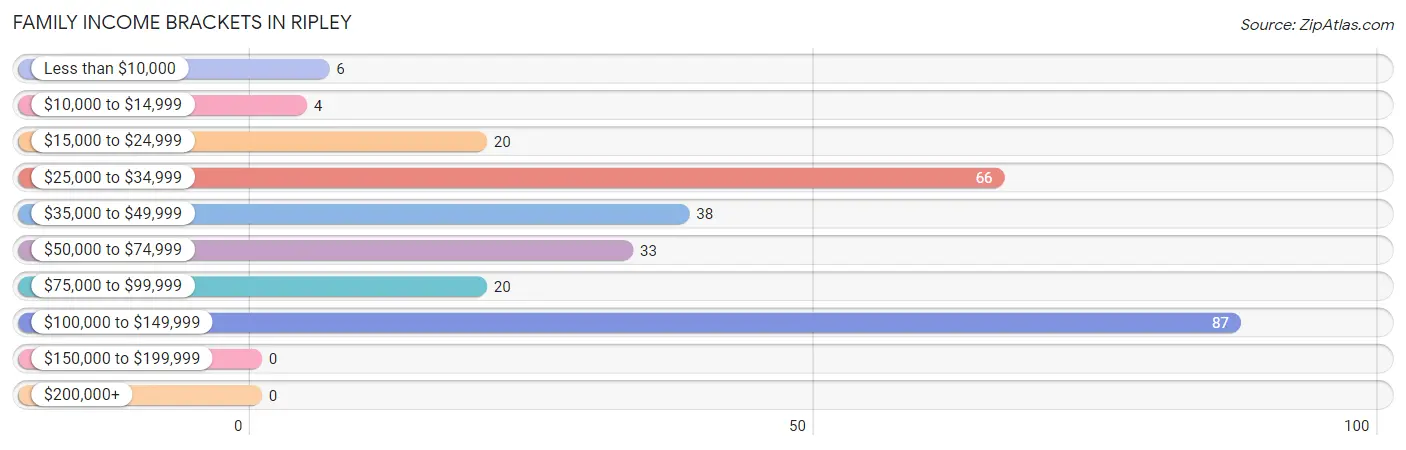
| Income Bracket | # Families | % Families |
| Less than $10,000 | 6 | 2.2% |
| $10,000 to $14,999 | 4 | 1.5% |
| $15,000 to $24,999 | 20 | 7.3% |
| $25,000 to $34,999 | 66 | 24.1% |
| $35,000 to $49,999 | 38 | 13.9% |
| $50,000 to $74,999 | 33 | 12.0% |
| $75,000 to $99,999 | 20 | 7.3% |
| $100,000 to $149,999 | 87 | 31.8% |
| $150,000 to $199,999 | 0 | 0.0% |
| $200,000+ | 0 | 0.0% |
Family Income by Famaliy Size in Ripley
2-person families (142 | 51.8%) account for the highest median family income in Ripley with $38,750 per family, while 2-person families (142 | 51.8%) have the highest median income of $19,375 per family member.
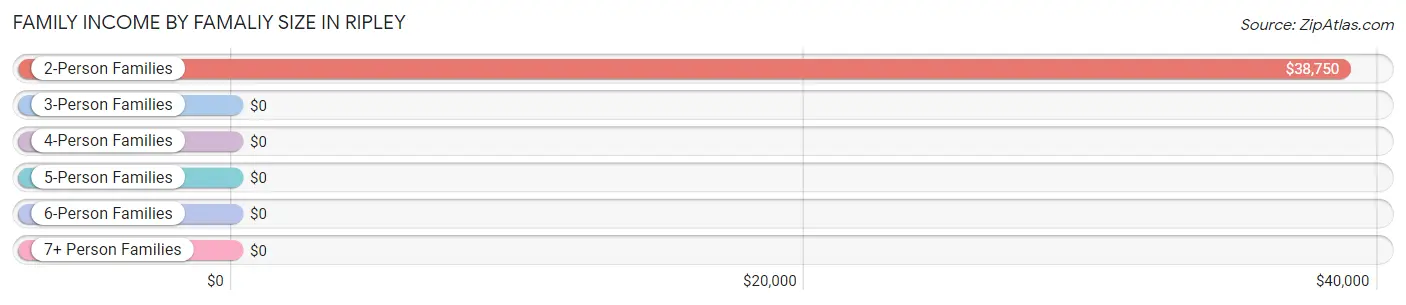
| Income Bracket | # Families | Median Income |
| 2-Person Families | 142 (51.8%) | $38,750 |
| 3-Person Families | 22 (8.0%) | $0 |
| 4-Person Families | 98 (35.8%) | $0 |
| 5-Person Families | 9 (3.3%) | $0 |
| 6-Person Families | 3 (1.1%) | $0 |
| 7+ Person Families | 0 (0.0%) | $0 |
| Total | 274 (100.0%) | $54,000 |
Family Income by Number of Earners in Ripley
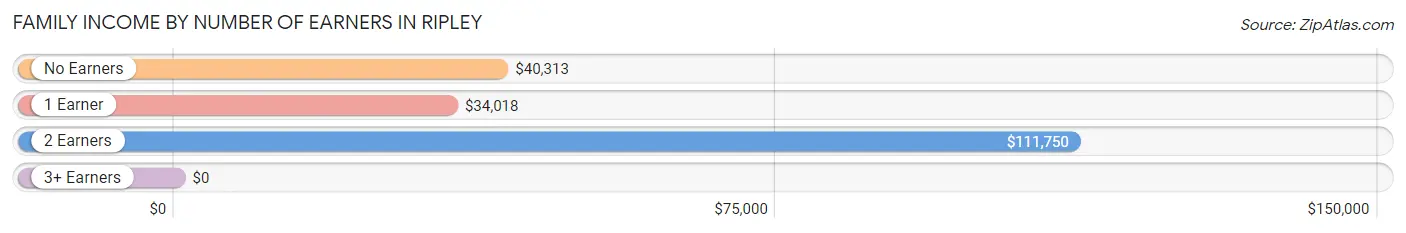
| Number of Earners | # Families | Median Income |
| No Earners | 60 (21.9%) | $40,313 |
| 1 Earner | 97 (35.4%) | $34,018 |
| 2 Earners | 109 (39.8%) | $111,750 |
| 3+ Earners | 8 (2.9%) | $0 |
| Total | 274 (100.0%) | $54,000 |
Household Income in Ripley
Household Income Brackets in Ripley
With 83 households falling in the category, the $100,000 to $149,999 income range is the most frequent in Ripley, accounting for 23.8% of all households.
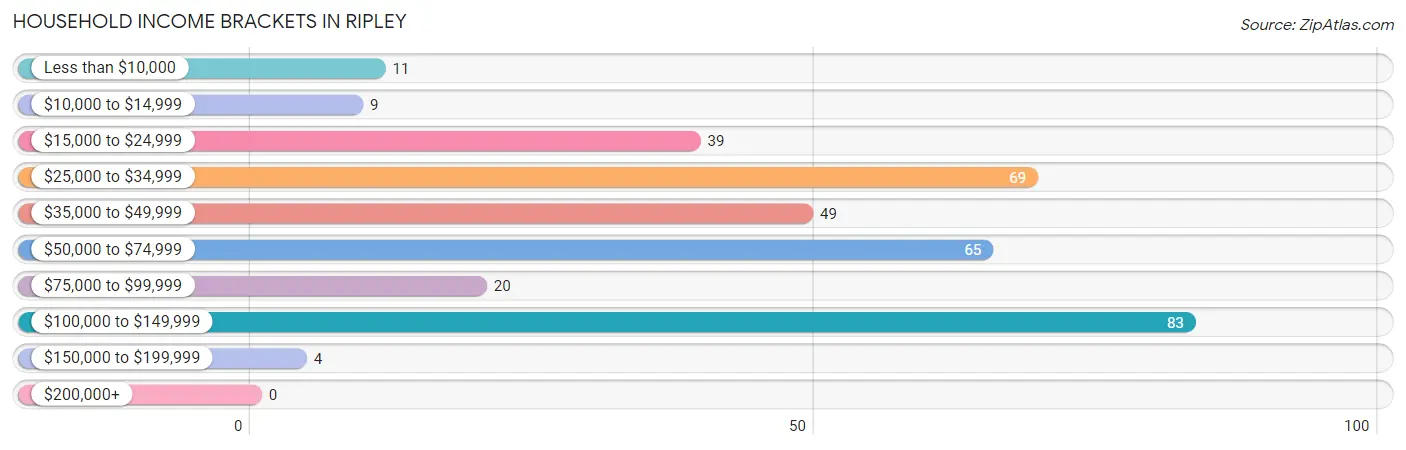
| Income Bracket | # Households | % Households |
| Less than $10,000 | 11 | 3.2% |
| $10,000 to $14,999 | 9 | 2.6% |
| $15,000 to $24,999 | 39 | 11.2% |
| $25,000 to $34,999 | 69 | 19.8% |
| $35,000 to $49,999 | 49 | 14.0% |
| $50,000 to $74,999 | 65 | 18.6% |
| $75,000 to $99,999 | 20 | 5.7% |
| $100,000 to $149,999 | 83 | 23.8% |
| $150,000 to $199,999 | 4 | 1.1% |
| $200,000+ | 0 | 0.0% |
Household Income by Householder Age in Ripley
The median household income in Ripley is $48,958, with the highest median household income of $47,917 found in the 65+ years age bracket for the primary householder. A total of 110 households (31.5%) fall into this category. Meanwhile, the 15 to 24 years age bracket for the primary householder has the lowest median household income of $0, with 6 households (1.7%) in this group.
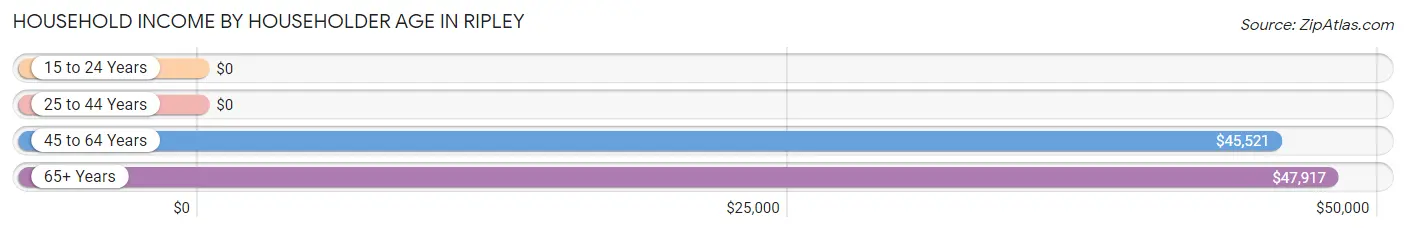
| Income Bracket | # Households | Median Income |
| 15 to 24 Years | 6 (1.7%) | $0 |
| 25 to 44 Years | 158 (45.3%) | $0 |
| 45 to 64 Years | 75 (21.5%) | $45,521 |
| 65+ Years | 110 (31.5%) | $47,917 |
| Total | 349 (100.0%) | $48,958 |
Poverty in Ripley
Income Below Poverty by Sex and Age in Ripley
With 2.4% poverty level for males and 11.1% for females among the residents of Ripley, 15 year old males and 16 and 17 year old females are the most vulnerable to poverty, with 6 males (100.0%) and 19 females (55.9%) in their respective age groups living below the poverty level.
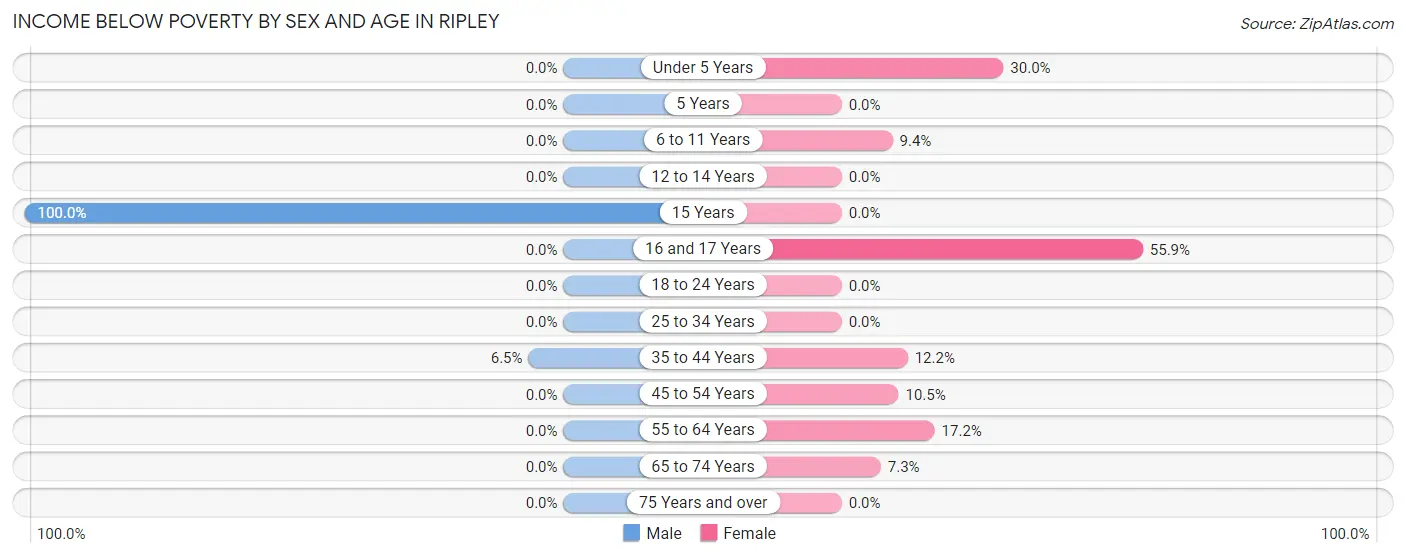
| Age Bracket | Male | Female |
| Under 5 Years | 0 (0.0%) | 6 (30.0%) |
| 5 Years | 0 (0.0%) | 0 (0.0%) |
| 6 to 11 Years | 0 (0.0%) | 5 (9.4%) |
| 12 to 14 Years | 0 (0.0%) | 0 (0.0%) |
| 15 Years | 6 (100.0%) | 0 (0.0%) |
| 16 and 17 Years | 0 (0.0%) | 19 (55.9%) |
| 18 to 24 Years | 0 (0.0%) | 0 (0.0%) |
| 25 to 34 Years | 0 (0.0%) | 0 (0.0%) |
| 35 to 44 Years | 5 (6.5%) | 12 (12.2%) |
| 45 to 54 Years | 0 (0.0%) | 4 (10.5%) |
| 55 to 64 Years | 0 (0.0%) | 5 (17.2%) |
| 65 to 74 Years | 0 (0.0%) | 5 (7.2%) |
| 75 Years and over | 0 (0.0%) | 0 (0.0%) |
| Total | 11 (2.4%) | 56 (11.1%) |
Income Above Poverty by Sex and Age in Ripley
According to the poverty statistics in Ripley, males aged under 5 years and females aged 12 to 14 years are the age groups that are most secure financially, with 100.0% of males and 100.0% of females in these age groups living above the poverty line.
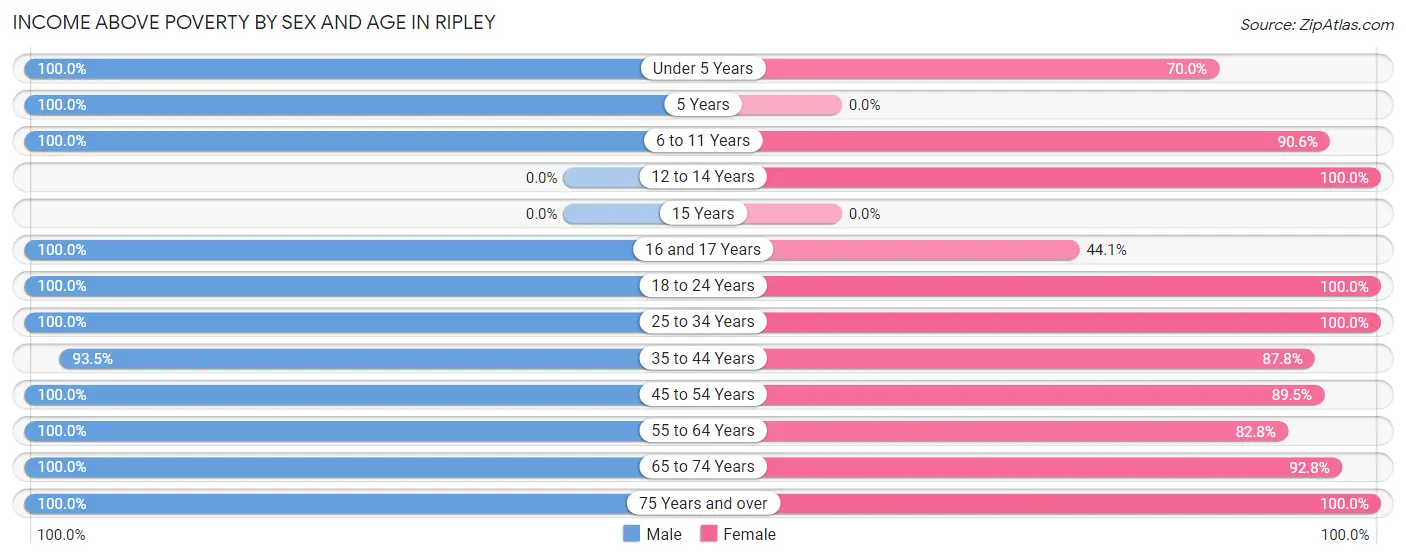
| Age Bracket | Male | Female |
| Under 5 Years | 54 (100.0%) | 14 (70.0%) |
| 5 Years | 65 (100.0%) | 0 (0.0%) |
| 6 to 11 Years | 20 (100.0%) | 48 (90.6%) |
| 12 to 14 Years | 0 (0.0%) | 15 (100.0%) |
| 15 Years | 0 (0.0%) | 0 (0.0%) |
| 16 and 17 Years | 9 (100.0%) | 15 (44.1%) |
| 18 to 24 Years | 20 (100.0%) | 66 (100.0%) |
| 25 to 34 Years | 62 (100.0%) | 53 (100.0%) |
| 35 to 44 Years | 72 (93.5%) | 86 (87.8%) |
| 45 to 54 Years | 26 (100.0%) | 34 (89.5%) |
| 55 to 64 Years | 53 (100.0%) | 24 (82.8%) |
| 65 to 74 Years | 49 (100.0%) | 64 (92.7%) |
| 75 Years and over | 17 (100.0%) | 31 (100.0%) |
| Total | 447 (97.6%) | 450 (88.9%) |
Income Below Poverty Among Married-Couple Families in Ripley
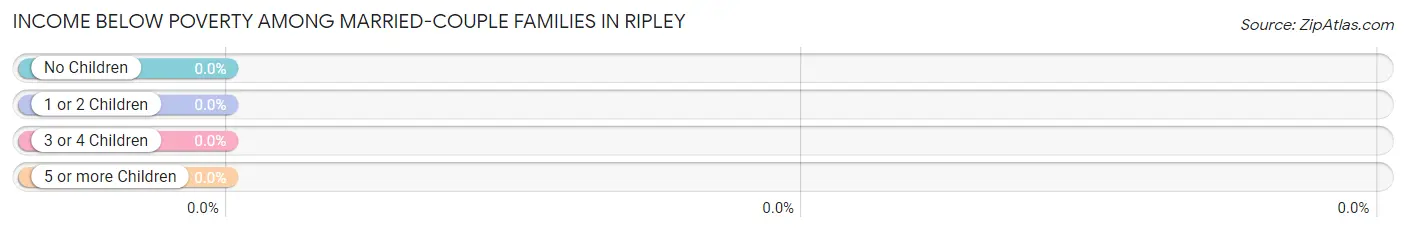
| Children | Above Poverty | Below Poverty |
| No Children | 82 (100.0%) | 0 (0.0%) |
| 1 or 2 Children | 95 (100.0%) | 0 (0.0%) |
| 3 or 4 Children | 4 (100.0%) | 0 (0.0%) |
| 5 or more Children | 0 (0.0%) | 0 (0.0%) |
| Total | 181 (100.0%) | 0 (0.0%) |
Income Below Poverty Among Single-Parent Households in Ripley
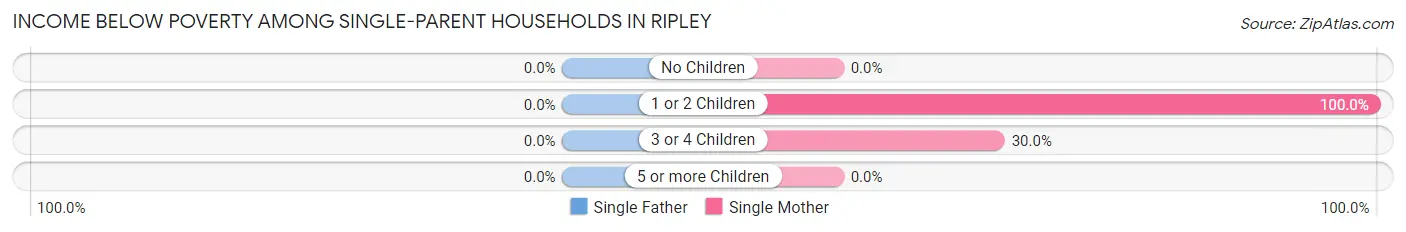
| Children | Single Father | Single Mother |
| No Children | 0 (0.0%) | 0 (0.0%) |
| 1 or 2 Children | 0 (0.0%) | 10 (100.0%) |
| 3 or 4 Children | 0 (0.0%) | 6 (30.0%) |
| 5 or more Children | 0 (0.0%) | 0 (0.0%) |
| Total | 0 (0.0%) | 16 (32.0%) |
Income Below Poverty Among Married-Couple vs Single-Parent Households in Ripley
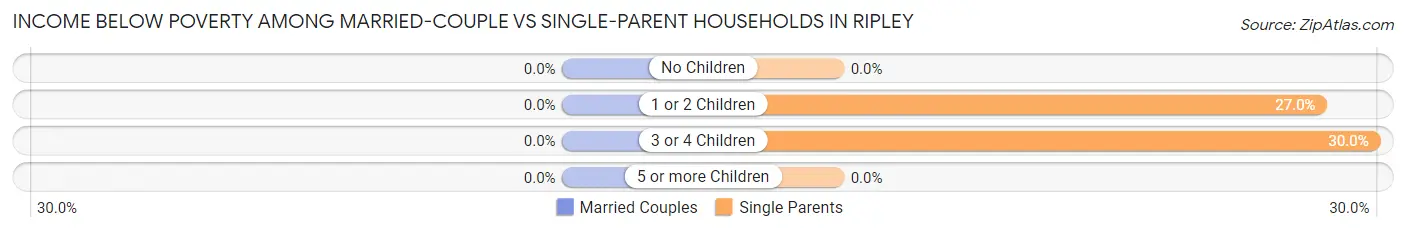
| Children | Married-Couple Families | Single-Parent Households |
| No Children | 0 (0.0%) | 0 (0.0%) |
| 1 or 2 Children | 0 (0.0%) | 10 (27.0%) |
| 3 or 4 Children | 0 (0.0%) | 6 (30.0%) |
| 5 or more Children | 0 (0.0%) | 0 (0.0%) |
| Total | 0 (0.0%) | 16 (17.2%) |
Race in Ripley
The most populous races in Ripley are White / Caucasian (918 | 95.2%), Hispanic or Latino (26 | 2.7%), and Some other Race (22 | 2.3%).
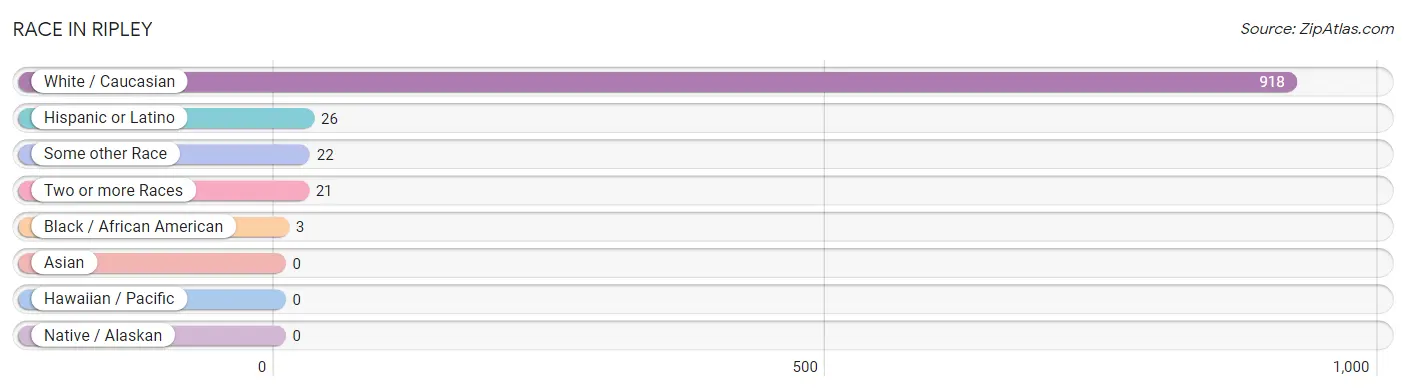
| Race | # Population | % Population |
| Asian | 0 | 0.0% |
| Black / African American | 3 | 0.3% |
| Hawaiian / Pacific | 0 | 0.0% |
| Hispanic or Latino | 26 | 2.7% |
| Native / Alaskan | 0 | 0.0% |
| White / Caucasian | 918 | 95.2% |
| Two or more Races | 21 | 2.2% |
| Some other Race | 22 | 2.3% |
| Total | 964 | 100.0% |
Ancestry in Ripley
The most populous ancestries reported in Ripley are English (293 | 30.4%), German (151 | 15.7%), Irish (97 | 10.1%), Italian (39 | 4.1%), and American (31 | 3.2%), together accounting for 63.4% of all Ripley residents.
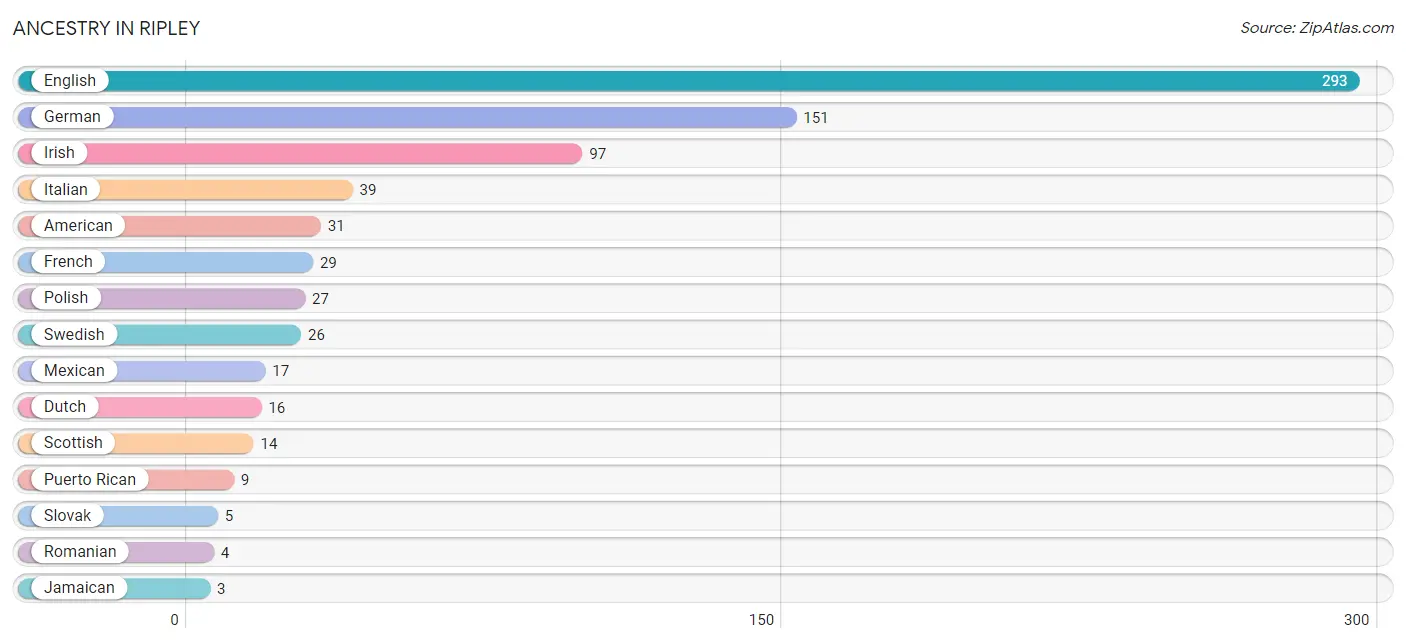
| Ancestry | # Population | % Population |
| American | 31 | 3.2% |
| Dutch | 16 | 1.7% |
| Eastern European | 2 | 0.2% |
| English | 293 | 30.4% |
| French | 29 | 3.0% |
| German | 151 | 15.7% |
| Irish | 97 | 10.1% |
| Italian | 39 | 4.1% |
| Jamaican | 3 | 0.3% |
| Mexican | 17 | 1.8% |
| Polish | 27 | 2.8% |
| Puerto Rican | 9 | 0.9% |
| Romanian | 4 | 0.4% |
| Scottish | 14 | 1.5% |
| Slovak | 5 | 0.5% |
| Swedish | 26 | 2.7% | View All 16 Rows |
Immigrants in Ripley
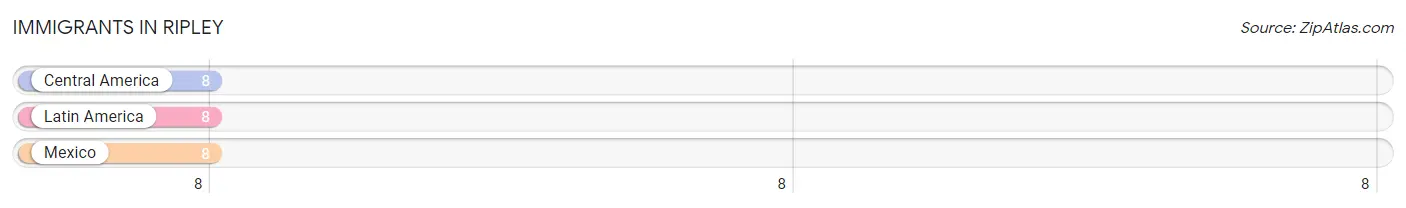
The most numerous immigrant groups reported in Ripley came from Central America (8 | 0.8%), Latin America (8 | 0.8%), and Mexico (8 | 0.8%), together accounting for 2.5% of all Ripley residents.
| Immigration Origin | # Population | % Population |
| Central America | 8 | 0.8% |
| Latin America | 8 | 0.8% |
| Mexico | 8 | 0.8% | View All 3 Rows |
Sex and Age in Ripley
Sex and Age in Ripley
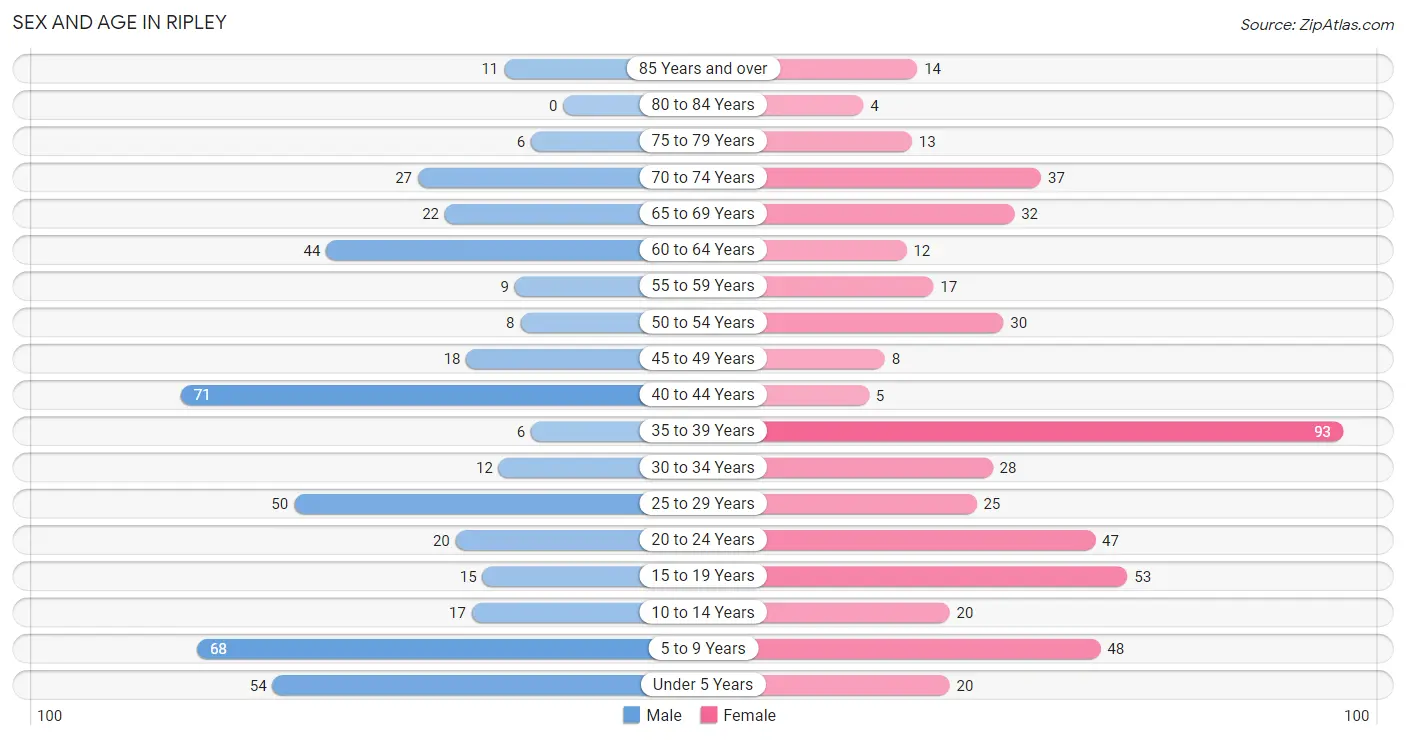
The most populous age groups in Ripley are 40 to 44 Years (71 | 15.5%) for men and 35 to 39 Years (93 | 18.4%) for women.
| Age Bracket | Male | Female |
| Under 5 Years | 54 (11.8%) | 20 (4.0%) |
| 5 to 9 Years | 68 (14.8%) | 48 (9.5%) |
| 10 to 14 Years | 17 (3.7%) | 20 (4.0%) |
| 15 to 19 Years | 15 (3.3%) | 53 (10.5%) |
| 20 to 24 Years | 20 (4.4%) | 47 (9.3%) |
| 25 to 29 Years | 50 (10.9%) | 25 (4.9%) |
| 30 to 34 Years | 12 (2.6%) | 28 (5.5%) |
| 35 to 39 Years | 6 (1.3%) | 93 (18.4%) |
| 40 to 44 Years | 71 (15.5%) | 5 (1.0%) |
| 45 to 49 Years | 18 (3.9%) | 8 (1.6%) |
| 50 to 54 Years | 8 (1.8%) | 30 (5.9%) |
| 55 to 59 Years | 9 (2.0%) | 17 (3.4%) |
| 60 to 64 Years | 44 (9.6%) | 12 (2.4%) |
| 65 to 69 Years | 22 (4.8%) | 32 (6.3%) |
| 70 to 74 Years | 27 (5.9%) | 37 (7.3%) |
| 75 to 79 Years | 6 (1.3%) | 13 (2.6%) |
| 80 to 84 Years | 0 (0.0%) | 4 (0.8%) |
| 85 Years and over | 11 (2.4%) | 14 (2.8%) |
| Total | 458 (100.0%) | 506 (100.0%) |
Families and Households in Ripley
Median Family Size in Ripley
The median family size in Ripley is 3.06 persons per family, with married-couple families (181 | 66.1%) accounting for the largest median family size of 3.23 persons per family. On the other hand, single male/father families (43 | 15.7%) represent the smallest median family size with 2.37 persons per family.
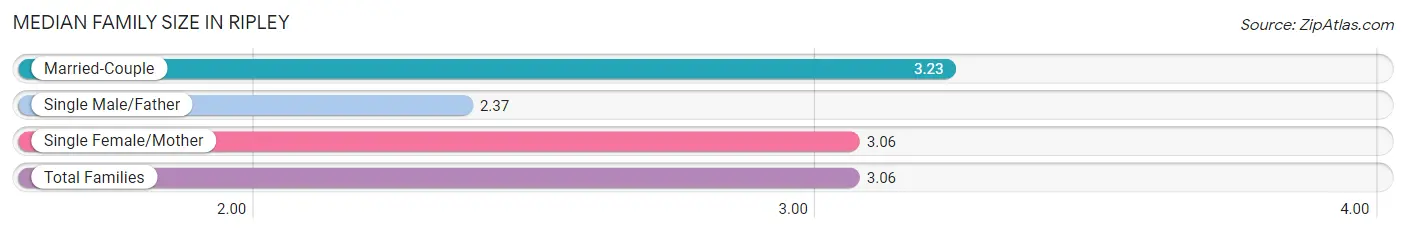
| Family Type | # Families | Family Size |
| Married-Couple | 181 (66.1%) | 3.23 |
| Single Male/Father | 43 (15.7%) | 2.37 |
| Single Female/Mother | 50 (18.2%) | 3.06 |
| Total Families | 274 (100.0%) | 3.06 |
Median Household Size in Ripley
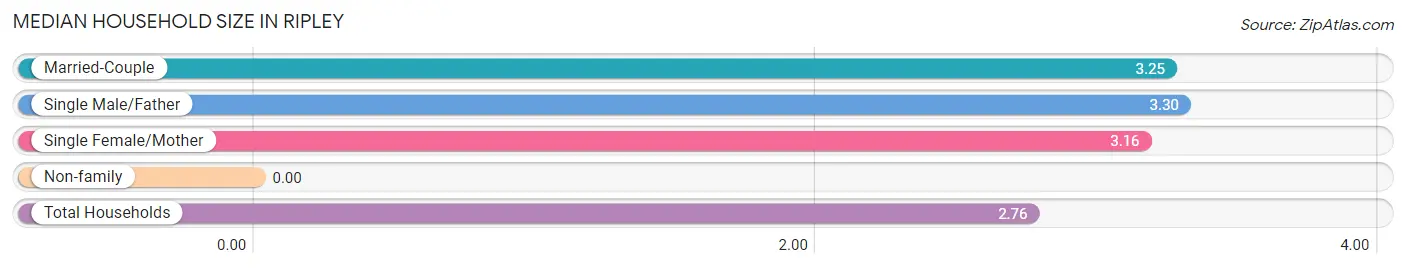
| Household Type | # Households | Household Size |
| Married-Couple | 181 (51.9%) | 3.25 |
| Single Male/Father | 43 (12.3%) | 3.30 |
| Single Female/Mother | 50 (14.3%) | 3.16 |
| Non-family | 75 (21.5%) | - |
| Total Households | 349 (100.0%) | 2.76 |
Household Size by Marriage Status in Ripley
Out of a total of 349 households in Ripley, 274 (78.5%) are family households, while 75 (21.5%) are nonfamily households. The most numerous type of family households are 2-person households, comprising 111, and the most common type of nonfamily households are 1-person households, comprising 75.
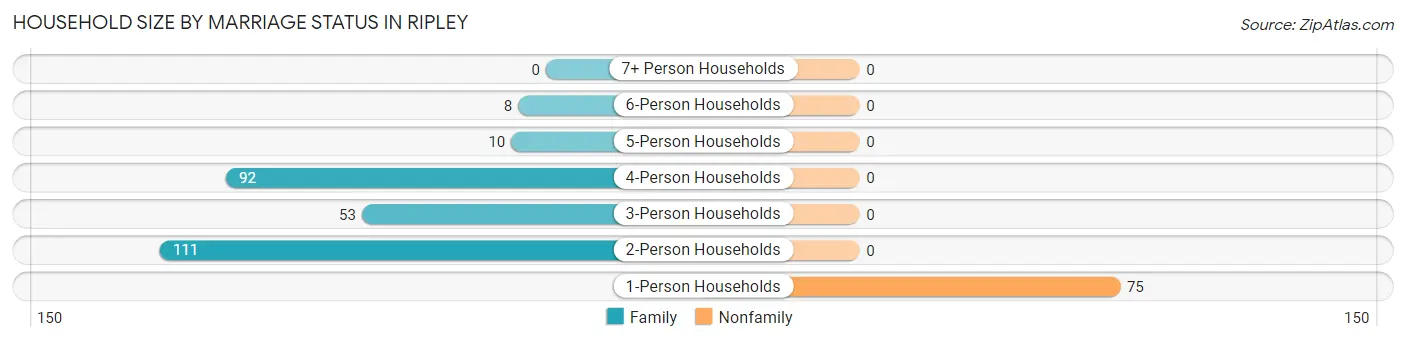
| Household Size | Family Households | Nonfamily Households |
| 1-Person Households | - | 75 (21.5%) |
| 2-Person Households | 111 (31.8%) | 0 (0.0%) |
| 3-Person Households | 53 (15.2%) | 0 (0.0%) |
| 4-Person Households | 92 (26.4%) | 0 (0.0%) |
| 5-Person Households | 10 (2.9%) | 0 (0.0%) |
| 6-Person Households | 8 (2.3%) | 0 (0.0%) |
| 7+ Person Households | 0 (0.0%) | 0 (0.0%) |
| Total | 274 (78.5%) | 75 (21.5%) |
Female Fertility in Ripley
Fertility by Age in Ripley
Average fertility rate in Ripley is 170.0 births per 1,000 women. Women in the age bracket of 20 to 34 years have the highest fertility rate with 400.0 births per 1,000 women. Women in the age bracket of 20 to 34 years acount for 88.9% of all women with births.
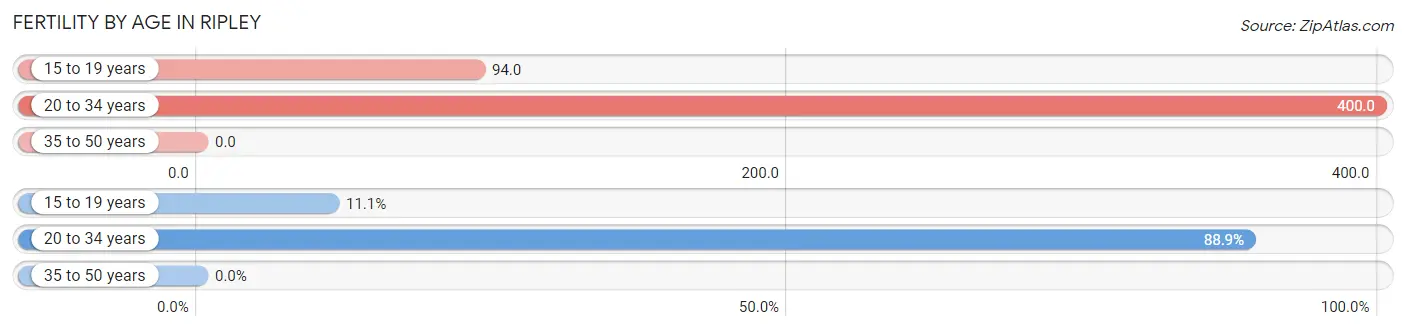
| Age Bracket | Women with Births | Births / 1,000 Women |
| 15 to 19 years | 5 (11.1%) | 94.0 |
| 20 to 34 years | 40 (88.9%) | 400.0 |
| 35 to 50 years | 0 (0.0%) | 0.0 |
| Total | 45 (100.0%) | 170.0 |
Fertility by Age by Marriage Status in Ripley
11.1% of women with births (45) in Ripley are married. The highest percentage of unmarried women with births falls into 15 to 19 years age bracket with 100.0% of them unmarried at the time of birth, while the lowest percentage of unmarried women with births belong to 20 to 34 years age bracket with 87.5% of them unmarried.
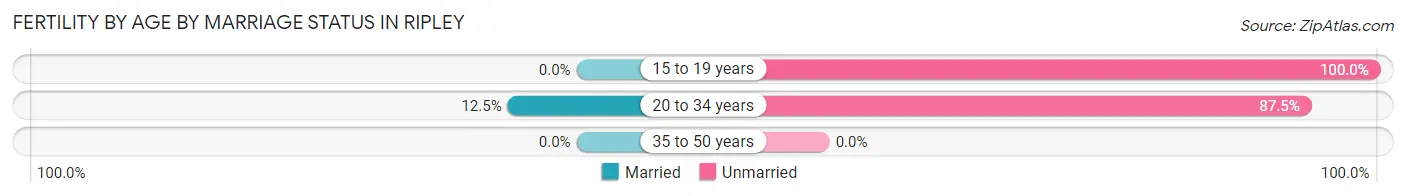
| Age Bracket | Married | Unmarried |
| 15 to 19 years | 0 (0.0%) | 5 (100.0%) |
| 20 to 34 years | 5 (12.5%) | 35 (87.5%) |
| 35 to 50 years | 0 (0.0%) | 0 (0.0%) |
| Total | 5 (11.1%) | 40 (88.9%) |
Fertility by Education in Ripley
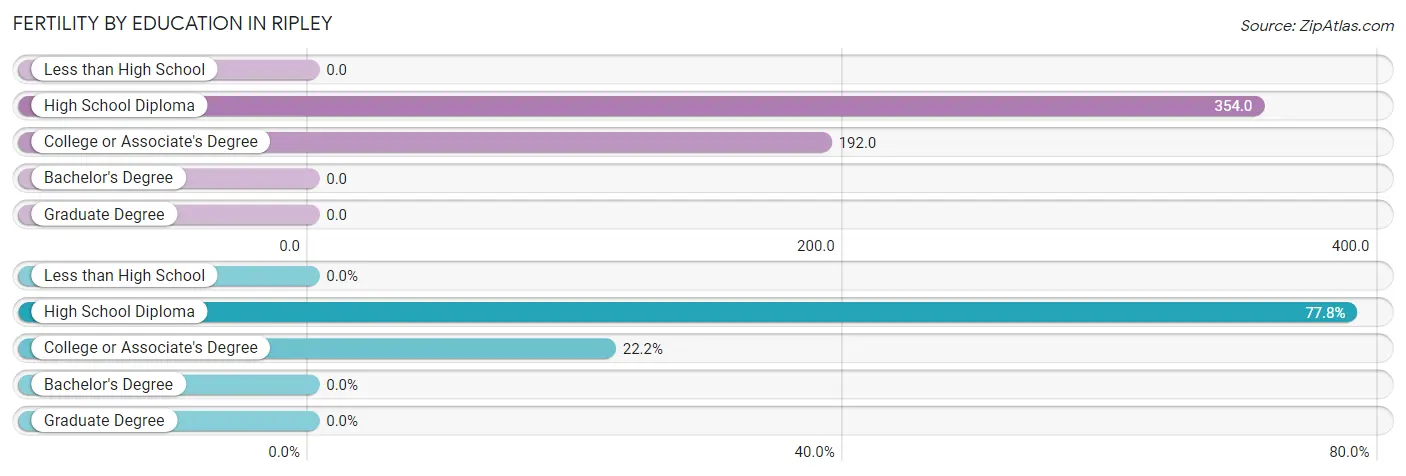
| Educational Attainment | Women with Births | Births / 1,000 Women |
| Less than High School | 0 (0.0%) | 0.0 |
| High School Diploma | 35 (77.8%) | 354.0 |
| College or Associate's Degree | 10 (22.2%) | 192.0 |
| Bachelor's Degree | 0 (0.0%) | 0.0 |
| Graduate Degree | 0 (0.0%) | 0.0 |
| Total | 45 (100.0%) | 170.0 |
Fertility by Education by Marriage Status in Ripley
88.9% of women with births in Ripley are unmarried. Women with the educational attainment of college or associate's degree are most likely to be married with 50.0% of them married at childbirth, while women with the educational attainment of high school diploma are least likely to be married with 100.0% of them unmarried at childbirth.
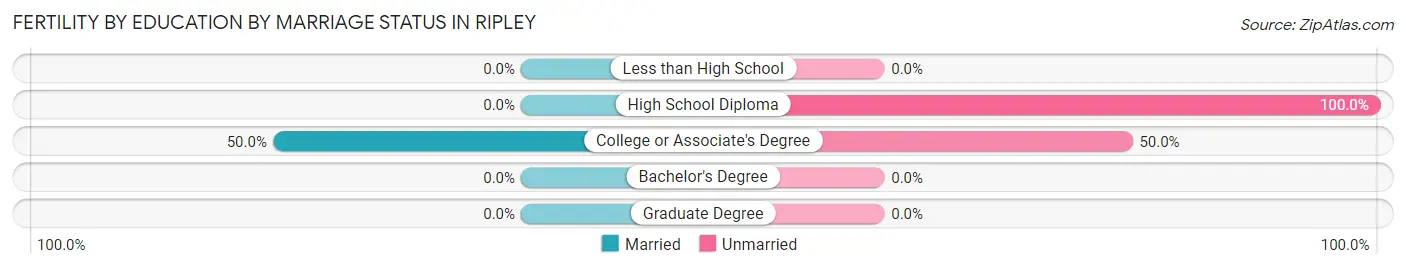
| Educational Attainment | Married | Unmarried |
| Less than High School | 0 (0.0%) | 0 (0.0%) |
| High School Diploma | 0 (0.0%) | 35 (100.0%) |
| College or Associate's Degree | 5 (50.0%) | 5 (50.0%) |
| Bachelor's Degree | 0 (0.0%) | 0 (0.0%) |
| Graduate Degree | 0 (0.0%) | 0 (0.0%) |
| Total | 5 (11.1%) | 40 (88.9%) |
Employment Characteristics in Ripley
Employment by Class of Employer in Ripley
Among the 379 employed individuals in Ripley, private company employees (214 | 56.5%), state government employees (117 | 30.9%), and not-for-profit organizations (22 | 5.8%) make up the most common classes of employment.
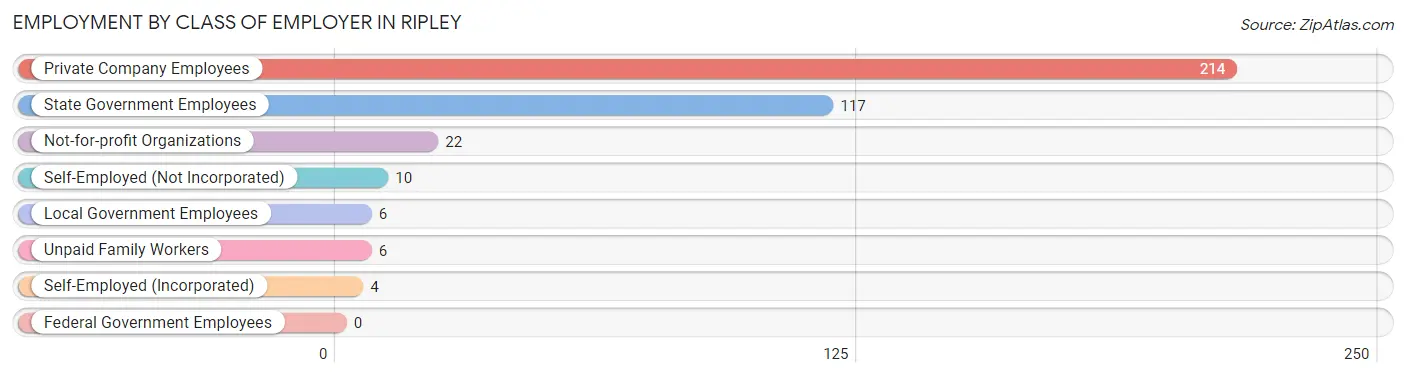
| Employer Class | # Employees | % Employees |
| Private Company Employees | 214 | 56.5% |
| Self-Employed (Incorporated) | 4 | 1.1% |
| Self-Employed (Not Incorporated) | 10 | 2.6% |
| Not-for-profit Organizations | 22 | 5.8% |
| Local Government Employees | 6 | 1.6% |
| State Government Employees | 117 | 30.9% |
| Federal Government Employees | 0 | 0.0% |
| Unpaid Family Workers | 6 | 1.6% |
| Total | 379 | 100.0% |
Employment Status by Age in Ripley
According to the labor force statistics for Ripley, out of the total population over 16 years of age (731), 58.8% or 430 individuals are in the labor force, with 2.1% or 9 of them unemployed. The age group with the highest labor force participation rate is 30 to 34 years, with 92.5% or 37 individuals in the labor force. Within the labor force, the 16 to 19 years age range has the highest percentage of unemployed individuals, with 26.3% or 5 of them being unemployed.
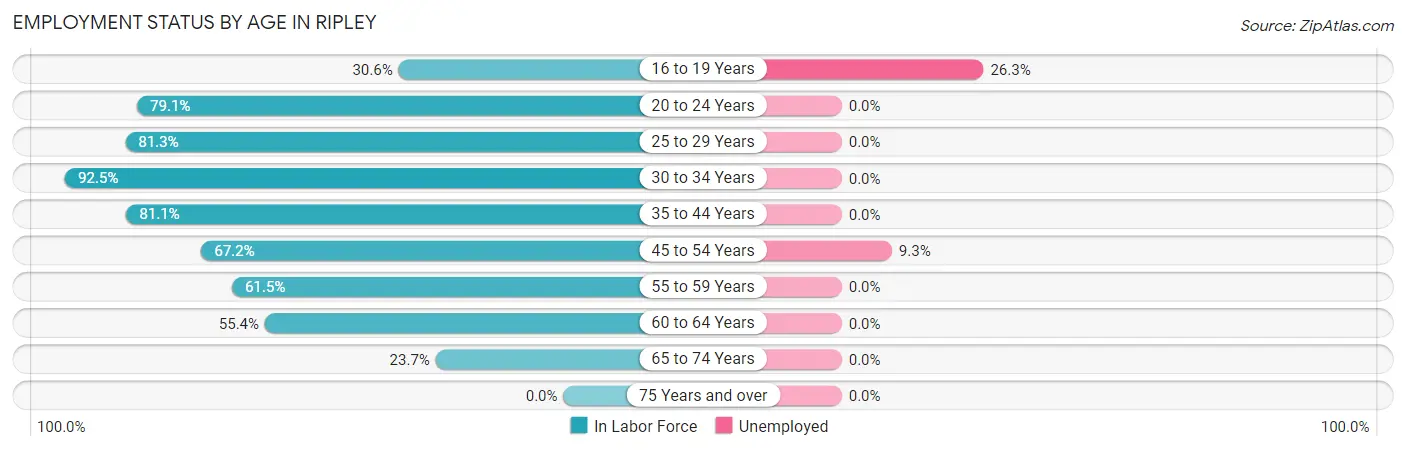
| Age Bracket | In Labor Force | Unemployed |
| 16 to 19 Years | 19 (30.6%) | 5 (26.3%) |
| 20 to 24 Years | 53 (79.1%) | 0 (0.0%) |
| 25 to 29 Years | 61 (81.3%) | 0 (0.0%) |
| 30 to 34 Years | 37 (92.5%) | 0 (0.0%) |
| 35 to 44 Years | 142 (81.1%) | 0 (0.0%) |
| 45 to 54 Years | 43 (67.2%) | 4 (9.3%) |
| 55 to 59 Years | 16 (61.5%) | 0 (0.0%) |
| 60 to 64 Years | 31 (55.4%) | 0 (0.0%) |
| 65 to 74 Years | 28 (23.7%) | 0 (0.0%) |
| 75 Years and over | 0 (0.0%) | 0 (0.0%) |
| Total | 430 (58.8%) | 9 (2.1%) |
Employment Status by Educational Attainment in Ripley
According to labor force statistics for Ripley, 75.7% of individuals (330) out of the total population between 25 and 64 years of age (436) are in the labor force, with 1.2% or 4 of them being unemployed. The group with the highest labor force participation rate are those with the educational attainment of bachelor's degree or higher, with 100.0% or 140 individuals in the labor force. Within the labor force, individuals with high school diploma education have the highest percentage of unemployment, with 3.5% or 4 of them being unemployed.
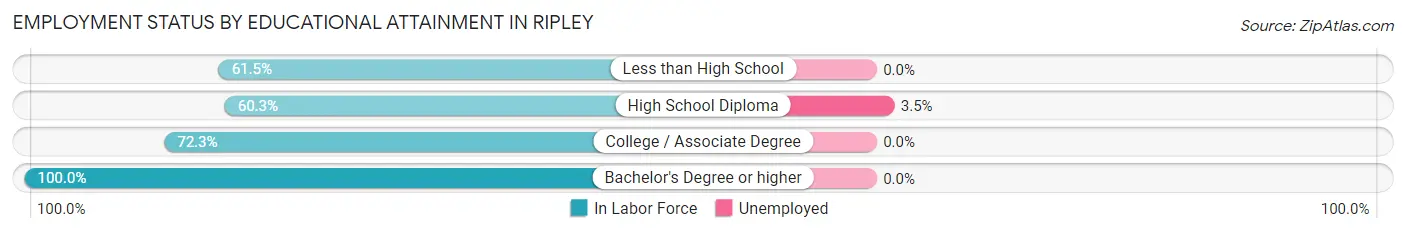
| Educational Attainment | In Labor Force | Unemployed |
| Less than High School | 8 (61.5%) | 0 (0.0%) |
| High School Diploma | 114 (60.3%) | 7 (3.5%) |
| College / Associate Degree | 68 (72.3%) | 0 (0.0%) |
| Bachelor's Degree or higher | 140 (100.0%) | 0 (0.0%) |
| Total | 330 (75.7%) | 5 (1.2%) |
Employment Occupations by Sex in Ripley
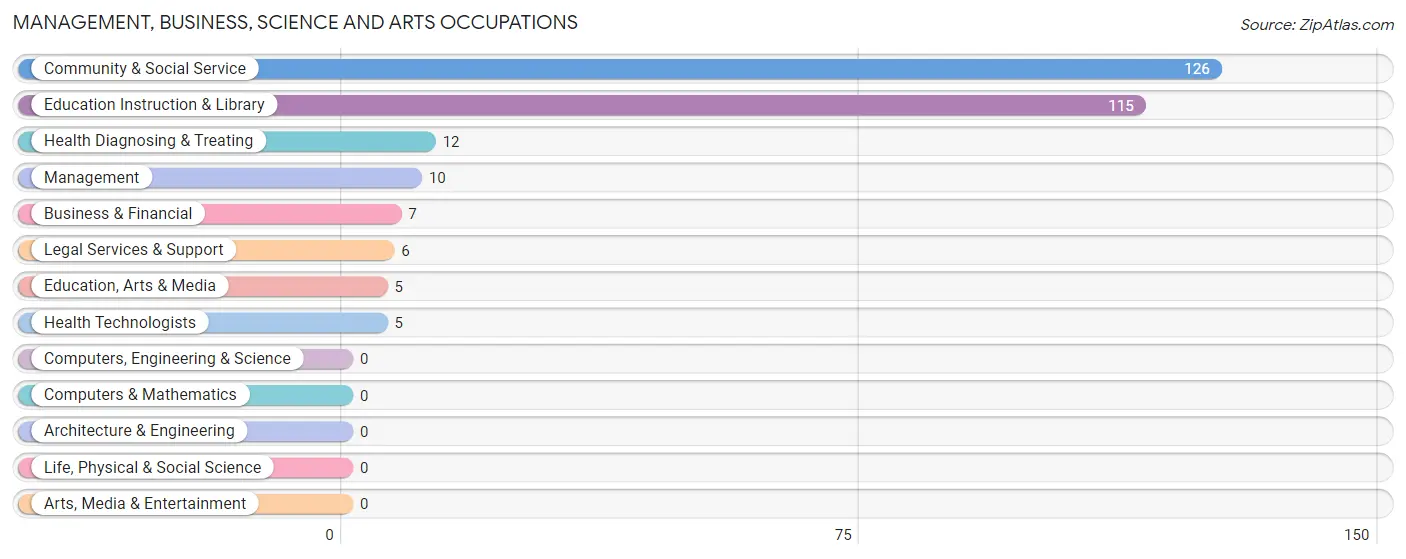
Management, Business, Science and Arts Occupations
The most common Management, Business, Science and Arts occupations in Ripley are Community & Social Service (126 | 29.9%), Education Instruction & Library (115 | 27.3%), Health Diagnosing & Treating (12 | 2.9%), Management (10 | 2.4%), and Business & Financial (7 | 1.7%).
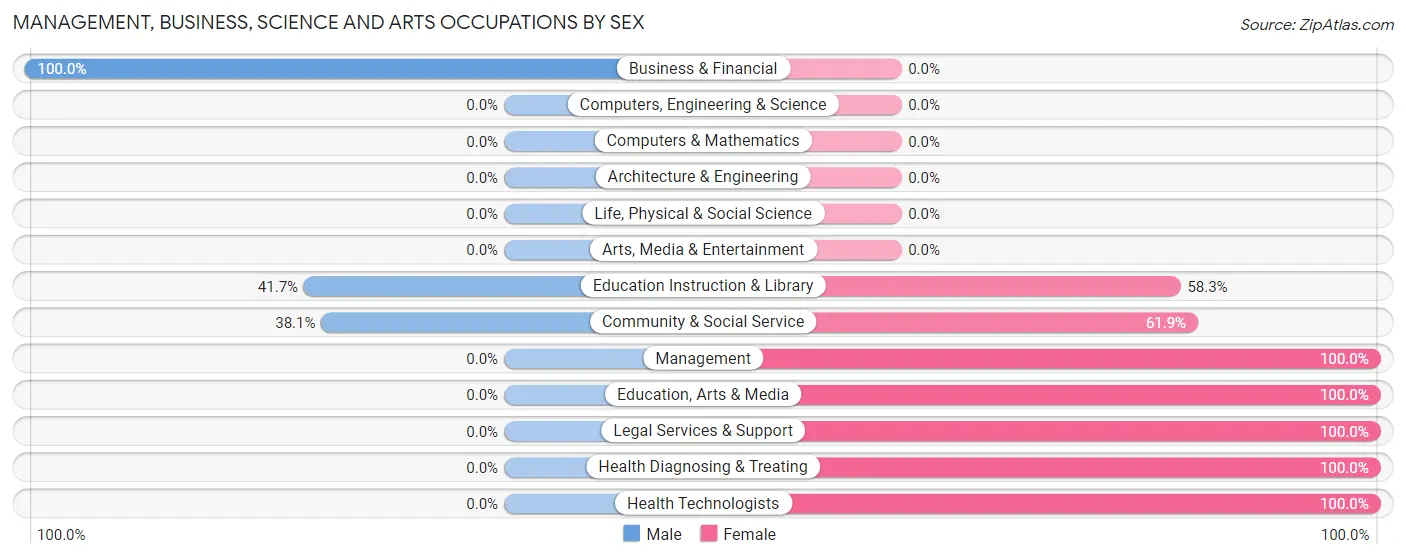
Management, Business, Science and Arts Occupations by Sex
Within the Management, Business, Science and Arts occupations in Ripley, the most male-oriented occupations are Business & Financial (100.0%), Education Instruction & Library (41.7%), and Community & Social Service (38.1%), while the most female-oriented occupations are Management (100.0%), Education, Arts & Media (100.0%), and Legal Services & Support (100.0%).
| Occupation | Male | Female |
| Management | 0 (0.0%) | 10 (100.0%) |
| Business & Financial | 7 (100.0%) | 0 (0.0%) |
| Computers, Engineering & Science | 0 (0.0%) | 0 (0.0%) |
| Computers & Mathematics | 0 (0.0%) | 0 (0.0%) |
| Architecture & Engineering | 0 (0.0%) | 0 (0.0%) |
| Life, Physical & Social Science | 0 (0.0%) | 0 (0.0%) |
| Community & Social Service | 48 (38.1%) | 78 (61.9%) |
| Education, Arts & Media | 0 (0.0%) | 5 (100.0%) |
| Legal Services & Support | 0 (0.0%) | 6 (100.0%) |
| Education Instruction & Library | 48 (41.7%) | 67 (58.3%) |
| Arts, Media & Entertainment | 0 (0.0%) | 0 (0.0%) |
| Health Diagnosing & Treating | 0 (0.0%) | 12 (100.0%) |
| Health Technologists | 0 (0.0%) | 5 (100.0%) |
| Total (Category) | 55 (35.5%) | 100 (64.5%) |
| Total (Overall) | 189 (44.9%) | 232 (55.1%) |
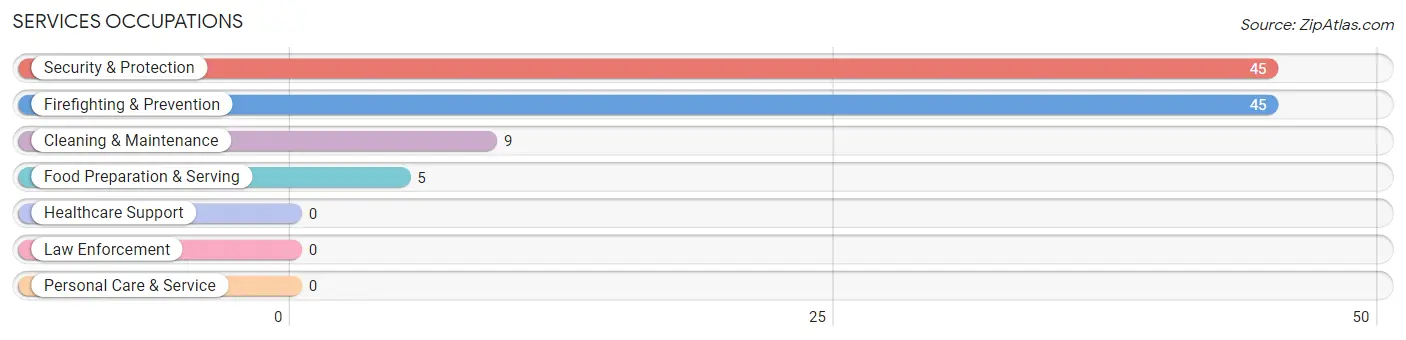
Services Occupations
The most common Services occupations in Ripley are Security & Protection (45 | 10.7%), Firefighting & Prevention (45 | 10.7%), Cleaning & Maintenance (9 | 2.1%), and Food Preparation & Serving (5 | 1.2%).
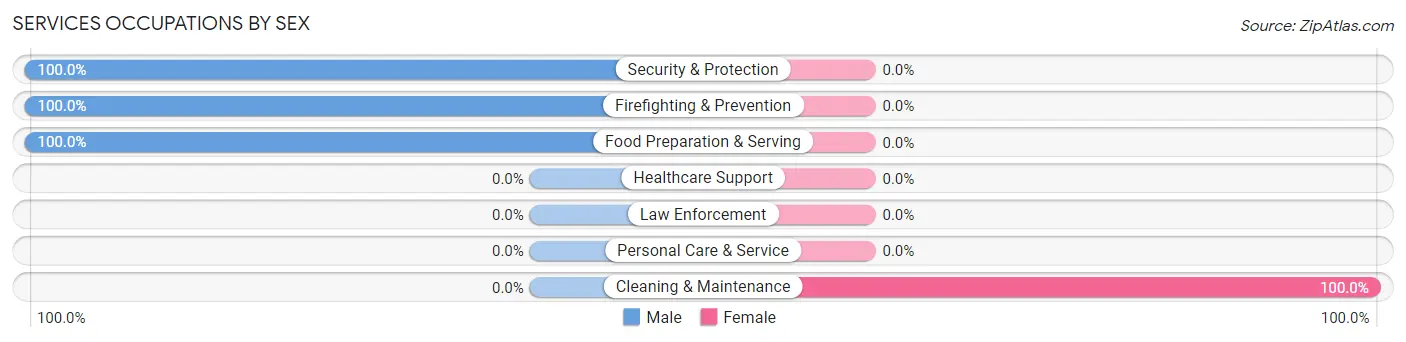
Services Occupations by Sex
| Occupation | Male | Female |
| Healthcare Support | 0 (0.0%) | 0 (0.0%) |
| Security & Protection | 45 (100.0%) | 0 (0.0%) |
| Firefighting & Prevention | 45 (100.0%) | 0 (0.0%) |
| Law Enforcement | 0 (0.0%) | 0 (0.0%) |
| Food Preparation & Serving | 5 (100.0%) | 0 (0.0%) |
| Cleaning & Maintenance | 0 (0.0%) | 9 (100.0%) |
| Personal Care & Service | 0 (0.0%) | 0 (0.0%) |
| Total (Category) | 50 (84.8%) | 9 (15.2%) |
| Total (Overall) | 189 (44.9%) | 232 (55.1%) |
Sales and Office Occupations
The most common Sales and Office occupations in Ripley are Sales & Related (89 | 21.1%), and Office & Administration (23 | 5.5%).
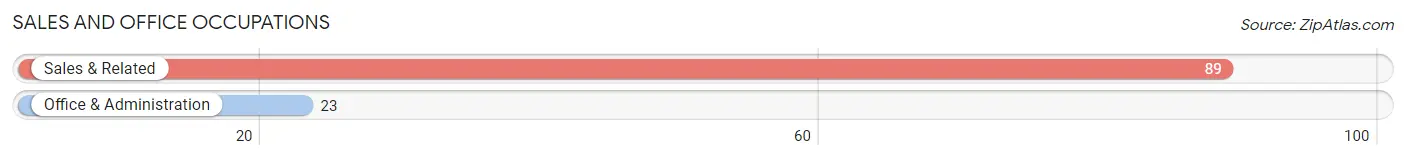
Sales and Office Occupations by Sex
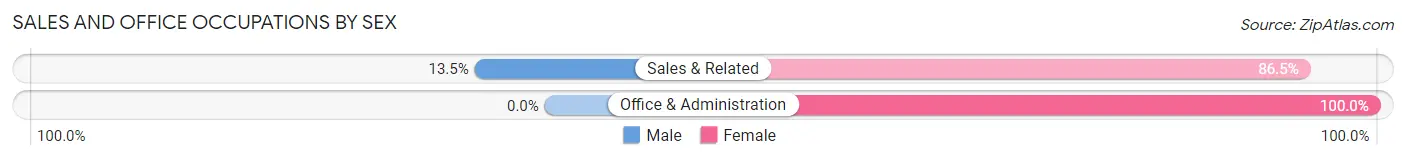
| Occupation | Male | Female |
| Sales & Related | 12 (13.5%) | 77 (86.5%) |
| Office & Administration | 0 (0.0%) | 23 (100.0%) |
| Total (Category) | 12 (10.7%) | 100 (89.3%) |
| Total (Overall) | 189 (44.9%) | 232 (55.1%) |
Natural Resources, Construction and Maintenance Occupations
The most common Natural Resources, Construction and Maintenance occupations in Ripley are Farming, Fishing & Forestry (11 | 2.6%), and Installation, Maintenance & Repair (6 | 1.4%).
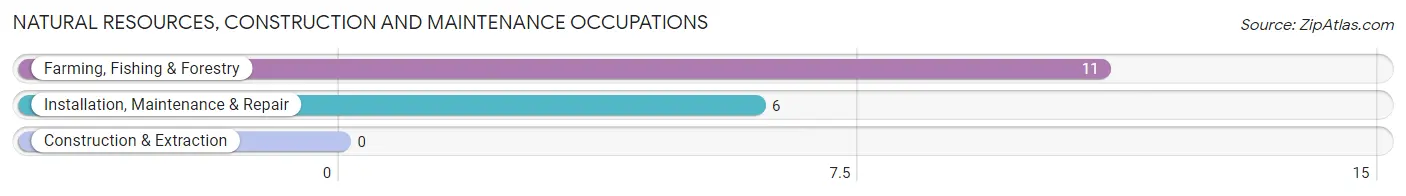
Natural Resources, Construction and Maintenance Occupations by Sex
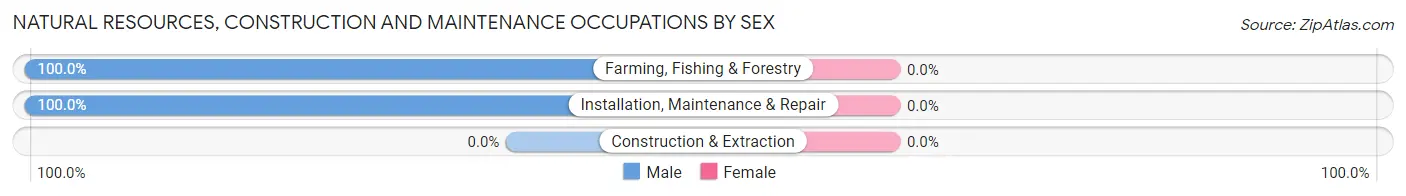
| Occupation | Male | Female |
| Farming, Fishing & Forestry | 11 (100.0%) | 0 (0.0%) |
| Construction & Extraction | 0 (0.0%) | 0 (0.0%) |
| Installation, Maintenance & Repair | 6 (100.0%) | 0 (0.0%) |
| Total (Category) | 17 (100.0%) | 0 (0.0%) |
| Total (Overall) | 189 (44.9%) | 232 (55.1%) |
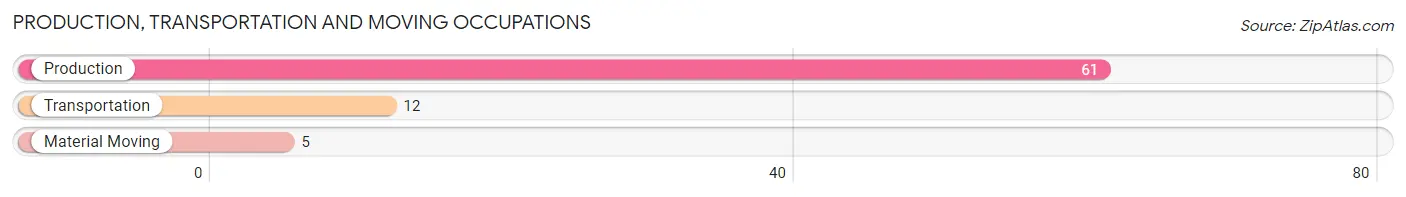
Production, Transportation and Moving Occupations
The most common Production, Transportation and Moving occupations in Ripley are Production (61 | 14.5%), Transportation (12 | 2.9%), and Material Moving (5 | 1.2%).
Production, Transportation and Moving Occupations by Sex
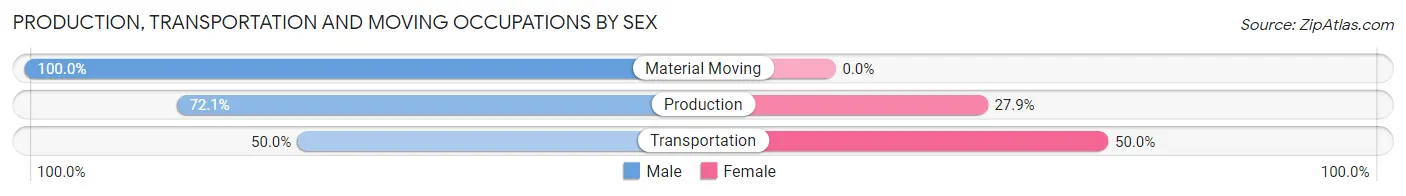
| Occupation | Male | Female |
| Production | 44 (72.1%) | 17 (27.9%) |
| Transportation | 6 (50.0%) | 6 (50.0%) |
| Material Moving | 5 (100.0%) | 0 (0.0%) |
| Total (Category) | 55 (70.5%) | 23 (29.5%) |
| Total (Overall) | 189 (44.9%) | 232 (55.1%) |
Employment Industries by Sex in Ripley
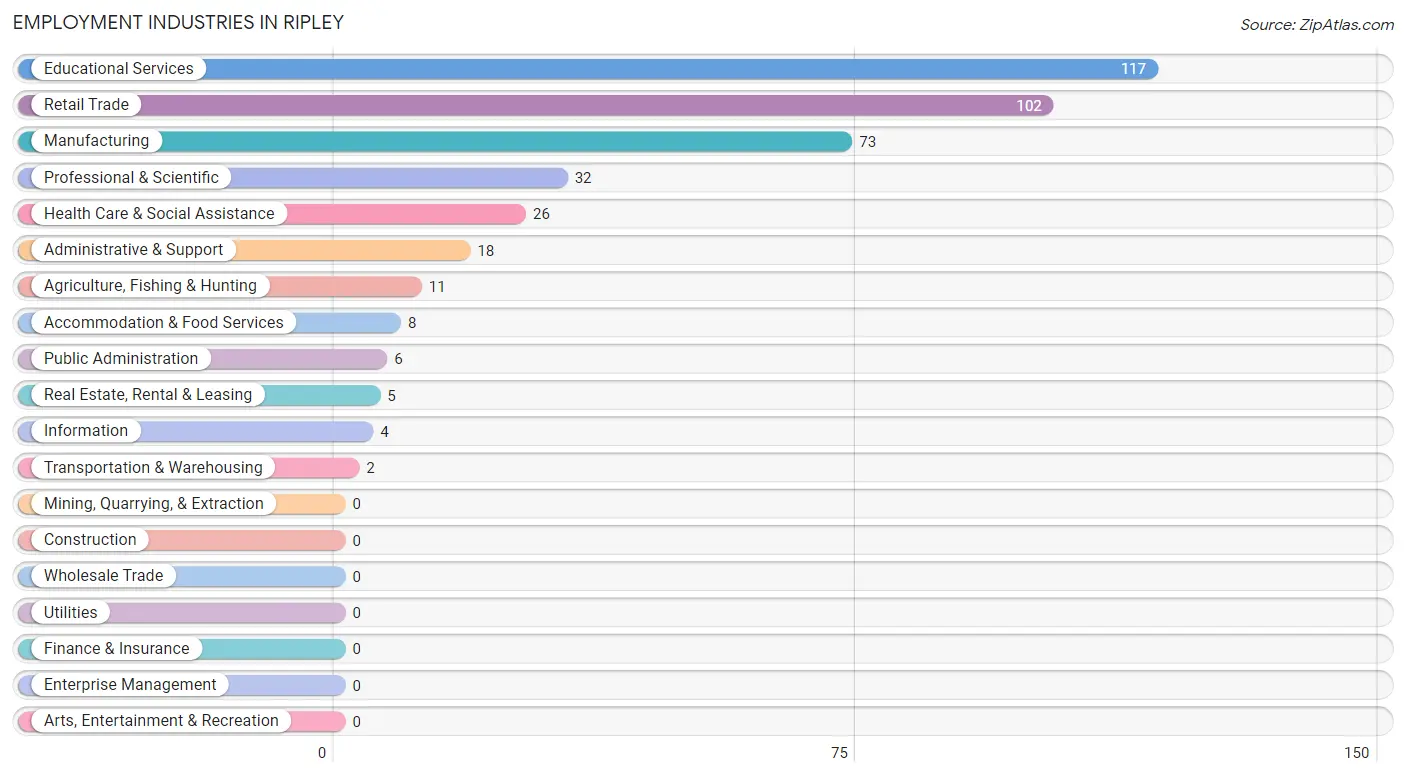
Employment Industries in Ripley
The major employment industries in Ripley include Educational Services (117 | 27.8%), Retail Trade (102 | 24.2%), Manufacturing (73 | 17.3%), Professional & Scientific (32 | 7.6%), and Health Care & Social Assistance (26 | 6.2%).
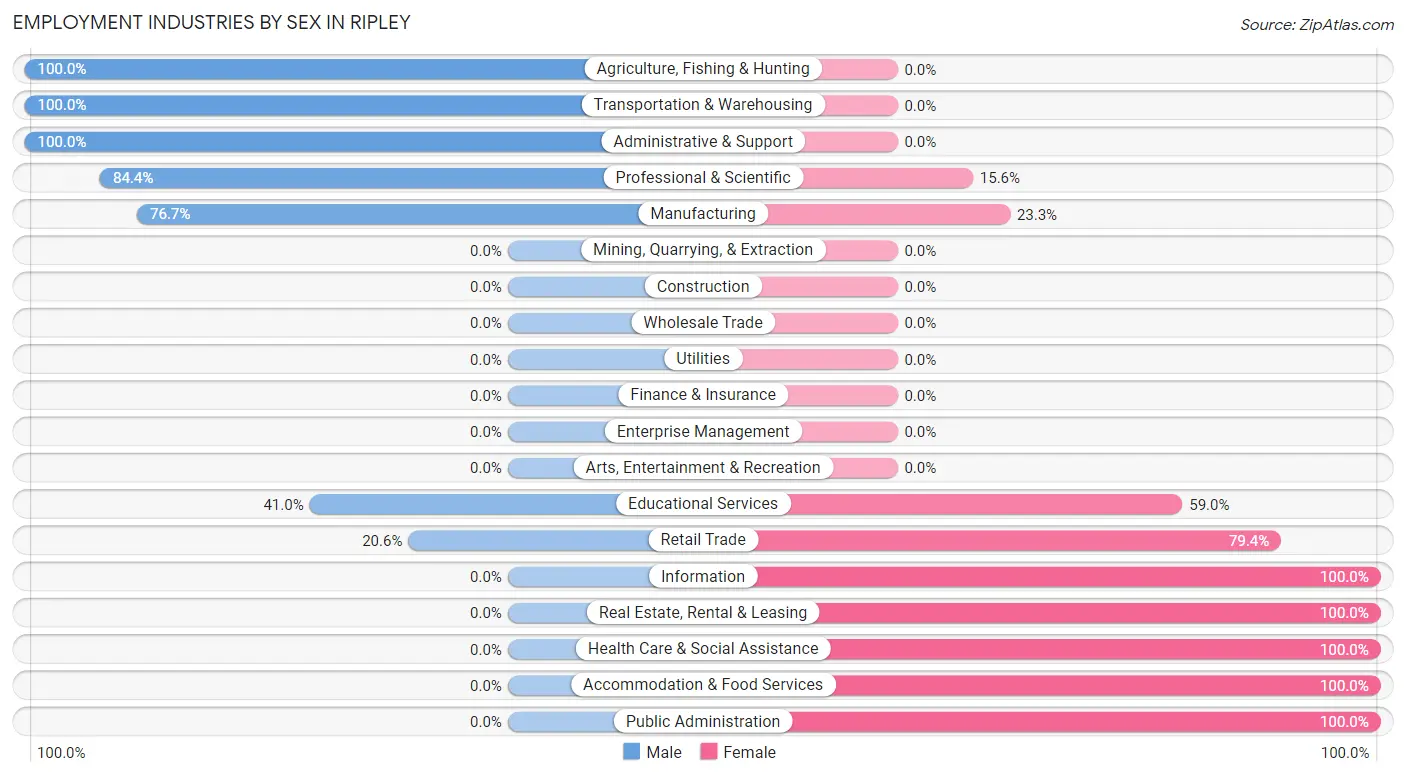
Employment Industries by Sex in Ripley
The Ripley industries that see more men than women are Agriculture, Fishing & Hunting (100.0%), Transportation & Warehousing (100.0%), and Administrative & Support (100.0%), whereas the industries that tend to have a higher number of women are Information (100.0%), Real Estate, Rental & Leasing (100.0%), and Health Care & Social Assistance (100.0%).
| Industry | Male | Female |
| Agriculture, Fishing & Hunting | 11 (100.0%) | 0 (0.0%) |
| Mining, Quarrying, & Extraction | 0 (0.0%) | 0 (0.0%) |
| Construction | 0 (0.0%) | 0 (0.0%) |
| Manufacturing | 56 (76.7%) | 17 (23.3%) |
| Wholesale Trade | 0 (0.0%) | 0 (0.0%) |
| Retail Trade | 21 (20.6%) | 81 (79.4%) |
| Transportation & Warehousing | 2 (100.0%) | 0 (0.0%) |
| Utilities | 0 (0.0%) | 0 (0.0%) |
| Information | 0 (0.0%) | 4 (100.0%) |
| Finance & Insurance | 0 (0.0%) | 0 (0.0%) |
| Real Estate, Rental & Leasing | 0 (0.0%) | 5 (100.0%) |
| Professional & Scientific | 27 (84.4%) | 5 (15.6%) |
| Enterprise Management | 0 (0.0%) | 0 (0.0%) |
| Administrative & Support | 18 (100.0%) | 0 (0.0%) |
| Educational Services | 48 (41.0%) | 69 (59.0%) |
| Health Care & Social Assistance | 0 (0.0%) | 26 (100.0%) |
| Arts, Entertainment & Recreation | 0 (0.0%) | 0 (0.0%) |
| Accommodation & Food Services | 0 (0.0%) | 8 (100.0%) |
| Public Administration | 0 (0.0%) | 6 (100.0%) |
| Total | 189 (44.9%) | 232 (55.1%) |
Education in Ripley
School Enrollment in Ripley
The most common levels of schooling among the 171 students in Ripley are elementary school (68 | 39.8%), high school (53 | 31.0%), and middle school (20 | 11.7%).
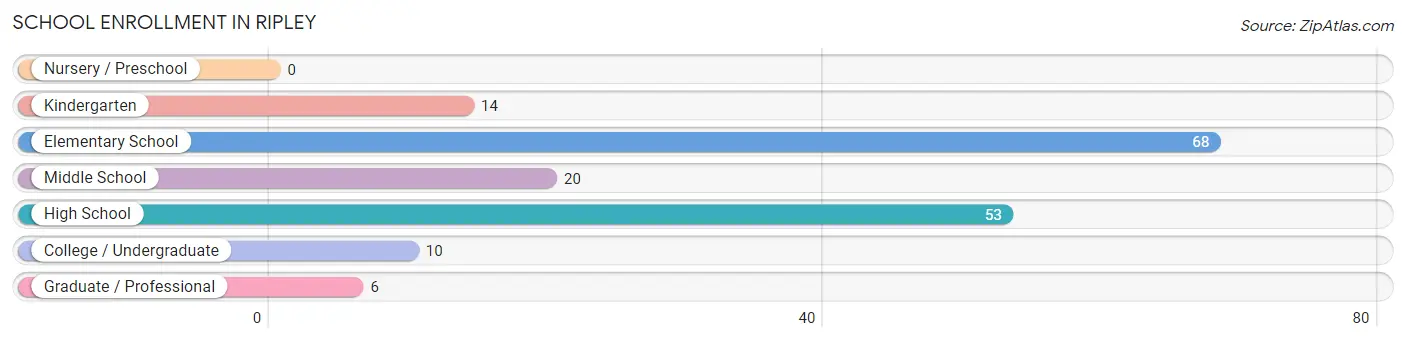
| School Level | # Students | % Students |
| Nursery / Preschool | 0 | 0.0% |
| Kindergarten | 14 | 8.2% |
| Elementary School | 68 | 39.8% |
| Middle School | 20 | 11.7% |
| High School | 53 | 31.0% |
| College / Undergraduate | 10 | 5.9% |
| Graduate / Professional | 6 | 3.5% |
| Total | 171 | 100.0% |
School Enrollment by Age by Funding Source in Ripley
Out of a total of 171 students who are enrolled in schools in Ripley, 15 (8.8%) attend a private institution, while the remaining 156 (91.2%) are enrolled in public schools. The age group of 20 to 24 year olds has the highest likelihood of being enrolled in private schools, with 4 (100.0% in the age bracket) enrolled. Conversely, the age group of 5 to 9 year old has the lowest likelihood of being enrolled in a private school, with 65 (100.0% in the age bracket) attending a public institution.
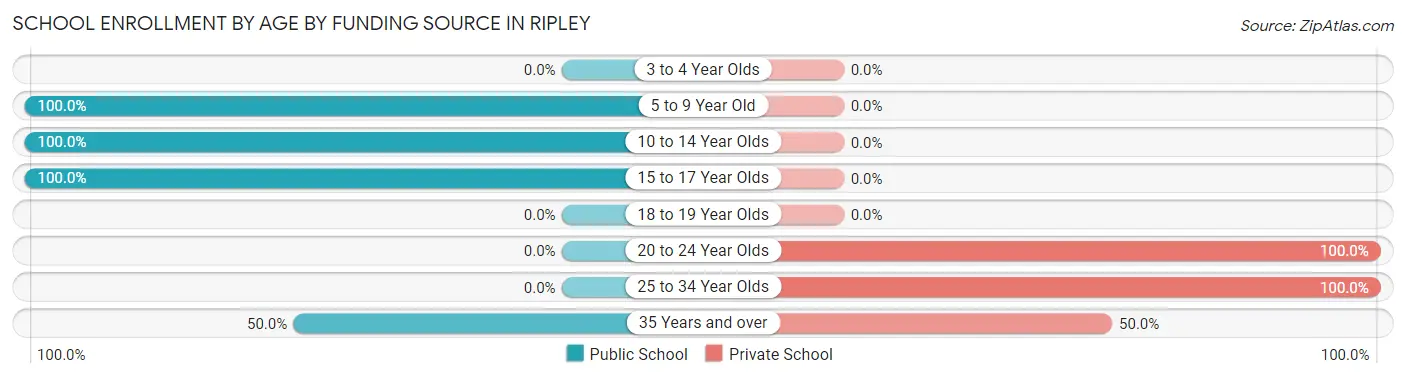
| Age Bracket | Public School | Private School |
| 3 to 4 Year Olds | 0 (0.0%) | 0 (0.0%) |
| 5 to 9 Year Old | 65 (100.0%) | 0 (0.0%) |
| 10 to 14 Year Olds | 37 (100.0%) | 0 (0.0%) |
| 15 to 17 Year Olds | 49 (100.0%) | 0 (0.0%) |
| 18 to 19 Year Olds | 0 (0.0%) | 0 (0.0%) |
| 20 to 24 Year Olds | 0 (0.0%) | 4 (100.0%) |
| 25 to 34 Year Olds | 0 (0.0%) | 6 (100.0%) |
| 35 Years and over | 5 (50.0%) | 5 (50.0%) |
| Total | 156 (91.2%) | 15 (8.8%) |
Educational Attainment by Field of Study in Ripley
Education (131 | 77.1%), business (10 | 5.9%), liberal arts & history (8 | 4.7%), bio, nature & agricultural (6 | 3.5%), and psychology (6 | 3.5%) are the most common fields of study among 170 individuals in Ripley who have obtained a bachelor's degree or higher.
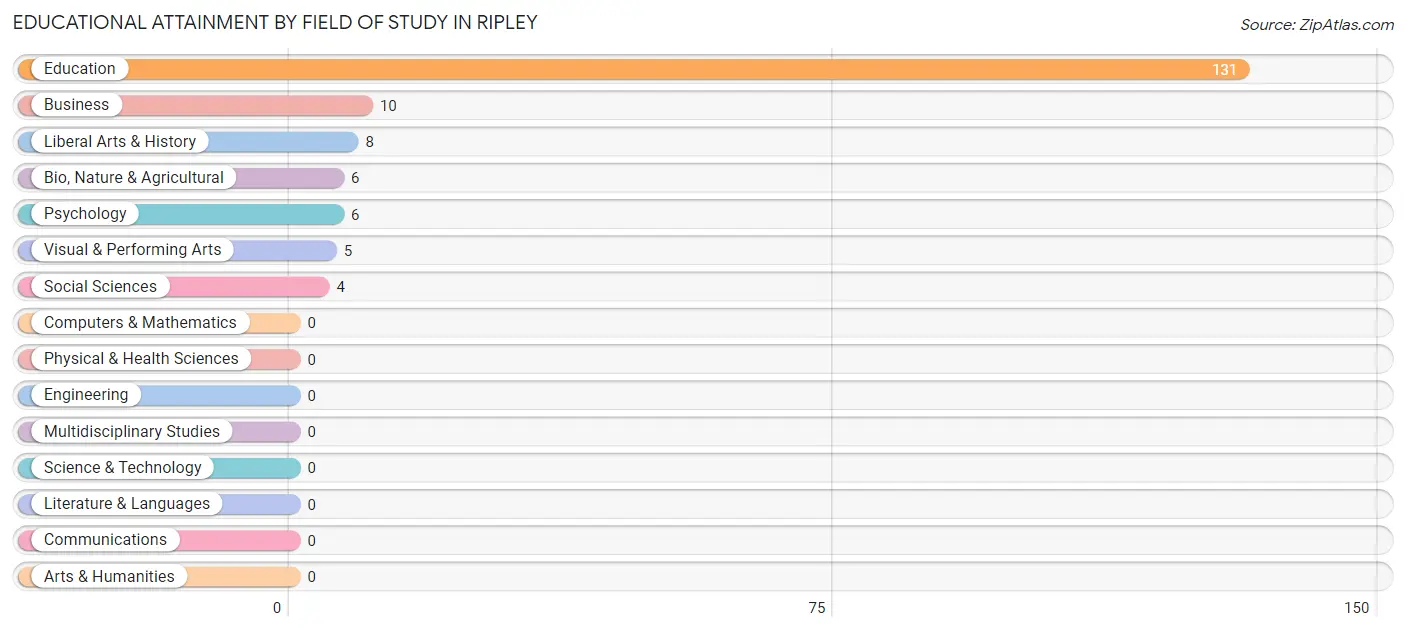
| Field of Study | # Graduates | % Graduates |
| Computers & Mathematics | 0 | 0.0% |
| Bio, Nature & Agricultural | 6 | 3.5% |
| Physical & Health Sciences | 0 | 0.0% |
| Psychology | 6 | 3.5% |
| Social Sciences | 4 | 2.4% |
| Engineering | 0 | 0.0% |
| Multidisciplinary Studies | 0 | 0.0% |
| Science & Technology | 0 | 0.0% |
| Business | 10 | 5.9% |
| Education | 131 | 77.1% |
| Literature & Languages | 0 | 0.0% |
| Liberal Arts & History | 8 | 4.7% |
| Visual & Performing Arts | 5 | 2.9% |
| Communications | 0 | 0.0% |
| Arts & Humanities | 0 | 0.0% |
| Total | 170 | 100.0% |
Transportation & Commute in Ripley
Vehicle Availability by Sex in Ripley
The most prevalent vehicle ownership categories in Ripley are males with 2 vehicles (155, accounting for 85.2%) and females with 2 vehicles (123, making up 78.7%).
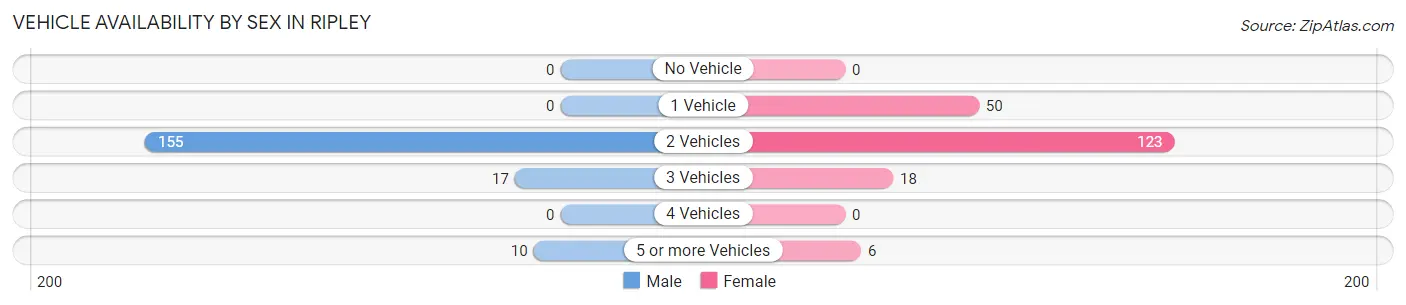
| Vehicles Available | Male | Female |
| No Vehicle | 0 (0.0%) | 0 (0.0%) |
| 1 Vehicle | 0 (0.0%) | 50 (25.4%) |
| 2 Vehicles | 155 (85.2%) | 123 (62.4%) |
| 3 Vehicles | 17 (9.3%) | 18 (9.1%) |
| 4 Vehicles | 0 (0.0%) | 0 (0.0%) |
| 5 or more Vehicles | 10 (5.5%) | 6 (3.0%) |
| Total | 182 (100.0%) | 197 (100.0%) |
Commute Time in Ripley
The most frequently occuring commute durations in Ripley are 45 to 59 minutes (98 commuters, 26.6%), 20 to 24 minutes (58 commuters, 15.7%), and 5 to 9 minutes (55 commuters, 14.9%).
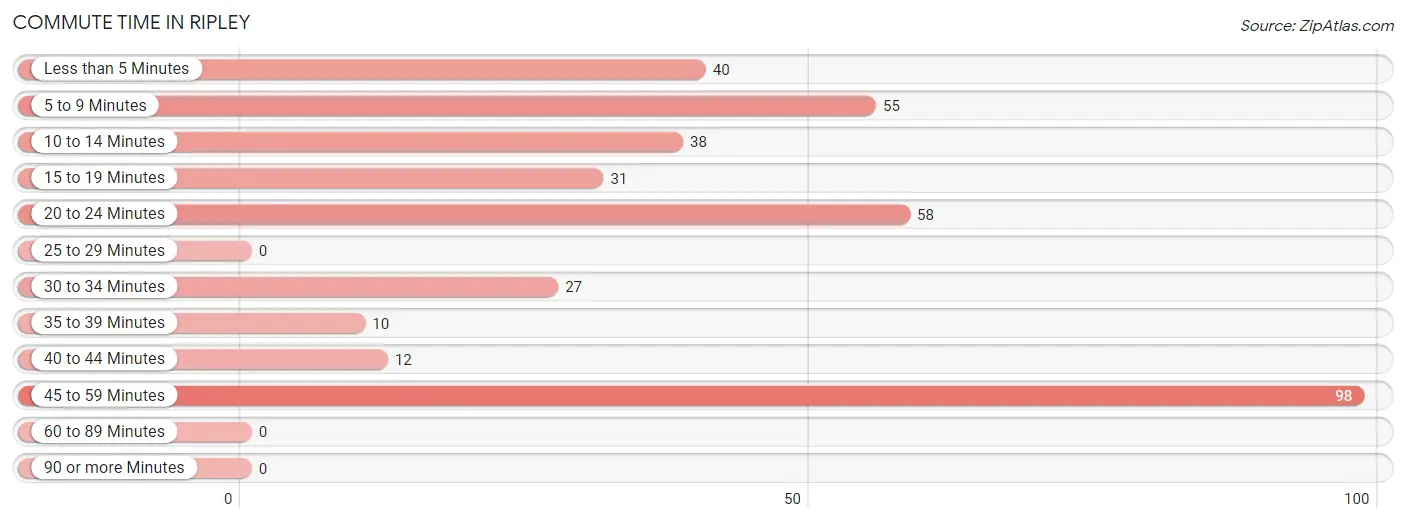
| Commute Time | # Commuters | % Commuters |
| Less than 5 Minutes | 40 | 10.8% |
| 5 to 9 Minutes | 55 | 14.9% |
| 10 to 14 Minutes | 38 | 10.3% |
| 15 to 19 Minutes | 31 | 8.4% |
| 20 to 24 Minutes | 58 | 15.7% |
| 25 to 29 Minutes | 0 | 0.0% |
| 30 to 34 Minutes | 27 | 7.3% |
| 35 to 39 Minutes | 10 | 2.7% |
| 40 to 44 Minutes | 12 | 3.3% |
| 45 to 59 Minutes | 98 | 26.6% |
| 60 to 89 Minutes | 0 | 0.0% |
| 90 or more Minutes | 0 | 0.0% |
Commute Time by Sex in Ripley
The most common commute times in Ripley are 45 to 59 minutes (90 commuters, 49.4%) for males and 20 to 24 minutes (58 commuters, 31.0%) for females.
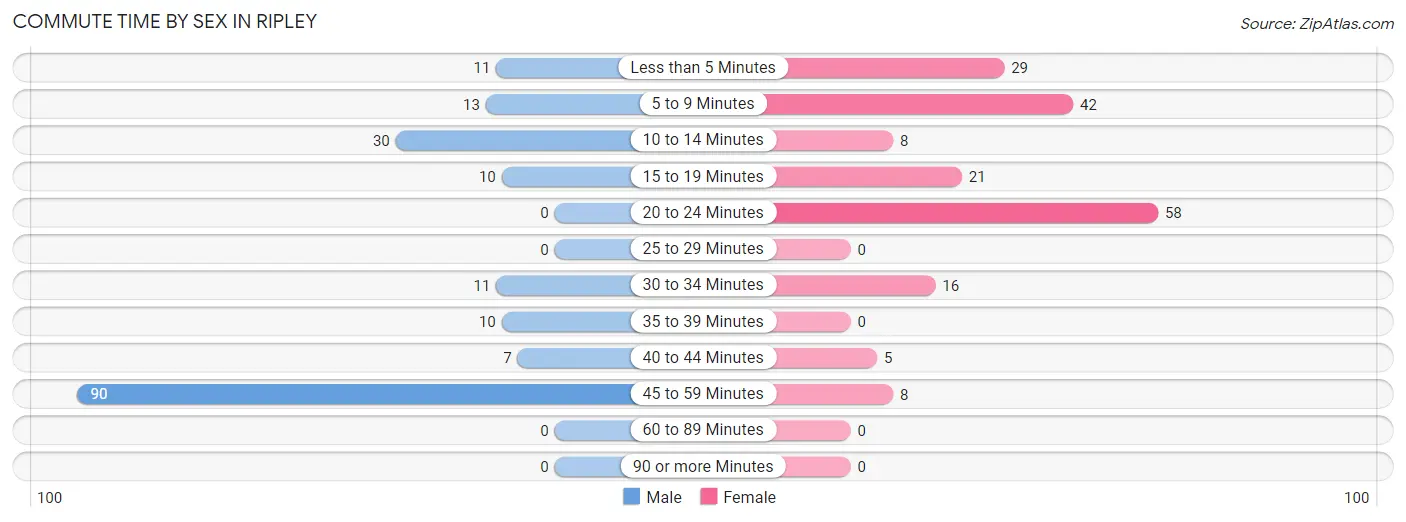
| Commute Time | Male | Female |
| Less than 5 Minutes | 11 (6.0%) | 29 (15.5%) |
| 5 to 9 Minutes | 13 (7.1%) | 42 (22.5%) |
| 10 to 14 Minutes | 30 (16.5%) | 8 (4.3%) |
| 15 to 19 Minutes | 10 (5.5%) | 21 (11.2%) |
| 20 to 24 Minutes | 0 (0.0%) | 58 (31.0%) |
| 25 to 29 Minutes | 0 (0.0%) | 0 (0.0%) |
| 30 to 34 Minutes | 11 (6.0%) | 16 (8.6%) |
| 35 to 39 Minutes | 10 (5.5%) | 0 (0.0%) |
| 40 to 44 Minutes | 7 (3.8%) | 5 (2.7%) |
| 45 to 59 Minutes | 90 (49.4%) | 8 (4.3%) |
| 60 to 89 Minutes | 0 (0.0%) | 0 (0.0%) |
| 90 or more Minutes | 0 (0.0%) | 0 (0.0%) |
Time of Departure to Work by Sex in Ripley
The most frequent times of departure to work in Ripley are 9:00 AM to 9:59 AM (81, 44.5%) for males and 7:30 AM to 7:59 AM (82, 43.9%) for females.
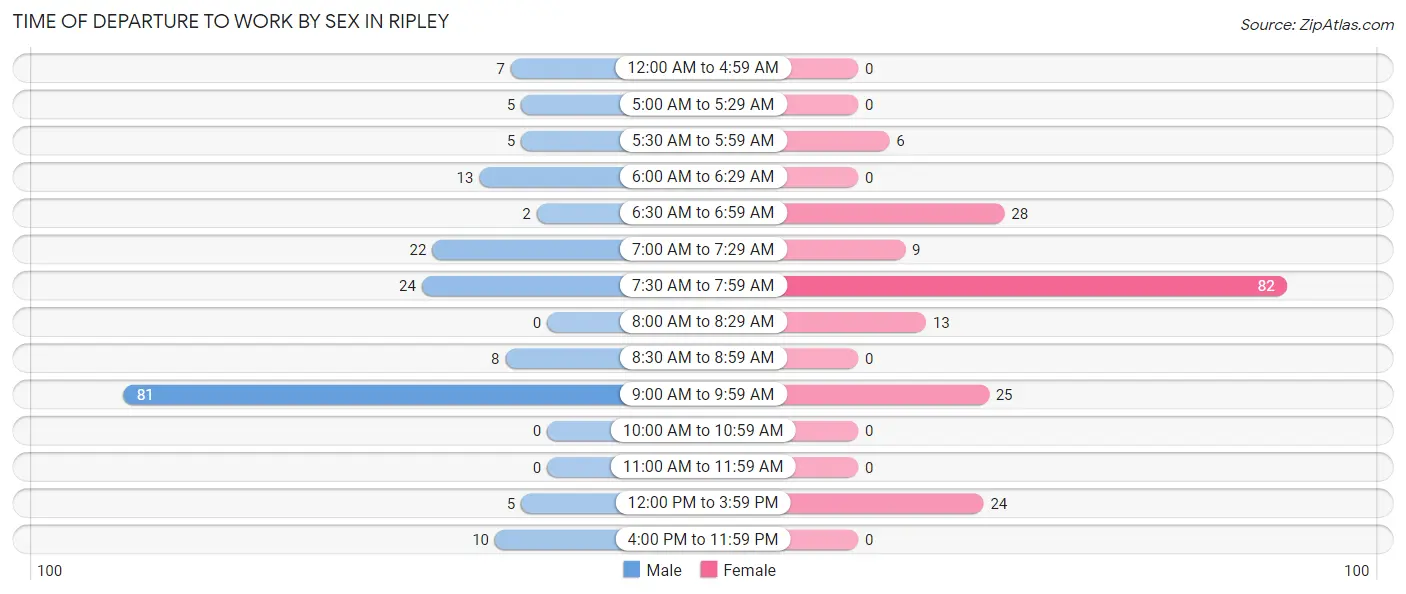
| Time of Departure | Male | Female |
| 12:00 AM to 4:59 AM | 7 (3.8%) | 0 (0.0%) |
| 5:00 AM to 5:29 AM | 5 (2.8%) | 0 (0.0%) |
| 5:30 AM to 5:59 AM | 5 (2.8%) | 6 (3.2%) |
| 6:00 AM to 6:29 AM | 13 (7.1%) | 0 (0.0%) |
| 6:30 AM to 6:59 AM | 2 (1.1%) | 28 (15.0%) |
| 7:00 AM to 7:29 AM | 22 (12.1%) | 9 (4.8%) |
| 7:30 AM to 7:59 AM | 24 (13.2%) | 82 (43.9%) |
| 8:00 AM to 8:29 AM | 0 (0.0%) | 13 (7.0%) |
| 8:30 AM to 8:59 AM | 8 (4.4%) | 0 (0.0%) |
| 9:00 AM to 9:59 AM | 81 (44.5%) | 25 (13.4%) |
| 10:00 AM to 10:59 AM | 0 (0.0%) | 0 (0.0%) |
| 11:00 AM to 11:59 AM | 0 (0.0%) | 0 (0.0%) |
| 12:00 PM to 3:59 PM | 5 (2.8%) | 24 (12.8%) |
| 4:00 PM to 11:59 PM | 10 (5.5%) | 0 (0.0%) |
| Total | 182 (100.0%) | 187 (100.0%) |
Housing Occupancy in Ripley
Occupancy by Ownership in Ripley
Of the total 349 dwellings in Ripley, owner-occupied units account for 250 (71.6%), while renter-occupied units make up 99 (28.4%).
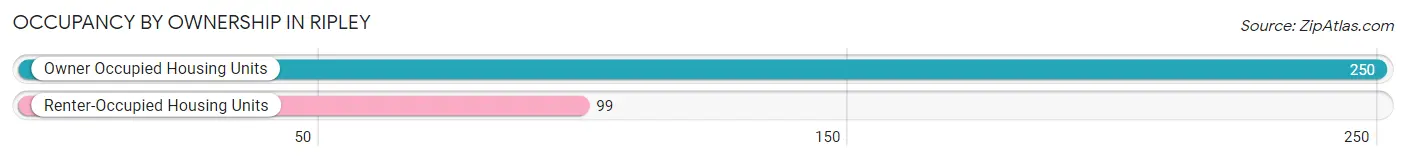
| Occupancy | # Housing Units | % Housing Units |
| Owner Occupied Housing Units | 250 | 71.6% |
| Renter-Occupied Housing Units | 99 | 28.4% |
| Total Occupied Housing Units | 349 | 100.0% |
Occupancy by Household Size in Ripley
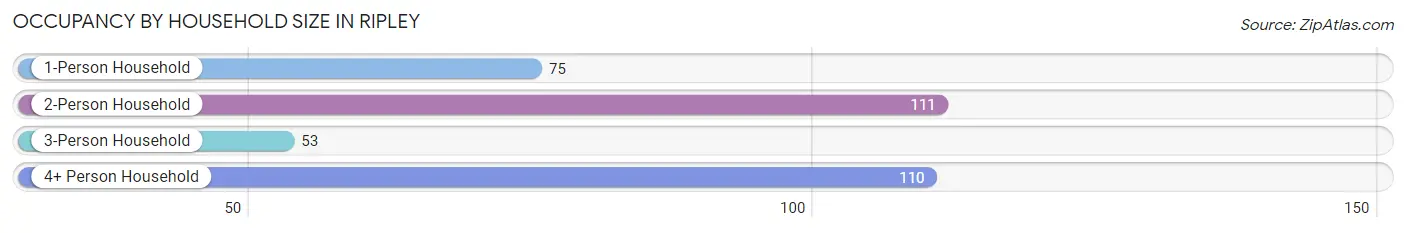
| Household Size | # Housing Units | % Housing Units |
| 1-Person Household | 75 | 21.5% |
| 2-Person Household | 111 | 31.8% |
| 3-Person Household | 53 | 15.2% |
| 4+ Person Household | 110 | 31.5% |
| Total Housing Units | 349 | 100.0% |
Occupancy by Ownership by Household Size in Ripley
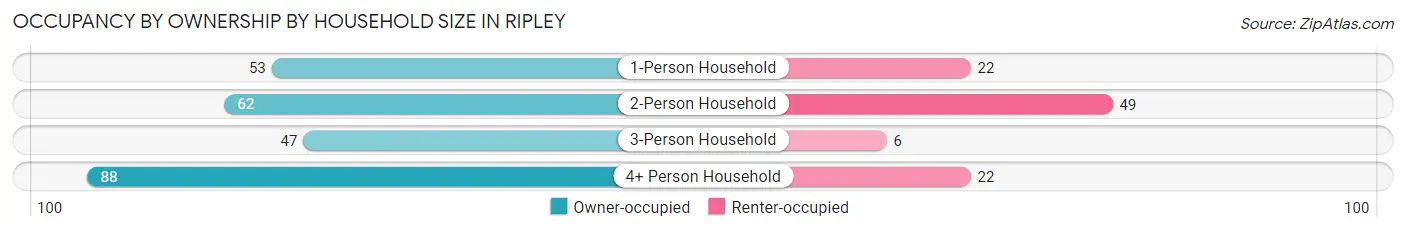
| Household Size | Owner-occupied | Renter-occupied |
| 1-Person Household | 53 (70.7%) | 22 (29.3%) |
| 2-Person Household | 62 (55.9%) | 49 (44.1%) |
| 3-Person Household | 47 (88.7%) | 6 (11.3%) |
| 4+ Person Household | 88 (80.0%) | 22 (20.0%) |
| Total Housing Units | 250 (71.6%) | 99 (28.4%) |
Occupancy by Educational Attainment in Ripley
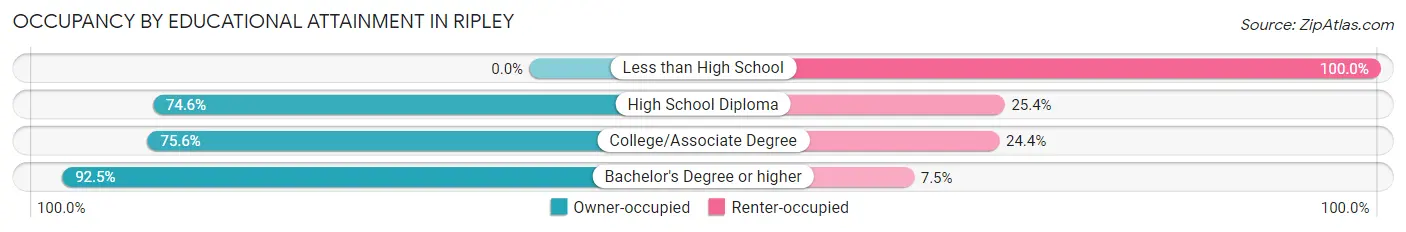
| Household Size | Owner-occupied | Renter-occupied |
| Less than High School | 0 (0.0%) | 31 (100.0%) |
| High School Diploma | 129 (74.6%) | 44 (25.4%) |
| College/Associate Degree | 59 (75.6%) | 19 (24.4%) |
| Bachelor's Degree or higher | 62 (92.5%) | 5 (7.5%) |
Occupancy by Age of Householder in Ripley
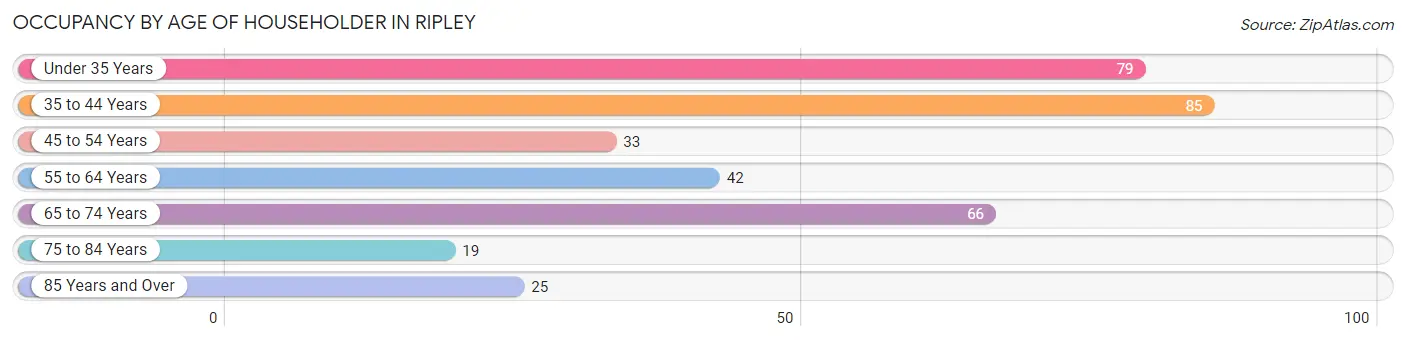
| Age Bracket | # Households | % Households |
| Under 35 Years | 79 | 22.6% |
| 35 to 44 Years | 85 | 24.4% |
| 45 to 54 Years | 33 | 9.5% |
| 55 to 64 Years | 42 | 12.0% |
| 65 to 74 Years | 66 | 18.9% |
| 75 to 84 Years | 19 | 5.4% |
| 85 Years and Over | 25 | 7.2% |
| Total | 349 | 100.0% |
Housing Finances in Ripley
Median Income by Occupancy in Ripley
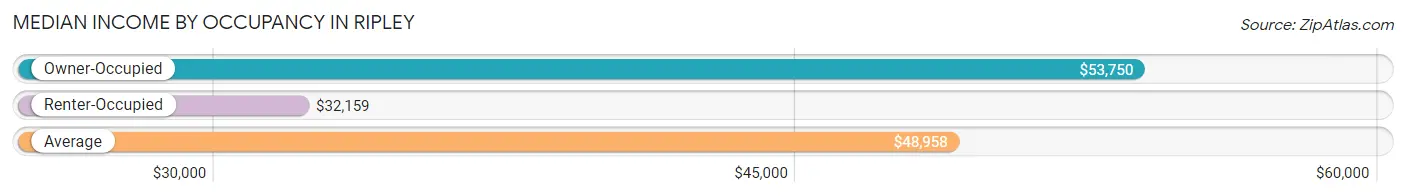
| Occupancy Type | # Households | Median Income |
| Owner-Occupied | 250 (71.6%) | $53,750 |
| Renter-Occupied | 99 (28.4%) | $32,159 |
| Average | 349 (100.0%) | $48,958 |
Occupancy by Householder Income Bracket in Ripley
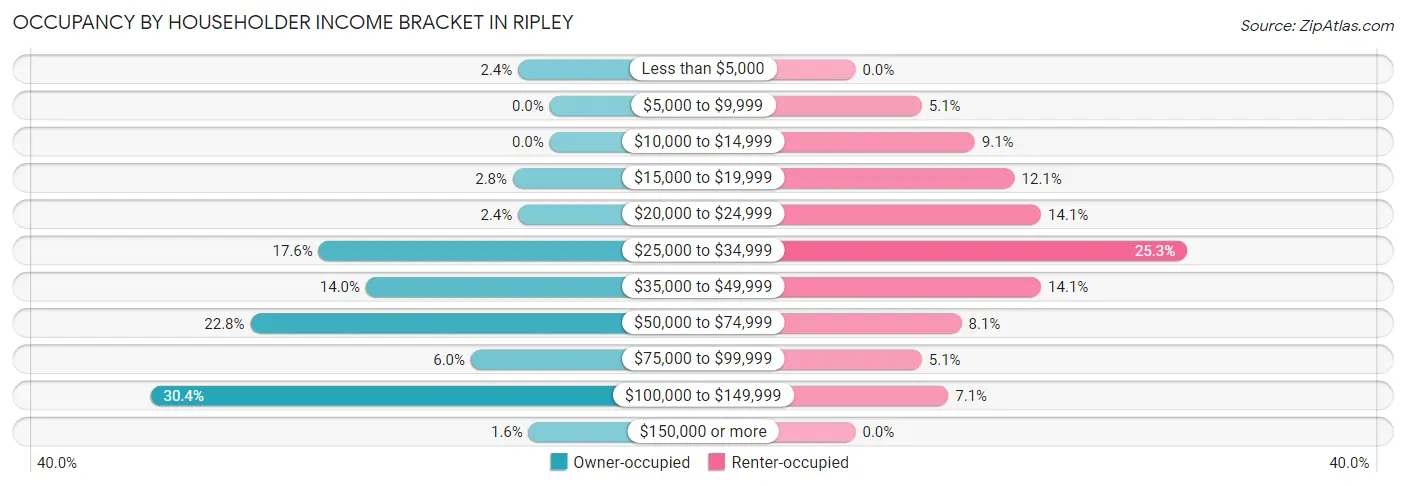
| Income Bracket | Owner-occupied | Renter-occupied |
| Less than $5,000 | 6 (2.4%) | 0 (0.0%) |
| $5,000 to $9,999 | 0 (0.0%) | 5 (5.1%) |
| $10,000 to $14,999 | 0 (0.0%) | 9 (9.1%) |
| $15,000 to $19,999 | 7 (2.8%) | 12 (12.1%) |
| $20,000 to $24,999 | 6 (2.4%) | 14 (14.1%) |
| $25,000 to $34,999 | 44 (17.6%) | 25 (25.3%) |
| $35,000 to $49,999 | 35 (14.0%) | 14 (14.1%) |
| $50,000 to $74,999 | 57 (22.8%) | 8 (8.1%) |
| $75,000 to $99,999 | 15 (6.0%) | 5 (5.1%) |
| $100,000 to $149,999 | 76 (30.4%) | 7 (7.1%) |
| $150,000 or more | 4 (1.6%) | 0 (0.0%) |
| Total | 250 (100.0%) | 99 (100.0%) |
Monthly Housing Cost Tiers in Ripley
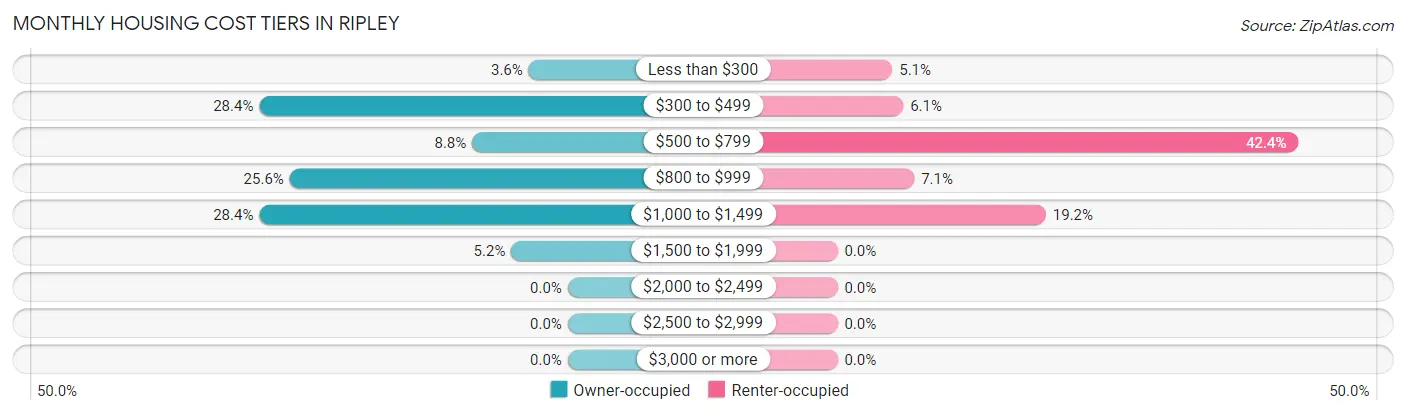
| Monthly Cost | Owner-occupied | Renter-occupied |
| Less than $300 | 9 (3.6%) | 5 (5.1%) |
| $300 to $499 | 71 (28.4%) | 6 (6.1%) |
| $500 to $799 | 22 (8.8%) | 42 (42.4%) |
| $800 to $999 | 64 (25.6%) | 7 (7.1%) |
| $1,000 to $1,499 | 71 (28.4%) | 19 (19.2%) |
| $1,500 to $1,999 | 13 (5.2%) | 0 (0.0%) |
| $2,000 to $2,499 | 0 (0.0%) | 0 (0.0%) |
| $2,500 to $2,999 | 0 (0.0%) | 0 (0.0%) |
| $3,000 or more | 0 (0.0%) | 0 (0.0%) |
| Total | 250 (100.0%) | 99 (100.0%) |
Physical Housing Characteristics in Ripley
Housing Structures in Ripley
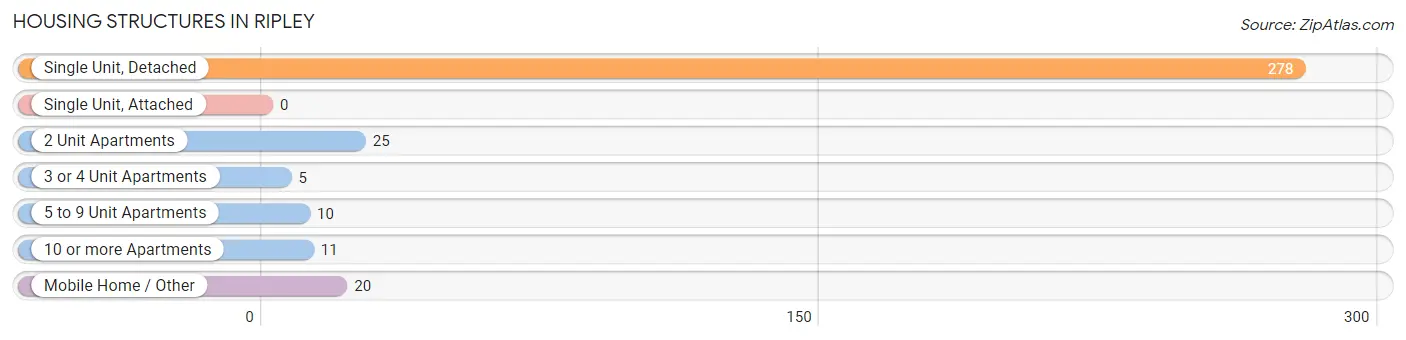
| Structure Type | # Housing Units | % Housing Units |
| Single Unit, Detached | 278 | 79.7% |
| Single Unit, Attached | 0 | 0.0% |
| 2 Unit Apartments | 25 | 7.2% |
| 3 or 4 Unit Apartments | 5 | 1.4% |
| 5 to 9 Unit Apartments | 10 | 2.9% |
| 10 or more Apartments | 11 | 3.2% |
| Mobile Home / Other | 20 | 5.7% |
| Total | 349 | 100.0% |
Housing Structures by Occupancy in Ripley
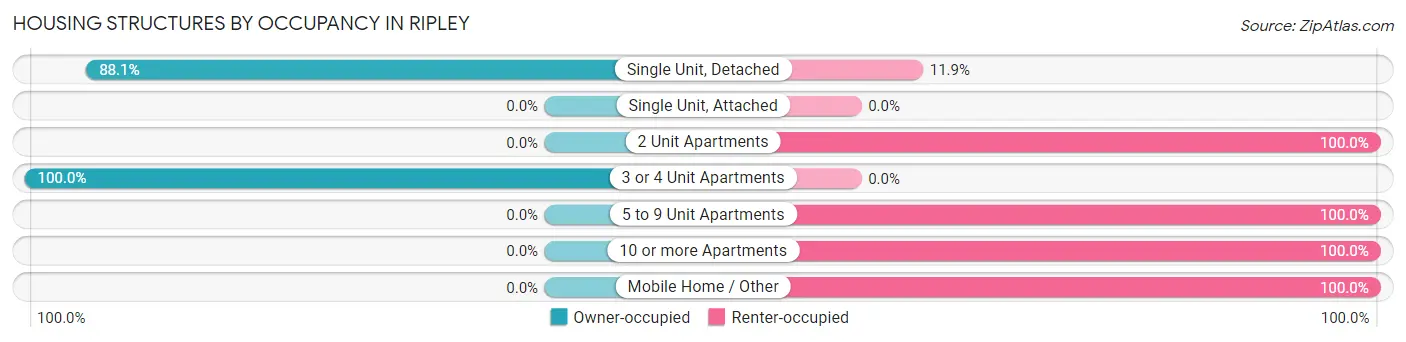
| Structure Type | Owner-occupied | Renter-occupied |
| Single Unit, Detached | 245 (88.1%) | 33 (11.9%) |
| Single Unit, Attached | 0 (0.0%) | 0 (0.0%) |
| 2 Unit Apartments | 0 (0.0%) | 25 (100.0%) |
| 3 or 4 Unit Apartments | 5 (100.0%) | 0 (0.0%) |
| 5 to 9 Unit Apartments | 0 (0.0%) | 10 (100.0%) |
| 10 or more Apartments | 0 (0.0%) | 11 (100.0%) |
| Mobile Home / Other | 0 (0.0%) | 20 (100.0%) |
| Total | 250 (71.6%) | 99 (28.4%) |
Housing Structures by Number of Rooms in Ripley
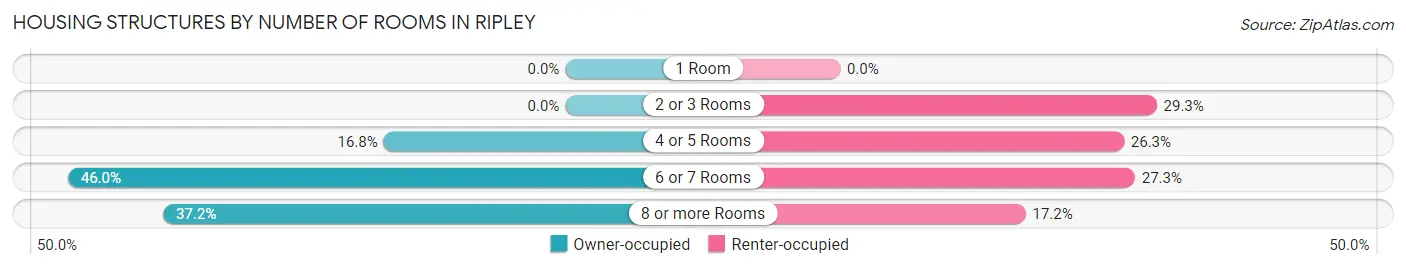
| Number of Rooms | Owner-occupied | Renter-occupied |
| 1 Room | 0 (0.0%) | 0 (0.0%) |
| 2 or 3 Rooms | 0 (0.0%) | 29 (29.3%) |
| 4 or 5 Rooms | 42 (16.8%) | 26 (26.3%) |
| 6 or 7 Rooms | 115 (46.0%) | 27 (27.3%) |
| 8 or more Rooms | 93 (37.2%) | 17 (17.2%) |
| Total | 250 (100.0%) | 99 (100.0%) |
Housing Structure by Heating Type in Ripley
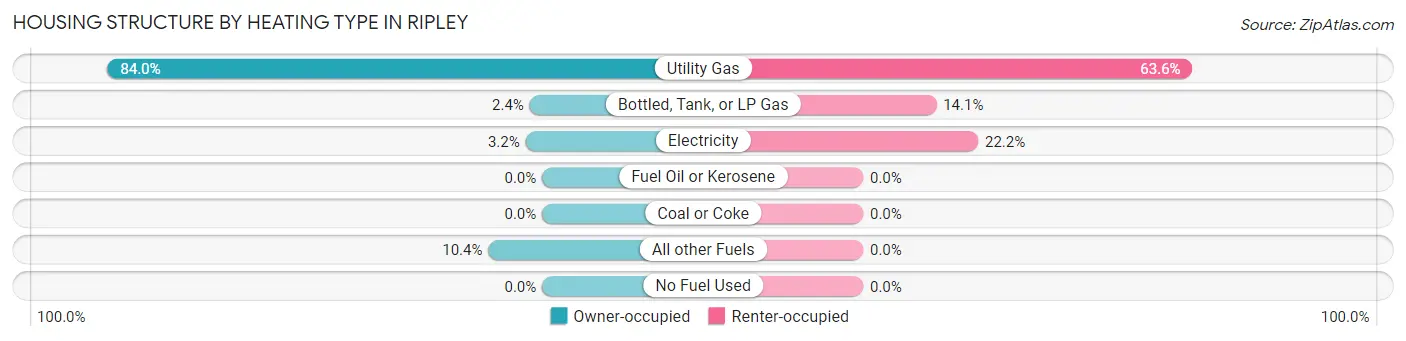
| Heating Type | Owner-occupied | Renter-occupied |
| Utility Gas | 210 (84.0%) | 63 (63.6%) |
| Bottled, Tank, or LP Gas | 6 (2.4%) | 14 (14.1%) |
| Electricity | 8 (3.2%) | 22 (22.2%) |
| Fuel Oil or Kerosene | 0 (0.0%) | 0 (0.0%) |
| Coal or Coke | 0 (0.0%) | 0 (0.0%) |
| All other Fuels | 26 (10.4%) | 0 (0.0%) |
| No Fuel Used | 0 (0.0%) | 0 (0.0%) |
| Total | 250 (100.0%) | 99 (100.0%) |
Household Vehicle Usage in Ripley
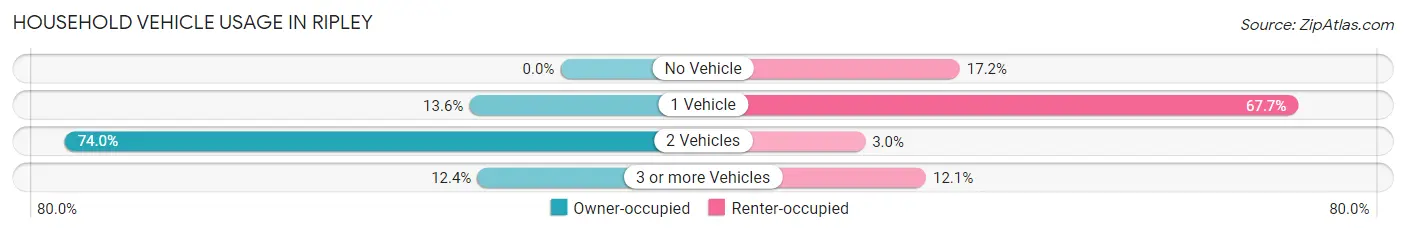
| Vehicles per Household | Owner-occupied | Renter-occupied |
| No Vehicle | 0 (0.0%) | 17 (17.2%) |
| 1 Vehicle | 34 (13.6%) | 67 (67.7%) |
| 2 Vehicles | 185 (74.0%) | 3 (3.0%) |
| 3 or more Vehicles | 31 (12.4%) | 12 (12.1%) |
| Total | 250 (100.0%) | 99 (100.0%) |
Real Estate & Mortgages in Ripley
Real Estate and Mortgage Overview in Ripley
| Characteristic | Without Mortgage | With Mortgage |
| Housing Units | 94 | 156 |
| Median Property Value | $62,100 | $98,000 |
| Median Household Income | $40,313 | $4 |
| Monthly Housing Costs | $420 | $0 |
| Real Estate Taxes | $1,568 | $0 |
Property Value by Mortgage Status in Ripley
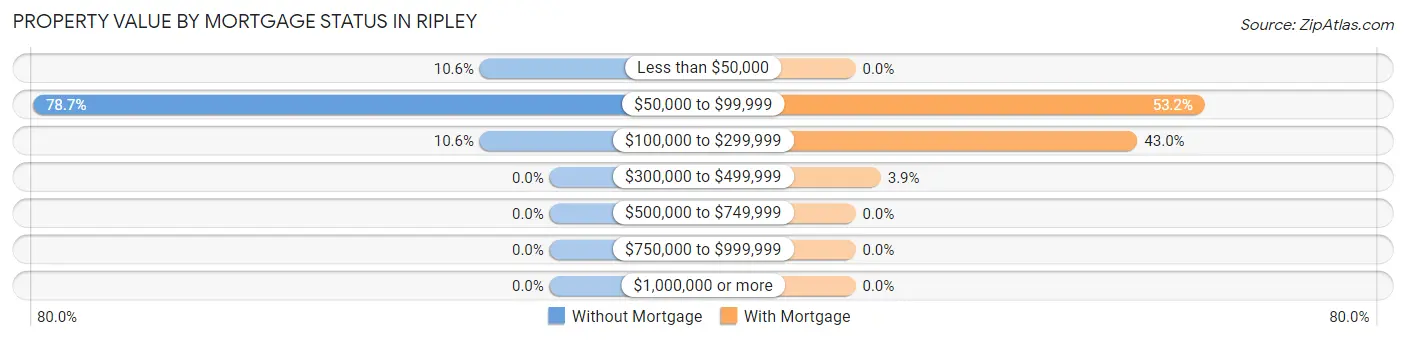
| Property Value | Without Mortgage | With Mortgage |
| Less than $50,000 | 10 (10.6%) | 0 (0.0%) |
| $50,000 to $99,999 | 74 (78.7%) | 83 (53.2%) |
| $100,000 to $299,999 | 10 (10.6%) | 67 (42.9%) |
| $300,000 to $499,999 | 0 (0.0%) | 6 (3.8%) |
| $500,000 to $749,999 | 0 (0.0%) | 0 (0.0%) |
| $750,000 to $999,999 | 0 (0.0%) | 0 (0.0%) |
| $1,000,000 or more | 0 (0.0%) | 0 (0.0%) |
| Total | 94 (100.0%) | 156 (100.0%) |
Household Income by Mortgage Status in Ripley
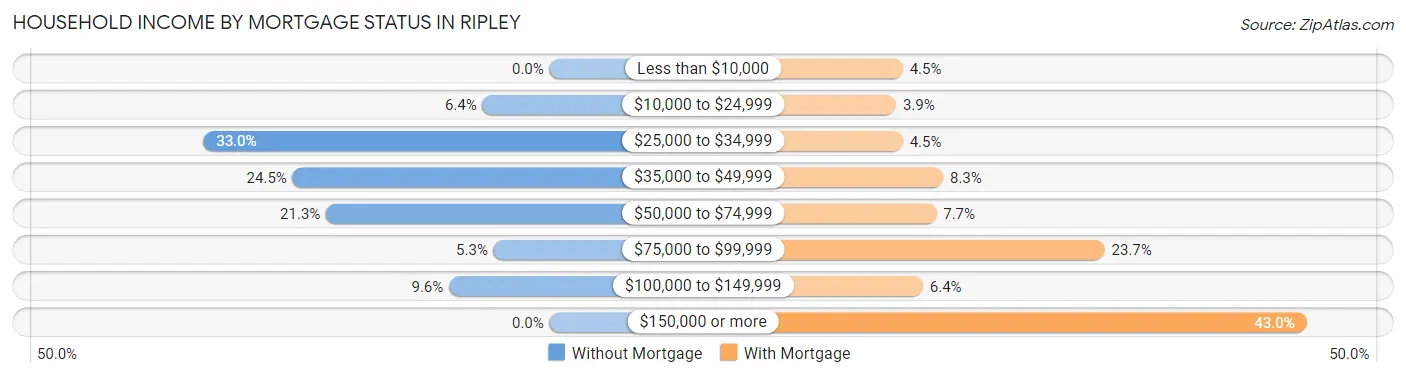
| Household Income | Without Mortgage | With Mortgage |
| Less than $10,000 | 0 (0.0%) | 7 (4.5%) |
| $10,000 to $24,999 | 6 (6.4%) | 6 (3.8%) |
| $25,000 to $34,999 | 31 (33.0%) | 7 (4.5%) |
| $35,000 to $49,999 | 23 (24.5%) | 13 (8.3%) |
| $50,000 to $74,999 | 20 (21.3%) | 12 (7.7%) |
| $75,000 to $99,999 | 5 (5.3%) | 37 (23.7%) |
| $100,000 to $149,999 | 9 (9.6%) | 10 (6.4%) |
| $150,000 or more | 0 (0.0%) | 67 (42.9%) |
| Total | 94 (100.0%) | 156 (100.0%) |
Property Value to Household Income Ratio in Ripley
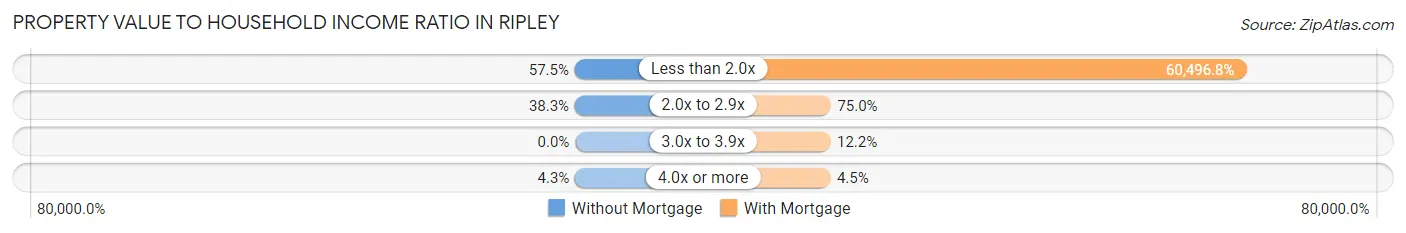
| Value-to-Income Ratio | Without Mortgage | With Mortgage |
| Less than 2.0x | 54 (57.5%) | 94,375 (60,496.8%) |
| 2.0x to 2.9x | 36 (38.3%) | 117 (75.0%) |
| 3.0x to 3.9x | 0 (0.0%) | 19 (12.2%) |
| 4.0x or more | 4 (4.3%) | 7 (4.5%) |
| Total | 94 (100.0%) | 156 (100.0%) |
Real Estate Taxes by Mortgage Status in Ripley
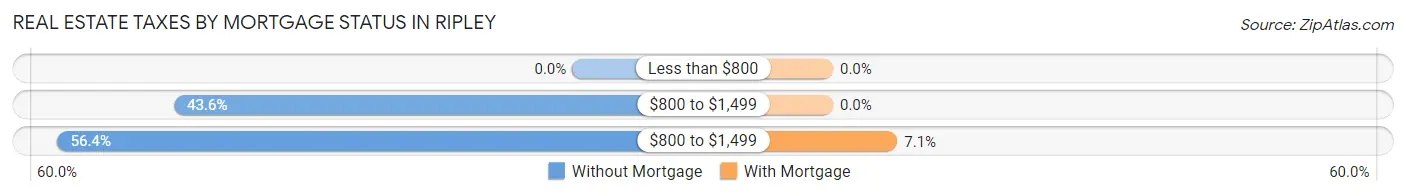
| Property Taxes | Without Mortgage | With Mortgage |
| Less than $800 | 0 (0.0%) | 0 (0.0%) |
| $800 to $1,499 | 41 (43.6%) | 0 (0.0%) |
| $800 to $1,499 | 53 (56.4%) | 11 (7.0%) |
| Total | 94 (100.0%) | 156 (100.0%) |
Health & Disability in Ripley
Health Insurance Coverage by Age in Ripley
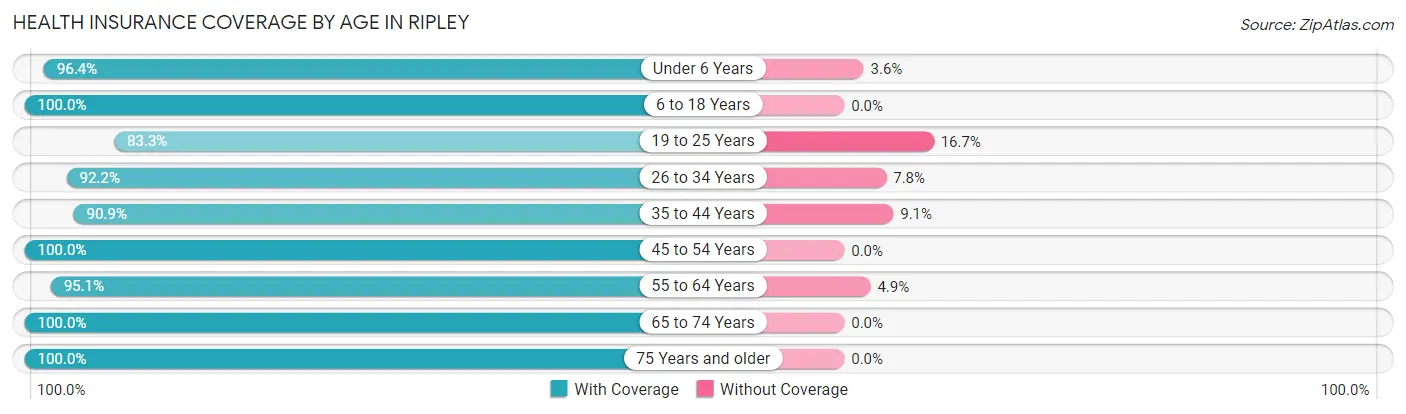
| Age Bracket | With Coverage | Without Coverage |
| Under 6 Years | 134 (96.4%) | 5 (3.6%) |
| 6 to 18 Years | 151 (100.0%) | 0 (0.0%) |
| 19 to 25 Years | 60 (83.3%) | 12 (16.7%) |
| 26 to 34 Years | 106 (92.2%) | 9 (7.8%) |
| 35 to 44 Years | 159 (90.9%) | 16 (9.1%) |
| 45 to 54 Years | 64 (100.0%) | 0 (0.0%) |
| 55 to 64 Years | 78 (95.1%) | 4 (4.9%) |
| 65 to 74 Years | 118 (100.0%) | 0 (0.0%) |
| 75 Years and older | 48 (100.0%) | 0 (0.0%) |
| Total | 918 (95.2%) | 46 (4.8%) |
Health Insurance Coverage by Citizenship Status in Ripley
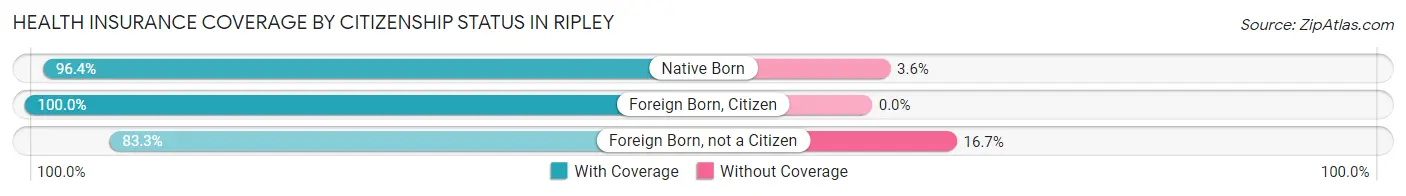
| Citizenship Status | With Coverage | Without Coverage |
| Native Born | 134 (96.4%) | 5 (3.6%) |
| Foreign Born, Citizen | 151 (100.0%) | 0 (0.0%) |
| Foreign Born, not a Citizen | 60 (83.3%) | 12 (16.7%) |
Health Insurance Coverage by Household Income in Ripley
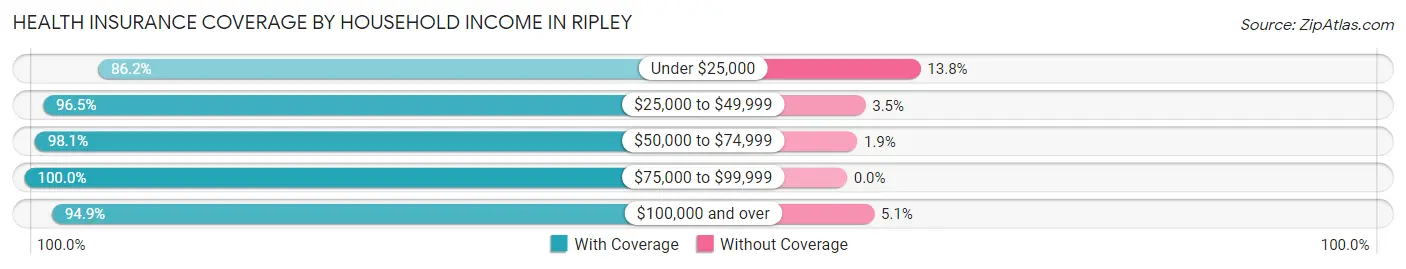
| Household Income | With Coverage | Without Coverage |
| Under $25,000 | 100 (86.2%) | 16 (13.8%) |
| $25,000 to $49,999 | 251 (96.5%) | 9 (3.5%) |
| $50,000 to $74,999 | 204 (98.1%) | 4 (1.9%) |
| $75,000 to $99,999 | 48 (100.0%) | 0 (0.0%) |
| $100,000 and over | 315 (94.9%) | 17 (5.1%) |
Public vs Private Health Insurance Coverage by Age in Ripley
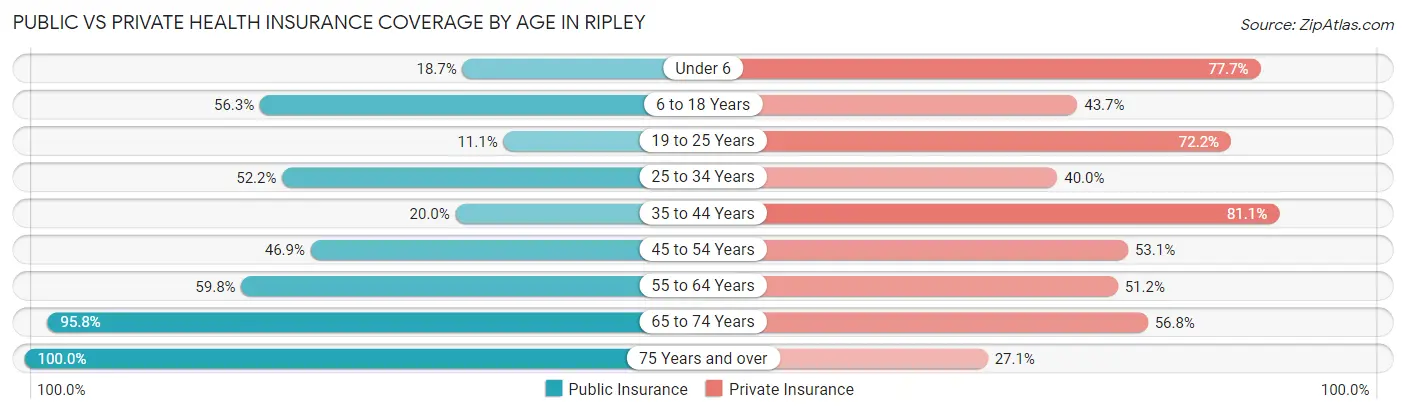
| Age Bracket | Public Insurance | Private Insurance |
| Under 6 | 26 (18.7%) | 108 (77.7%) |
| 6 to 18 Years | 85 (56.3%) | 66 (43.7%) |
| 19 to 25 Years | 8 (11.1%) | 52 (72.2%) |
| 25 to 34 Years | 60 (52.2%) | 46 (40.0%) |
| 35 to 44 Years | 35 (20.0%) | 142 (81.1%) |
| 45 to 54 Years | 30 (46.9%) | 34 (53.1%) |
| 55 to 64 Years | 49 (59.8%) | 42 (51.2%) |
| 65 to 74 Years | 113 (95.8%) | 67 (56.8%) |
| 75 Years and over | 48 (100.0%) | 13 (27.1%) |
| Total | 454 (47.1%) | 570 (59.1%) |
Disability Status by Sex by Age in Ripley
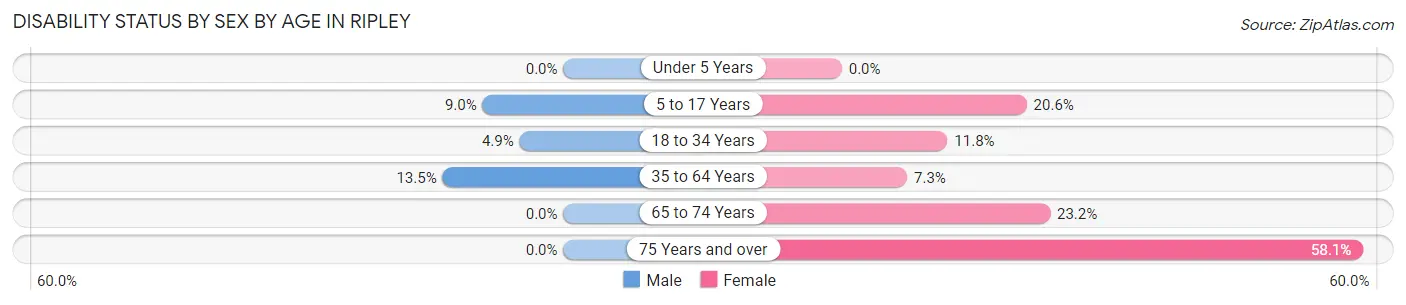
| Age Bracket | Male | Female |
| Under 5 Years | 0 (0.0%) | 0 (0.0%) |
| 5 to 17 Years | 9 (9.0%) | 21 (20.6%) |
| 18 to 34 Years | 4 (4.9%) | 14 (11.8%) |
| 35 to 64 Years | 21 (13.5%) | 12 (7.3%) |
| 65 to 74 Years | 0 (0.0%) | 16 (23.2%) |
| 75 Years and over | 0 (0.0%) | 18 (58.1%) |
Disability Class by Sex by Age in Ripley
Disability Class: Hearing Difficulty
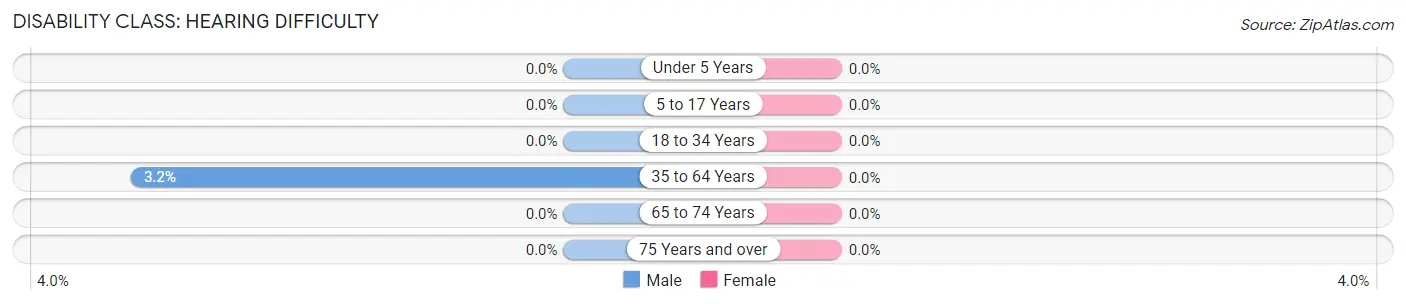
| Age Bracket | Male | Female |
| Under 5 Years | 0 (0.0%) | 0 (0.0%) |
| 5 to 17 Years | 0 (0.0%) | 0 (0.0%) |
| 18 to 34 Years | 0 (0.0%) | 0 (0.0%) |
| 35 to 64 Years | 5 (3.2%) | 0 (0.0%) |
| 65 to 74 Years | 0 (0.0%) | 0 (0.0%) |
| 75 Years and over | 0 (0.0%) | 0 (0.0%) |
Disability Class: Vision Difficulty
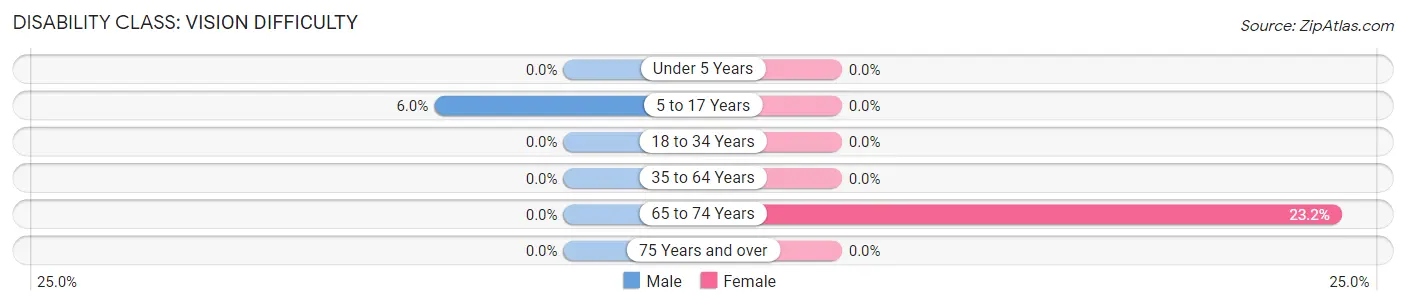
| Age Bracket | Male | Female |
| Under 5 Years | 0 (0.0%) | 0 (0.0%) |
| 5 to 17 Years | 6 (6.0%) | 0 (0.0%) |
| 18 to 34 Years | 0 (0.0%) | 0 (0.0%) |
| 35 to 64 Years | 0 (0.0%) | 0 (0.0%) |
| 65 to 74 Years | 0 (0.0%) | 16 (23.2%) |
| 75 Years and over | 0 (0.0%) | 0 (0.0%) |
Disability Class: Cognitive Difficulty
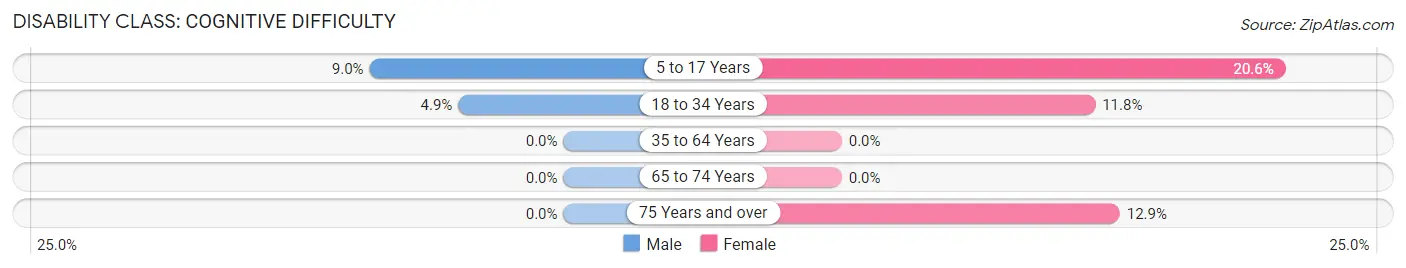
| Age Bracket | Male | Female |
| 5 to 17 Years | 9 (9.0%) | 21 (20.6%) |
| 18 to 34 Years | 4 (4.9%) | 14 (11.8%) |
| 35 to 64 Years | 0 (0.0%) | 0 (0.0%) |
| 65 to 74 Years | 0 (0.0%) | 0 (0.0%) |
| 75 Years and over | 0 (0.0%) | 4 (12.9%) |
Disability Class: Ambulatory Difficulty
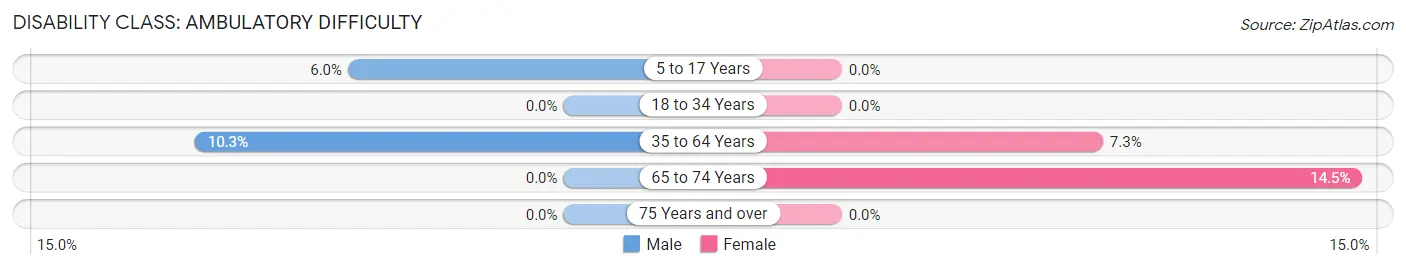
| Age Bracket | Male | Female |
| 5 to 17 Years | 6 (6.0%) | 0 (0.0%) |
| 18 to 34 Years | 0 (0.0%) | 0 (0.0%) |
| 35 to 64 Years | 16 (10.3%) | 12 (7.3%) |
| 65 to 74 Years | 0 (0.0%) | 10 (14.5%) |
| 75 Years and over | 0 (0.0%) | 0 (0.0%) |
Disability Class: Self-Care Difficulty
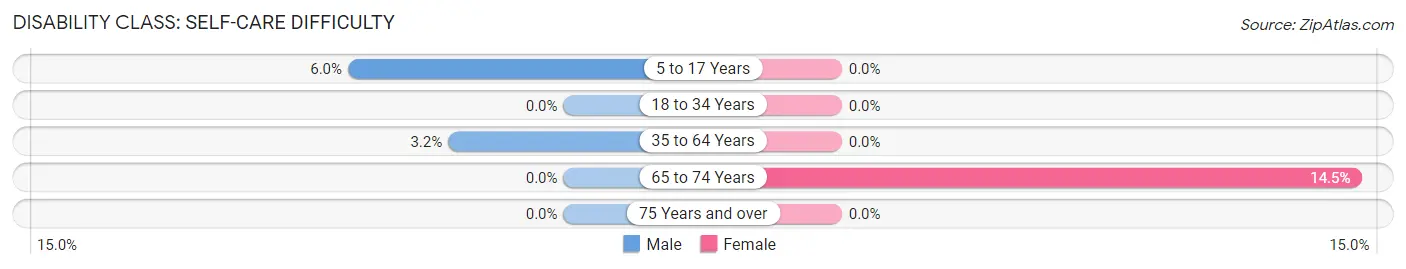
| Age Bracket | Male | Female |
| 5 to 17 Years | 6 (6.0%) | 0 (0.0%) |
| 18 to 34 Years | 0 (0.0%) | 0 (0.0%) |
| 35 to 64 Years | 5 (3.2%) | 0 (0.0%) |
| 65 to 74 Years | 0 (0.0%) | 10 (14.5%) |
| 75 Years and over | 0 (0.0%) | 0 (0.0%) |
Technology Access in Ripley
Computing Device Access in Ripley
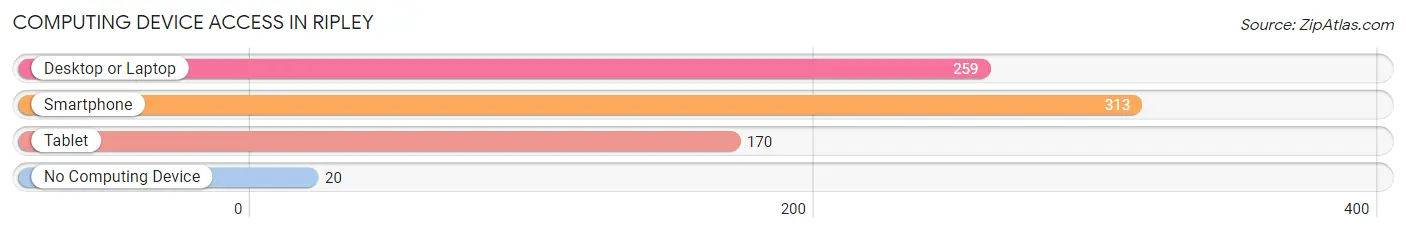
| Device Type | # Households | % Households |
| Desktop or Laptop | 259 | 74.2% |
| Smartphone | 313 | 89.7% |
| Tablet | 170 | 48.7% |
| No Computing Device | 20 | 5.7% |
| Total | 349 | 100.0% |
Internet Access in Ripley
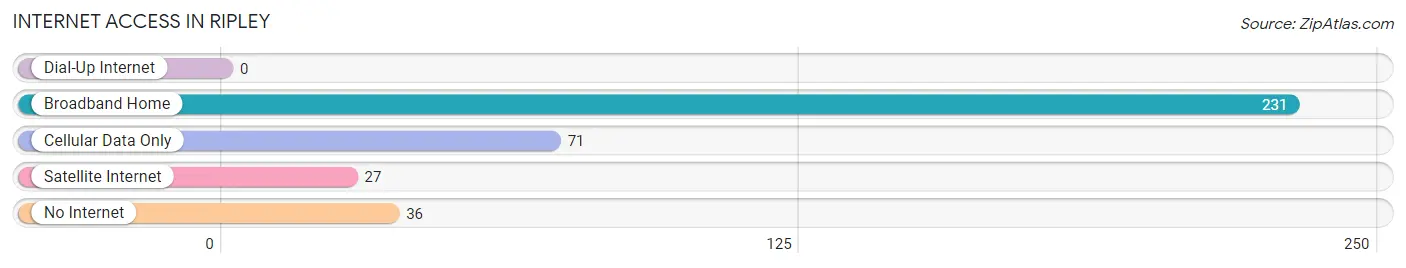
| Internet Type | # Households | % Households |
| Dial-Up Internet | 0 | 0.0% |
| Broadband Home | 231 | 66.2% |
| Cellular Data Only | 71 | 20.3% |
| Satellite Internet | 27 | 7.7% |
| No Internet | 36 | 10.3% |
| Total | 349 | 100.0% |
Ripley Summary
Ripley, New York is a small town located in Chautauqua County, in the western part of the state. It is situated on the shores of Lake Erie, and is part of the Buffalo-Niagara Falls metropolitan area. The town has a population of approximately 1,500 people, and is known for its rural charm and small-town atmosphere.
History
Ripley was first settled in 1811 by a group of settlers from Connecticut. The town was named after the Revolutionary War hero, Commodore Oliver Hazard Perry. The town was officially incorporated in 1821.
In the early 19th century, Ripley was a thriving agricultural community. The town was home to several mills, including a grist mill, a saw mill, and a woolen mill. The town also had a thriving shipbuilding industry, and was home to several shipyards.
In the late 19th century, Ripley began to experience a decline in its economy. The shipbuilding industry had declined, and the mills had closed. The town was also hit hard by the Great Depression.
Geography
Ripley is located in western New York, in Chautauqua County. It is situated on the shores of Lake Erie, and is part of the Buffalo-Niagara Falls metropolitan area. The town has a total area of 4.2 square miles, all of which is land.
The town is located in a rural area, and is surrounded by farmland. The town is also home to several small lakes, including Lake Ripley and Lake Chautauqua.
Economy
Ripley’s economy is largely based on agriculture and tourism. The town is home to several farms, which produce a variety of crops, including corn, soybeans, and wheat. The town is also home to several wineries, which produce a variety of wines.
Tourism is also an important part of the town’s economy. The town is home to several attractions, including the Ripley Historical Society Museum, the Ripley Opera House, and the Ripley Aquarium. The town also hosts several festivals throughout the year, including the Ripley Summer Festival and the Ripley Fall Festival.
Demographics
As of the 2010 census, Ripley had a population of 1,500 people. The racial makeup of the town was 97.3% White, 0.7% African American, 0.3% Native American, 0.3% Asian, and 1.3% from other races. Hispanic or Latino of any race were 1.3% of the population.
The median household income in Ripley was $41,250, and the median family income was $50,000. The per capita income in the town was $20,945. About 11.3% of families and 14.3% of the population were below the poverty line, including 18.3% of those under age 18 and 8.3% of those age 65 or over.
Common Questions
What is Per Capita Income in Ripley?
Per Capita income in Ripley is $23,929.
What is the Median Family Income in Ripley?
Median Family Income in Ripley is $54,000.
What is the Median Household income in Ripley?
Median Household Income in Ripley is $48,958.
What is Income or Wage Gap in Ripley?
Income or Wage Gap in Ripley is 51.3%.
Women in Ripley earn 48.7 cents for every dollar earned by a man.
What is Family Income Deficit in Ripley?
Family Income Deficit in Ripley is $12,819.
Families that are below poverty line in Ripley earn $12,819 less on average than the poverty threshold level.
What is Inequality or Gini Index in Ripley?
Inequality or Gini Index in Ripley is 0.38.
What is the Total Population of Ripley?
Total Population of Ripley is 964.
What is the Total Male Population of Ripley?
Total Male Population of Ripley is 458.
What is the Total Female Population of Ripley?
Total Female Population of Ripley is 506.
What is the Ratio of Males per 100 Females in Ripley?
There are 90.51 Males per 100 Females in Ripley.
What is the Ratio of Females per 100 Males in Ripley?
There are 110.48 Females per 100 Males in Ripley.
What is the Median Population Age in Ripley?
Median Population Age in Ripley is 36.1 Years.
What is the Average Family Size in Ripley
Average Family Size in Ripley is 3.1 People.
What is the Average Household Size in Ripley
Average Household Size in Ripley is 2.8 People.
How Large is the Labor Force in Ripley?
There are 430 People in the Labor Forcein in Ripley.
What is the Percentage of People in the Labor Force in Ripley?
58.8% of People are in the Labor Force in Ripley.
What is the Unemployment Rate in Ripley?
Unemployment Rate in Ripley is 2.1%.