Norfolk, NY Map & Demographics
Norfolk Map
Norfolk Overview
$27,210
PER CAPITA INCOME
$48,798
AVG FAMILY INCOME
$49,071
AVG HOUSEHOLD INCOME
56.0%
WAGE / INCOME GAP [ % ]
44.0¢/ $1
WAGE / INCOME GAP [ $ ]
0.38
INEQUALITY / GINI INDEX
869
TOTAL POPULATION
388
MALE POPULATION
481
FEMALE POPULATION
80.67
MALES / 100 FEMALES
123.97
FEMALES / 100 MALES
50.3
MEDIAN AGE
2.5
AVG FAMILY SIZE
2.1
AVG HOUSEHOLD SIZE
358
LABOR FORCE [ PEOPLE ]
50.8%
PERCENT IN LABOR FORCE
5.9%
UNEMPLOYMENT RATE
Norfolk Zip Codes
Norfolk Area Codes
Income in Norfolk
Income Overview in Norfolk
Per Capita Income in Norfolk is $27,210, while median incomes of families and households are $48,798 and $49,071 respectively.
| Characteristic | Number | Measure |
| Per Capita Income | 869 | $27,210 |
| Median Family Income | 273 | $48,798 |
| Mean Family Income | 273 | $60,619 |
| Median Household Income | 420 | $49,071 |
| Mean Household Income | 420 | $54,210 |
| Income Deficit | 273 | $0 |
| Wage / Income Gap (%) | 869 | 56.01% |
| Wage / Income Gap ($) | 869 | 43.99¢ per $1 |
| Gini / Inequality Index | 869 | 0.38 |
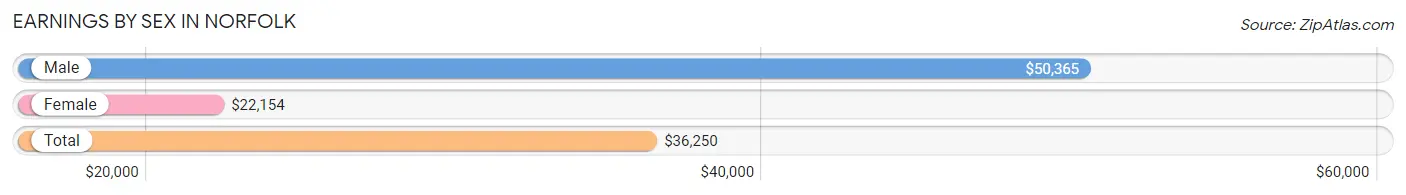
Earnings by Sex in Norfolk
Average Earnings in Norfolk are $36,250, $50,365 for men and $22,154 for women, a difference of 56.0%.
| Sex | Number | Average Earnings |
| Male | 185 (51.7%) | $50,365 |
| Female | 173 (48.3%) | $22,154 |
| Total | 358 (100.0%) | $36,250 |
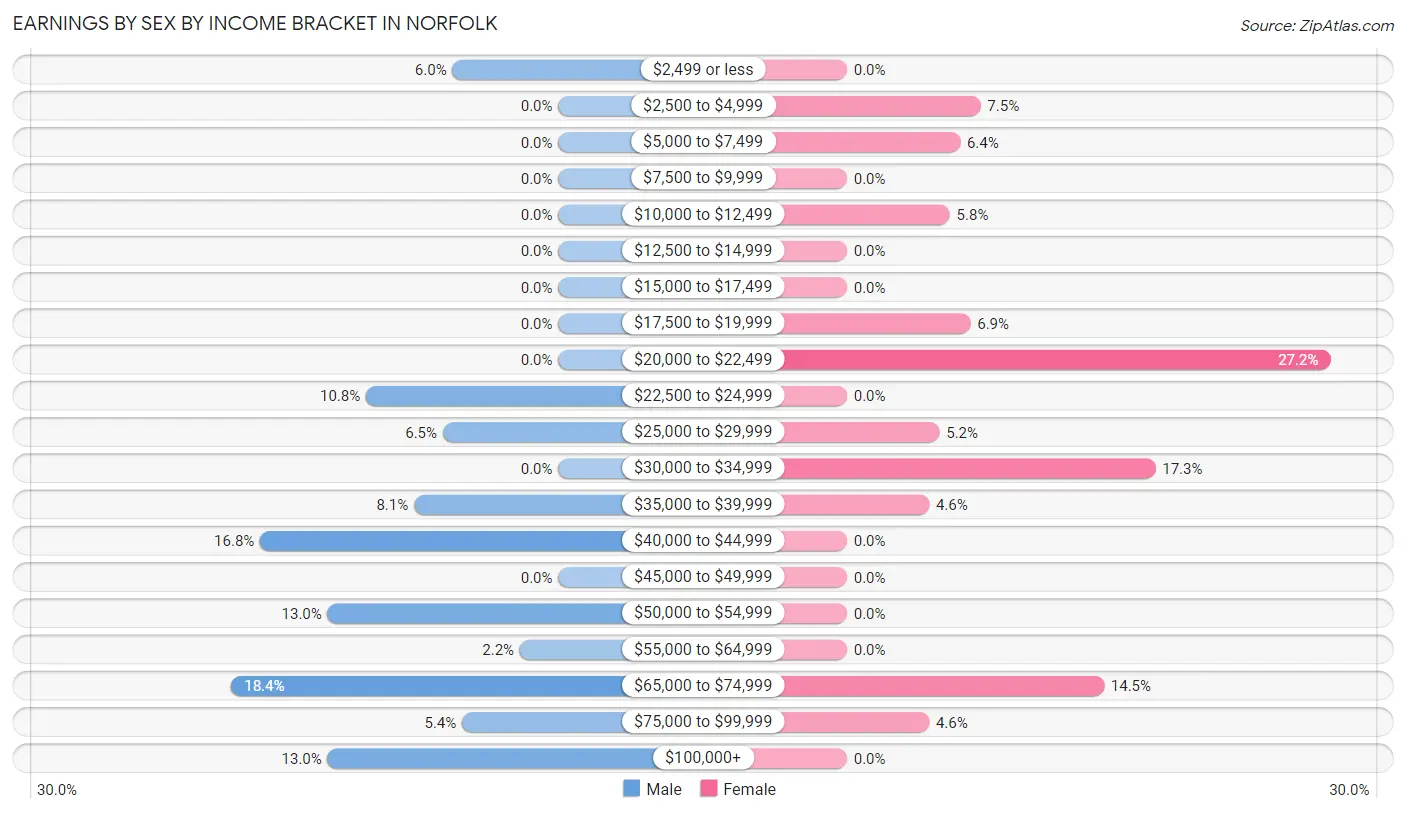
Earnings by Sex by Income Bracket in Norfolk
The most common earnings brackets in Norfolk are $65,000 to $74,999 for men (34 | 18.4%) and $20,000 to $22,499 for women (47 | 27.2%).
| Income | Male | Female |
| $2,499 or less | 11 (5.9%) | 0 (0.0%) |
| $2,500 to $4,999 | 0 (0.0%) | 13 (7.5%) |
| $5,000 to $7,499 | 0 (0.0%) | 11 (6.4%) |
| $7,500 to $9,999 | 0 (0.0%) | 0 (0.0%) |
| $10,000 to $12,499 | 0 (0.0%) | 10 (5.8%) |
| $12,500 to $14,999 | 0 (0.0%) | 0 (0.0%) |
| $15,000 to $17,499 | 0 (0.0%) | 0 (0.0%) |
| $17,500 to $19,999 | 0 (0.0%) | 12 (6.9%) |
| $20,000 to $22,499 | 0 (0.0%) | 47 (27.2%) |
| $22,500 to $24,999 | 20 (10.8%) | 0 (0.0%) |
| $25,000 to $29,999 | 12 (6.5%) | 9 (5.2%) |
| $30,000 to $34,999 | 0 (0.0%) | 30 (17.3%) |
| $35,000 to $39,999 | 15 (8.1%) | 8 (4.6%) |
| $40,000 to $44,999 | 31 (16.8%) | 0 (0.0%) |
| $45,000 to $49,999 | 0 (0.0%) | 0 (0.0%) |
| $50,000 to $54,999 | 24 (13.0%) | 0 (0.0%) |
| $55,000 to $64,999 | 4 (2.2%) | 0 (0.0%) |
| $65,000 to $74,999 | 34 (18.4%) | 25 (14.4%) |
| $75,000 to $99,999 | 10 (5.4%) | 8 (4.6%) |
| $100,000+ | 24 (13.0%) | 0 (0.0%) |
| Total | 185 (100.0%) | 173 (100.0%) |
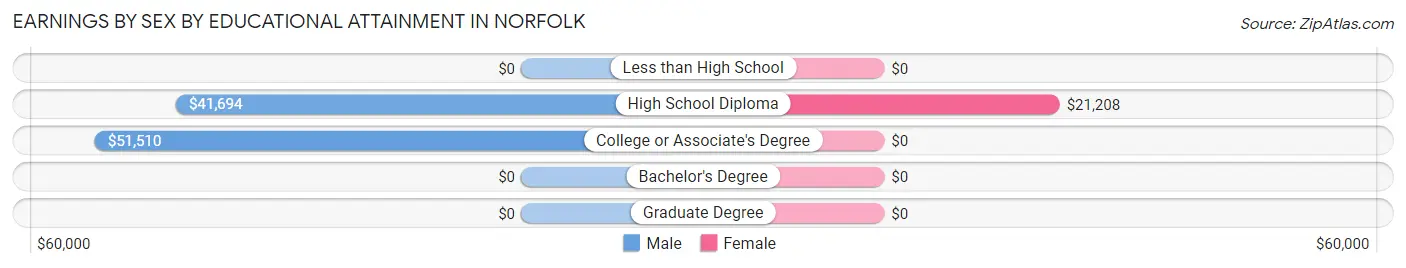
Earnings by Sex by Educational Attainment in Norfolk
Average earnings in Norfolk are $50,469 for men and $25,556 for women, a difference of 49.4%. Men with an educational attainment of college or associate's degree enjoy the highest average annual earnings of $51,510, while those with high school diploma education earn the least with $41,694. Women with an educational attainment of high school diploma earn the most with the average annual earnings of $21,208, while those with high school diploma education have the smallest earnings of $21,208.
| Educational Attainment | Male Income | Female Income |
| Less than High School | - | - |
| High School Diploma | $41,694 | $21,208 |
| College or Associate's Degree | $51,510 | $0 |
| Bachelor's Degree | - | - |
| Graduate Degree | - | - |
| Total | $50,469 | $25,556 |
Family Income in Norfolk
Family Income Brackets in Norfolk
According to the Norfolk family income data, there are 63 families falling into the $25,000 to $34,999 income range, which is the most common income bracket and makes up 23.1% of all families.
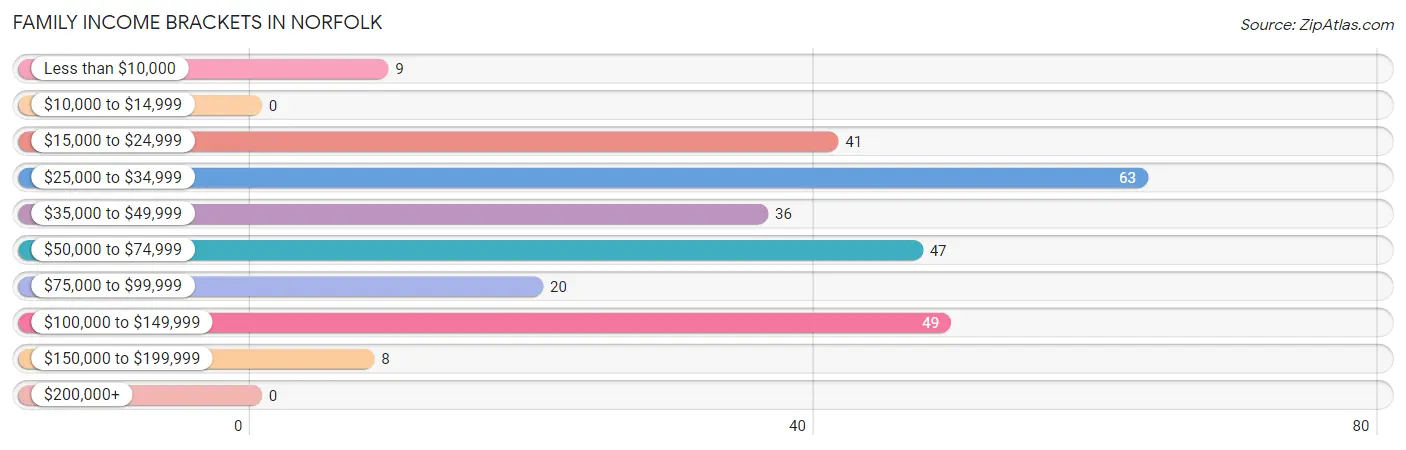
| Income Bracket | # Families | % Families |
| Less than $10,000 | 9 | 3.3% |
| $10,000 to $14,999 | 0 | 0.0% |
| $15,000 to $24,999 | 41 | 15.0% |
| $25,000 to $34,999 | 63 | 23.1% |
| $35,000 to $49,999 | 36 | 13.2% |
| $50,000 to $74,999 | 47 | 17.2% |
| $75,000 to $99,999 | 20 | 7.3% |
| $100,000 to $149,999 | 49 | 17.9% |
| $150,000 to $199,999 | 8 | 2.9% |
| $200,000+ | 0 | 0.0% |
Family Income by Famaliy Size in Norfolk
2-person families (194 | 71.1%) account for the highest median family income in Norfolk with $48,942 per family, while 2-person families (194 | 71.1%) have the highest median income of $24,471 per family member.
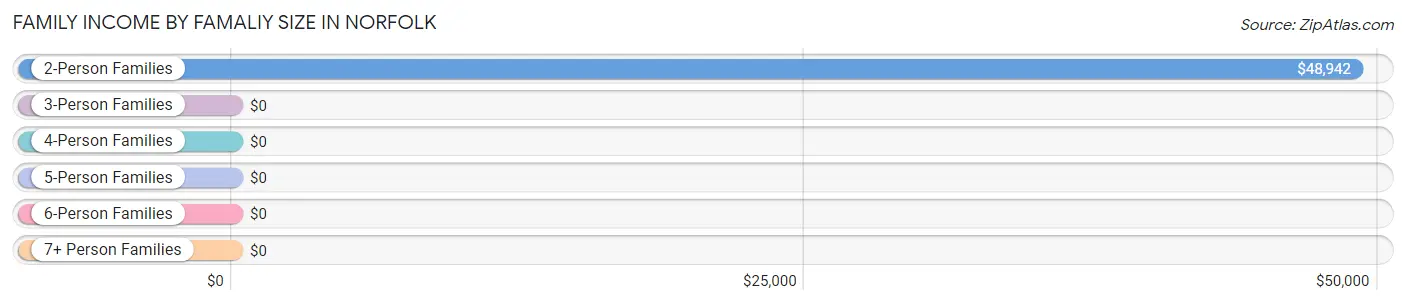
| Income Bracket | # Families | Median Income |
| 2-Person Families | 194 (71.1%) | $48,942 |
| 3-Person Families | 55 (20.2%) | $0 |
| 4-Person Families | 8 (2.9%) | $0 |
| 5-Person Families | 12 (4.4%) | $0 |
| 6-Person Families | 4 (1.5%) | $0 |
| 7+ Person Families | 0 (0.0%) | $0 |
| Total | 273 (100.0%) | $48,798 |
Family Income by Number of Earners in Norfolk
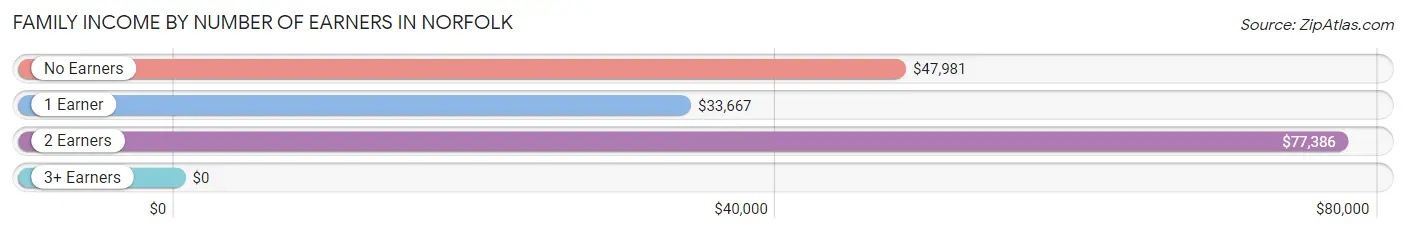
| Number of Earners | # Families | Median Income |
| No Earners | 76 (27.8%) | $47,981 |
| 1 Earner | 128 (46.9%) | $33,667 |
| 2 Earners | 69 (25.3%) | $77,386 |
| 3+ Earners | 0 (0.0%) | $0 |
| Total | 273 (100.0%) | $48,798 |
Household Income in Norfolk
Household Income Brackets in Norfolk
With 111 households falling in the category, the $50,000 to $74,999 income range is the most frequent in Norfolk, accounting for 26.4% of all households.
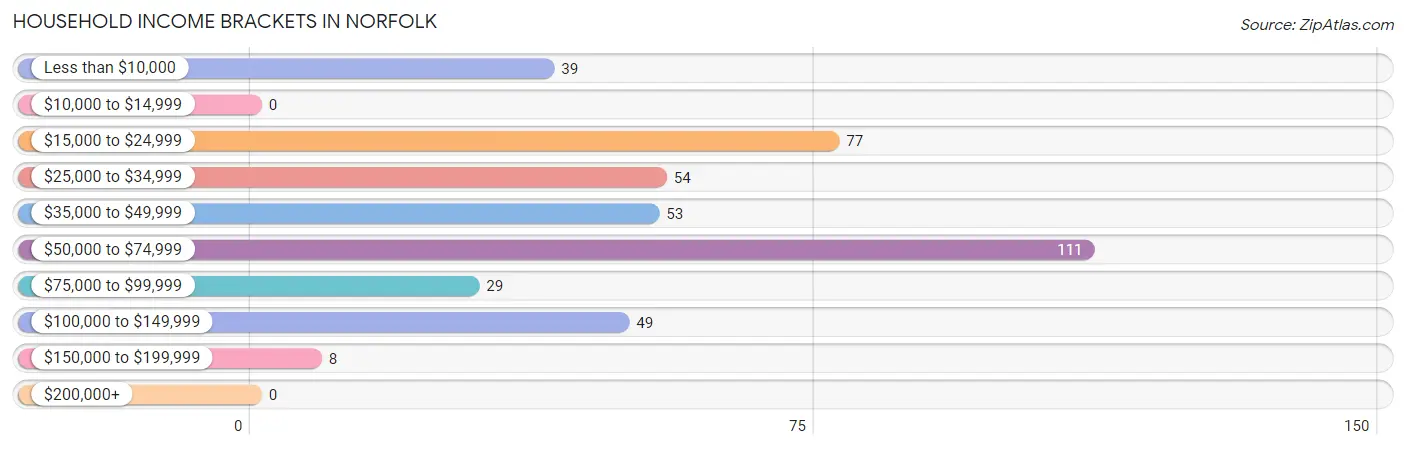
| Income Bracket | # Households | % Households |
| Less than $10,000 | 39 | 9.3% |
| $10,000 to $14,999 | 0 | 0.0% |
| $15,000 to $24,999 | 77 | 18.3% |
| $25,000 to $34,999 | 54 | 12.9% |
| $35,000 to $49,999 | 53 | 12.6% |
| $50,000 to $74,999 | 111 | 26.4% |
| $75,000 to $99,999 | 29 | 6.9% |
| $100,000 to $149,999 | 49 | 11.7% |
| $150,000 to $199,999 | 8 | 1.9% |
| $200,000+ | 0 | 0.0% |
Household Income by Householder Age in Norfolk
The median household income in Norfolk is $49,071, with the highest median household income of $48,990 found in the 65+ years age bracket for the primary householder. A total of 165 households (39.3%) fall into this category. Meanwhile, the 15 to 24 years age bracket for the primary householder has the lowest median household income of $0, with 28 households (6.7%) in this group.
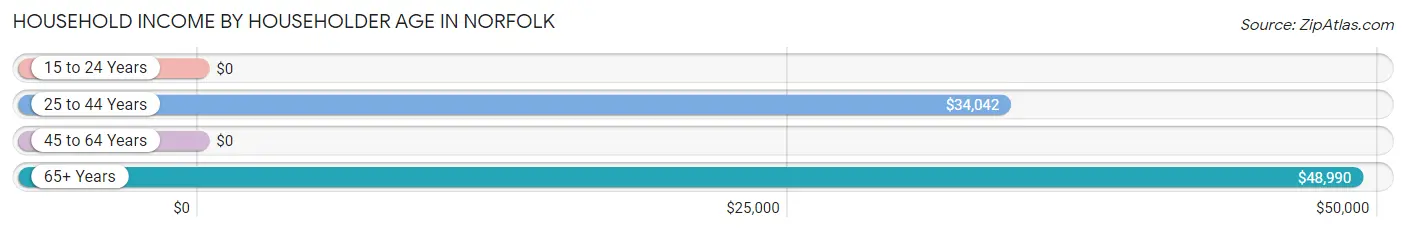
| Income Bracket | # Households | Median Income |
| 15 to 24 Years | 28 (6.7%) | $0 |
| 25 to 44 Years | 97 (23.1%) | $34,042 |
| 45 to 64 Years | 130 (30.9%) | $0 |
| 65+ Years | 165 (39.3%) | $48,990 |
| Total | 420 (100.0%) | $49,071 |
Poverty in Norfolk
Income Below Poverty by Sex and Age in Norfolk
With 13.1% poverty level for males and 7.3% for females among the residents of Norfolk, 16 and 17 year old males and 35 to 44 year old females are the most vulnerable to poverty, with 10 males (100.0%) and 11 females (57.9%) in their respective age groups living below the poverty level.
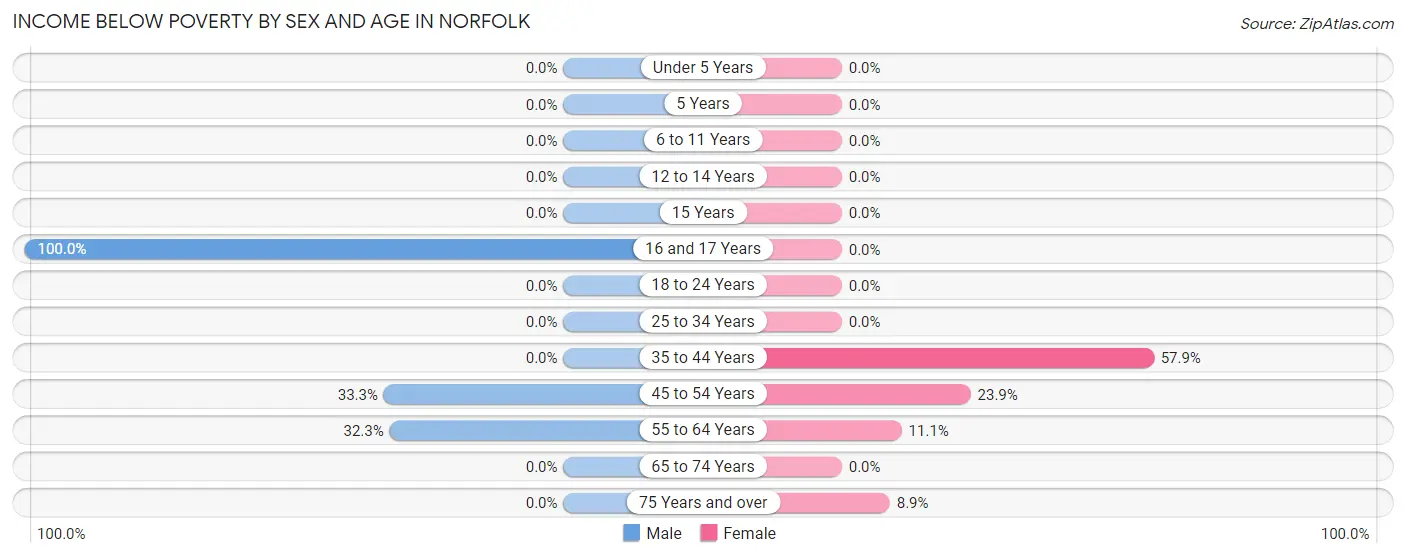
| Age Bracket | Male | Female |
| Under 5 Years | 0 (0.0%) | 0 (0.0%) |
| 5 Years | 0 (0.0%) | 0 (0.0%) |
| 6 to 11 Years | 0 (0.0%) | 0 (0.0%) |
| 12 to 14 Years | 0 (0.0%) | 0 (0.0%) |
| 15 Years | 0 (0.0%) | 0 (0.0%) |
| 16 and 17 Years | 10 (100.0%) | 0 (0.0%) |
| 18 to 24 Years | 0 (0.0%) | 0 (0.0%) |
| 25 to 34 Years | 0 (0.0%) | 0 (0.0%) |
| 35 to 44 Years | 0 (0.0%) | 11 (57.9%) |
| 45 to 54 Years | 11 (33.3%) | 11 (23.9%) |
| 55 to 64 Years | 30 (32.3%) | 4 (11.1%) |
| 65 to 74 Years | 0 (0.0%) | 0 (0.0%) |
| 75 Years and over | 0 (0.0%) | 9 (8.9%) |
| Total | 51 (13.1%) | 35 (7.3%) |
Income Above Poverty by Sex and Age in Norfolk
According to the poverty statistics in Norfolk, males aged under 5 years and females aged under 5 years are the age groups that are most secure financially, with 100.0% of males and 100.0% of females in these age groups living above the poverty line.
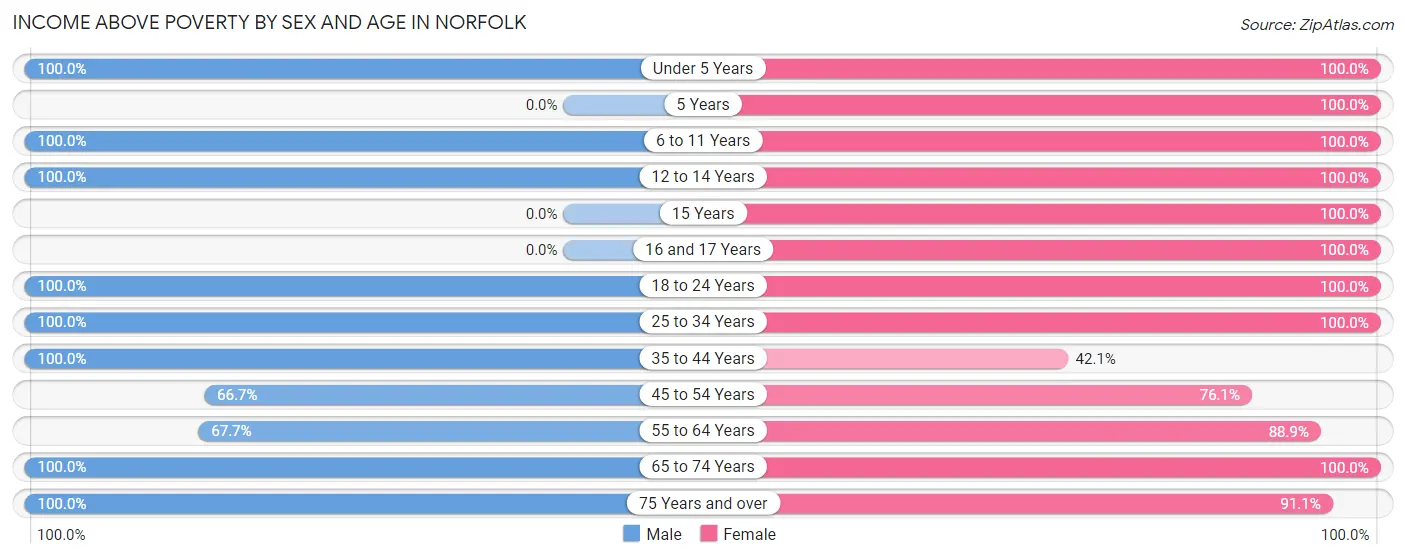
| Age Bracket | Male | Female |
| Under 5 Years | 33 (100.0%) | 10 (100.0%) |
| 5 Years | 0 (0.0%) | 20 (100.0%) |
| 6 to 11 Years | 10 (100.0%) | 9 (100.0%) |
| 12 to 14 Years | 39 (100.0%) | 15 (100.0%) |
| 15 Years | 0 (0.0%) | 28 (100.0%) |
| 16 and 17 Years | 0 (0.0%) | 10 (100.0%) |
| 18 to 24 Years | 28 (100.0%) | 17 (100.0%) |
| 25 to 34 Years | 41 (100.0%) | 98 (100.0%) |
| 35 to 44 Years | 10 (100.0%) | 8 (42.1%) |
| 45 to 54 Years | 22 (66.7%) | 35 (76.1%) |
| 55 to 64 Years | 63 (67.7%) | 32 (88.9%) |
| 65 to 74 Years | 56 (100.0%) | 72 (100.0%) |
| 75 Years and over | 35 (100.0%) | 92 (91.1%) |
| Total | 337 (86.9%) | 446 (92.7%) |
Income Below Poverty Among Married-Couple Families in Norfolk
The poverty statistics for married-couple families in Norfolk show that 8.1% or 11 of the total 136 families live below the poverty line. Families with 1 or 2 children have the highest poverty rate of 57.9%, comprising of 11 families. On the other hand, families with no children have the lowest poverty rate of 0.0%, which includes 0 families.
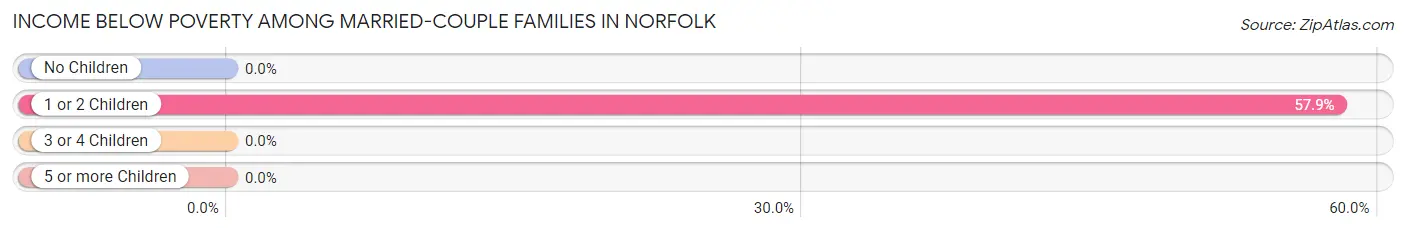
| Children | Above Poverty | Below Poverty |
| No Children | 101 (100.0%) | 0 (0.0%) |
| 1 or 2 Children | 8 (42.1%) | 11 (57.9%) |
| 3 or 4 Children | 16 (100.0%) | 0 (0.0%) |
| 5 or more Children | 0 (0.0%) | 0 (0.0%) |
| Total | 125 (91.9%) | 11 (8.1%) |
Income Below Poverty Among Single-Parent Households in Norfolk
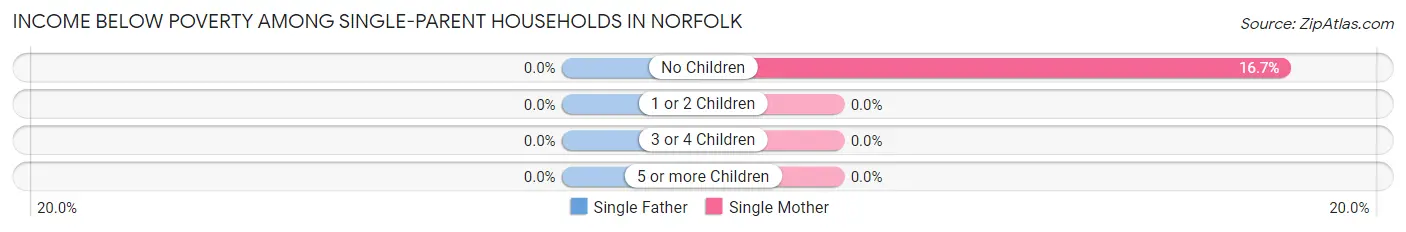
| Children | Single Father | Single Mother |
| No Children | 0 (0.0%) | 9 (16.7%) |
| 1 or 2 Children | 0 (0.0%) | 0 (0.0%) |
| 3 or 4 Children | 0 (0.0%) | 0 (0.0%) |
| 5 or more Children | 0 (0.0%) | 0 (0.0%) |
| Total | 0 (0.0%) | 9 (6.6%) |
Income Below Poverty Among Married-Couple vs Single-Parent Households in Norfolk
The poverty data for Norfolk shows that 11 of the married-couple family households (8.1%) and 9 of the single-parent households (6.6%) are living below the poverty level. Within the married-couple family households, those with 1 or 2 children have the highest poverty rate, with 11 households (57.9%) falling below the poverty line. Among the single-parent households, those with no children have the highest poverty rate, with 9 household (16.7%) living below poverty.
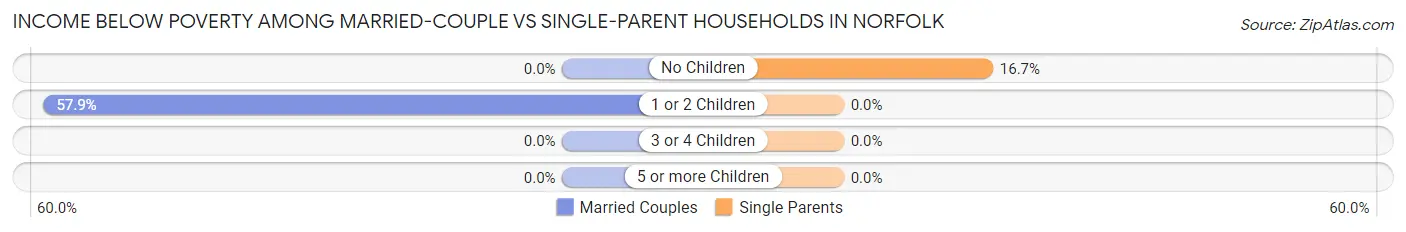
| Children | Married-Couple Families | Single-Parent Households |
| No Children | 0 (0.0%) | 9 (16.7%) |
| 1 or 2 Children | 11 (57.9%) | 0 (0.0%) |
| 3 or 4 Children | 0 (0.0%) | 0 (0.0%) |
| 5 or more Children | 0 (0.0%) | 0 (0.0%) |
| Total | 11 (8.1%) | 9 (6.6%) |
Race in Norfolk
The most populous races in Norfolk are White / Caucasian (798 | 91.8%), Black / African American (46 | 5.3%), and Two or more Races (25 | 2.9%).
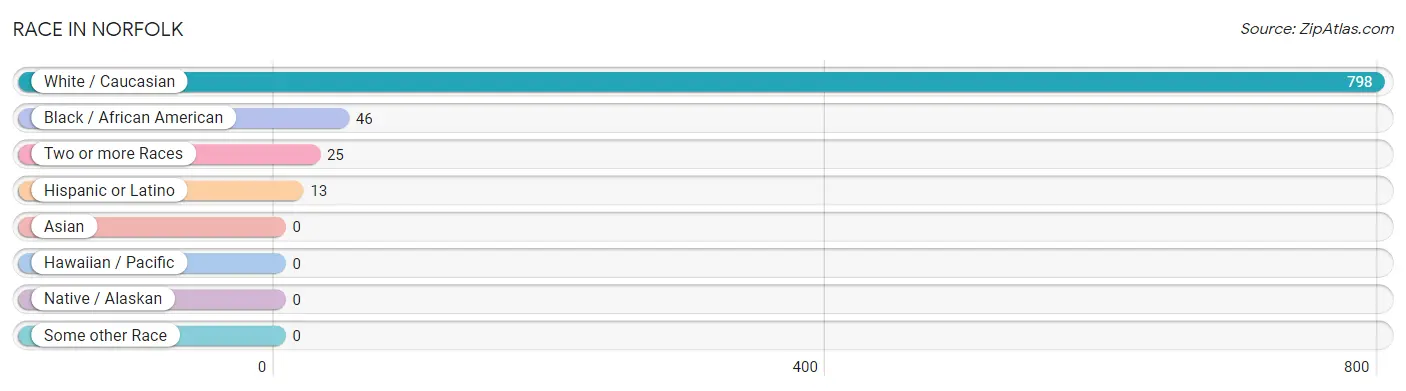
| Race | # Population | % Population |
| Asian | 0 | 0.0% |
| Black / African American | 46 | 5.3% |
| Hawaiian / Pacific | 0 | 0.0% |
| Hispanic or Latino | 13 | 1.5% |
| Native / Alaskan | 0 | 0.0% |
| White / Caucasian | 798 | 91.8% |
| Two or more Races | 25 | 2.9% |
| Some other Race | 0 | 0.0% |
| Total | 869 | 100.0% |
Ancestry in Norfolk
The most populous ancestries reported in Norfolk are American (168 | 19.3%), French (168 | 19.3%), English (114 | 13.1%), Irish (112 | 12.9%), and German (75 | 8.6%), together accounting for 73.3% of all Norfolk residents.
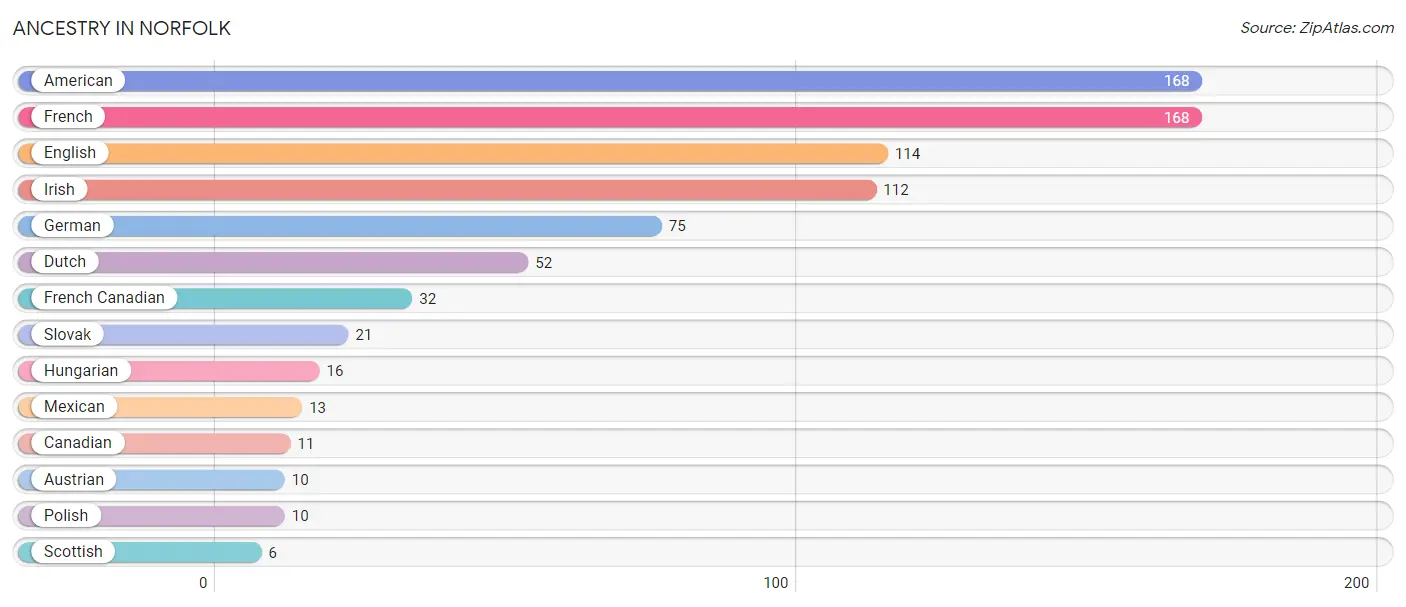
| Ancestry | # Population | % Population |
| American | 168 | 19.3% |
| Austrian | 10 | 1.1% |
| Canadian | 11 | 1.3% |
| Dutch | 52 | 6.0% |
| English | 114 | 13.1% |
| French | 168 | 19.3% |
| French Canadian | 32 | 3.7% |
| German | 75 | 8.6% |
| Hungarian | 16 | 1.8% |
| Irish | 112 | 12.9% |
| Mexican | 13 | 1.5% |
| Polish | 10 | 1.1% |
| Scottish | 6 | 0.7% |
| Slovak | 21 | 2.4% | View All 14 Rows |
Immigrants in Norfolk
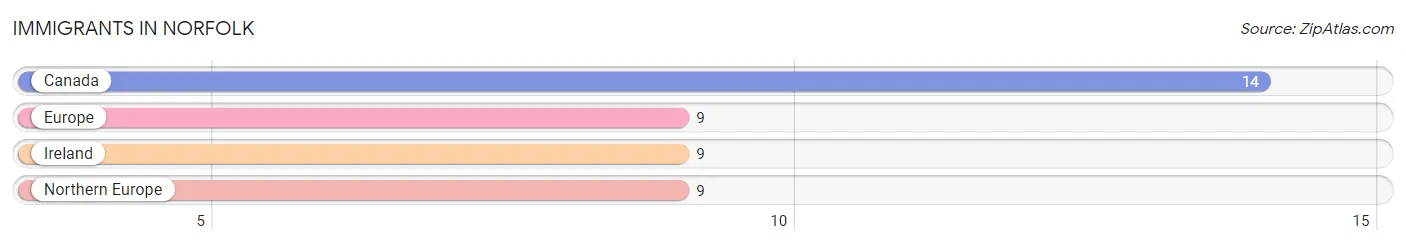
The most numerous immigrant groups reported in Norfolk came from Canada (14 | 1.6%), Europe (9 | 1.0%), Ireland (9 | 1.0%), and Northern Europe (9 | 1.0%), together accounting for 4.7% of all Norfolk residents.
| Immigration Origin | # Population | % Population |
| Canada | 14 | 1.6% |
| Europe | 9 | 1.0% |
| Ireland | 9 | 1.0% |
| Northern Europe | 9 | 1.0% | View All 4 Rows |
Sex and Age in Norfolk
Sex and Age in Norfolk
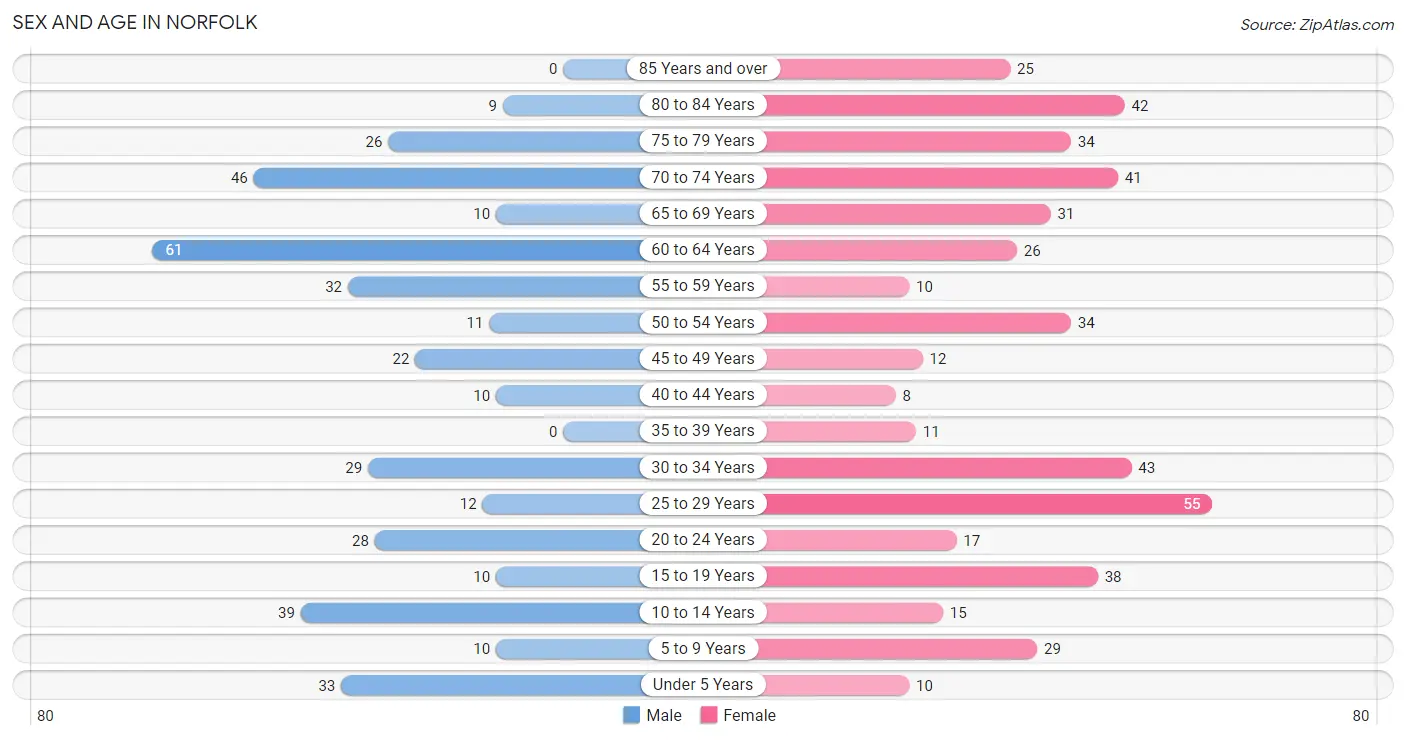
The most populous age groups in Norfolk are 60 to 64 Years (61 | 15.7%) for men and 25 to 29 Years (55 | 11.4%) for women.
| Age Bracket | Male | Female |
| Under 5 Years | 33 (8.5%) | 10 (2.1%) |
| 5 to 9 Years | 10 (2.6%) | 29 (6.0%) |
| 10 to 14 Years | 39 (10.1%) | 15 (3.1%) |
| 15 to 19 Years | 10 (2.6%) | 38 (7.9%) |
| 20 to 24 Years | 28 (7.2%) | 17 (3.5%) |
| 25 to 29 Years | 12 (3.1%) | 55 (11.4%) |
| 30 to 34 Years | 29 (7.5%) | 43 (8.9%) |
| 35 to 39 Years | 0 (0.0%) | 11 (2.3%) |
| 40 to 44 Years | 10 (2.6%) | 8 (1.7%) |
| 45 to 49 Years | 22 (5.7%) | 12 (2.5%) |
| 50 to 54 Years | 11 (2.8%) | 34 (7.1%) |
| 55 to 59 Years | 32 (8.3%) | 10 (2.1%) |
| 60 to 64 Years | 61 (15.7%) | 26 (5.4%) |
| 65 to 69 Years | 10 (2.6%) | 31 (6.4%) |
| 70 to 74 Years | 46 (11.9%) | 41 (8.5%) |
| 75 to 79 Years | 26 (6.7%) | 34 (7.1%) |
| 80 to 84 Years | 9 (2.3%) | 42 (8.7%) |
| 85 Years and over | 0 (0.0%) | 25 (5.2%) |
| Total | 388 (100.0%) | 481 (100.0%) |
Families and Households in Norfolk
Median Family Size in Norfolk
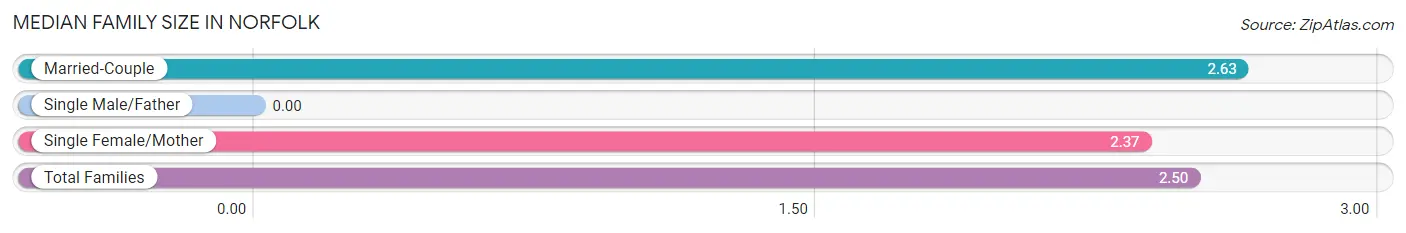
| Family Type | # Families | Family Size |
| Married-Couple | 136 (49.8%) | 2.63 |
| Single Male/Father | 0 (0.0%) | - |
| Single Female/Mother | 137 (50.2%) | 2.37 |
| Total Families | 273 (100.0%) | 2.50 |
Median Household Size in Norfolk
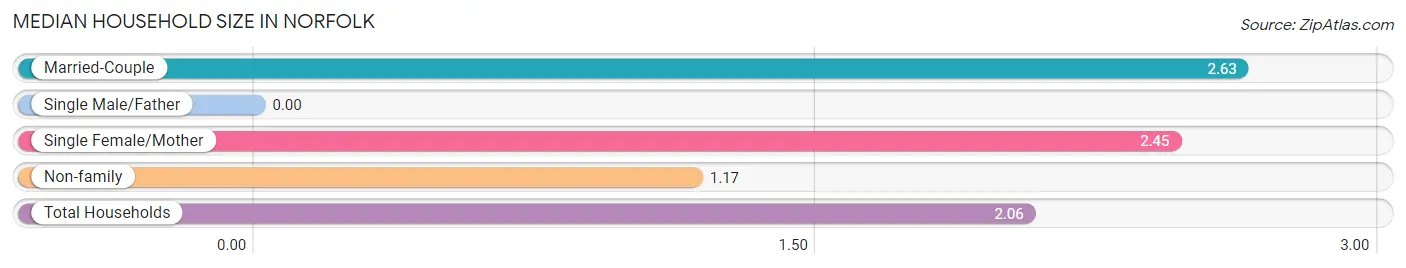
| Household Type | # Households | Household Size |
| Married-Couple | 136 (32.4%) | 2.63 |
| Single Male/Father | 0 (0.0%) | - |
| Single Female/Mother | 137 (32.6%) | 2.45 |
| Non-family | 147 (35.0%) | 1.17 |
| Total Households | 420 (100.0%) | 2.06 |
Household Size by Marriage Status in Norfolk
Out of a total of 420 households in Norfolk, 273 (65.0%) are family households, while 147 (35.0%) are nonfamily households. The most numerous type of family households are 2-person households, comprising 185, and the most common type of nonfamily households are 1-person households, comprising 123.
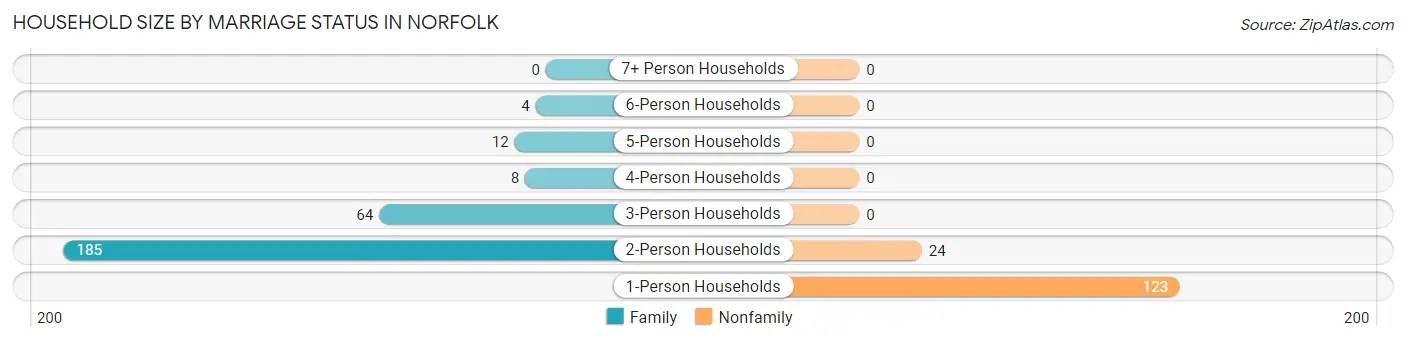
| Household Size | Family Households | Nonfamily Households |
| 1-Person Households | - | 123 (29.3%) |
| 2-Person Households | 185 (44.1%) | 24 (5.7%) |
| 3-Person Households | 64 (15.2%) | 0 (0.0%) |
| 4-Person Households | 8 (1.9%) | 0 (0.0%) |
| 5-Person Households | 12 (2.9%) | 0 (0.0%) |
| 6-Person Households | 4 (0.9%) | 0 (0.0%) |
| 7+ Person Households | 0 (0.0%) | 0 (0.0%) |
| Total | 273 (65.0%) | 147 (35.0%) |
Female Fertility in Norfolk
Fertility by Age in Norfolk
Average fertility rate in Norfolk is 185.0 births per 1,000 women. Women in the age bracket of 20 to 34 years have the highest fertility rate with 313.0 births per 1,000 women. Women in the age bracket of 20 to 34 years acount for 100.0% of all women with births.
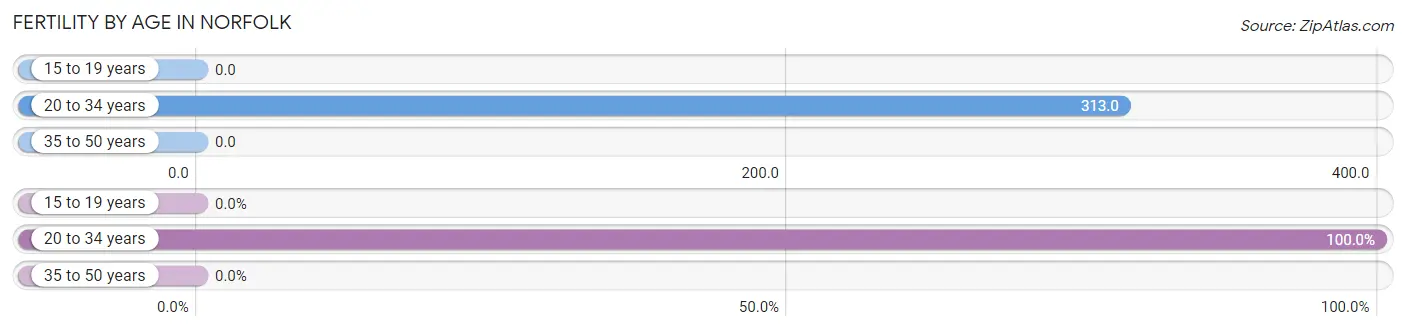
| Age Bracket | Women with Births | Births / 1,000 Women |
| 15 to 19 years | 0 (0.0%) | 0.0 |
| 20 to 34 years | 36 (100.0%) | 313.0 |
| 35 to 50 years | 0 (0.0%) | 0.0 |
| Total | 36 (100.0%) | 185.0 |
Fertility by Age by Marriage Status in Norfolk
16.7% of women with births (36) in Norfolk are married. The highest percentage of unmarried women with births falls into 20 to 34 years age bracket with 83.3% of them unmarried at the time of birth, while the lowest percentage of unmarried women with births belong to 20 to 34 years age bracket with 83.3% of them unmarried.
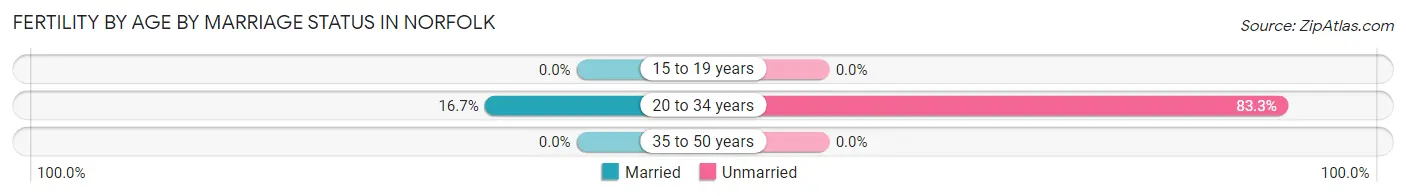
| Age Bracket | Married | Unmarried |
| 15 to 19 years | 0 (0.0%) | 0 (0.0%) |
| 20 to 34 years | 6 (16.7%) | 30 (83.3%) |
| 35 to 50 years | 0 (0.0%) | 0 (0.0%) |
| Total | 6 (16.7%) | 30 (83.3%) |
Fertility by Education in Norfolk
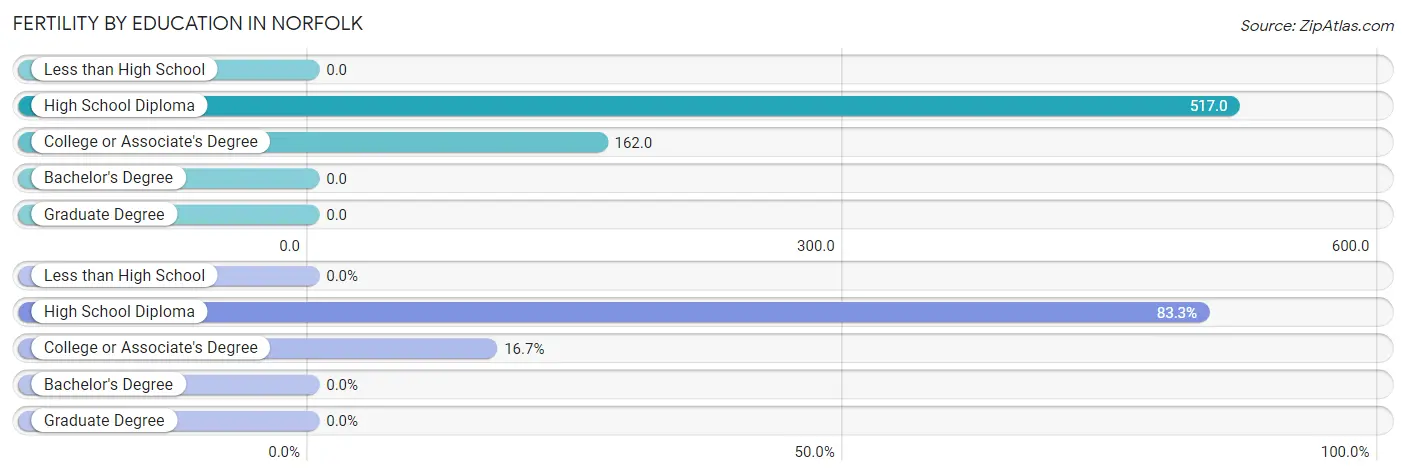
| Educational Attainment | Women with Births | Births / 1,000 Women |
| Less than High School | 0 (0.0%) | 0.0 |
| High School Diploma | 30 (83.3%) | 517.0 |
| College or Associate's Degree | 6 (16.7%) | 162.0 |
| Bachelor's Degree | 0 (0.0%) | 0.0 |
| Graduate Degree | 0 (0.0%) | 0.0 |
| Total | 36 (100.0%) | 185.0 |
Fertility by Education by Marriage Status in Norfolk
83.3% of women with births in Norfolk are unmarried. Women with the educational attainment of college or associate's degree are most likely to be married with 100.0% of them married at childbirth, while women with the educational attainment of high school diploma are least likely to be married with 100.0% of them unmarried at childbirth.
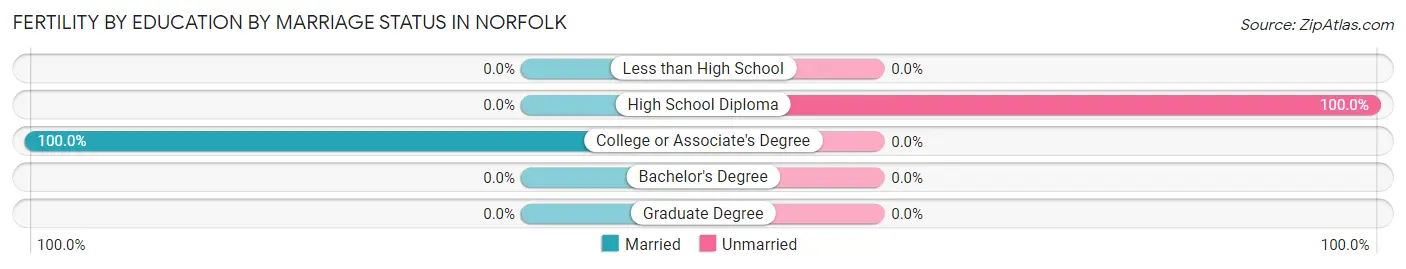
| Educational Attainment | Married | Unmarried |
| Less than High School | 0 (0.0%) | 0 (0.0%) |
| High School Diploma | 0 (0.0%) | 30 (100.0%) |
| College or Associate's Degree | 6 (100.0%) | 0 (0.0%) |
| Bachelor's Degree | 0 (0.0%) | 0 (0.0%) |
| Graduate Degree | 0 (0.0%) | 0 (0.0%) |
| Total | 6 (16.7%) | 30 (83.3%) |
Employment Characteristics in Norfolk
Employment by Class of Employer in Norfolk
Among the 337 employed individuals in Norfolk, private company employees (142 | 42.1%), state government employees (73 | 21.7%), and not-for-profit organizations (49 | 14.5%) make up the most common classes of employment.
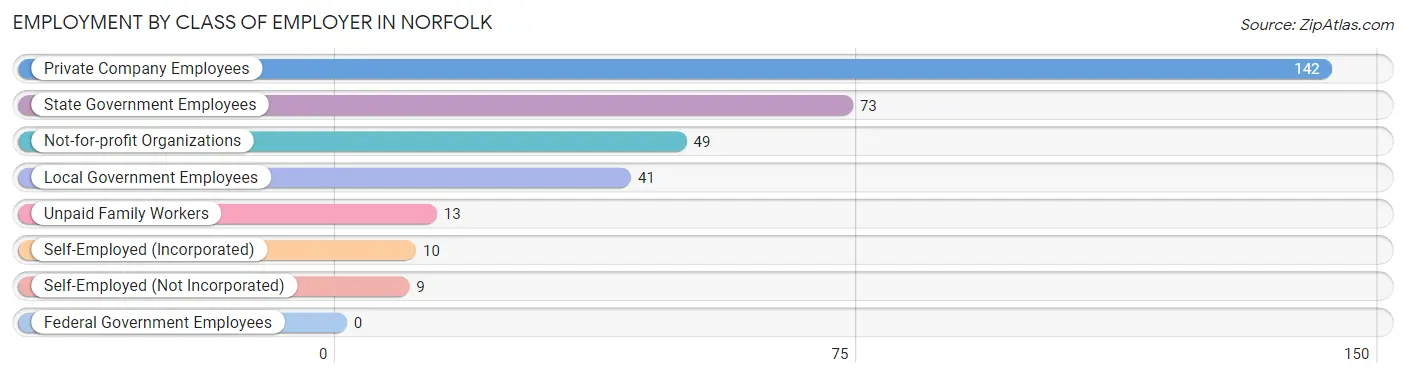
| Employer Class | # Employees | % Employees |
| Private Company Employees | 142 | 42.1% |
| Self-Employed (Incorporated) | 10 | 3.0% |
| Self-Employed (Not Incorporated) | 9 | 2.7% |
| Not-for-profit Organizations | 49 | 14.5% |
| Local Government Employees | 41 | 12.2% |
| State Government Employees | 73 | 21.7% |
| Federal Government Employees | 0 | 0.0% |
| Unpaid Family Workers | 13 | 3.9% |
| Total | 337 | 100.0% |
Employment Status by Age in Norfolk
According to the labor force statistics for Norfolk, out of the total population over 16 years of age (705), 50.8% or 358 individuals are in the labor force, with 5.9% or 21 of them unemployed. The age group with the highest labor force participation rate is 20 to 24 years, with 100.0% or 45 individuals in the labor force. Within the labor force, the 35 to 44 years age range has the highest percentage of unemployed individuals, with 37.9% or 11 of them being unemployed.

| Age Bracket | In Labor Force | Unemployed |
| 16 to 19 Years | 0 (0.0%) | 0 (0.0%) |
| 20 to 24 Years | 45 (100.0%) | 0 (0.0%) |
| 25 to 29 Years | 61 (91.0%) | 0 (0.0%) |
| 30 to 34 Years | 72 (100.0%) | 0 (0.0%) |
| 35 to 44 Years | 29 (100.0%) | 11 (37.9%) |
| 45 to 54 Years | 57 (72.2%) | 0 (0.0%) |
| 55 to 59 Years | 32 (76.2%) | 10 (31.3%) |
| 60 to 64 Years | 42 (48.3%) | 0 (0.0%) |
| 65 to 74 Years | 20 (15.6%) | 0 (0.0%) |
| 75 Years and over | 0 (0.0%) | 0 (0.0%) |
| Total | 358 (50.8%) | 21 (5.9%) |
Employment Status by Educational Attainment in Norfolk
According to labor force statistics for Norfolk, 77.9% of individuals (293) out of the total population between 25 and 64 years of age (376) are in the labor force, with 7.2% or 21 of them being unemployed. The group with the highest labor force participation rate are those with the educational attainment of less than high school, with 100.0% or 41 individuals in the labor force. Within the labor force, individuals with less than high school education have the highest percentage of unemployment, with 26.8% or 11 of them being unemployed.
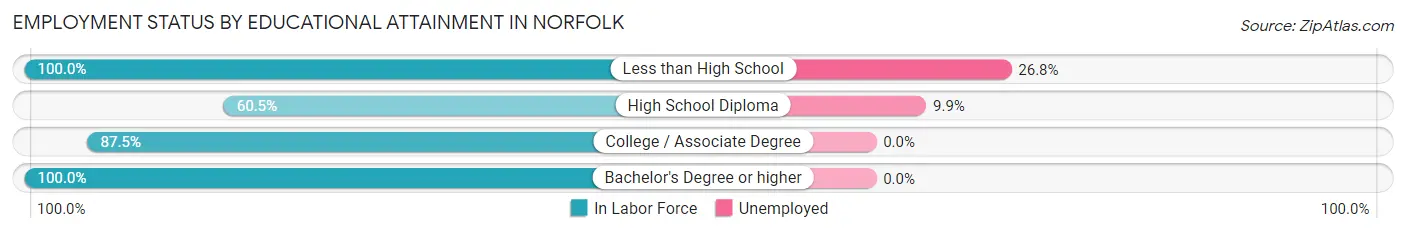
| Educational Attainment | In Labor Force | Unemployed |
| Less than High School | 41 (100.0%) | 11 (26.8%) |
| High School Diploma | 101 (60.5%) | 17 (9.9%) |
| College / Associate Degree | 119 (87.5%) | 0 (0.0%) |
| Bachelor's Degree or higher | 32 (100.0%) | 0 (0.0%) |
| Total | 293 (77.9%) | 27 (7.2%) |
Employment Occupations by Sex in Norfolk
Management, Business, Science and Arts Occupations
The most common Management, Business, Science and Arts occupations in Norfolk are Community & Social Service (40 | 11.9%), Education Instruction & Library (40 | 11.9%), Health Diagnosing & Treating (12 | 3.6%), Health Technologists (12 | 3.6%), and Management (11 | 3.3%).
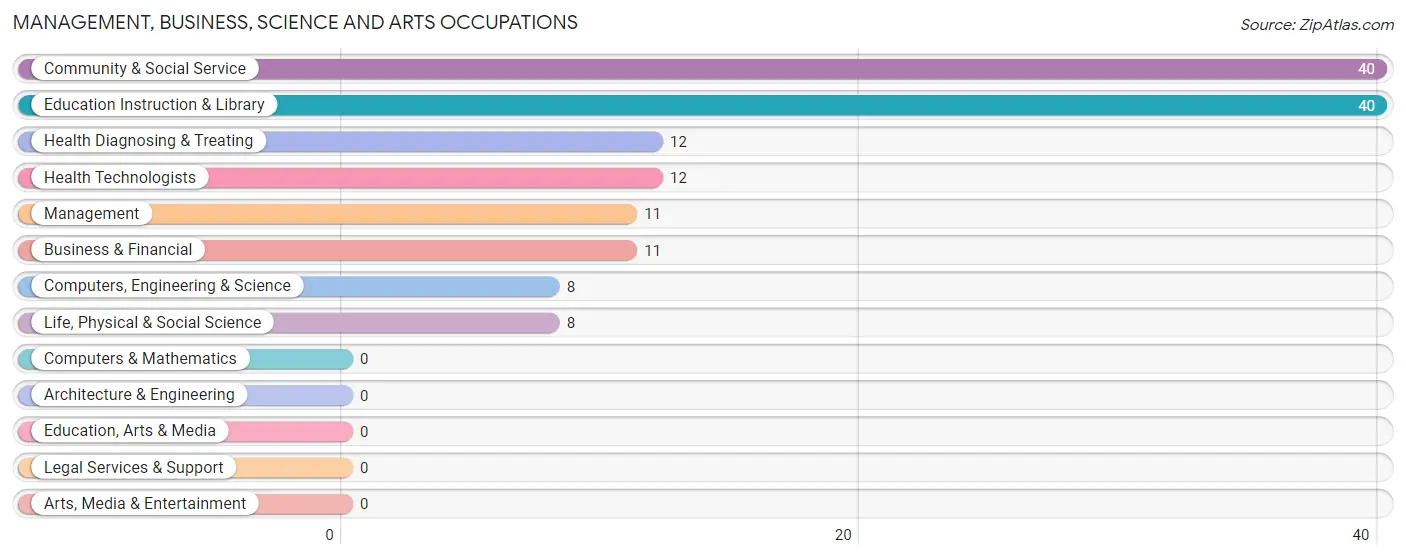
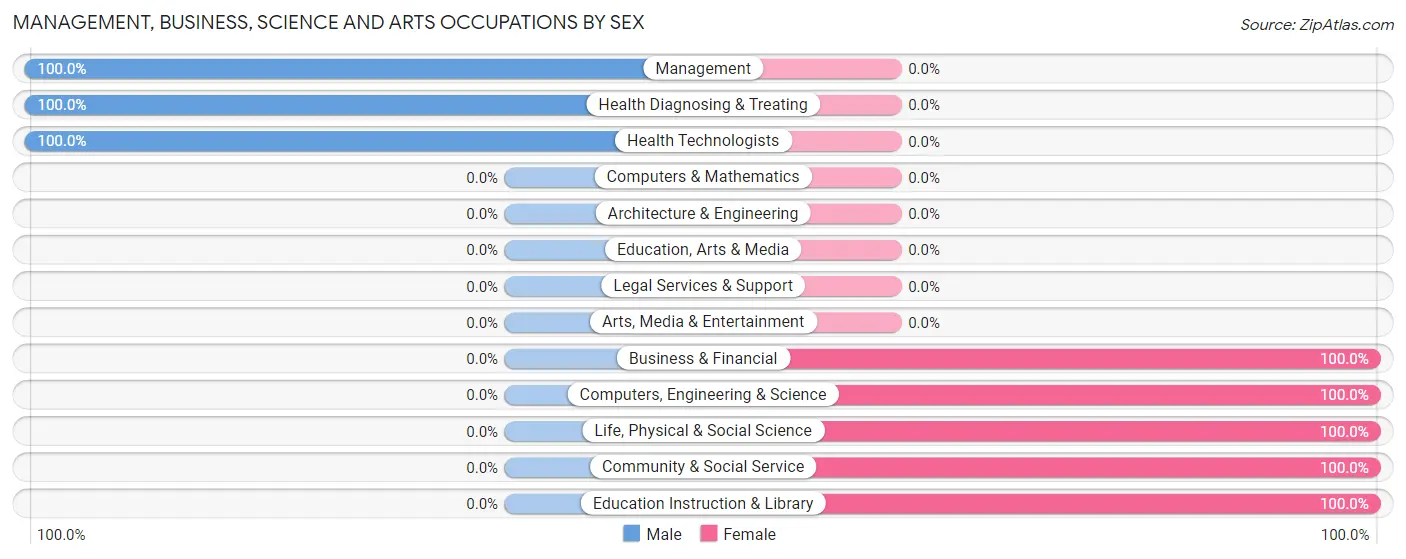
Management, Business, Science and Arts Occupations by Sex
Within the Management, Business, Science and Arts occupations in Norfolk, the most male-oriented occupations are Management (100.0%), Health Diagnosing & Treating (100.0%), and Health Technologists (100.0%), while the most female-oriented occupations are Business & Financial (100.0%), Computers, Engineering & Science (100.0%), and Life, Physical & Social Science (100.0%).
| Occupation | Male | Female |
| Management | 11 (100.0%) | 0 (0.0%) |
| Business & Financial | 0 (0.0%) | 11 (100.0%) |
| Computers, Engineering & Science | 0 (0.0%) | 8 (100.0%) |
| Computers & Mathematics | 0 (0.0%) | 0 (0.0%) |
| Architecture & Engineering | 0 (0.0%) | 0 (0.0%) |
| Life, Physical & Social Science | 0 (0.0%) | 8 (100.0%) |
| Community & Social Service | 0 (0.0%) | 40 (100.0%) |
| Education, Arts & Media | 0 (0.0%) | 0 (0.0%) |
| Legal Services & Support | 0 (0.0%) | 0 (0.0%) |
| Education Instruction & Library | 0 (0.0%) | 40 (100.0%) |
| Arts, Media & Entertainment | 0 (0.0%) | 0 (0.0%) |
| Health Diagnosing & Treating | 12 (100.0%) | 0 (0.0%) |
| Health Technologists | 12 (100.0%) | 0 (0.0%) |
| Total (Category) | 23 (28.1%) | 59 (72.0%) |
| Total (Overall) | 174 (51.6%) | 163 (48.4%) |
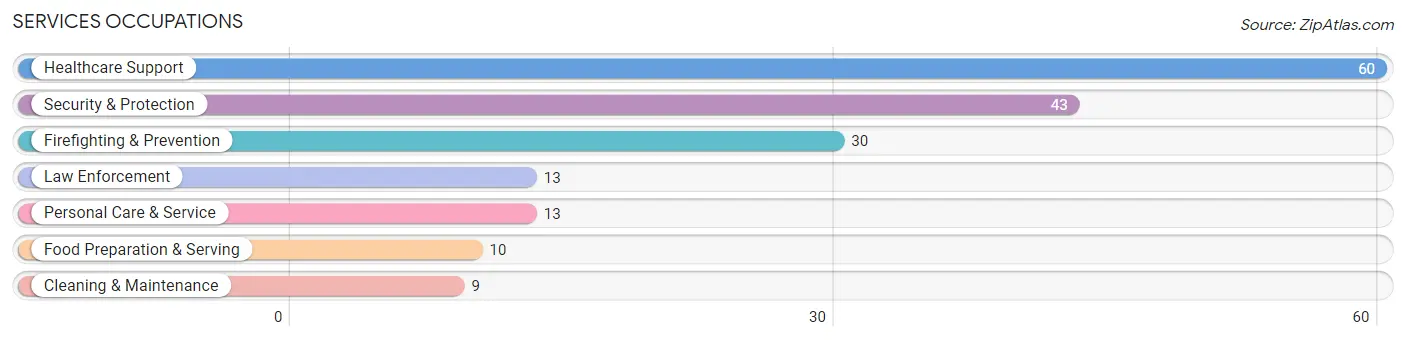
Services Occupations
The most common Services occupations in Norfolk are Healthcare Support (60 | 17.8%), Security & Protection (43 | 12.8%), Firefighting & Prevention (30 | 8.9%), Law Enforcement (13 | 3.9%), and Personal Care & Service (13 | 3.9%).
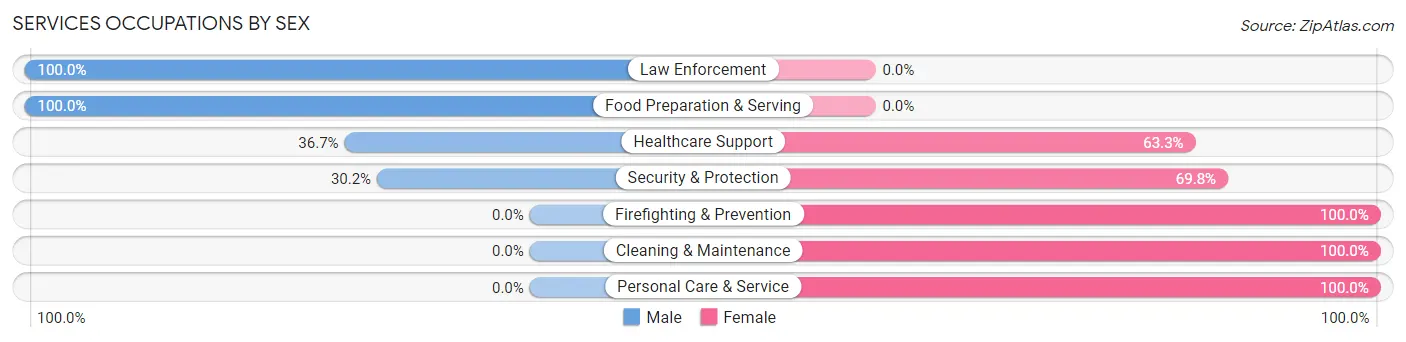
Services Occupations by Sex
Within the Services occupations in Norfolk, the most male-oriented occupations are Law Enforcement (100.0%), Food Preparation & Serving (100.0%), and Healthcare Support (36.7%), while the most female-oriented occupations are Firefighting & Prevention (100.0%), Cleaning & Maintenance (100.0%), and Personal Care & Service (100.0%).
| Occupation | Male | Female |
| Healthcare Support | 22 (36.7%) | 38 (63.3%) |
| Security & Protection | 13 (30.2%) | 30 (69.8%) |
| Firefighting & Prevention | 0 (0.0%) | 30 (100.0%) |
| Law Enforcement | 13 (100.0%) | 0 (0.0%) |
| Food Preparation & Serving | 10 (100.0%) | 0 (0.0%) |
| Cleaning & Maintenance | 0 (0.0%) | 9 (100.0%) |
| Personal Care & Service | 0 (0.0%) | 13 (100.0%) |
| Total (Category) | 45 (33.3%) | 90 (66.7%) |
| Total (Overall) | 174 (51.6%) | 163 (48.4%) |
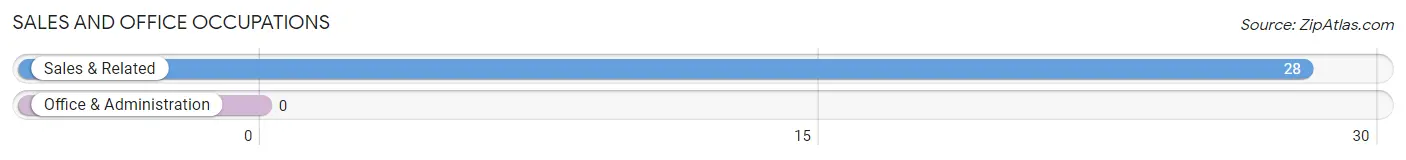
Sales and Office Occupations
The most common Sales and Office occupations in Norfolk are , and Sales & Related (28 | 8.3%).
Sales and Office Occupations by Sex
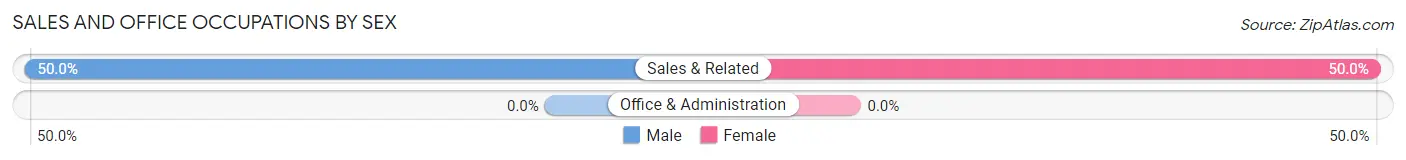
| Occupation | Male | Female |
| Sales & Related | 14 (50.0%) | 14 (50.0%) |
| Office & Administration | 0 (0.0%) | 0 (0.0%) |
| Total (Category) | 14 (50.0%) | 14 (50.0%) |
| Total (Overall) | 174 (51.6%) | 163 (48.4%) |
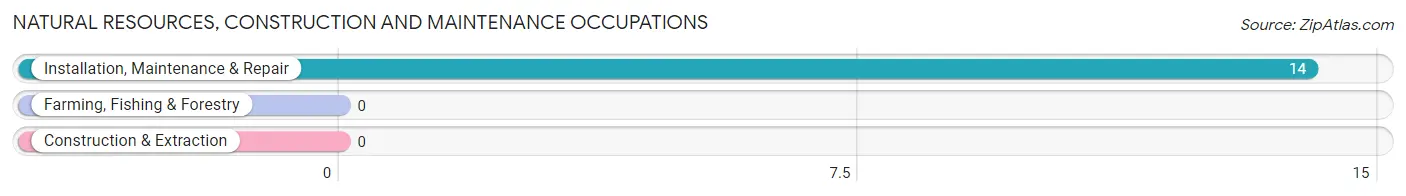
Natural Resources, Construction and Maintenance Occupations
The most common Natural Resources, Construction and Maintenance occupations in Norfolk are , and Installation, Maintenance & Repair (14 | 4.2%).
Natural Resources, Construction and Maintenance Occupations by Sex
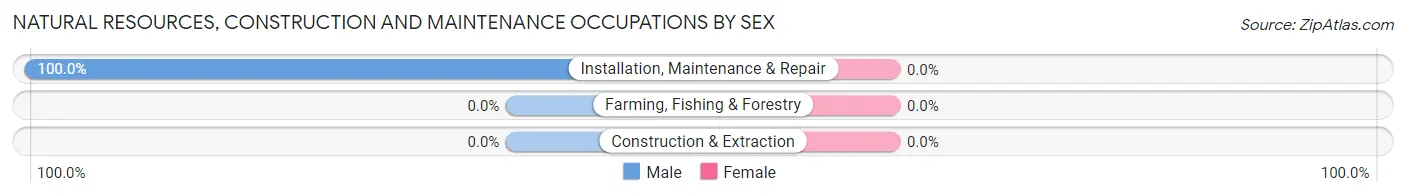
| Occupation | Male | Female |
| Farming, Fishing & Forestry | 0 (0.0%) | 0 (0.0%) |
| Construction & Extraction | 0 (0.0%) | 0 (0.0%) |
| Installation, Maintenance & Repair | 14 (100.0%) | 0 (0.0%) |
| Total (Category) | 14 (100.0%) | 0 (0.0%) |
| Total (Overall) | 174 (51.6%) | 163 (48.4%) |
Production, Transportation and Moving Occupations
The most common Production, Transportation and Moving occupations in Norfolk are Production (37 | 11.0%), Material Moving (31 | 9.2%), and Transportation (10 | 3.0%).
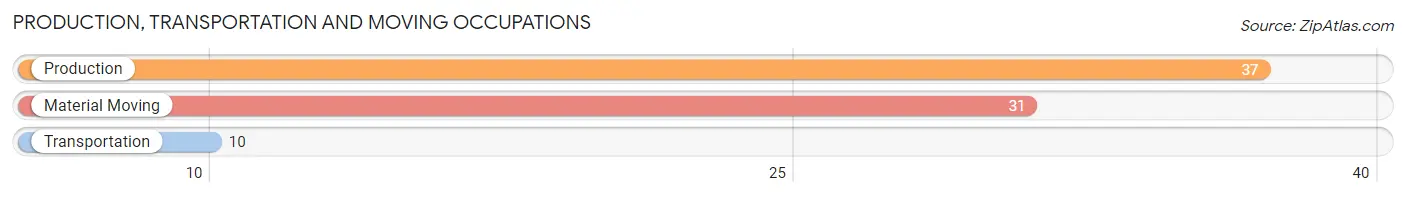
Production, Transportation and Moving Occupations by Sex
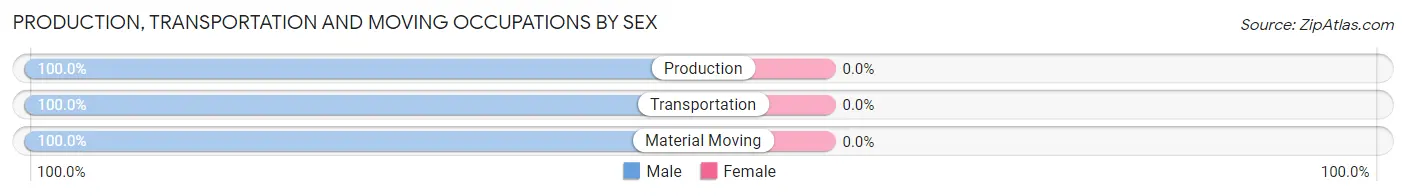
| Occupation | Male | Female |
| Production | 37 (100.0%) | 0 (0.0%) |
| Transportation | 10 (100.0%) | 0 (0.0%) |
| Material Moving | 31 (100.0%) | 0 (0.0%) |
| Total (Category) | 78 (100.0%) | 0 (0.0%) |
| Total (Overall) | 174 (51.6%) | 163 (48.4%) |
Employment Industries by Sex in Norfolk
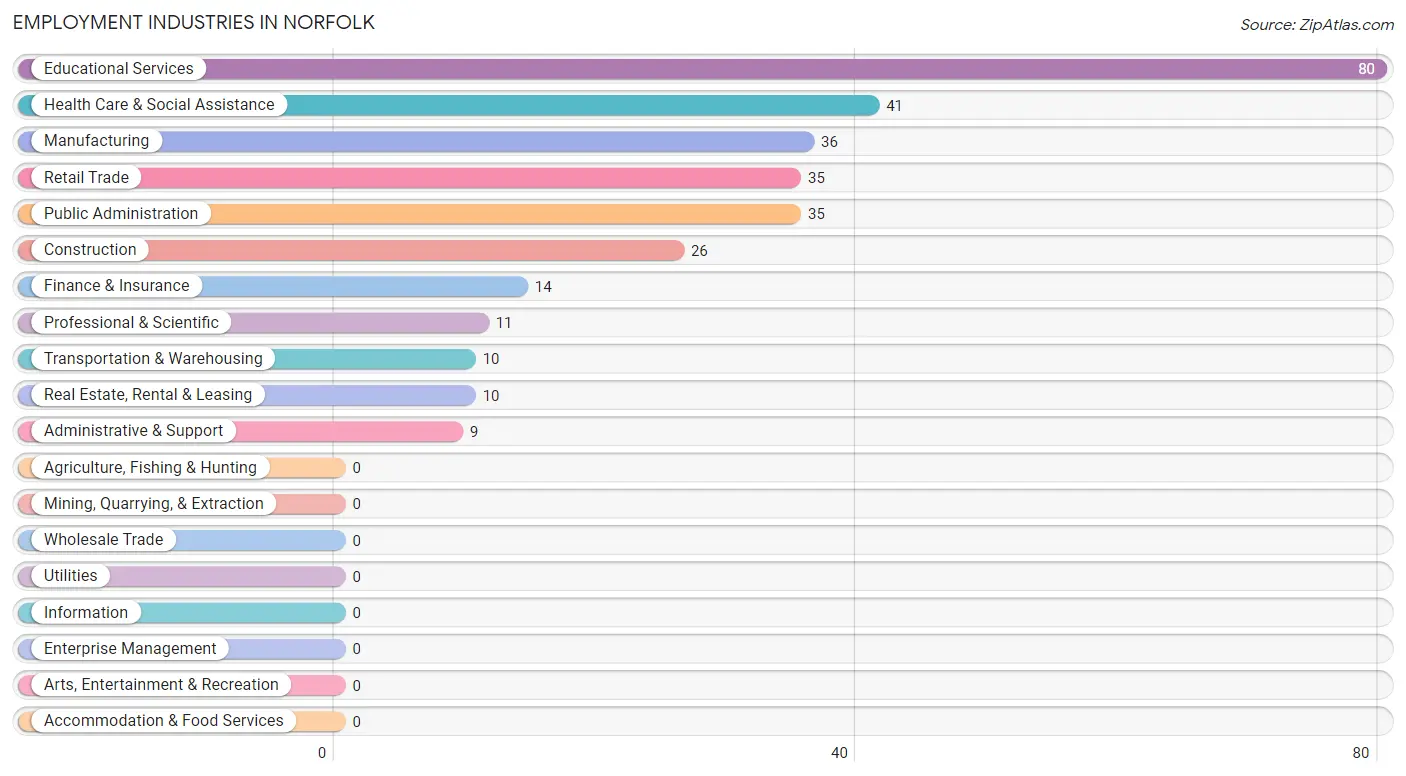
Employment Industries in Norfolk
The major employment industries in Norfolk include Educational Services (80 | 23.7%), Health Care & Social Assistance (41 | 12.2%), Manufacturing (36 | 10.7%), Retail Trade (35 | 10.4%), and Public Administration (35 | 10.4%).
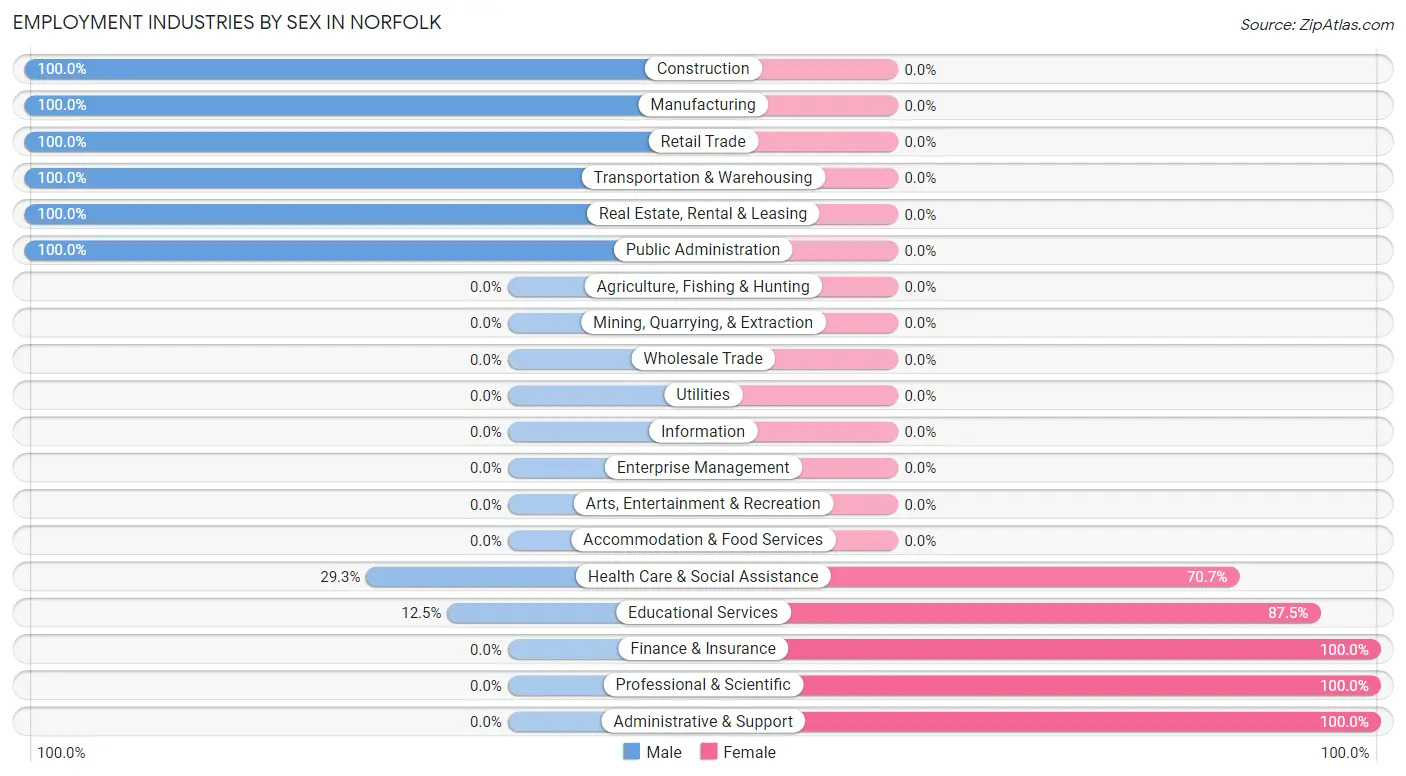
Employment Industries by Sex in Norfolk
The Norfolk industries that see more men than women are Construction (100.0%), Manufacturing (100.0%), and Retail Trade (100.0%), whereas the industries that tend to have a higher number of women are Finance & Insurance (100.0%), Professional & Scientific (100.0%), and Administrative & Support (100.0%).
| Industry | Male | Female |
| Agriculture, Fishing & Hunting | 0 (0.0%) | 0 (0.0%) |
| Mining, Quarrying, & Extraction | 0 (0.0%) | 0 (0.0%) |
| Construction | 26 (100.0%) | 0 (0.0%) |
| Manufacturing | 36 (100.0%) | 0 (0.0%) |
| Wholesale Trade | 0 (0.0%) | 0 (0.0%) |
| Retail Trade | 35 (100.0%) | 0 (0.0%) |
| Transportation & Warehousing | 10 (100.0%) | 0 (0.0%) |
| Utilities | 0 (0.0%) | 0 (0.0%) |
| Information | 0 (0.0%) | 0 (0.0%) |
| Finance & Insurance | 0 (0.0%) | 14 (100.0%) |
| Real Estate, Rental & Leasing | 10 (100.0%) | 0 (0.0%) |
| Professional & Scientific | 0 (0.0%) | 11 (100.0%) |
| Enterprise Management | 0 (0.0%) | 0 (0.0%) |
| Administrative & Support | 0 (0.0%) | 9 (100.0%) |
| Educational Services | 10 (12.5%) | 70 (87.5%) |
| Health Care & Social Assistance | 12 (29.3%) | 29 (70.7%) |
| Arts, Entertainment & Recreation | 0 (0.0%) | 0 (0.0%) |
| Accommodation & Food Services | 0 (0.0%) | 0 (0.0%) |
| Public Administration | 35 (100.0%) | 0 (0.0%) |
| Total | 174 (51.6%) | 163 (48.4%) |
Education in Norfolk
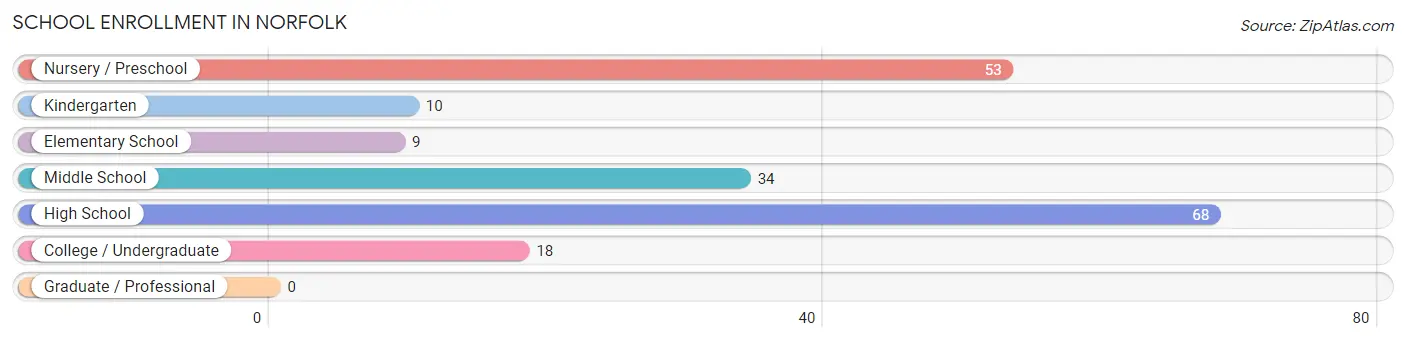
School Enrollment in Norfolk
The most common levels of schooling among the 192 students in Norfolk are high school (68 | 35.4%), nursery / preschool (53 | 27.6%), and middle school (34 | 17.7%).
| School Level | # Students | % Students |
| Nursery / Preschool | 53 | 27.6% |
| Kindergarten | 10 | 5.2% |
| Elementary School | 9 | 4.7% |
| Middle School | 34 | 17.7% |
| High School | 68 | 35.4% |
| College / Undergraduate | 18 | 9.4% |
| Graduate / Professional | 0 | 0.0% |
| Total | 192 | 100.0% |
School Enrollment by Age by Funding Source in Norfolk
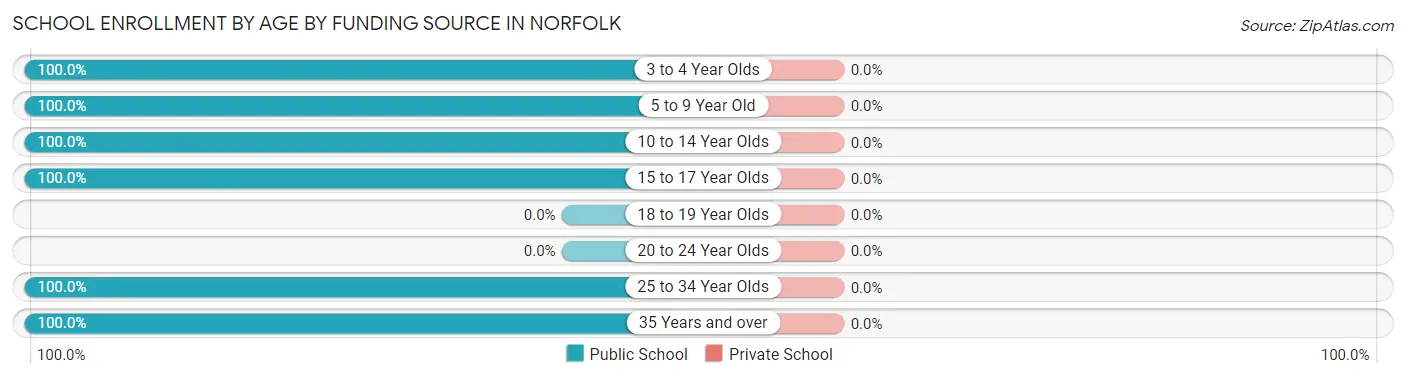
| Age Bracket | Public School | Private School |
| 3 to 4 Year Olds | 33 (100.0%) | 0 (0.0%) |
| 5 to 9 Year Old | 39 (100.0%) | 0 (0.0%) |
| 10 to 14 Year Olds | 54 (100.0%) | 0 (0.0%) |
| 15 to 17 Year Olds | 48 (100.0%) | 0 (0.0%) |
| 18 to 19 Year Olds | 0 (0.0%) | 0 (0.0%) |
| 20 to 24 Year Olds | 0 (0.0%) | 0 (0.0%) |
| 25 to 34 Year Olds | 8 (100.0%) | 0 (0.0%) |
| 35 Years and over | 10 (100.0%) | 0 (0.0%) |
| Total | 192 (100.0%) | 0 (0.0%) |
Educational Attainment by Field of Study in Norfolk
Science & technology (24 | 54.5%), education (12 | 27.3%), and arts & humanities (8 | 18.2%) are the most common fields of study among 44 individuals in Norfolk who have obtained a bachelor's degree or higher.
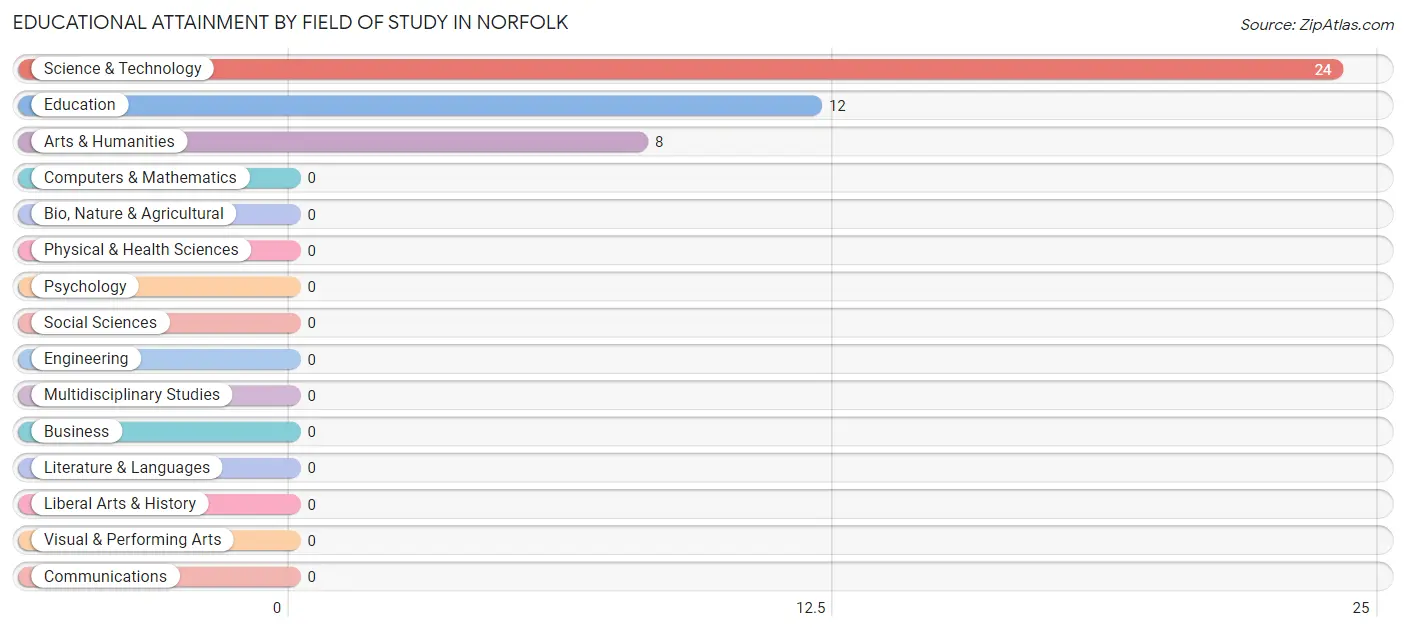
| Field of Study | # Graduates | % Graduates |
| Computers & Mathematics | 0 | 0.0% |
| Bio, Nature & Agricultural | 0 | 0.0% |
| Physical & Health Sciences | 0 | 0.0% |
| Psychology | 0 | 0.0% |
| Social Sciences | 0 | 0.0% |
| Engineering | 0 | 0.0% |
| Multidisciplinary Studies | 0 | 0.0% |
| Science & Technology | 24 | 54.5% |
| Business | 0 | 0.0% |
| Education | 12 | 27.3% |
| Literature & Languages | 0 | 0.0% |
| Liberal Arts & History | 0 | 0.0% |
| Visual & Performing Arts | 0 | 0.0% |
| Communications | 0 | 0.0% |
| Arts & Humanities | 8 | 18.2% |
| Total | 44 | 100.0% |
Transportation & Commute in Norfolk
Vehicle Availability by Sex in Norfolk
The most prevalent vehicle ownership categories in Norfolk are males with 2 vehicles (69, accounting for 39.7%) and females with 2 vehicles (69, making up 42.3%).
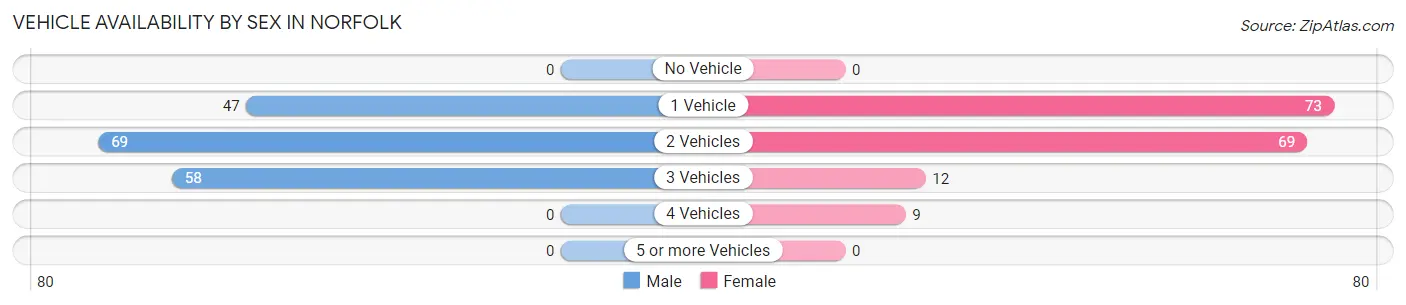
| Vehicles Available | Male | Female |
| No Vehicle | 0 (0.0%) | 0 (0.0%) |
| 1 Vehicle | 47 (27.0%) | 73 (44.8%) |
| 2 Vehicles | 69 (39.7%) | 69 (42.3%) |
| 3 Vehicles | 58 (33.3%) | 12 (7.4%) |
| 4 Vehicles | 0 (0.0%) | 9 (5.5%) |
| 5 or more Vehicles | 0 (0.0%) | 0 (0.0%) |
| Total | 174 (100.0%) | 163 (100.0%) |
Commute Time in Norfolk
The most frequently occuring commute durations in Norfolk are 20 to 24 minutes (119 commuters, 36.2%), 15 to 19 minutes (87 commuters, 26.4%), and 5 to 9 minutes (52 commuters, 15.8%).
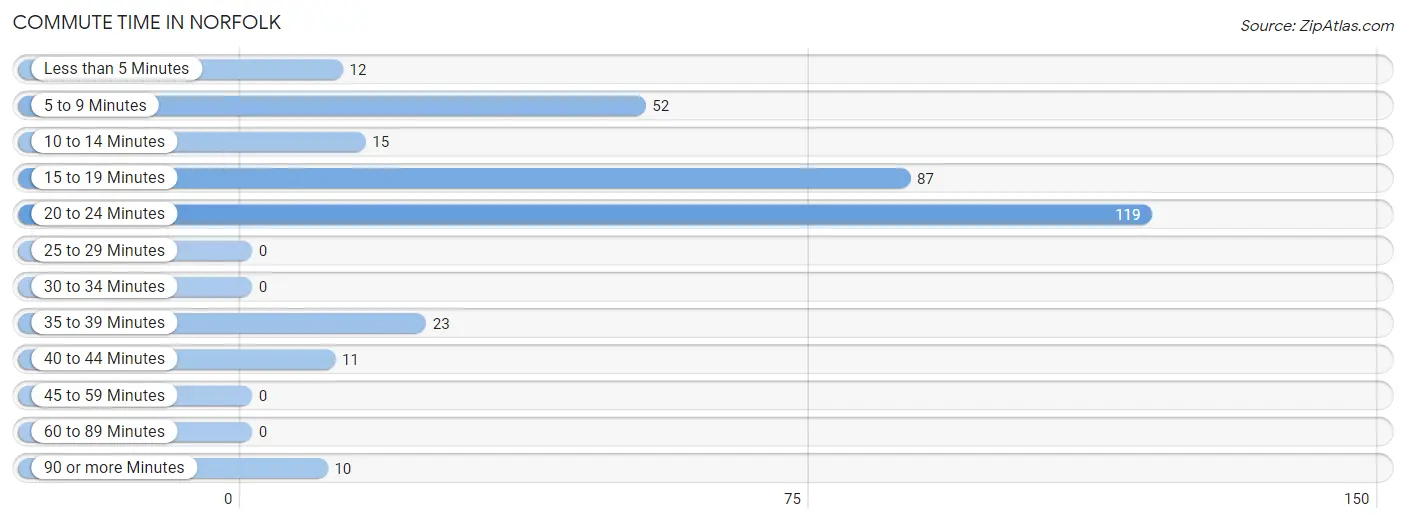
| Commute Time | # Commuters | % Commuters |
| Less than 5 Minutes | 12 | 3.6% |
| 5 to 9 Minutes | 52 | 15.8% |
| 10 to 14 Minutes | 15 | 4.6% |
| 15 to 19 Minutes | 87 | 26.4% |
| 20 to 24 Minutes | 119 | 36.2% |
| 25 to 29 Minutes | 0 | 0.0% |
| 30 to 34 Minutes | 0 | 0.0% |
| 35 to 39 Minutes | 23 | 7.0% |
| 40 to 44 Minutes | 11 | 3.3% |
| 45 to 59 Minutes | 0 | 0.0% |
| 60 to 89 Minutes | 0 | 0.0% |
| 90 or more Minutes | 10 | 3.0% |
Commute Time by Sex in Norfolk
The most common commute times in Norfolk are 20 to 24 minutes (102 commuters, 58.6%) for males and 15 to 19 minutes (63 commuters, 40.6%) for females.
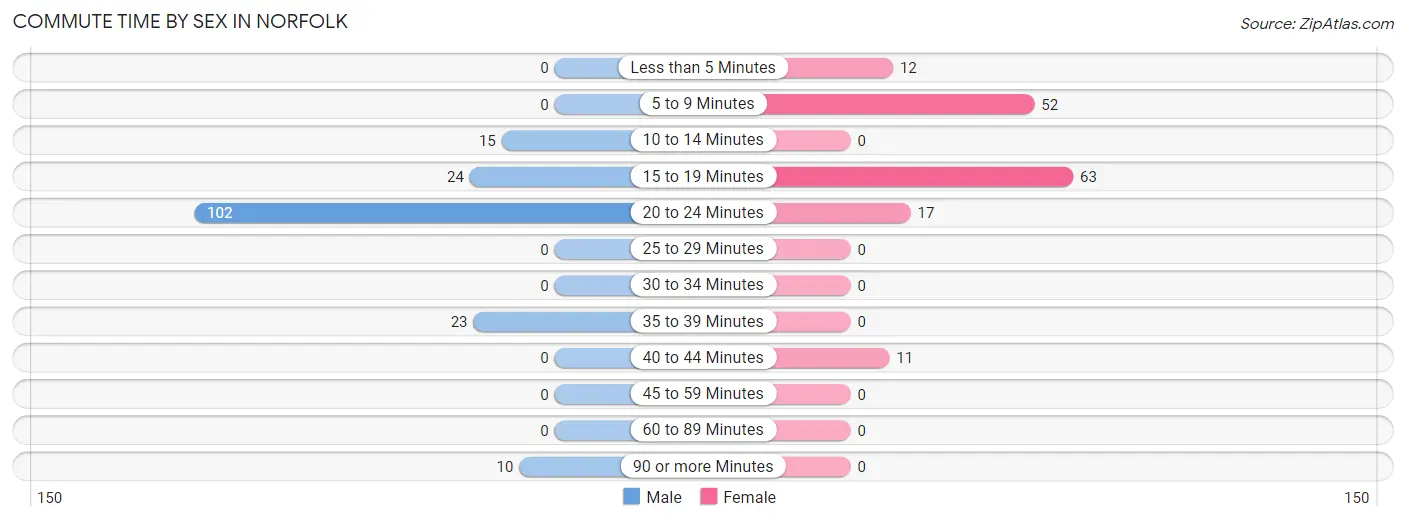
| Commute Time | Male | Female |
| Less than 5 Minutes | 0 (0.0%) | 12 (7.7%) |
| 5 to 9 Minutes | 0 (0.0%) | 52 (33.6%) |
| 10 to 14 Minutes | 15 (8.6%) | 0 (0.0%) |
| 15 to 19 Minutes | 24 (13.8%) | 63 (40.6%) |
| 20 to 24 Minutes | 102 (58.6%) | 17 (11.0%) |
| 25 to 29 Minutes | 0 (0.0%) | 0 (0.0%) |
| 30 to 34 Minutes | 0 (0.0%) | 0 (0.0%) |
| 35 to 39 Minutes | 23 (13.2%) | 0 (0.0%) |
| 40 to 44 Minutes | 0 (0.0%) | 11 (7.1%) |
| 45 to 59 Minutes | 0 (0.0%) | 0 (0.0%) |
| 60 to 89 Minutes | 0 (0.0%) | 0 (0.0%) |
| 90 or more Minutes | 10 (5.8%) | 0 (0.0%) |
Time of Departure to Work by Sex in Norfolk
The most frequent times of departure to work in Norfolk are 12:00 AM to 4:59 AM (52, 29.9%) for males and 7:00 AM to 7:29 AM (42, 27.1%) for females.
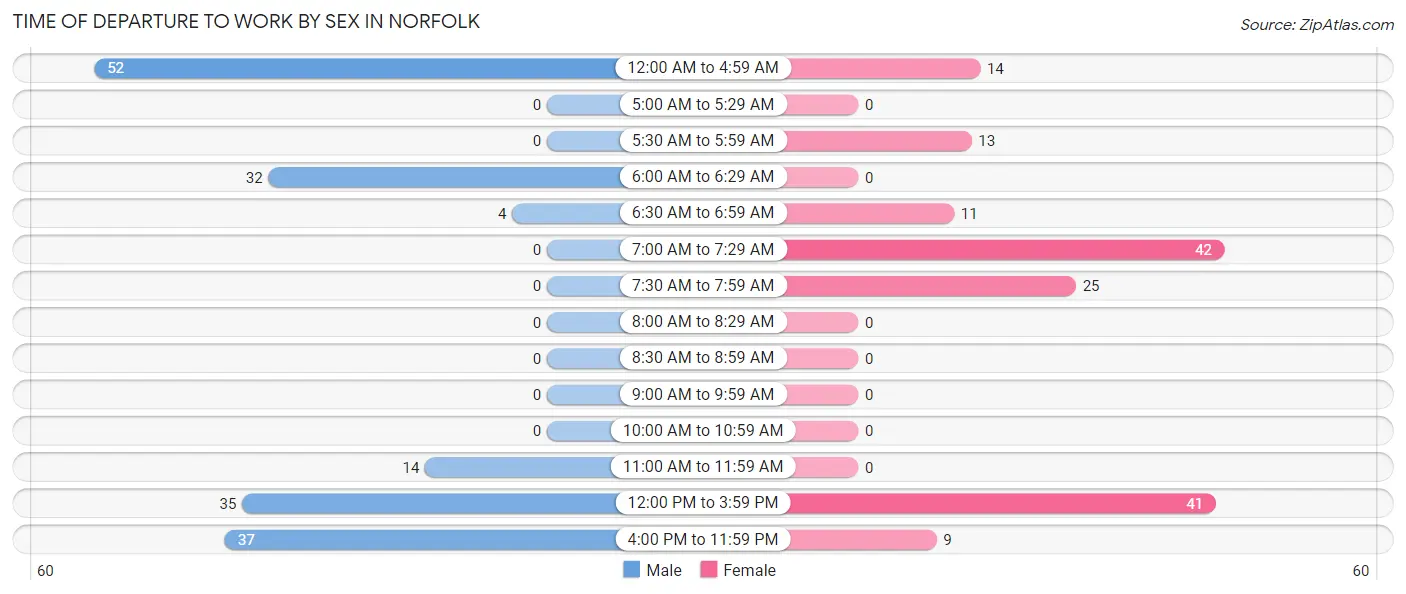
| Time of Departure | Male | Female |
| 12:00 AM to 4:59 AM | 52 (29.9%) | 14 (9.0%) |
| 5:00 AM to 5:29 AM | 0 (0.0%) | 0 (0.0%) |
| 5:30 AM to 5:59 AM | 0 (0.0%) | 13 (8.4%) |
| 6:00 AM to 6:29 AM | 32 (18.4%) | 0 (0.0%) |
| 6:30 AM to 6:59 AM | 4 (2.3%) | 11 (7.1%) |
| 7:00 AM to 7:29 AM | 0 (0.0%) | 42 (27.1%) |
| 7:30 AM to 7:59 AM | 0 (0.0%) | 25 (16.1%) |
| 8:00 AM to 8:29 AM | 0 (0.0%) | 0 (0.0%) |
| 8:30 AM to 8:59 AM | 0 (0.0%) | 0 (0.0%) |
| 9:00 AM to 9:59 AM | 0 (0.0%) | 0 (0.0%) |
| 10:00 AM to 10:59 AM | 0 (0.0%) | 0 (0.0%) |
| 11:00 AM to 11:59 AM | 14 (8.1%) | 0 (0.0%) |
| 12:00 PM to 3:59 PM | 35 (20.1%) | 41 (26.5%) |
| 4:00 PM to 11:59 PM | 37 (21.3%) | 9 (5.8%) |
| Total | 174 (100.0%) | 155 (100.0%) |
Housing Occupancy in Norfolk
Occupancy by Ownership in Norfolk
Of the total 420 dwellings in Norfolk, owner-occupied units account for 299 (71.2%), while renter-occupied units make up 121 (28.8%).
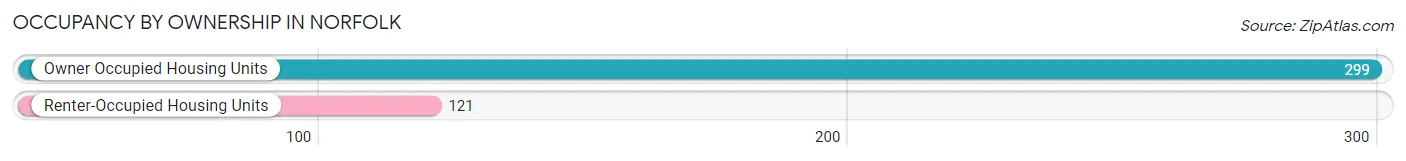
| Occupancy | # Housing Units | % Housing Units |
| Owner Occupied Housing Units | 299 | 71.2% |
| Renter-Occupied Housing Units | 121 | 28.8% |
| Total Occupied Housing Units | 420 | 100.0% |
Occupancy by Household Size in Norfolk
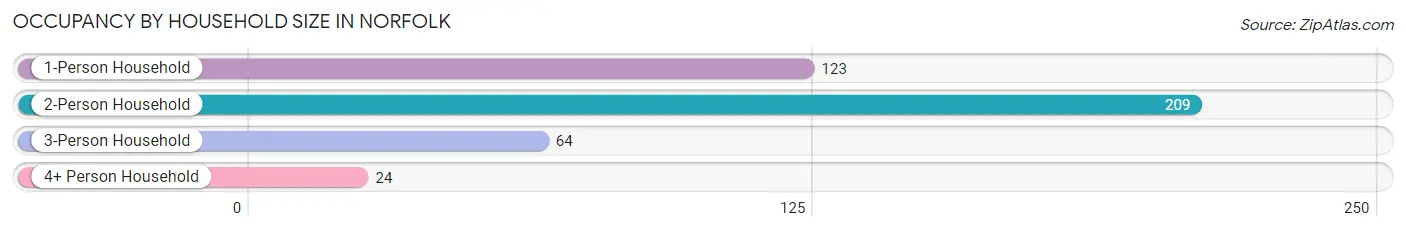
| Household Size | # Housing Units | % Housing Units |
| 1-Person Household | 123 | 29.3% |
| 2-Person Household | 209 | 49.8% |
| 3-Person Household | 64 | 15.2% |
| 4+ Person Household | 24 | 5.7% |
| Total Housing Units | 420 | 100.0% |
Occupancy by Ownership by Household Size in Norfolk
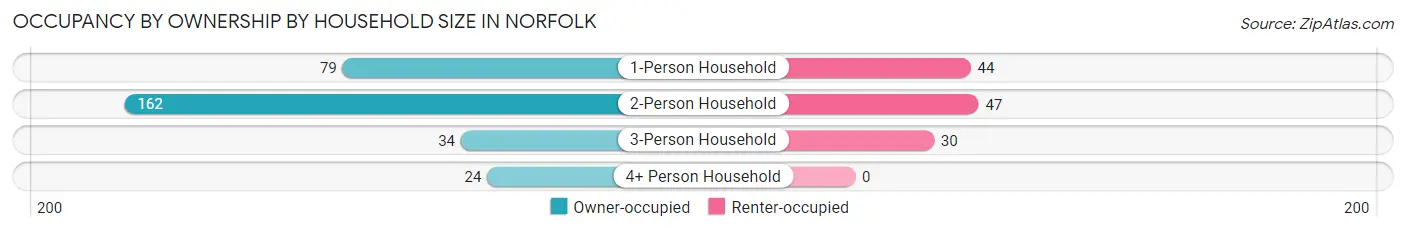
| Household Size | Owner-occupied | Renter-occupied |
| 1-Person Household | 79 (64.2%) | 44 (35.8%) |
| 2-Person Household | 162 (77.5%) | 47 (22.5%) |
| 3-Person Household | 34 (53.1%) | 30 (46.9%) |
| 4+ Person Household | 24 (100.0%) | 0 (0.0%) |
| Total Housing Units | 299 (71.2%) | 121 (28.8%) |
Occupancy by Educational Attainment in Norfolk
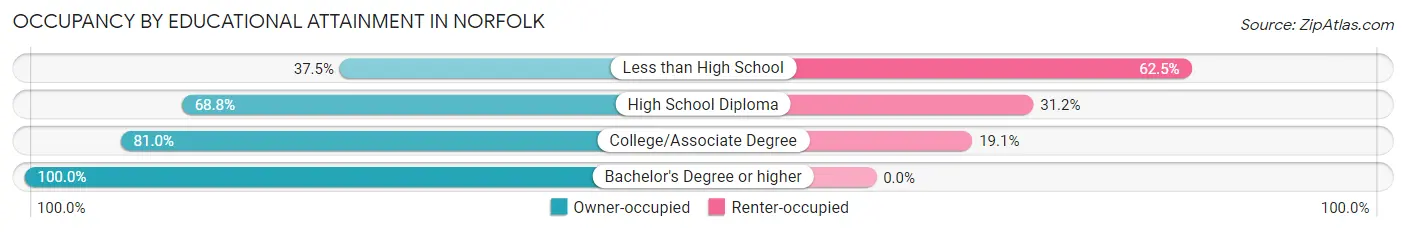
| Household Size | Owner-occupied | Renter-occupied |
| Less than High School | 18 (37.5%) | 30 (62.5%) |
| High School Diploma | 148 (68.8%) | 67 (31.2%) |
| College/Associate Degree | 102 (80.9%) | 24 (19.1%) |
| Bachelor's Degree or higher | 31 (100.0%) | 0 (0.0%) |
Occupancy by Age of Householder in Norfolk
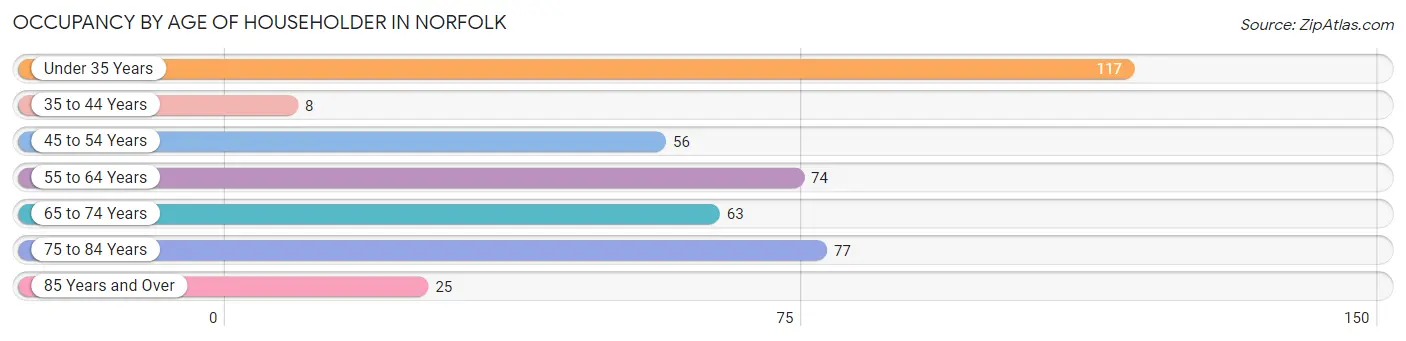
| Age Bracket | # Households | % Households |
| Under 35 Years | 117 | 27.9% |
| 35 to 44 Years | 8 | 1.9% |
| 45 to 54 Years | 56 | 13.3% |
| 55 to 64 Years | 74 | 17.6% |
| 65 to 74 Years | 63 | 15.0% |
| 75 to 84 Years | 77 | 18.3% |
| 85 Years and Over | 25 | 5.9% |
| Total | 420 | 100.0% |
Housing Finances in Norfolk
Median Income by Occupancy in Norfolk
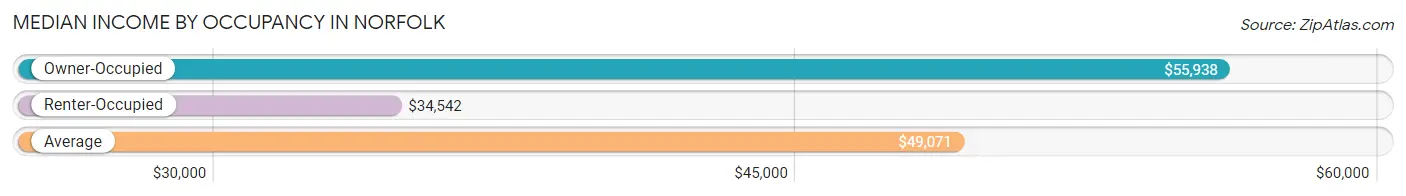
| Occupancy Type | # Households | Median Income |
| Owner-Occupied | 299 (71.2%) | $55,938 |
| Renter-Occupied | 121 (28.8%) | $34,542 |
| Average | 420 (100.0%) | $49,071 |
Occupancy by Householder Income Bracket in Norfolk
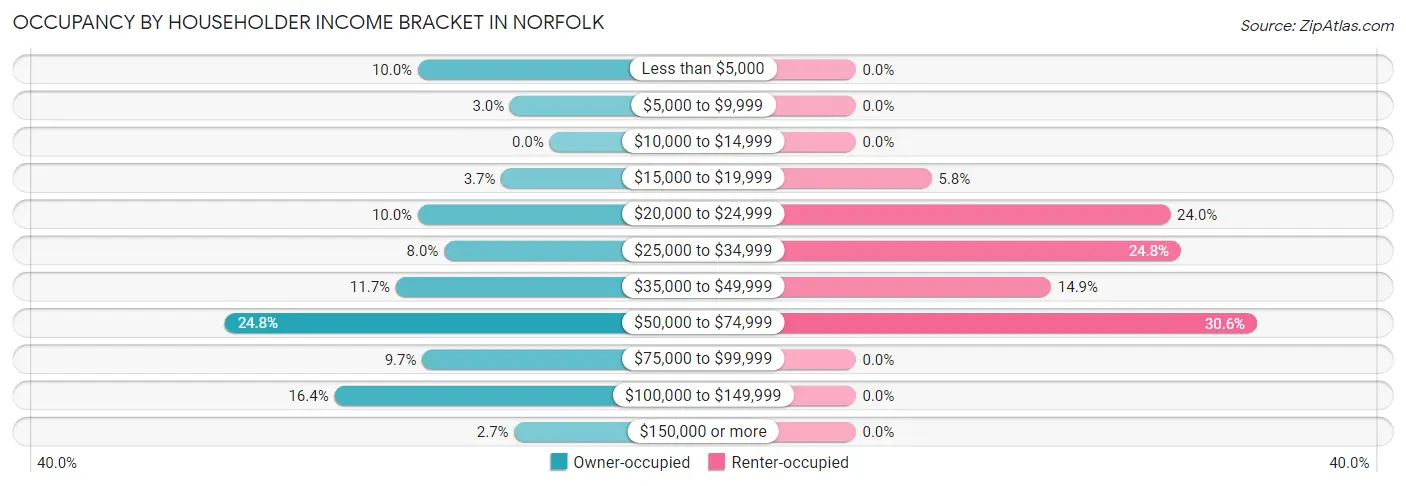
| Income Bracket | Owner-occupied | Renter-occupied |
| Less than $5,000 | 30 (10.0%) | 0 (0.0%) |
| $5,000 to $9,999 | 9 (3.0%) | 0 (0.0%) |
| $10,000 to $14,999 | 0 (0.0%) | 0 (0.0%) |
| $15,000 to $19,999 | 11 (3.7%) | 7 (5.8%) |
| $20,000 to $24,999 | 30 (10.0%) | 29 (24.0%) |
| $25,000 to $34,999 | 24 (8.0%) | 30 (24.8%) |
| $35,000 to $49,999 | 35 (11.7%) | 18 (14.9%) |
| $50,000 to $74,999 | 74 (24.7%) | 37 (30.6%) |
| $75,000 to $99,999 | 29 (9.7%) | 0 (0.0%) |
| $100,000 to $149,999 | 49 (16.4%) | 0 (0.0%) |
| $150,000 or more | 8 (2.7%) | 0 (0.0%) |
| Total | 299 (100.0%) | 121 (100.0%) |
Monthly Housing Cost Tiers in Norfolk
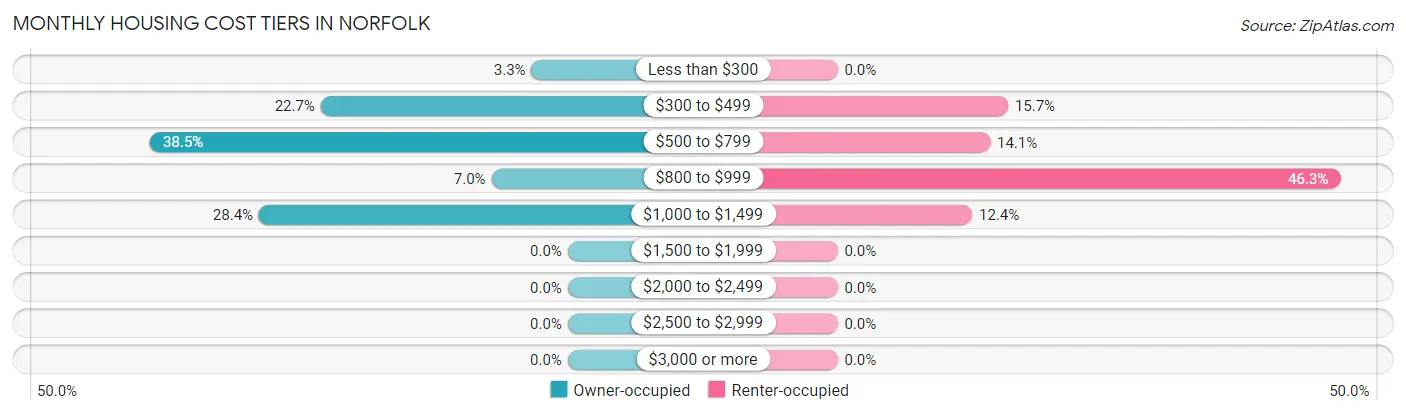
| Monthly Cost | Owner-occupied | Renter-occupied |
| Less than $300 | 10 (3.3%) | 0 (0.0%) |
| $300 to $499 | 68 (22.7%) | 19 (15.7%) |
| $500 to $799 | 115 (38.5%) | 17 (14.1%) |
| $800 to $999 | 21 (7.0%) | 56 (46.3%) |
| $1,000 to $1,499 | 85 (28.4%) | 15 (12.4%) |
| $1,500 to $1,999 | 0 (0.0%) | 0 (0.0%) |
| $2,000 to $2,499 | 0 (0.0%) | 0 (0.0%) |
| $2,500 to $2,999 | 0 (0.0%) | 0 (0.0%) |
| $3,000 or more | 0 (0.0%) | 0 (0.0%) |
| Total | 299 (100.0%) | 121 (100.0%) |
Physical Housing Characteristics in Norfolk
Housing Structures in Norfolk
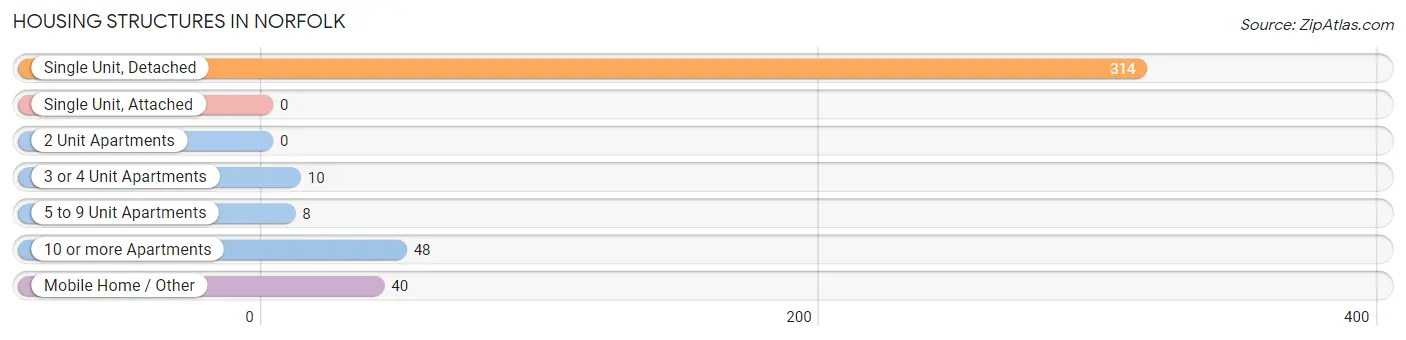
| Structure Type | # Housing Units | % Housing Units |
| Single Unit, Detached | 314 | 74.8% |
| Single Unit, Attached | 0 | 0.0% |
| 2 Unit Apartments | 0 | 0.0% |
| 3 or 4 Unit Apartments | 10 | 2.4% |
| 5 to 9 Unit Apartments | 8 | 1.9% |
| 10 or more Apartments | 48 | 11.4% |
| Mobile Home / Other | 40 | 9.5% |
| Total | 420 | 100.0% |
Housing Structures by Occupancy in Norfolk
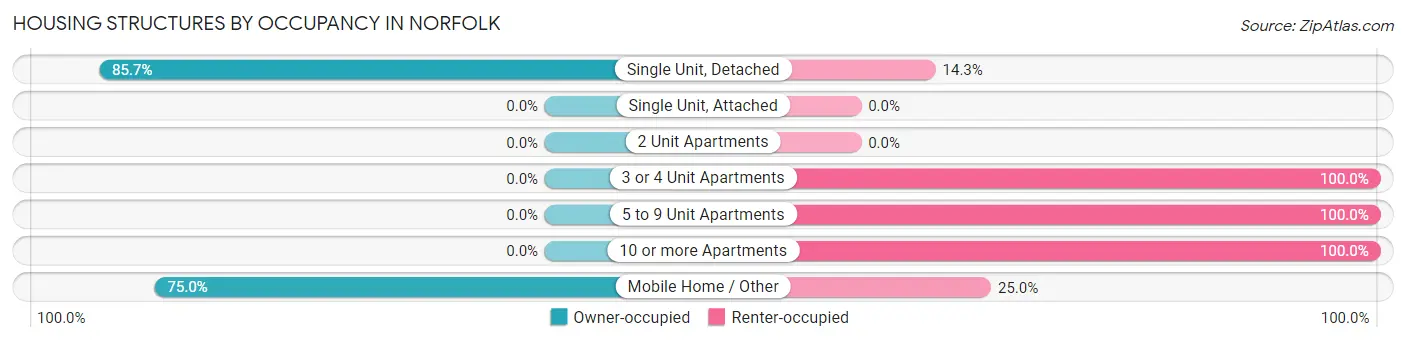
| Structure Type | Owner-occupied | Renter-occupied |
| Single Unit, Detached | 269 (85.7%) | 45 (14.3%) |
| Single Unit, Attached | 0 (0.0%) | 0 (0.0%) |
| 2 Unit Apartments | 0 (0.0%) | 0 (0.0%) |
| 3 or 4 Unit Apartments | 0 (0.0%) | 10 (100.0%) |
| 5 to 9 Unit Apartments | 0 (0.0%) | 8 (100.0%) |
| 10 or more Apartments | 0 (0.0%) | 48 (100.0%) |
| Mobile Home / Other | 30 (75.0%) | 10 (25.0%) |
| Total | 299 (71.2%) | 121 (28.8%) |
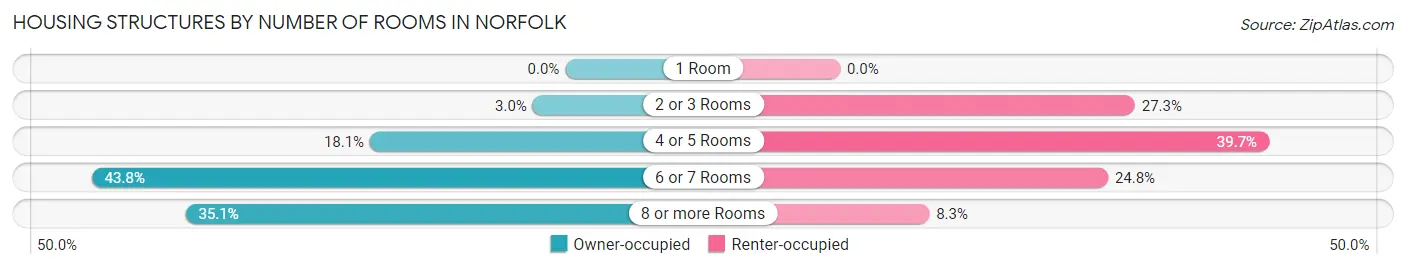
Housing Structures by Number of Rooms in Norfolk
| Number of Rooms | Owner-occupied | Renter-occupied |
| 1 Room | 0 (0.0%) | 0 (0.0%) |
| 2 or 3 Rooms | 9 (3.0%) | 33 (27.3%) |
| 4 or 5 Rooms | 54 (18.1%) | 48 (39.7%) |
| 6 or 7 Rooms | 131 (43.8%) | 30 (24.8%) |
| 8 or more Rooms | 105 (35.1%) | 10 (8.3%) |
| Total | 299 (100.0%) | 121 (100.0%) |
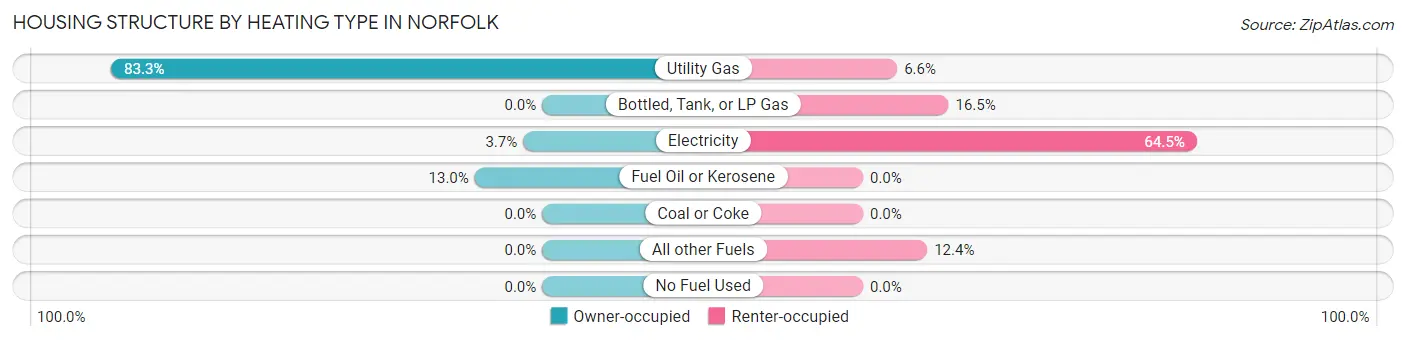
Housing Structure by Heating Type in Norfolk
| Heating Type | Owner-occupied | Renter-occupied |
| Utility Gas | 249 (83.3%) | 8 (6.6%) |
| Bottled, Tank, or LP Gas | 0 (0.0%) | 20 (16.5%) |
| Electricity | 11 (3.7%) | 78 (64.5%) |
| Fuel Oil or Kerosene | 39 (13.0%) | 0 (0.0%) |
| Coal or Coke | 0 (0.0%) | 0 (0.0%) |
| All other Fuels | 0 (0.0%) | 15 (12.4%) |
| No Fuel Used | 0 (0.0%) | 0 (0.0%) |
| Total | 299 (100.0%) | 121 (100.0%) |
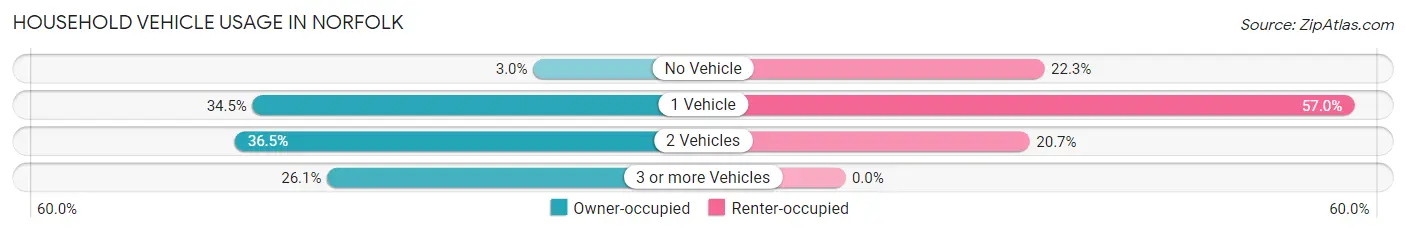
Household Vehicle Usage in Norfolk
| Vehicles per Household | Owner-occupied | Renter-occupied |
| No Vehicle | 9 (3.0%) | 27 (22.3%) |
| 1 Vehicle | 103 (34.4%) | 69 (57.0%) |
| 2 Vehicles | 109 (36.4%) | 25 (20.7%) |
| 3 or more Vehicles | 78 (26.1%) | 0 (0.0%) |
| Total | 299 (100.0%) | 121 (100.0%) |
Real Estate & Mortgages in Norfolk
Real Estate and Mortgage Overview in Norfolk
| Characteristic | Without Mortgage | With Mortgage |
| Housing Units | 193 | 106 |
| Median Property Value | - | - |
| Median Household Income | $34,219 | $8 |
| Monthly Housing Costs | $533 | $0 |
| Real Estate Taxes | $3,149 | $11 |
Property Value by Mortgage Status in Norfolk
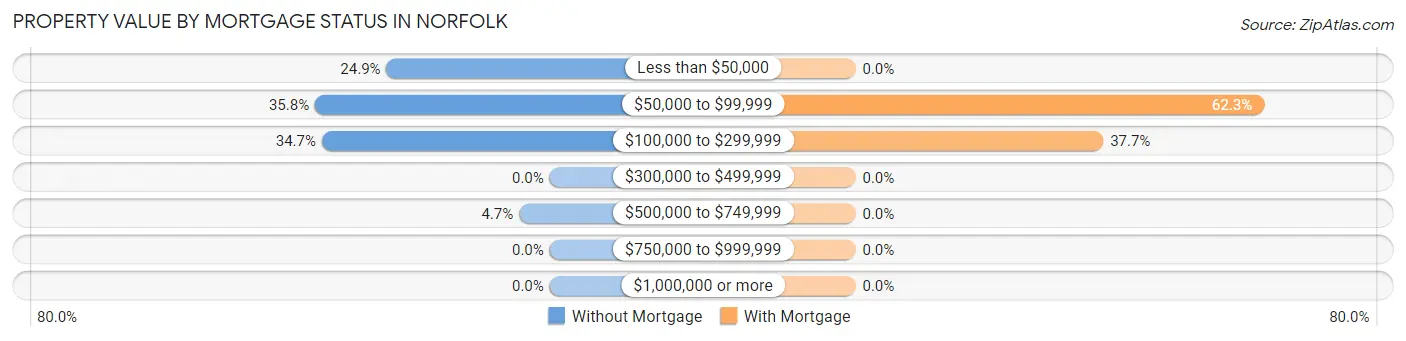
| Property Value | Without Mortgage | With Mortgage |
| Less than $50,000 | 48 (24.9%) | 0 (0.0%) |
| $50,000 to $99,999 | 69 (35.7%) | 66 (62.3%) |
| $100,000 to $299,999 | 67 (34.7%) | 40 (37.7%) |
| $300,000 to $499,999 | 0 (0.0%) | 0 (0.0%) |
| $500,000 to $749,999 | 9 (4.7%) | 0 (0.0%) |
| $750,000 to $999,999 | 0 (0.0%) | 0 (0.0%) |
| $1,000,000 or more | 0 (0.0%) | 0 (0.0%) |
| Total | 193 (100.0%) | 106 (100.0%) |
Household Income by Mortgage Status in Norfolk
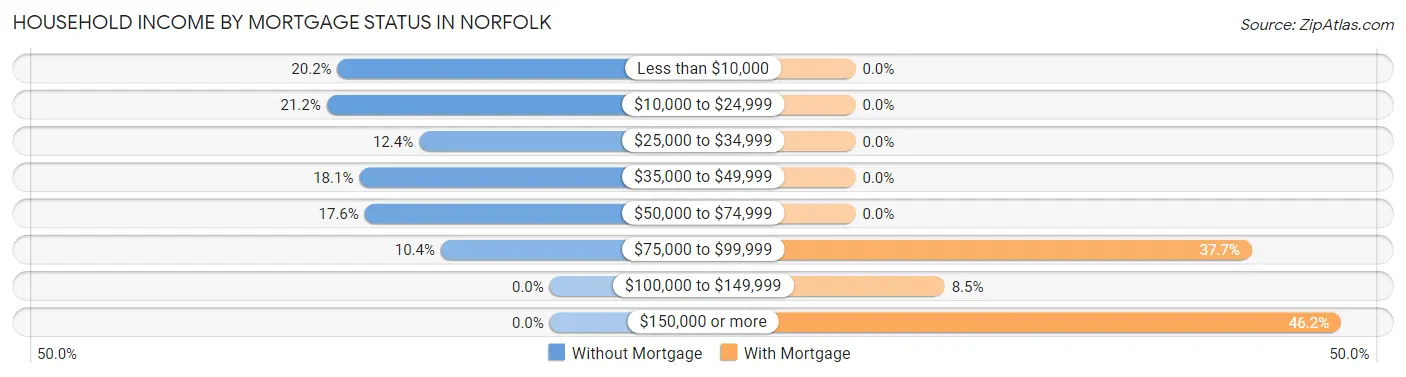
| Household Income | Without Mortgage | With Mortgage |
| Less than $10,000 | 39 (20.2%) | 0 (0.0%) |
| $10,000 to $24,999 | 41 (21.2%) | 0 (0.0%) |
| $25,000 to $34,999 | 24 (12.4%) | 0 (0.0%) |
| $35,000 to $49,999 | 35 (18.1%) | 0 (0.0%) |
| $50,000 to $74,999 | 34 (17.6%) | 0 (0.0%) |
| $75,000 to $99,999 | 20 (10.4%) | 40 (37.7%) |
| $100,000 to $149,999 | 0 (0.0%) | 9 (8.5%) |
| $150,000 or more | 0 (0.0%) | 49 (46.2%) |
| Total | 193 (100.0%) | 106 (100.0%) |
Property Value to Household Income Ratio in Norfolk
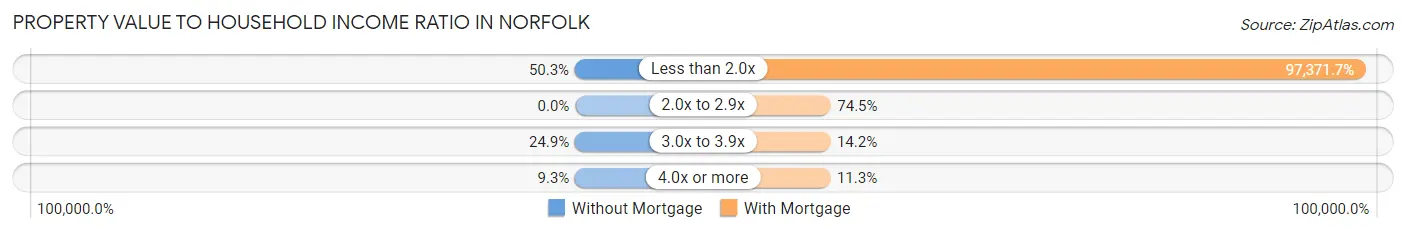
| Value-to-Income Ratio | Without Mortgage | With Mortgage |
| Less than 2.0x | 97 (50.3%) | 103,214 (97,371.7%) |
| 2.0x to 2.9x | 0 (0.0%) | 79 (74.5%) |
| 3.0x to 3.9x | 48 (24.9%) | 15 (14.1%) |
| 4.0x or more | 18 (9.3%) | 12 (11.3%) |
| Total | 193 (100.0%) | 106 (100.0%) |
Real Estate Taxes by Mortgage Status in Norfolk
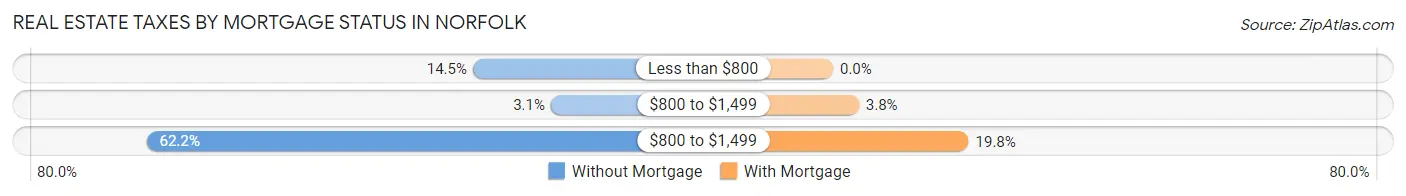
| Property Taxes | Without Mortgage | With Mortgage |
| Less than $800 | 28 (14.5%) | 0 (0.0%) |
| $800 to $1,499 | 6 (3.1%) | 4 (3.8%) |
| $800 to $1,499 | 120 (62.2%) | 21 (19.8%) |
| Total | 193 (100.0%) | 106 (100.0%) |
Health & Disability in Norfolk
Health Insurance Coverage by Age in Norfolk
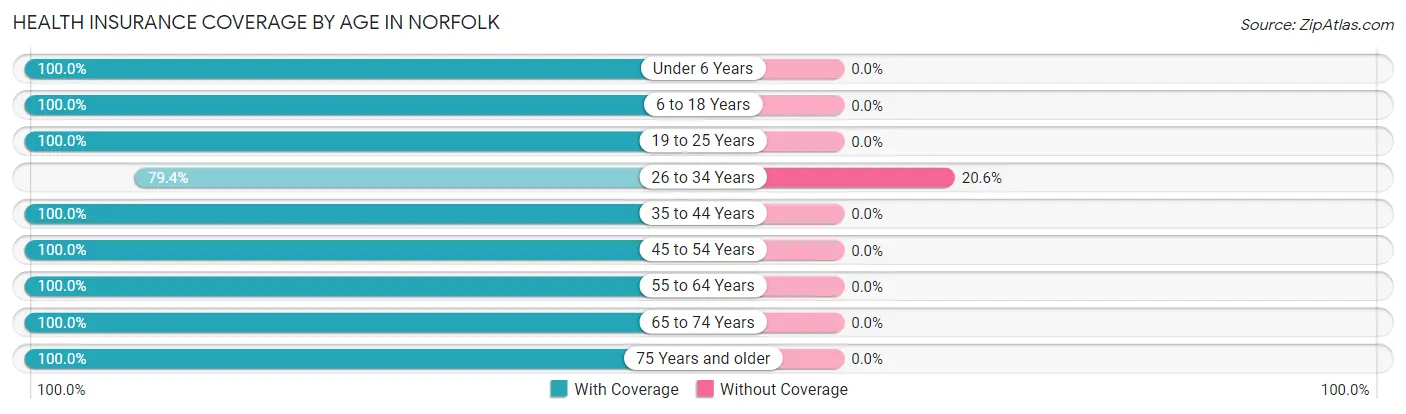
| Age Bracket | With Coverage | Without Coverage |
| Under 6 Years | 63 (100.0%) | 0 (0.0%) |
| 6 to 18 Years | 121 (100.0%) | 0 (0.0%) |
| 19 to 25 Years | 53 (100.0%) | 0 (0.0%) |
| 26 to 34 Years | 104 (79.4%) | 27 (20.6%) |
| 35 to 44 Years | 29 (100.0%) | 0 (0.0%) |
| 45 to 54 Years | 79 (100.0%) | 0 (0.0%) |
| 55 to 64 Years | 129 (100.0%) | 0 (0.0%) |
| 65 to 74 Years | 128 (100.0%) | 0 (0.0%) |
| 75 Years and older | 136 (100.0%) | 0 (0.0%) |
| Total | 842 (96.9%) | 27 (3.1%) |
Health Insurance Coverage by Citizenship Status in Norfolk
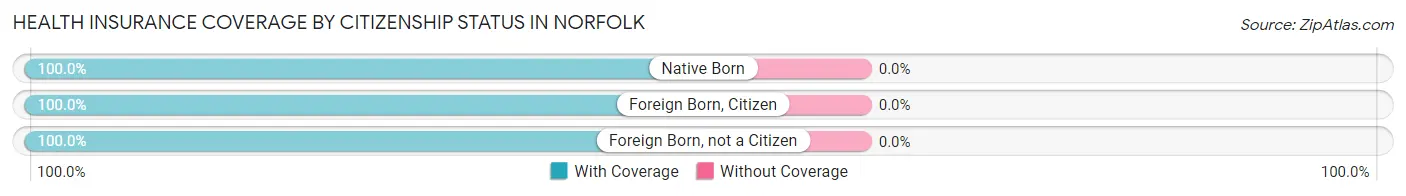
| Citizenship Status | With Coverage | Without Coverage |
| Native Born | 63 (100.0%) | 0 (0.0%) |
| Foreign Born, Citizen | 121 (100.0%) | 0 (0.0%) |
| Foreign Born, not a Citizen | 53 (100.0%) | 0 (0.0%) |
Health Insurance Coverage by Household Income in Norfolk
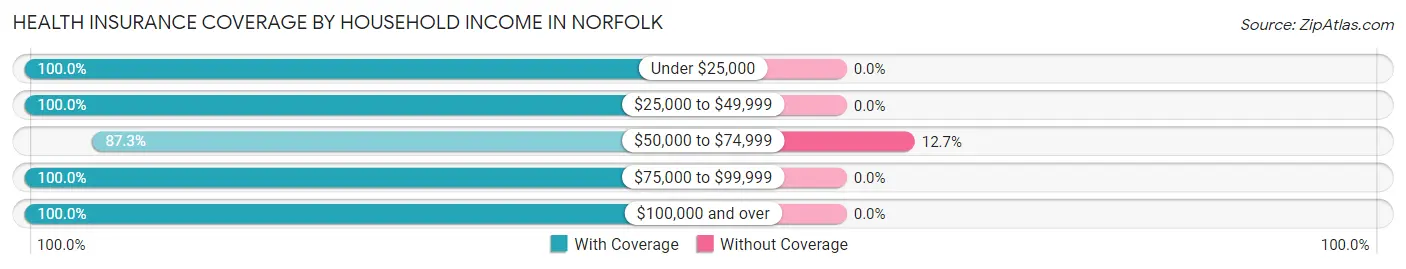
| Household Income | With Coverage | Without Coverage |
| Under $25,000 | 179 (100.0%) | 0 (0.0%) |
| $25,000 to $49,999 | 249 (100.0%) | 0 (0.0%) |
| $50,000 to $74,999 | 185 (87.3%) | 27 (12.7%) |
| $75,000 to $99,999 | 57 (100.0%) | 0 (0.0%) |
| $100,000 and over | 168 (100.0%) | 0 (0.0%) |
Public vs Private Health Insurance Coverage by Age in Norfolk
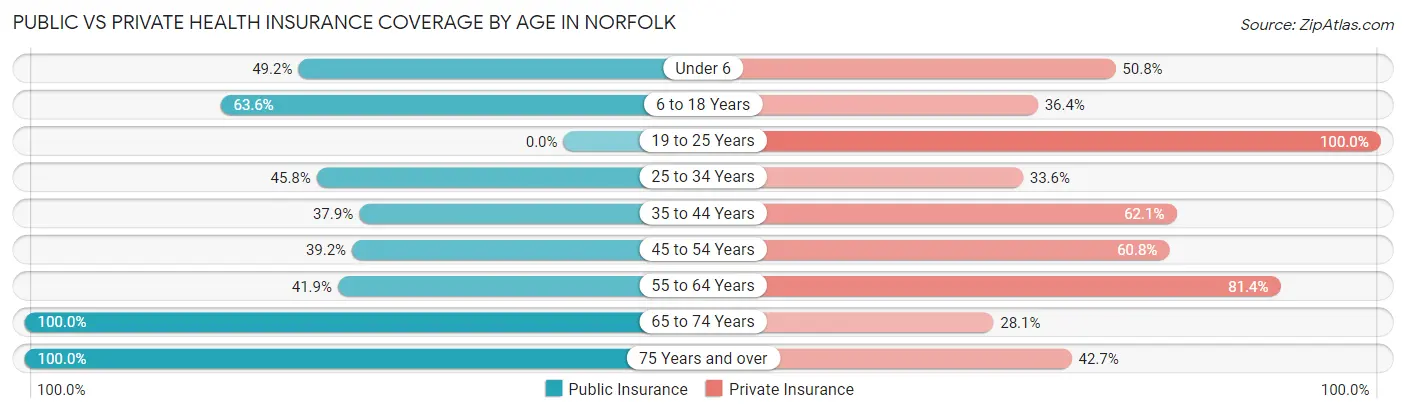
| Age Bracket | Public Insurance | Private Insurance |
| Under 6 | 31 (49.2%) | 32 (50.8%) |
| 6 to 18 Years | 77 (63.6%) | 44 (36.4%) |
| 19 to 25 Years | 0 (0.0%) | 53 (100.0%) |
| 25 to 34 Years | 60 (45.8%) | 44 (33.6%) |
| 35 to 44 Years | 11 (37.9%) | 18 (62.1%) |
| 45 to 54 Years | 31 (39.2%) | 48 (60.8%) |
| 55 to 64 Years | 54 (41.9%) | 105 (81.4%) |
| 65 to 74 Years | 128 (100.0%) | 36 (28.1%) |
| 75 Years and over | 136 (100.0%) | 58 (42.6%) |
| Total | 528 (60.8%) | 438 (50.4%) |
Disability Status by Sex by Age in Norfolk
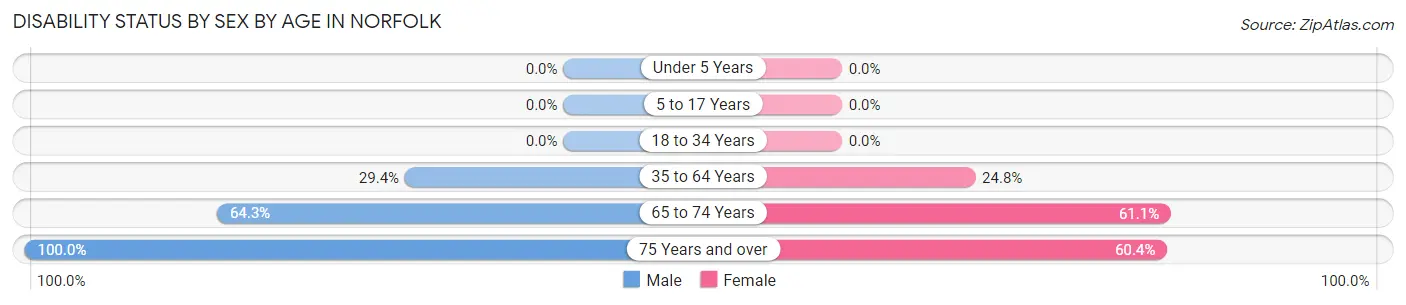
| Age Bracket | Male | Female |
| Under 5 Years | 0 (0.0%) | 0 (0.0%) |
| 5 to 17 Years | 0 (0.0%) | 0 (0.0%) |
| 18 to 34 Years | 0 (0.0%) | 0 (0.0%) |
| 35 to 64 Years | 40 (29.4%) | 25 (24.7%) |
| 65 to 74 Years | 36 (64.3%) | 44 (61.1%) |
| 75 Years and over | 35 (100.0%) | 61 (60.4%) |
Disability Class by Sex by Age in Norfolk
Disability Class: Hearing Difficulty
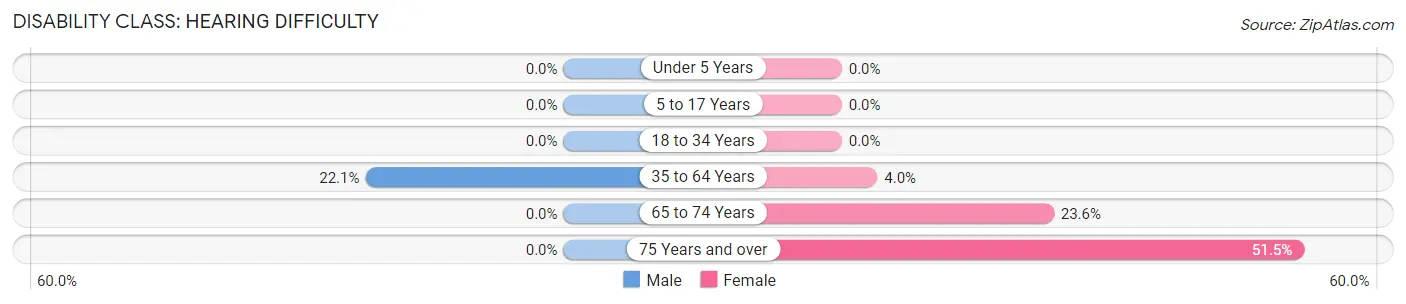
| Age Bracket | Male | Female |
| Under 5 Years | 0 (0.0%) | 0 (0.0%) |
| 5 to 17 Years | 0 (0.0%) | 0 (0.0%) |
| 18 to 34 Years | 0 (0.0%) | 0 (0.0%) |
| 35 to 64 Years | 30 (22.1%) | 4 (4.0%) |
| 65 to 74 Years | 0 (0.0%) | 17 (23.6%) |
| 75 Years and over | 0 (0.0%) | 52 (51.5%) |
Disability Class: Vision Difficulty
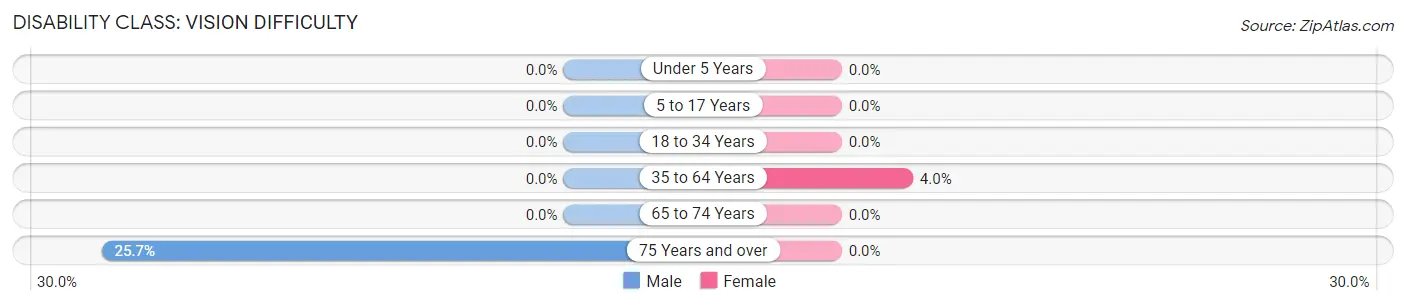
| Age Bracket | Male | Female |
| Under 5 Years | 0 (0.0%) | 0 (0.0%) |
| 5 to 17 Years | 0 (0.0%) | 0 (0.0%) |
| 18 to 34 Years | 0 (0.0%) | 0 (0.0%) |
| 35 to 64 Years | 0 (0.0%) | 4 (4.0%) |
| 65 to 74 Years | 0 (0.0%) | 0 (0.0%) |
| 75 Years and over | 9 (25.7%) | 0 (0.0%) |
Disability Class: Cognitive Difficulty
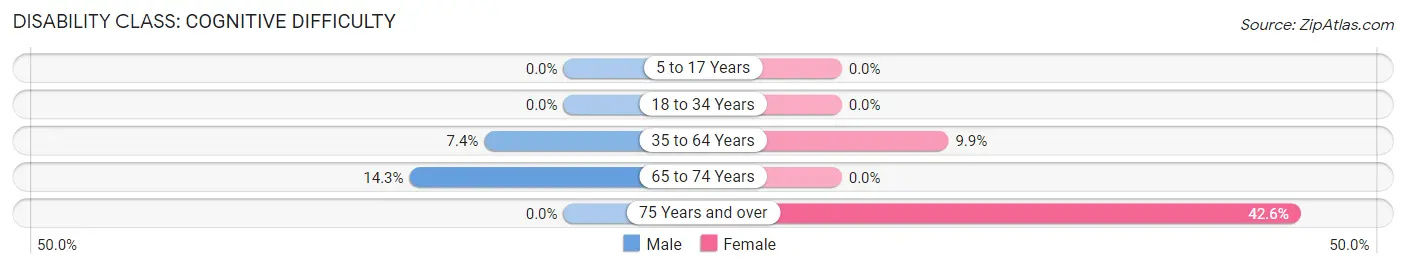
| Age Bracket | Male | Female |
| 5 to 17 Years | 0 (0.0%) | 0 (0.0%) |
| 18 to 34 Years | 0 (0.0%) | 0 (0.0%) |
| 35 to 64 Years | 10 (7.3%) | 10 (9.9%) |
| 65 to 74 Years | 8 (14.3%) | 0 (0.0%) |
| 75 Years and over | 0 (0.0%) | 43 (42.6%) |
Disability Class: Ambulatory Difficulty
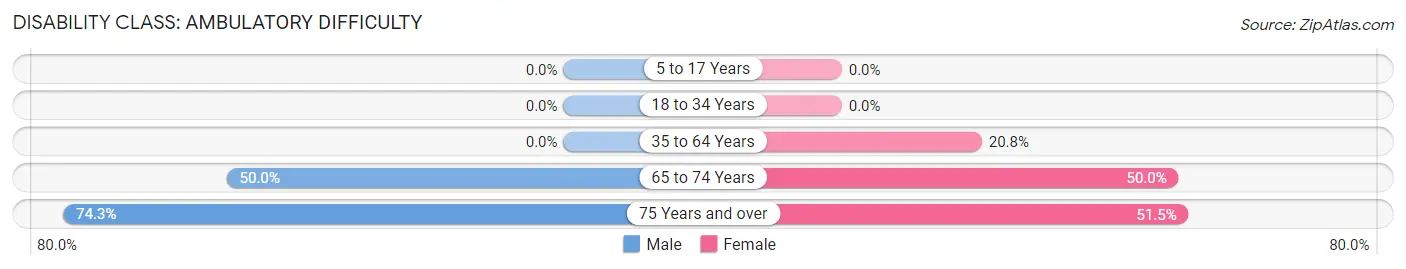
| Age Bracket | Male | Female |
| 5 to 17 Years | 0 (0.0%) | 0 (0.0%) |
| 18 to 34 Years | 0 (0.0%) | 0 (0.0%) |
| 35 to 64 Years | 0 (0.0%) | 21 (20.8%) |
| 65 to 74 Years | 28 (50.0%) | 36 (50.0%) |
| 75 Years and over | 26 (74.3%) | 52 (51.5%) |
Disability Class: Self-Care Difficulty
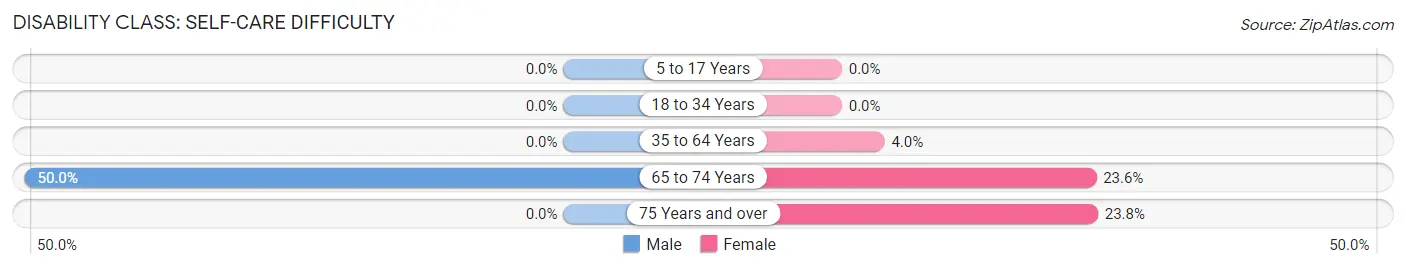
| Age Bracket | Male | Female |
| 5 to 17 Years | 0 (0.0%) | 0 (0.0%) |
| 18 to 34 Years | 0 (0.0%) | 0 (0.0%) |
| 35 to 64 Years | 0 (0.0%) | 4 (4.0%) |
| 65 to 74 Years | 28 (50.0%) | 17 (23.6%) |
| 75 Years and over | 0 (0.0%) | 24 (23.8%) |
Technology Access in Norfolk
Computing Device Access in Norfolk
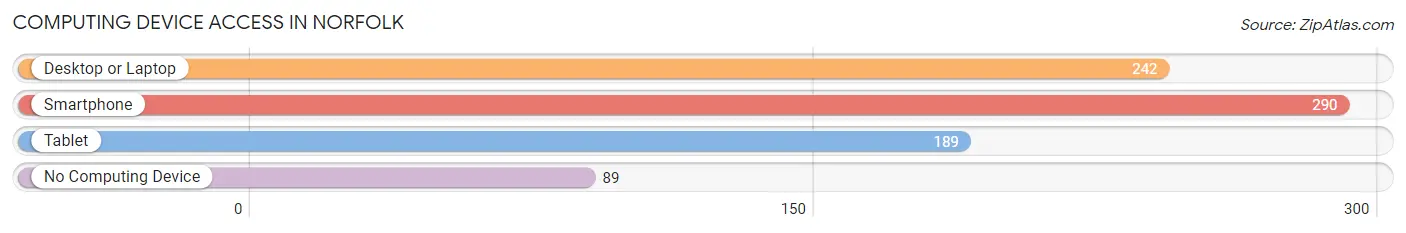
| Device Type | # Households | % Households |
| Desktop or Laptop | 242 | 57.6% |
| Smartphone | 290 | 69.1% |
| Tablet | 189 | 45.0% |
| No Computing Device | 89 | 21.2% |
| Total | 420 | 100.0% |
Internet Access in Norfolk
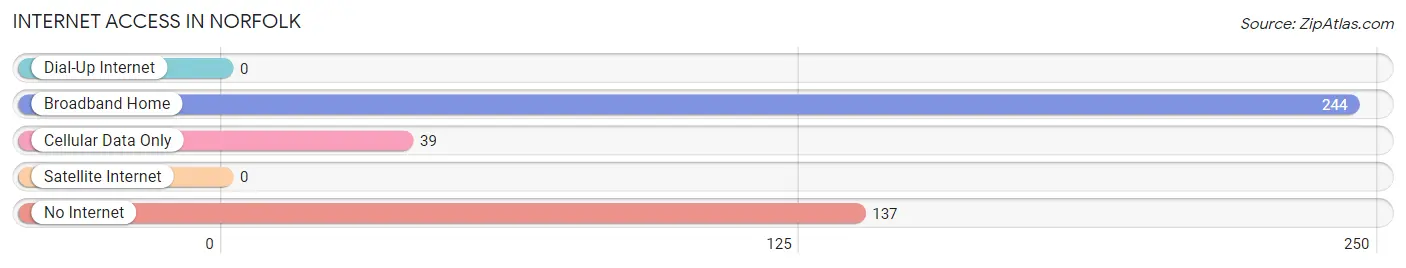
| Internet Type | # Households | % Households |
| Dial-Up Internet | 0 | 0.0% |
| Broadband Home | 244 | 58.1% |
| Cellular Data Only | 39 | 9.3% |
| Satellite Internet | 0 | 0.0% |
| No Internet | 137 | 32.6% |
| Total | 420 | 100.0% |
Norfolk Summary
Norfolk is a town located in St. Lawrence County, New York, United States. The population was 2,845 at the 2010 census. The town is named after Norfolk, England.
History
The town of Norfolk was first settled in 1802 by a group of settlers from Massachusetts. The town was formed from the town of Stockholm in 1808. The town was named after Norfolk, England.
In 1810, the first school was established in the town. The first church was built in 1812. The first post office was established in 1817.
In 1820 the first newspaper was established in the town The first railroad was built in 1851
Geography
Norfolk is located in the northern part of St. Lawrence County. It is bordered by the towns of Stockholm to the north, Massena to the east, Louisville to the south, and Hopkinton to the west.
The town is located on the St. Lawrence River, which forms the northern border of the town. The Grasse River flows through the town.
The town has a total area of 36.2 square miles, of which 35.7 square miles is land and 0.5 square miles is water.
Economy
The economy of Norfolk is largely based on agriculture and tourism. The town is home to several farms, which produce a variety of crops, including corn, soybeans, hay, and vegetables.
The town is also home to several tourist attractions, including the St. Lawrence River, the Grasse River, and the Norfolk Historical Society Museum.
Demographics
As of the 2010 census, there were 2,845 people, 1,093 households, and 790 families residing in the town. The population density was 79.7 people per square mile. There were 1,213 housing units at an average density of 33.9 per square mile.
The racial makeup of the town was 97.2% White, 0.7% African American, 0.3% Native American, 0.2% Asian, 0.1% Pacific Islander, 0.2% from other races, and 1.3% from two or more races. Hispanic or Latino of any race were 1.2% of the population.
There were 1,093 households, out of which 33.2% had children under the age of 18 living with them, 56.2% were married couples living together, 10.2% had a female householder with no husband present, and 28.7% were non-families. 24.2% of all households were made up of individuals, and 11.2% had someone living alone who was 65 years of age or older. The average household size was 2.60 and the average family size was 3.06.
In the town, the population was spread out, with 25.7% under the age of 18, 7.2% from 18 to 24, 27.2% from 25 to 44, 25.2% from 45 to 64, and 14.7% who were 65 years of age or older. The median age was 38 years. For every 100 females, there were 97.2 males. For every 100 females age 18 and over, there were 94.2 males.
The median income for a household in the town was $37,917, and the median income for a family was $45,000. Males had a median income of $31,964 versus $25,000 for females. The per capita income for the town was $17,845. About 8.2% of families and 11.2% of the population were below the poverty line, including 14.2% of those under age 18 and 8.2% of those age 65 or over.
Common Questions
What is Per Capita Income in Norfolk?
Per Capita income in Norfolk is $27,210.
What is the Median Family Income in Norfolk?
Median Family Income in Norfolk is $48,798.
What is the Median Household income in Norfolk?
Median Household Income in Norfolk is $49,071.
What is Income or Wage Gap in Norfolk?
Income or Wage Gap in Norfolk is 56.0%.
Women in Norfolk earn 44.0 cents for every dollar earned by a man.
What is Inequality or Gini Index in Norfolk?
Inequality or Gini Index in Norfolk is 0.38.
What is the Total Population of Norfolk?
Total Population of Norfolk is 869.
What is the Total Male Population of Norfolk?
Total Male Population of Norfolk is 388.
What is the Total Female Population of Norfolk?
Total Female Population of Norfolk is 481.
What is the Ratio of Males per 100 Females in Norfolk?
There are 80.67 Males per 100 Females in Norfolk.
What is the Ratio of Females per 100 Males in Norfolk?
There are 123.97 Females per 100 Males in Norfolk.
What is the Median Population Age in Norfolk?
Median Population Age in Norfolk is 50.3 Years.
What is the Average Family Size in Norfolk
Average Family Size in Norfolk is 2.5 People.
What is the Average Household Size in Norfolk
Average Household Size in Norfolk is 2.1 People.
How Large is the Labor Force in Norfolk?
There are 358 People in the Labor Forcein in Norfolk.
What is the Percentage of People in the Labor Force in Norfolk?
50.8% of People are in the Labor Force in Norfolk.
What is the Unemployment Rate in Norfolk?
Unemployment Rate in Norfolk is 5.9%.