Pearl River, NY Map & Demographics
Pearl River Map
Pearl River Overview
$59,293
PER CAPITA INCOME
$151,709
AVG FAMILY INCOME
$137,331
AVG HOUSEHOLD INCOME
32.2%
WAGE / INCOME GAP [ % ]
67.8¢/ $1
WAGE / INCOME GAP [ $ ]
0.42
INEQUALITY / GINI INDEX
16,426
TOTAL POPULATION
8,328
MALE POPULATION
8,098
FEMALE POPULATION
102.84
MALES / 100 FEMALES
97.24
FEMALES / 100 MALES
39.6
MEDIAN AGE
3.3
AVG FAMILY SIZE
2.9
AVG HOUSEHOLD SIZE
8,318
LABOR FORCE [ PEOPLE ]
63.0%
PERCENT IN LABOR FORCE
3.2%
UNEMPLOYMENT RATE
Pearl River Zip Codes
Income in Pearl River
Income Overview in Pearl River
Per Capita Income in Pearl River is $59,293, while median incomes of families and households are $151,709 and $137,331 respectively.
| Characteristic | Number | Measure |
| Per Capita Income | 16,426 | $59,293 |
| Median Family Income | 4,405 | $151,709 |
| Mean Family Income | 4,405 | $190,909 |
| Median Household Income | 5,714 | $137,331 |
| Mean Household Income | 5,714 | $170,441 |
| Income Deficit | 4,405 | $0 |
| Wage / Income Gap (%) | 16,426 | 32.15% |
| Wage / Income Gap ($) | 16,426 | 67.85¢ per $1 |
| Gini / Inequality Index | 16,426 | 0.42 |
Earnings by Sex in Pearl River
Average Earnings in Pearl River are $68,650, $83,090 for men and $56,373 for women, a difference of 32.2%.
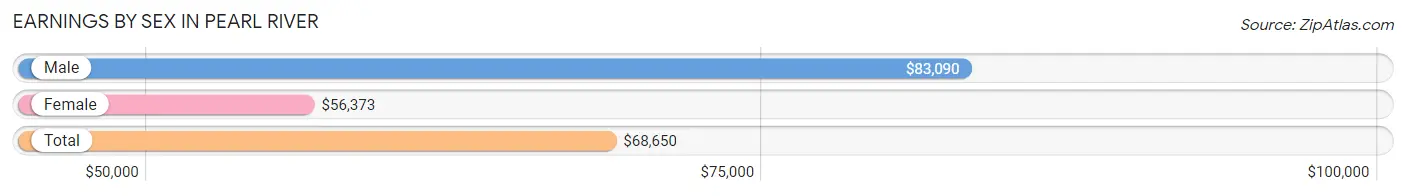
| Sex | Number | Average Earnings |
| Male | 4,763 (53.3%) | $83,090 |
| Female | 4,164 (46.7%) | $56,373 |
| Total | 8,927 (100.0%) | $68,650 |
Earnings by Sex by Income Bracket in Pearl River
The most common earnings brackets in Pearl River are $100,000+ for men (1,958 | 41.1%) and $100,000+ for women (1,031 | 24.8%).
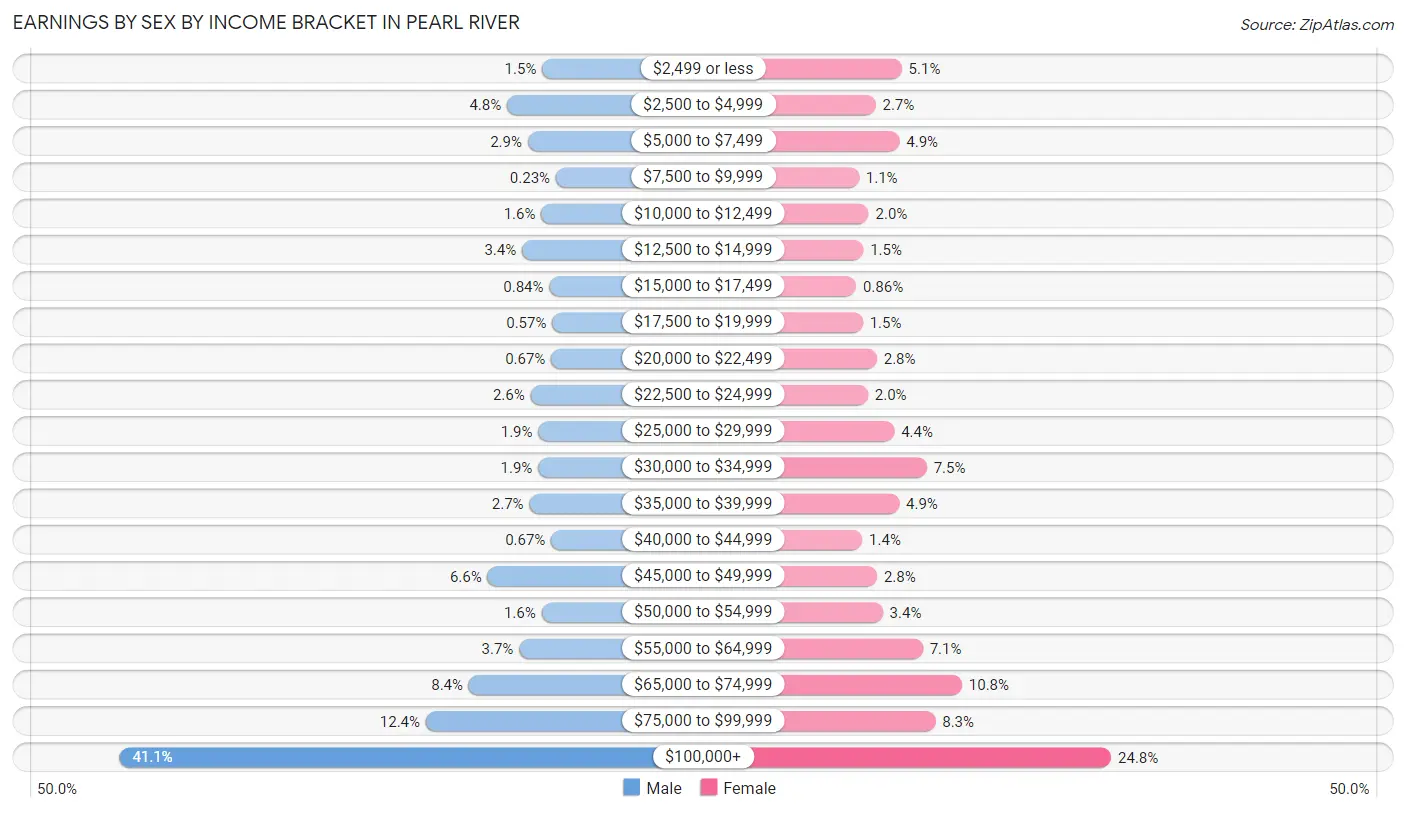
| Income | Male | Female |
| $2,499 or less | 72 (1.5%) | 214 (5.1%) |
| $2,500 to $4,999 | 229 (4.8%) | 112 (2.7%) |
| $5,000 to $7,499 | 136 (2.9%) | 205 (4.9%) |
| $7,500 to $9,999 | 11 (0.2%) | 47 (1.1%) |
| $10,000 to $12,499 | 76 (1.6%) | 85 (2.0%) |
| $12,500 to $14,999 | 162 (3.4%) | 64 (1.5%) |
| $15,000 to $17,499 | 40 (0.8%) | 36 (0.9%) |
| $17,500 to $19,999 | 27 (0.6%) | 62 (1.5%) |
| $20,000 to $22,499 | 32 (0.7%) | 117 (2.8%) |
| $22,500 to $24,999 | 124 (2.6%) | 82 (2.0%) |
| $25,000 to $29,999 | 89 (1.9%) | 185 (4.4%) |
| $30,000 to $34,999 | 90 (1.9%) | 312 (7.5%) |
| $35,000 to $39,999 | 129 (2.7%) | 204 (4.9%) |
| $40,000 to $44,999 | 32 (0.7%) | 60 (1.4%) |
| $45,000 to $49,999 | 316 (6.6%) | 118 (2.8%) |
| $50,000 to $54,999 | 75 (1.6%) | 140 (3.4%) |
| $55,000 to $64,999 | 175 (3.7%) | 296 (7.1%) |
| $65,000 to $74,999 | 399 (8.4%) | 449 (10.8%) |
| $75,000 to $99,999 | 591 (12.4%) | 345 (8.3%) |
| $100,000+ | 1,958 (41.1%) | 1,031 (24.8%) |
| Total | 4,763 (100.0%) | 4,164 (100.0%) |
Earnings by Sex by Educational Attainment in Pearl River
Average earnings in Pearl River are $95,707 for men and $59,802 for women, a difference of 37.5%. Men with an educational attainment of graduate degree enjoy the highest average annual earnings of $126,797, while those with high school diploma education earn the least with $69,041. Women with an educational attainment of graduate degree earn the most with the average annual earnings of $86,610, while those with less than high school education have the smallest earnings of $5,550.
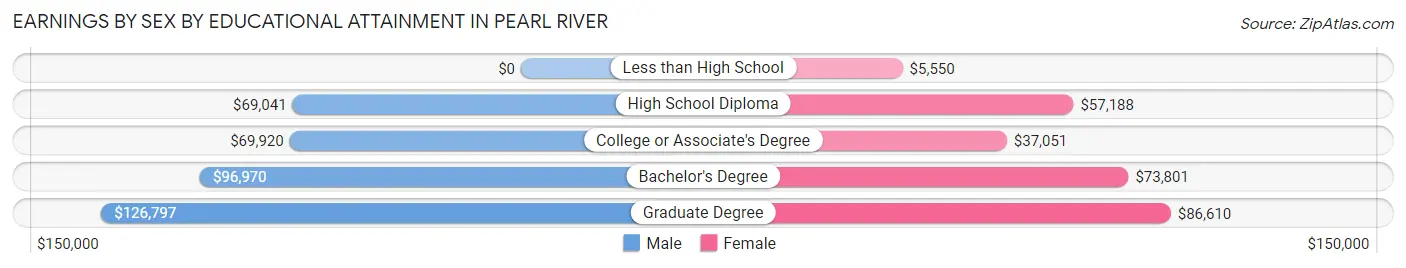
| Educational Attainment | Male Income | Female Income |
| Less than High School | - | - |
| High School Diploma | $69,041 | $57,188 |
| College or Associate's Degree | $69,920 | $37,051 |
| Bachelor's Degree | $96,970 | $73,801 |
| Graduate Degree | $126,797 | $86,610 |
| Total | $95,707 | $59,802 |
Family Income in Pearl River
Family Income Brackets in Pearl River
According to the Pearl River family income data, there are 1,603 families falling into the $200,000+ income range, which is the most common income bracket and makes up 36.4% of all families.
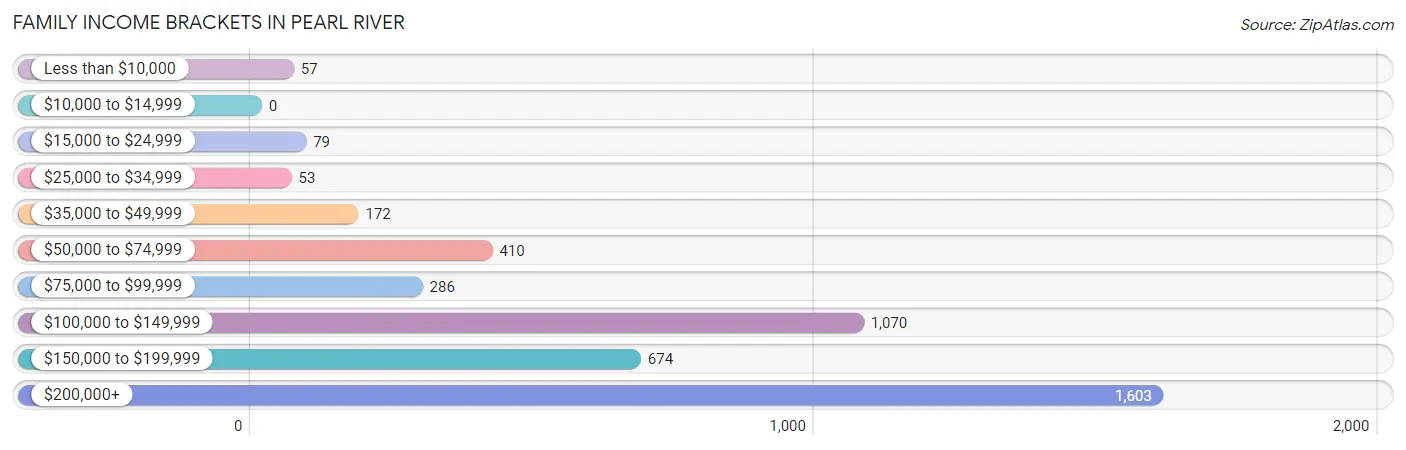
| Income Bracket | # Families | % Families |
| Less than $10,000 | 57 | 1.3% |
| $10,000 to $14,999 | 0 | 0.0% |
| $15,000 to $24,999 | 79 | 1.8% |
| $25,000 to $34,999 | 53 | 1.2% |
| $35,000 to $49,999 | 172 | 3.9% |
| $50,000 to $74,999 | 410 | 9.3% |
| $75,000 to $99,999 | 286 | 6.5% |
| $100,000 to $149,999 | 1,070 | 24.3% |
| $150,000 to $199,999 | 674 | 15.3% |
| $200,000+ | 1,603 | 36.4% |
Family Income by Famaliy Size in Pearl River
7+ person families (66 | 1.5%) account for the highest median family income in Pearl River with $250,001 per family, while 2-person families (1,844 | 41.9%) have the highest median income of $63,528 per family member.
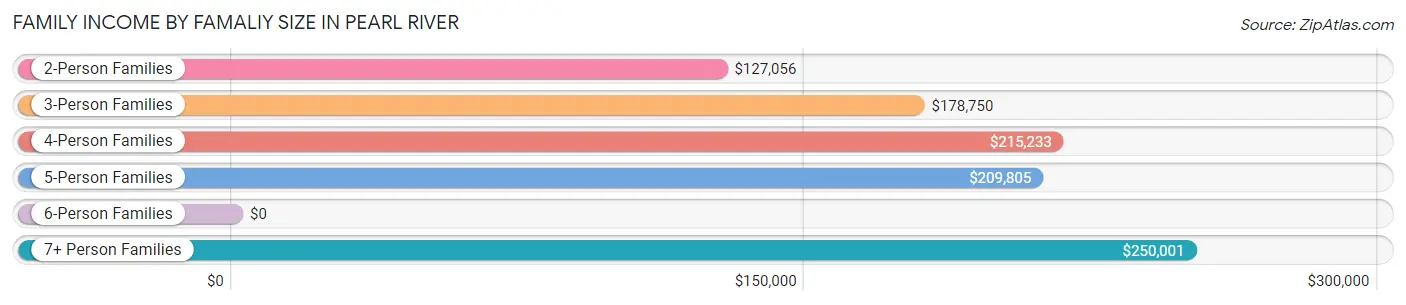
| Income Bracket | # Families | Median Income |
| 2-Person Families | 1,844 (41.9%) | $127,056 |
| 3-Person Families | 725 (16.5%) | $178,750 |
| 4-Person Families | 1,112 (25.2%) | $215,233 |
| 5-Person Families | 562 (12.8%) | $209,805 |
| 6-Person Families | 96 (2.2%) | $0 |
| 7+ Person Families | 66 (1.5%) | $250,001 |
| Total | 4,405 (100.0%) | $151,709 |
Family Income by Number of Earners in Pearl River
The median family income in Pearl River is $151,709, with families comprising 3+ earners (771) having the highest median family income of $250,001, while families with no earners (582) have the lowest median family income of $100,000, accounting for 17.5% and 13.2% of families, respectively.
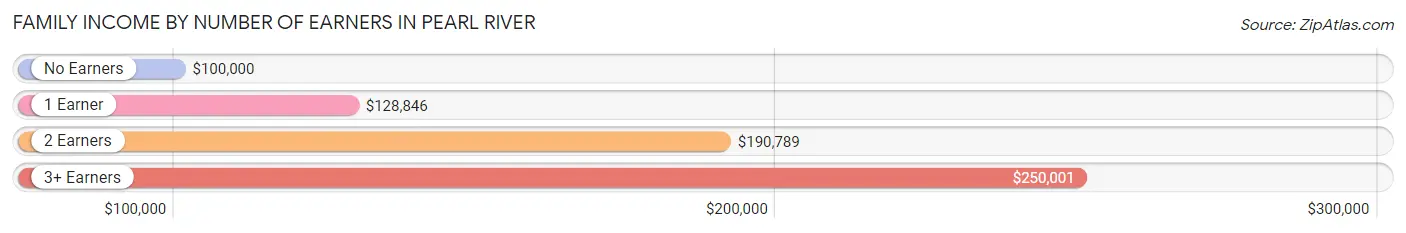
| Number of Earners | # Families | Median Income |
| No Earners | 582 (13.2%) | $100,000 |
| 1 Earner | 1,132 (25.7%) | $128,846 |
| 2 Earners | 1,920 (43.6%) | $190,789 |
| 3+ Earners | 771 (17.5%) | $250,001 |
| Total | 4,405 (100.0%) | $151,709 |
Household Income in Pearl River
Household Income Brackets in Pearl River
With 1,846 households falling in the category, the $200,000+ income range is the most frequent in Pearl River, accounting for 32.3% of all households. In contrast, only 46 households (0.8%) fall into the $10,000 to $14,999 income bracket, making it the least populous group.
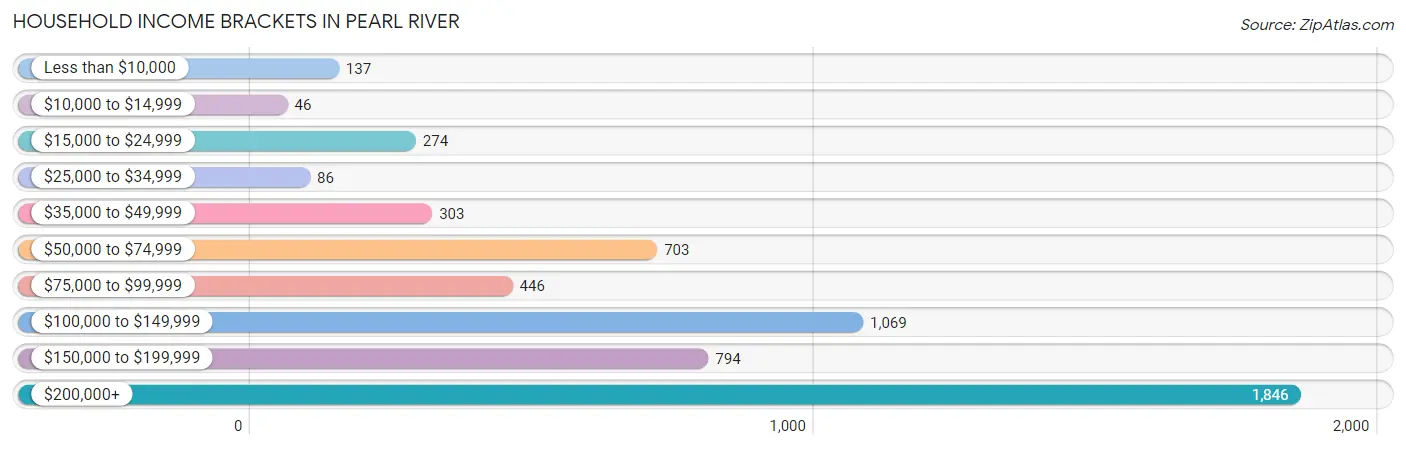
| Income Bracket | # Households | % Households |
| Less than $10,000 | 137 | 2.4% |
| $10,000 to $14,999 | 46 | 0.8% |
| $15,000 to $24,999 | 274 | 4.8% |
| $25,000 to $34,999 | 86 | 1.5% |
| $35,000 to $49,999 | 303 | 5.3% |
| $50,000 to $74,999 | 703 | 12.3% |
| $75,000 to $99,999 | 446 | 7.8% |
| $100,000 to $149,999 | 1,069 | 18.7% |
| $150,000 to $199,999 | 794 | 13.9% |
| $200,000+ | 1,846 | 32.3% |
Household Income by Householder Age in Pearl River
The median household income in Pearl River is $137,331, with the highest median household income of $197,188 found in the 45 to 64 years age bracket for the primary householder. A total of 2,132 households (37.3%) fall into this category. Meanwhile, the 15 to 24 years age bracket for the primary householder has the lowest median household income of $0, with 71 households (1.2%) in this group.
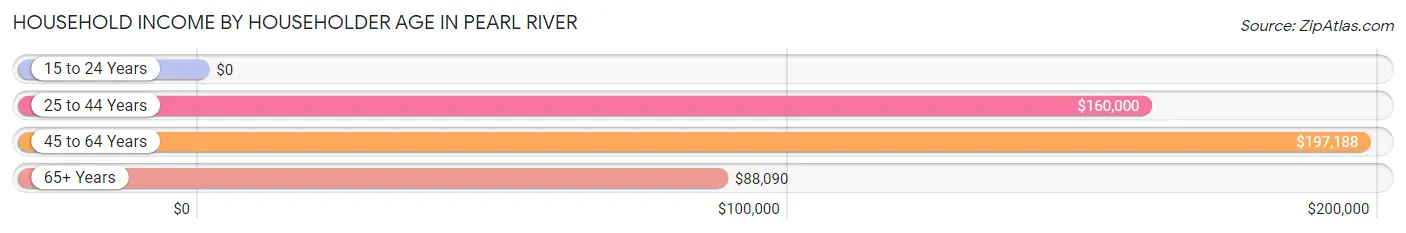
| Income Bracket | # Households | Median Income |
| 15 to 24 Years | 71 (1.2%) | $0 |
| 25 to 44 Years | 1,484 (26.0%) | $160,000 |
| 45 to 64 Years | 2,132 (37.3%) | $197,188 |
| 65+ Years | 2,027 (35.5%) | $88,090 |
| Total | 5,714 (100.0%) | $137,331 |
Poverty in Pearl River
Income Below Poverty by Sex and Age in Pearl River
With 7.7% poverty level for males and 4.7% for females among the residents of Pearl River, 6 to 11 year old males and 15 year old females are the most vulnerable to poverty, with 212 males (26.8%) and 25 females (36.8%) in their respective age groups living below the poverty level.
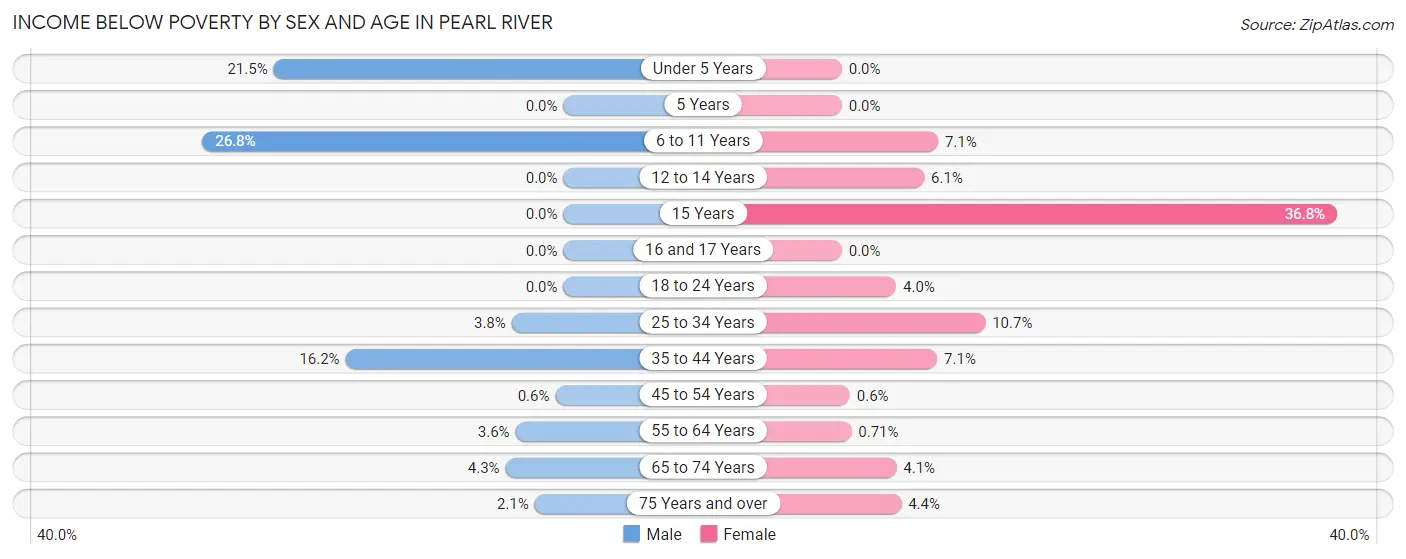
| Age Bracket | Male | Female |
| Under 5 Years | 133 (21.5%) | 0 (0.0%) |
| 5 Years | 0 (0.0%) | 0 (0.0%) |
| 6 to 11 Years | 212 (26.8%) | 46 (7.1%) |
| 12 to 14 Years | 0 (0.0%) | 14 (6.1%) |
| 15 Years | 0 (0.0%) | 25 (36.8%) |
| 16 and 17 Years | 0 (0.0%) | 0 (0.0%) |
| 18 to 24 Years | 0 (0.0%) | 31 (4.0%) |
| 25 to 34 Years | 24 (3.8%) | 123 (10.6%) |
| 35 to 44 Years | 181 (16.2%) | 58 (7.1%) |
| 45 to 54 Years | 7 (0.6%) | 7 (0.6%) |
| 55 to 64 Years | 34 (3.6%) | 7 (0.7%) |
| 65 to 74 Years | 34 (4.3%) | 24 (4.1%) |
| 75 Years and over | 16 (2.1%) | 43 (4.4%) |
| Total | 641 (7.7%) | 378 (4.7%) |
Income Above Poverty by Sex and Age in Pearl River
According to the poverty statistics in Pearl River, males aged 5 years and females aged under 5 years are the age groups that are most secure financially, with 100.0% of males and 100.0% of females in these age groups living above the poverty line.
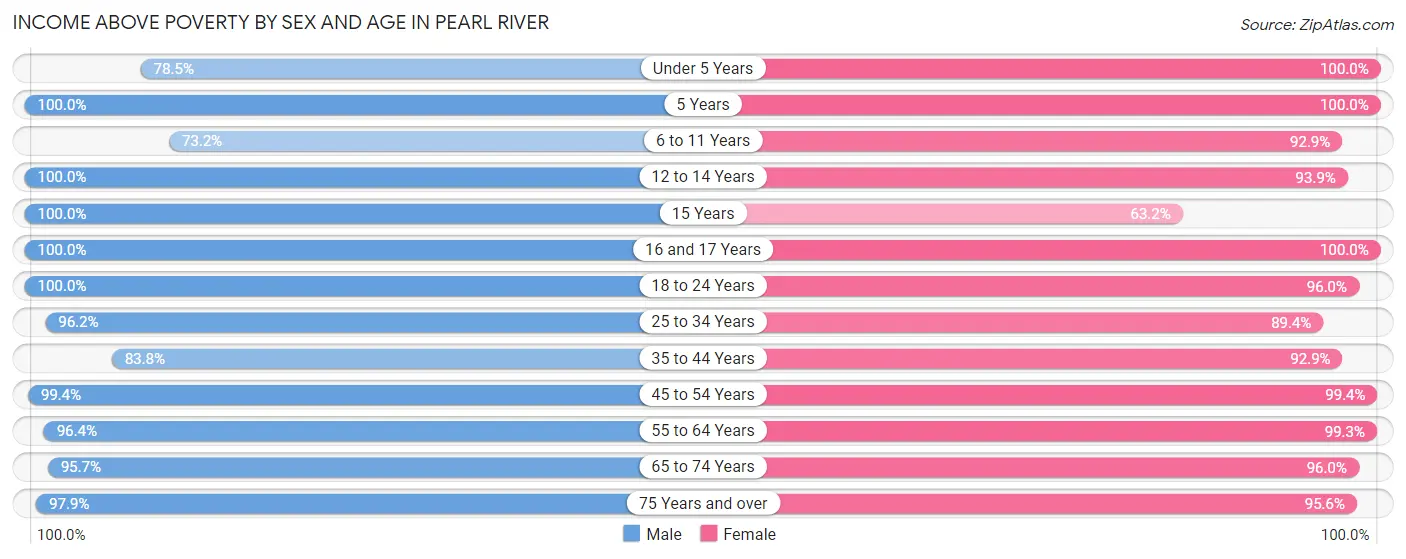
| Age Bracket | Male | Female |
| Under 5 Years | 485 (78.5%) | 365 (100.0%) |
| 5 Years | 81 (100.0%) | 102 (100.0%) |
| 6 to 11 Years | 579 (73.2%) | 598 (92.9%) |
| 12 to 14 Years | 264 (100.0%) | 215 (93.9%) |
| 15 Years | 40 (100.0%) | 43 (63.2%) |
| 16 and 17 Years | 263 (100.0%) | 188 (100.0%) |
| 18 to 24 Years | 845 (100.0%) | 739 (96.0%) |
| 25 to 34 Years | 601 (96.2%) | 1,032 (89.3%) |
| 35 to 44 Years | 938 (83.8%) | 761 (92.9%) |
| 45 to 54 Years | 1,160 (99.4%) | 1,169 (99.4%) |
| 55 to 64 Years | 921 (96.4%) | 973 (99.3%) |
| 65 to 74 Years | 756 (95.7%) | 569 (96.0%) |
| 75 Years and over | 733 (97.9%) | 931 (95.6%) |
| Total | 7,666 (92.3%) | 7,685 (95.3%) |
Income Below Poverty Among Married-Couple Families in Pearl River
The poverty statistics for married-couple families in Pearl River show that 2.4% or 90 of the total 3,692 families live below the poverty line. Families with 3 or 4 children have the highest poverty rate of 17.8%, comprising of 74 families. On the other hand, families with 1 or 2 children have the lowest poverty rate of 0.0%, which includes 0 families.
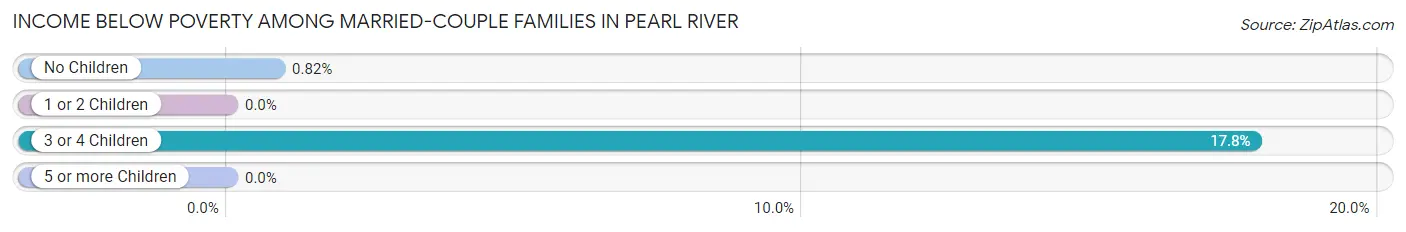
| Children | Above Poverty | Below Poverty |
| No Children | 1,939 (99.2%) | 16 (0.8%) |
| 1 or 2 Children | 1,314 (100.0%) | 0 (0.0%) |
| 3 or 4 Children | 341 (82.2%) | 74 (17.8%) |
| 5 or more Children | 8 (100.0%) | 0 (0.0%) |
| Total | 3,602 (97.6%) | 90 (2.4%) |
Income Below Poverty Among Single-Parent Households in Pearl River
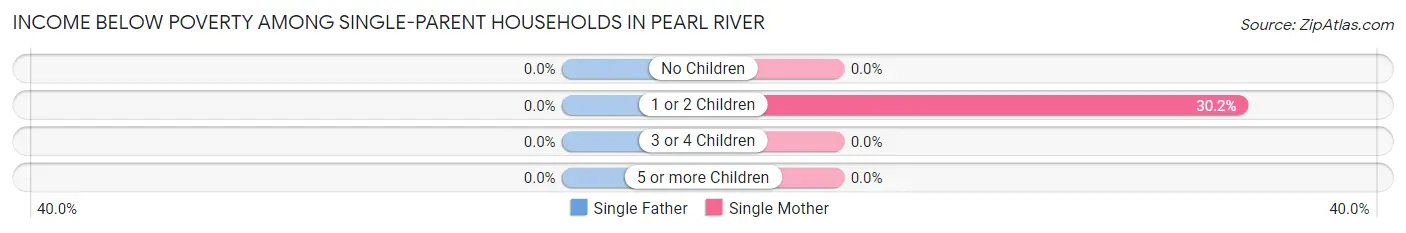
| Children | Single Father | Single Mother |
| No Children | 0 (0.0%) | 0 (0.0%) |
| 1 or 2 Children | 0 (0.0%) | 41 (30.1%) |
| 3 or 4 Children | 0 (0.0%) | 0 (0.0%) |
| 5 or more Children | 0 (0.0%) | 0 (0.0%) |
| Total | 0 (0.0%) | 41 (11.4%) |
Income Below Poverty Among Married-Couple vs Single-Parent Households in Pearl River
The poverty data for Pearl River shows that 90 of the married-couple family households (2.4%) and 41 of the single-parent households (5.8%) are living below the poverty level. Within the married-couple family households, those with 3 or 4 children have the highest poverty rate, with 74 households (17.8%) falling below the poverty line. Among the single-parent households, those with 1 or 2 children have the highest poverty rate, with 41 household (20.0%) living below poverty.
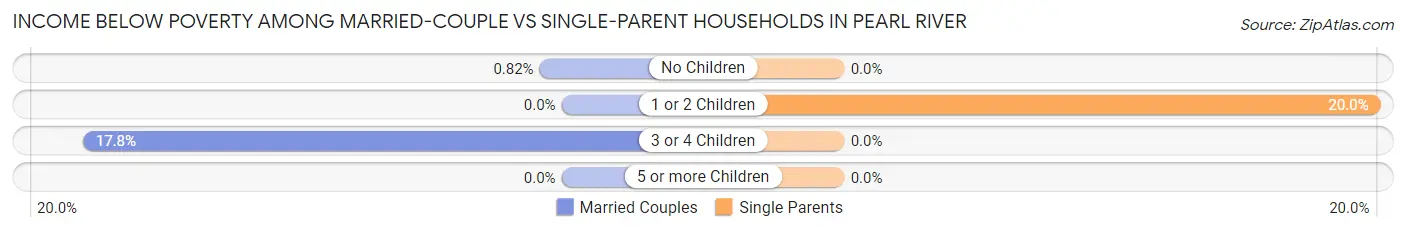
| Children | Married-Couple Families | Single-Parent Households |
| No Children | 16 (0.8%) | 0 (0.0%) |
| 1 or 2 Children | 0 (0.0%) | 41 (20.0%) |
| 3 or 4 Children | 74 (17.8%) | 0 (0.0%) |
| 5 or more Children | 0 (0.0%) | 0 (0.0%) |
| Total | 90 (2.4%) | 41 (5.8%) |
Race in Pearl River
The most populous races in Pearl River are White / Caucasian (13,484 | 82.1%), Hispanic or Latino (2,284 | 13.9%), and Some other Race (1,673 | 10.2%).
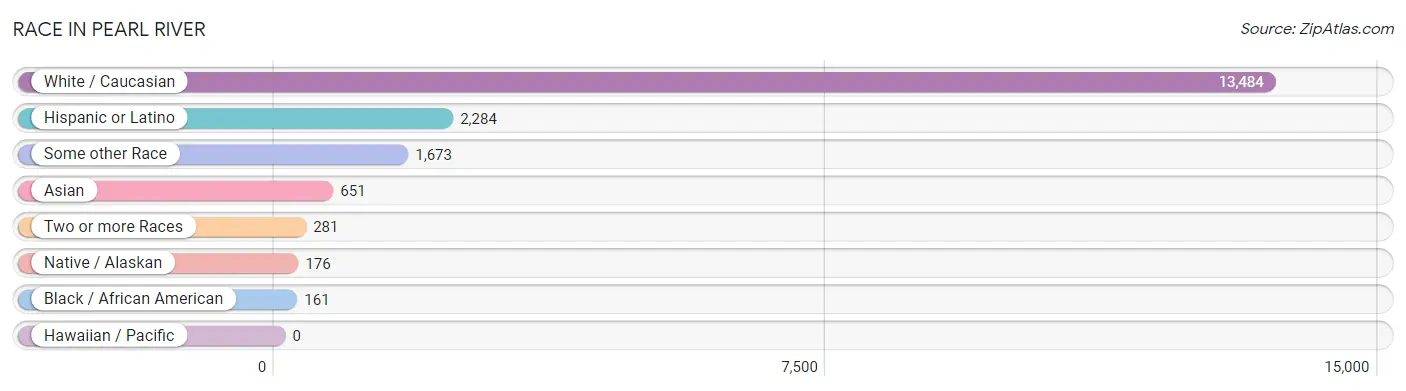
| Race | # Population | % Population |
| Asian | 651 | 4.0% |
| Black / African American | 161 | 1.0% |
| Hawaiian / Pacific | 0 | 0.0% |
| Hispanic or Latino | 2,284 | 13.9% |
| Native / Alaskan | 176 | 1.1% |
| White / Caucasian | 13,484 | 82.1% |
| Two or more Races | 281 | 1.7% |
| Some other Race | 1,673 | 10.2% |
| Total | 16,426 | 100.0% |
Ancestry in Pearl River
The most populous ancestries reported in Pearl River are Irish (5,715 | 34.8%), Italian (2,646 | 16.1%), German (1,644 | 10.0%), Polish (914 | 5.6%), and English (877 | 5.3%), together accounting for 71.8% of all Pearl River residents.
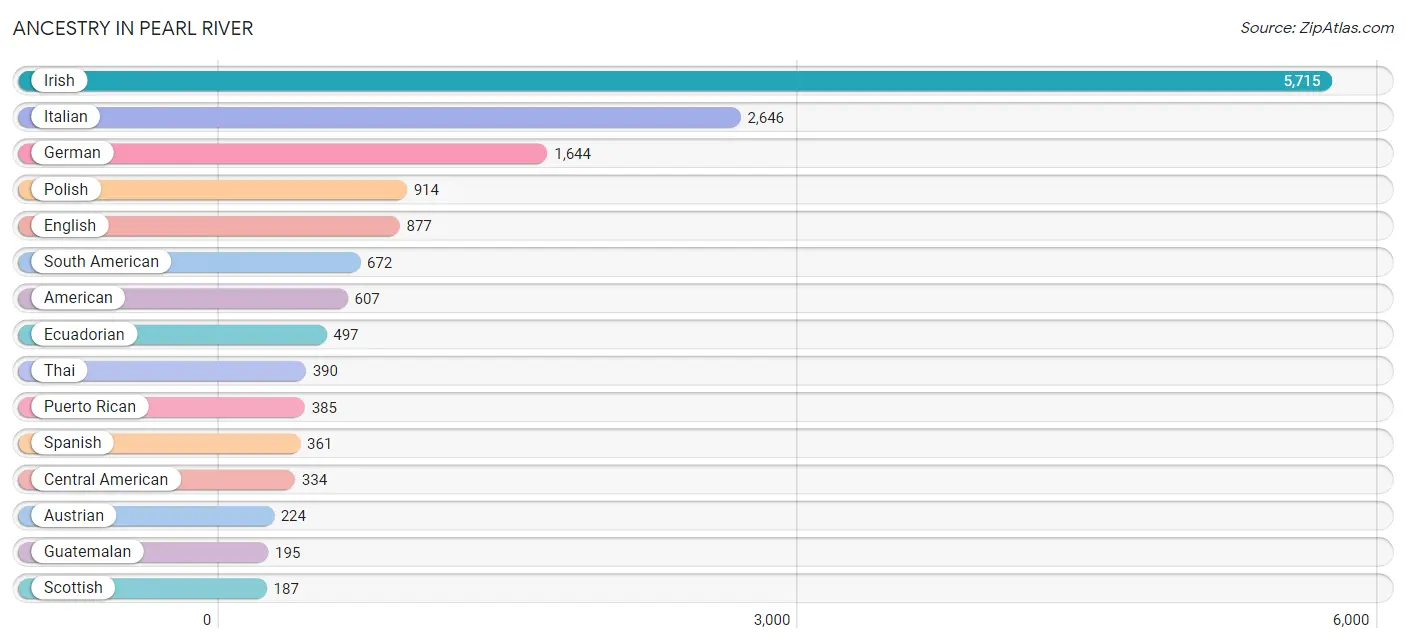
| Ancestry | # Population | % Population |
| African | 39 | 0.2% |
| American | 607 | 3.7% |
| Arab | 47 | 0.3% |
| Argentinean | 18 | 0.1% |
| Armenian | 25 | 0.2% |
| Austrian | 224 | 1.4% |
| Belgian | 11 | 0.1% |
| Bhutanese | 17 | 0.1% |
| British | 43 | 0.3% |
| Burmese | 127 | 0.8% |
| Canadian | 14 | 0.1% |
| Central American | 334 | 2.0% |
| Central American Indian | 34 | 0.2% |
| Cherokee | 4 | 0.0% |
| Colombian | 27 | 0.2% |
| Costa Rican | 5 | 0.0% |
| Croatian | 29 | 0.2% |
| Cuban | 40 | 0.2% |
| Czech | 32 | 0.2% |
| Czechoslovakian | 21 | 0.1% |
| Danish | 56 | 0.3% |
| Delaware | 12 | 0.1% |
| Dominican | 7 | 0.0% |
| Dutch | 90 | 0.5% |
| Eastern European | 98 | 0.6% |
| Ecuadorian | 497 | 3.0% |
| Egyptian | 18 | 0.1% |
| English | 877 | 5.3% |
| European | 81 | 0.5% |
| French | 95 | 0.6% |
| German | 1,644 | 10.0% |
| Greek | 73 | 0.4% |
| Guatemalan | 195 | 1.2% |
| Haitian | 13 | 0.1% |
| Hungarian | 120 | 0.7% |
| Indian (Asian) | 95 | 0.6% |
| Irish | 5,715 | 34.8% |
| Italian | 2,646 | 16.1% |
| Korean | 127 | 0.8% |
| Lebanese | 11 | 0.1% |
| Lithuanian | 19 | 0.1% |
| Mexican | 126 | 0.8% |
| Native Hawaiian | 13 | 0.1% |
| Norwegian | 70 | 0.4% |
| Palestinian | 18 | 0.1% |
| Peruvian | 130 | 0.8% |
| Polish | 914 | 5.6% |
| Portuguese | 59 | 0.4% |
| Puerto Rican | 385 | 2.3% |
| Romanian | 13 | 0.1% |
| Russian | 134 | 0.8% |
| Salvadoran | 134 | 0.8% |
| Scotch-Irish | 62 | 0.4% |
| Scottish | 187 | 1.1% |
| Slovak | 53 | 0.3% |
| South American | 672 | 4.1% |
| South American Indian | 130 | 0.8% |
| Spaniard | 62 | 0.4% |
| Spanish | 361 | 2.2% |
| Subsaharan African | 39 | 0.2% |
| Swedish | 114 | 0.7% |
| Thai | 390 | 2.4% |
| Tongan | 9 | 0.1% |
| Trinidadian and Tobagonian | 9 | 0.1% |
| Ukrainian | 186 | 1.1% |
| Welsh | 63 | 0.4% | View All 66 Rows |
Immigrants in Pearl River
The most numerous immigrant groups reported in Pearl River came from Latin America (1,238 | 7.5%), Europe (1,148 | 7.0%), South America (873 | 5.3%), Ecuador (771 | 4.7%), and Northern Europe (704 | 4.3%), together accounting for 28.8% of all Pearl River residents.
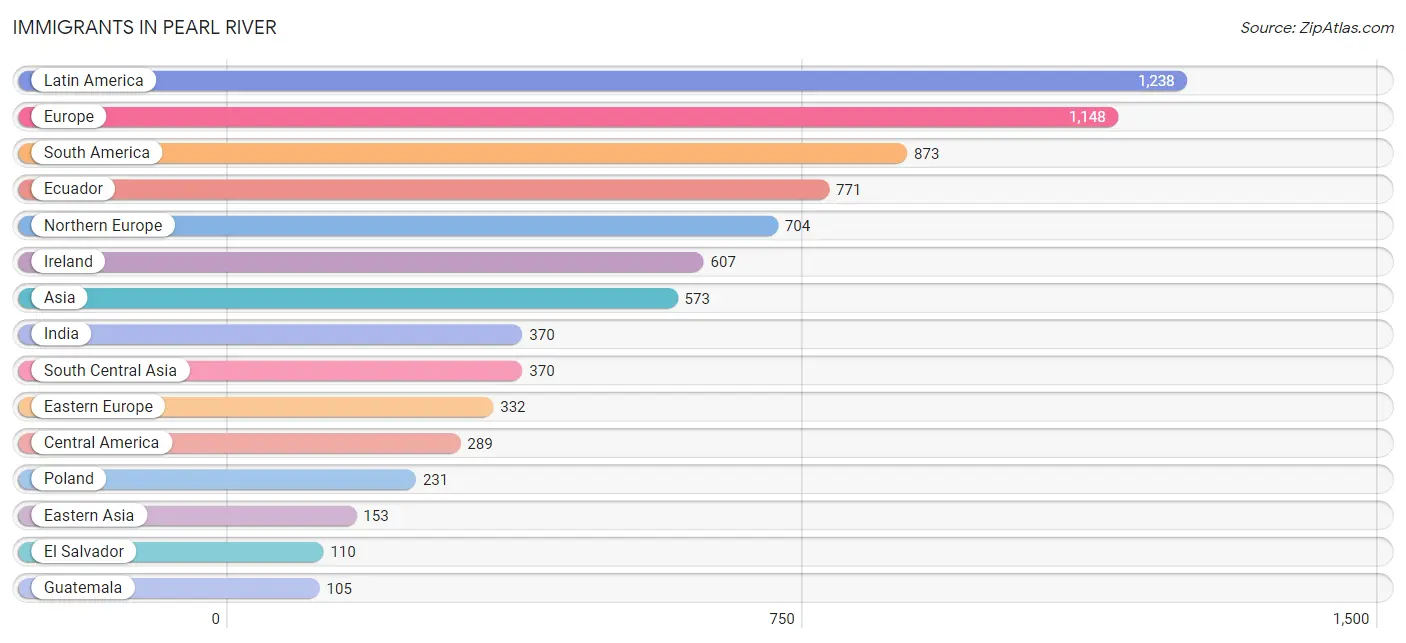
| Immigration Origin | # Population | % Population |
| Africa | 64 | 0.4% |
| Argentina | 18 | 0.1% |
| Asia | 573 | 3.5% |
| Austria | 31 | 0.2% |
| Belarus | 33 | 0.2% |
| Bolivia | 25 | 0.2% |
| Brazil | 59 | 0.4% |
| Caribbean | 76 | 0.5% |
| Central America | 289 | 1.8% |
| China | 59 | 0.4% |
| Costa Rica | 5 | 0.0% |
| Cuba | 35 | 0.2% |
| Dominican Republic | 7 | 0.0% |
| Eastern Asia | 153 | 0.9% |
| Eastern Europe | 332 | 2.0% |
| Ecuador | 771 | 4.7% |
| Egypt | 18 | 0.1% |
| El Salvador | 110 | 0.7% |
| England | 31 | 0.2% |
| Europe | 1,148 | 7.0% |
| Germany | 31 | 0.2% |
| Ghana | 24 | 0.2% |
| Greece | 11 | 0.1% |
| Guatemala | 105 | 0.6% |
| Haiti | 25 | 0.2% |
| India | 370 | 2.2% |
| Ireland | 607 | 3.7% |
| Israel | 6 | 0.0% |
| Italy | 39 | 0.2% |
| Japan | 17 | 0.1% |
| Korea | 77 | 0.5% |
| Latin America | 1,238 | 7.5% |
| Mexico | 69 | 0.4% |
| Nigeria | 7 | 0.0% |
| Northern Africa | 18 | 0.1% |
| Northern Europe | 704 | 4.3% |
| Philippines | 44 | 0.3% |
| Poland | 231 | 1.4% |
| Scotland | 33 | 0.2% |
| South America | 873 | 5.3% |
| South Central Asia | 370 | 2.2% |
| South Eastern Asia | 44 | 0.3% |
| Southern Europe | 50 | 0.3% |
| Trinidad and Tobago | 9 | 0.1% |
| Ukraine | 68 | 0.4% |
| Western Africa | 46 | 0.3% |
| Western Asia | 6 | 0.0% |
| Western Europe | 62 | 0.4% | View All 48 Rows |
Sex and Age in Pearl River
Sex and Age in Pearl River
The most populous age groups in Pearl River are 35 to 39 Years (774 | 9.3%) for men and 25 to 29 Years (697 | 8.6%) for women.
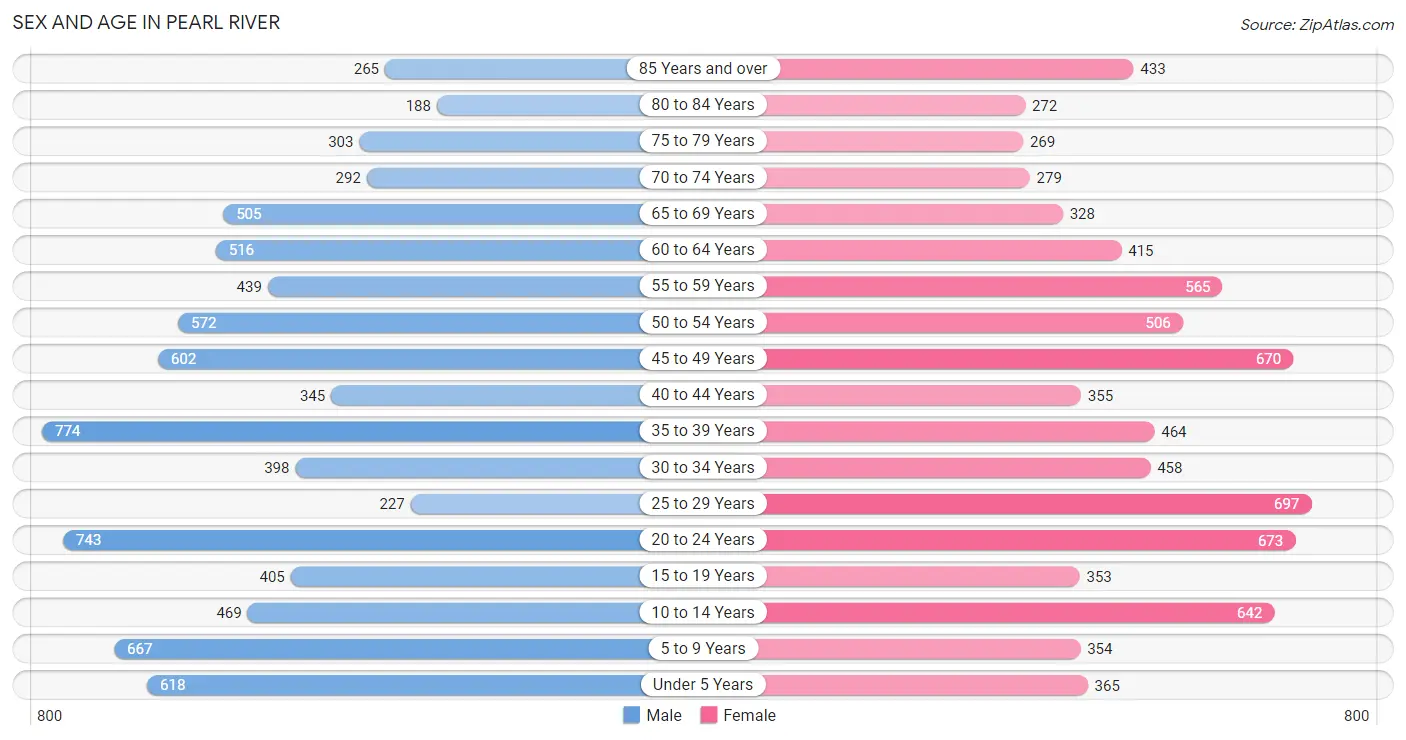
| Age Bracket | Male | Female |
| Under 5 Years | 618 (7.4%) | 365 (4.5%) |
| 5 to 9 Years | 667 (8.0%) | 354 (4.4%) |
| 10 to 14 Years | 469 (5.6%) | 642 (7.9%) |
| 15 to 19 Years | 405 (4.9%) | 353 (4.4%) |
| 20 to 24 Years | 743 (8.9%) | 673 (8.3%) |
| 25 to 29 Years | 227 (2.7%) | 697 (8.6%) |
| 30 to 34 Years | 398 (4.8%) | 458 (5.7%) |
| 35 to 39 Years | 774 (9.3%) | 464 (5.7%) |
| 40 to 44 Years | 345 (4.1%) | 355 (4.4%) |
| 45 to 49 Years | 602 (7.2%) | 670 (8.3%) |
| 50 to 54 Years | 572 (6.9%) | 506 (6.2%) |
| 55 to 59 Years | 439 (5.3%) | 565 (7.0%) |
| 60 to 64 Years | 516 (6.2%) | 415 (5.1%) |
| 65 to 69 Years | 505 (6.1%) | 328 (4.1%) |
| 70 to 74 Years | 292 (3.5%) | 279 (3.5%) |
| 75 to 79 Years | 303 (3.6%) | 269 (3.3%) |
| 80 to 84 Years | 188 (2.3%) | 272 (3.4%) |
| 85 Years and over | 265 (3.2%) | 433 (5.3%) |
| Total | 8,328 (100.0%) | 8,098 (100.0%) |
Families and Households in Pearl River
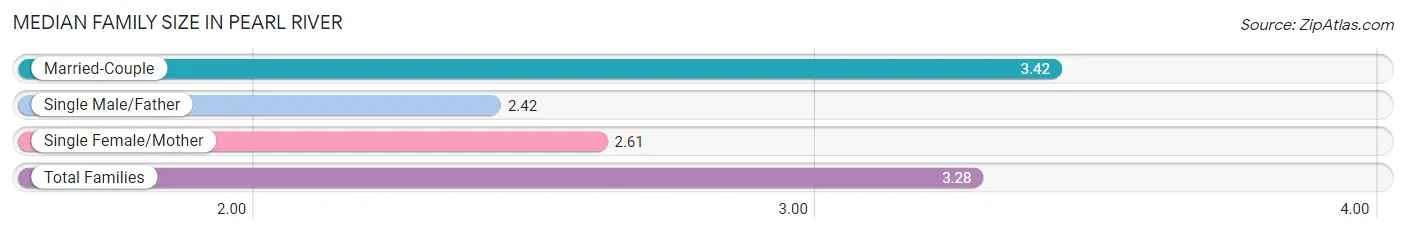
Median Family Size in Pearl River
The median family size in Pearl River is 3.28 persons per family, with married-couple families (3,692 | 83.8%) accounting for the largest median family size of 3.42 persons per family. On the other hand, single male/father families (352 | 8.0%) represent the smallest median family size with 2.42 persons per family.
| Family Type | # Families | Family Size |
| Married-Couple | 3,692 (83.8%) | 3.42 |
| Single Male/Father | 352 (8.0%) | 2.42 |
| Single Female/Mother | 361 (8.2%) | 2.61 |
| Total Families | 4,405 (100.0%) | 3.28 |
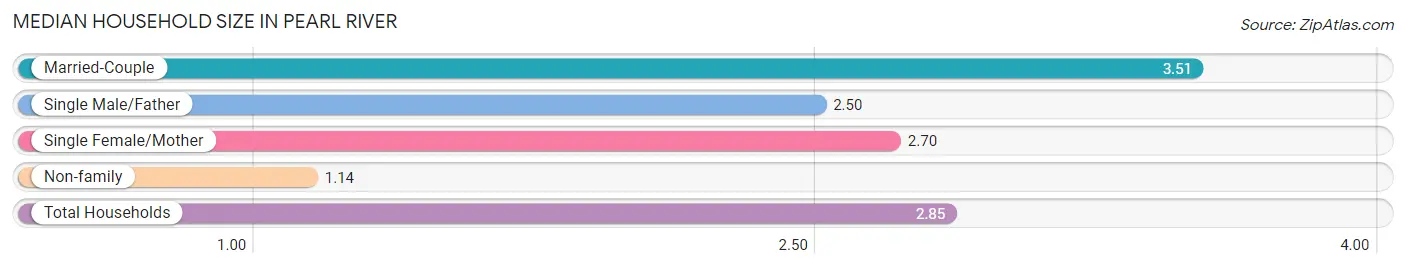
Median Household Size in Pearl River
The median household size in Pearl River is 2.85 persons per household, with married-couple households (3,692 | 64.6%) accounting for the largest median household size of 3.51 persons per household. non-family households (1,309 | 22.9%) represent the smallest median household size with 1.14 persons per household.
| Household Type | # Households | Household Size |
| Married-Couple | 3,692 (64.6%) | 3.51 |
| Single Male/Father | 352 (6.2%) | 2.50 |
| Single Female/Mother | 361 (6.3%) | 2.70 |
| Non-family | 1,309 (22.9%) | 1.14 |
| Total Households | 5,714 (100.0%) | 2.85 |
Household Size by Marriage Status in Pearl River
Out of a total of 5,714 households in Pearl River, 4,405 (77.1%) are family households, while 1,309 (22.9%) are nonfamily households. The most numerous type of family households are 2-person households, comprising 1,700, and the most common type of nonfamily households are 1-person households, comprising 1,195.
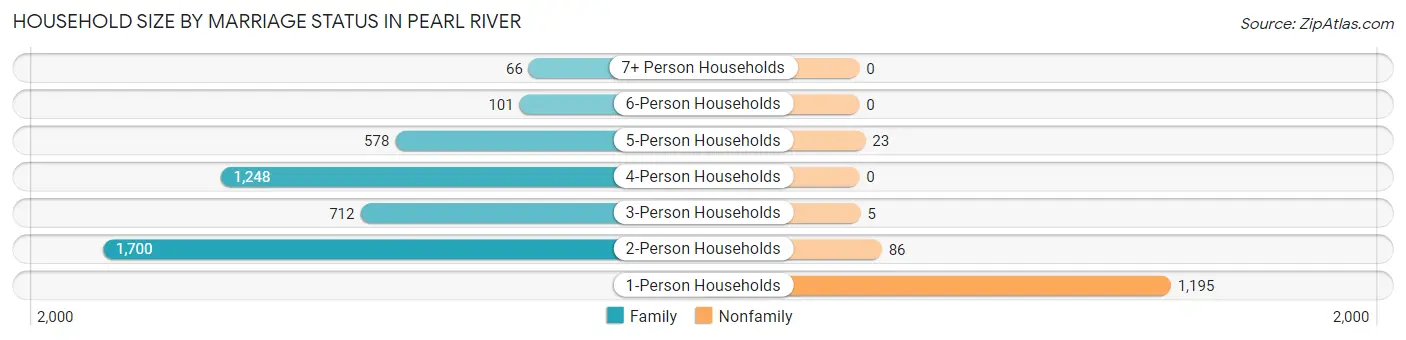
| Household Size | Family Households | Nonfamily Households |
| 1-Person Households | - | 1,195 (20.9%) |
| 2-Person Households | 1,700 (29.7%) | 86 (1.5%) |
| 3-Person Households | 712 (12.5%) | 5 (0.1%) |
| 4-Person Households | 1,248 (21.8%) | 0 (0.0%) |
| 5-Person Households | 578 (10.1%) | 23 (0.4%) |
| 6-Person Households | 101 (1.8%) | 0 (0.0%) |
| 7+ Person Households | 66 (1.2%) | 0 (0.0%) |
| Total | 4,405 (77.1%) | 1,309 (22.9%) |
Female Fertility in Pearl River
Fertility by Age in Pearl River
Average fertility rate in Pearl River is 31.0 births per 1,000 women. Women in the age bracket of 20 to 34 years have the highest fertility rate with 40.0 births per 1,000 women. Women in the age bracket of 20 to 34 years acount for 61.7% of all women with births.
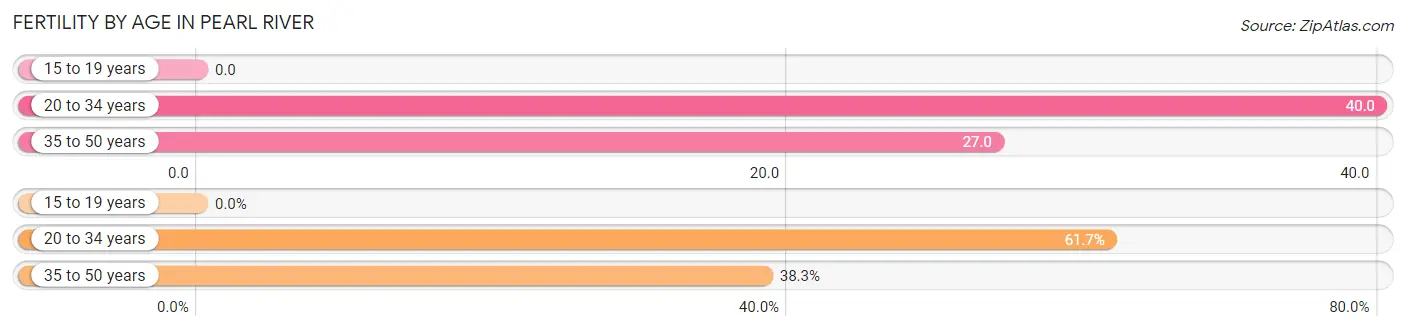
| Age Bracket | Women with Births | Births / 1,000 Women |
| 15 to 19 years | 0 (0.0%) | 0.0 |
| 20 to 34 years | 74 (61.7%) | 40.0 |
| 35 to 50 years | 46 (38.3%) | 27.0 |
| Total | 120 (100.0%) | 31.0 |
Fertility by Age by Marriage Status in Pearl River
98.3% of women with births (120) in Pearl River are married. The highest percentage of unmarried women with births falls into 35 to 50 years age bracket with 4.3% of them unmarried at the time of birth, while the lowest percentage of unmarried women with births belong to 20 to 34 years age bracket with 0.0% of them unmarried.
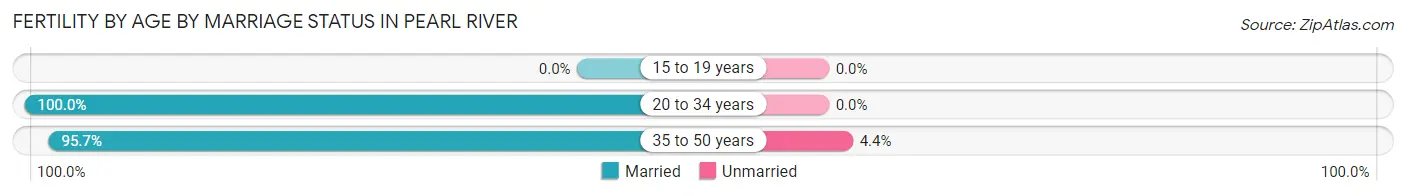
| Age Bracket | Married | Unmarried |
| 15 to 19 years | 0 (0.0%) | 0 (0.0%) |
| 20 to 34 years | 74 (100.0%) | 0 (0.0%) |
| 35 to 50 years | 44 (95.7%) | 2 (4.3%) |
| Total | 118 (98.3%) | 2 (1.7%) |
Fertility by Education in Pearl River
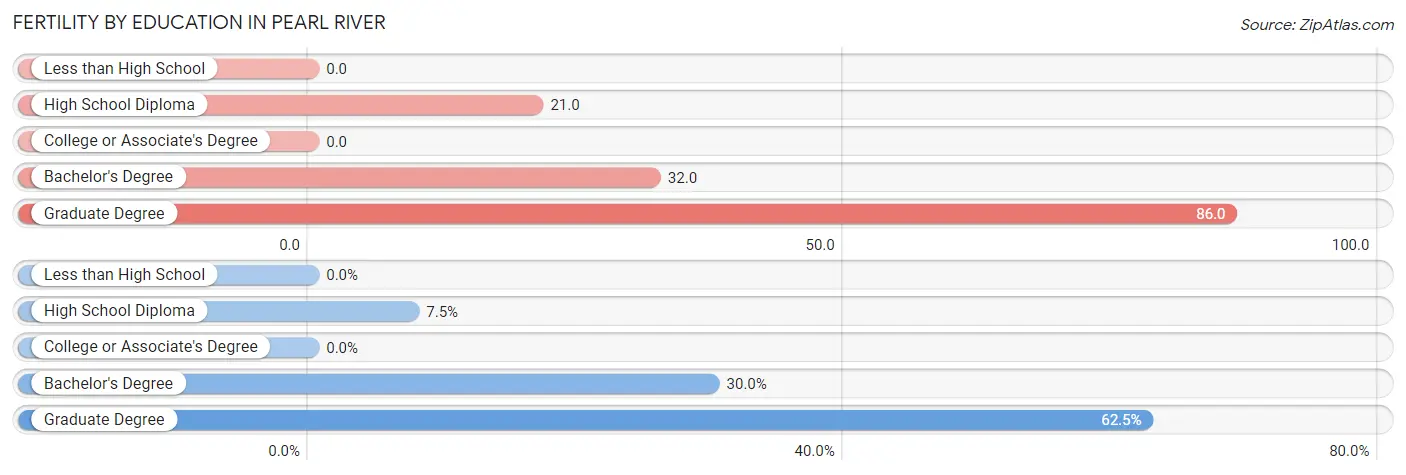
| Educational Attainment | Women with Births | Births / 1,000 Women |
| Less than High School | 0 (0.0%) | 0.0 |
| High School Diploma | 9 (7.5%) | 21.0 |
| College or Associate's Degree | 0 (0.0%) | 0.0 |
| Bachelor's Degree | 36 (30.0%) | 32.0 |
| Graduate Degree | 75 (62.5%) | 86.0 |
| Total | 120 (100.0%) | 31.0 |
Fertility by Education by Marriage Status in Pearl River
1.7% of women with births in Pearl River are unmarried. Women with the educational attainment of bachelor's degree are most likely to be married with 100.0% of them married at childbirth, while women with the educational attainment of high school diploma are least likely to be married with 22.2% of them unmarried at childbirth.
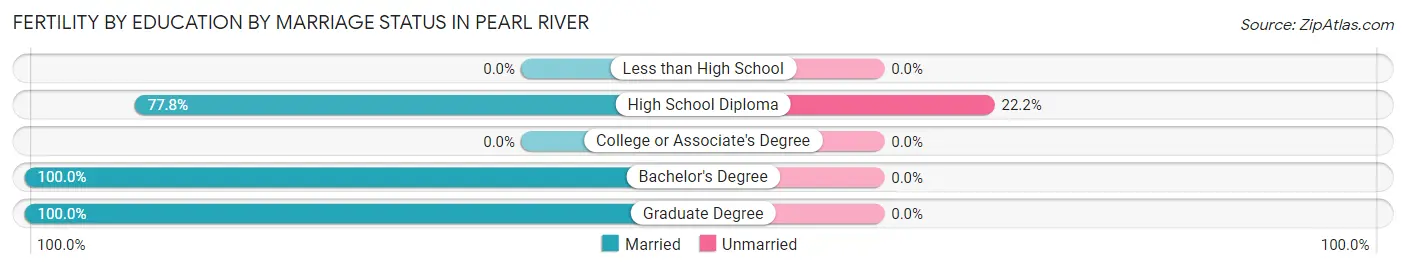
| Educational Attainment | Married | Unmarried |
| Less than High School | 0 (0.0%) | 0 (0.0%) |
| High School Diploma | 7 (77.8%) | 2 (22.2%) |
| College or Associate's Degree | 0 (0.0%) | 0 (0.0%) |
| Bachelor's Degree | 36 (100.0%) | 0 (0.0%) |
| Graduate Degree | 75 (100.0%) | 0 (0.0%) |
| Total | 118 (98.3%) | 2 (1.7%) |
Employment Characteristics in Pearl River
Employment by Class of Employer in Pearl River
Among the 7,988 employed individuals in Pearl River, private company employees (4,771 | 59.7%), local government employees (1,292 | 16.2%), and not-for-profit organizations (656 | 8.2%) make up the most common classes of employment.
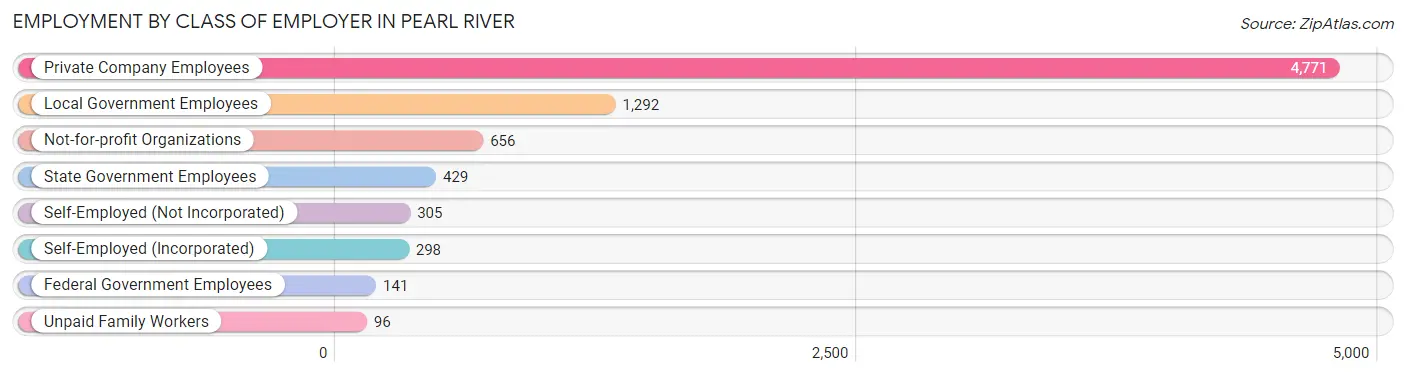
| Employer Class | # Employees | % Employees |
| Private Company Employees | 4,771 | 59.7% |
| Self-Employed (Incorporated) | 298 | 3.7% |
| Self-Employed (Not Incorporated) | 305 | 3.8% |
| Not-for-profit Organizations | 656 | 8.2% |
| Local Government Employees | 1,292 | 16.2% |
| State Government Employees | 429 | 5.4% |
| Federal Government Employees | 141 | 1.8% |
| Unpaid Family Workers | 96 | 1.2% |
| Total | 7,988 | 100.0% |
Employment Status by Age in Pearl River
According to the labor force statistics for Pearl River, out of the total population over 16 years of age (13,203), 63.0% or 8,318 individuals are in the labor force, with 3.2% or 266 of them unemployed. The age group with the highest labor force participation rate is 30 to 34 years, with 94.5% or 809 individuals in the labor force. Within the labor force, the 30 to 34 years age range has the highest percentage of unemployed individuals, with 10.4% or 84 of them being unemployed.
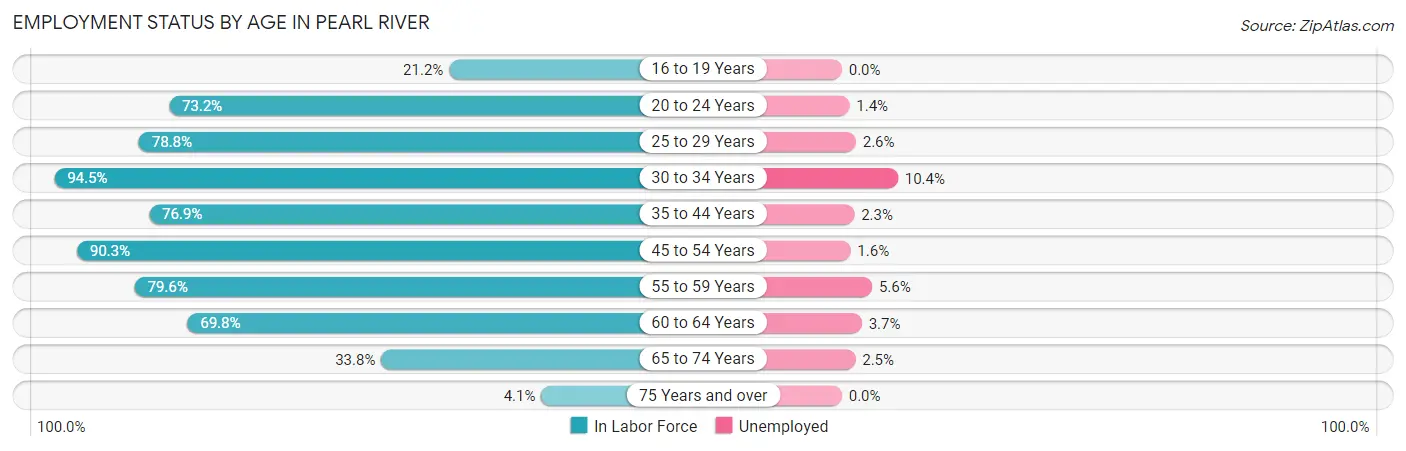
| Age Bracket | In Labor Force | Unemployed |
| 16 to 19 Years | 138 (21.2%) | 0 (0.0%) |
| 20 to 24 Years | 1,037 (73.2%) | 15 (1.4%) |
| 25 to 29 Years | 728 (78.8%) | 19 (2.6%) |
| 30 to 34 Years | 809 (94.5%) | 84 (10.4%) |
| 35 to 44 Years | 1,490 (76.9%) | 34 (2.3%) |
| 45 to 54 Years | 2,122 (90.3%) | 34 (1.6%) |
| 55 to 59 Years | 799 (79.6%) | 45 (5.6%) |
| 60 to 64 Years | 650 (69.8%) | 24 (3.7%) |
| 65 to 74 Years | 475 (33.8%) | 12 (2.5%) |
| 75 Years and over | 71 (4.1%) | 0 (0.0%) |
| Total | 8,318 (63.0%) | 266 (3.2%) |
Employment Status by Educational Attainment in Pearl River
According to labor force statistics for Pearl River, 82.4% of individuals (6,594) out of the total population between 25 and 64 years of age (8,003) are in the labor force, with 3.6% or 237 of them being unemployed. The group with the highest labor force participation rate are those with the educational attainment of bachelor's degree or higher, with 89.2% or 3,854 individuals in the labor force. Within the labor force, individuals with less than high school education have the highest percentage of unemployment, with 13.3% or 46 of them being unemployed.
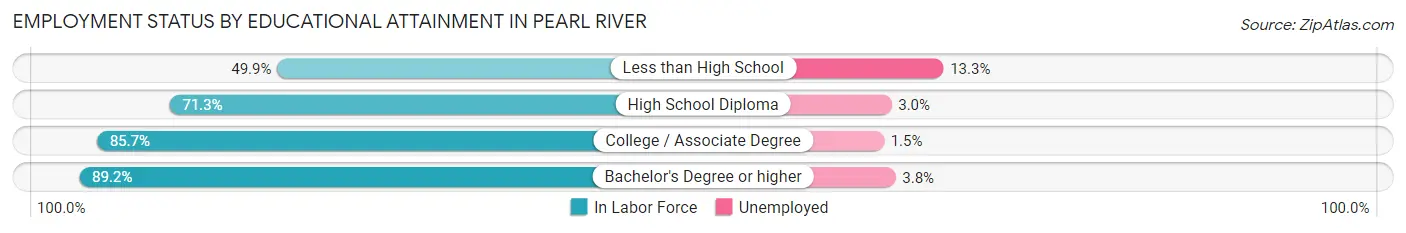
| Educational Attainment | In Labor Force | Unemployed |
| Less than High School | 346 (49.9%) | 92 (13.3%) |
| High School Diploma | 820 (71.3%) | 34 (3.0%) |
| College / Associate Degree | 1,575 (85.7%) | 28 (1.5%) |
| Bachelor's Degree or higher | 3,854 (89.2%) | 164 (3.8%) |
| Total | 6,594 (82.4%) | 288 (3.6%) |
Employment Occupations by Sex in Pearl River
Management, Business, Science and Arts Occupations
The most common Management, Business, Science and Arts occupations in Pearl River are Community & Social Service (1,239 | 15.4%), Management (913 | 11.3%), Health Diagnosing & Treating (808 | 10.0%), Education Instruction & Library (807 | 10.0%), and Health Technologists (702 | 8.7%).
Management, Business, Science and Arts Occupations by Sex
Within the Management, Business, Science and Arts occupations in Pearl River, the most male-oriented occupations are Architecture & Engineering (100.0%), Computers & Mathematics (80.3%), and Computers, Engineering & Science (76.2%), while the most female-oriented occupations are Health Diagnosing & Treating (80.3%), Health Technologists (77.3%), and Education, Arts & Media (76.1%).
| Occupation | Male | Female |
| Management | 434 (47.5%) | 479 (52.5%) |
| Business & Financial | 216 (38.1%) | 351 (61.9%) |
| Computers, Engineering & Science | 409 (76.2%) | 128 (23.8%) |
| Computers & Mathematics | 167 (80.3%) | 41 (19.7%) |
| Architecture & Engineering | 159 (100.0%) | 0 (0.0%) |
| Life, Physical & Social Science | 83 (48.8%) | 87 (51.2%) |
| Community & Social Service | 417 (33.7%) | 822 (66.3%) |
| Education, Arts & Media | 34 (23.9%) | 108 (76.1%) |
| Legal Services & Support | 86 (48.3%) | 92 (51.7%) |
| Education Instruction & Library | 223 (27.6%) | 584 (72.4%) |
| Arts, Media & Entertainment | 74 (66.1%) | 38 (33.9%) |
| Health Diagnosing & Treating | 159 (19.7%) | 649 (80.3%) |
| Health Technologists | 159 (22.7%) | 543 (77.3%) |
| Total (Category) | 1,635 (40.2%) | 2,429 (59.8%) |
| Total (Overall) | 4,229 (52.5%) | 3,822 (47.5%) |
Services Occupations
The most common Services occupations in Pearl River are Security & Protection (714 | 8.9%), Law Enforcement (367 | 4.6%), Firefighting & Prevention (347 | 4.3%), Personal Care & Service (304 | 3.8%), and Food Preparation & Serving (230 | 2.9%).
Services Occupations by Sex
Within the Services occupations in Pearl River, the most male-oriented occupations are Firefighting & Prevention (98.3%), Security & Protection (91.7%), and Law Enforcement (85.6%), while the most female-oriented occupations are Personal Care & Service (88.8%), Healthcare Support (88.0%), and Food Preparation & Serving (71.3%).
| Occupation | Male | Female |
| Healthcare Support | 6 (12.0%) | 44 (88.0%) |
| Security & Protection | 655 (91.7%) | 59 (8.3%) |
| Firefighting & Prevention | 341 (98.3%) | 6 (1.7%) |
| Law Enforcement | 314 (85.6%) | 53 (14.4%) |
| Food Preparation & Serving | 66 (28.7%) | 164 (71.3%) |
| Cleaning & Maintenance | 38 (37.2%) | 64 (62.7%) |
| Personal Care & Service | 34 (11.2%) | 270 (88.8%) |
| Total (Category) | 799 (57.1%) | 601 (42.9%) |
| Total (Overall) | 4,229 (52.5%) | 3,822 (47.5%) |
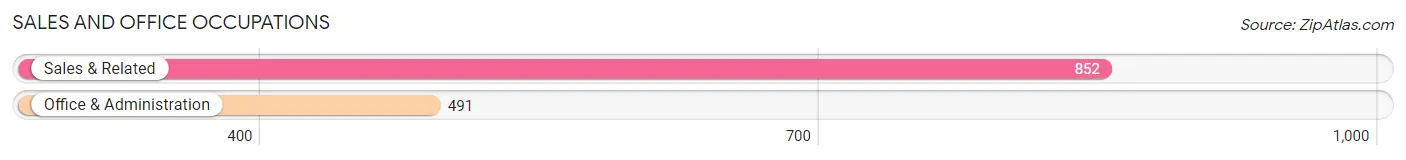
Sales and Office Occupations
The most common Sales and Office occupations in Pearl River are Sales & Related (852 | 10.6%), and Office & Administration (491 | 6.1%).
Sales and Office Occupations by Sex
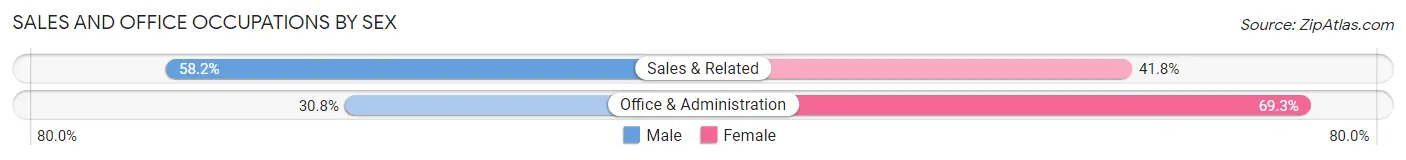
| Occupation | Male | Female |
| Sales & Related | 496 (58.2%) | 356 (41.8%) |
| Office & Administration | 151 (30.7%) | 340 (69.3%) |
| Total (Category) | 647 (48.2%) | 696 (51.8%) |
| Total (Overall) | 4,229 (52.5%) | 3,822 (47.5%) |
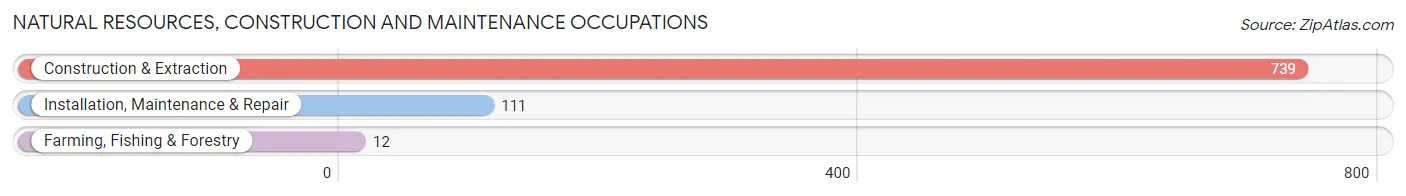
Natural Resources, Construction and Maintenance Occupations
The most common Natural Resources, Construction and Maintenance occupations in Pearl River are Construction & Extraction (739 | 9.2%), Installation, Maintenance & Repair (111 | 1.4%), and Farming, Fishing & Forestry (12 | 0.2%).
Natural Resources, Construction and Maintenance Occupations by Sex
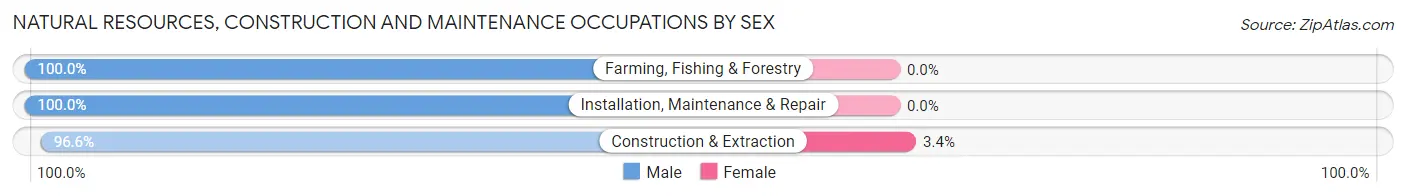
| Occupation | Male | Female |
| Farming, Fishing & Forestry | 12 (100.0%) | 0 (0.0%) |
| Construction & Extraction | 714 (96.6%) | 25 (3.4%) |
| Installation, Maintenance & Repair | 111 (100.0%) | 0 (0.0%) |
| Total (Category) | 837 (97.1%) | 25 (2.9%) |
| Total (Overall) | 4,229 (52.5%) | 3,822 (47.5%) |
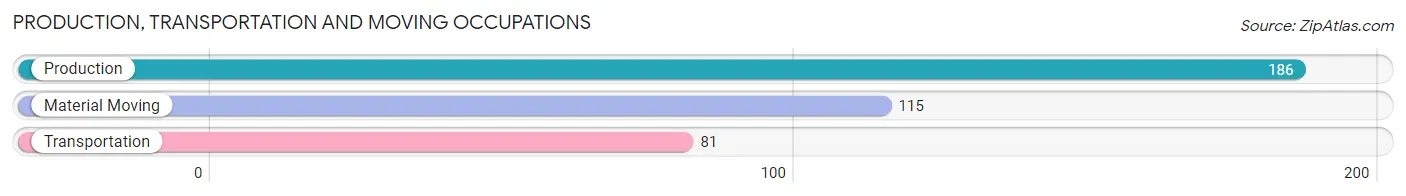
Production, Transportation and Moving Occupations
The most common Production, Transportation and Moving occupations in Pearl River are Production (186 | 2.3%), Material Moving (115 | 1.4%), and Transportation (81 | 1.0%).
Production, Transportation and Moving Occupations by Sex
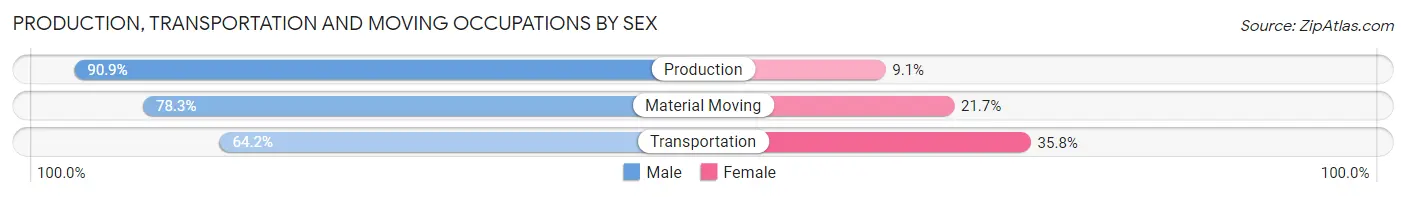
| Occupation | Male | Female |
| Production | 169 (90.9%) | 17 (9.1%) |
| Transportation | 52 (64.2%) | 29 (35.8%) |
| Material Moving | 90 (78.3%) | 25 (21.7%) |
| Total (Category) | 311 (81.4%) | 71 (18.6%) |
| Total (Overall) | 4,229 (52.5%) | 3,822 (47.5%) |
Employment Industries by Sex in Pearl River
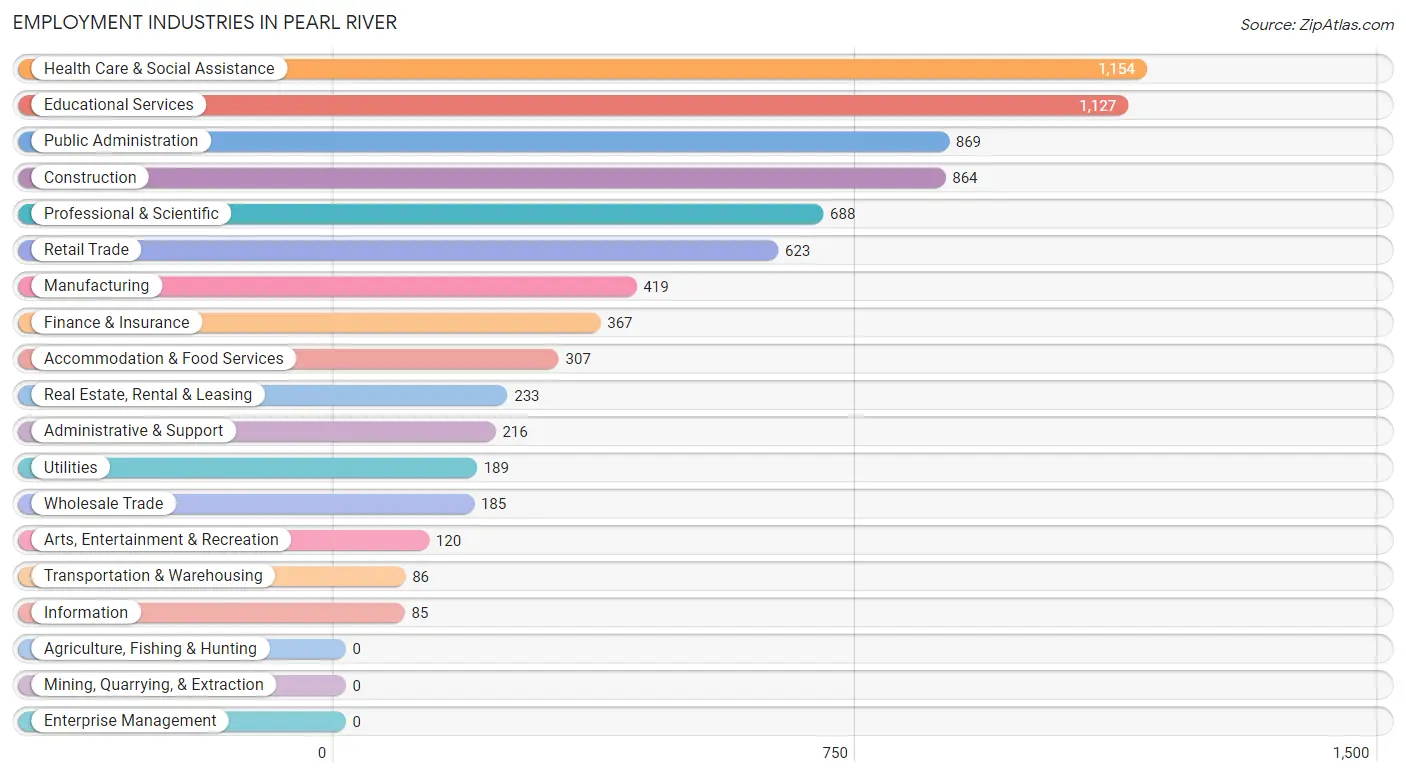
Employment Industries in Pearl River
The major employment industries in Pearl River include Health Care & Social Assistance (1,154 | 14.3%), Educational Services (1,127 | 14.0%), Public Administration (869 | 10.8%), Construction (864 | 10.7%), and Professional & Scientific (688 | 8.6%).
Employment Industries by Sex in Pearl River
The Pearl River industries that see more men than women are Real Estate, Rental & Leasing (90.1%), Construction (88.4%), and Transportation & Warehousing (84.9%), whereas the industries that tend to have a higher number of women are Health Care & Social Assistance (83.2%), Utilities (69.8%), and Arts, Entertainment & Recreation (68.3%).
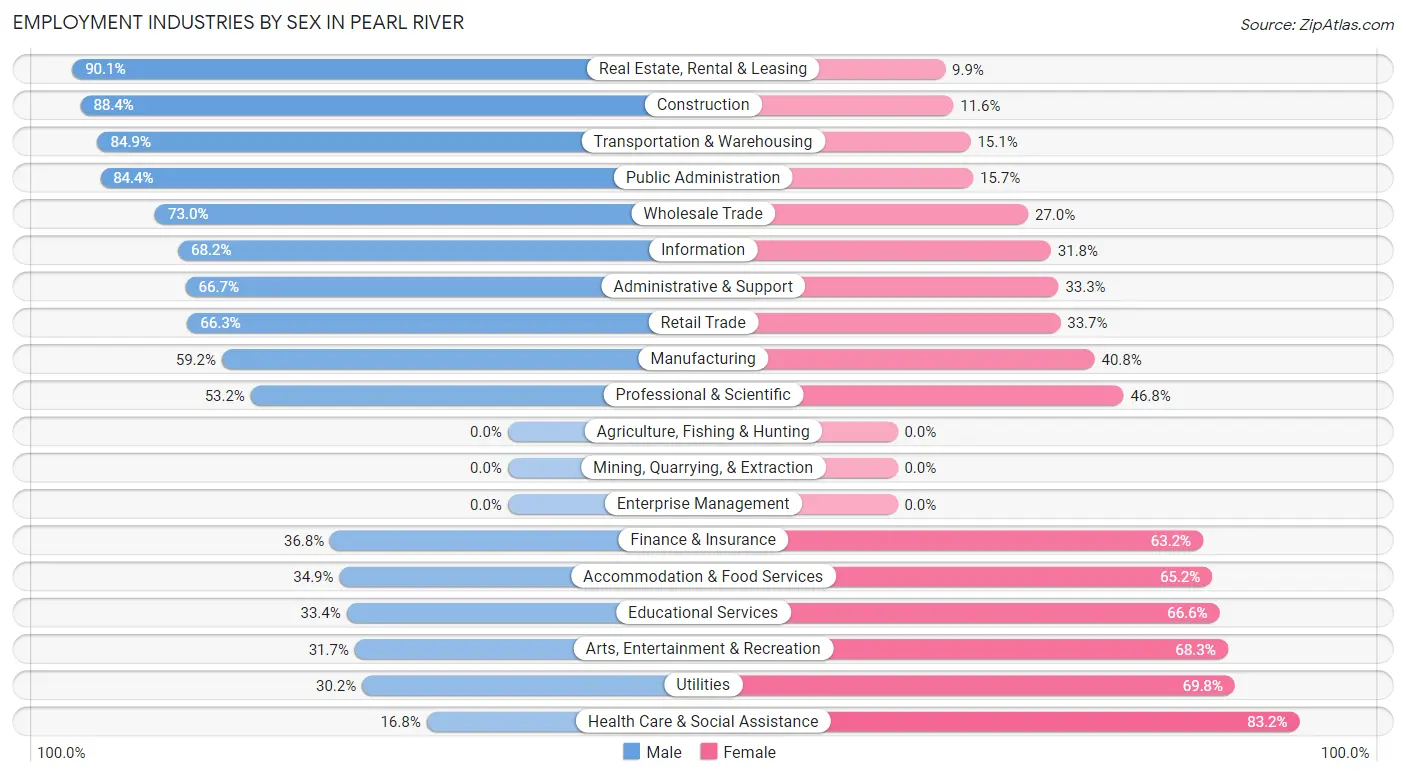
| Industry | Male | Female |
| Agriculture, Fishing & Hunting | 0 (0.0%) | 0 (0.0%) |
| Mining, Quarrying, & Extraction | 0 (0.0%) | 0 (0.0%) |
| Construction | 764 (88.4%) | 100 (11.6%) |
| Manufacturing | 248 (59.2%) | 171 (40.8%) |
| Wholesale Trade | 135 (73.0%) | 50 (27.0%) |
| Retail Trade | 413 (66.3%) | 210 (33.7%) |
| Transportation & Warehousing | 73 (84.9%) | 13 (15.1%) |
| Utilities | 57 (30.2%) | 132 (69.8%) |
| Information | 58 (68.2%) | 27 (31.8%) |
| Finance & Insurance | 135 (36.8%) | 232 (63.2%) |
| Real Estate, Rental & Leasing | 210 (90.1%) | 23 (9.9%) |
| Professional & Scientific | 366 (53.2%) | 322 (46.8%) |
| Enterprise Management | 0 (0.0%) | 0 (0.0%) |
| Administrative & Support | 144 (66.7%) | 72 (33.3%) |
| Educational Services | 376 (33.4%) | 751 (66.6%) |
| Health Care & Social Assistance | 194 (16.8%) | 960 (83.2%) |
| Arts, Entertainment & Recreation | 38 (31.7%) | 82 (68.3%) |
| Accommodation & Food Services | 107 (34.8%) | 200 (65.1%) |
| Public Administration | 733 (84.4%) | 136 (15.7%) |
| Total | 4,229 (52.5%) | 3,822 (47.5%) |
Education in Pearl River
School Enrollment in Pearl River
The most common levels of schooling among the 4,144 students in Pearl River are high school (898 | 21.7%), middle school (851 | 20.5%), and elementary school (736 | 17.8%).
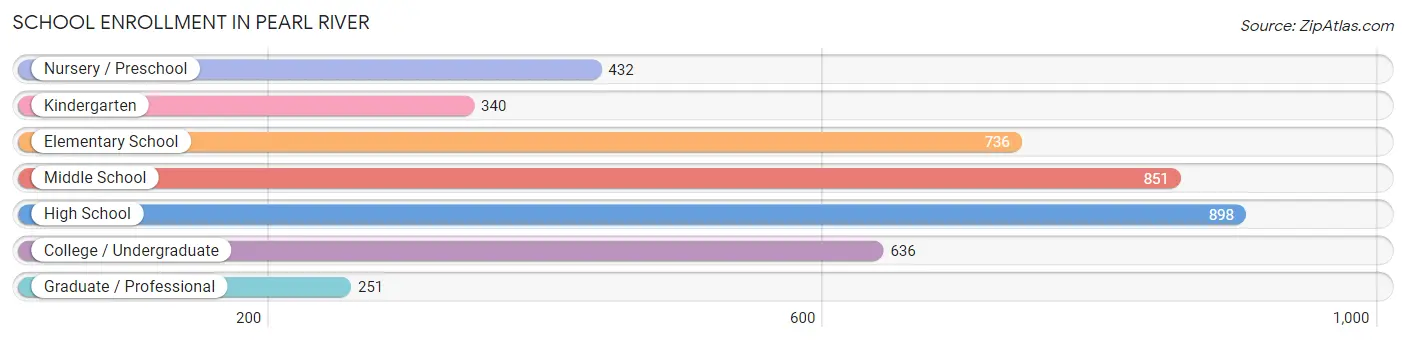
| School Level | # Students | % Students |
| Nursery / Preschool | 432 | 10.4% |
| Kindergarten | 340 | 8.2% |
| Elementary School | 736 | 17.8% |
| Middle School | 851 | 20.5% |
| High School | 898 | 21.7% |
| College / Undergraduate | 636 | 15.3% |
| Graduate / Professional | 251 | 6.1% |
| Total | 4,144 | 100.0% |
School Enrollment by Age by Funding Source in Pearl River
Out of a total of 4,144 students who are enrolled in schools in Pearl River, 1,280 (30.9%) attend a private institution, while the remaining 2,864 (69.1%) are enrolled in public schools. The age group of 25 to 34 year olds has the highest likelihood of being enrolled in private schools, with 259 (79.2% in the age bracket) enrolled. Conversely, the age group of 10 to 14 year olds has the lowest likelihood of being enrolled in a private school, with 932 (89.4% in the age bracket) attending a public institution.
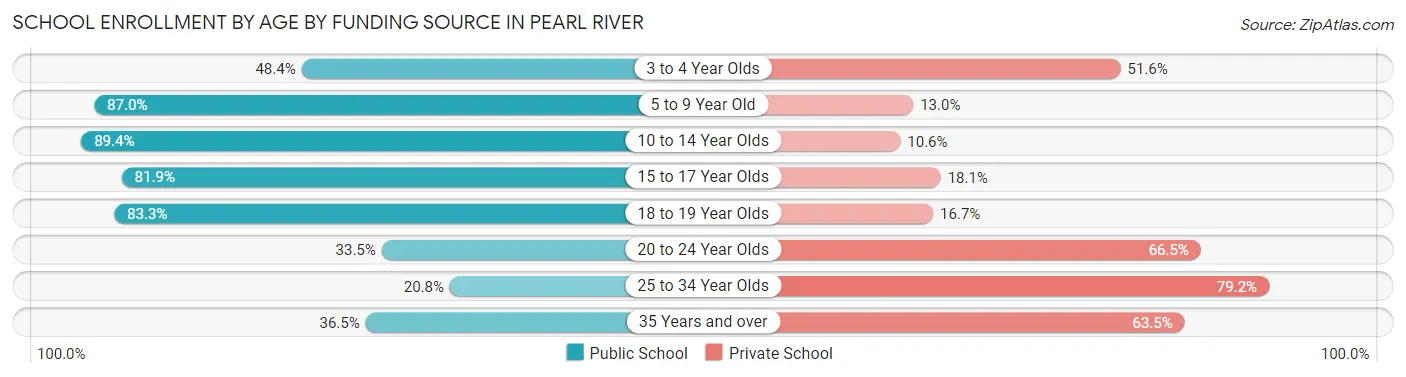
| Age Bracket | Public School | Private School |
| 3 to 4 Year Olds | 247 (48.4%) | 263 (51.6%) |
| 5 to 9 Year Old | 806 (87.0%) | 120 (13.0%) |
| 10 to 14 Year Olds | 932 (89.4%) | 110 (10.6%) |
| 15 to 17 Year Olds | 458 (81.9%) | 101 (18.1%) |
| 18 to 19 Year Olds | 140 (83.3%) | 28 (16.7%) |
| 20 to 24 Year Olds | 138 (33.5%) | 274 (66.5%) |
| 25 to 34 Year Olds | 68 (20.8%) | 259 (79.2%) |
| 35 Years and over | 73 (36.5%) | 127 (63.5%) |
| Total | 2,864 (69.1%) | 1,280 (30.9%) |
Educational Attainment by Field of Study in Pearl River
Business (1,333 | 22.8%), education (649 | 11.1%), science & technology (628 | 10.7%), social sciences (446 | 7.6%), and psychology (444 | 7.6%) are the most common fields of study among 5,846 individuals in Pearl River who have obtained a bachelor's degree or higher.
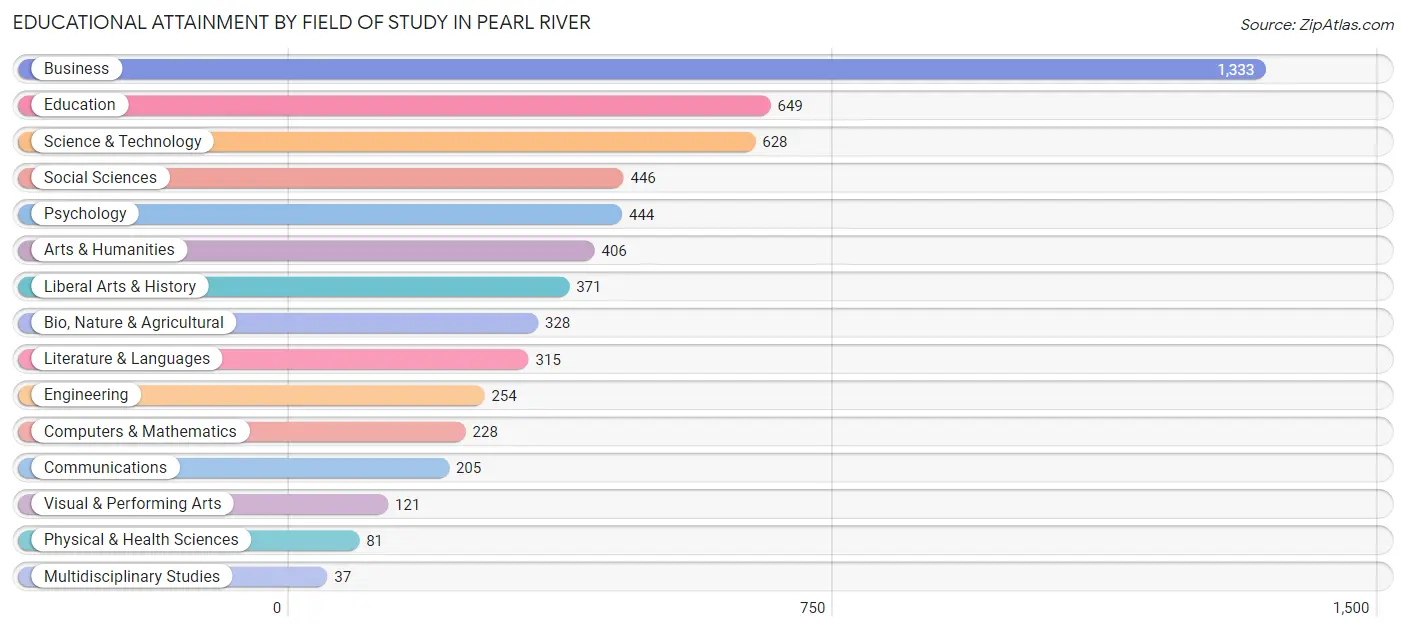
| Field of Study | # Graduates | % Graduates |
| Computers & Mathematics | 228 | 3.9% |
| Bio, Nature & Agricultural | 328 | 5.6% |
| Physical & Health Sciences | 81 | 1.4% |
| Psychology | 444 | 7.6% |
| Social Sciences | 446 | 7.6% |
| Engineering | 254 | 4.3% |
| Multidisciplinary Studies | 37 | 0.6% |
| Science & Technology | 628 | 10.7% |
| Business | 1,333 | 22.8% |
| Education | 649 | 11.1% |
| Literature & Languages | 315 | 5.4% |
| Liberal Arts & History | 371 | 6.4% |
| Visual & Performing Arts | 121 | 2.1% |
| Communications | 205 | 3.5% |
| Arts & Humanities | 406 | 6.9% |
| Total | 5,846 | 100.0% |
Transportation & Commute in Pearl River
Vehicle Availability by Sex in Pearl River
The most prevalent vehicle ownership categories in Pearl River are males with 2 vehicles (2,102, accounting for 50.3%) and females with 2 vehicles (1,376, making up 55.5%).
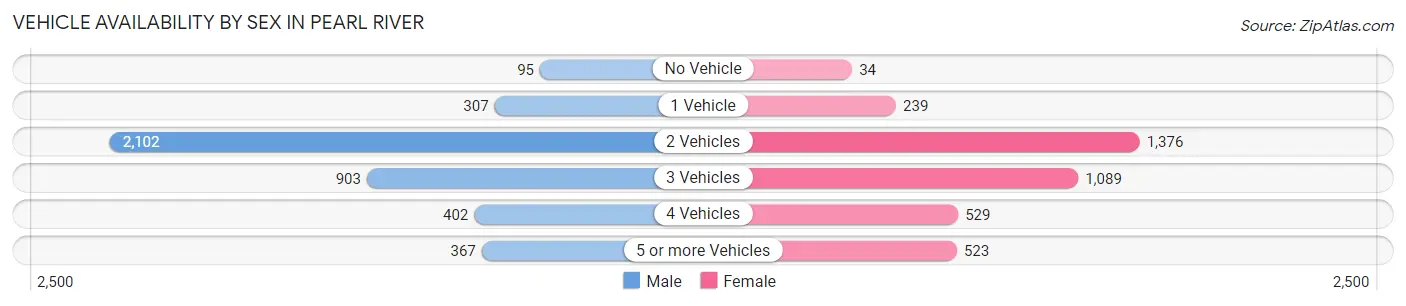
| Vehicles Available | Male | Female |
| No Vehicle | 95 (2.3%) | 34 (0.9%) |
| 1 Vehicle | 307 (7.3%) | 239 (6.3%) |
| 2 Vehicles | 2,102 (50.3%) | 1,376 (36.3%) |
| 3 Vehicles | 903 (21.6%) | 1,089 (28.7%) |
| 4 Vehicles | 402 (9.6%) | 529 (14.0%) |
| 5 or more Vehicles | 367 (8.8%) | 523 (13.8%) |
| Total | 4,176 (100.0%) | 3,790 (100.0%) |
Commute Time in Pearl River
The most frequently occuring commute durations in Pearl River are 15 to 19 minutes (1,137 commuters, 16.6%), 60 to 89 minutes (912 commuters, 13.3%), and 45 to 59 minutes (906 commuters, 13.2%).
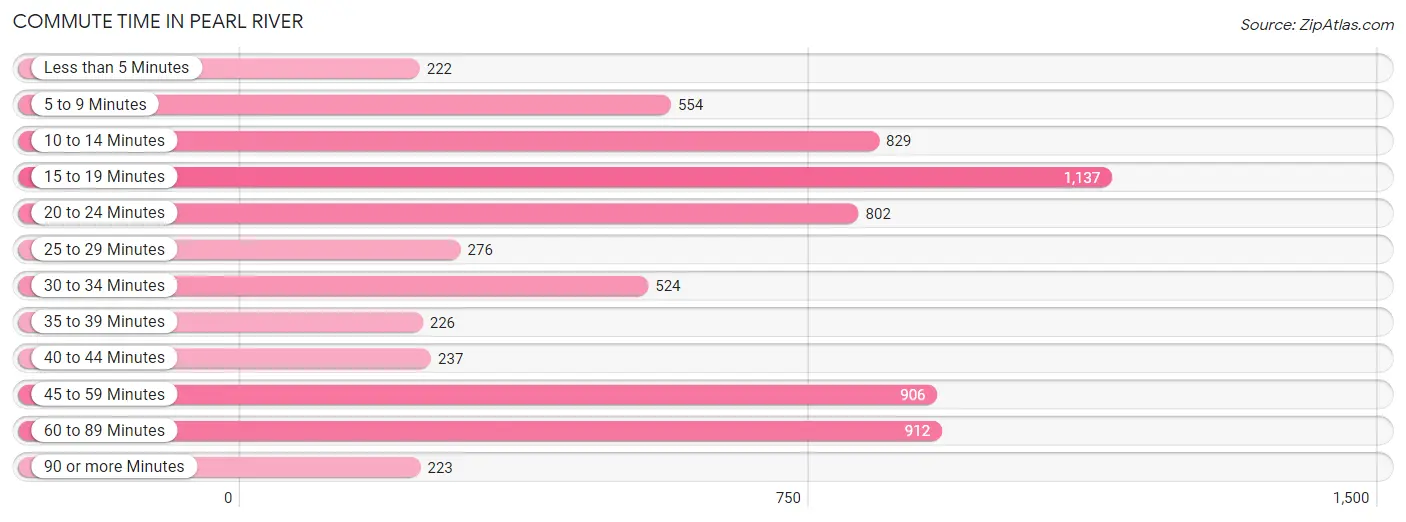
| Commute Time | # Commuters | % Commuters |
| Less than 5 Minutes | 222 | 3.2% |
| 5 to 9 Minutes | 554 | 8.1% |
| 10 to 14 Minutes | 829 | 12.1% |
| 15 to 19 Minutes | 1,137 | 16.6% |
| 20 to 24 Minutes | 802 | 11.7% |
| 25 to 29 Minutes | 276 | 4.0% |
| 30 to 34 Minutes | 524 | 7.6% |
| 35 to 39 Minutes | 226 | 3.3% |
| 40 to 44 Minutes | 237 | 3.5% |
| 45 to 59 Minutes | 906 | 13.2% |
| 60 to 89 Minutes | 912 | 13.3% |
| 90 or more Minutes | 223 | 3.3% |
Commute Time by Sex in Pearl River
The most common commute times in Pearl River are 45 to 59 minutes (626 commuters, 17.4%) for males and 10 to 14 minutes (669 commuters, 20.5%) for females.
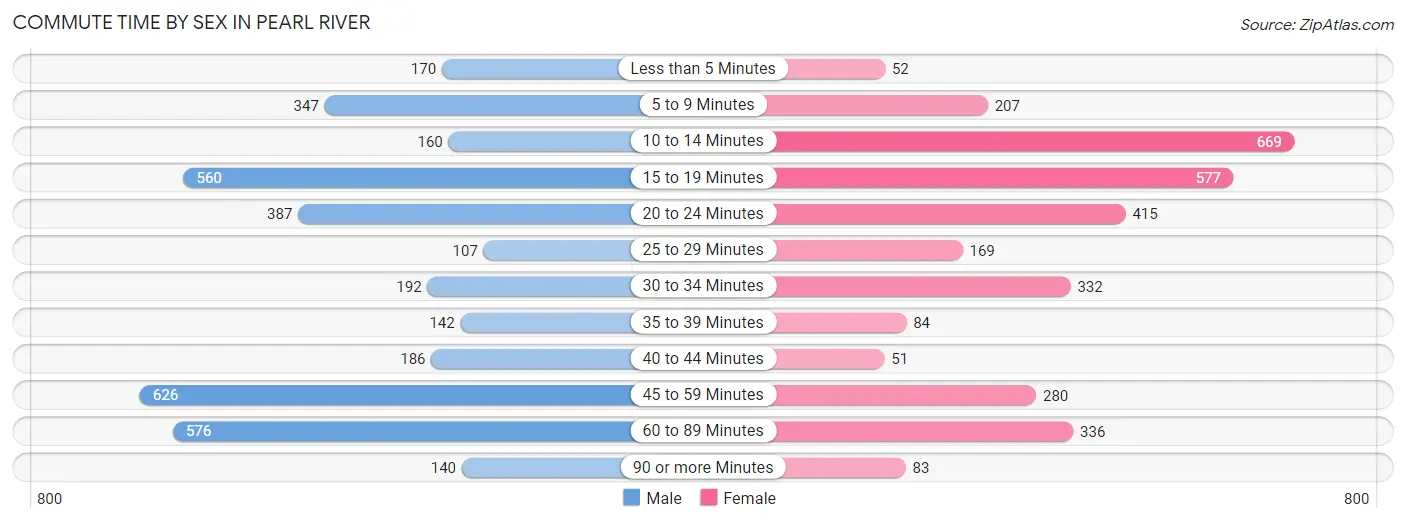
| Commute Time | Male | Female |
| Less than 5 Minutes | 170 (4.7%) | 52 (1.6%) |
| 5 to 9 Minutes | 347 (9.7%) | 207 (6.4%) |
| 10 to 14 Minutes | 160 (4.4%) | 669 (20.5%) |
| 15 to 19 Minutes | 560 (15.6%) | 577 (17.7%) |
| 20 to 24 Minutes | 387 (10.8%) | 415 (12.8%) |
| 25 to 29 Minutes | 107 (3.0%) | 169 (5.2%) |
| 30 to 34 Minutes | 192 (5.3%) | 332 (10.2%) |
| 35 to 39 Minutes | 142 (4.0%) | 84 (2.6%) |
| 40 to 44 Minutes | 186 (5.2%) | 51 (1.6%) |
| 45 to 59 Minutes | 626 (17.4%) | 280 (8.6%) |
| 60 to 89 Minutes | 576 (16.0%) | 336 (10.3%) |
| 90 or more Minutes | 140 (3.9%) | 83 (2.5%) |
Time of Departure to Work by Sex in Pearl River
The most frequent times of departure to work in Pearl River are 6:00 AM to 6:29 AM (660, 18.4%) for males and 8:30 AM to 8:59 AM (629, 19.3%) for females.
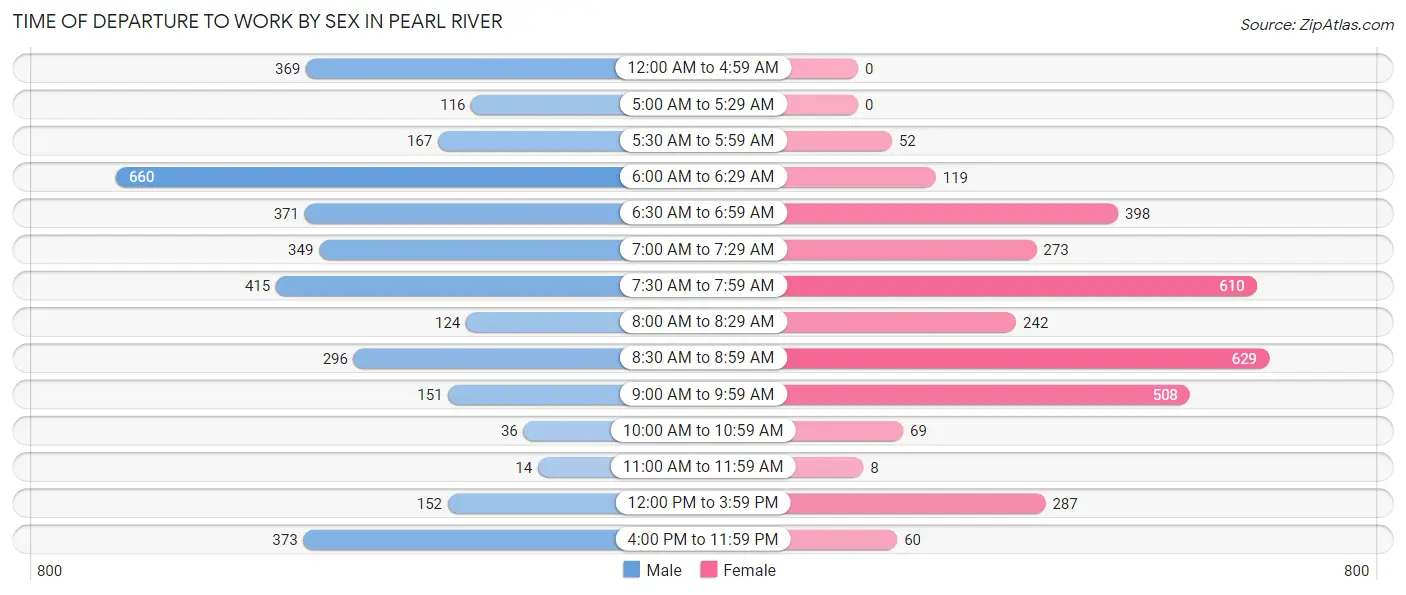
| Time of Departure | Male | Female |
| 12:00 AM to 4:59 AM | 369 (10.3%) | 0 (0.0%) |
| 5:00 AM to 5:29 AM | 116 (3.2%) | 0 (0.0%) |
| 5:30 AM to 5:59 AM | 167 (4.6%) | 52 (1.6%) |
| 6:00 AM to 6:29 AM | 660 (18.4%) | 119 (3.7%) |
| 6:30 AM to 6:59 AM | 371 (10.3%) | 398 (12.2%) |
| 7:00 AM to 7:29 AM | 349 (9.7%) | 273 (8.4%) |
| 7:30 AM to 7:59 AM | 415 (11.6%) | 610 (18.7%) |
| 8:00 AM to 8:29 AM | 124 (3.5%) | 242 (7.4%) |
| 8:30 AM to 8:59 AM | 296 (8.2%) | 629 (19.3%) |
| 9:00 AM to 9:59 AM | 151 (4.2%) | 508 (15.6%) |
| 10:00 AM to 10:59 AM | 36 (1.0%) | 69 (2.1%) |
| 11:00 AM to 11:59 AM | 14 (0.4%) | 8 (0.3%) |
| 12:00 PM to 3:59 PM | 152 (4.2%) | 287 (8.8%) |
| 4:00 PM to 11:59 PM | 373 (10.4%) | 60 (1.8%) |
| Total | 3,593 (100.0%) | 3,255 (100.0%) |
Housing Occupancy in Pearl River
Occupancy by Ownership in Pearl River
Of the total 5,714 dwellings in Pearl River, owner-occupied units account for 4,340 (75.9%), while renter-occupied units make up 1,374 (24.0%).
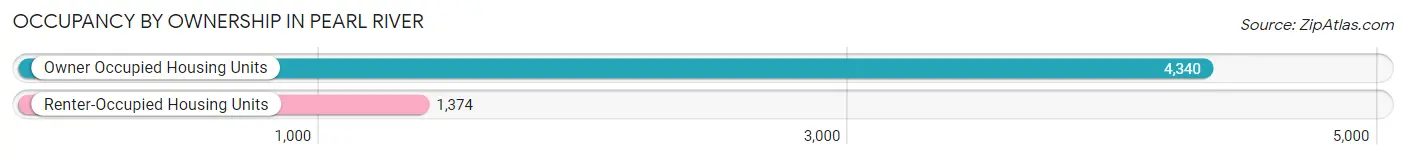
| Occupancy | # Housing Units | % Housing Units |
| Owner Occupied Housing Units | 4,340 | 75.9% |
| Renter-Occupied Housing Units | 1,374 | 24.0% |
| Total Occupied Housing Units | 5,714 | 100.0% |
Occupancy by Household Size in Pearl River
| Household Size | # Housing Units | % Housing Units |
| 1-Person Household | 1,195 | 20.9% |
| 2-Person Household | 1,786 | 31.3% |
| 3-Person Household | 717 | 12.6% |
| 4+ Person Household | 2,016 | 35.3% |
| Total Housing Units | 5,714 | 100.0% |
Occupancy by Ownership by Household Size in Pearl River
| Household Size | Owner-occupied | Renter-occupied |
| 1-Person Household | 616 (51.5%) | 579 (48.4%) |
| 2-Person Household | 1,391 (77.9%) | 395 (22.1%) |
| 3-Person Household | 629 (87.7%) | 88 (12.3%) |
| 4+ Person Household | 1,704 (84.5%) | 312 (15.5%) |
| Total Housing Units | 4,340 (75.9%) | 1,374 (24.0%) |
Occupancy by Educational Attainment in Pearl River
| Household Size | Owner-occupied | Renter-occupied |
| Less than High School | 132 (32.1%) | 279 (67.9%) |
| High School Diploma | 659 (75.3%) | 216 (24.7%) |
| College/Associate Degree | 870 (63.3%) | 504 (36.7%) |
| Bachelor's Degree or higher | 2,679 (87.7%) | 375 (12.3%) |
Occupancy by Age of Householder in Pearl River
| Age Bracket | # Households | % Households |
| Under 35 Years | 553 | 9.7% |
| 35 to 44 Years | 1,002 | 17.5% |
| 45 to 54 Years | 1,087 | 19.0% |
| 55 to 64 Years | 1,045 | 18.3% |
| 65 to 74 Years | 911 | 15.9% |
| 75 to 84 Years | 652 | 11.4% |
| 85 Years and Over | 464 | 8.1% |
| Total | 5,714 | 100.0% |
Housing Finances in Pearl River
Median Income by Occupancy in Pearl River
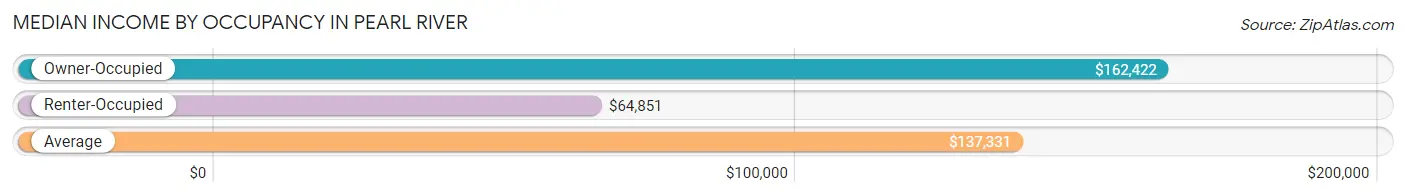
| Occupancy Type | # Households | Median Income |
| Owner-Occupied | 4,340 (75.9%) | $162,422 |
| Renter-Occupied | 1,374 (24.0%) | $64,851 |
| Average | 5,714 (100.0%) | $137,331 |
Occupancy by Householder Income Bracket in Pearl River
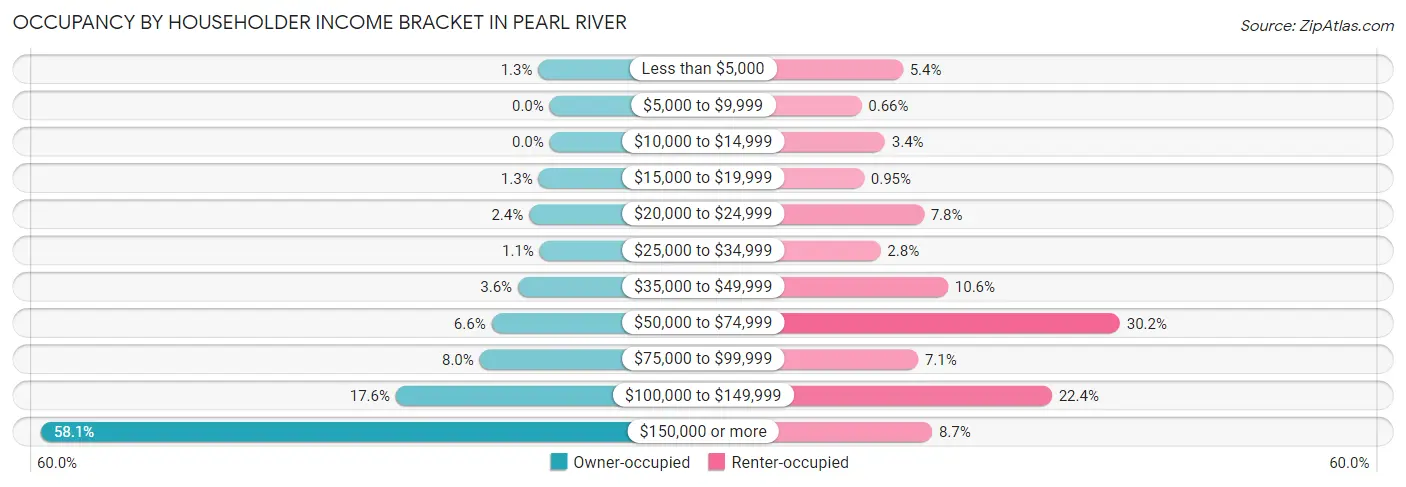
| Income Bracket | Owner-occupied | Renter-occupied |
| Less than $5,000 | 56 (1.3%) | 74 (5.4%) |
| $5,000 to $9,999 | 0 (0.0%) | 9 (0.7%) |
| $10,000 to $14,999 | 0 (0.0%) | 46 (3.4%) |
| $15,000 to $19,999 | 55 (1.3%) | 13 (0.9%) |
| $20,000 to $24,999 | 102 (2.4%) | 107 (7.8%) |
| $25,000 to $34,999 | 49 (1.1%) | 39 (2.8%) |
| $35,000 to $49,999 | 157 (3.6%) | 145 (10.5%) |
| $50,000 to $74,999 | 288 (6.6%) | 415 (30.2%) |
| $75,000 to $99,999 | 347 (8.0%) | 98 (7.1%) |
| $100,000 to $149,999 | 763 (17.6%) | 308 (22.4%) |
| $150,000 or more | 2,523 (58.1%) | 120 (8.7%) |
| Total | 4,340 (100.0%) | 1,374 (100.0%) |
Monthly Housing Cost Tiers in Pearl River
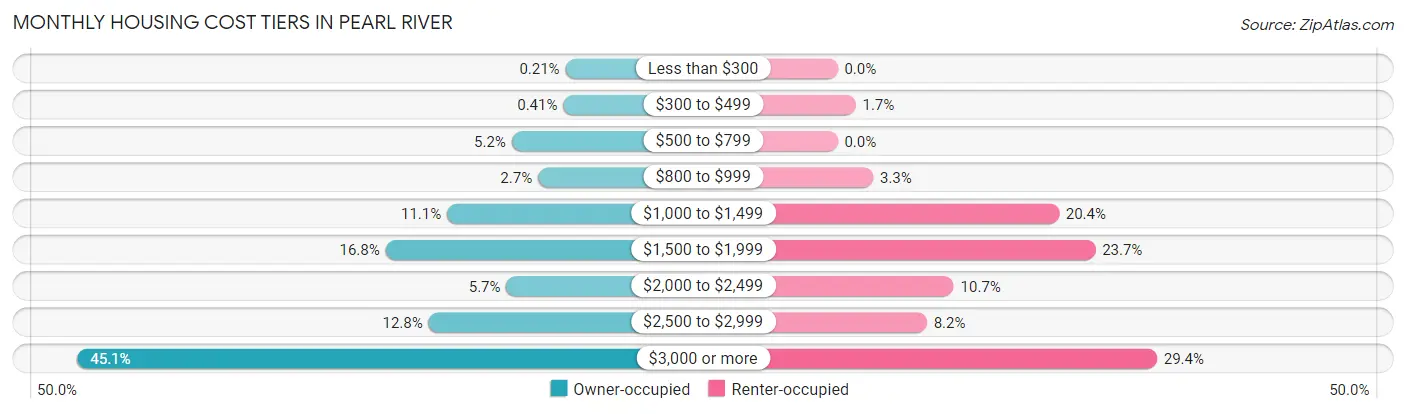
| Monthly Cost | Owner-occupied | Renter-occupied |
| Less than $300 | 9 (0.2%) | 0 (0.0%) |
| $300 to $499 | 18 (0.4%) | 23 (1.7%) |
| $500 to $799 | 224 (5.2%) | 0 (0.0%) |
| $800 to $999 | 119 (2.7%) | 45 (3.3%) |
| $1,000 to $1,499 | 482 (11.1%) | 280 (20.4%) |
| $1,500 to $1,999 | 728 (16.8%) | 326 (23.7%) |
| $2,000 to $2,499 | 245 (5.7%) | 147 (10.7%) |
| $2,500 to $2,999 | 556 (12.8%) | 113 (8.2%) |
| $3,000 or more | 1,959 (45.1%) | 404 (29.4%) |
| Total | 4,340 (100.0%) | 1,374 (100.0%) |
Physical Housing Characteristics in Pearl River
Housing Structures in Pearl River
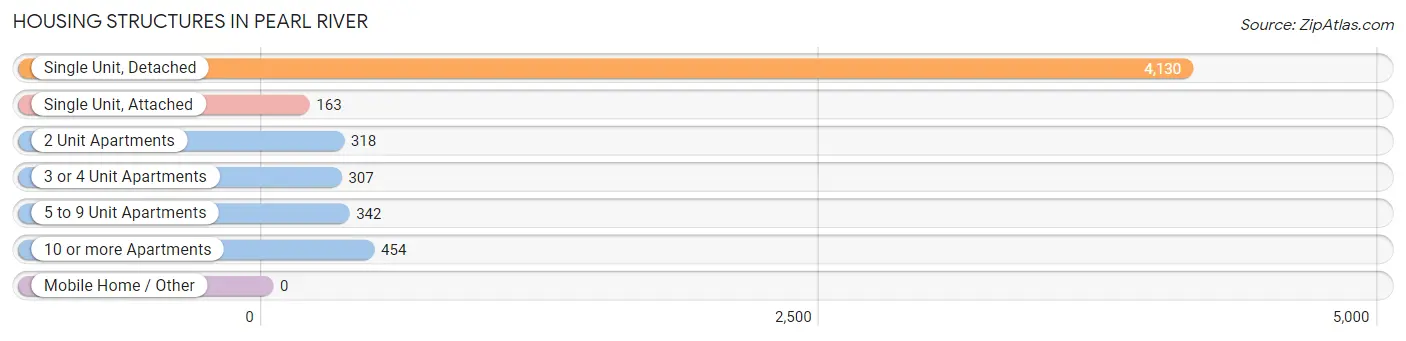
| Structure Type | # Housing Units | % Housing Units |
| Single Unit, Detached | 4,130 | 72.3% |
| Single Unit, Attached | 163 | 2.9% |
| 2 Unit Apartments | 318 | 5.6% |
| 3 or 4 Unit Apartments | 307 | 5.4% |
| 5 to 9 Unit Apartments | 342 | 6.0% |
| 10 or more Apartments | 454 | 8.0% |
| Mobile Home / Other | 0 | 0.0% |
| Total | 5,714 | 100.0% |
Housing Structures by Occupancy in Pearl River
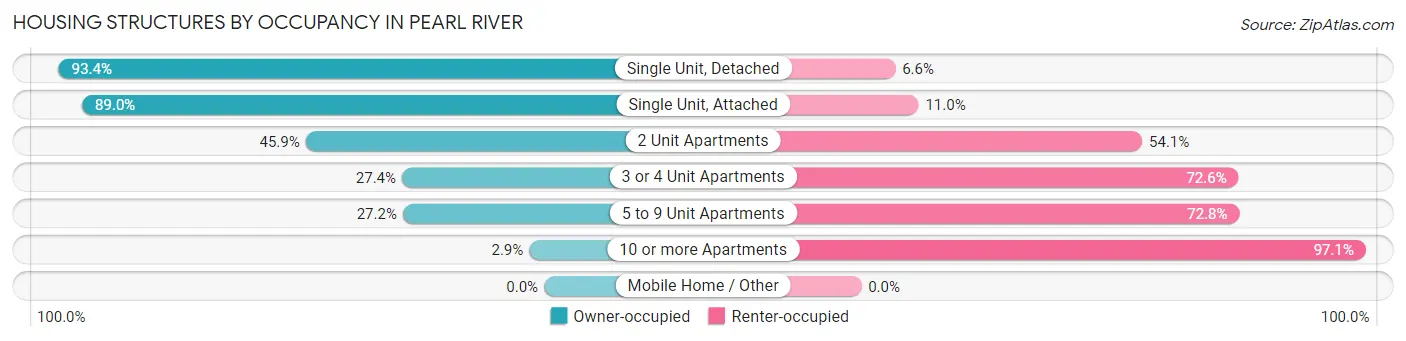
| Structure Type | Owner-occupied | Renter-occupied |
| Single Unit, Detached | 3,859 (93.4%) | 271 (6.6%) |
| Single Unit, Attached | 145 (89.0%) | 18 (11.0%) |
| 2 Unit Apartments | 146 (45.9%) | 172 (54.1%) |
| 3 or 4 Unit Apartments | 84 (27.4%) | 223 (72.6%) |
| 5 to 9 Unit Apartments | 93 (27.2%) | 249 (72.8%) |
| 10 or more Apartments | 13 (2.9%) | 441 (97.1%) |
| Mobile Home / Other | 0 (0.0%) | 0 (0.0%) |
| Total | 4,340 (75.9%) | 1,374 (24.0%) |
Housing Structures by Number of Rooms in Pearl River
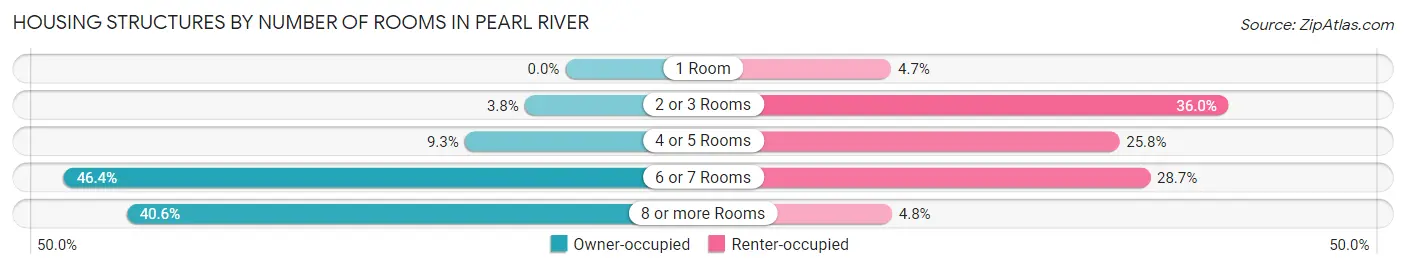
| Number of Rooms | Owner-occupied | Renter-occupied |
| 1 Room | 0 (0.0%) | 65 (4.7%) |
| 2 or 3 Rooms | 163 (3.8%) | 494 (35.9%) |
| 4 or 5 Rooms | 404 (9.3%) | 355 (25.8%) |
| 6 or 7 Rooms | 2,013 (46.4%) | 394 (28.7%) |
| 8 or more Rooms | 1,760 (40.6%) | 66 (4.8%) |
| Total | 4,340 (100.0%) | 1,374 (100.0%) |
Housing Structure by Heating Type in Pearl River
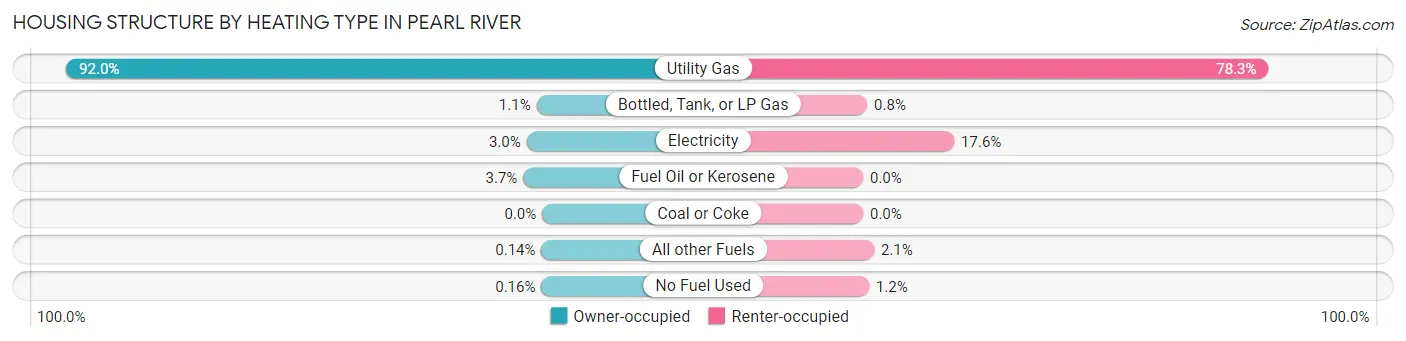
| Heating Type | Owner-occupied | Renter-occupied |
| Utility Gas | 3,991 (92.0%) | 1,076 (78.3%) |
| Bottled, Tank, or LP Gas | 47 (1.1%) | 11 (0.8%) |
| Electricity | 130 (3.0%) | 242 (17.6%) |
| Fuel Oil or Kerosene | 159 (3.7%) | 0 (0.0%) |
| Coal or Coke | 0 (0.0%) | 0 (0.0%) |
| All other Fuels | 6 (0.1%) | 29 (2.1%) |
| No Fuel Used | 7 (0.2%) | 16 (1.2%) |
| Total | 4,340 (100.0%) | 1,374 (100.0%) |
Household Vehicle Usage in Pearl River
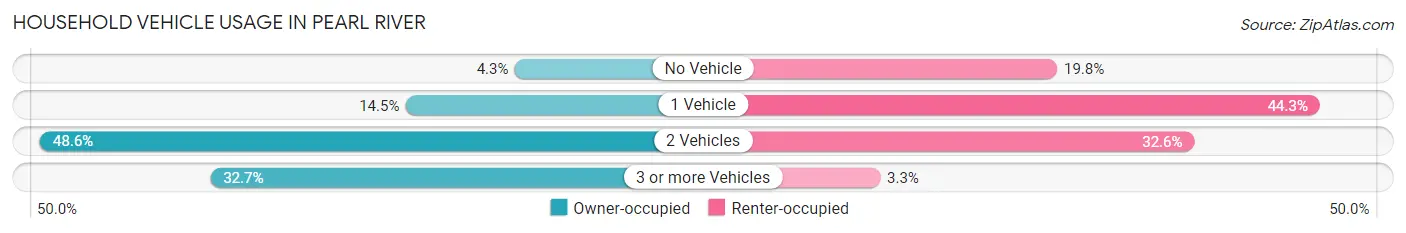
| Vehicles per Household | Owner-occupied | Renter-occupied |
| No Vehicle | 186 (4.3%) | 272 (19.8%) |
| 1 Vehicle | 628 (14.5%) | 609 (44.3%) |
| 2 Vehicles | 2,108 (48.6%) | 448 (32.6%) |
| 3 or more Vehicles | 1,418 (32.7%) | 45 (3.3%) |
| Total | 4,340 (100.0%) | 1,374 (100.0%) |
Real Estate & Mortgages in Pearl River
Real Estate and Mortgage Overview in Pearl River
| Characteristic | Without Mortgage | With Mortgage |
| Housing Units | 1,452 | 2,888 |
| Median Property Value | $493,300 | $549,600 |
| Median Household Income | $110,306 | $2,056 |
| Monthly Housing Costs | $1,426 | $1,919 |
| Real Estate Taxes | $10,001 | $111 |
Property Value by Mortgage Status in Pearl River
| Property Value | Without Mortgage | With Mortgage |
| Less than $50,000 | 0 (0.0%) | 24 (0.8%) |
| $50,000 to $99,999 | 14 (1.0%) | 0 (0.0%) |
| $100,000 to $299,999 | 131 (9.0%) | 116 (4.0%) |
| $300,000 to $499,999 | 615 (42.4%) | 1,039 (36.0%) |
| $500,000 to $749,999 | 590 (40.6%) | 1,336 (46.3%) |
| $750,000 to $999,999 | 62 (4.3%) | 308 (10.7%) |
| $1,000,000 or more | 40 (2.8%) | 65 (2.2%) |
| Total | 1,452 (100.0%) | 2,888 (100.0%) |
Household Income by Mortgage Status in Pearl River
| Household Income | Without Mortgage | With Mortgage |
| Less than $10,000 | 0 (0.0%) | 37 (1.3%) |
| $10,000 to $24,999 | 138 (9.5%) | 56 (1.9%) |
| $25,000 to $34,999 | 49 (3.4%) | 19 (0.7%) |
| $35,000 to $49,999 | 91 (6.3%) | 0 (0.0%) |
| $50,000 to $74,999 | 209 (14.4%) | 66 (2.3%) |
| $75,000 to $99,999 | 125 (8.6%) | 79 (2.7%) |
| $100,000 to $149,999 | 373 (25.7%) | 222 (7.7%) |
| $150,000 or more | 467 (32.2%) | 390 (13.5%) |
| Total | 1,452 (100.0%) | 2,888 (100.0%) |
Property Value to Household Income Ratio in Pearl River
| Value-to-Income Ratio | Without Mortgage | With Mortgage |
| Less than 2.0x | 178 (12.3%) | 204,743 (7,089.4%) |
| 2.0x to 2.9x | 204 (14.1%) | 622 (21.5%) |
| 3.0x to 3.9x | 220 (15.1%) | 1,268 (43.9%) |
| 4.0x or more | 850 (58.5%) | 292 (10.1%) |
| Total | 1,452 (100.0%) | 2,888 (100.0%) |
Real Estate Taxes by Mortgage Status in Pearl River
| Property Taxes | Without Mortgage | With Mortgage |
| Less than $800 | 14 (1.0%) | 32 (1.1%) |
| $800 to $1,499 | 9 (0.6%) | 24 (0.8%) |
| $800 to $1,499 | 1,421 (97.9%) | 2 (0.1%) |
| Total | 1,452 (100.0%) | 2,888 (100.0%) |
Health & Disability in Pearl River
Health Insurance Coverage by Age in Pearl River
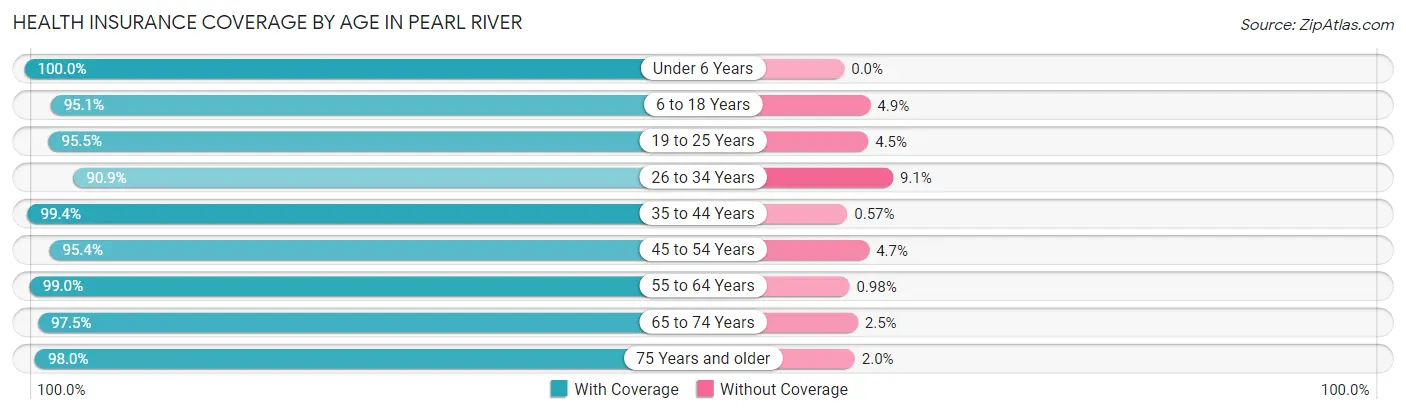
| Age Bracket | With Coverage | Without Coverage |
| Under 6 Years | 1,166 (100.0%) | 0 (0.0%) |
| 6 to 18 Years | 2,482 (95.1%) | 127 (4.9%) |
| 19 to 25 Years | 1,517 (95.5%) | 71 (4.5%) |
| 26 to 34 Years | 1,551 (90.9%) | 155 (9.1%) |
| 35 to 44 Years | 1,927 (99.4%) | 11 (0.6%) |
| 45 to 54 Years | 2,234 (95.4%) | 109 (4.6%) |
| 55 to 64 Years | 1,916 (99.0%) | 19 (1.0%) |
| 65 to 74 Years | 1,348 (97.5%) | 35 (2.5%) |
| 75 Years and older | 1,689 (98.0%) | 34 (2.0%) |
| Total | 15,830 (96.6%) | 561 (3.4%) |
Health Insurance Coverage by Citizenship Status in Pearl River
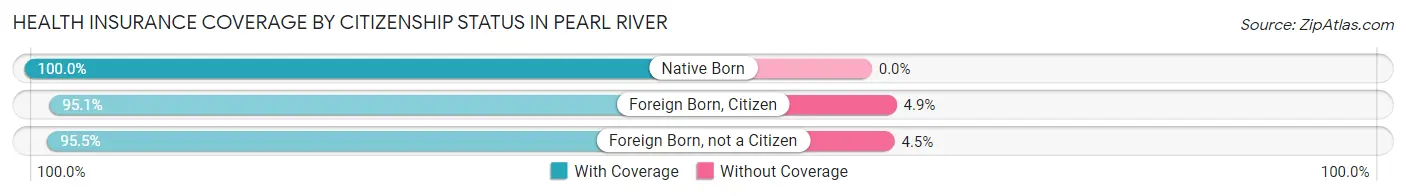
| Citizenship Status | With Coverage | Without Coverage |
| Native Born | 1,166 (100.0%) | 0 (0.0%) |
| Foreign Born, Citizen | 2,482 (95.1%) | 127 (4.9%) |
| Foreign Born, not a Citizen | 1,517 (95.5%) | 71 (4.5%) |
Health Insurance Coverage by Household Income in Pearl River
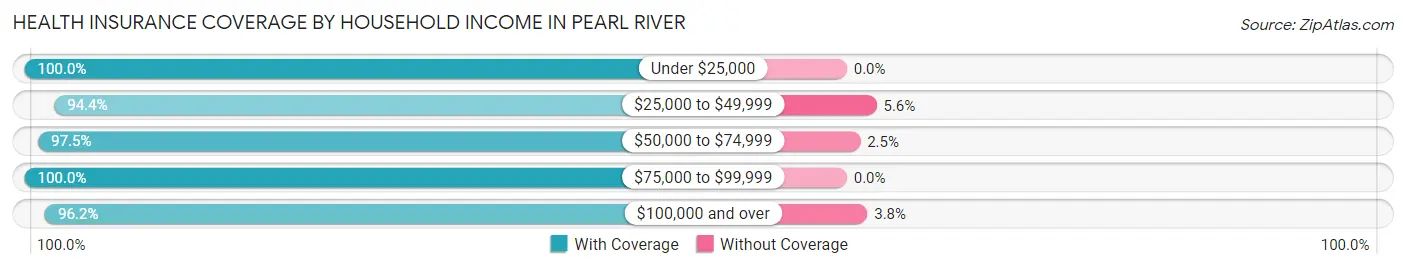
| Household Income | With Coverage | Without Coverage |
| Under $25,000 | 603 (100.0%) | 0 (0.0%) |
| $25,000 to $49,999 | 1,085 (94.4%) | 64 (5.6%) |
| $50,000 to $74,999 | 1,356 (97.5%) | 35 (2.5%) |
| $75,000 to $99,999 | 1,123 (100.0%) | 0 (0.0%) |
| $100,000 and over | 11,578 (96.2%) | 462 (3.8%) |
Public vs Private Health Insurance Coverage by Age in Pearl River
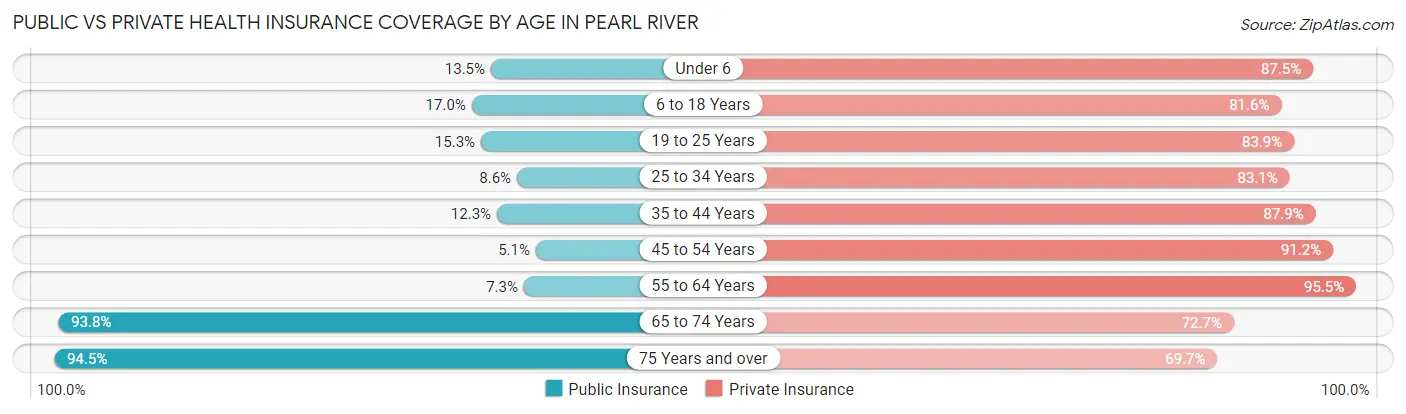
| Age Bracket | Public Insurance | Private Insurance |
| Under 6 | 157 (13.5%) | 1,020 (87.5%) |
| 6 to 18 Years | 444 (17.0%) | 2,128 (81.6%) |
| 19 to 25 Years | 243 (15.3%) | 1,333 (83.9%) |
| 25 to 34 Years | 147 (8.6%) | 1,418 (83.1%) |
| 35 to 44 Years | 239 (12.3%) | 1,704 (87.9%) |
| 45 to 54 Years | 120 (5.1%) | 2,136 (91.2%) |
| 55 to 64 Years | 142 (7.3%) | 1,847 (95.5%) |
| 65 to 74 Years | 1,297 (93.8%) | 1,006 (72.7%) |
| 75 Years and over | 1,629 (94.5%) | 1,201 (69.7%) |
| Total | 4,418 (27.0%) | 13,793 (84.2%) |
Disability Status by Sex by Age in Pearl River
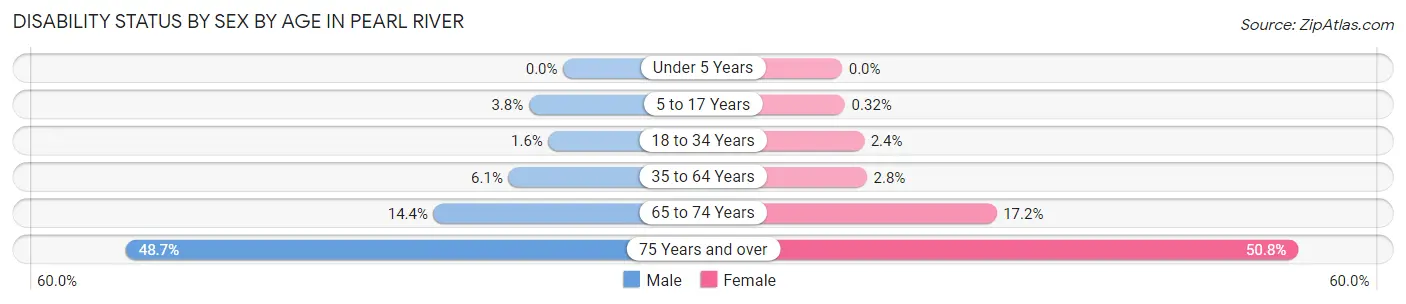
| Age Bracket | Male | Female |
| Under 5 Years | 0 (0.0%) | 0 (0.0%) |
| 5 to 17 Years | 55 (3.8%) | 4 (0.3%) |
| 18 to 34 Years | 24 (1.6%) | 47 (2.4%) |
| 35 to 64 Years | 197 (6.1%) | 82 (2.8%) |
| 65 to 74 Years | 114 (14.4%) | 102 (17.2%) |
| 75 Years and over | 365 (48.7%) | 495 (50.8%) |
Disability Class by Sex by Age in Pearl River
Disability Class: Hearing Difficulty
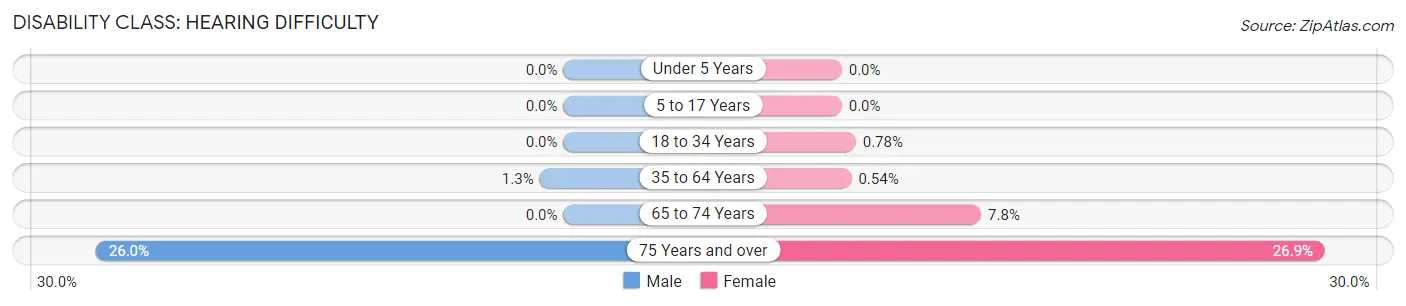
| Age Bracket | Male | Female |
| Under 5 Years | 0 (0.0%) | 0 (0.0%) |
| 5 to 17 Years | 0 (0.0%) | 0 (0.0%) |
| 18 to 34 Years | 0 (0.0%) | 15 (0.8%) |
| 35 to 64 Years | 43 (1.3%) | 16 (0.5%) |
| 65 to 74 Years | 0 (0.0%) | 46 (7.8%) |
| 75 Years and over | 195 (26.0%) | 262 (26.9%) |
Disability Class: Vision Difficulty
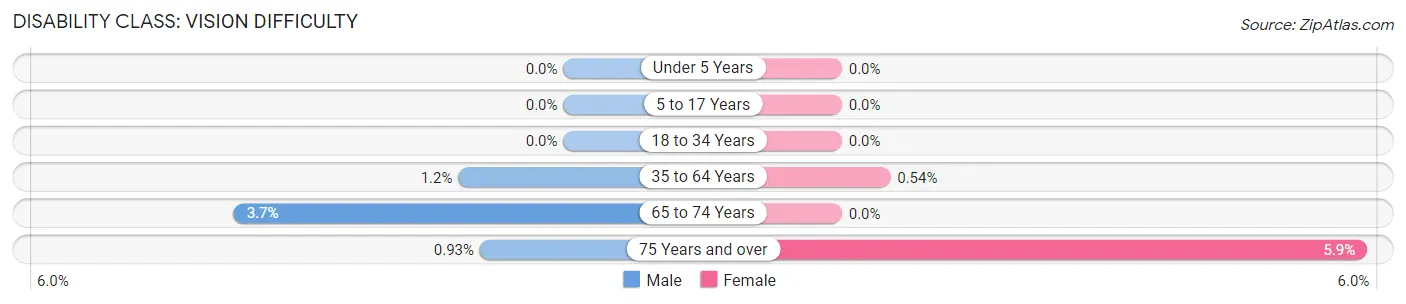
| Age Bracket | Male | Female |
| Under 5 Years | 0 (0.0%) | 0 (0.0%) |
| 5 to 17 Years | 0 (0.0%) | 0 (0.0%) |
| 18 to 34 Years | 0 (0.0%) | 0 (0.0%) |
| 35 to 64 Years | 38 (1.2%) | 16 (0.5%) |
| 65 to 74 Years | 29 (3.7%) | 0 (0.0%) |
| 75 Years and over | 7 (0.9%) | 57 (5.9%) |
Disability Class: Cognitive Difficulty
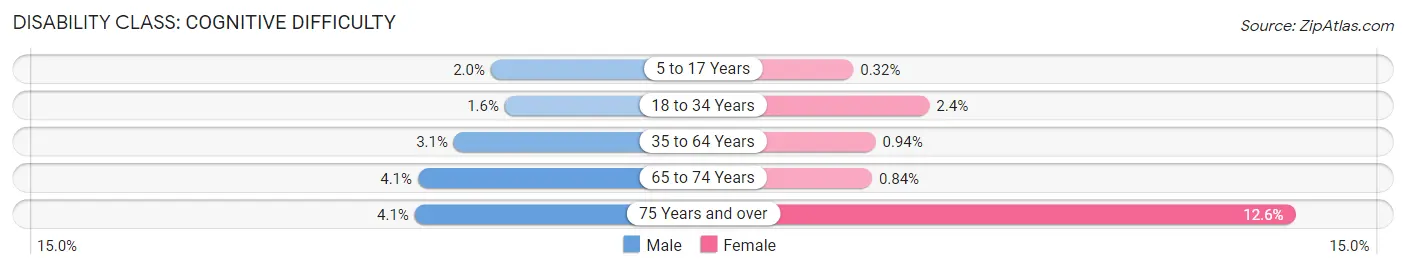
| Age Bracket | Male | Female |
| 5 to 17 Years | 29 (2.0%) | 4 (0.3%) |
| 18 to 34 Years | 24 (1.6%) | 47 (2.4%) |
| 35 to 64 Years | 99 (3.0%) | 28 (0.9%) |
| 65 to 74 Years | 32 (4.1%) | 5 (0.8%) |
| 75 Years and over | 31 (4.1%) | 123 (12.6%) |
Disability Class: Ambulatory Difficulty
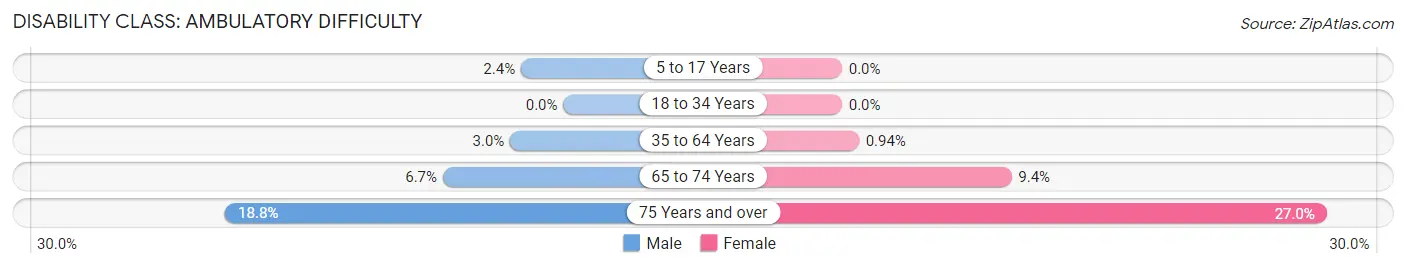
| Age Bracket | Male | Female |
| 5 to 17 Years | 34 (2.4%) | 0 (0.0%) |
| 18 to 34 Years | 0 (0.0%) | 0 (0.0%) |
| 35 to 64 Years | 96 (3.0%) | 28 (0.9%) |
| 65 to 74 Years | 53 (6.7%) | 56 (9.4%) |
| 75 Years and over | 141 (18.8%) | 263 (27.0%) |
Disability Class: Self-Care Difficulty
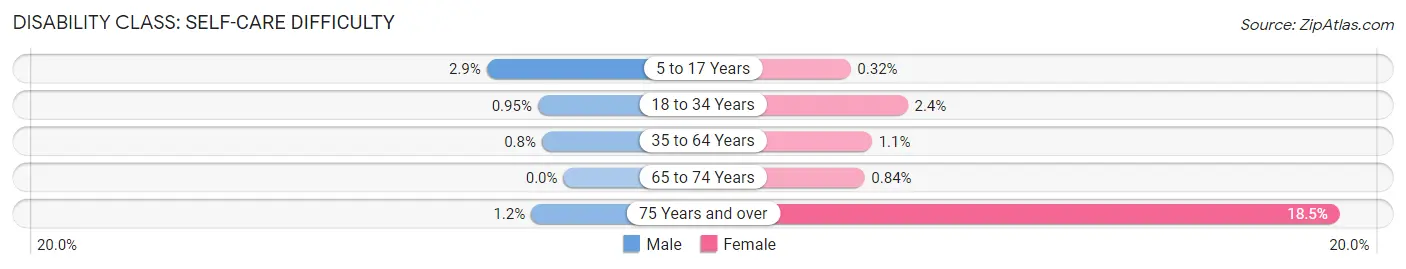
| Age Bracket | Male | Female |
| 5 to 17 Years | 41 (2.9%) | 4 (0.3%) |
| 18 to 34 Years | 14 (0.9%) | 47 (2.4%) |
| 35 to 64 Years | 26 (0.8%) | 33 (1.1%) |
| 65 to 74 Years | 0 (0.0%) | 5 (0.8%) |
| 75 Years and over | 9 (1.2%) | 180 (18.5%) |
Technology Access in Pearl River
Computing Device Access in Pearl River
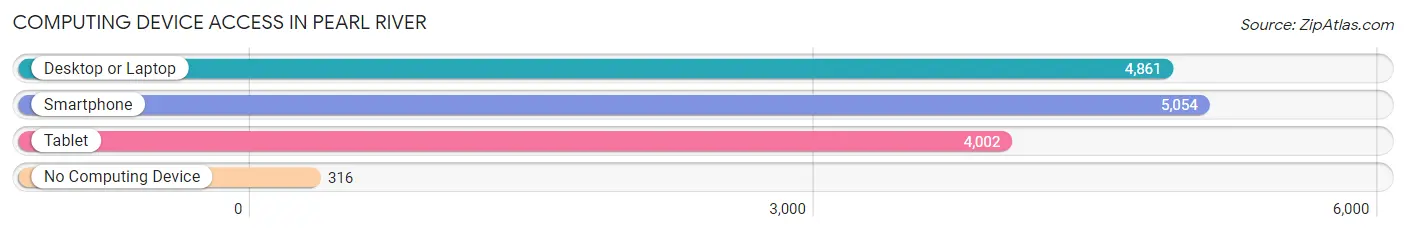
| Device Type | # Households | % Households |
| Desktop or Laptop | 4,861 | 85.1% |
| Smartphone | 5,054 | 88.4% |
| Tablet | 4,002 | 70.0% |
| No Computing Device | 316 | 5.5% |
| Total | 5,714 | 100.0% |
Internet Access in Pearl River
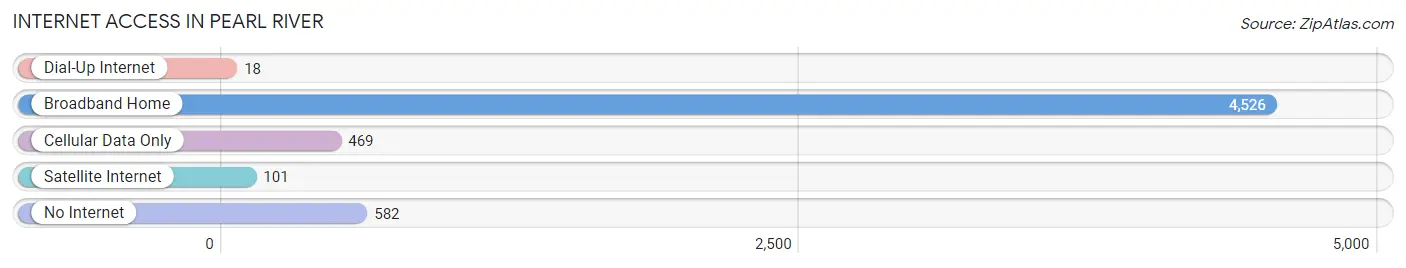
| Internet Type | # Households | % Households |
| Dial-Up Internet | 18 | 0.3% |
| Broadband Home | 4,526 | 79.2% |
| Cellular Data Only | 469 | 8.2% |
| Satellite Internet | 101 | 1.8% |
| No Internet | 582 | 10.2% |
| Total | 5,714 | 100.0% |
Pearl River Summary
Pearl River is a hamlet located in the town of Orangetown in Rockland County, New York. It is located about 20 miles north of New York City and is part of the New York metropolitan area. The hamlet is bordered by the towns of Ramapo and Clarkstown to the north, and the towns of Orangetown and Haverstraw to the south.
History
The area that is now Pearl River was originally inhabited by the Munsee Indians, a branch of the Lenape tribe. The first European settlers arrived in the area in the late 17th century, and the hamlet was officially established in 1713. The hamlet was named after the nearby Pearl River, which was named for the abundance of freshwater mussels found in the river.
In the 19th century, Pearl River became a popular destination for wealthy New Yorkers looking to escape the hustle and bustle of the city. The hamlet was home to several large estates, including the estate of John Jacob Astor, which was later purchased by the Sisters of the Presentation of the Blessed Virgin Mary.
In the early 20th century, Pearl River began to experience rapid growth as a result of the construction of the New York, Susquehanna and Western Railroad. The railroad provided easy access to New York City, and the hamlet quickly became a popular commuter town.
Geography
Pearl River is located in the southeastern corner of Rockland County, New York. It is bordered by the towns of Ramapo and Clarkstown to the north, and the towns of Orangetown and Haverstraw to the south. The hamlet is located about 20 miles north of New York City and is part of the New York metropolitan area.
The hamlet is situated on the western bank of the Hudson River, and is home to the Pearl River Marsh, a tidal marsh that is part of the Hudson River Estuary. The marsh is home to a variety of wildlife, including birds, fish, and amphibians.
Economy
Pearl River is primarily a residential community, and the majority of its residents are employed in the nearby cities of New York and New Jersey. The hamlet is home to several small businesses, including restaurants, retail stores, and professional services.
The hamlet is also home to several large employers, including the Sisters of the Presentation of the Blessed Virgin Mary, which operates a convent and retreat center in the hamlet. The hamlet is also home to the Pearl River School District, which serves the educational needs of the community.
Demographics
As of the 2010 census, Pearl River had a population of 15,876. The racial makeup of the hamlet was 79.3% White, 8.2% African American, 0.3% Native American, 6.2% Asian, and 4.9% from other races. Hispanic or Latino of any race were 11.3% of the population.
The median household income in Pearl River was $77,845, and the median family income was $90,945. The per capita income was $35,945. About 4.3% of families and 5.7% of the population were below the poverty line.
Common Questions
What is Per Capita Income in Pearl River?
Per Capita income in Pearl River is $59,293.
What is the Median Family Income in Pearl River?
Median Family Income in Pearl River is $151,709.
What is the Median Household income in Pearl River?
Median Household Income in Pearl River is $137,331.
What is Income or Wage Gap in Pearl River?
Income or Wage Gap in Pearl River is 32.2%.
Women in Pearl River earn 67.8 cents for every dollar earned by a man.
What is Inequality or Gini Index in Pearl River?
Inequality or Gini Index in Pearl River is 0.42.
What is the Total Population of Pearl River?
Total Population of Pearl River is 16,426.
What is the Total Male Population of Pearl River?
Total Male Population of Pearl River is 8,328.
What is the Total Female Population of Pearl River?
Total Female Population of Pearl River is 8,098.
What is the Ratio of Males per 100 Females in Pearl River?
There are 102.84 Males per 100 Females in Pearl River.
What is the Ratio of Females per 100 Males in Pearl River?
There are 97.24 Females per 100 Males in Pearl River.
What is the Median Population Age in Pearl River?
Median Population Age in Pearl River is 39.6 Years.
What is the Average Family Size in Pearl River
Average Family Size in Pearl River is 3.3 People.
What is the Average Household Size in Pearl River
Average Household Size in Pearl River is 2.9 People.
How Large is the Labor Force in Pearl River?
There are 8,318 People in the Labor Forcein in Pearl River.
What is the Percentage of People in the Labor Force in Pearl River?
63.0% of People are in the Labor Force in Pearl River.
What is the Unemployment Rate in Pearl River?
Unemployment Rate in Pearl River is 3.2%.