Redford, NY Map & Demographics
Redford Map
Redford Overview
$32,964
PER CAPITA INCOME
$92,355
AVG FAMILY INCOME
$92,355
AVG HOUSEHOLD INCOME
21.6%
WAGE / INCOME GAP [ % ]
78.4¢/ $1
WAGE / INCOME GAP [ $ ]
0.07
INEQUALITY / GINI INDEX
256
TOTAL POPULATION
123
MALE POPULATION
133
FEMALE POPULATION
92.48
MALES / 100 FEMALES
108.13
FEMALES / 100 MALES
59.5
MEDIAN AGE
3.2
AVG FAMILY SIZE
3.2
AVG HOUSEHOLD SIZE
146
LABOR FORCE [ PEOPLE ]
62.4%
PERCENT IN LABOR FORCE
Redford Zip Codes
Redford Area Codes
Income in Redford
Income Overview in Redford
Per Capita Income in Redford is $32,964, while median incomes of families and households are $92,355 and $92,355 respectively.
| Characteristic | Number | Measure |
| Per Capita Income | 256 | $32,964 |
| Median Family Income | 81 | $92,355 |
| Mean Family Income | 81 | $102,407 |
| Median Household Income | 81 | $92,355 |
| Mean Household Income | 81 | $102,407 |
| Income Deficit | 81 | $0 |
| Wage / Income Gap (%) | 256 | 21.64% |
| Wage / Income Gap ($) | 256 | 78.36¢ per $1 |
| Gini / Inequality Index | 256 | 0.07 |
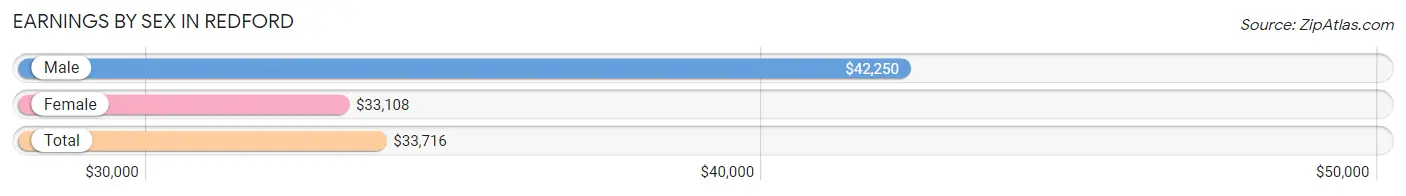
Earnings by Sex in Redford
Average Earnings in Redford are $33,716, $42,250 for men and $33,108 for women, a difference of 21.6%.
| Sex | Number | Average Earnings |
| Male | 90 (61.6%) | $42,250 |
| Female | 56 (38.4%) | $33,108 |
| Total | 146 (100.0%) | $33,716 |
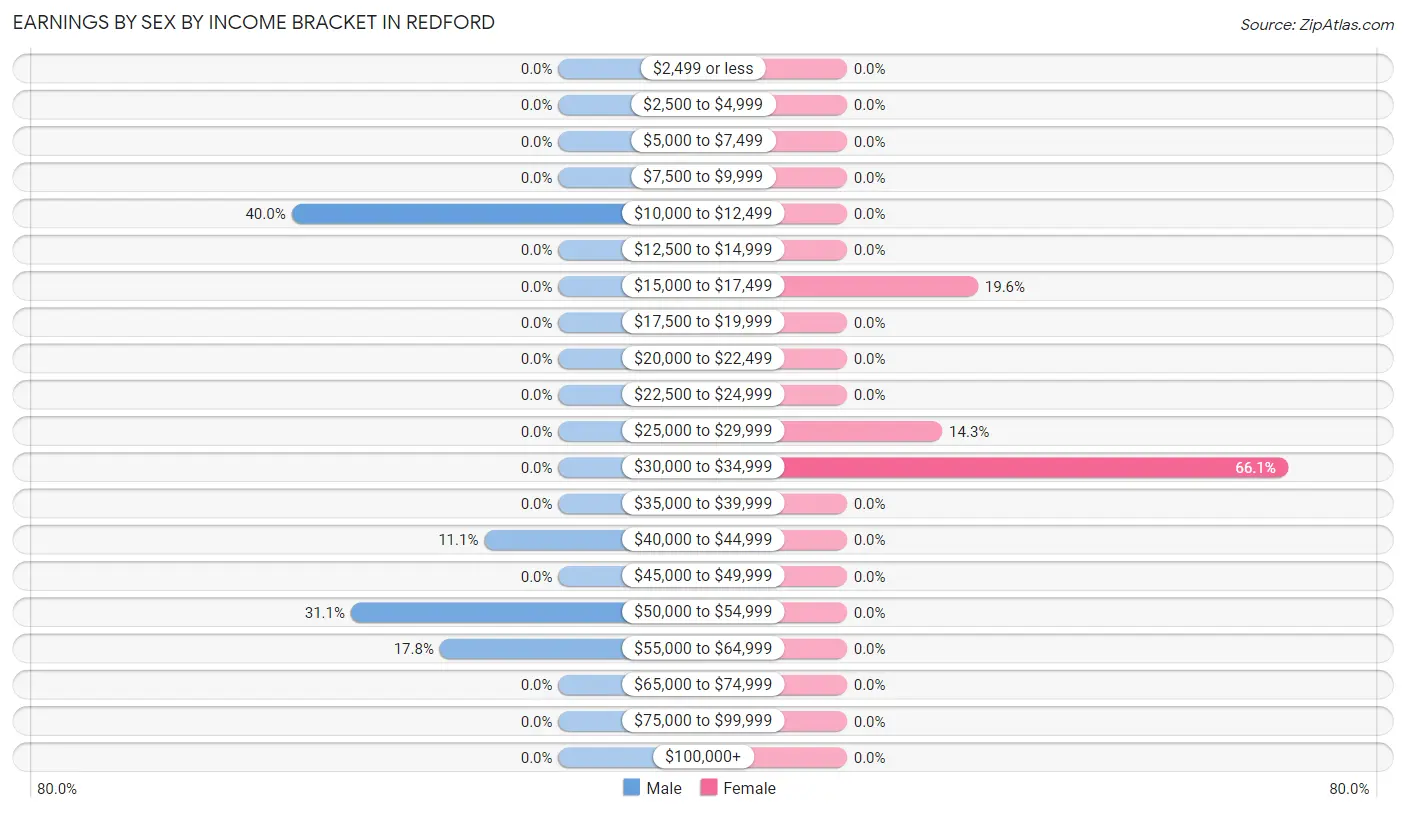
Earnings by Sex by Income Bracket in Redford
The most common earnings brackets in Redford are $10,000 to $12,499 for men (36 | 40.0%) and $30,000 to $34,999 for women (37 | 66.1%).
| Income | Male | Female |
| $2,499 or less | 0 (0.0%) | 0 (0.0%) |
| $2,500 to $4,999 | 0 (0.0%) | 0 (0.0%) |
| $5,000 to $7,499 | 0 (0.0%) | 0 (0.0%) |
| $7,500 to $9,999 | 0 (0.0%) | 0 (0.0%) |
| $10,000 to $12,499 | 36 (40.0%) | 0 (0.0%) |
| $12,500 to $14,999 | 0 (0.0%) | 0 (0.0%) |
| $15,000 to $17,499 | 0 (0.0%) | 11 (19.6%) |
| $17,500 to $19,999 | 0 (0.0%) | 0 (0.0%) |
| $20,000 to $22,499 | 0 (0.0%) | 0 (0.0%) |
| $22,500 to $24,999 | 0 (0.0%) | 0 (0.0%) |
| $25,000 to $29,999 | 0 (0.0%) | 8 (14.3%) |
| $30,000 to $34,999 | 0 (0.0%) | 37 (66.1%) |
| $35,000 to $39,999 | 0 (0.0%) | 0 (0.0%) |
| $40,000 to $44,999 | 10 (11.1%) | 0 (0.0%) |
| $45,000 to $49,999 | 0 (0.0%) | 0 (0.0%) |
| $50,000 to $54,999 | 28 (31.1%) | 0 (0.0%) |
| $55,000 to $64,999 | 16 (17.8%) | 0 (0.0%) |
| $65,000 to $74,999 | 0 (0.0%) | 0 (0.0%) |
| $75,000 to $99,999 | 0 (0.0%) | 0 (0.0%) |
| $100,000+ | 0 (0.0%) | 0 (0.0%) |
| Total | 90 (100.0%) | 56 (100.0%) |
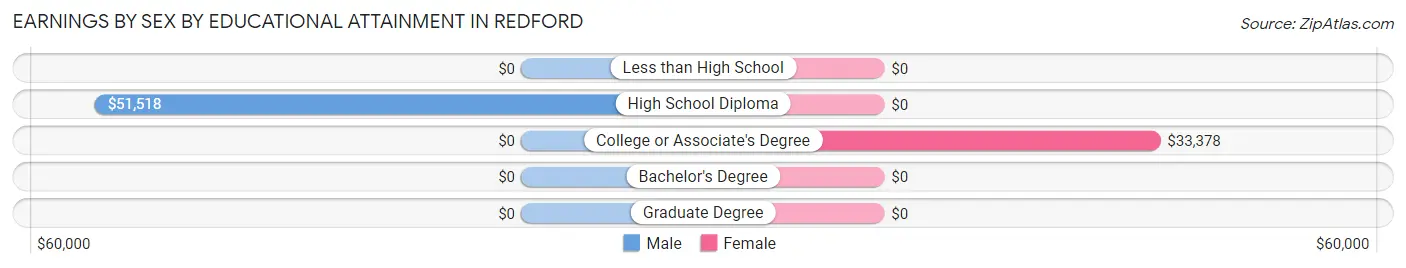
Earnings by Sex by Educational Attainment in Redford
Average earnings in Redford are $42,250 for men and $33,108 for women, a difference of 21.6%. Men with an educational attainment of high school diploma enjoy the highest average annual earnings of $51,518, while those with high school diploma education earn the least with $51,518. Women with an educational attainment of college or associate's degree earn the most with the average annual earnings of $33,378, while those with college or associate's degree education have the smallest earnings of $33,378.
| Educational Attainment | Male Income | Female Income |
| Less than High School | - | - |
| High School Diploma | $51,518 | $0 |
| College or Associate's Degree | - | - |
| Bachelor's Degree | - | - |
| Graduate Degree | - | - |
| Total | $42,250 | $33,108 |
Family Income in Redford
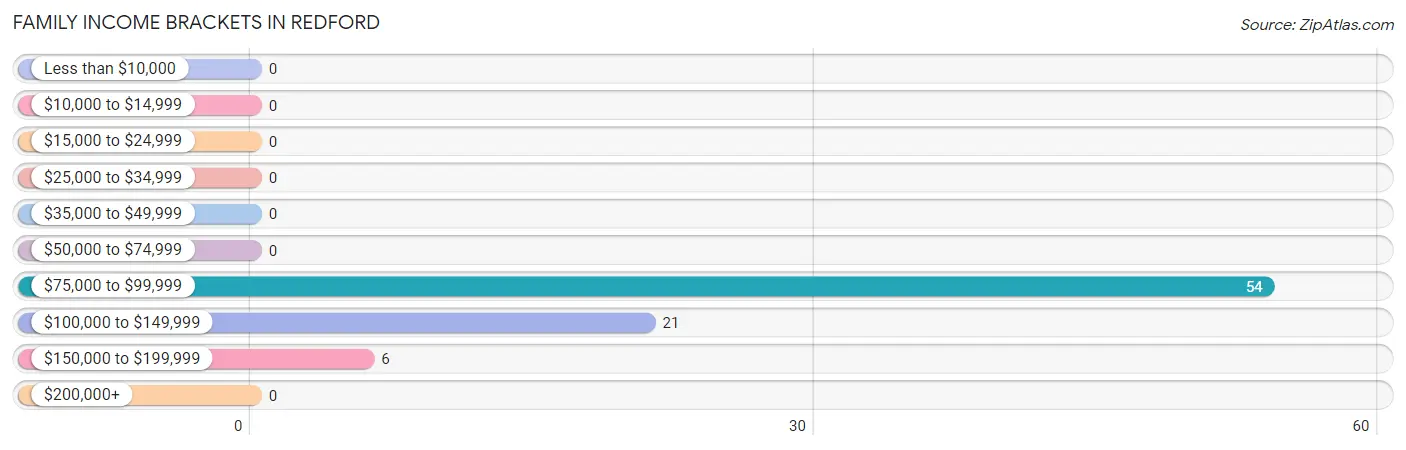
Family Income Brackets in Redford
According to the Redford family income data, there are 54 families falling into the $75,000 to $99,999 income range, which is the most common income bracket and makes up 66.7% of all families.
| Income Bracket | # Families | % Families |
| Less than $10,000 | 0 | 0.0% |
| $10,000 to $14,999 | 0 | 0.0% |
| $15,000 to $24,999 | 0 | 0.0% |
| $25,000 to $34,999 | 0 | 0.0% |
| $35,000 to $49,999 | 0 | 0.0% |
| $50,000 to $74,999 | 0 | 0.0% |
| $75,000 to $99,999 | 54 | 66.7% |
| $100,000 to $149,999 | 21 | 25.9% |
| $150,000 to $199,999 | 6 | 7.4% |
| $200,000+ | 0 | 0.0% |
Family Income by Famaliy Size in Redford
| Income Bracket | # Families | Median Income |
| 2-Person Families | 21 (25.9%) | $0 |
| 3-Person Families | 54 (66.7%) | $0 |
| 4-Person Families | 0 (0.0%) | $0 |
| 5-Person Families | 0 (0.0%) | $0 |
| 6-Person Families | 0 (0.0%) | $0 |
| 7+ Person Families | 6 (7.4%) | $0 |
| Total | 81 (100.0%) | $92,355 |
Family Income by Number of Earners in Redford
| Number of Earners | # Families | Median Income |
| No Earners | 21 (25.9%) | $0 |
| 1 Earner | 0 (0.0%) | $0 |
| 2 Earners | 54 (66.7%) | $0 |
| 3+ Earners | 6 (7.4%) | $0 |
| Total | 81 (100.0%) | $92,355 |
Household Income in Redford
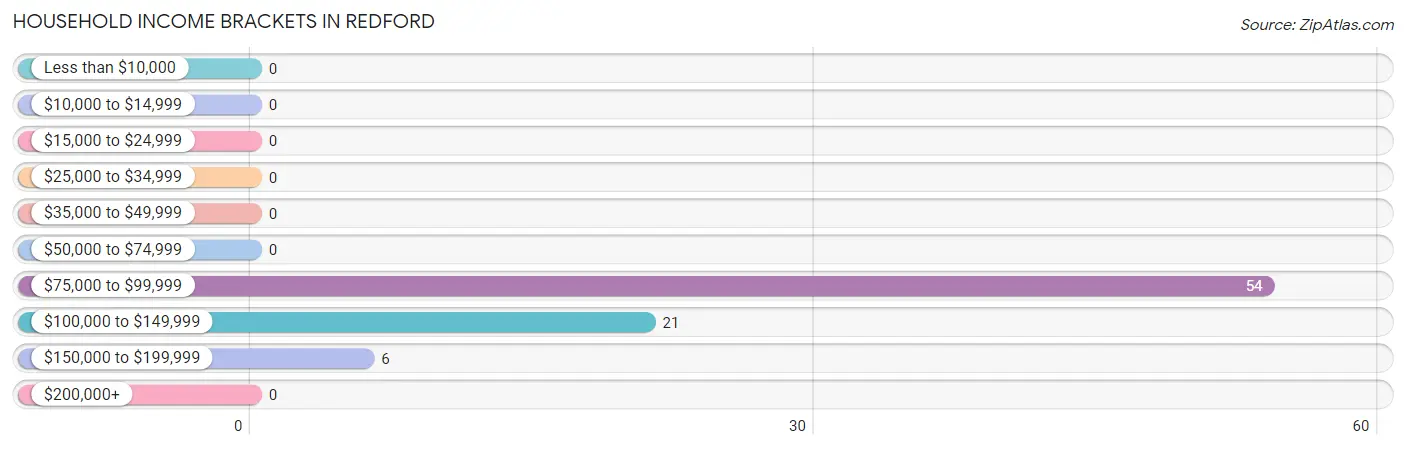
Household Income Brackets in Redford
With 54 households falling in the category, the $75,000 to $99,999 income range is the most frequent in Redford, accounting for 66.7% of all households.
| Income Bracket | # Households | % Households |
| Less than $10,000 | 0 | 0.0% |
| $10,000 to $14,999 | 0 | 0.0% |
| $15,000 to $24,999 | 0 | 0.0% |
| $25,000 to $34,999 | 0 | 0.0% |
| $35,000 to $49,999 | 0 | 0.0% |
| $50,000 to $74,999 | 0 | 0.0% |
| $75,000 to $99,999 | 54 | 66.7% |
| $100,000 to $149,999 | 21 | 25.9% |
| $150,000 to $199,999 | 6 | 7.4% |
| $200,000+ | 0 | 0.0% |
Household Income by Householder Age in Redford
| Income Bracket | # Households | Median Income |
| 15 to 24 Years | 0 (0.0%) | $0 |
| 25 to 44 Years | 11 (13.6%) | $0 |
| 45 to 64 Years | 6 (7.4%) | $0 |
| 65+ Years | 64 (79.0%) | $0 |
| Total | 81 (100.0%) | $92,355 |
Poverty in Redford
Income Below Poverty by Sex and Age in Redford
| Age Bracket | Male | Female |
| Under 5 Years | 0 (0.0%) | 0 (0.0%) |
| 5 Years | 0 (0.0%) | 0 (0.0%) |
| 6 to 11 Years | 0 (0.0%) | 0 (0.0%) |
| 12 to 14 Years | 0 (0.0%) | 0 (0.0%) |
| 15 Years | 0 (0.0%) | 0 (0.0%) |
| 16 and 17 Years | 0 (0.0%) | 0 (0.0%) |
| 18 to 24 Years | 0 (0.0%) | 0 (0.0%) |
| 25 to 34 Years | 0 (0.0%) | 0 (0.0%) |
| 35 to 44 Years | 0 (0.0%) | 0 (0.0%) |
| 45 to 54 Years | 0 (0.0%) | 0 (0.0%) |
| 55 to 64 Years | 0 (0.0%) | 0 (0.0%) |
| 65 to 74 Years | 0 (0.0%) | 0 (0.0%) |
| 75 Years and over | 0 (0.0%) | 0 (0.0%) |
| Total | 0 (0.0%) | 0 (0.0%) |
Income Above Poverty by Sex and Age in Redford
According to the poverty statistics in Redford, males aged 6 to 11 years and females aged under 5 years are the age groups that are most secure financially, with 100.0% of males and 100.0% of females in these age groups living above the poverty line.
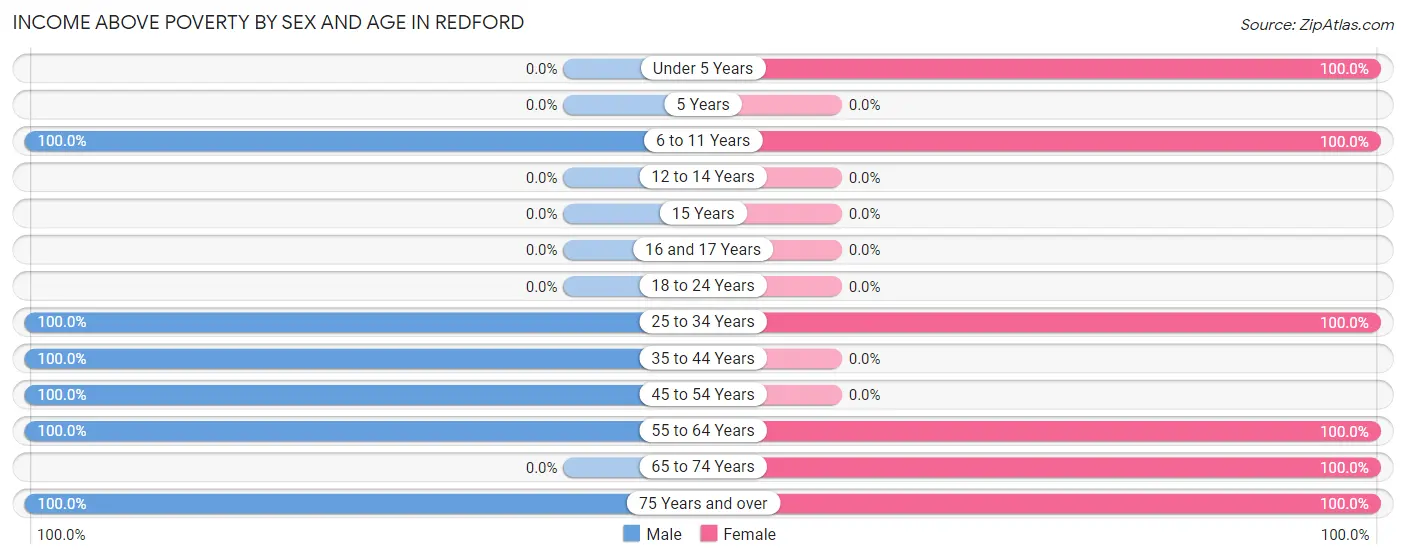
| Age Bracket | Male | Female |
| Under 5 Years | 0 (0.0%) | 8 (100.0%) |
| 5 Years | 0 (0.0%) | 0 (0.0%) |
| 6 to 11 Years | 9 (100.0%) | 5 (100.0%) |
| 12 to 14 Years | 0 (0.0%) | 0 (0.0%) |
| 15 Years | 0 (0.0%) | 0 (0.0%) |
| 16 and 17 Years | 0 (0.0%) | 0 (0.0%) |
| 18 to 24 Years | 0 (0.0%) | 0 (0.0%) |
| 25 to 34 Years | 16 (100.0%) | 48 (100.0%) |
| 35 to 44 Years | 10 (100.0%) | 0 (0.0%) |
| 45 to 54 Years | 28 (100.0%) | 0 (0.0%) |
| 55 to 64 Years | 6 (100.0%) | 8 (100.0%) |
| 65 to 74 Years | 0 (0.0%) | 21 (100.0%) |
| 75 Years and over | 54 (100.0%) | 43 (100.0%) |
| Total | 123 (100.0%) | 133 (100.0%) |
Income Below Poverty Among Married-Couple Families in Redford
| Children | Above Poverty | Below Poverty |
| No Children | 64 (100.0%) | 0 (0.0%) |
| 1 or 2 Children | 17 (100.0%) | 0 (0.0%) |
| 3 or 4 Children | 0 (0.0%) | 0 (0.0%) |
| 5 or more Children | 0 (0.0%) | 0 (0.0%) |
| Total | 81 (100.0%) | 0 (0.0%) |
Income Below Poverty Among Single-Parent Households in Redford
| Children | Single Father | Single Mother |
| No Children | 0 (0.0%) | 0 (0.0%) |
| 1 or 2 Children | 0 (0.0%) | 0 (0.0%) |
| 3 or 4 Children | 0 (0.0%) | 0 (0.0%) |
| 5 or more Children | 0 (0.0%) | 0 (0.0%) |
| Total | 0 (0.0%) | 0 (0.0%) |
Income Below Poverty Among Married-Couple vs Single-Parent Households in Redford
| Children | Married-Couple Families | Single-Parent Households |
| No Children | 0 (0.0%) | 0 (0.0%) |
| 1 or 2 Children | 0 (0.0%) | 0 (0.0%) |
| 3 or 4 Children | 0 (0.0%) | 0 (0.0%) |
| 5 or more Children | 0 (0.0%) | 0 (0.0%) |
| Total | 0 (0.0%) | 0 (0.0%) |
Race in Redford
The most populous races in Redford are White / Caucasian (256 | 100.0%), and Hispanic or Latino (5 | 1.9%).
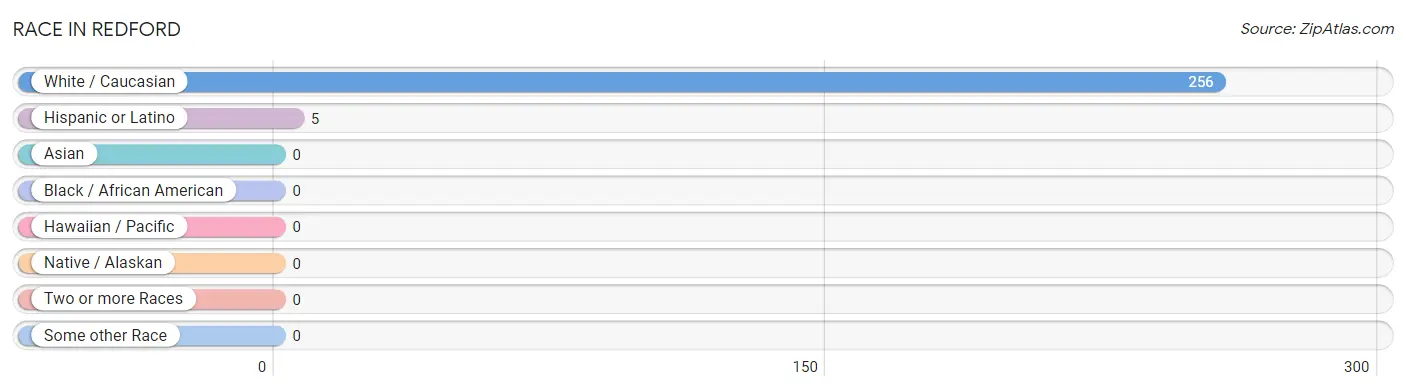
| Race | # Population | % Population |
| Asian | 0 | 0.0% |
| Black / African American | 0 | 0.0% |
| Hawaiian / Pacific | 0 | 0.0% |
| Hispanic or Latino | 5 | 1.9% |
| Native / Alaskan | 0 | 0.0% |
| White / Caucasian | 256 | 100.0% |
| Two or more Races | 0 | 0.0% |
| Some other Race | 0 | 0.0% |
| Total | 256 | 100.0% |
Ancestry in Redford
The most populous ancestries reported in Redford are Irish (47 | 18.4%), Lithuanian (18 | 7.0%), Scotch-Irish (10 | 3.9%), French (6 | 2.3%), and Puerto Rican (5 | 1.9%), together accounting for 33.6% of all Redford residents.
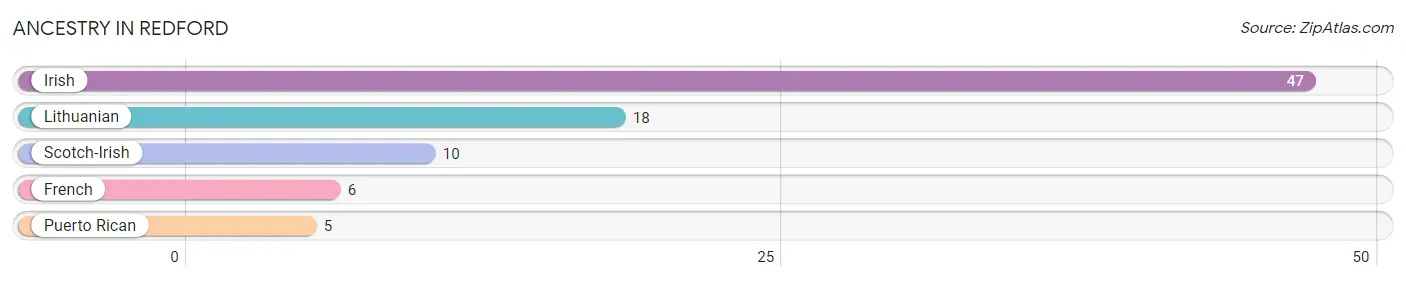
| Ancestry | # Population | % Population |
| French | 6 | 2.3% |
| Irish | 47 | 18.4% |
| Lithuanian | 18 | 7.0% |
| Puerto Rican | 5 | 1.9% |
| Scotch-Irish | 10 | 3.9% | View All 5 Rows |
Immigrants in Redford

| Immigration Origin | # Population | % Population | View All 0 Rows |
Sex and Age in Redford
Sex and Age in Redford
The most populous age groups in Redford are 75 to 79 Years (54 | 43.9%) for men and 75 to 79 Years (43 | 32.3%) for women.
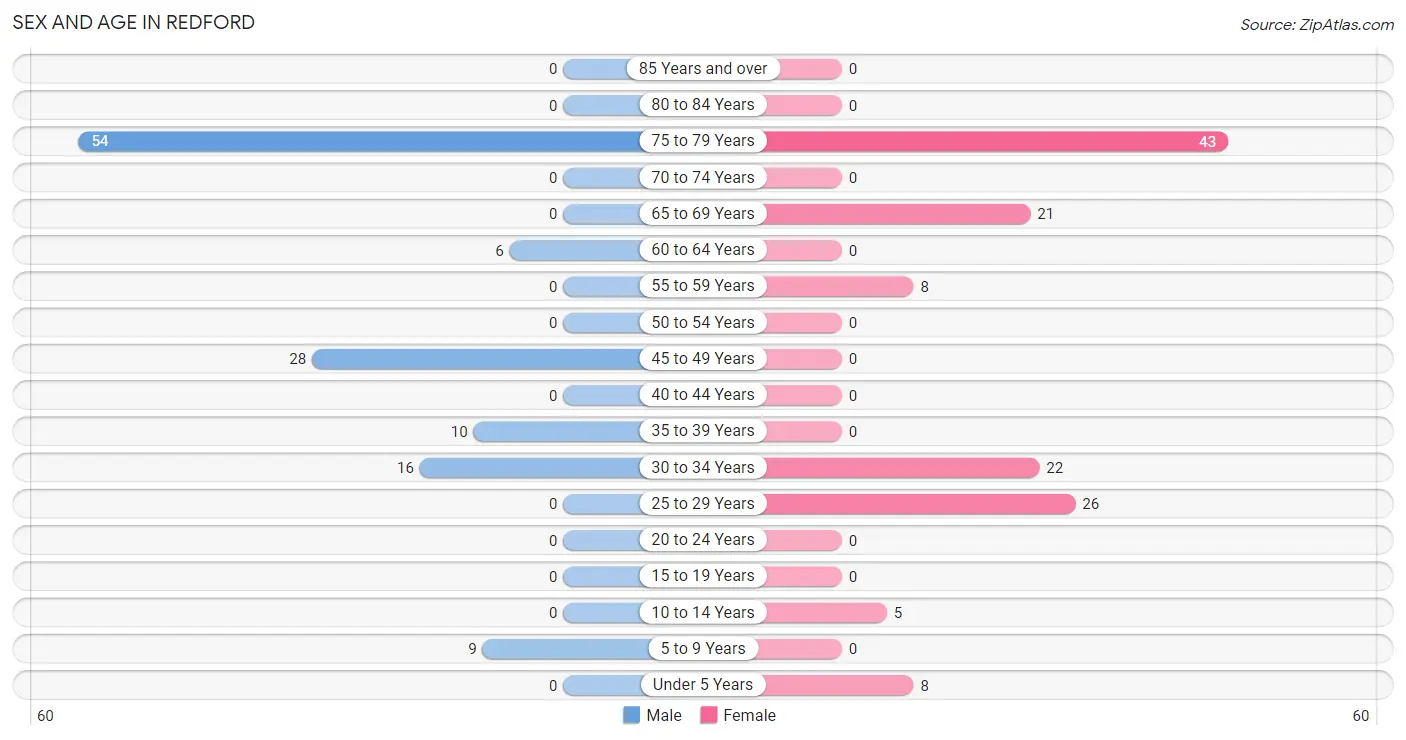
| Age Bracket | Male | Female |
| Under 5 Years | 0 (0.0%) | 8 (6.0%) |
| 5 to 9 Years | 9 (7.3%) | 0 (0.0%) |
| 10 to 14 Years | 0 (0.0%) | 5 (3.8%) |
| 15 to 19 Years | 0 (0.0%) | 0 (0.0%) |
| 20 to 24 Years | 0 (0.0%) | 0 (0.0%) |
| 25 to 29 Years | 0 (0.0%) | 26 (19.6%) |
| 30 to 34 Years | 16 (13.0%) | 22 (16.5%) |
| 35 to 39 Years | 10 (8.1%) | 0 (0.0%) |
| 40 to 44 Years | 0 (0.0%) | 0 (0.0%) |
| 45 to 49 Years | 28 (22.8%) | 0 (0.0%) |
| 50 to 54 Years | 0 (0.0%) | 0 (0.0%) |
| 55 to 59 Years | 0 (0.0%) | 8 (6.0%) |
| 60 to 64 Years | 6 (4.9%) | 0 (0.0%) |
| 65 to 69 Years | 0 (0.0%) | 21 (15.8%) |
| 70 to 74 Years | 0 (0.0%) | 0 (0.0%) |
| 75 to 79 Years | 54 (43.9%) | 43 (32.3%) |
| 80 to 84 Years | 0 (0.0%) | 0 (0.0%) |
| 85 Years and over | 0 (0.0%) | 0 (0.0%) |
| Total | 123 (100.0%) | 133 (100.0%) |
Families and Households in Redford
Median Family Size in Redford
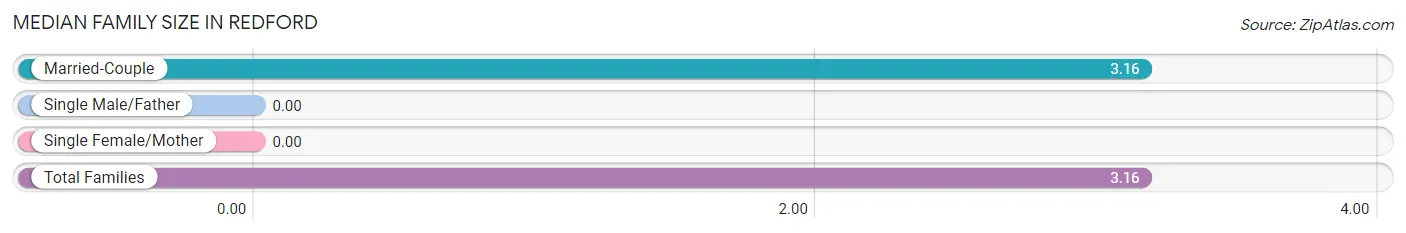
| Family Type | # Families | Family Size |
| Married-Couple | 81 (100.0%) | 3.16 |
| Single Male/Father | 0 (0.0%) | - |
| Single Female/Mother | 0 (0.0%) | - |
| Total Families | 81 (100.0%) | 3.16 |
Median Household Size in Redford
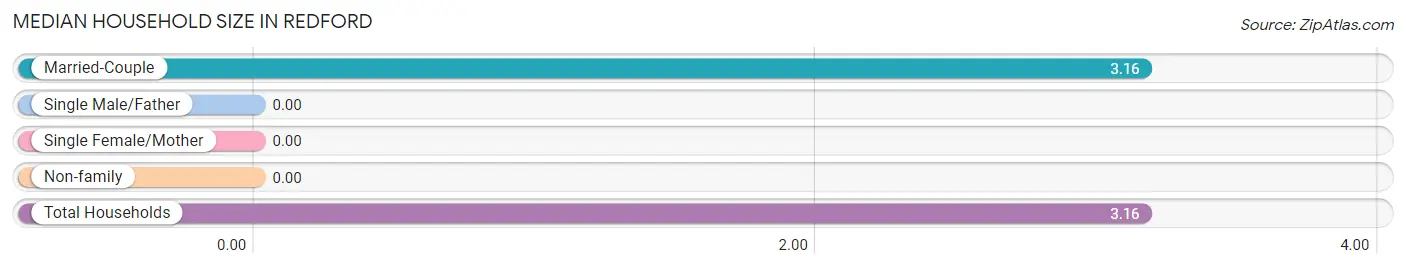
| Household Type | # Households | Household Size |
| Married-Couple | 81 (100.0%) | 3.16 |
| Single Male/Father | 0 (0.0%) | - |
| Single Female/Mother | 0 (0.0%) | - |
| Non-family | 0 (0.0%) | - |
| Total Households | 81 (100.0%) | 3.16 |
Household Size by Marriage Status in Redford
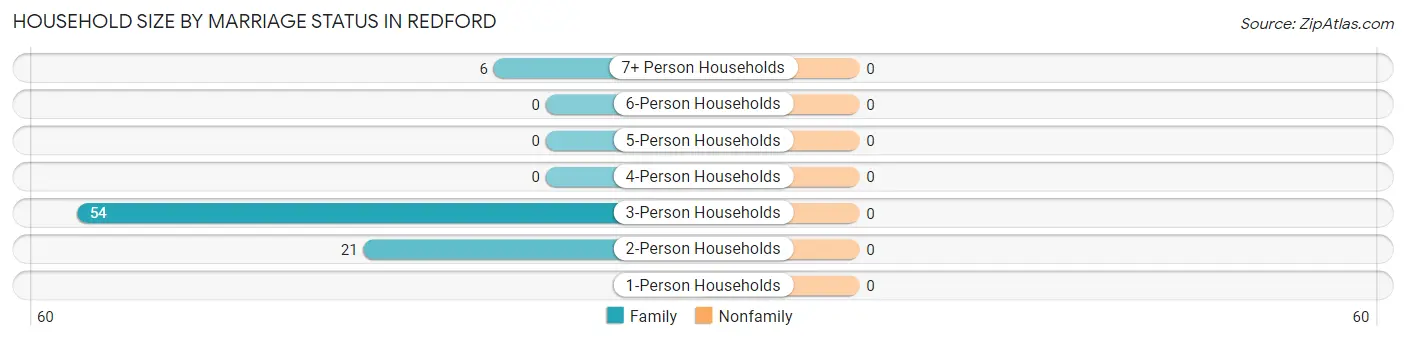
| Household Size | Family Households | Nonfamily Households |
| 1-Person Households | - | 0 (0.0%) |
| 2-Person Households | 21 (25.9%) | 0 (0.0%) |
| 3-Person Households | 54 (66.7%) | 0 (0.0%) |
| 4-Person Households | 0 (0.0%) | 0 (0.0%) |
| 5-Person Households | 0 (0.0%) | 0 (0.0%) |
| 6-Person Households | 0 (0.0%) | 0 (0.0%) |
| 7+ Person Households | 6 (7.4%) | 0 (0.0%) |
| Total | 81 (100.0%) | 0 (0.0%) |
Female Fertility in Redford
Fertility by Age in Redford
Average fertility rate in Redford is 229.0 births per 1,000 women. Women in the age bracket of 20 to 34 years have the highest fertility rate with 229.0 births per 1,000 women. Women in the age bracket of 20 to 34 years acount for 100.0% of all women with births.
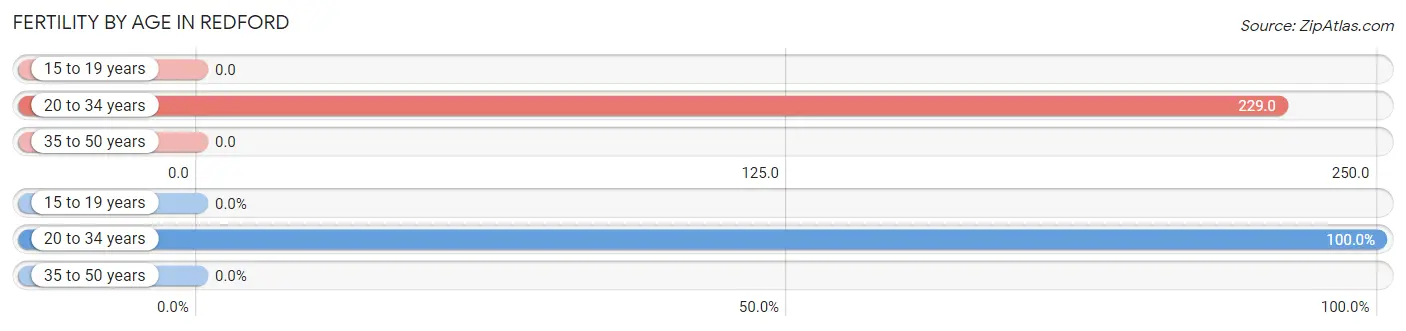
| Age Bracket | Women with Births | Births / 1,000 Women |
| 15 to 19 years | 0 (0.0%) | 0.0 |
| 20 to 34 years | 11 (100.0%) | 229.0 |
| 35 to 50 years | 0 (0.0%) | 0.0 |
| Total | 11 (100.0%) | 229.0 |
Fertility by Age by Marriage Status in Redford
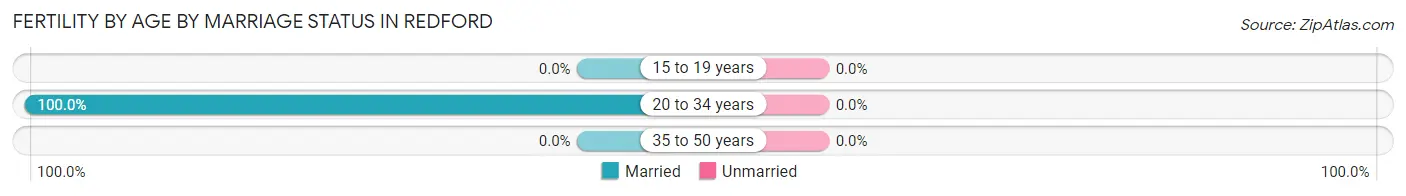
| Age Bracket | Married | Unmarried |
| 15 to 19 years | 0 (0.0%) | 0 (0.0%) |
| 20 to 34 years | 11 (100.0%) | 0 (0.0%) |
| 35 to 50 years | 0 (0.0%) | 0 (0.0%) |
| Total | 11 (100.0%) | 0 (0.0%) |
Fertility by Education in Redford
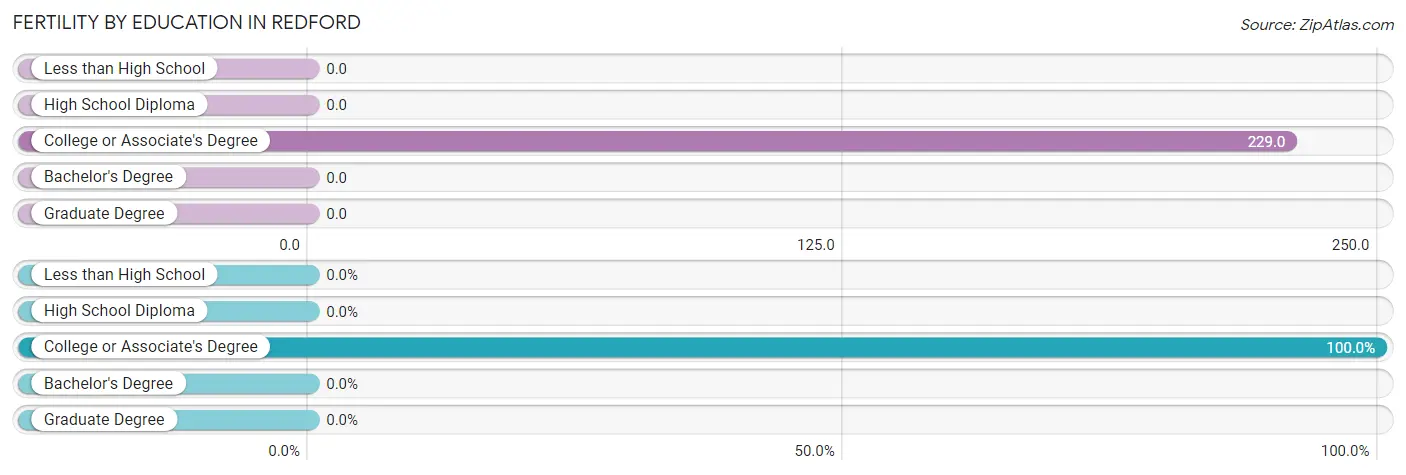
| Educational Attainment | Women with Births | Births / 1,000 Women |
| Less than High School | 0 (0.0%) | 0.0 |
| High School Diploma | 0 (0.0%) | 0.0 |
| College or Associate's Degree | 11 (100.0%) | 229.0 |
| Bachelor's Degree | 0 (0.0%) | 0.0 |
| Graduate Degree | 0 (0.0%) | 0.0 |
| Total | 11 (100.0%) | 229.0 |
Fertility by Education by Marriage Status in Redford
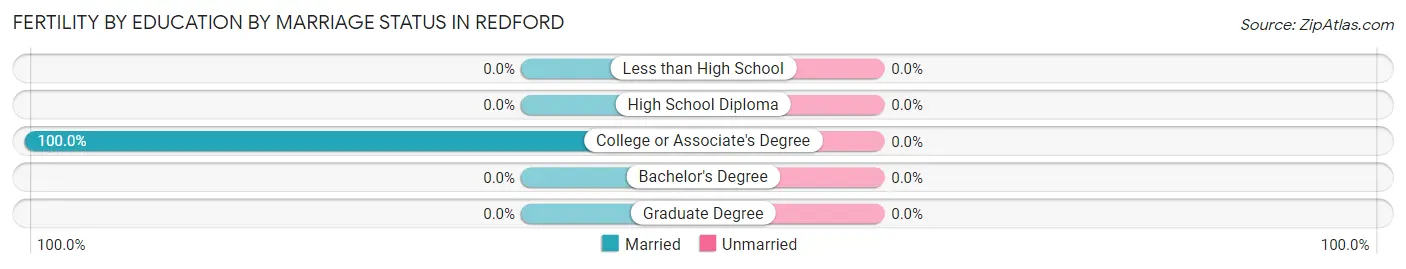
| Educational Attainment | Married | Unmarried |
| Less than High School | 0 (0.0%) | 0 (0.0%) |
| High School Diploma | 0 (0.0%) | 0 (0.0%) |
| College or Associate's Degree | 11 (100.0%) | 0 (0.0%) |
| Bachelor's Degree | 0 (0.0%) | 0 (0.0%) |
| Graduate Degree | 0 (0.0%) | 0 (0.0%) |
| Total | 11 (100.0%) | 0 (0.0%) |
Employment Characteristics in Redford
Employment by Class of Employer in Redford
Among the 135 employed individuals in Redford, private company employees (44 | 32.6%), self-employed (not incorporated) (36 | 26.7%), and local government employees (28 | 20.7%) make up the most common classes of employment.
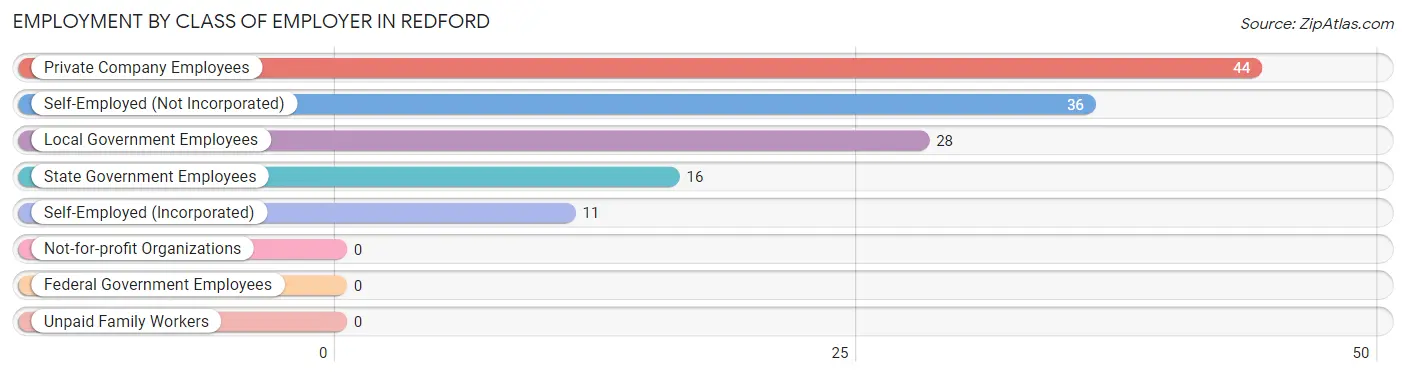
| Employer Class | # Employees | % Employees |
| Private Company Employees | 44 | 32.6% |
| Self-Employed (Incorporated) | 11 | 8.2% |
| Self-Employed (Not Incorporated) | 36 | 26.7% |
| Not-for-profit Organizations | 0 | 0.0% |
| Local Government Employees | 28 | 20.7% |
| State Government Employees | 16 | 11.8% |
| Federal Government Employees | 0 | 0.0% |
| Unpaid Family Workers | 0 | 0.0% |
| Total | 135 | 100.0% |
Employment Status by Age in Redford
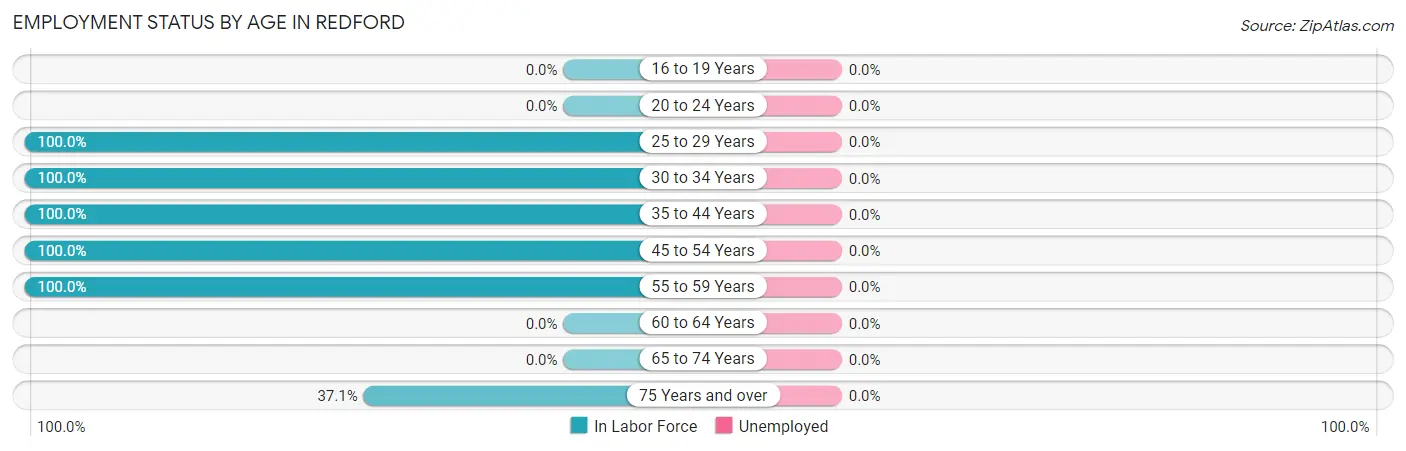
| Age Bracket | In Labor Force | Unemployed |
| 16 to 19 Years | 0 (0.0%) | 0 (0.0%) |
| 20 to 24 Years | 0 (0.0%) | 0 (0.0%) |
| 25 to 29 Years | 26 (100.0%) | 0 (0.0%) |
| 30 to 34 Years | 38 (100.0%) | 0 (0.0%) |
| 35 to 44 Years | 10 (100.0%) | 0 (0.0%) |
| 45 to 54 Years | 28 (100.0%) | 0 (0.0%) |
| 55 to 59 Years | 8 (100.0%) | 0 (0.0%) |
| 60 to 64 Years | 0 (0.0%) | 0 (0.0%) |
| 65 to 74 Years | 0 (0.0%) | 0 (0.0%) |
| 75 Years and over | 36 (37.1%) | 0 (0.0%) |
| Total | 146 (62.4%) | 0 (0.0%) |
Employment Status by Educational Attainment in Redford
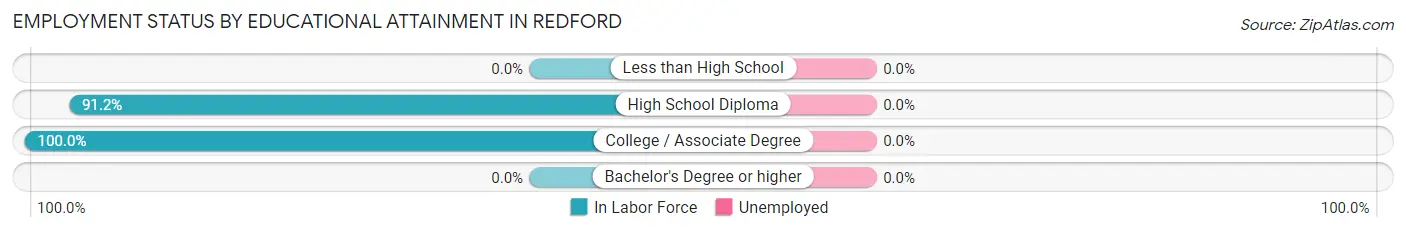
| Educational Attainment | In Labor Force | Unemployed |
| Less than High School | 0 (0.0%) | 0 (0.0%) |
| High School Diploma | 62 (91.2%) | 0 (0.0%) |
| College / Associate Degree | 48 (100.0%) | 0 (0.0%) |
| Bachelor's Degree or higher | 0 (0.0%) | 0 (0.0%) |
| Total | 110 (94.8%) | 0 (0.0%) |
Employment Occupations by Sex in Redford
Management, Business, Science and Arts Occupations
The most common Management, Business, Science and Arts occupations in Redford are Community & Social Service (36 | 24.7%), and Arts, Media & Entertainment (36 | 24.7%).
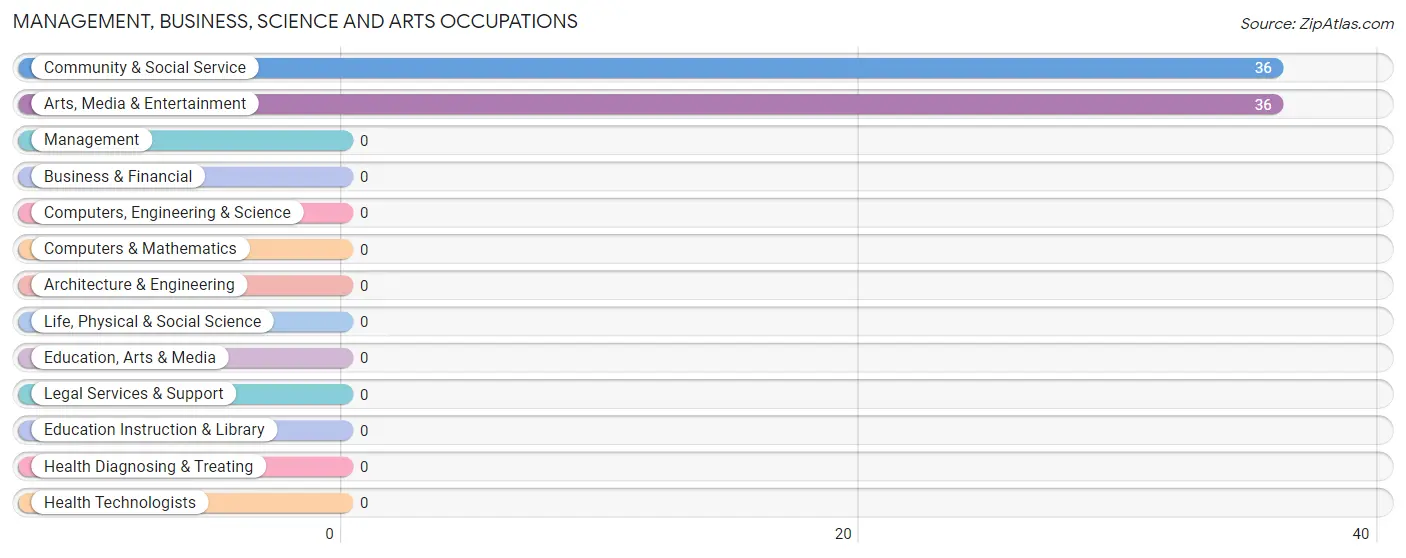
Management, Business, Science and Arts Occupations by Sex
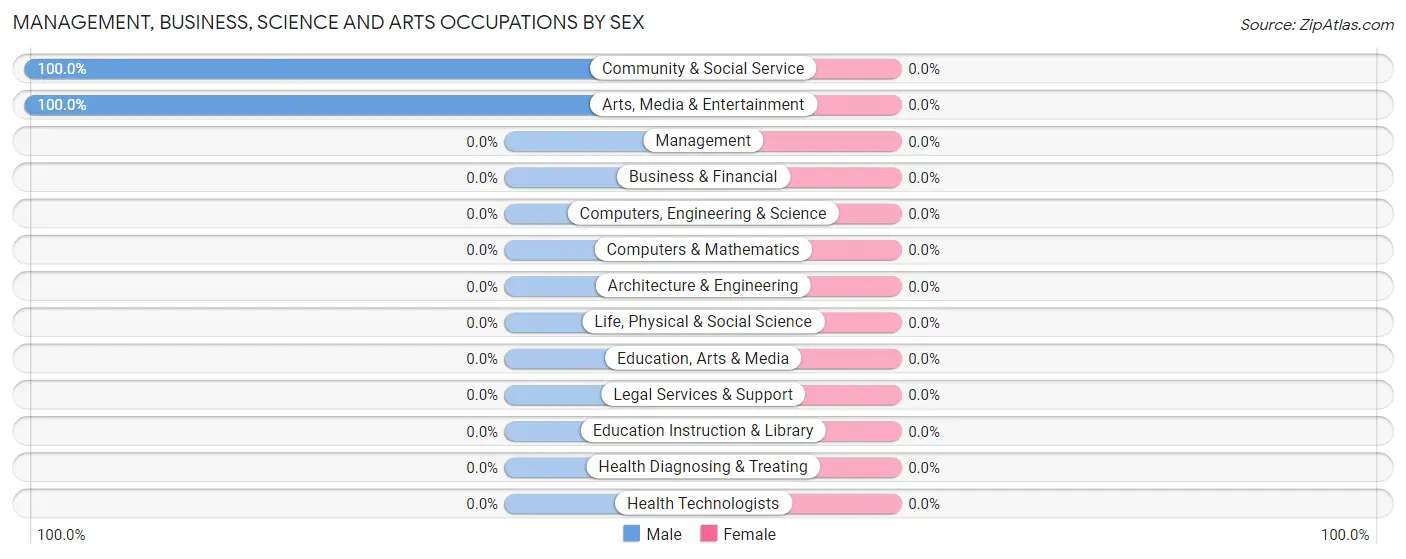
| Occupation | Male | Female |
| Management | 0 (0.0%) | 0 (0.0%) |
| Business & Financial | 0 (0.0%) | 0 (0.0%) |
| Computers, Engineering & Science | 0 (0.0%) | 0 (0.0%) |
| Computers & Mathematics | 0 (0.0%) | 0 (0.0%) |
| Architecture & Engineering | 0 (0.0%) | 0 (0.0%) |
| Life, Physical & Social Science | 0 (0.0%) | 0 (0.0%) |
| Community & Social Service | 36 (100.0%) | 0 (0.0%) |
| Education, Arts & Media | 0 (0.0%) | 0 (0.0%) |
| Legal Services & Support | 0 (0.0%) | 0 (0.0%) |
| Education Instruction & Library | 0 (0.0%) | 0 (0.0%) |
| Arts, Media & Entertainment | 36 (100.0%) | 0 (0.0%) |
| Health Diagnosing & Treating | 0 (0.0%) | 0 (0.0%) |
| Health Technologists | 0 (0.0%) | 0 (0.0%) |
| Total (Category) | 36 (100.0%) | 0 (0.0%) |
| Total (Overall) | 90 (61.6%) | 56 (38.4%) |
Services Occupations
The most common Services occupations in Redford are Security & Protection (16 | 11.0%), and Law Enforcement (16 | 11.0%).
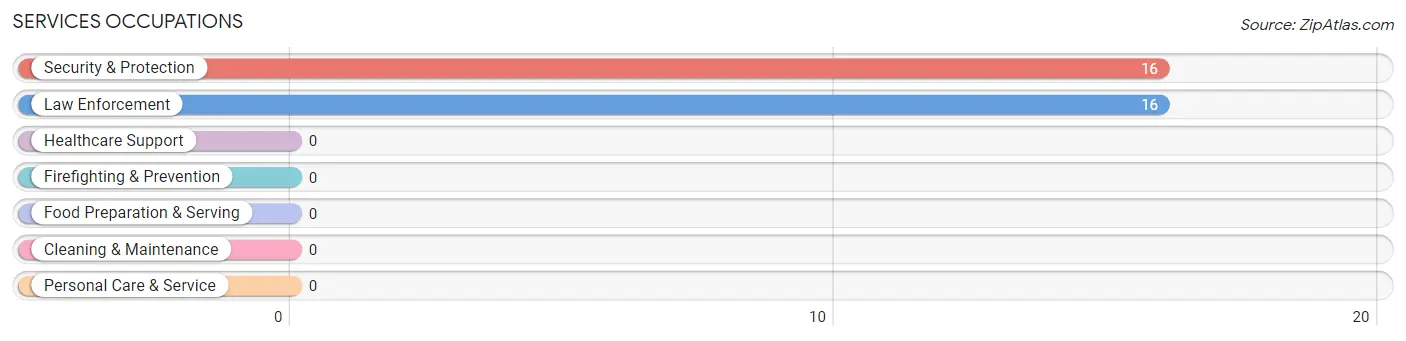
Services Occupations by Sex
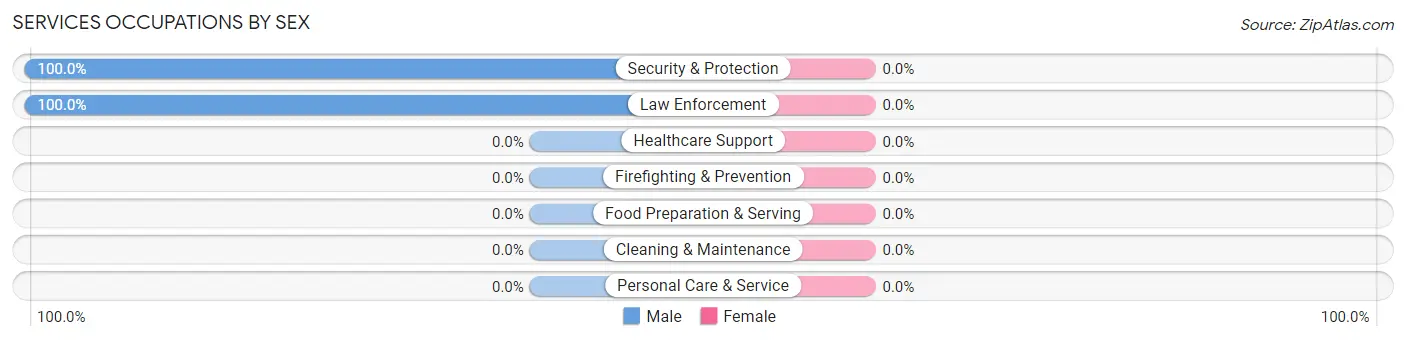
| Occupation | Male | Female |
| Healthcare Support | 0 (0.0%) | 0 (0.0%) |
| Security & Protection | 16 (100.0%) | 0 (0.0%) |
| Firefighting & Prevention | 0 (0.0%) | 0 (0.0%) |
| Law Enforcement | 16 (100.0%) | 0 (0.0%) |
| Food Preparation & Serving | 0 (0.0%) | 0 (0.0%) |
| Cleaning & Maintenance | 0 (0.0%) | 0 (0.0%) |
| Personal Care & Service | 0 (0.0%) | 0 (0.0%) |
| Total (Category) | 16 (100.0%) | 0 (0.0%) |
| Total (Overall) | 90 (61.6%) | 56 (38.4%) |
Sales and Office Occupations
The most common Sales and Office occupations in Redford are Sales & Related (37 | 25.3%), and Office & Administration (11 | 7.5%).
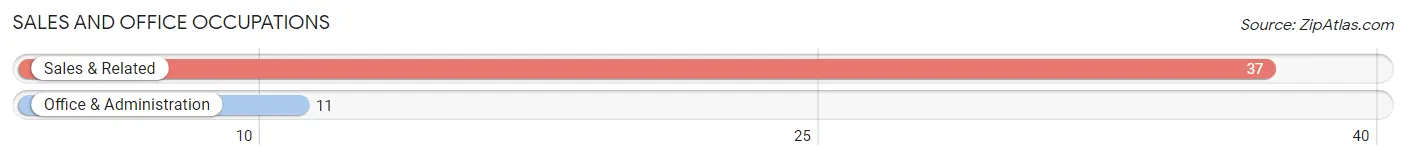
Sales and Office Occupations by Sex
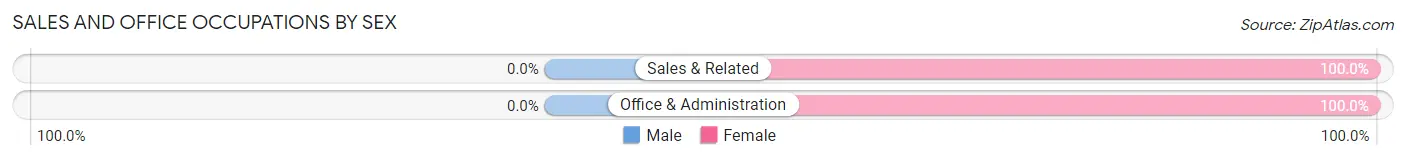
| Occupation | Male | Female |
| Sales & Related | 0 (0.0%) | 37 (100.0%) |
| Office & Administration | 0 (0.0%) | 11 (100.0%) |
| Total (Category) | 0 (0.0%) | 48 (100.0%) |
| Total (Overall) | 90 (61.6%) | 56 (38.4%) |
Natural Resources, Construction and Maintenance Occupations
The most common Natural Resources, Construction and Maintenance occupations in Redford are , and Construction & Extraction (28 | 19.2%).
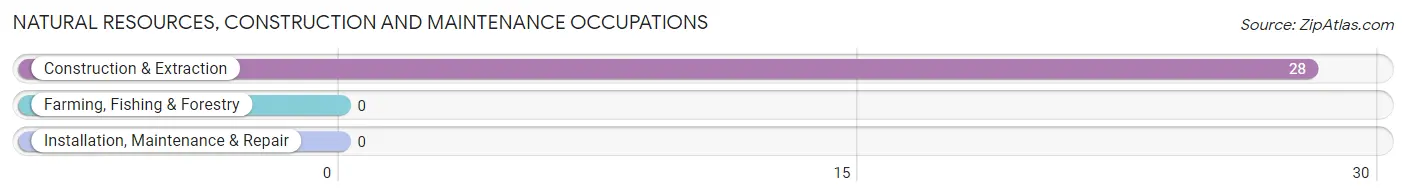
Natural Resources, Construction and Maintenance Occupations by Sex
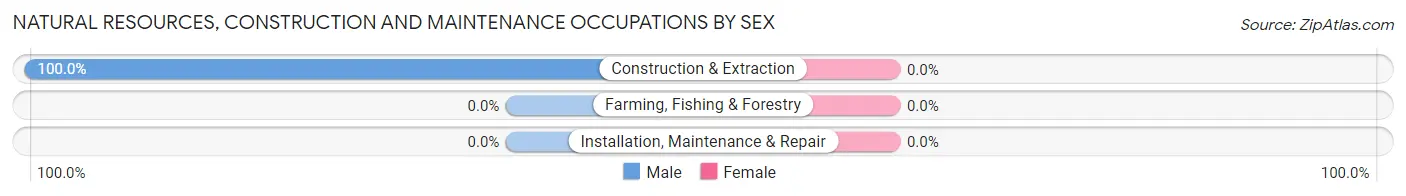
| Occupation | Male | Female |
| Farming, Fishing & Forestry | 0 (0.0%) | 0 (0.0%) |
| Construction & Extraction | 28 (100.0%) | 0 (0.0%) |
| Installation, Maintenance & Repair | 0 (0.0%) | 0 (0.0%) |
| Total (Category) | 28 (100.0%) | 0 (0.0%) |
| Total (Overall) | 90 (61.6%) | 56 (38.4%) |
Production, Transportation and Moving Occupations
The most common Production, Transportation and Moving occupations in Redford are , and Transportation (18 | 12.3%).
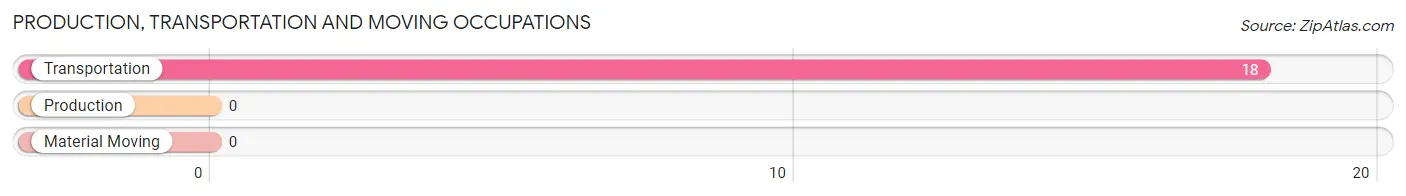
Production, Transportation and Moving Occupations by Sex
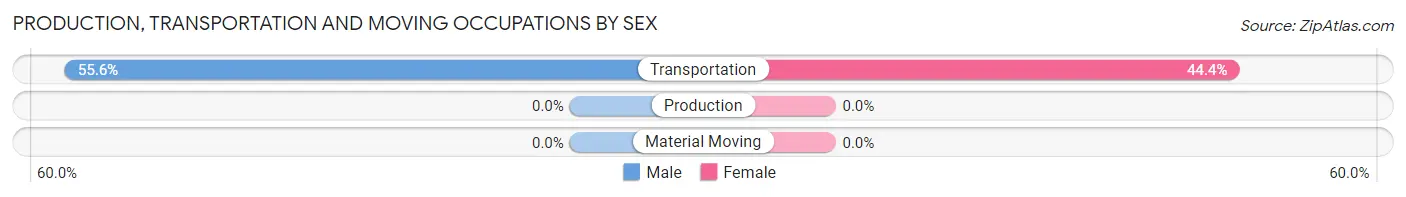
| Occupation | Male | Female |
| Production | 0 (0.0%) | 0 (0.0%) |
| Transportation | 10 (55.6%) | 8 (44.4%) |
| Material Moving | 0 (0.0%) | 0 (0.0%) |
| Total (Category) | 10 (55.6%) | 8 (44.4%) |
| Total (Overall) | 90 (61.6%) | 56 (38.4%) |
Employment Industries by Sex in Redford
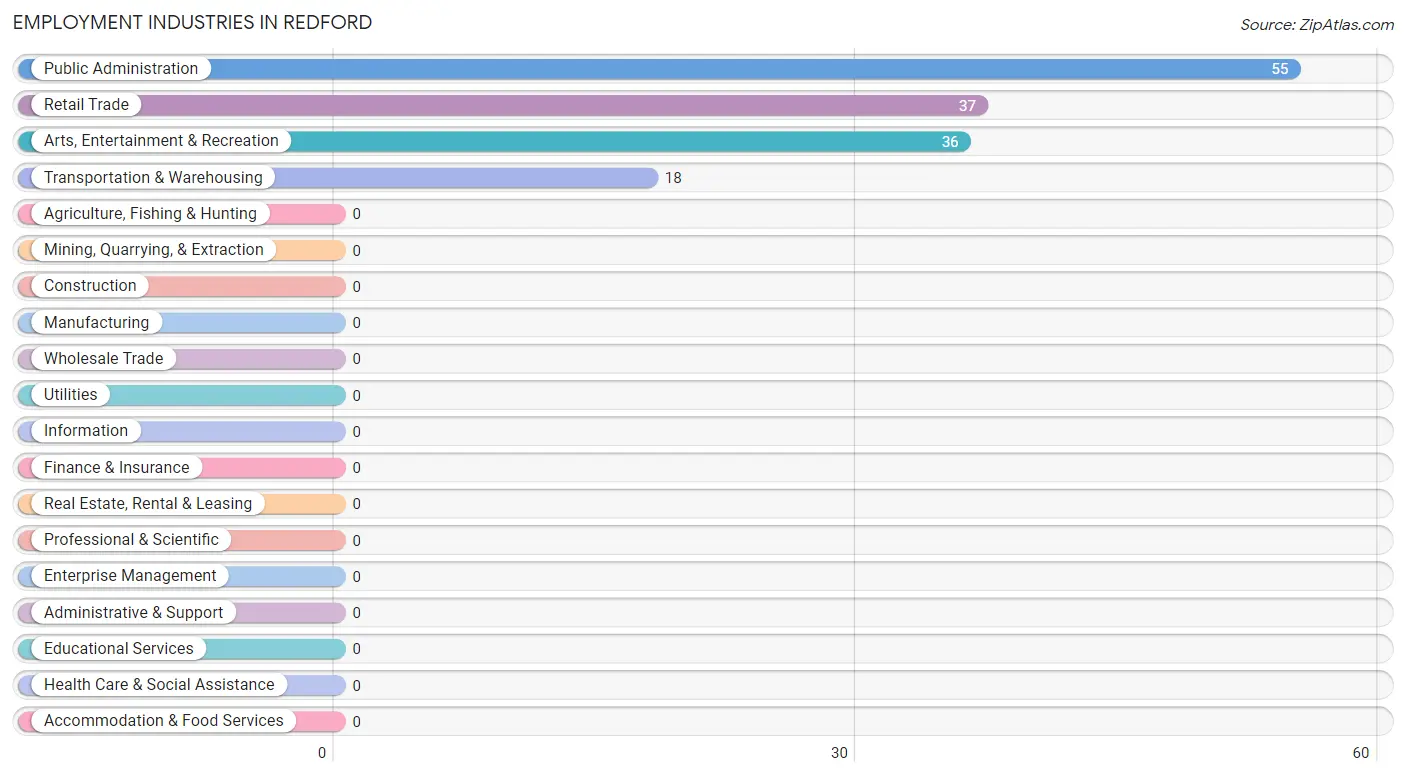
Employment Industries in Redford
The major employment industries in Redford include Public Administration (55 | 37.7%), Retail Trade (37 | 25.3%), Arts, Entertainment & Recreation (36 | 24.7%), and Transportation & Warehousing (18 | 12.3%).
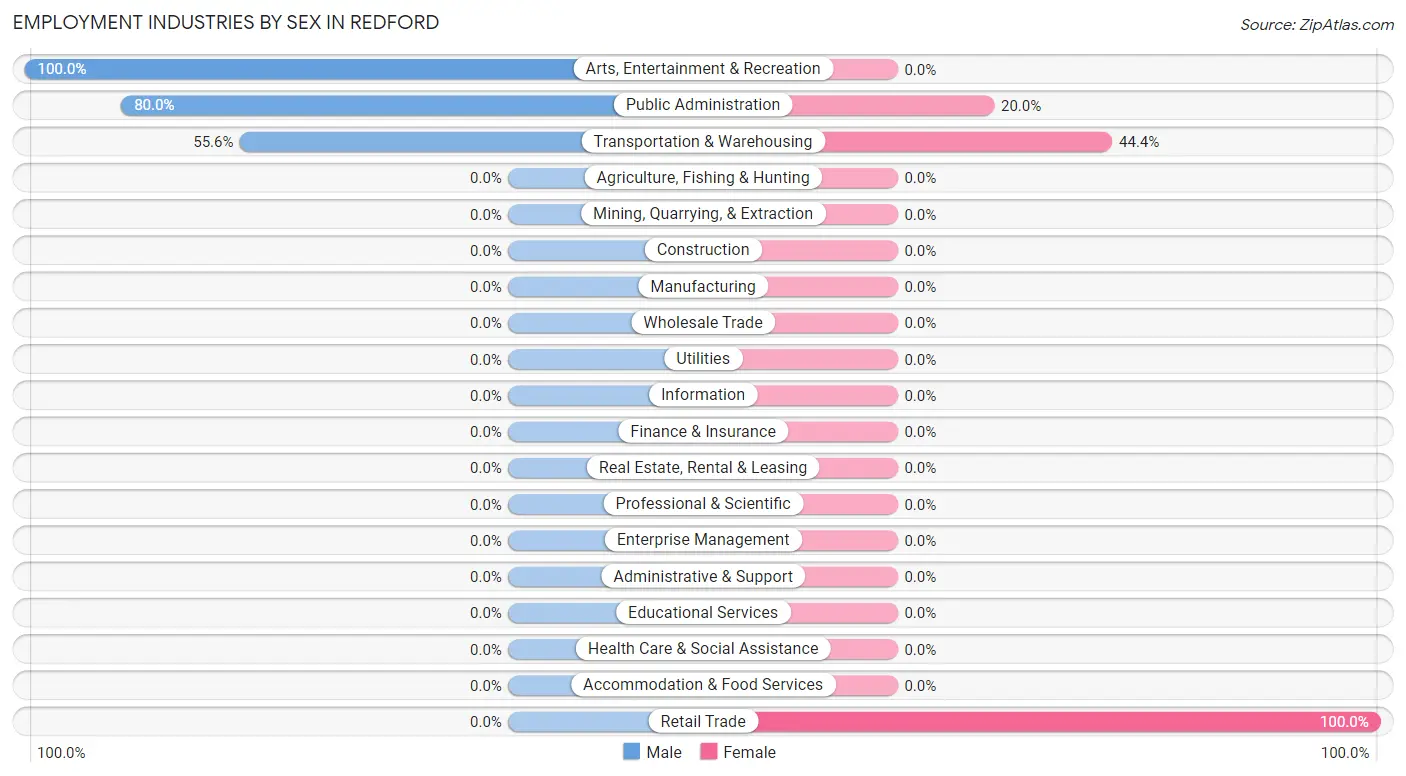
Employment Industries by Sex in Redford
The Redford industries that see more men than women are Arts, Entertainment & Recreation (100.0%), Public Administration (80.0%), and Transportation & Warehousing (55.6%), whereas the industries that tend to have a higher number of women are Retail Trade (100.0%), Transportation & Warehousing (44.4%), and Public Administration (20.0%).
| Industry | Male | Female |
| Agriculture, Fishing & Hunting | 0 (0.0%) | 0 (0.0%) |
| Mining, Quarrying, & Extraction | 0 (0.0%) | 0 (0.0%) |
| Construction | 0 (0.0%) | 0 (0.0%) |
| Manufacturing | 0 (0.0%) | 0 (0.0%) |
| Wholesale Trade | 0 (0.0%) | 0 (0.0%) |
| Retail Trade | 0 (0.0%) | 37 (100.0%) |
| Transportation & Warehousing | 10 (55.6%) | 8 (44.4%) |
| Utilities | 0 (0.0%) | 0 (0.0%) |
| Information | 0 (0.0%) | 0 (0.0%) |
| Finance & Insurance | 0 (0.0%) | 0 (0.0%) |
| Real Estate, Rental & Leasing | 0 (0.0%) | 0 (0.0%) |
| Professional & Scientific | 0 (0.0%) | 0 (0.0%) |
| Enterprise Management | 0 (0.0%) | 0 (0.0%) |
| Administrative & Support | 0 (0.0%) | 0 (0.0%) |
| Educational Services | 0 (0.0%) | 0 (0.0%) |
| Health Care & Social Assistance | 0 (0.0%) | 0 (0.0%) |
| Arts, Entertainment & Recreation | 36 (100.0%) | 0 (0.0%) |
| Accommodation & Food Services | 0 (0.0%) | 0 (0.0%) |
| Public Administration | 44 (80.0%) | 11 (20.0%) |
| Total | 90 (61.6%) | 56 (38.4%) |
Education in Redford
School Enrollment in Redford
The most common levels of schooling among the 25 students in Redford are elementary school (14 | 56.0%), and college / undergraduate (11 | 44.0%).

| School Level | # Students | % Students |
| Nursery / Preschool | 0 | 0.0% |
| Kindergarten | 0 | 0.0% |
| Elementary School | 14 | 56.0% |
| Middle School | 0 | 0.0% |
| High School | 0 | 0.0% |
| College / Undergraduate | 11 | 44.0% |
| Graduate / Professional | 0 | 0.0% |
| Total | 25 | 100.0% |
School Enrollment by Age by Funding Source in Redford
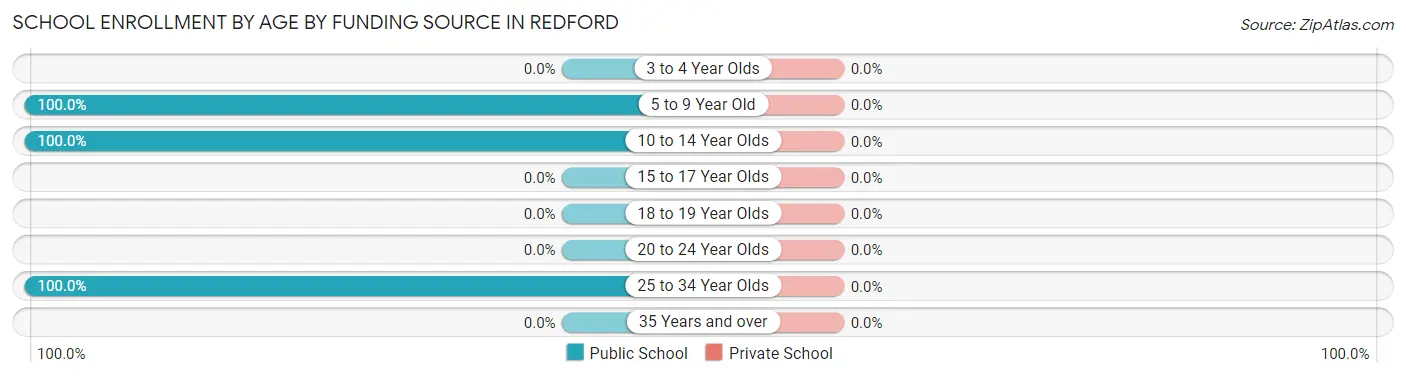
| Age Bracket | Public School | Private School |
| 3 to 4 Year Olds | 0 (0.0%) | 0 (0.0%) |
| 5 to 9 Year Old | 9 (100.0%) | 0 (0.0%) |
| 10 to 14 Year Olds | 5 (100.0%) | 0 (0.0%) |
| 15 to 17 Year Olds | 0 (0.0%) | 0 (0.0%) |
| 18 to 19 Year Olds | 0 (0.0%) | 0 (0.0%) |
| 20 to 24 Year Olds | 0 (0.0%) | 0 (0.0%) |
| 25 to 34 Year Olds | 11 (100.0%) | 0 (0.0%) |
| 35 Years and over | 0 (0.0%) | 0 (0.0%) |
| Total | 25 (100.0%) | 0 (0.0%) |
Educational Attainment by Field of Study in Redford
| Field of Study | # Graduates | % Graduates |
| Computers & Mathematics | 0 | 0.0% |
| Bio, Nature & Agricultural | 0 | 0.0% |
| Physical & Health Sciences | 0 | 0.0% |
| Psychology | 0 | 0.0% |
| Social Sciences | 0 | 0.0% |
| Engineering | 0 | 0.0% |
| Multidisciplinary Studies | 0 | 0.0% |
| Science & Technology | 0 | 0.0% |
| Business | 0 | 0.0% |
| Education | 0 | 0.0% |
| Literature & Languages | 0 | 0.0% |
| Liberal Arts & History | 0 | 0.0% |
| Visual & Performing Arts | 0 | 0.0% |
| Communications | 0 | 0.0% |
| Arts & Humanities | 0 | 0.0% |
| Total | 0 | 0.0% |
Transportation & Commute in Redford
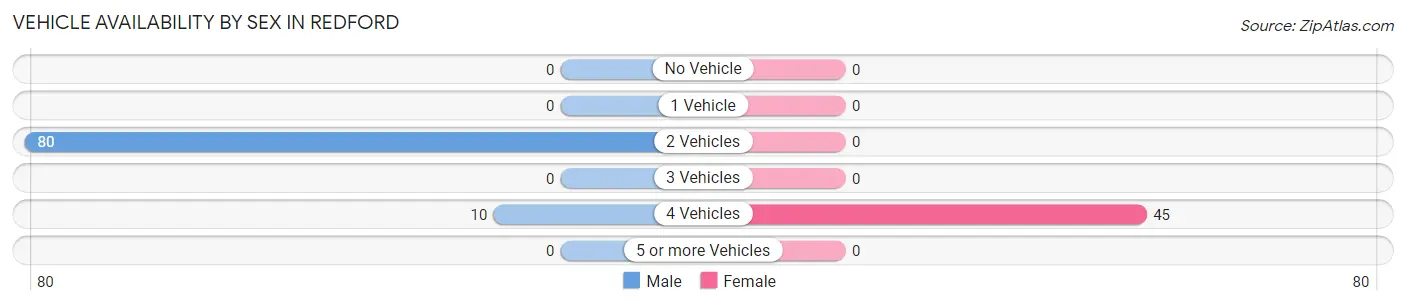
Vehicle Availability by Sex in Redford
The most prevalent vehicle ownership categories in Redford are males with 2 vehicles (80, accounting for 88.9%) and females with 2 vehicles (0, making up 177.8%).
| Vehicles Available | Male | Female |
| No Vehicle | 0 (0.0%) | 0 (0.0%) |
| 1 Vehicle | 0 (0.0%) | 0 (0.0%) |
| 2 Vehicles | 80 (88.9%) | 0 (0.0%) |
| 3 Vehicles | 0 (0.0%) | 0 (0.0%) |
| 4 Vehicles | 10 (11.1%) | 45 (100.0%) |
| 5 or more Vehicles | 0 (0.0%) | 0 (0.0%) |
| Total | 90 (100.0%) | 45 (100.0%) |
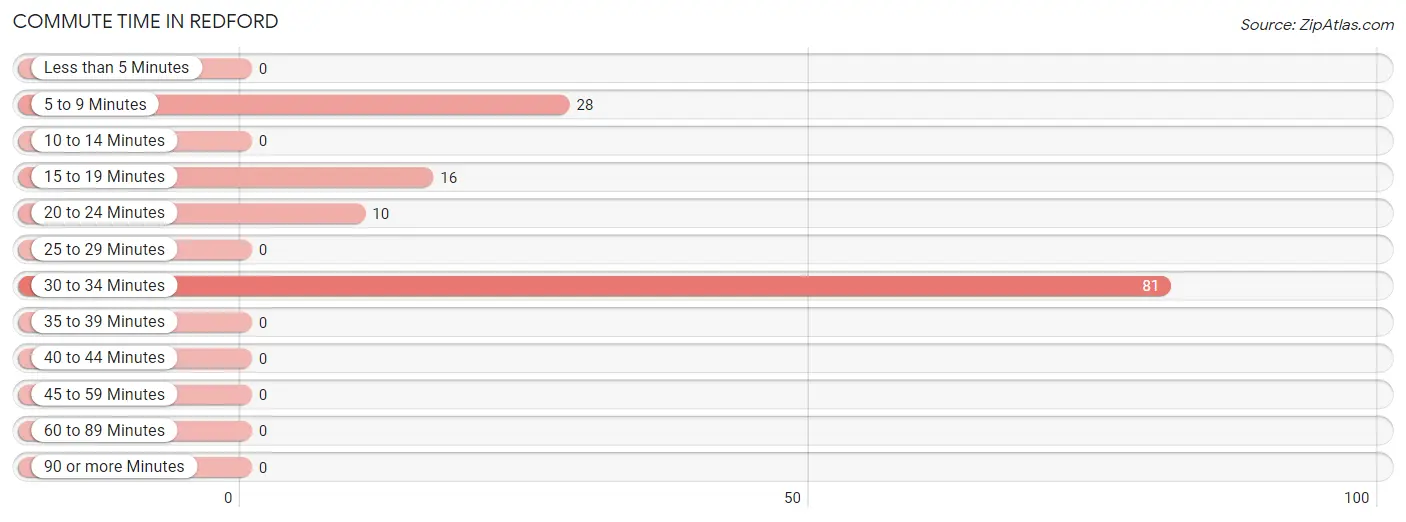
Commute Time in Redford
The most frequently occuring commute durations in Redford are 30 to 34 minutes (81 commuters, 60.0%), 5 to 9 minutes (28 commuters, 20.7%), and 15 to 19 minutes (16 commuters, 11.8%).
| Commute Time | # Commuters | % Commuters |
| Less than 5 Minutes | 0 | 0.0% |
| 5 to 9 Minutes | 28 | 20.7% |
| 10 to 14 Minutes | 0 | 0.0% |
| 15 to 19 Minutes | 16 | 11.8% |
| 20 to 24 Minutes | 10 | 7.4% |
| 25 to 29 Minutes | 0 | 0.0% |
| 30 to 34 Minutes | 81 | 60.0% |
| 35 to 39 Minutes | 0 | 0.0% |
| 40 to 44 Minutes | 0 | 0.0% |
| 45 to 59 Minutes | 0 | 0.0% |
| 60 to 89 Minutes | 0 | 0.0% |
| 90 or more Minutes | 0 | 0.0% |
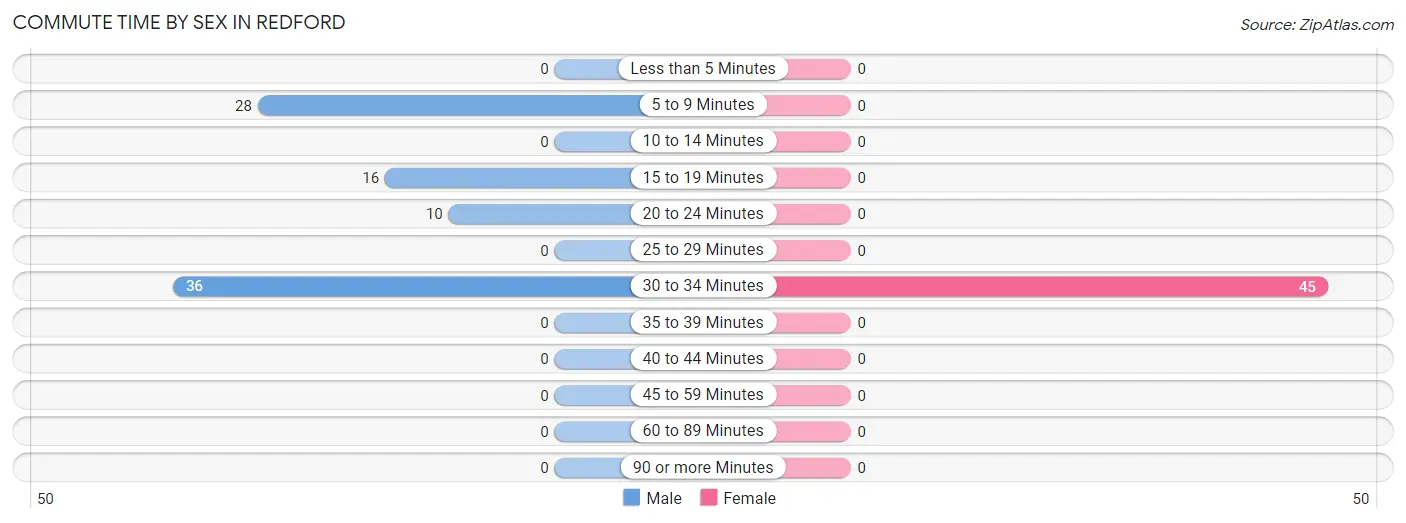
Commute Time by Sex in Redford
The most common commute times in Redford are 30 to 34 minutes (36 commuters, 40.0%) for males and 30 to 34 minutes (45 commuters, 100.0%) for females.
| Commute Time | Male | Female |
| Less than 5 Minutes | 0 (0.0%) | 0 (0.0%) |
| 5 to 9 Minutes | 28 (31.1%) | 0 (0.0%) |
| 10 to 14 Minutes | 0 (0.0%) | 0 (0.0%) |
| 15 to 19 Minutes | 16 (17.8%) | 0 (0.0%) |
| 20 to 24 Minutes | 10 (11.1%) | 0 (0.0%) |
| 25 to 29 Minutes | 0 (0.0%) | 0 (0.0%) |
| 30 to 34 Minutes | 36 (40.0%) | 45 (100.0%) |
| 35 to 39 Minutes | 0 (0.0%) | 0 (0.0%) |
| 40 to 44 Minutes | 0 (0.0%) | 0 (0.0%) |
| 45 to 59 Minutes | 0 (0.0%) | 0 (0.0%) |
| 60 to 89 Minutes | 0 (0.0%) | 0 (0.0%) |
| 90 or more Minutes | 0 (0.0%) | 0 (0.0%) |
Time of Departure to Work by Sex in Redford
The most frequent times of departure to work in Redford are 5:00 AM to 5:29 AM (44, 48.9%) for males and 7:00 AM to 7:29 AM (37, 82.2%) for females.
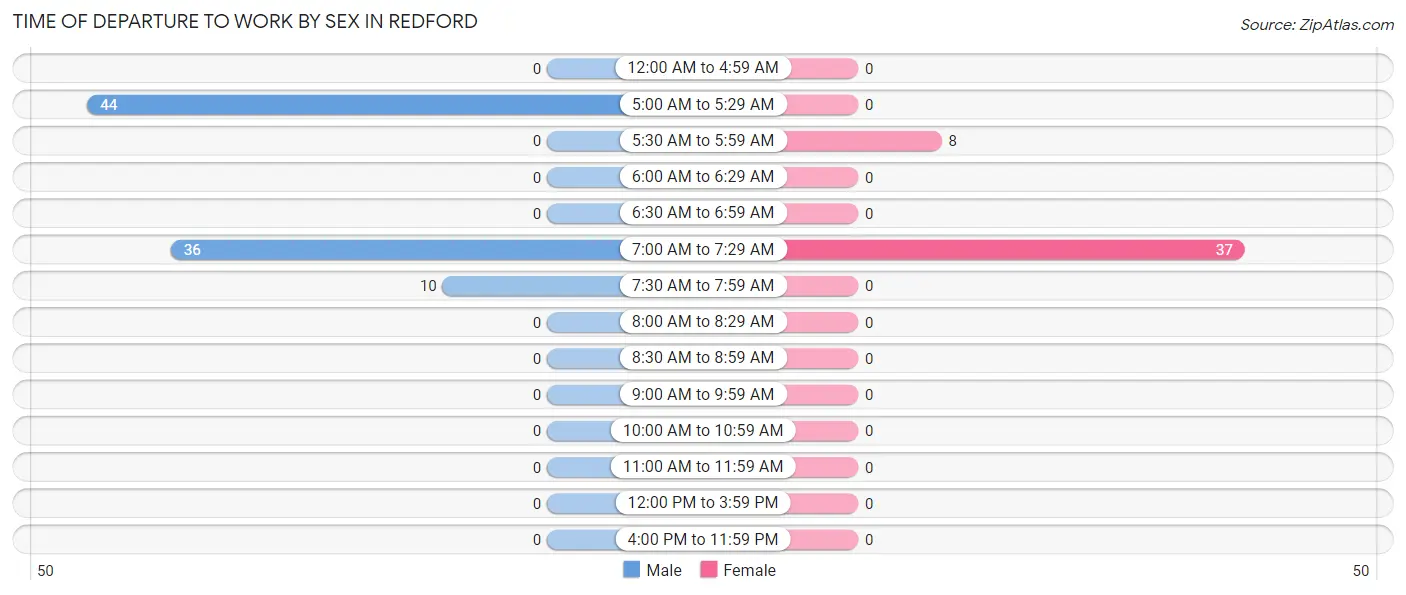
| Time of Departure | Male | Female |
| 12:00 AM to 4:59 AM | 0 (0.0%) | 0 (0.0%) |
| 5:00 AM to 5:29 AM | 44 (48.9%) | 0 (0.0%) |
| 5:30 AM to 5:59 AM | 0 (0.0%) | 8 (17.8%) |
| 6:00 AM to 6:29 AM | 0 (0.0%) | 0 (0.0%) |
| 6:30 AM to 6:59 AM | 0 (0.0%) | 0 (0.0%) |
| 7:00 AM to 7:29 AM | 36 (40.0%) | 37 (82.2%) |
| 7:30 AM to 7:59 AM | 10 (11.1%) | 0 (0.0%) |
| 8:00 AM to 8:29 AM | 0 (0.0%) | 0 (0.0%) |
| 8:30 AM to 8:59 AM | 0 (0.0%) | 0 (0.0%) |
| 9:00 AM to 9:59 AM | 0 (0.0%) | 0 (0.0%) |
| 10:00 AM to 10:59 AM | 0 (0.0%) | 0 (0.0%) |
| 11:00 AM to 11:59 AM | 0 (0.0%) | 0 (0.0%) |
| 12:00 PM to 3:59 PM | 0 (0.0%) | 0 (0.0%) |
| 4:00 PM to 11:59 PM | 0 (0.0%) | 0 (0.0%) |
| Total | 90 (100.0%) | 45 (100.0%) |
Housing Occupancy in Redford
Occupancy by Ownership in Redford
Of the total 81 dwellings in Redford, owner-occupied units account for 81 (100.0%), while renter-occupied units make up 0 (0.0%).
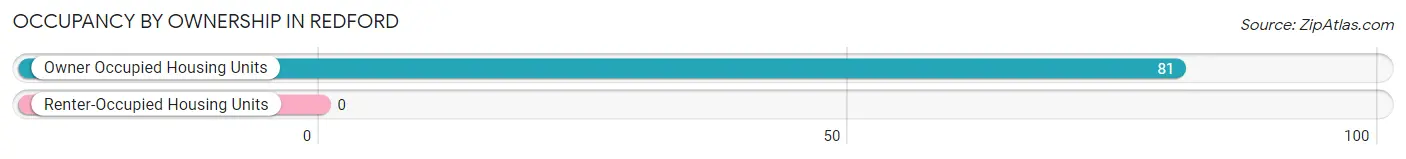
| Occupancy | # Housing Units | % Housing Units |
| Owner Occupied Housing Units | 81 | 100.0% |
| Renter-Occupied Housing Units | 0 | 0.0% |
| Total Occupied Housing Units | 81 | 100.0% |
Occupancy by Household Size in Redford
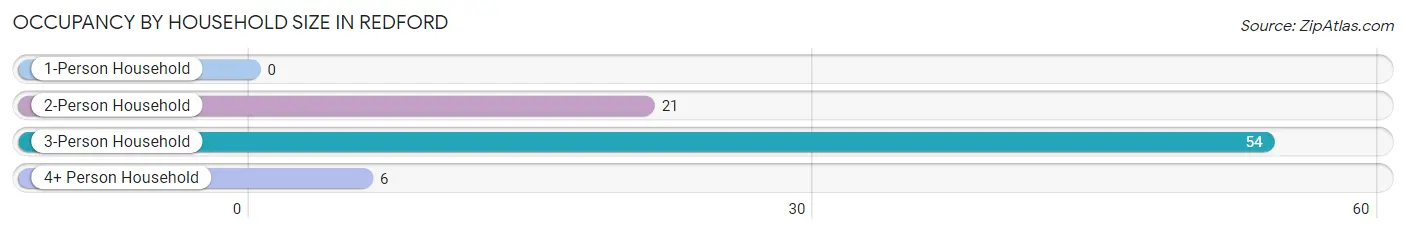
| Household Size | # Housing Units | % Housing Units |
| 1-Person Household | 0 | 0.0% |
| 2-Person Household | 21 | 25.9% |
| 3-Person Household | 54 | 66.7% |
| 4+ Person Household | 6 | 7.4% |
| Total Housing Units | 81 | 100.0% |
Occupancy by Ownership by Household Size in Redford
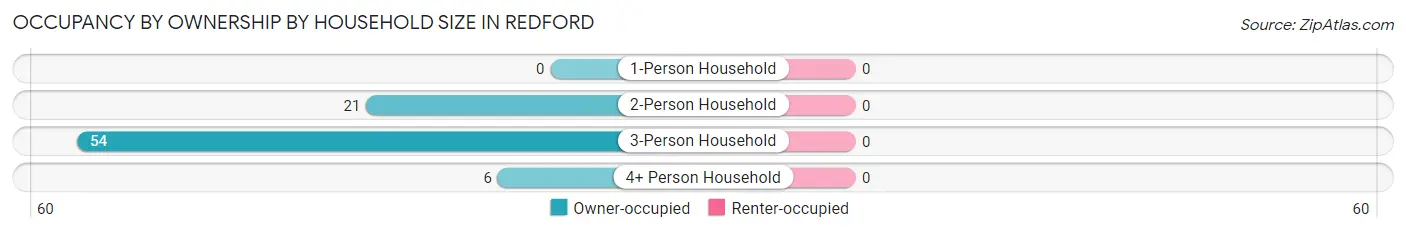
| Household Size | Owner-occupied | Renter-occupied |
| 1-Person Household | 0 (0.0%) | 0 (0.0%) |
| 2-Person Household | 21 (100.0%) | 0 (0.0%) |
| 3-Person Household | 54 (100.0%) | 0 (0.0%) |
| 4+ Person Household | 6 (100.0%) | 0 (0.0%) |
| Total Housing Units | 81 (100.0%) | 0 (0.0%) |
Occupancy by Educational Attainment in Redford
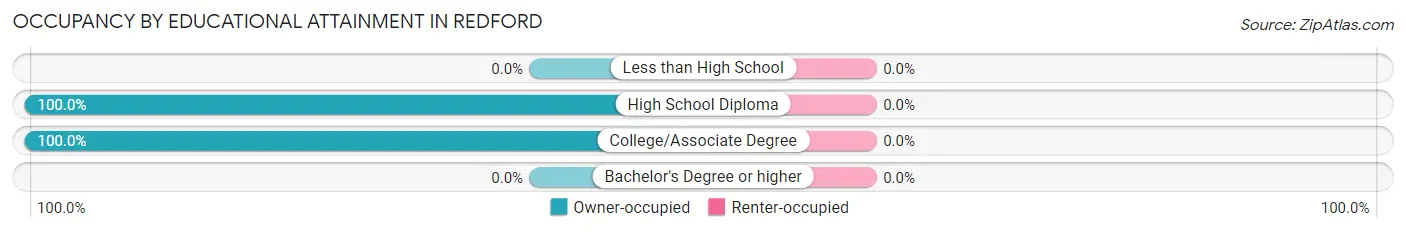
| Household Size | Owner-occupied | Renter-occupied |
| Less than High School | 0 (0.0%) | 0 (0.0%) |
| High School Diploma | 49 (100.0%) | 0 (0.0%) |
| College/Associate Degree | 32 (100.0%) | 0 (0.0%) |
| Bachelor's Degree or higher | 0 (0.0%) | 0 (0.0%) |
Occupancy by Age of Householder in Redford
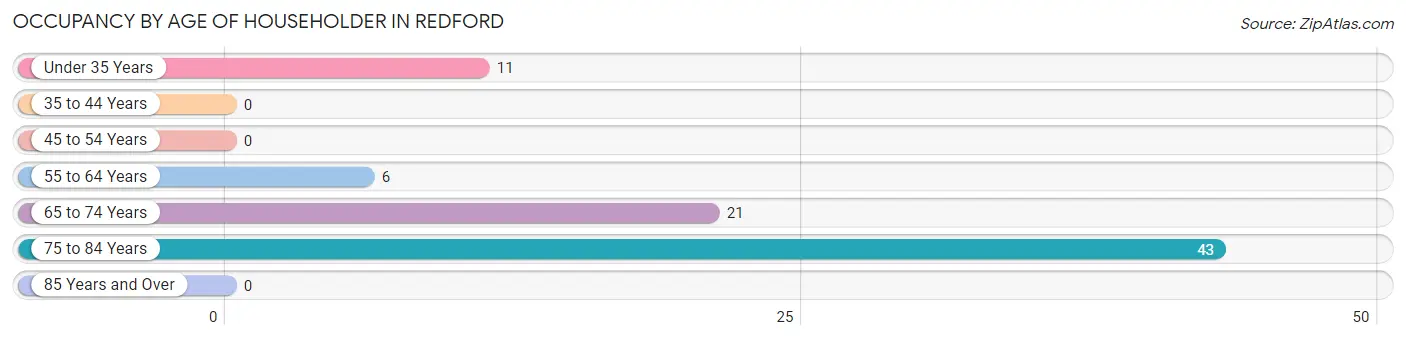
| Age Bracket | # Households | % Households |
| Under 35 Years | 11 | 13.6% |
| 35 to 44 Years | 0 | 0.0% |
| 45 to 54 Years | 0 | 0.0% |
| 55 to 64 Years | 6 | 7.4% |
| 65 to 74 Years | 21 | 25.9% |
| 75 to 84 Years | 43 | 53.1% |
| 85 Years and Over | 0 | 0.0% |
| Total | 81 | 100.0% |
Housing Finances in Redford
Median Income by Occupancy in Redford
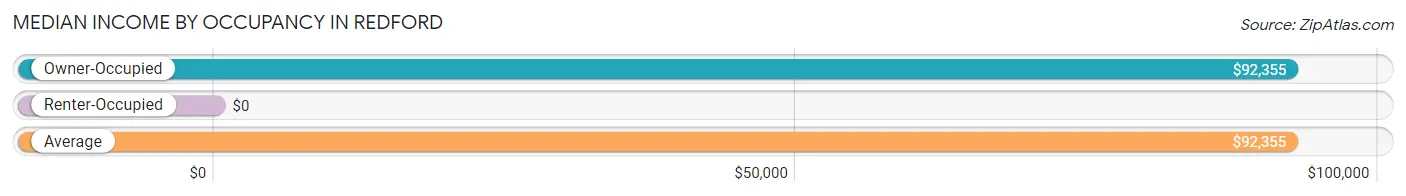
| Occupancy Type | # Households | Median Income |
| Owner-Occupied | 81 (100.0%) | $92,355 |
| Renter-Occupied | 0 (0.0%) | $0 |
| Average | 81 (100.0%) | $92,355 |
Occupancy by Householder Income Bracket in Redford
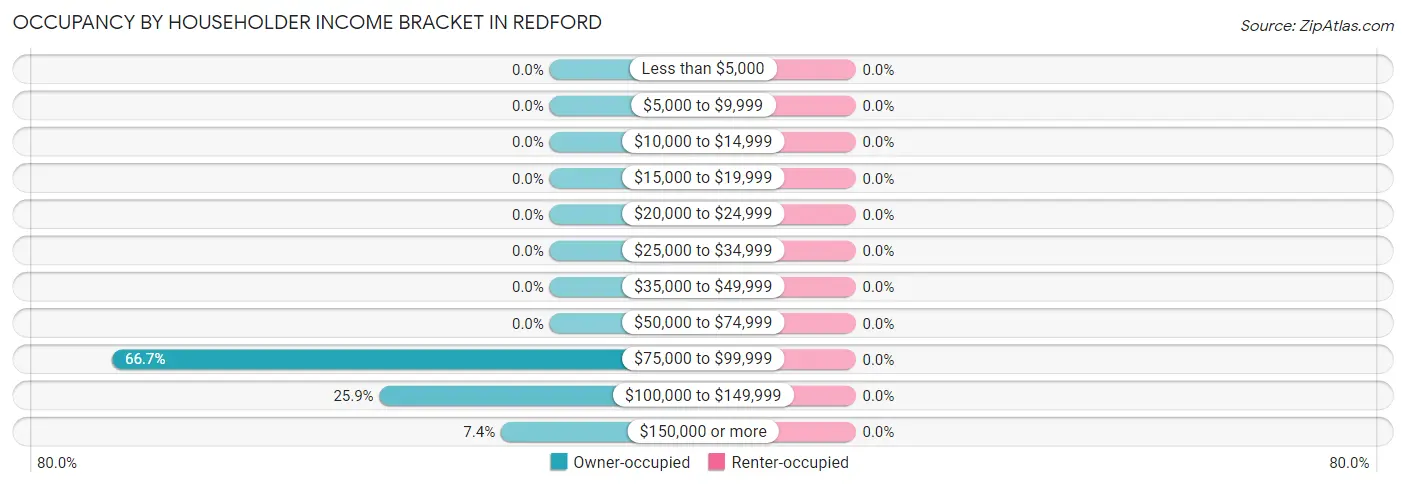
| Income Bracket | Owner-occupied | Renter-occupied |
| Less than $5,000 | 0 (0.0%) | 0 (0.0%) |
| $5,000 to $9,999 | 0 (0.0%) | 0 (0.0%) |
| $10,000 to $14,999 | 0 (0.0%) | 0 (0.0%) |
| $15,000 to $19,999 | 0 (0.0%) | 0 (0.0%) |
| $20,000 to $24,999 | 0 (0.0%) | 0 (0.0%) |
| $25,000 to $34,999 | 0 (0.0%) | 0 (0.0%) |
| $35,000 to $49,999 | 0 (0.0%) | 0 (0.0%) |
| $50,000 to $74,999 | 0 (0.0%) | 0 (0.0%) |
| $75,000 to $99,999 | 54 (66.7%) | 0 (0.0%) |
| $100,000 to $149,999 | 21 (25.9%) | 0 (0.0%) |
| $150,000 or more | 6 (7.4%) | 0 (0.0%) |
| Total | 81 (100.0%) | 0 (0.0%) |
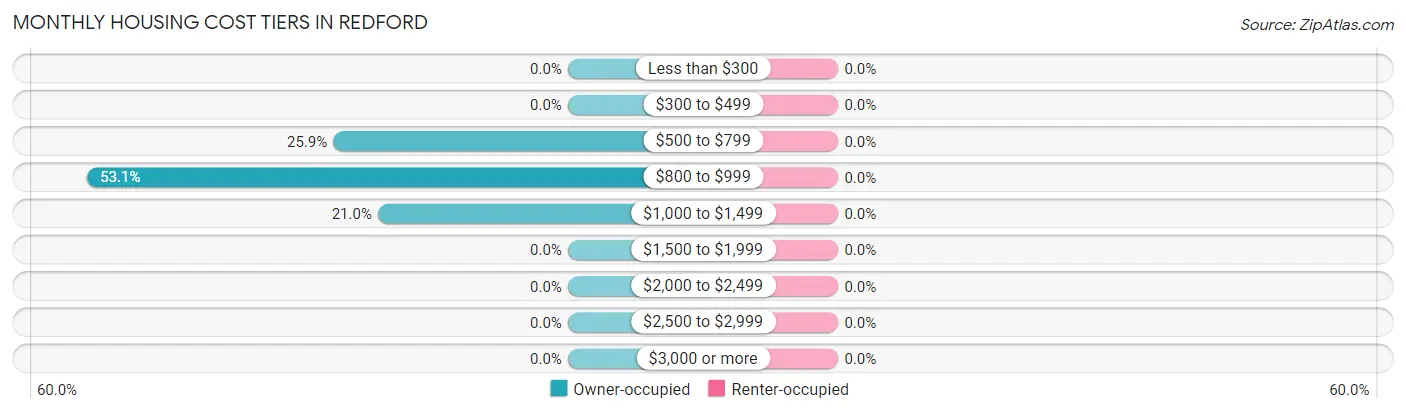
Monthly Housing Cost Tiers in Redford
| Monthly Cost | Owner-occupied | Renter-occupied |
| Less than $300 | 0 (0.0%) | 0 (0.0%) |
| $300 to $499 | 0 (0.0%) | 0 (0.0%) |
| $500 to $799 | 21 (25.9%) | 0 (0.0%) |
| $800 to $999 | 43 (53.1%) | 0 (0.0%) |
| $1,000 to $1,499 | 17 (21.0%) | 0 (0.0%) |
| $1,500 to $1,999 | 0 (0.0%) | 0 (0.0%) |
| $2,000 to $2,499 | 0 (0.0%) | 0 (0.0%) |
| $2,500 to $2,999 | 0 (0.0%) | 0 (0.0%) |
| $3,000 or more | 0 (0.0%) | 0 (0.0%) |
| Total | 81 (100.0%) | 0 (0.0%) |
Physical Housing Characteristics in Redford
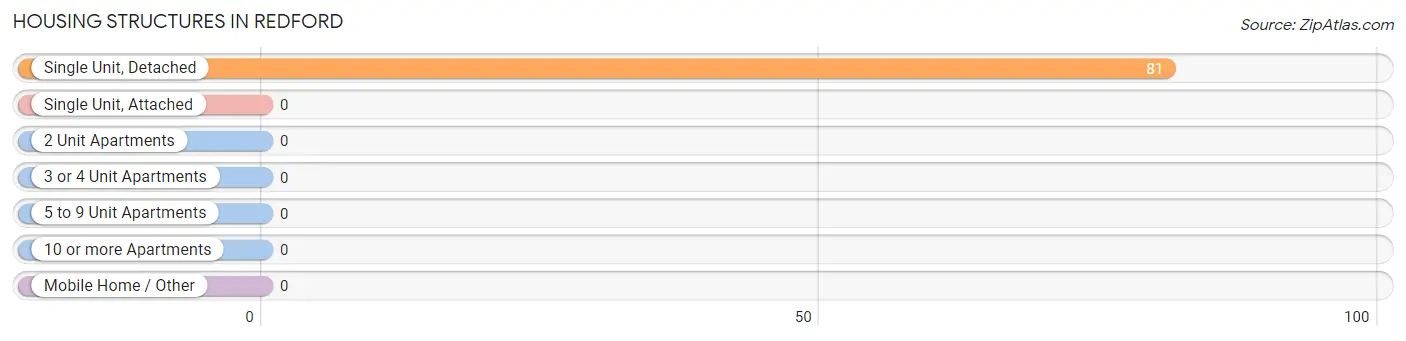
Housing Structures in Redford
| Structure Type | # Housing Units | % Housing Units |
| Single Unit, Detached | 81 | 100.0% |
| Single Unit, Attached | 0 | 0.0% |
| 2 Unit Apartments | 0 | 0.0% |
| 3 or 4 Unit Apartments | 0 | 0.0% |
| 5 to 9 Unit Apartments | 0 | 0.0% |
| 10 or more Apartments | 0 | 0.0% |
| Mobile Home / Other | 0 | 0.0% |
| Total | 81 | 100.0% |
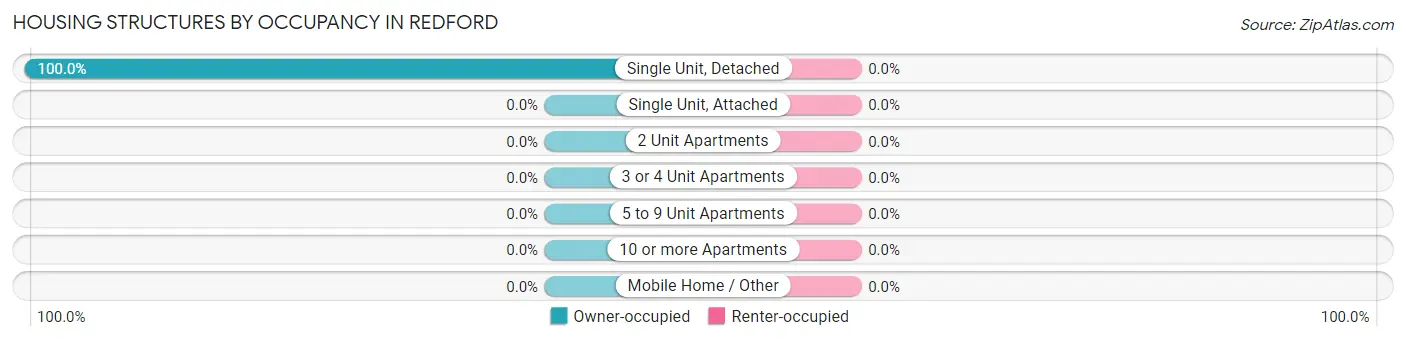
Housing Structures by Occupancy in Redford
| Structure Type | Owner-occupied | Renter-occupied |
| Single Unit, Detached | 81 (100.0%) | 0 (0.0%) |
| Single Unit, Attached | 0 (0.0%) | 0 (0.0%) |
| 2 Unit Apartments | 0 (0.0%) | 0 (0.0%) |
| 3 or 4 Unit Apartments | 0 (0.0%) | 0 (0.0%) |
| 5 to 9 Unit Apartments | 0 (0.0%) | 0 (0.0%) |
| 10 or more Apartments | 0 (0.0%) | 0 (0.0%) |
| Mobile Home / Other | 0 (0.0%) | 0 (0.0%) |
| Total | 81 (100.0%) | 0 (0.0%) |
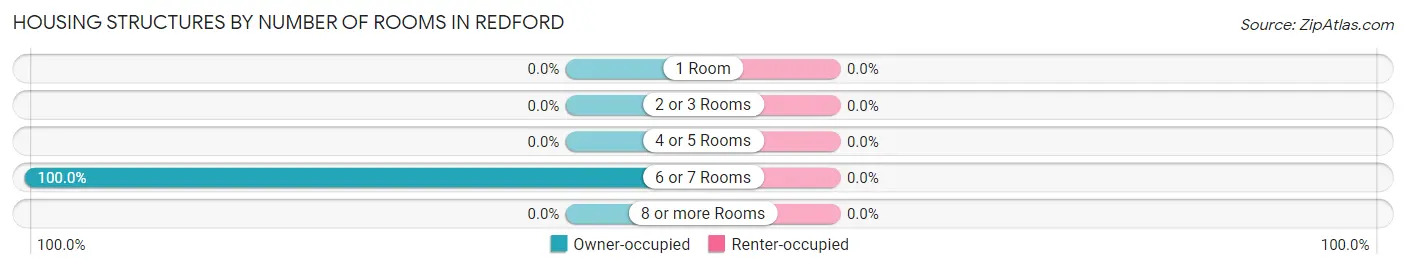
Housing Structures by Number of Rooms in Redford
| Number of Rooms | Owner-occupied | Renter-occupied |
| 1 Room | 0 (0.0%) | 0 (0.0%) |
| 2 or 3 Rooms | 0 (0.0%) | 0 (0.0%) |
| 4 or 5 Rooms | 0 (0.0%) | 0 (0.0%) |
| 6 or 7 Rooms | 81 (100.0%) | 0 (0.0%) |
| 8 or more Rooms | 0 (0.0%) | 0 (0.0%) |
| Total | 81 (100.0%) | 0 (0.0%) |
Housing Structure by Heating Type in Redford
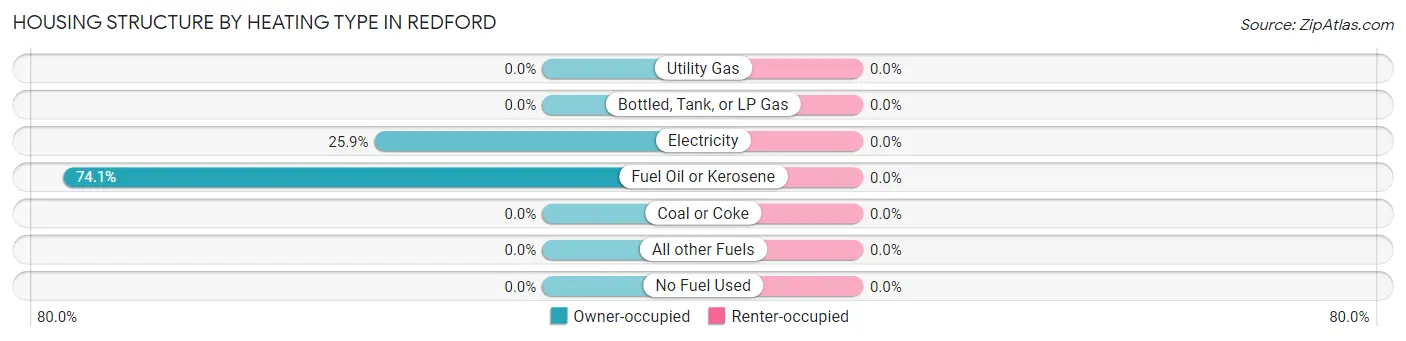
| Heating Type | Owner-occupied | Renter-occupied |
| Utility Gas | 0 (0.0%) | 0 (0.0%) |
| Bottled, Tank, or LP Gas | 0 (0.0%) | 0 (0.0%) |
| Electricity | 21 (25.9%) | 0 (0.0%) |
| Fuel Oil or Kerosene | 60 (74.1%) | 0 (0.0%) |
| Coal or Coke | 0 (0.0%) | 0 (0.0%) |
| All other Fuels | 0 (0.0%) | 0 (0.0%) |
| No Fuel Used | 0 (0.0%) | 0 (0.0%) |
| Total | 81 (100.0%) | 0 (0.0%) |
Household Vehicle Usage in Redford
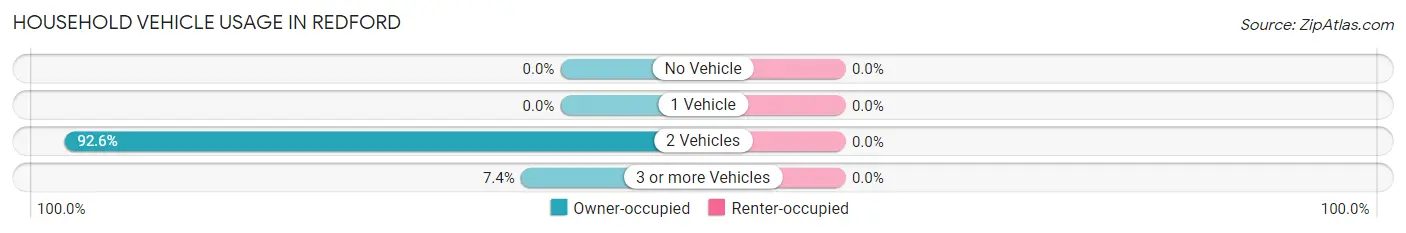
| Vehicles per Household | Owner-occupied | Renter-occupied |
| No Vehicle | 0 (0.0%) | 0 (0.0%) |
| 1 Vehicle | 0 (0.0%) | 0 (0.0%) |
| 2 Vehicles | 75 (92.6%) | 0 (0.0%) |
| 3 or more Vehicles | 6 (7.4%) | 0 (0.0%) |
| Total | 81 (100.0%) | 0 (0.0%) |
Real Estate & Mortgages in Redford
Real Estate and Mortgage Overview in Redford
| Characteristic | Without Mortgage | With Mortgage |
| Housing Units | 21 | 60 |
| Median Property Value | - | - |
| Median Household Income | - | - |
| Monthly Housing Costs | - | - |
| Real Estate Taxes | - | - |
Property Value by Mortgage Status in Redford
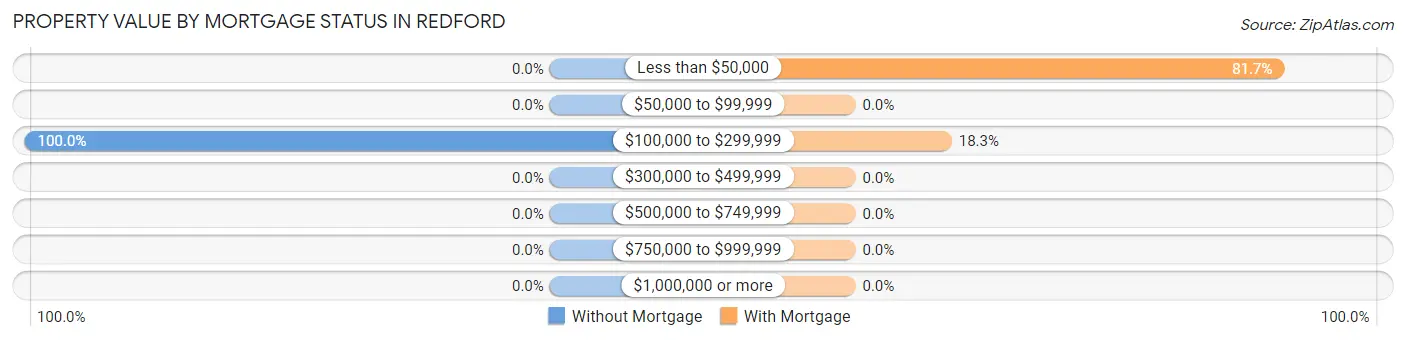
| Property Value | Without Mortgage | With Mortgage |
| Less than $50,000 | 0 (0.0%) | 49 (81.7%) |
| $50,000 to $99,999 | 0 (0.0%) | 0 (0.0%) |
| $100,000 to $299,999 | 21 (100.0%) | 11 (18.3%) |
| $300,000 to $499,999 | 0 (0.0%) | 0 (0.0%) |
| $500,000 to $749,999 | 0 (0.0%) | 0 (0.0%) |
| $750,000 to $999,999 | 0 (0.0%) | 0 (0.0%) |
| $1,000,000 or more | 0 (0.0%) | 0 (0.0%) |
| Total | 21 (100.0%) | 60 (100.0%) |
Household Income by Mortgage Status in Redford
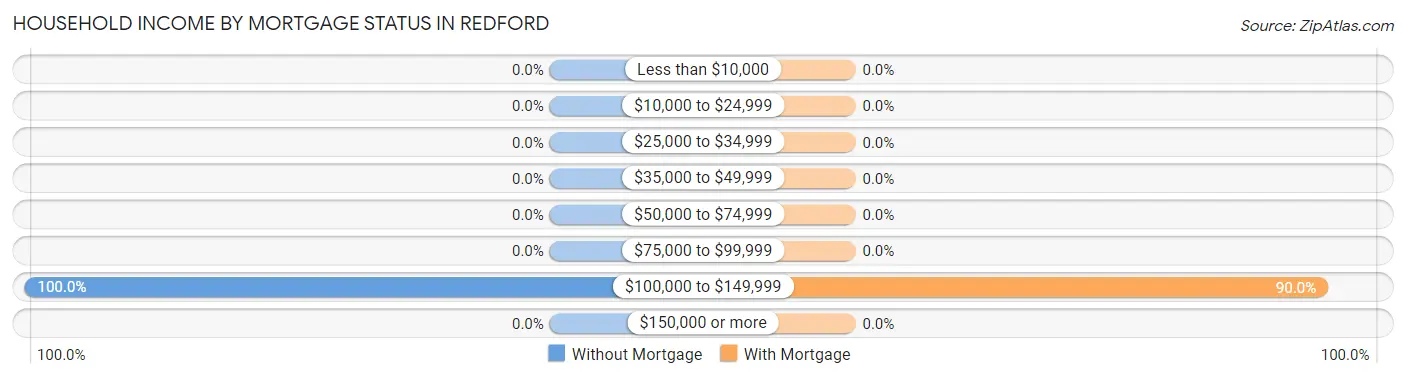
| Household Income | Without Mortgage | With Mortgage |
| Less than $10,000 | 0 (0.0%) | 0 (0.0%) |
| $10,000 to $24,999 | 0 (0.0%) | 0 (0.0%) |
| $25,000 to $34,999 | 0 (0.0%) | 0 (0.0%) |
| $35,000 to $49,999 | 0 (0.0%) | 0 (0.0%) |
| $50,000 to $74,999 | 0 (0.0%) | 0 (0.0%) |
| $75,000 to $99,999 | 0 (0.0%) | 0 (0.0%) |
| $100,000 to $149,999 | 21 (100.0%) | 54 (90.0%) |
| $150,000 or more | 0 (0.0%) | 0 (0.0%) |
| Total | 21 (100.0%) | 60 (100.0%) |
Property Value to Household Income Ratio in Redford
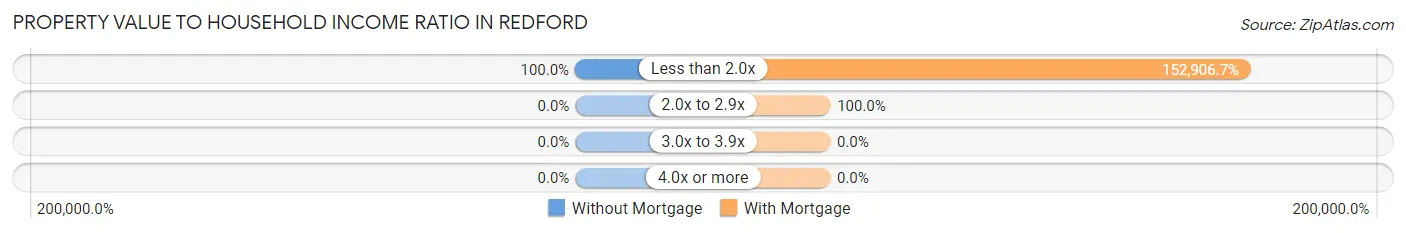
| Value-to-Income Ratio | Without Mortgage | With Mortgage |
| Less than 2.0x | 21 (100.0%) | 91,744 (152,906.7%) |
| 2.0x to 2.9x | 0 (0.0%) | 60 (100.0%) |
| 3.0x to 3.9x | 0 (0.0%) | 0 (0.0%) |
| 4.0x or more | 0 (0.0%) | 0 (0.0%) |
| Total | 21 (100.0%) | 60 (100.0%) |
Real Estate Taxes by Mortgage Status in Redford
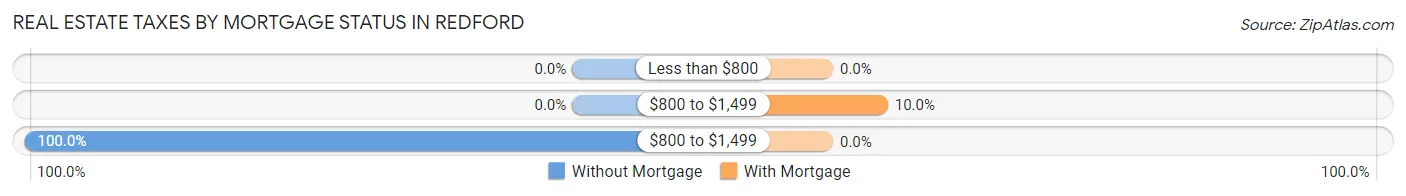
| Property Taxes | Without Mortgage | With Mortgage |
| Less than $800 | 0 (0.0%) | 0 (0.0%) |
| $800 to $1,499 | 0 (0.0%) | 6 (10.0%) |
| $800 to $1,499 | 21 (100.0%) | 0 (0.0%) |
| Total | 21 (100.0%) | 60 (100.0%) |
Health & Disability in Redford
Health Insurance Coverage by Age in Redford
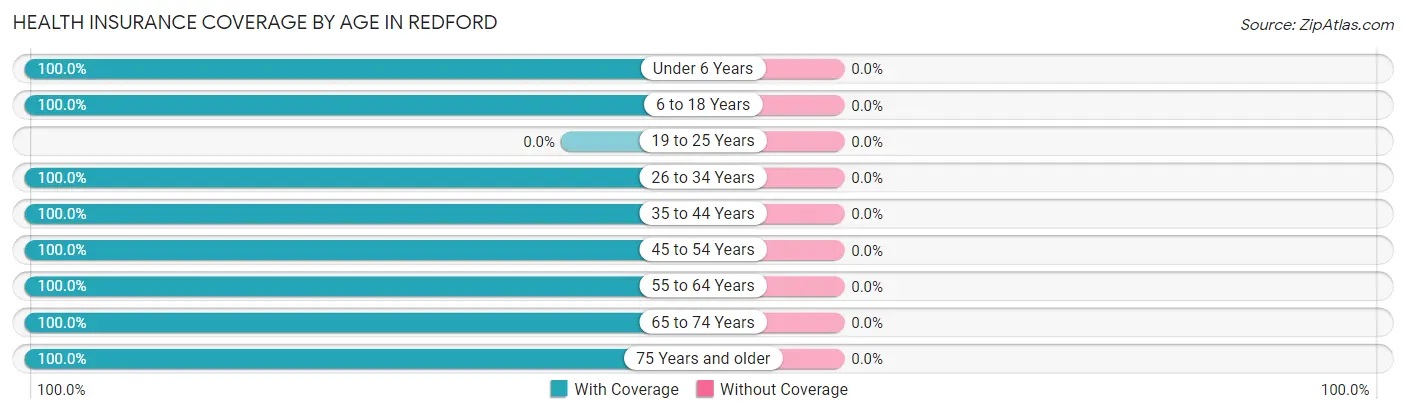
| Age Bracket | With Coverage | Without Coverage |
| Under 6 Years | 8 (100.0%) | 0 (0.0%) |
| 6 to 18 Years | 14 (100.0%) | 0 (0.0%) |
| 19 to 25 Years | 0 (0.0%) | 0 (0.0%) |
| 26 to 34 Years | 64 (100.0%) | 0 (0.0%) |
| 35 to 44 Years | 10 (100.0%) | 0 (0.0%) |
| 45 to 54 Years | 28 (100.0%) | 0 (0.0%) |
| 55 to 64 Years | 14 (100.0%) | 0 (0.0%) |
| 65 to 74 Years | 21 (100.0%) | 0 (0.0%) |
| 75 Years and older | 97 (100.0%) | 0 (0.0%) |
| Total | 256 (100.0%) | 0 (0.0%) |
Health Insurance Coverage by Citizenship Status in Redford
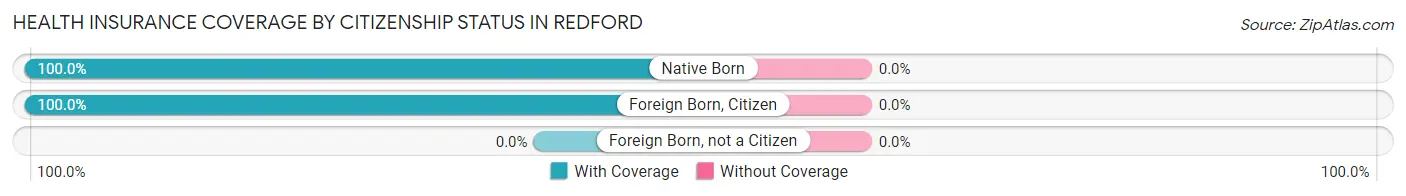
| Citizenship Status | With Coverage | Without Coverage |
| Native Born | 8 (100.0%) | 0 (0.0%) |
| Foreign Born, Citizen | 14 (100.0%) | 0 (0.0%) |
| Foreign Born, not a Citizen | 0 (0.0%) | 0 (0.0%) |
Health Insurance Coverage by Household Income in Redford
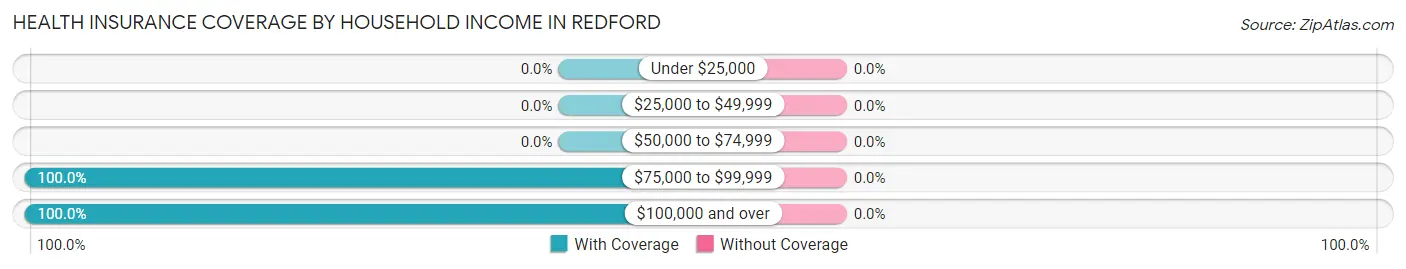
| Household Income | With Coverage | Without Coverage |
| Under $25,000 | 0 (0.0%) | 0 (0.0%) |
| $25,000 to $49,999 | 0 (0.0%) | 0 (0.0%) |
| $50,000 to $74,999 | 0 (0.0%) | 0 (0.0%) |
| $75,000 to $99,999 | 139 (100.0%) | 0 (0.0%) |
| $100,000 and over | 117 (100.0%) | 0 (0.0%) |
Public vs Private Health Insurance Coverage by Age in Redford
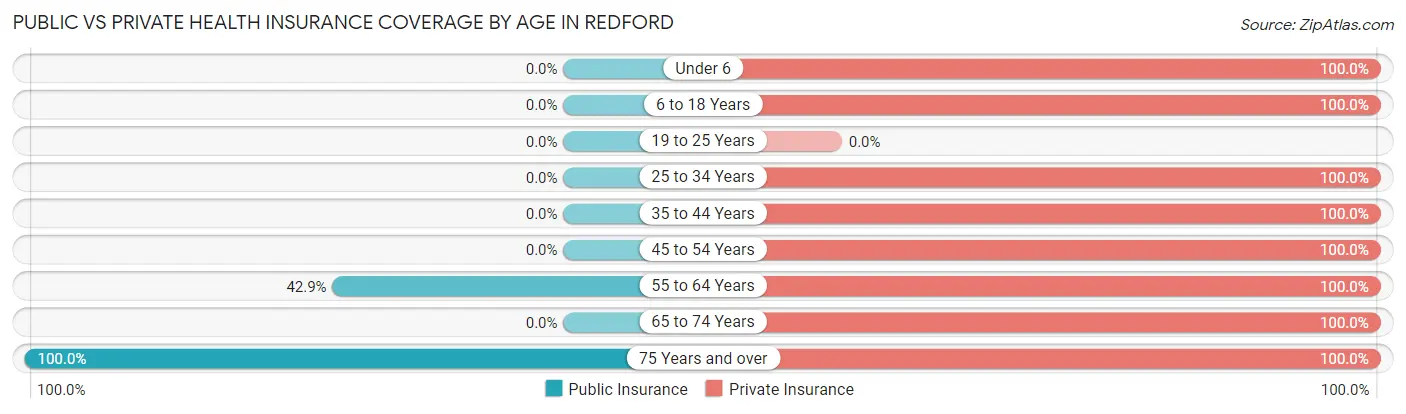
| Age Bracket | Public Insurance | Private Insurance |
| Under 6 | 0 (0.0%) | 8 (100.0%) |
| 6 to 18 Years | 0 (0.0%) | 14 (100.0%) |
| 19 to 25 Years | 0 (0.0%) | 0 (0.0%) |
| 25 to 34 Years | 0 (0.0%) | 64 (100.0%) |
| 35 to 44 Years | 0 (0.0%) | 10 (100.0%) |
| 45 to 54 Years | 0 (0.0%) | 28 (100.0%) |
| 55 to 64 Years | 6 (42.9%) | 14 (100.0%) |
| 65 to 74 Years | 0 (0.0%) | 21 (100.0%) |
| 75 Years and over | 97 (100.0%) | 97 (100.0%) |
| Total | 103 (40.2%) | 256 (100.0%) |
Disability Status by Sex by Age in Redford
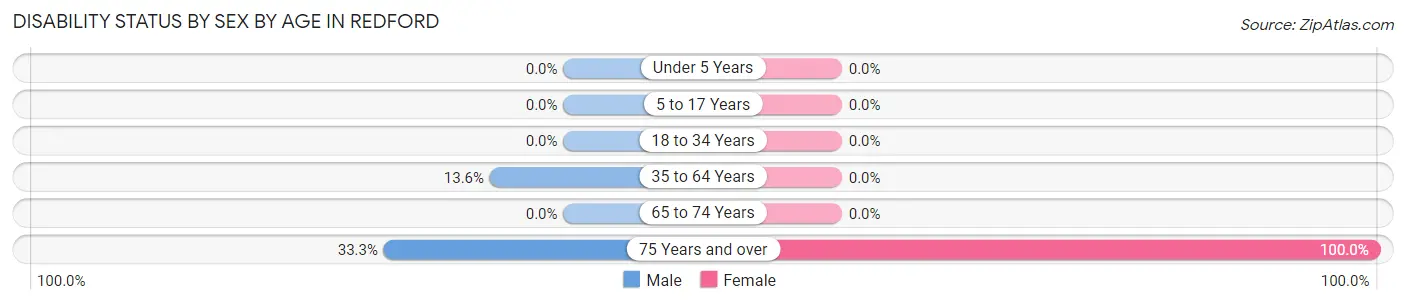
| Age Bracket | Male | Female |
| Under 5 Years | 0 (0.0%) | 0 (0.0%) |
| 5 to 17 Years | 0 (0.0%) | 0 (0.0%) |
| 18 to 34 Years | 0 (0.0%) | 0 (0.0%) |
| 35 to 64 Years | 6 (13.6%) | 0 (0.0%) |
| 65 to 74 Years | 0 (0.0%) | 0 (0.0%) |
| 75 Years and over | 18 (33.3%) | 43 (100.0%) |
Disability Class by Sex by Age in Redford
Disability Class: Hearing Difficulty
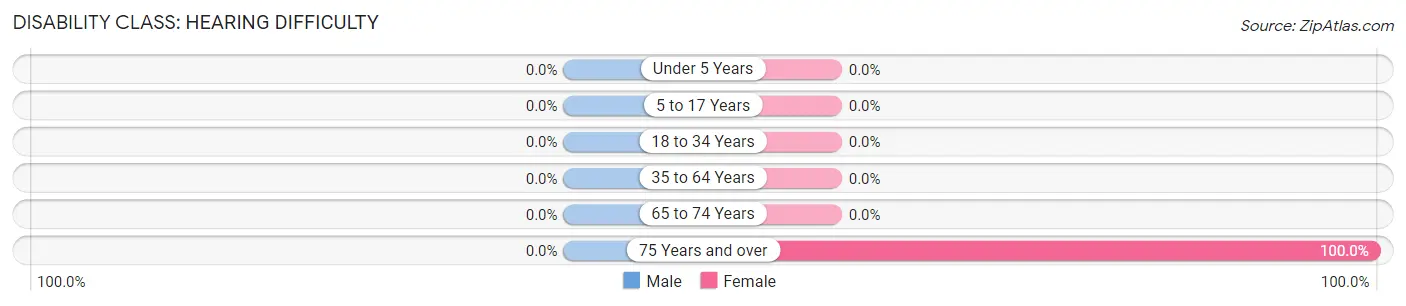
| Age Bracket | Male | Female |
| Under 5 Years | 0 (0.0%) | 0 (0.0%) |
| 5 to 17 Years | 0 (0.0%) | 0 (0.0%) |
| 18 to 34 Years | 0 (0.0%) | 0 (0.0%) |
| 35 to 64 Years | 0 (0.0%) | 0 (0.0%) |
| 65 to 74 Years | 0 (0.0%) | 0 (0.0%) |
| 75 Years and over | 0 (0.0%) | 43 (100.0%) |
Disability Class: Vision Difficulty
| Age Bracket | Male | Female |
| Under 5 Years | 0 (0.0%) | 0 (0.0%) |
| 5 to 17 Years | 0 (0.0%) | 0 (0.0%) |
| 18 to 34 Years | 0 (0.0%) | 0 (0.0%) |
| 35 to 64 Years | 0 (0.0%) | 0 (0.0%) |
| 65 to 74 Years | 0 (0.0%) | 0 (0.0%) |
| 75 Years and over | 0 (0.0%) | 0 (0.0%) |
Disability Class: Cognitive Difficulty
| Age Bracket | Male | Female |
| 5 to 17 Years | 0 (0.0%) | 0 (0.0%) |
| 18 to 34 Years | 0 (0.0%) | 0 (0.0%) |
| 35 to 64 Years | 0 (0.0%) | 0 (0.0%) |
| 65 to 74 Years | 0 (0.0%) | 0 (0.0%) |
| 75 Years and over | 0 (0.0%) | 0 (0.0%) |
Disability Class: Ambulatory Difficulty
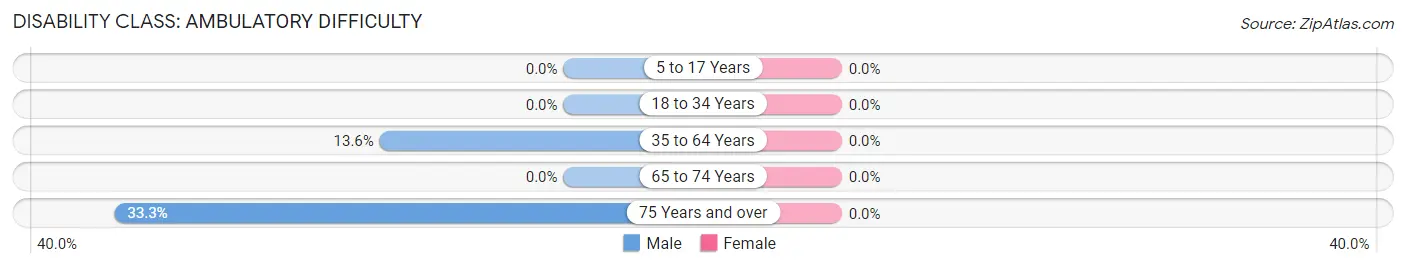
| Age Bracket | Male | Female |
| 5 to 17 Years | 0 (0.0%) | 0 (0.0%) |
| 18 to 34 Years | 0 (0.0%) | 0 (0.0%) |
| 35 to 64 Years | 6 (13.6%) | 0 (0.0%) |
| 65 to 74 Years | 0 (0.0%) | 0 (0.0%) |
| 75 Years and over | 18 (33.3%) | 0 (0.0%) |
Disability Class: Self-Care Difficulty
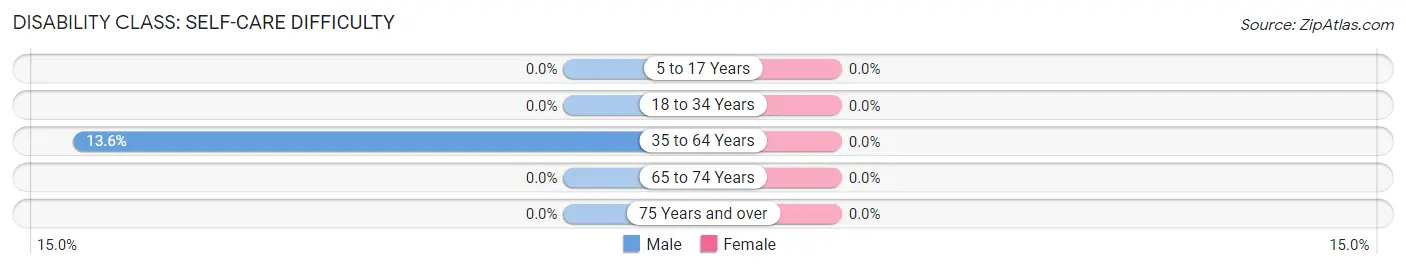
| Age Bracket | Male | Female |
| 5 to 17 Years | 0 (0.0%) | 0 (0.0%) |
| 18 to 34 Years | 0 (0.0%) | 0 (0.0%) |
| 35 to 64 Years | 6 (13.6%) | 0 (0.0%) |
| 65 to 74 Years | 0 (0.0%) | 0 (0.0%) |
| 75 Years and over | 0 (0.0%) | 0 (0.0%) |
Technology Access in Redford
Computing Device Access in Redford
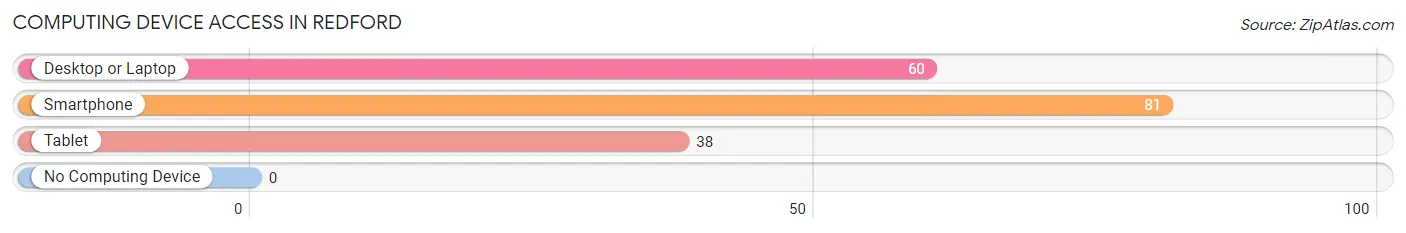
| Device Type | # Households | % Households |
| Desktop or Laptop | 60 | 74.1% |
| Smartphone | 81 | 100.0% |
| Tablet | 38 | 46.9% |
| No Computing Device | 0 | 0.0% |
| Total | 81 | 100.0% |
Internet Access in Redford
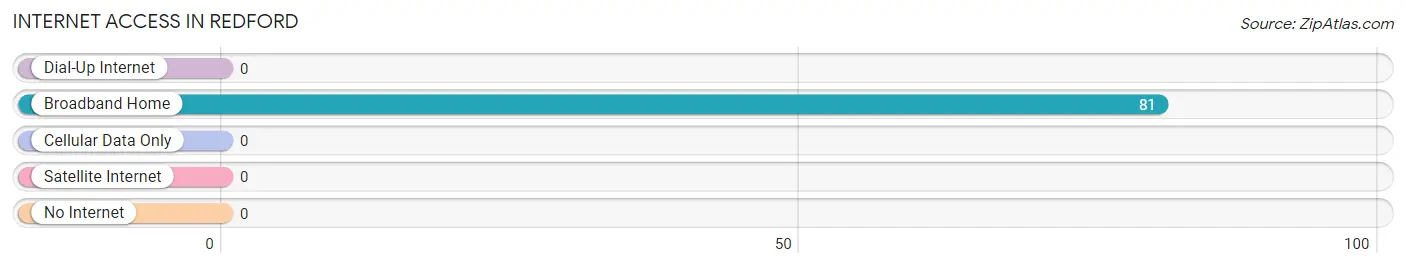
| Internet Type | # Households | % Households |
| Dial-Up Internet | 0 | 0.0% |
| Broadband Home | 81 | 100.0% |
| Cellular Data Only | 0 | 0.0% |
| Satellite Internet | 0 | 0.0% |
| No Internet | 0 | 0.0% |
| Total | 81 | 100.0% |
Redford Summary
Redford, NY is a small town located in the northern part of New York State, in the county of Essex. It is situated in the Adirondack Mountains, and is surrounded by the towns of North Hudson, Minerva, and Newcomb. The town has a population of approximately 1,000 people, and is home to a variety of businesses, including a general store, a post office, a library, and a few restaurants.
Geography
Redford is located in the Adirondack Mountains, and is surrounded by the towns of North Hudson, Minerva, and Newcomb. The town is situated at an elevation of 1,400 feet, and is located in the northern part of New York State. The town is located in the Adirondack Park, and is home to a variety of wildlife, including deer, bear, and moose. The town is also home to a variety of lakes, including Lake Placid, Lake George, and Lake Champlain.
Economy
The economy of Redford is largely based on tourism, as the town is located in the Adirondack Mountains. The town is home to a variety of businesses, including a general store, a post office, a library, and a few restaurants. The town also has a few small manufacturing businesses, such as a furniture factory and a woodworking shop. The town is also home to a few small farms, which produce a variety of crops, including apples, potatoes, and hay.
Demographics
As of the 2010 census, the population of Redford was 1,000 people. The town is predominantly white, with approximately 95% of the population being white. The town also has a small Hispanic population, with approximately 4% of the population being Hispanic. The town also has a small African American population, with approximately 1% of the population being African American. The median household income in Redford is approximately $45,000, and the median home value is approximately $150,000.
Conclusion
Redford, NY is a small town located in the northern part of New York State, in the county of Essex. It is situated in the Adirondack Mountains, and is surrounded by the towns of North Hudson, Minerva, and Newcomb. The town has a population of approximately 1,000 people, and is home to a variety of businesses, including a general store, a post office, a library, and a few restaurants. The economy of Redford is largely based on tourism, as the town is located in the Adirondack Mountains. The town is predominantly white, with approximately 95% of the population being white. The median household income in Redford is approximately $45,000, and the median home value is approximately $150,000. Redford is a small town with a rich history and a vibrant economy.
Common Questions
What is Per Capita Income in Redford?
Per Capita income in Redford is $32,964.
What is the Median Family Income in Redford?
Median Family Income in Redford is $92,355.
What is the Median Household income in Redford?
Median Household Income in Redford is $92,355.
What is Income or Wage Gap in Redford?
Income or Wage Gap in Redford is 21.6%.
Women in Redford earn 78.4 cents for every dollar earned by a man.
What is Inequality or Gini Index in Redford?
Inequality or Gini Index in Redford is 0.07.
What is the Total Population of Redford?
Total Population of Redford is 256.
What is the Total Male Population of Redford?
Total Male Population of Redford is 123.
What is the Total Female Population of Redford?
Total Female Population of Redford is 133.
What is the Ratio of Males per 100 Females in Redford?
There are 92.48 Males per 100 Females in Redford.
What is the Ratio of Females per 100 Males in Redford?
There are 108.13 Females per 100 Males in Redford.
What is the Median Population Age in Redford?
Median Population Age in Redford is 59.5 Years.
What is the Average Family Size in Redford
Average Family Size in Redford is 3.2 People.
What is the Average Household Size in Redford
Average Household Size in Redford is 3.2 People.
How Large is the Labor Force in Redford?
There are 146 People in the Labor Forcein in Redford.
What is the Percentage of People in the Labor Force in Redford?
62.4% of People are in the Labor Force in Redford.