Andes, NY Map & Demographics
Andes Map
Andes Overview
$68,906
PER CAPITA INCOME
$50,750
AVG HOUSEHOLD INCOME
0.54
INEQUALITY / GINI INDEX
115
TOTAL POPULATION
65
MALE POPULATION
50
FEMALE POPULATION
130.00
MALES / 100 FEMALES
76.92
FEMALES / 100 MALES
68.4
MEDIAN AGE
2.1
AVG FAMILY SIZE
1.4
AVG HOUSEHOLD SIZE
57
LABOR FORCE [ PEOPLE ]
51.8%
PERCENT IN LABOR FORCE
10.5%
UNEMPLOYMENT RATE
Andes Zip Codes
Andes Area Codes
Income in Andes
Income Overview in Andes
| Characteristic | Number | Measure |
| Per Capita Income | 115 | $68,906 |
| Median Family Income | 21 | $0 |
| Mean Family Income | 21 | $216,086 |
| Median Household Income | 84 | $50,750 |
| Mean Household Income | 84 | $92,900 |
| Income Deficit | 21 | $0 |
| Wage / Income Gap (%) | 115 | 0.00% |
| Wage / Income Gap ($) | 115 | 100.00¢ per $1 |
| Gini / Inequality Index | 115 | 0.54 |
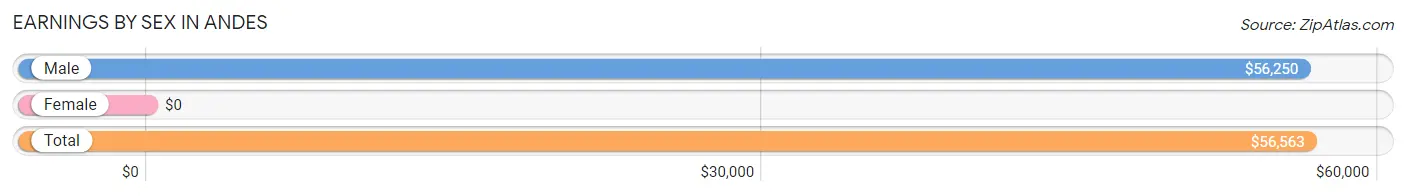
Earnings by Sex in Andes
| Sex | Number | Average Earnings |
| Male | 40 (70.2%) | $56,250 |
| Female | 17 (29.8%) | $0 |
| Total | 57 (100.0%) | $56,563 |
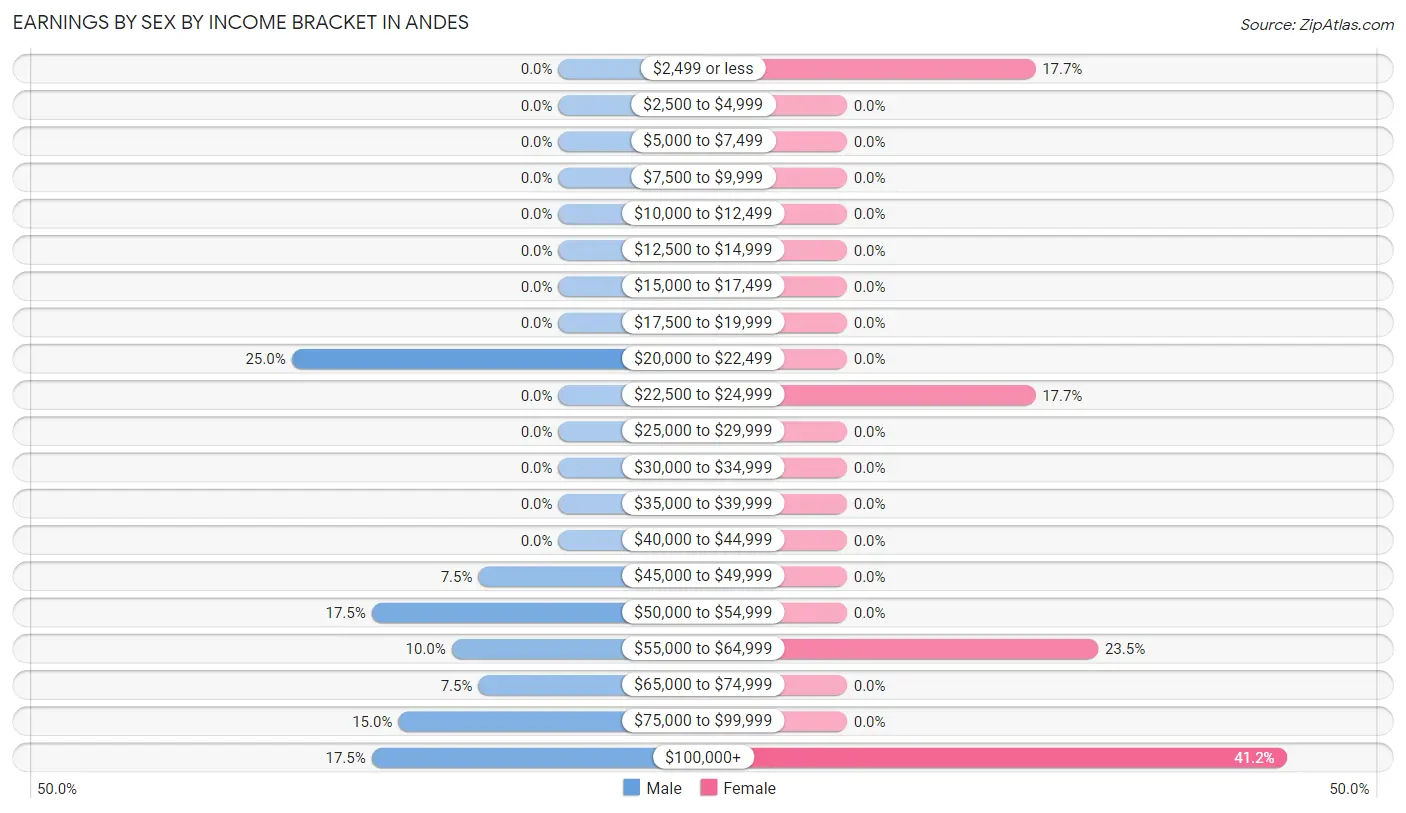
Earnings by Sex by Income Bracket in Andes
The most common earnings brackets in Andes are $20,000 to $22,499 for men (10 | 25.0%) and $100,000+ for women (7 | 41.2%).
| Income | Male | Female |
| $2,499 or less | 0 (0.0%) | 3 (17.6%) |
| $2,500 to $4,999 | 0 (0.0%) | 0 (0.0%) |
| $5,000 to $7,499 | 0 (0.0%) | 0 (0.0%) |
| $7,500 to $9,999 | 0 (0.0%) | 0 (0.0%) |
| $10,000 to $12,499 | 0 (0.0%) | 0 (0.0%) |
| $12,500 to $14,999 | 0 (0.0%) | 0 (0.0%) |
| $15,000 to $17,499 | 0 (0.0%) | 0 (0.0%) |
| $17,500 to $19,999 | 0 (0.0%) | 0 (0.0%) |
| $20,000 to $22,499 | 10 (25.0%) | 0 (0.0%) |
| $22,500 to $24,999 | 0 (0.0%) | 3 (17.6%) |
| $25,000 to $29,999 | 0 (0.0%) | 0 (0.0%) |
| $30,000 to $34,999 | 0 (0.0%) | 0 (0.0%) |
| $35,000 to $39,999 | 0 (0.0%) | 0 (0.0%) |
| $40,000 to $44,999 | 0 (0.0%) | 0 (0.0%) |
| $45,000 to $49,999 | 3 (7.5%) | 0 (0.0%) |
| $50,000 to $54,999 | 7 (17.5%) | 0 (0.0%) |
| $55,000 to $64,999 | 4 (10.0%) | 4 (23.5%) |
| $65,000 to $74,999 | 3 (7.5%) | 0 (0.0%) |
| $75,000 to $99,999 | 6 (15.0%) | 0 (0.0%) |
| $100,000+ | 7 (17.5%) | 7 (41.2%) |
| Total | 40 (100.0%) | 17 (100.0%) |
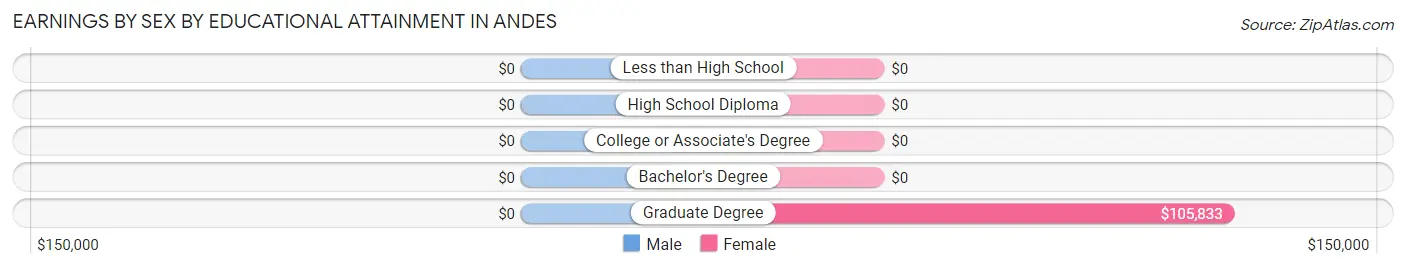
Earnings by Sex by Educational Attainment in Andes
| Educational Attainment | Male Income | Female Income |
| Less than High School | - | - |
| High School Diploma | - | - |
| College or Associate's Degree | - | - |
| Bachelor's Degree | - | - |
| Graduate Degree | - | - |
| Total | $56,250 | $0 |
Family Income in Andes
Family Income Brackets in Andes
According to the Andes family income data, there are 7 families falling into the $100,000 to $149,999 income range, which is the most common income bracket and makes up 33.3% of all families.
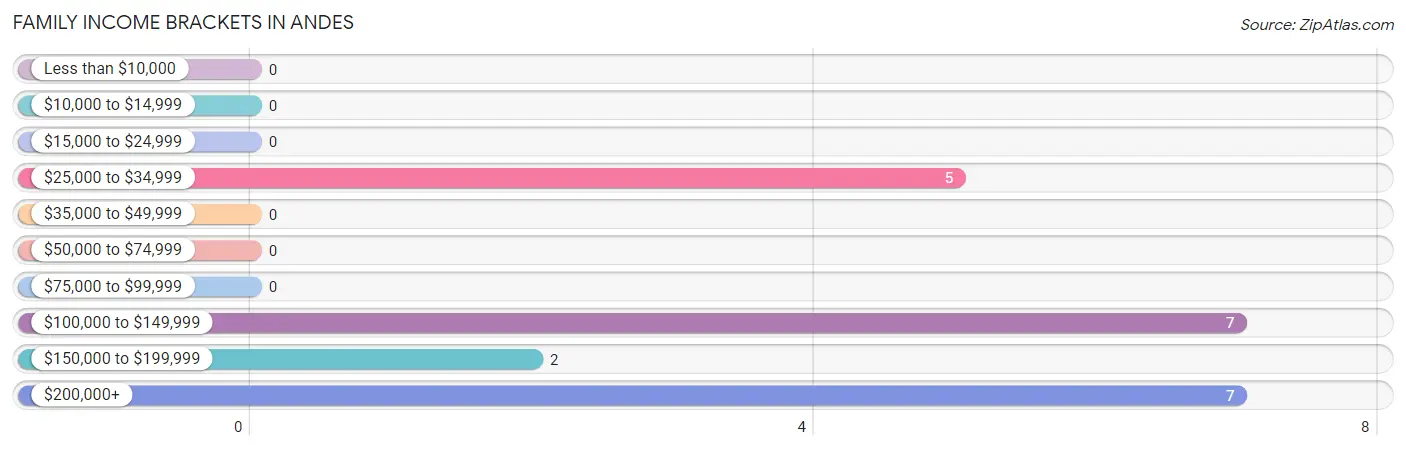
| Income Bracket | # Families | % Families |
| Less than $10,000 | 0 | 0.0% |
| $10,000 to $14,999 | 0 | 0.0% |
| $15,000 to $24,999 | 0 | 0.0% |
| $25,000 to $34,999 | 5 | 23.8% |
| $35,000 to $49,999 | 0 | 0.0% |
| $50,000 to $74,999 | 0 | 0.0% |
| $75,000 to $99,999 | 0 | 0.0% |
| $100,000 to $149,999 | 7 | 33.3% |
| $150,000 to $199,999 | 2 | 9.5% |
| $200,000+ | 7 | 33.3% |
Family Income by Famaliy Size in Andes
2-person families (18 | 85.7%) account for the highest median family income in Andes with $115,625 per family, while 2-person families (18 | 85.7%) have the highest median income of $57,812 per family member.
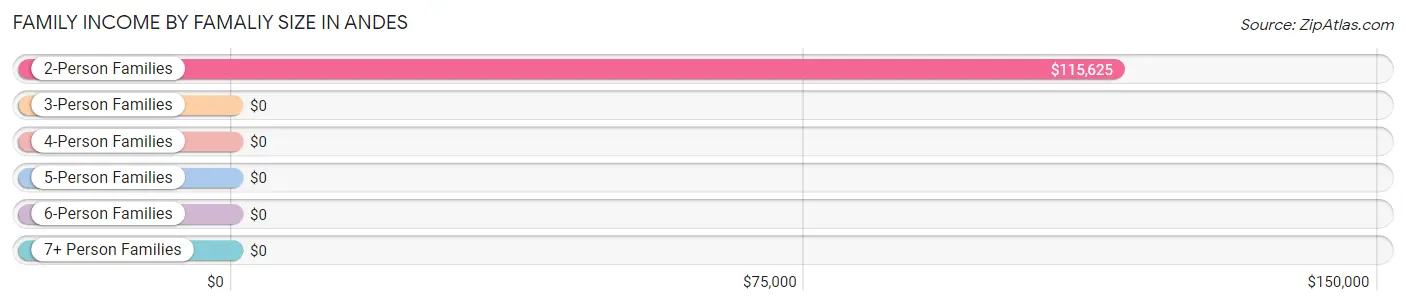
| Income Bracket | # Families | Median Income |
| 2-Person Families | 18 (85.7%) | $115,625 |
| 3-Person Families | 3 (14.3%) | $0 |
| 4-Person Families | 0 (0.0%) | $0 |
| 5-Person Families | 0 (0.0%) | $0 |
| 6-Person Families | 0 (0.0%) | $0 |
| 7+ Person Families | 0 (0.0%) | $0 |
| Total | 21 (100.0%) | $0 |
Family Income by Number of Earners in Andes
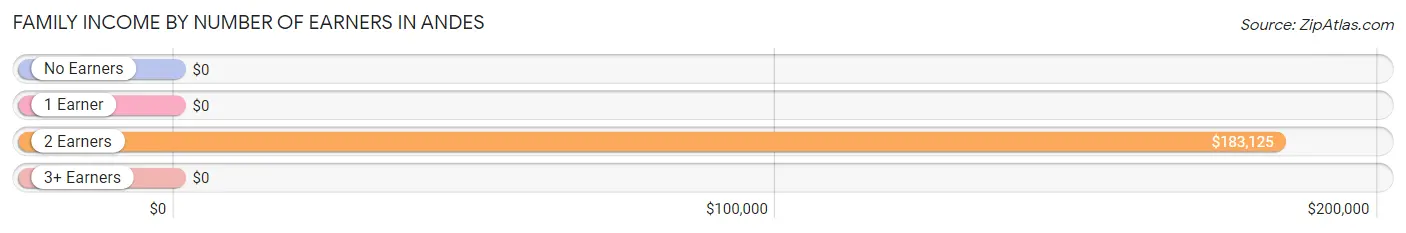
| Number of Earners | # Families | Median Income |
| No Earners | 9 (42.9%) | $0 |
| 1 Earner | 3 (14.3%) | $0 |
| 2 Earners | 9 (42.9%) | $183,125 |
| 3+ Earners | 0 (0.0%) | $0 |
| Total | 21 (100.0%) | $0 |
Household Income in Andes
Household Income Brackets in Andes
With 24 households falling in the category, the $25,000 to $34,999 income range is the most frequent in Andes, accounting for 28.6% of all households.
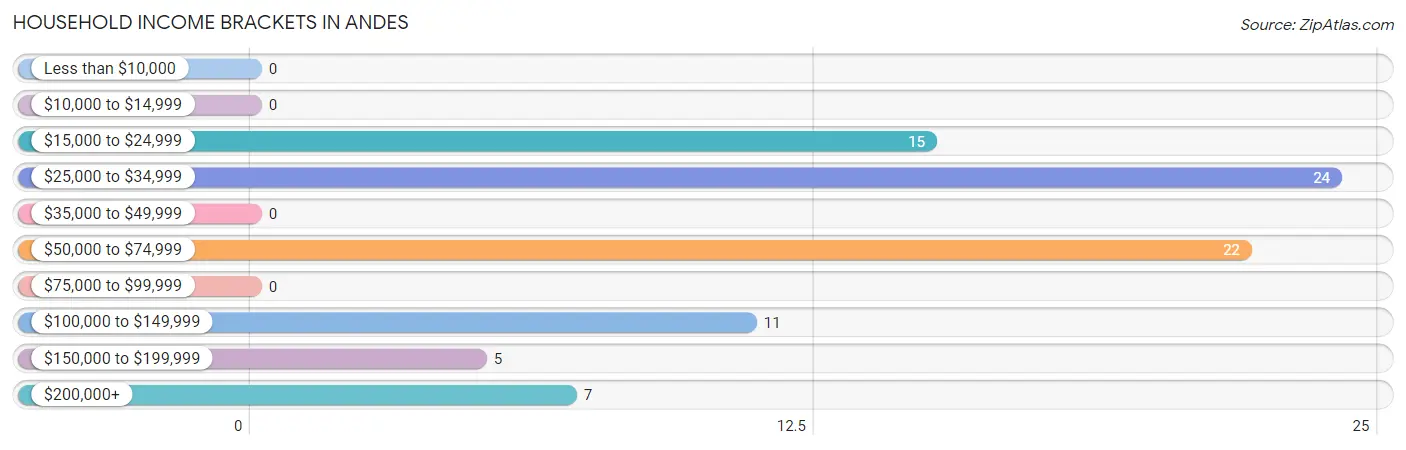
| Income Bracket | # Households | % Households |
| Less than $10,000 | 0 | 0.0% |
| $10,000 to $14,999 | 0 | 0.0% |
| $15,000 to $24,999 | 15 | 17.9% |
| $25,000 to $34,999 | 24 | 28.6% |
| $35,000 to $49,999 | 0 | 0.0% |
| $50,000 to $74,999 | 22 | 26.2% |
| $75,000 to $99,999 | 0 | 0.0% |
| $100,000 to $149,999 | 11 | 13.1% |
| $150,000 to $199,999 | 5 | 6.0% |
| $200,000+ | 7 | 8.3% |
Household Income by Householder Age in Andes
The median household income in Andes is $50,750, with the highest median household income of $142,679 found in the 25 to 44 years age bracket for the primary householder. A total of 23 households (27.4%) fall into this category.
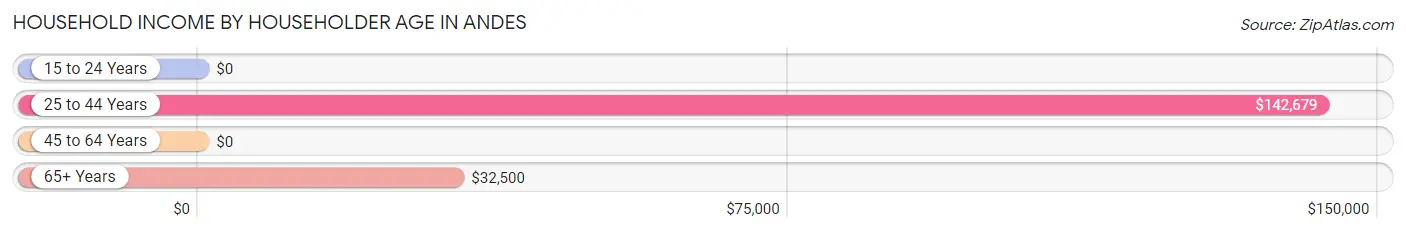
| Income Bracket | # Households | Median Income |
| 15 to 24 Years | 0 (0.0%) | $0 |
| 25 to 44 Years | 23 (27.4%) | $142,679 |
| 45 to 64 Years | 13 (15.5%) | $0 |
| 65+ Years | 48 (57.1%) | $32,500 |
| Total | 84 (100.0%) | $50,750 |
Poverty in Andes
Income Below Poverty by Sex and Age in Andes
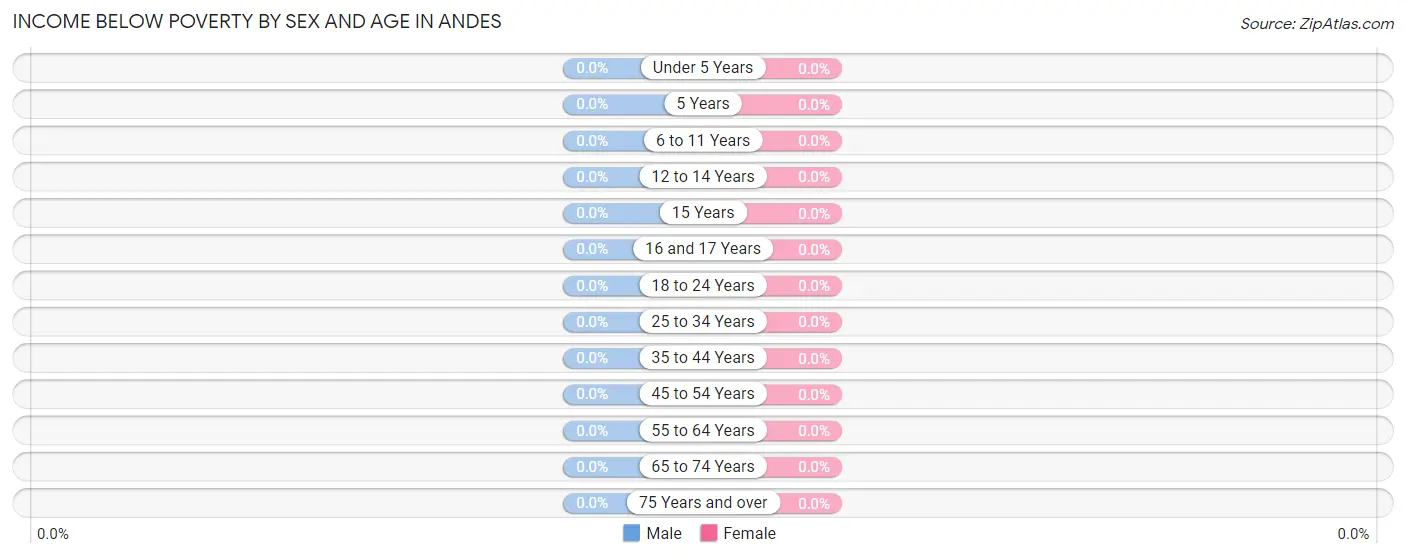
| Age Bracket | Male | Female |
| Under 5 Years | 0 (0.0%) | 0 (0.0%) |
| 5 Years | 0 (0.0%) | 0 (0.0%) |
| 6 to 11 Years | 0 (0.0%) | 0 (0.0%) |
| 12 to 14 Years | 0 (0.0%) | 0 (0.0%) |
| 15 Years | 0 (0.0%) | 0 (0.0%) |
| 16 and 17 Years | 0 (0.0%) | 0 (0.0%) |
| 18 to 24 Years | 0 (0.0%) | 0 (0.0%) |
| 25 to 34 Years | 0 (0.0%) | 0 (0.0%) |
| 35 to 44 Years | 0 (0.0%) | 0 (0.0%) |
| 45 to 54 Years | 0 (0.0%) | 0 (0.0%) |
| 55 to 64 Years | 0 (0.0%) | 0 (0.0%) |
| 65 to 74 Years | 0 (0.0%) | 0 (0.0%) |
| 75 Years and over | 0 (0.0%) | 0 (0.0%) |
| Total | 0 (0.0%) | 0 (0.0%) |
Income Above Poverty by Sex and Age in Andes
According to the poverty statistics in Andes, males aged 6 to 11 years and females aged under 5 years are the age groups that are most secure financially, with 100.0% of males and 100.0% of females in these age groups living above the poverty line.
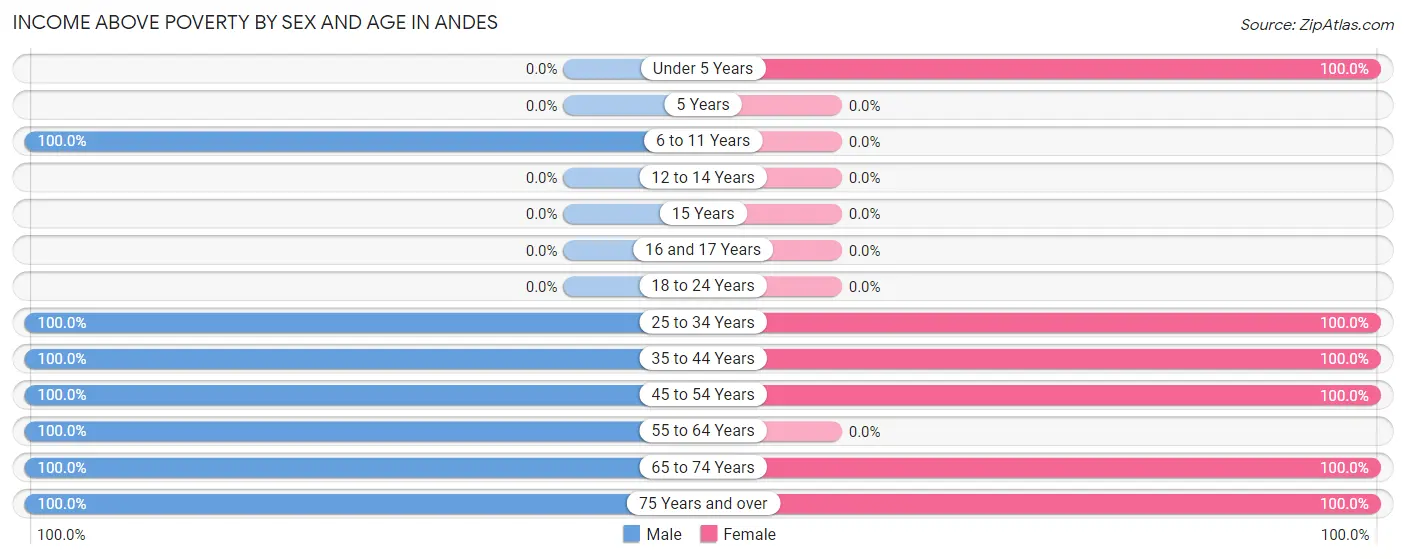
| Age Bracket | Male | Female |
| Under 5 Years | 0 (0.0%) | 3 (100.0%) |
| 5 Years | 0 (0.0%) | 0 (0.0%) |
| 6 to 11 Years | 2 (100.0%) | 0 (0.0%) |
| 12 to 14 Years | 0 (0.0%) | 0 (0.0%) |
| 15 Years | 0 (0.0%) | 0 (0.0%) |
| 16 and 17 Years | 0 (0.0%) | 0 (0.0%) |
| 18 to 24 Years | 0 (0.0%) | 0 (0.0%) |
| 25 to 34 Years | 10 (100.0%) | 4 (100.0%) |
| 35 to 44 Years | 17 (100.0%) | 5 (100.0%) |
| 45 to 54 Years | 10 (100.0%) | 2 (100.0%) |
| 55 to 64 Years | 3 (100.0%) | 0 (0.0%) |
| 65 to 74 Years | 9 (100.0%) | 19 (100.0%) |
| 75 Years and over | 14 (100.0%) | 17 (100.0%) |
| Total | 65 (100.0%) | 50 (100.0%) |
Income Below Poverty Among Married-Couple Families in Andes
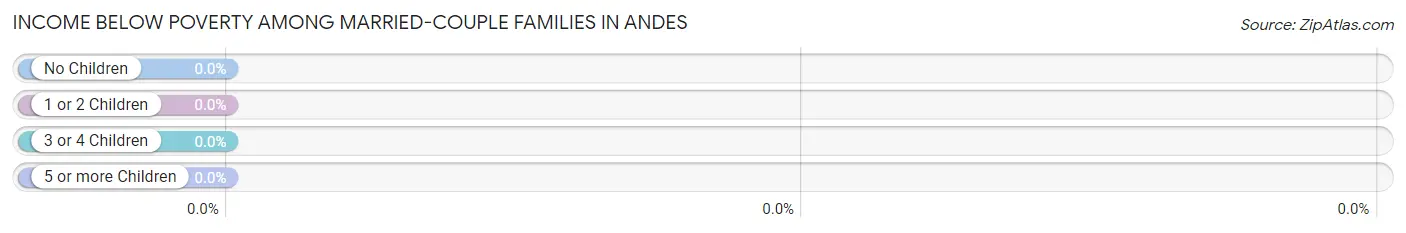
| Children | Above Poverty | Below Poverty |
| No Children | 15 (100.0%) | 0 (0.0%) |
| 1 or 2 Children | 3 (100.0%) | 0 (0.0%) |
| 3 or 4 Children | 0 (0.0%) | 0 (0.0%) |
| 5 or more Children | 0 (0.0%) | 0 (0.0%) |
| Total | 18 (100.0%) | 0 (0.0%) |
Income Below Poverty Among Single-Parent Households in Andes
| Children | Single Father | Single Mother |
| No Children | 0 (0.0%) | 0 (0.0%) |
| 1 or 2 Children | 0 (0.0%) | 0 (0.0%) |
| 3 or 4 Children | 0 (0.0%) | 0 (0.0%) |
| 5 or more Children | 0 (0.0%) | 0 (0.0%) |
| Total | 0 (0.0%) | 0 (0.0%) |
Income Below Poverty Among Married-Couple vs Single-Parent Households in Andes
| Children | Married-Couple Families | Single-Parent Households |
| No Children | 0 (0.0%) | 0 (0.0%) |
| 1 or 2 Children | 0 (0.0%) | 0 (0.0%) |
| 3 or 4 Children | 0 (0.0%) | 0 (0.0%) |
| 5 or more Children | 0 (0.0%) | 0 (0.0%) |
| Total | 0 (0.0%) | 0 (0.0%) |
Race in Andes
The most populous races in Andes are White / Caucasian (109 | 94.8%), and Two or more Races (6 | 5.2%).
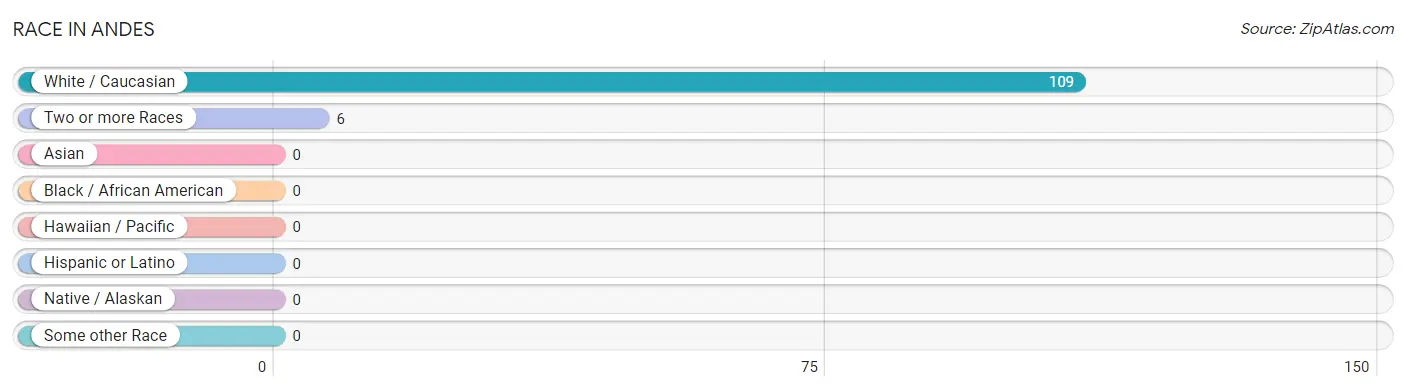
| Race | # Population | % Population |
| Asian | 0 | 0.0% |
| Black / African American | 0 | 0.0% |
| Hawaiian / Pacific | 0 | 0.0% |
| Hispanic or Latino | 0 | 0.0% |
| Native / Alaskan | 0 | 0.0% |
| White / Caucasian | 109 | 94.8% |
| Two or more Races | 6 | 5.2% |
| Some other Race | 0 | 0.0% |
| Total | 115 | 100.0% |
Ancestry in Andes
The most populous ancestries reported in Andes are Italian (32 | 27.8%), Irish (31 | 27.0%), English (24 | 20.9%), German (18 | 15.7%), and Scotch-Irish (8 | 7.0%), together accounting for 98.3% of all Andes residents.
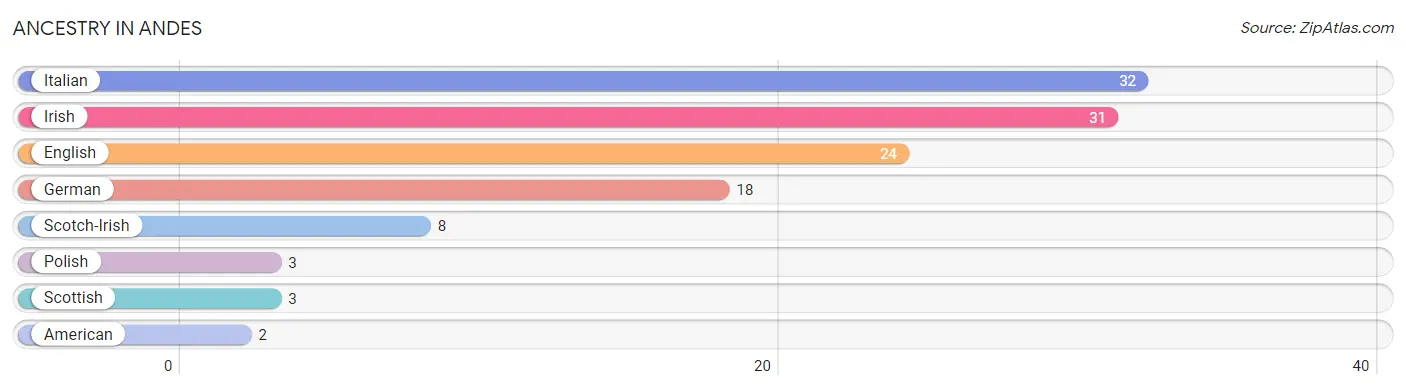
| Ancestry | # Population | % Population |
| American | 2 | 1.7% |
| English | 24 | 20.9% |
| German | 18 | 15.7% |
| Irish | 31 | 27.0% |
| Italian | 32 | 27.8% |
| Polish | 3 | 2.6% |
| Scotch-Irish | 8 | 7.0% |
| Scottish | 3 | 2.6% | View All 8 Rows |
Immigrants in Andes
The most numerous immigrant groups reported in Andes came from Europe (13 | 11.3%), Belarus (7 | 6.1%), Eastern Europe (7 | 6.1%), England (3 | 2.6%), and Italy (3 | 2.6%), together accounting for 28.7% of all Andes residents.
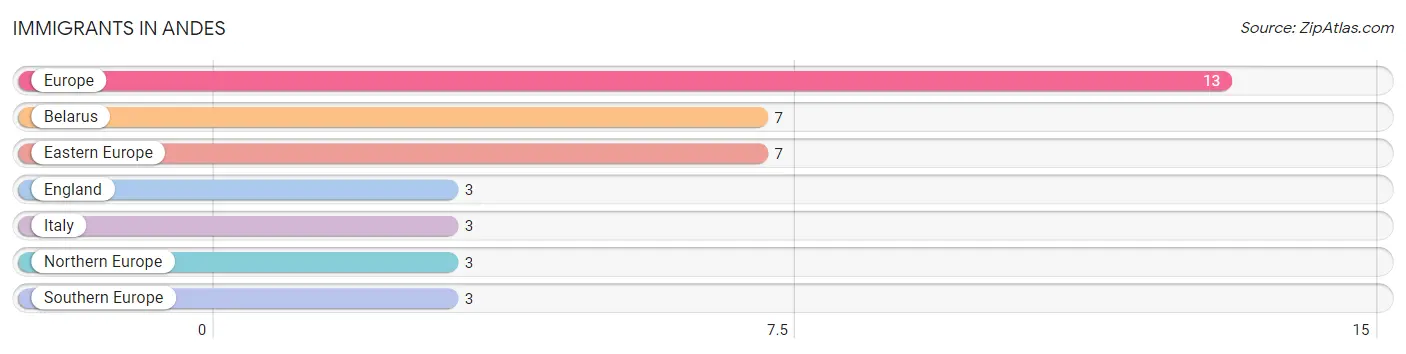
| Immigration Origin | # Population | % Population |
| Belarus | 7 | 6.1% |
| Eastern Europe | 7 | 6.1% |
| England | 3 | 2.6% |
| Europe | 13 | 11.3% |
| Italy | 3 | 2.6% |
| Northern Europe | 3 | 2.6% |
| Southern Europe | 3 | 2.6% | View All 7 Rows |
Sex and Age in Andes
Sex and Age in Andes
The most populous age groups in Andes are 80 to 84 Years (14 | 21.5%) for men and 70 to 74 Years (19 | 38.0%) for women.
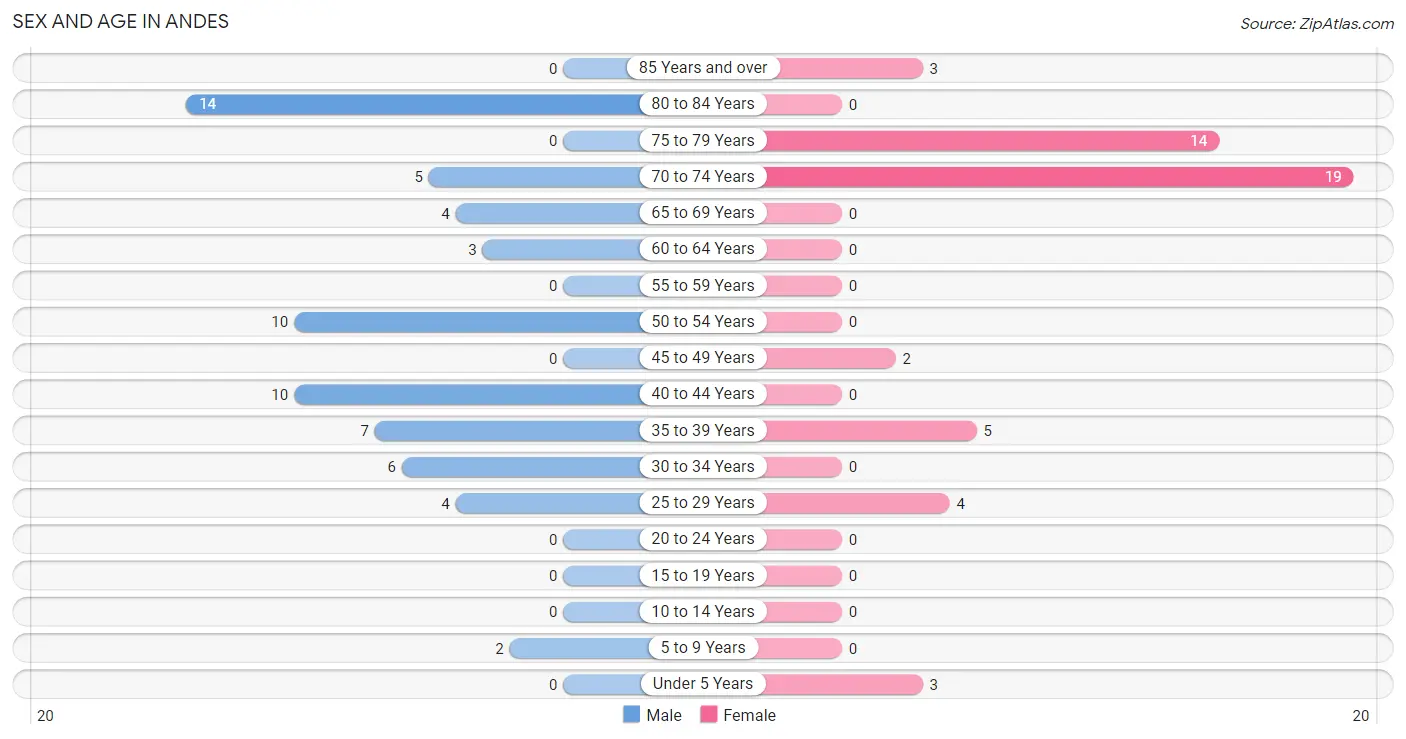
| Age Bracket | Male | Female |
| Under 5 Years | 0 (0.0%) | 3 (6.0%) |
| 5 to 9 Years | 2 (3.1%) | 0 (0.0%) |
| 10 to 14 Years | 0 (0.0%) | 0 (0.0%) |
| 15 to 19 Years | 0 (0.0%) | 0 (0.0%) |
| 20 to 24 Years | 0 (0.0%) | 0 (0.0%) |
| 25 to 29 Years | 4 (6.1%) | 4 (8.0%) |
| 30 to 34 Years | 6 (9.2%) | 0 (0.0%) |
| 35 to 39 Years | 7 (10.8%) | 5 (10.0%) |
| 40 to 44 Years | 10 (15.4%) | 0 (0.0%) |
| 45 to 49 Years | 0 (0.0%) | 2 (4.0%) |
| 50 to 54 Years | 10 (15.4%) | 0 (0.0%) |
| 55 to 59 Years | 0 (0.0%) | 0 (0.0%) |
| 60 to 64 Years | 3 (4.6%) | 0 (0.0%) |
| 65 to 69 Years | 4 (6.1%) | 0 (0.0%) |
| 70 to 74 Years | 5 (7.7%) | 19 (38.0%) |
| 75 to 79 Years | 0 (0.0%) | 14 (28.0%) |
| 80 to 84 Years | 14 (21.5%) | 0 (0.0%) |
| 85 Years and over | 0 (0.0%) | 3 (6.0%) |
| Total | 65 (100.0%) | 50 (100.0%) |
Families and Households in Andes
Median Family Size in Andes
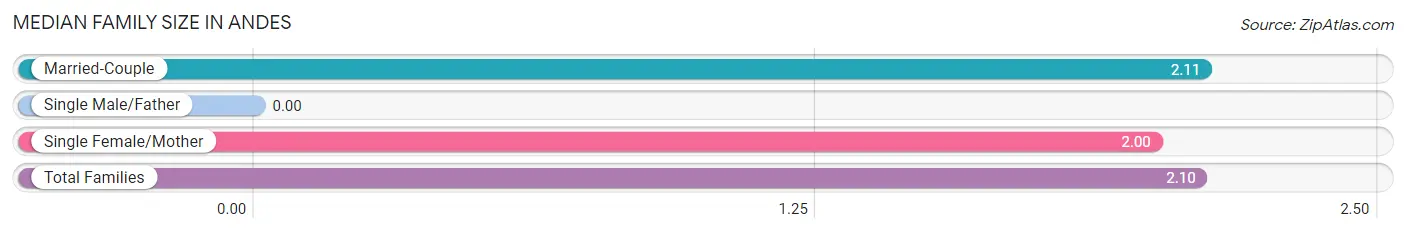
| Family Type | # Families | Family Size |
| Married-Couple | 18 (85.7%) | 2.11 |
| Single Male/Father | 0 (0.0%) | - |
| Single Female/Mother | 3 (14.3%) | 2.00 |
| Total Families | 21 (100.0%) | 2.10 |
Median Household Size in Andes
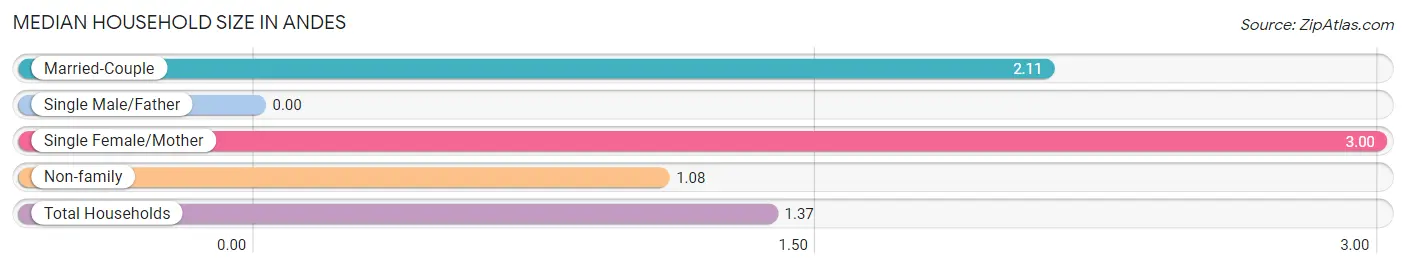
| Household Type | # Households | Household Size |
| Married-Couple | 18 (21.4%) | 2.11 |
| Single Male/Father | 0 (0.0%) | - |
| Single Female/Mother | 3 (3.6%) | 3.00 |
| Non-family | 63 (75.0%) | 1.08 |
| Total Households | 84 (100.0%) | 1.37 |
Household Size by Marriage Status in Andes
Out of a total of 84 households in Andes, 21 (25.0%) are family households, while 63 (75.0%) are nonfamily households. The most numerous type of family households are 2-person households, comprising 15, and the most common type of nonfamily households are 1-person households, comprising 60.
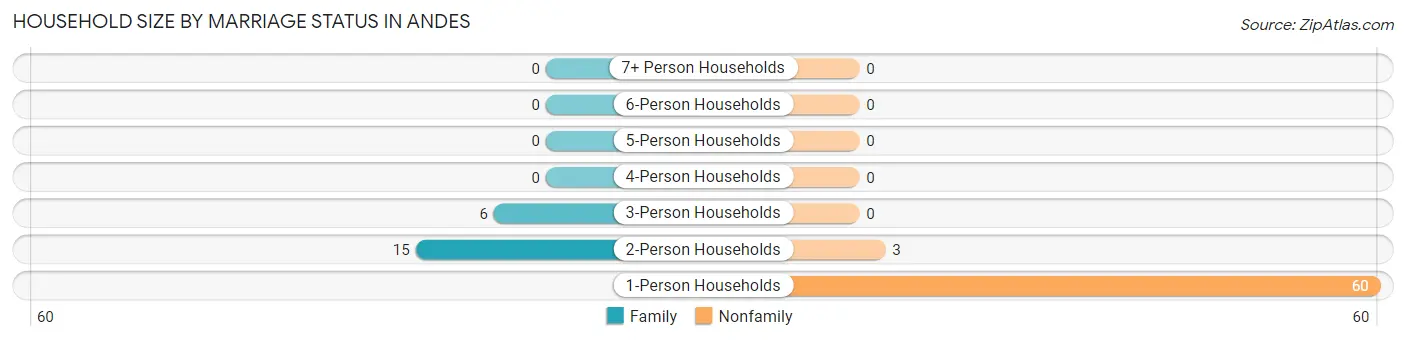
| Household Size | Family Households | Nonfamily Households |
| 1-Person Households | - | 60 (71.4%) |
| 2-Person Households | 15 (17.9%) | 3 (3.6%) |
| 3-Person Households | 6 (7.1%) | 0 (0.0%) |
| 4-Person Households | 0 (0.0%) | 0 (0.0%) |
| 5-Person Households | 0 (0.0%) | 0 (0.0%) |
| 6-Person Households | 0 (0.0%) | 0 (0.0%) |
| 7+ Person Households | 0 (0.0%) | 0 (0.0%) |
| Total | 21 (25.0%) | 63 (75.0%) |
Female Fertility in Andes
Fertility by Age in Andes
Average fertility rate in Andes is 273.0 births per 1,000 women. Women in the age bracket of 35 to 50 years have the highest fertility rate with 429.0 births per 1,000 women. Women in the age bracket of 35 to 50 years acount for 100.0% of all women with births.
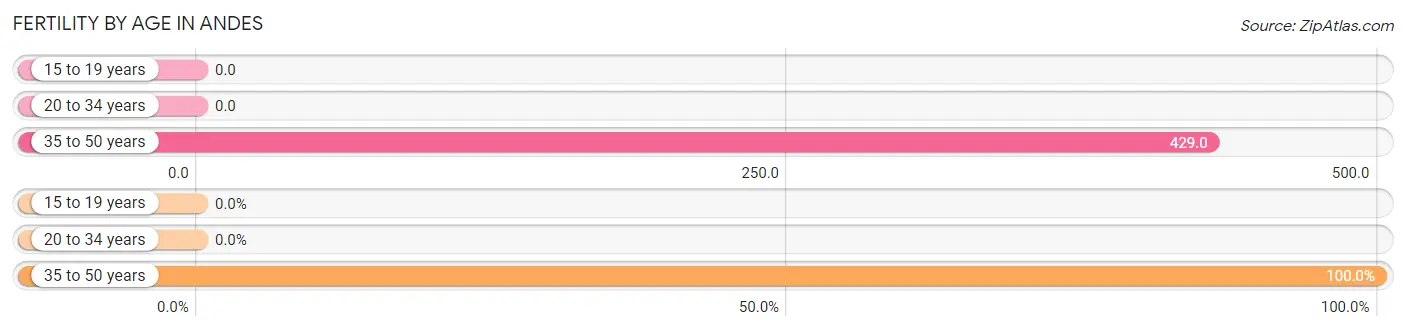
| Age Bracket | Women with Births | Births / 1,000 Women |
| 15 to 19 years | 0 (0.0%) | 0.0 |
| 20 to 34 years | 0 (0.0%) | 0.0 |
| 35 to 50 years | 3 (100.0%) | 429.0 |
| Total | 3 (100.0%) | 273.0 |
Fertility by Age by Marriage Status in Andes
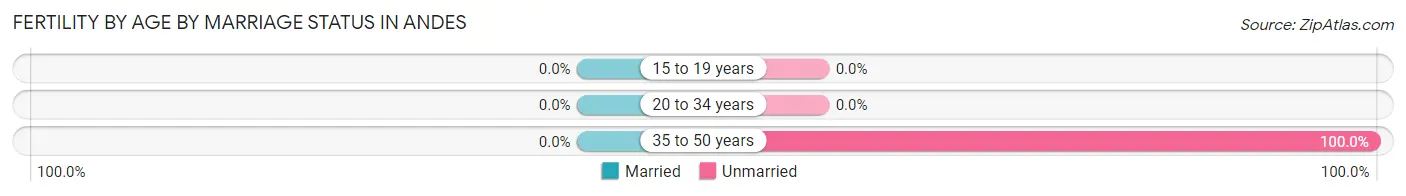
| Age Bracket | Married | Unmarried |
| 15 to 19 years | 0 (0.0%) | 0 (0.0%) |
| 20 to 34 years | 0 (0.0%) | 0 (0.0%) |
| 35 to 50 years | 0 (0.0%) | 3 (100.0%) |
| Total | 0 (0.0%) | 3 (100.0%) |
Fertility by Education in Andes
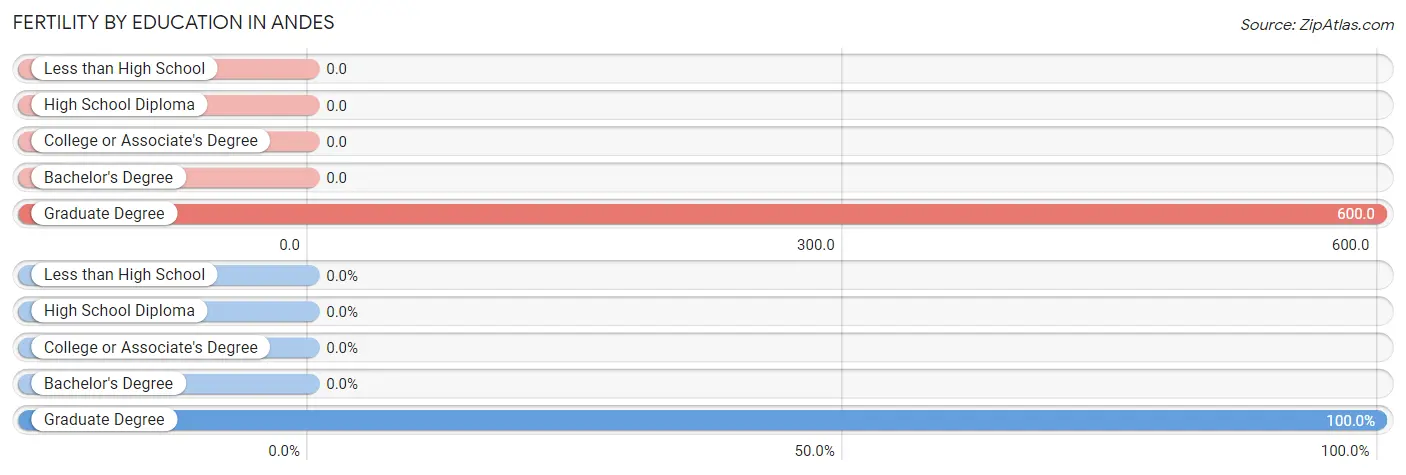
| Educational Attainment | Women with Births | Births / 1,000 Women |
| Less than High School | 0 (0.0%) | 0.0 |
| High School Diploma | 0 (0.0%) | 0.0 |
| College or Associate's Degree | 0 (0.0%) | 0.0 |
| Bachelor's Degree | 0 (0.0%) | 0.0 |
| Graduate Degree | 3 (100.0%) | 600.0 |
| Total | 3 (100.0%) | 273.0 |
Fertility by Education by Marriage Status in Andes
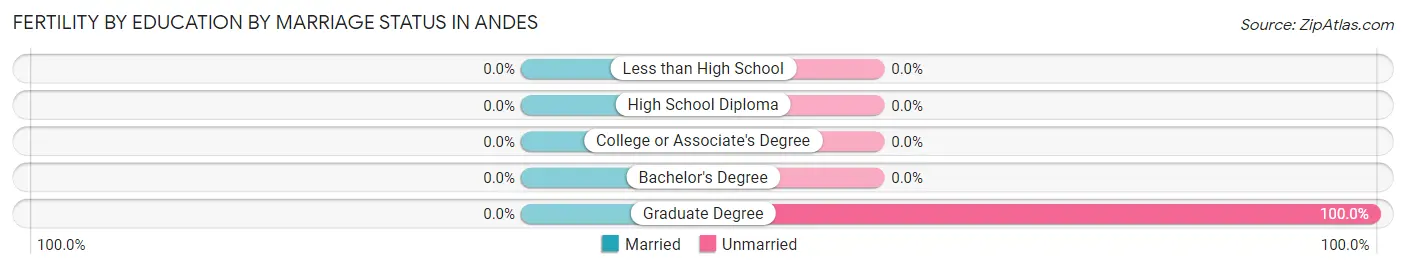
| Educational Attainment | Married | Unmarried |
| Less than High School | 0 (0.0%) | 0 (0.0%) |
| High School Diploma | 0 (0.0%) | 0 (0.0%) |
| College or Associate's Degree | 0 (0.0%) | 0 (0.0%) |
| Bachelor's Degree | 0 (0.0%) | 0 (0.0%) |
| Graduate Degree | 0 (0.0%) | 3 (100.0%) |
| Total | 0 (0.0%) | 3 (100.0%) |
Employment Characteristics in Andes
Employment by Class of Employer in Andes
Among the 51 employed individuals in Andes, private company employees (23 | 45.1%), state government employees (11 | 21.6%), and local government employees (10 | 19.6%) make up the most common classes of employment.
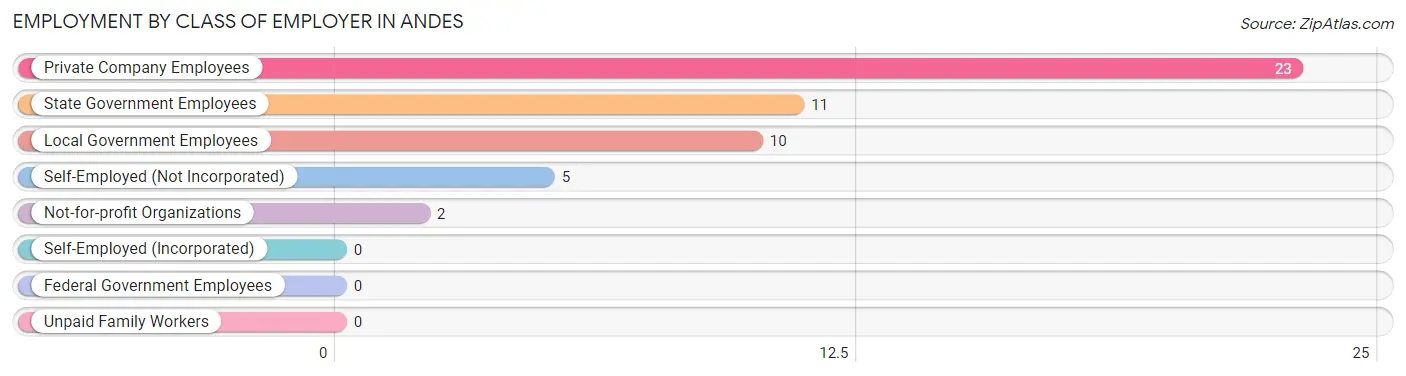
| Employer Class | # Employees | % Employees |
| Private Company Employees | 23 | 45.1% |
| Self-Employed (Incorporated) | 0 | 0.0% |
| Self-Employed (Not Incorporated) | 5 | 9.8% |
| Not-for-profit Organizations | 2 | 3.9% |
| Local Government Employees | 10 | 19.6% |
| State Government Employees | 11 | 21.6% |
| Federal Government Employees | 0 | 0.0% |
| Unpaid Family Workers | 0 | 0.0% |
| Total | 51 | 100.0% |
Employment Status by Age in Andes
According to the labor force statistics for Andes, out of the total population over 16 years of age (110), 51.8% or 57 individuals are in the labor force, with 10.5% or 6 of them unemployed. The age group with the highest labor force participation rate is 25 to 29 years, with 100.0% or 8 individuals in the labor force. Within the labor force, the 30 to 34 years age range has the highest percentage of unemployed individuals, with 100.0% or 6 of them being unemployed.
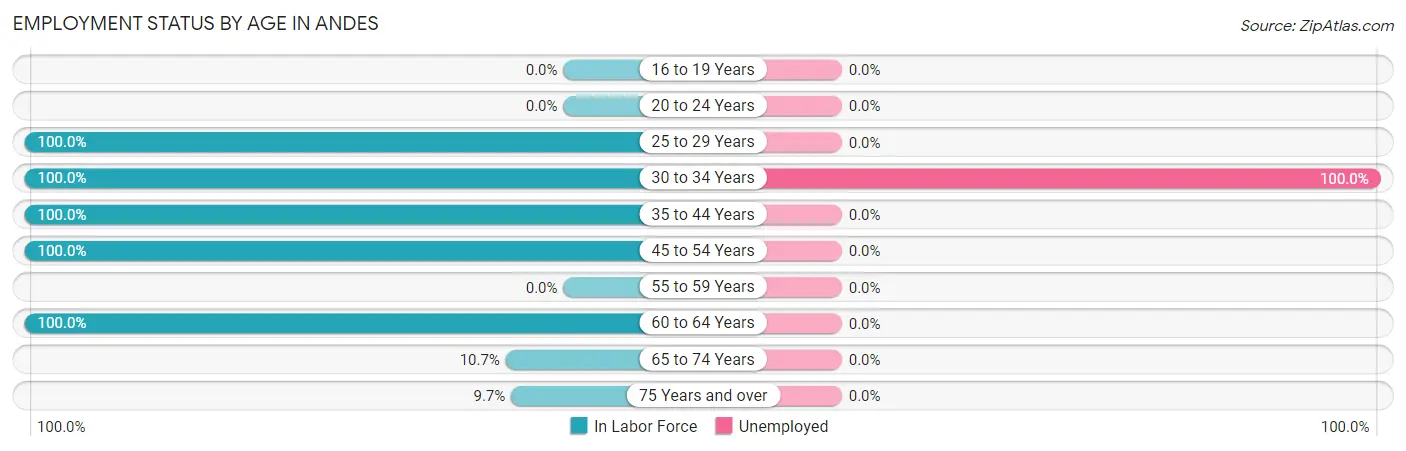
| Age Bracket | In Labor Force | Unemployed |
| 16 to 19 Years | 0 (0.0%) | 0 (0.0%) |
| 20 to 24 Years | 0 (0.0%) | 0 (0.0%) |
| 25 to 29 Years | 8 (100.0%) | 0 (0.0%) |
| 30 to 34 Years | 6 (100.0%) | 6 (100.0%) |
| 35 to 44 Years | 22 (100.0%) | 0 (0.0%) |
| 45 to 54 Years | 12 (100.0%) | 0 (0.0%) |
| 55 to 59 Years | 0 (0.0%) | 0 (0.0%) |
| 60 to 64 Years | 3 (100.0%) | 0 (0.0%) |
| 65 to 74 Years | 3 (10.7%) | 0 (0.0%) |
| 75 Years and over | 3 (9.7%) | 0 (0.0%) |
| Total | 57 (51.8%) | 6 (10.5%) |
Employment Status by Educational Attainment in Andes
According to labor force statistics for Andes, 100.0% of individuals (51) out of the total population between 25 and 64 years of age (51) are in the labor force, with 11.8% or 6 of them being unemployed. The group with the highest labor force participation rate are those with the educational attainment of less than high school, with 100.0% or 2 individuals in the labor force. Within the labor force, individuals with bachelor's degree or higher education have the highest percentage of unemployment, with 27.3% or 6 of them being unemployed.
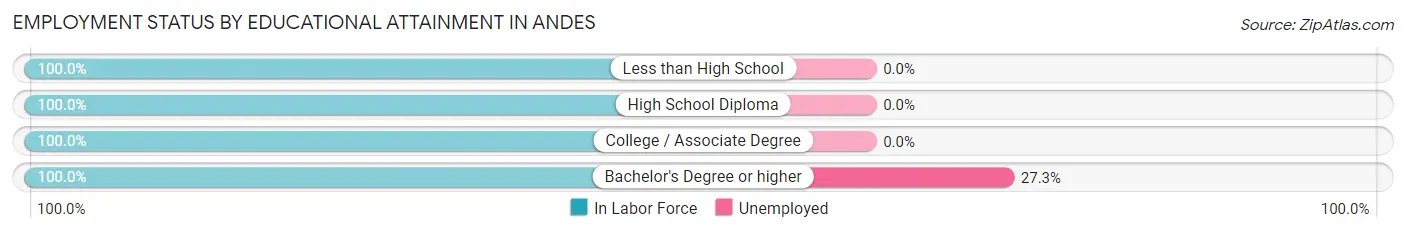
| Educational Attainment | In Labor Force | Unemployed |
| Less than High School | 2 (100.0%) | 0 (0.0%) |
| High School Diploma | 17 (100.0%) | 0 (0.0%) |
| College / Associate Degree | 10 (100.0%) | 0 (0.0%) |
| Bachelor's Degree or higher | 22 (100.0%) | 6 (27.3%) |
| Total | 51 (100.0%) | 6 (11.8%) |
Employment Occupations by Sex in Andes
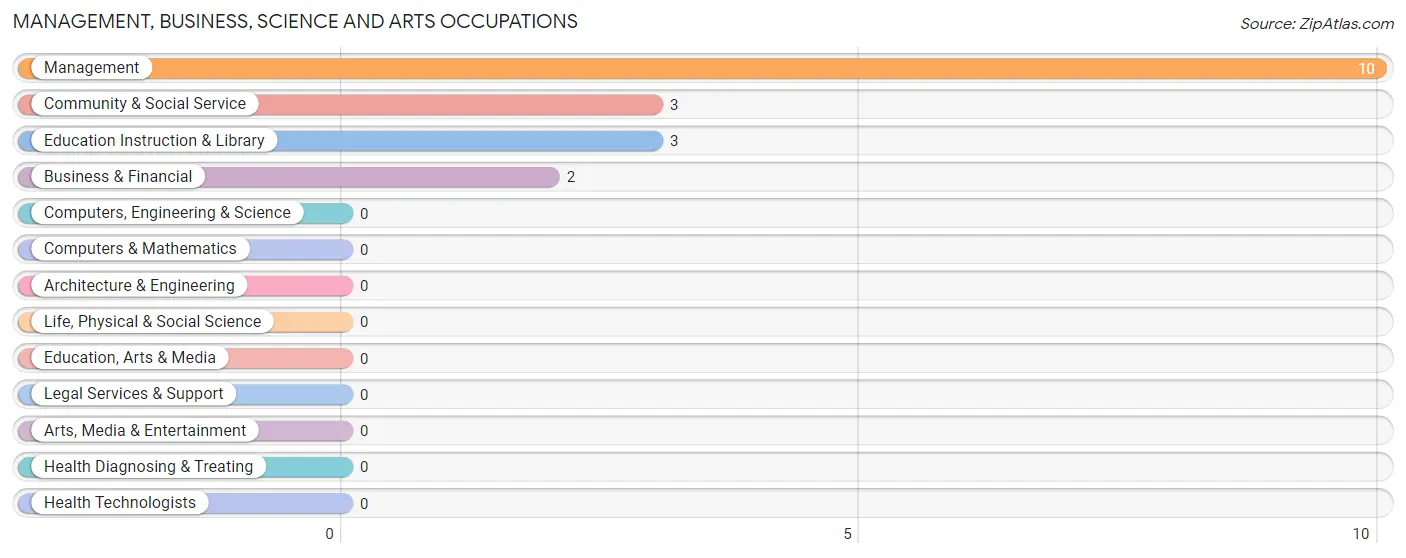
Management, Business, Science and Arts Occupations
The most common Management, Business, Science and Arts occupations in Andes are Management (10 | 19.6%), Community & Social Service (3 | 5.9%), Education Instruction & Library (3 | 5.9%), and Business & Financial (2 | 3.9%).
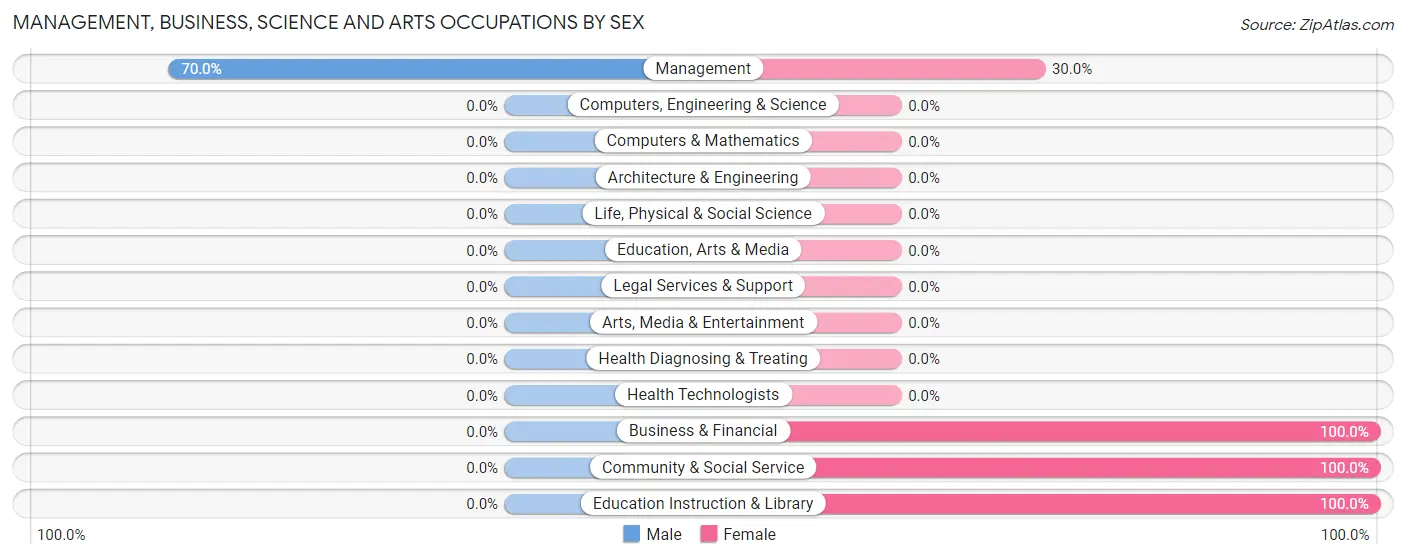
Management, Business, Science and Arts Occupations by Sex
| Occupation | Male | Female |
| Management | 7 (70.0%) | 3 (30.0%) |
| Business & Financial | 0 (0.0%) | 2 (100.0%) |
| Computers, Engineering & Science | 0 (0.0%) | 0 (0.0%) |
| Computers & Mathematics | 0 (0.0%) | 0 (0.0%) |
| Architecture & Engineering | 0 (0.0%) | 0 (0.0%) |
| Life, Physical & Social Science | 0 (0.0%) | 0 (0.0%) |
| Community & Social Service | 0 (0.0%) | 3 (100.0%) |
| Education, Arts & Media | 0 (0.0%) | 0 (0.0%) |
| Legal Services & Support | 0 (0.0%) | 0 (0.0%) |
| Education Instruction & Library | 0 (0.0%) | 3 (100.0%) |
| Arts, Media & Entertainment | 0 (0.0%) | 0 (0.0%) |
| Health Diagnosing & Treating | 0 (0.0%) | 0 (0.0%) |
| Health Technologists | 0 (0.0%) | 0 (0.0%) |
| Total (Category) | 7 (46.7%) | 8 (53.3%) |
| Total (Overall) | 34 (66.7%) | 17 (33.3%) |
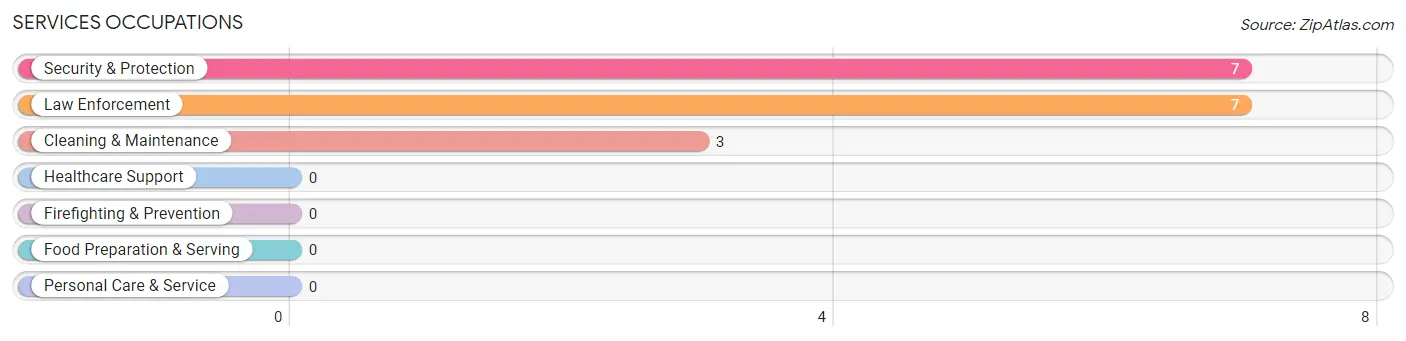
Services Occupations
The most common Services occupations in Andes are Security & Protection (7 | 13.7%), Law Enforcement (7 | 13.7%), and Cleaning & Maintenance (3 | 5.9%).
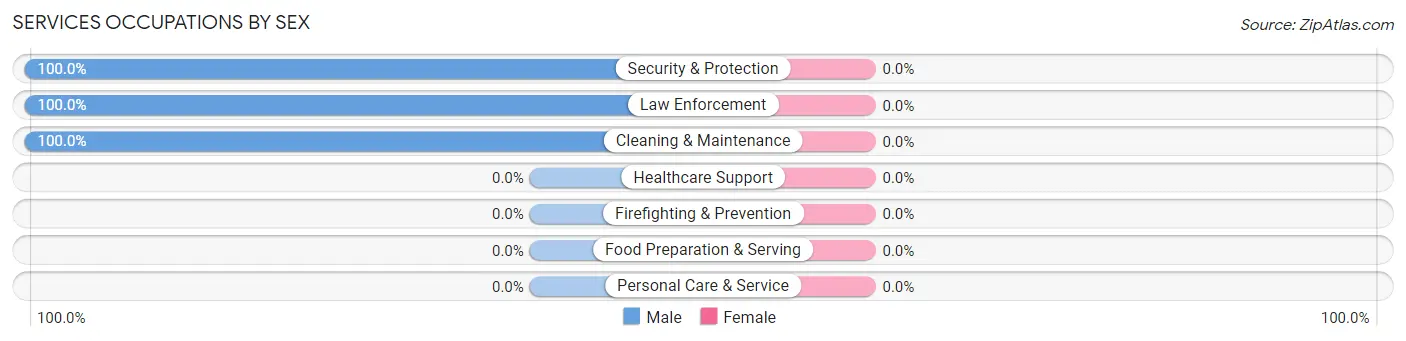
Services Occupations by Sex
| Occupation | Male | Female |
| Healthcare Support | 0 (0.0%) | 0 (0.0%) |
| Security & Protection | 7 (100.0%) | 0 (0.0%) |
| Firefighting & Prevention | 0 (0.0%) | 0 (0.0%) |
| Law Enforcement | 7 (100.0%) | 0 (0.0%) |
| Food Preparation & Serving | 0 (0.0%) | 0 (0.0%) |
| Cleaning & Maintenance | 3 (100.0%) | 0 (0.0%) |
| Personal Care & Service | 0 (0.0%) | 0 (0.0%) |
| Total (Category) | 10 (100.0%) | 0 (0.0%) |
| Total (Overall) | 34 (66.7%) | 17 (33.3%) |
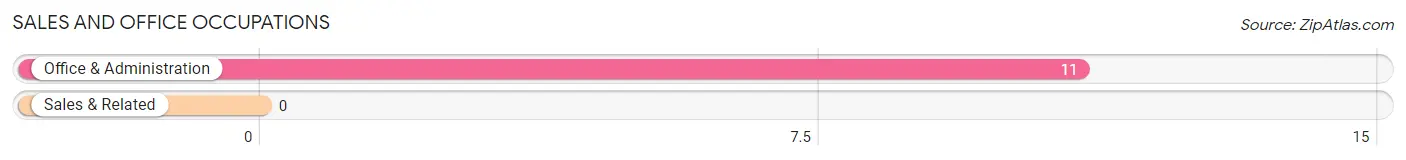
Sales and Office Occupations
The most common Sales and Office occupations in Andes are , and Office & Administration (11 | 21.6%).
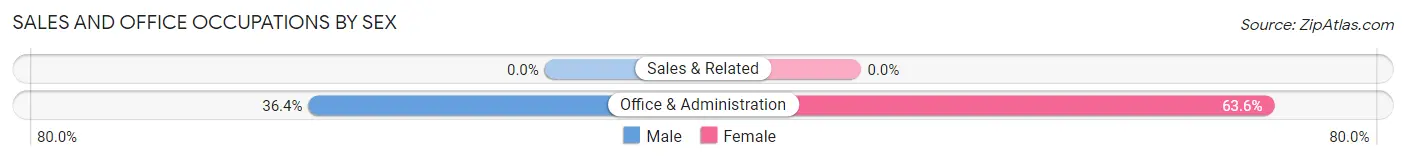
Sales and Office Occupations by Sex
| Occupation | Male | Female |
| Sales & Related | 0 (0.0%) | 0 (0.0%) |
| Office & Administration | 4 (36.4%) | 7 (63.6%) |
| Total (Category) | 4 (36.4%) | 7 (63.6%) |
| Total (Overall) | 34 (66.7%) | 17 (33.3%) |
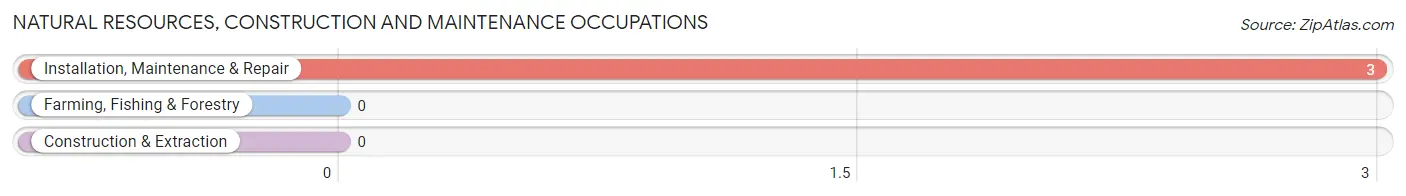
Natural Resources, Construction and Maintenance Occupations
The most common Natural Resources, Construction and Maintenance occupations in Andes are , and Installation, Maintenance & Repair (3 | 5.9%).
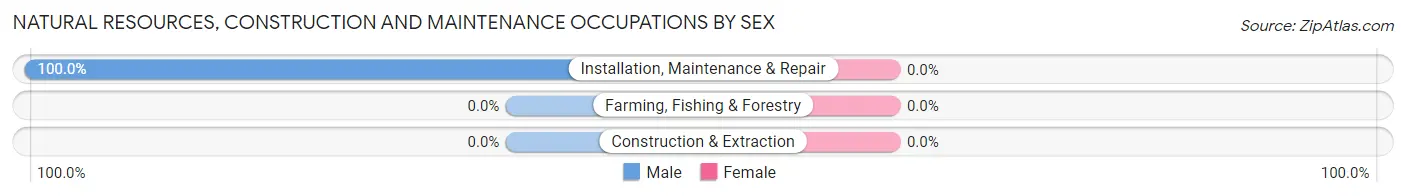
Natural Resources, Construction and Maintenance Occupations by Sex
| Occupation | Male | Female |
| Farming, Fishing & Forestry | 0 (0.0%) | 0 (0.0%) |
| Construction & Extraction | 0 (0.0%) | 0 (0.0%) |
| Installation, Maintenance & Repair | 3 (100.0%) | 0 (0.0%) |
| Total (Category) | 3 (100.0%) | 0 (0.0%) |
| Total (Overall) | 34 (66.7%) | 17 (33.3%) |
Production, Transportation and Moving Occupations
The most common Production, Transportation and Moving occupations in Andes are Material Moving (10 | 19.6%), and Production (2 | 3.9%).
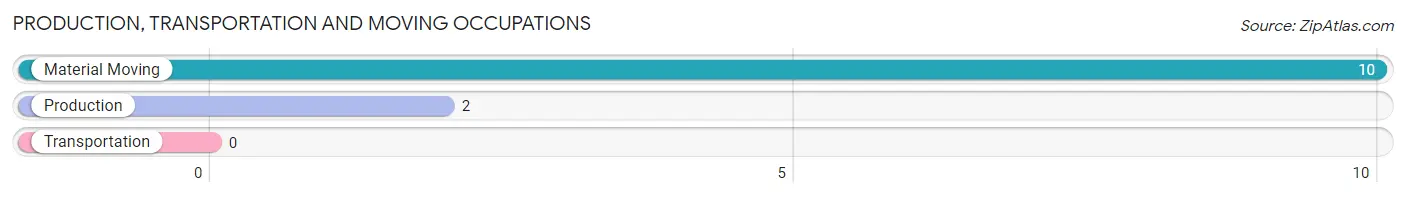
Production, Transportation and Moving Occupations by Sex
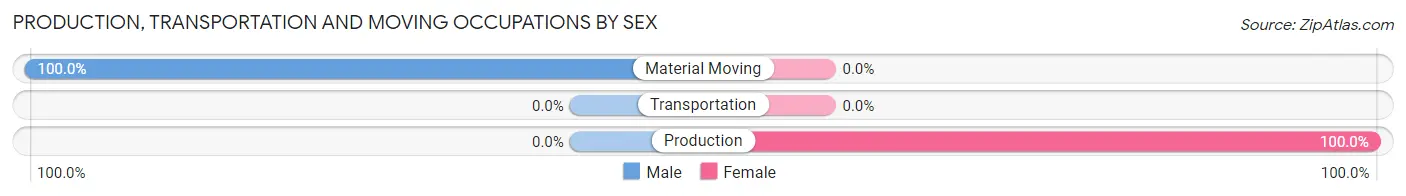
| Occupation | Male | Female |
| Production | 0 (0.0%) | 2 (100.0%) |
| Transportation | 0 (0.0%) | 0 (0.0%) |
| Material Moving | 10 (100.0%) | 0 (0.0%) |
| Total (Category) | 10 (83.3%) | 2 (16.7%) |
| Total (Overall) | 34 (66.7%) | 17 (33.3%) |
Employment Industries by Sex in Andes
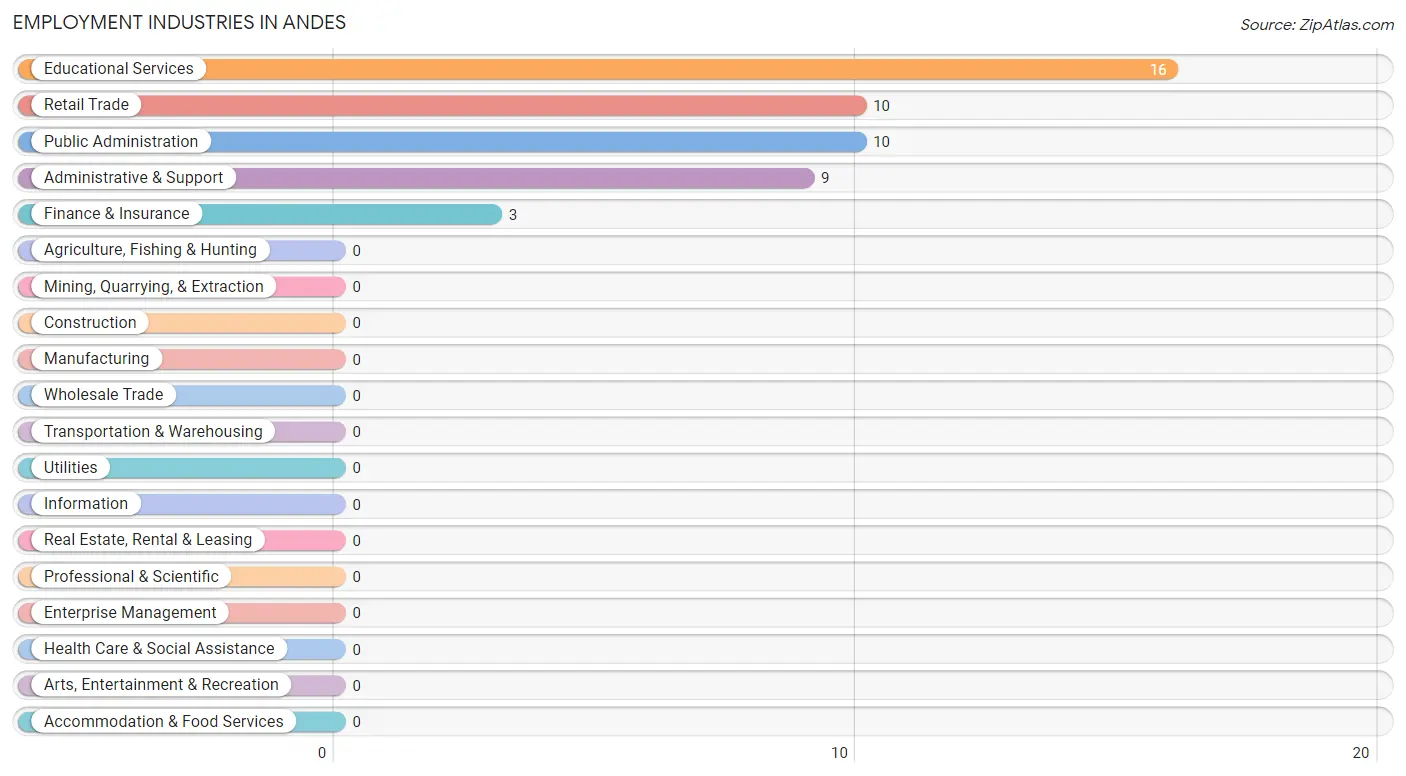
Employment Industries in Andes
The major employment industries in Andes include Educational Services (16 | 31.4%), Retail Trade (10 | 19.6%), Public Administration (10 | 19.6%), Administrative & Support (9 | 17.6%), and Finance & Insurance (3 | 5.9%).
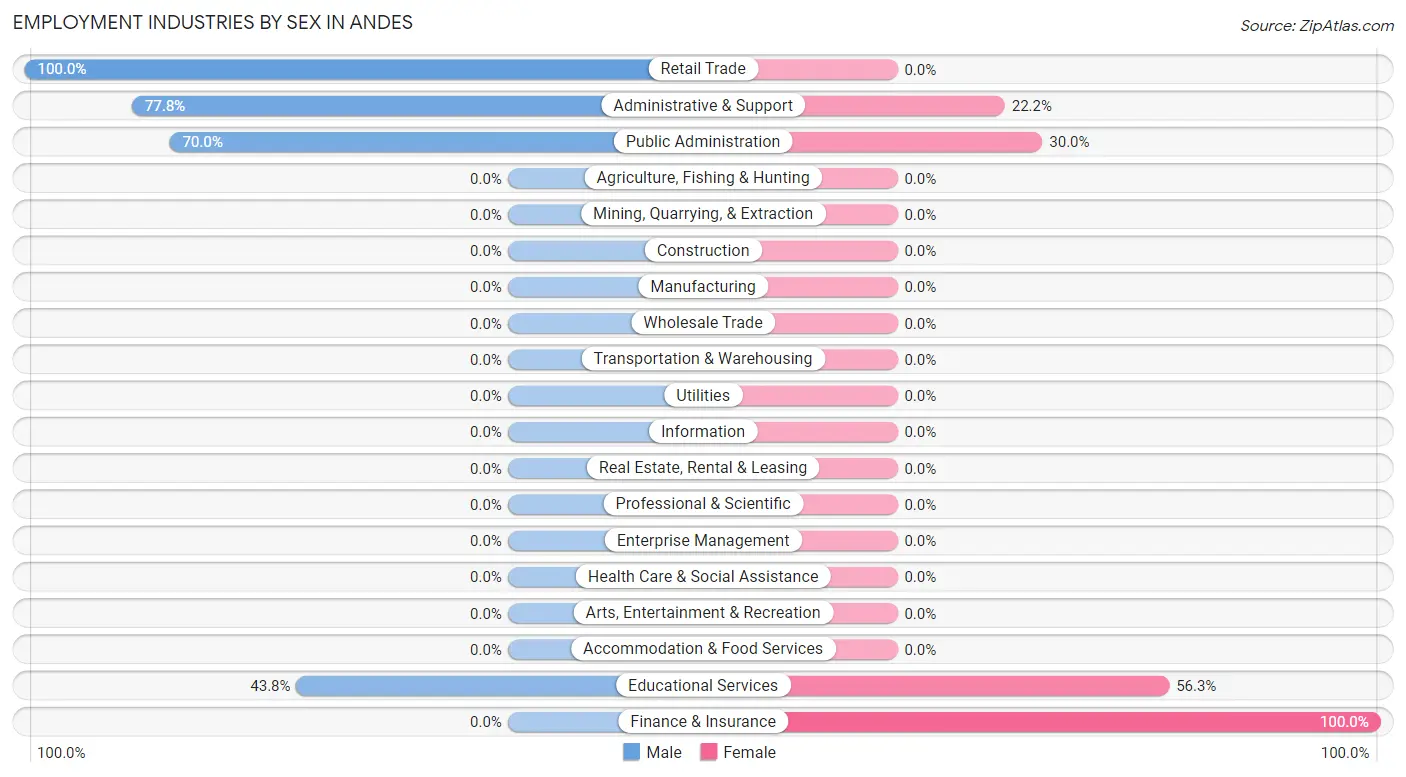
Employment Industries by Sex in Andes
The Andes industries that see more men than women are Retail Trade (100.0%), Administrative & Support (77.8%), and Public Administration (70.0%), whereas the industries that tend to have a higher number of women are Finance & Insurance (100.0%), Educational Services (56.2%), and Public Administration (30.0%).
| Industry | Male | Female |
| Agriculture, Fishing & Hunting | 0 (0.0%) | 0 (0.0%) |
| Mining, Quarrying, & Extraction | 0 (0.0%) | 0 (0.0%) |
| Construction | 0 (0.0%) | 0 (0.0%) |
| Manufacturing | 0 (0.0%) | 0 (0.0%) |
| Wholesale Trade | 0 (0.0%) | 0 (0.0%) |
| Retail Trade | 10 (100.0%) | 0 (0.0%) |
| Transportation & Warehousing | 0 (0.0%) | 0 (0.0%) |
| Utilities | 0 (0.0%) | 0 (0.0%) |
| Information | 0 (0.0%) | 0 (0.0%) |
| Finance & Insurance | 0 (0.0%) | 3 (100.0%) |
| Real Estate, Rental & Leasing | 0 (0.0%) | 0 (0.0%) |
| Professional & Scientific | 0 (0.0%) | 0 (0.0%) |
| Enterprise Management | 0 (0.0%) | 0 (0.0%) |
| Administrative & Support | 7 (77.8%) | 2 (22.2%) |
| Educational Services | 7 (43.8%) | 9 (56.2%) |
| Health Care & Social Assistance | 0 (0.0%) | 0 (0.0%) |
| Arts, Entertainment & Recreation | 0 (0.0%) | 0 (0.0%) |
| Accommodation & Food Services | 0 (0.0%) | 0 (0.0%) |
| Public Administration | 7 (70.0%) | 3 (30.0%) |
| Total | 34 (66.7%) | 17 (33.3%) |
Education in Andes
School Enrollment in Andes
The most common levels of schooling among the 6 students in Andes are graduate / professional (4 | 66.7%), and elementary school (2 | 33.3%).
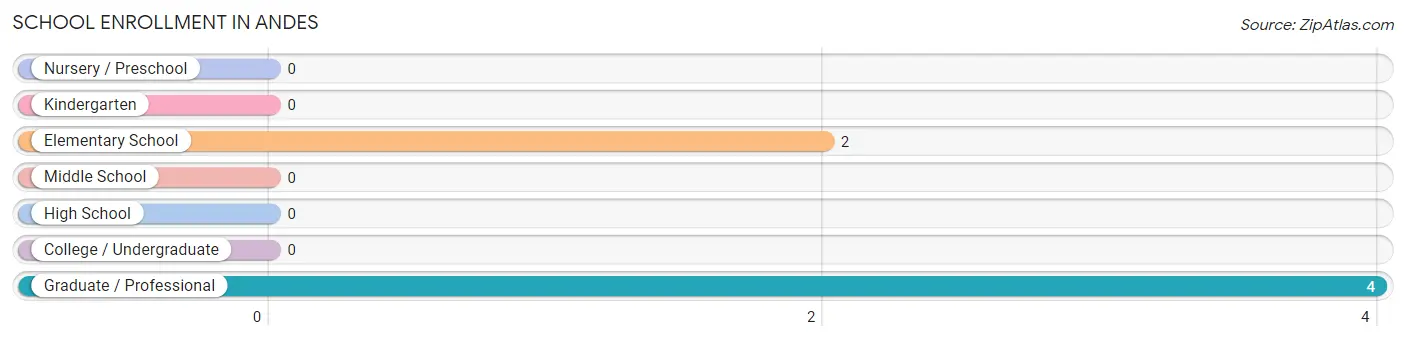
| School Level | # Students | % Students |
| Nursery / Preschool | 0 | 0.0% |
| Kindergarten | 0 | 0.0% |
| Elementary School | 2 | 33.3% |
| Middle School | 0 | 0.0% |
| High School | 0 | 0.0% |
| College / Undergraduate | 0 | 0.0% |
| Graduate / Professional | 4 | 66.7% |
| Total | 6 | 100.0% |
School Enrollment by Age by Funding Source in Andes
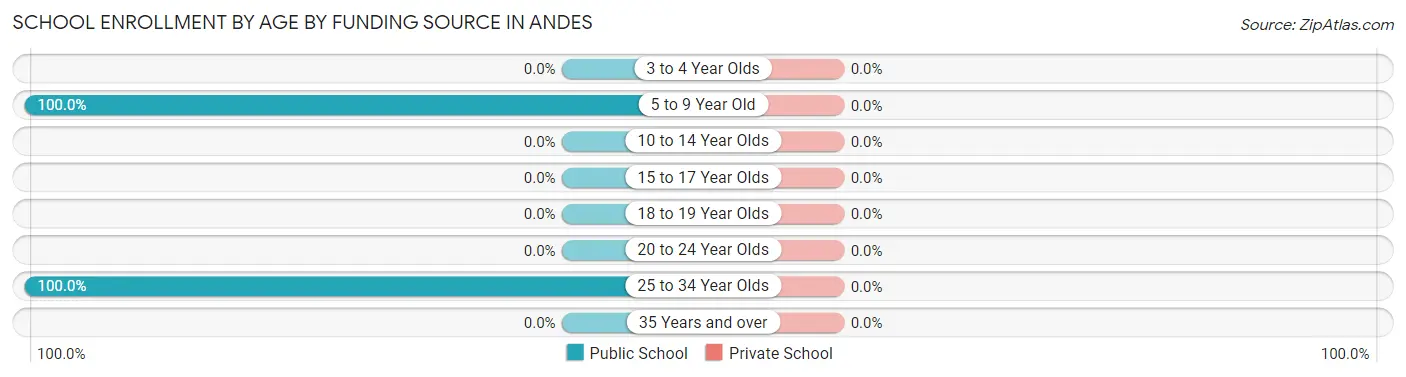
| Age Bracket | Public School | Private School |
| 3 to 4 Year Olds | 0 (0.0%) | 0 (0.0%) |
| 5 to 9 Year Old | 2 (100.0%) | 0 (0.0%) |
| 10 to 14 Year Olds | 0 (0.0%) | 0 (0.0%) |
| 15 to 17 Year Olds | 0 (0.0%) | 0 (0.0%) |
| 18 to 19 Year Olds | 0 (0.0%) | 0 (0.0%) |
| 20 to 24 Year Olds | 0 (0.0%) | 0 (0.0%) |
| 25 to 34 Year Olds | 4 (100.0%) | 0 (0.0%) |
| 35 Years and over | 0 (0.0%) | 0 (0.0%) |
| Total | 6 (100.0%) | 0 (0.0%) |
Educational Attainment by Field of Study in Andes
Business (13 | 32.5%), social sciences (6 | 15.0%), visual & performing arts (6 | 15.0%), engineering (4 | 10.0%), and psychology (3 | 7.5%) are the most common fields of study among 40 individuals in Andes who have obtained a bachelor's degree or higher.
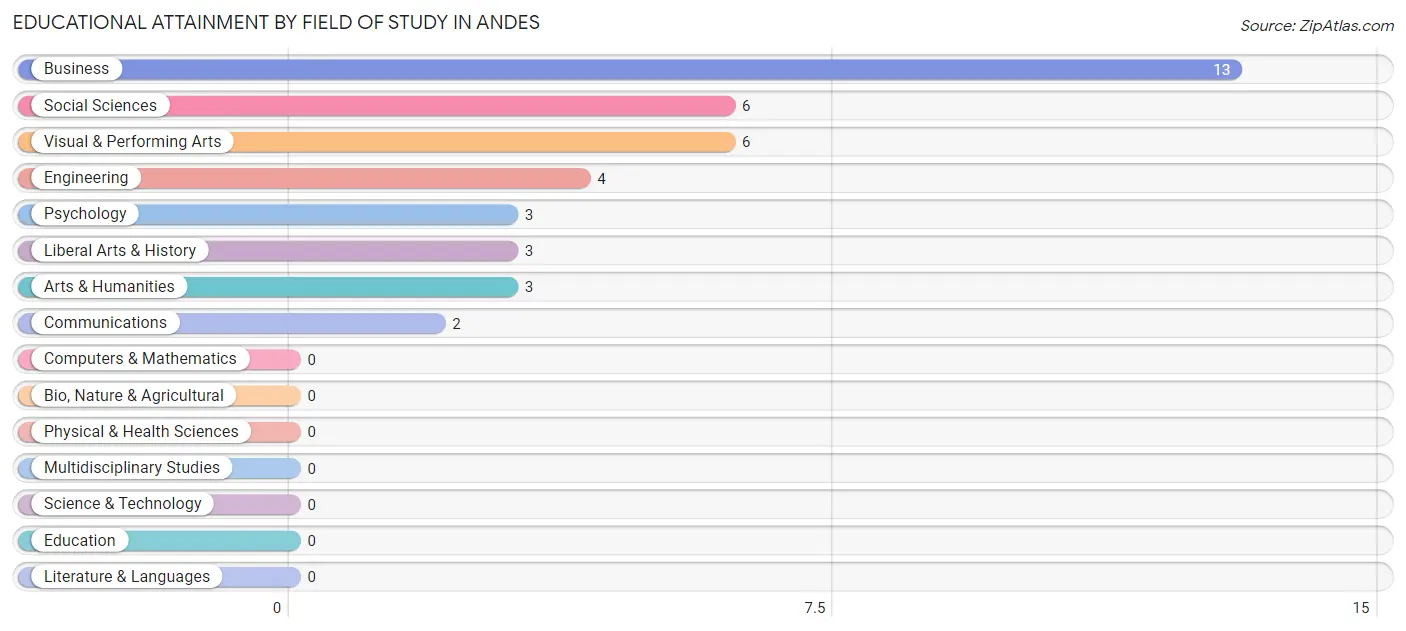
| Field of Study | # Graduates | % Graduates |
| Computers & Mathematics | 0 | 0.0% |
| Bio, Nature & Agricultural | 0 | 0.0% |
| Physical & Health Sciences | 0 | 0.0% |
| Psychology | 3 | 7.5% |
| Social Sciences | 6 | 15.0% |
| Engineering | 4 | 10.0% |
| Multidisciplinary Studies | 0 | 0.0% |
| Science & Technology | 0 | 0.0% |
| Business | 13 | 32.5% |
| Education | 0 | 0.0% |
| Literature & Languages | 0 | 0.0% |
| Liberal Arts & History | 3 | 7.5% |
| Visual & Performing Arts | 6 | 15.0% |
| Communications | 2 | 5.0% |
| Arts & Humanities | 3 | 7.5% |
| Total | 40 | 100.0% |
Transportation & Commute in Andes
Vehicle Availability by Sex in Andes
The most prevalent vehicle ownership categories in Andes are males with 1 vehicle (24, accounting for 70.6%) and females with 1 vehicle (5, making up 141.2%).
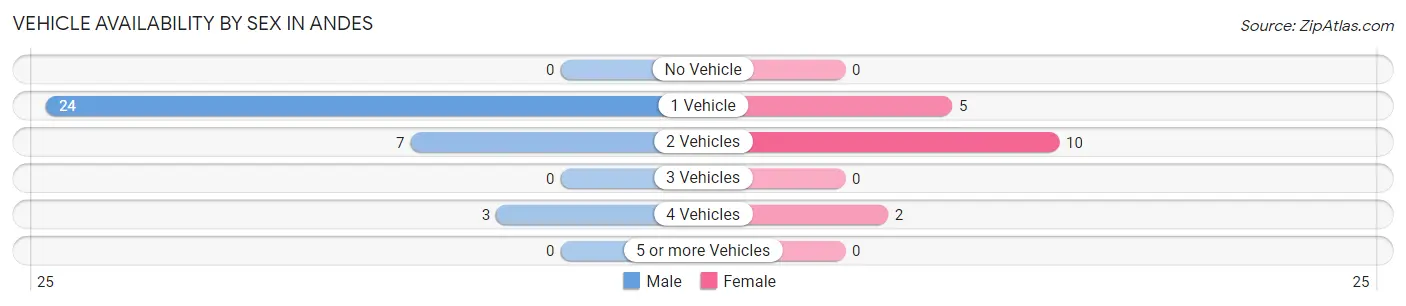
| Vehicles Available | Male | Female |
| No Vehicle | 0 (0.0%) | 0 (0.0%) |
| 1 Vehicle | 24 (70.6%) | 5 (29.4%) |
| 2 Vehicles | 7 (20.6%) | 10 (58.8%) |
| 3 Vehicles | 0 (0.0%) | 0 (0.0%) |
| 4 Vehicles | 3 (8.8%) | 2 (11.8%) |
| 5 or more Vehicles | 0 (0.0%) | 0 (0.0%) |
| Total | 34 (100.0%) | 17 (100.0%) |
Commute Time in Andes
The most frequently occuring commute durations in Andes are 10 to 14 minutes (10 commuters, 25.6%), 25 to 29 minutes (9 commuters, 23.1%), and 15 to 19 minutes (8 commuters, 20.5%).
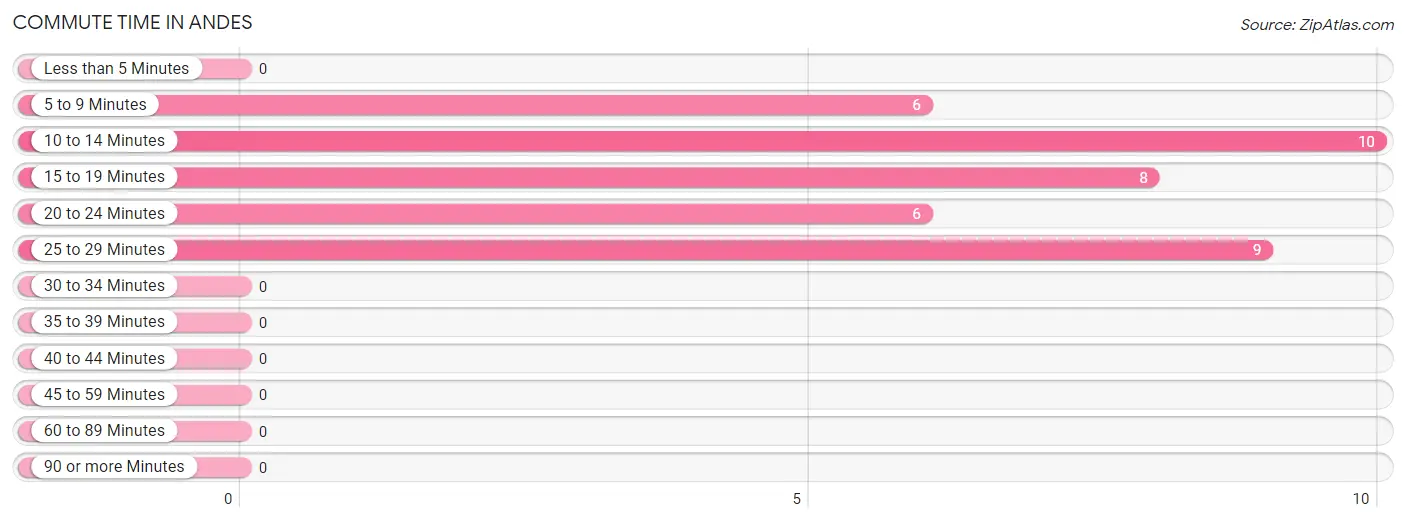
| Commute Time | # Commuters | % Commuters |
| Less than 5 Minutes | 0 | 0.0% |
| 5 to 9 Minutes | 6 | 15.4% |
| 10 to 14 Minutes | 10 | 25.6% |
| 15 to 19 Minutes | 8 | 20.5% |
| 20 to 24 Minutes | 6 | 15.4% |
| 25 to 29 Minutes | 9 | 23.1% |
| 30 to 34 Minutes | 0 | 0.0% |
| 35 to 39 Minutes | 0 | 0.0% |
| 40 to 44 Minutes | 0 | 0.0% |
| 45 to 59 Minutes | 0 | 0.0% |
| 60 to 89 Minutes | 0 | 0.0% |
| 90 or more Minutes | 0 | 0.0% |
Commute Time by Sex in Andes
The most common commute times in Andes are 10 to 14 minutes (10 commuters, 37.0%) for males and 15 to 19 minutes (4 commuters, 33.3%) for females.
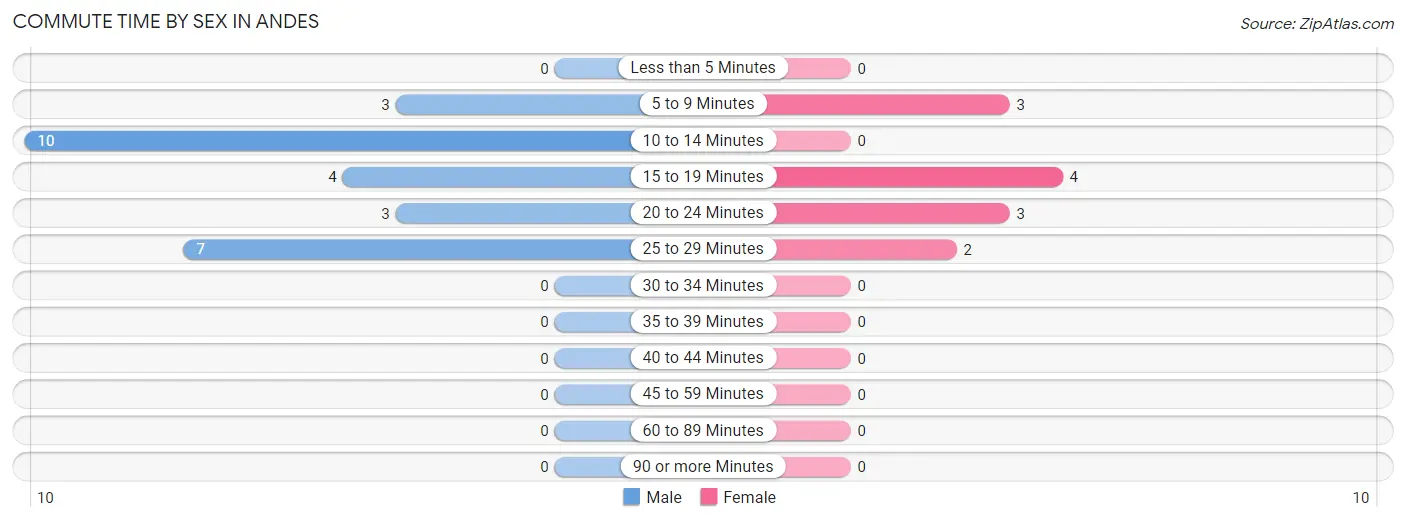
| Commute Time | Male | Female |
| Less than 5 Minutes | 0 (0.0%) | 0 (0.0%) |
| 5 to 9 Minutes | 3 (11.1%) | 3 (25.0%) |
| 10 to 14 Minutes | 10 (37.0%) | 0 (0.0%) |
| 15 to 19 Minutes | 4 (14.8%) | 4 (33.3%) |
| 20 to 24 Minutes | 3 (11.1%) | 3 (25.0%) |
| 25 to 29 Minutes | 7 (25.9%) | 2 (16.7%) |
| 30 to 34 Minutes | 0 (0.0%) | 0 (0.0%) |
| 35 to 39 Minutes | 0 (0.0%) | 0 (0.0%) |
| 40 to 44 Minutes | 0 (0.0%) | 0 (0.0%) |
| 45 to 59 Minutes | 0 (0.0%) | 0 (0.0%) |
| 60 to 89 Minutes | 0 (0.0%) | 0 (0.0%) |
| 90 or more Minutes | 0 (0.0%) | 0 (0.0%) |
Time of Departure to Work by Sex in Andes
The most frequent times of departure to work in Andes are 5:30 AM to 5:59 AM (13, 48.1%) for males and 8:00 AM to 8:29 AM (4, 33.3%) for females.
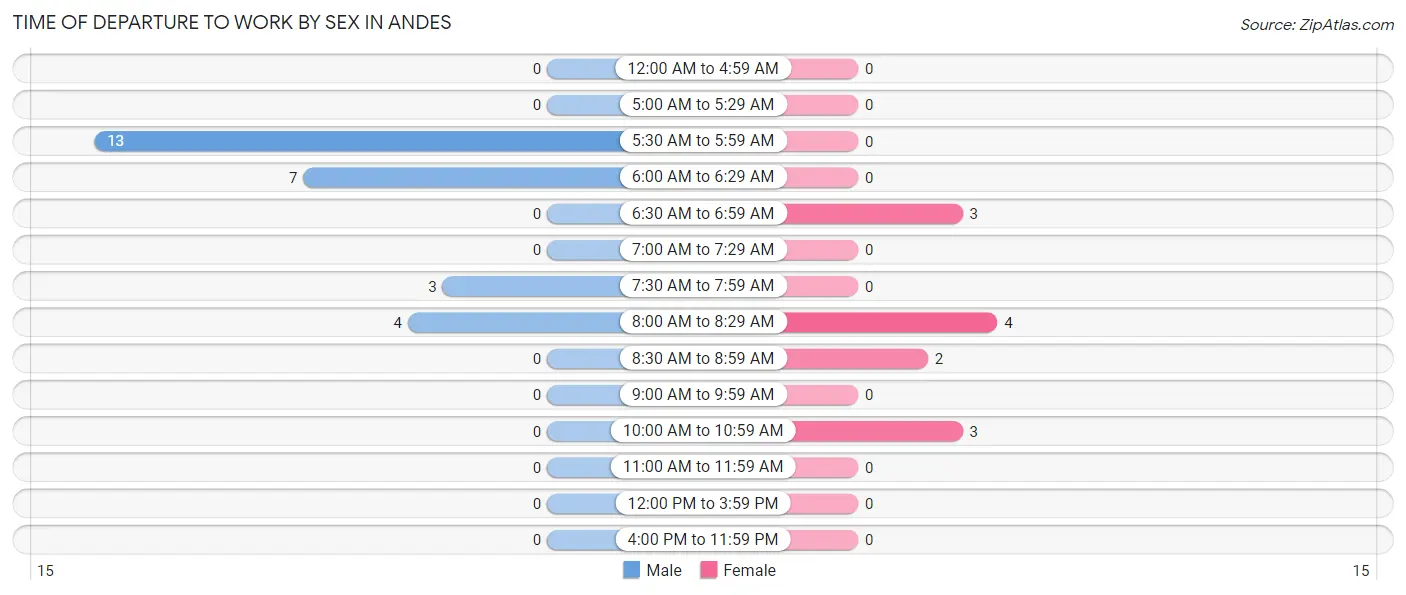
| Time of Departure | Male | Female |
| 12:00 AM to 4:59 AM | 0 (0.0%) | 0 (0.0%) |
| 5:00 AM to 5:29 AM | 0 (0.0%) | 0 (0.0%) |
| 5:30 AM to 5:59 AM | 13 (48.1%) | 0 (0.0%) |
| 6:00 AM to 6:29 AM | 7 (25.9%) | 0 (0.0%) |
| 6:30 AM to 6:59 AM | 0 (0.0%) | 3 (25.0%) |
| 7:00 AM to 7:29 AM | 0 (0.0%) | 0 (0.0%) |
| 7:30 AM to 7:59 AM | 3 (11.1%) | 0 (0.0%) |
| 8:00 AM to 8:29 AM | 4 (14.8%) | 4 (33.3%) |
| 8:30 AM to 8:59 AM | 0 (0.0%) | 2 (16.7%) |
| 9:00 AM to 9:59 AM | 0 (0.0%) | 0 (0.0%) |
| 10:00 AM to 10:59 AM | 0 (0.0%) | 3 (25.0%) |
| 11:00 AM to 11:59 AM | 0 (0.0%) | 0 (0.0%) |
| 12:00 PM to 3:59 PM | 0 (0.0%) | 0 (0.0%) |
| 4:00 PM to 11:59 PM | 0 (0.0%) | 0 (0.0%) |
| Total | 27 (100.0%) | 12 (100.0%) |
Housing Occupancy in Andes
Occupancy by Ownership in Andes
Of the total 84 dwellings in Andes, owner-occupied units account for 60 (71.4%), while renter-occupied units make up 24 (28.6%).
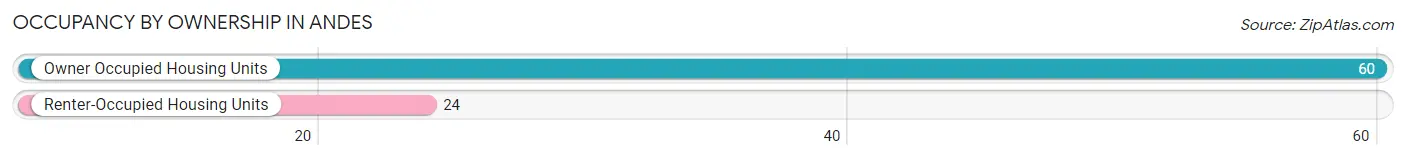
| Occupancy | # Housing Units | % Housing Units |
| Owner Occupied Housing Units | 60 | 71.4% |
| Renter-Occupied Housing Units | 24 | 28.6% |
| Total Occupied Housing Units | 84 | 100.0% |
Occupancy by Household Size in Andes
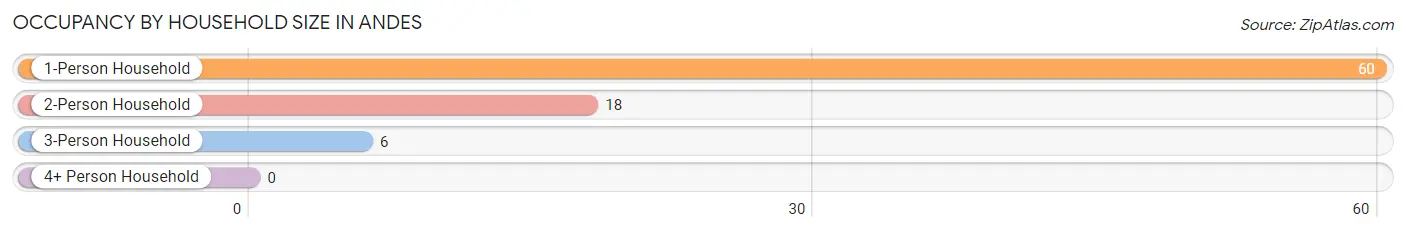
| Household Size | # Housing Units | % Housing Units |
| 1-Person Household | 60 | 71.4% |
| 2-Person Household | 18 | 21.4% |
| 3-Person Household | 6 | 7.1% |
| 4+ Person Household | 0 | 0.0% |
| Total Housing Units | 84 | 100.0% |
Occupancy by Ownership by Household Size in Andes
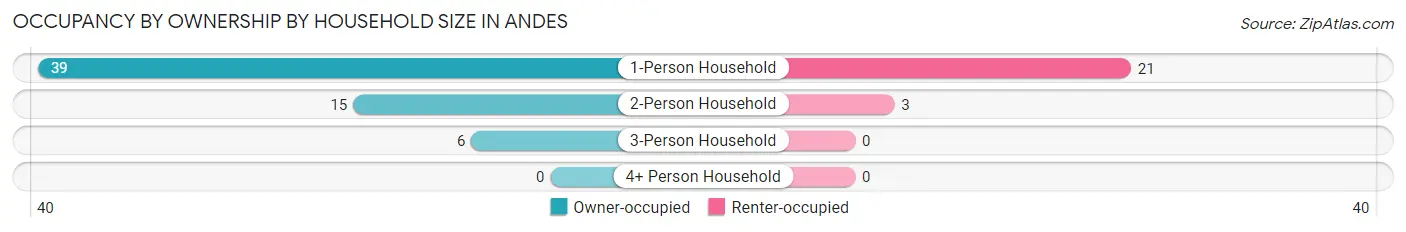
| Household Size | Owner-occupied | Renter-occupied |
| 1-Person Household | 39 (65.0%) | 21 (35.0%) |
| 2-Person Household | 15 (83.3%) | 3 (16.7%) |
| 3-Person Household | 6 (100.0%) | 0 (0.0%) |
| 4+ Person Household | 0 (0.0%) | 0 (0.0%) |
| Total Housing Units | 60 (71.4%) | 24 (28.6%) |
Occupancy by Educational Attainment in Andes
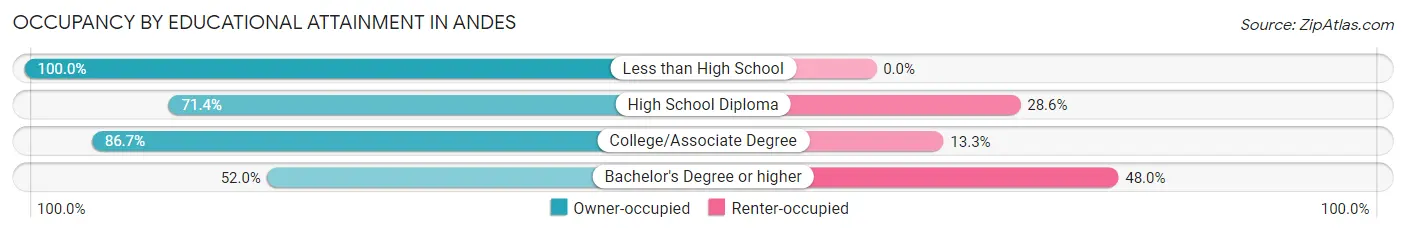
| Household Size | Owner-occupied | Renter-occupied |
| Less than High School | 9 (100.0%) | 0 (0.0%) |
| High School Diploma | 25 (71.4%) | 10 (28.6%) |
| College/Associate Degree | 13 (86.7%) | 2 (13.3%) |
| Bachelor's Degree or higher | 13 (52.0%) | 12 (48.0%) |
Occupancy by Age of Householder in Andes
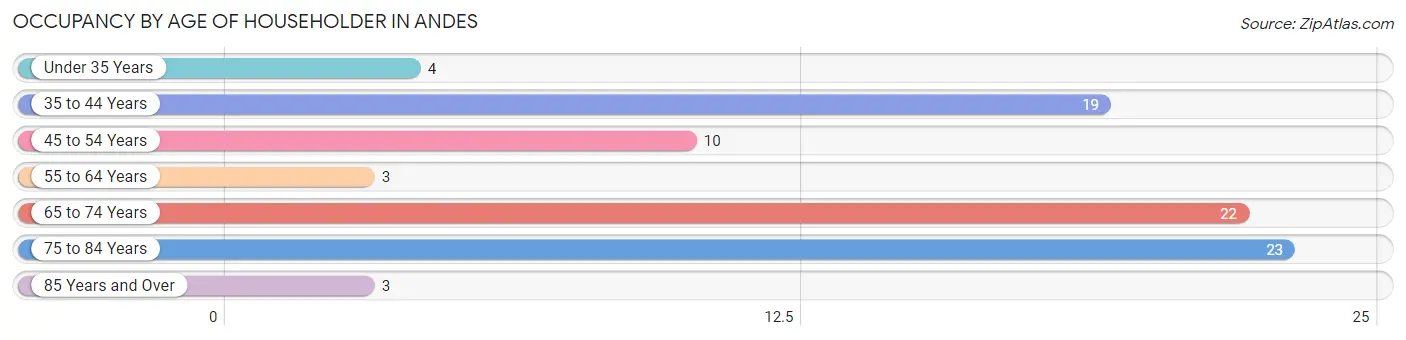
| Age Bracket | # Households | % Households |
| Under 35 Years | 4 | 4.8% |
| 35 to 44 Years | 19 | 22.6% |
| 45 to 54 Years | 10 | 11.9% |
| 55 to 64 Years | 3 | 3.6% |
| 65 to 74 Years | 22 | 26.2% |
| 75 to 84 Years | 23 | 27.4% |
| 85 Years and Over | 3 | 3.6% |
| Total | 84 | 100.0% |
Housing Finances in Andes
Median Income by Occupancy in Andes
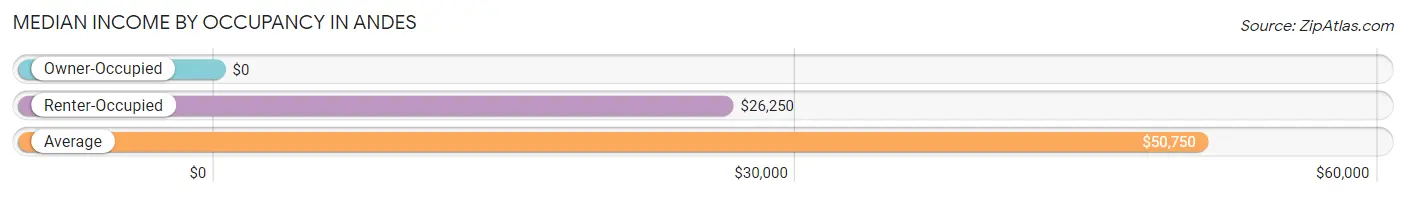
| Occupancy Type | # Households | Median Income |
| Owner-Occupied | 60 (71.4%) | $0 |
| Renter-Occupied | 24 (28.6%) | $26,250 |
| Average | 84 (100.0%) | $50,750 |
Occupancy by Householder Income Bracket in Andes
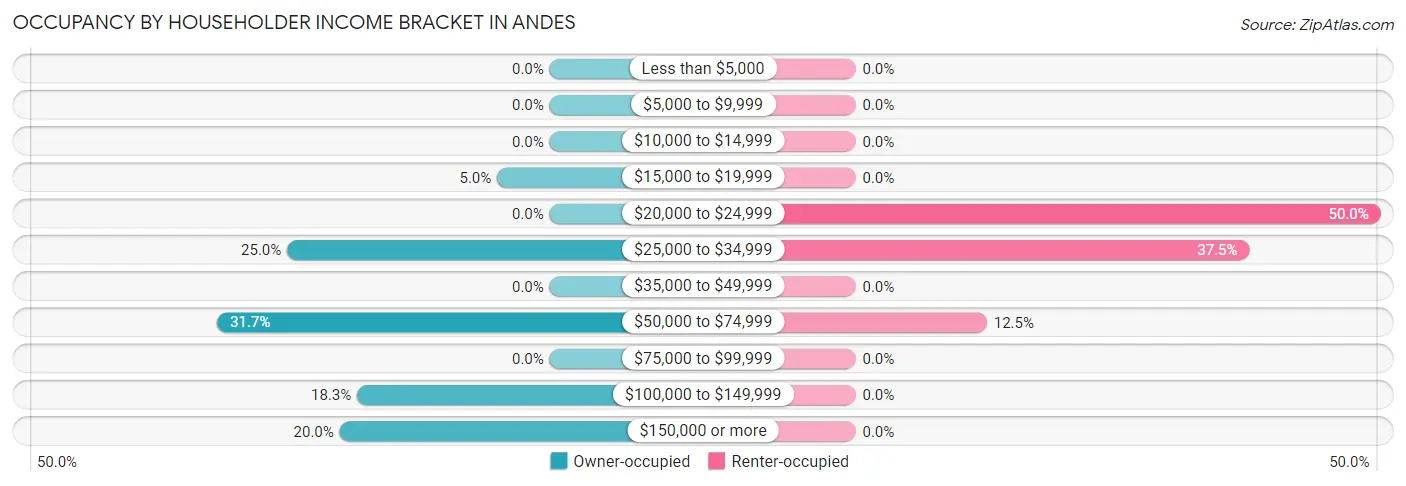
| Income Bracket | Owner-occupied | Renter-occupied |
| Less than $5,000 | 0 (0.0%) | 0 (0.0%) |
| $5,000 to $9,999 | 0 (0.0%) | 0 (0.0%) |
| $10,000 to $14,999 | 0 (0.0%) | 0 (0.0%) |
| $15,000 to $19,999 | 3 (5.0%) | 0 (0.0%) |
| $20,000 to $24,999 | 0 (0.0%) | 12 (50.0%) |
| $25,000 to $34,999 | 15 (25.0%) | 9 (37.5%) |
| $35,000 to $49,999 | 0 (0.0%) | 0 (0.0%) |
| $50,000 to $74,999 | 19 (31.7%) | 3 (12.5%) |
| $75,000 to $99,999 | 0 (0.0%) | 0 (0.0%) |
| $100,000 to $149,999 | 11 (18.3%) | 0 (0.0%) |
| $150,000 or more | 12 (20.0%) | 0 (0.0%) |
| Total | 60 (100.0%) | 24 (100.0%) |
Monthly Housing Cost Tiers in Andes
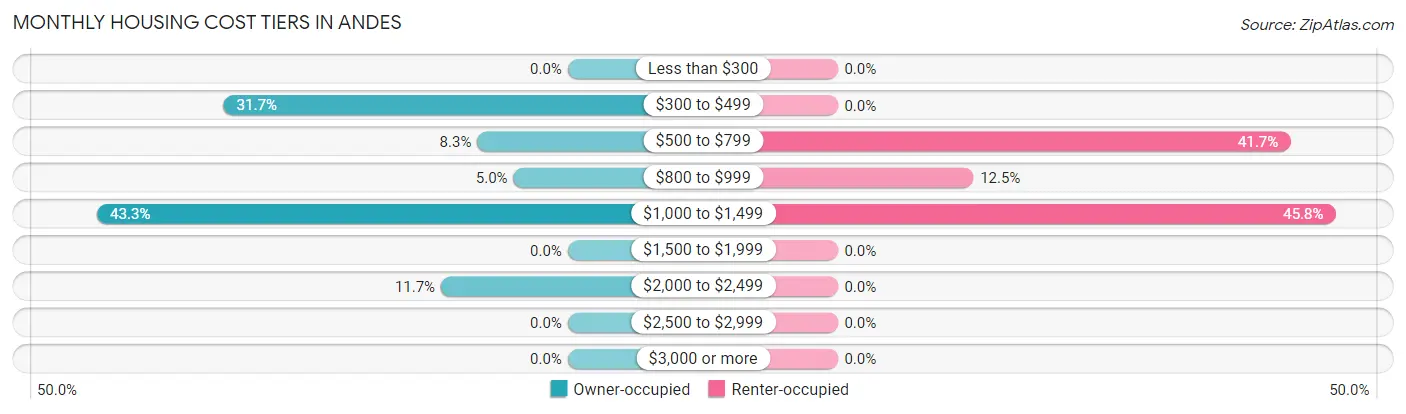
| Monthly Cost | Owner-occupied | Renter-occupied |
| Less than $300 | 0 (0.0%) | 0 (0.0%) |
| $300 to $499 | 19 (31.7%) | 0 (0.0%) |
| $500 to $799 | 5 (8.3%) | 10 (41.7%) |
| $800 to $999 | 3 (5.0%) | 3 (12.5%) |
| $1,000 to $1,499 | 26 (43.3%) | 11 (45.8%) |
| $1,500 to $1,999 | 0 (0.0%) | 0 (0.0%) |
| $2,000 to $2,499 | 7 (11.7%) | 0 (0.0%) |
| $2,500 to $2,999 | 0 (0.0%) | 0 (0.0%) |
| $3,000 or more | 0 (0.0%) | 0 (0.0%) |
| Total | 60 (100.0%) | 24 (100.0%) |
Physical Housing Characteristics in Andes
Housing Structures in Andes
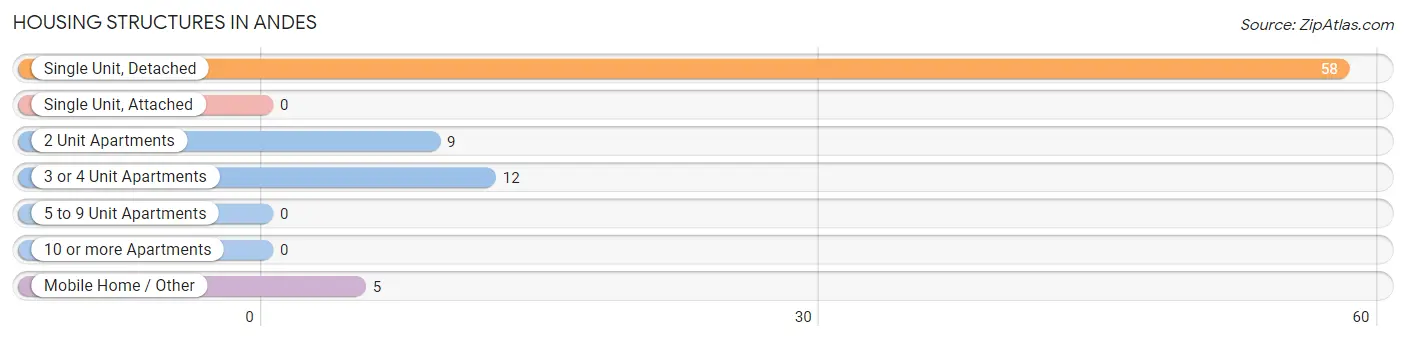
| Structure Type | # Housing Units | % Housing Units |
| Single Unit, Detached | 58 | 69.1% |
| Single Unit, Attached | 0 | 0.0% |
| 2 Unit Apartments | 9 | 10.7% |
| 3 or 4 Unit Apartments | 12 | 14.3% |
| 5 to 9 Unit Apartments | 0 | 0.0% |
| 10 or more Apartments | 0 | 0.0% |
| Mobile Home / Other | 5 | 5.9% |
| Total | 84 | 100.0% |
Housing Structures by Occupancy in Andes
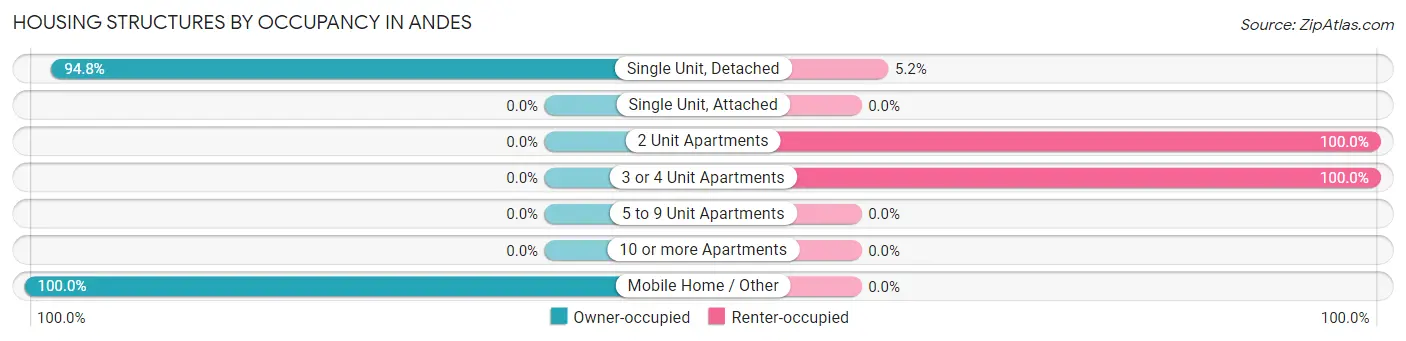
| Structure Type | Owner-occupied | Renter-occupied |
| Single Unit, Detached | 55 (94.8%) | 3 (5.2%) |
| Single Unit, Attached | 0 (0.0%) | 0 (0.0%) |
| 2 Unit Apartments | 0 (0.0%) | 9 (100.0%) |
| 3 or 4 Unit Apartments | 0 (0.0%) | 12 (100.0%) |
| 5 to 9 Unit Apartments | 0 (0.0%) | 0 (0.0%) |
| 10 or more Apartments | 0 (0.0%) | 0 (0.0%) |
| Mobile Home / Other | 5 (100.0%) | 0 (0.0%) |
| Total | 60 (71.4%) | 24 (28.6%) |
Housing Structures by Number of Rooms in Andes
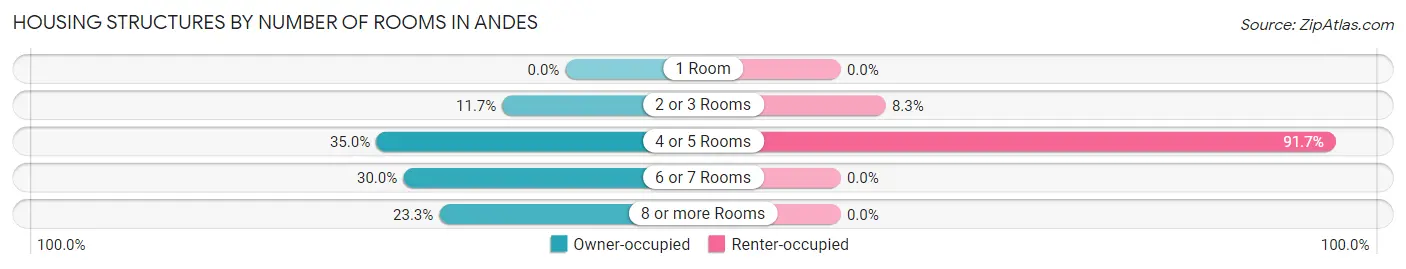
| Number of Rooms | Owner-occupied | Renter-occupied |
| 1 Room | 0 (0.0%) | 0 (0.0%) |
| 2 or 3 Rooms | 7 (11.7%) | 2 (8.3%) |
| 4 or 5 Rooms | 21 (35.0%) | 22 (91.7%) |
| 6 or 7 Rooms | 18 (30.0%) | 0 (0.0%) |
| 8 or more Rooms | 14 (23.3%) | 0 (0.0%) |
| Total | 60 (100.0%) | 24 (100.0%) |
Housing Structure by Heating Type in Andes
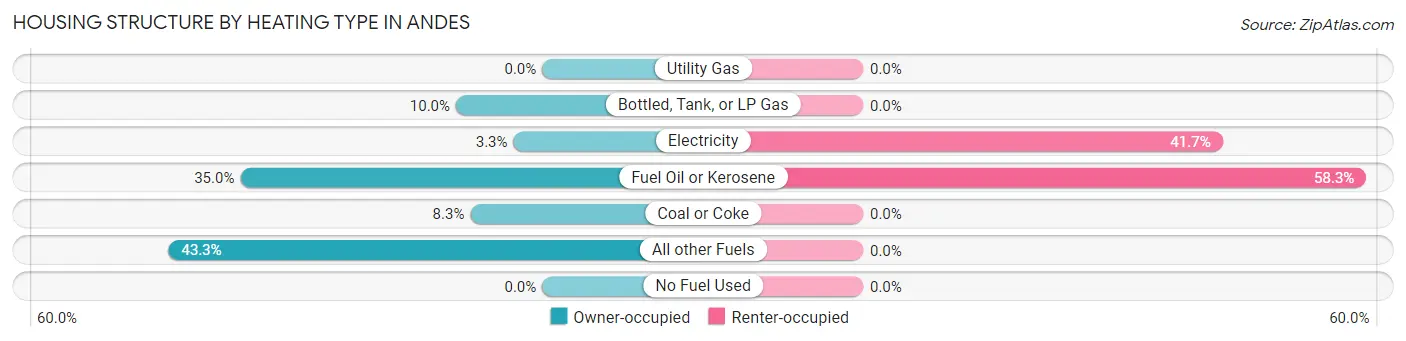
| Heating Type | Owner-occupied | Renter-occupied |
| Utility Gas | 0 (0.0%) | 0 (0.0%) |
| Bottled, Tank, or LP Gas | 6 (10.0%) | 0 (0.0%) |
| Electricity | 2 (3.3%) | 10 (41.7%) |
| Fuel Oil or Kerosene | 21 (35.0%) | 14 (58.3%) |
| Coal or Coke | 5 (8.3%) | 0 (0.0%) |
| All other Fuels | 26 (43.3%) | 0 (0.0%) |
| No Fuel Used | 0 (0.0%) | 0 (0.0%) |
| Total | 60 (100.0%) | 24 (100.0%) |
Household Vehicle Usage in Andes
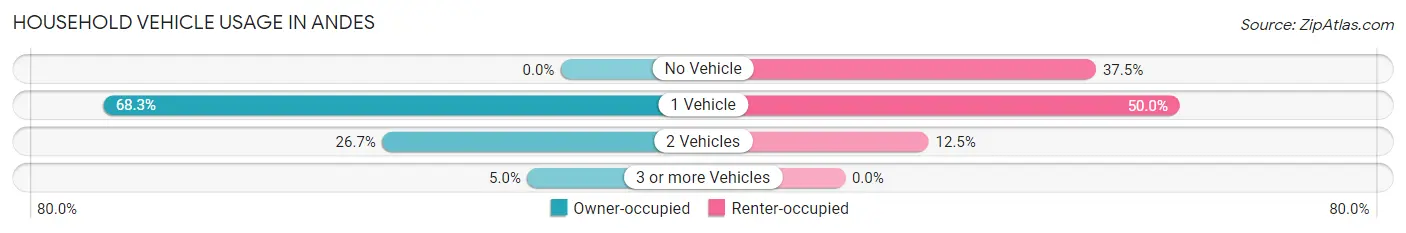
| Vehicles per Household | Owner-occupied | Renter-occupied |
| No Vehicle | 0 (0.0%) | 9 (37.5%) |
| 1 Vehicle | 41 (68.3%) | 12 (50.0%) |
| 2 Vehicles | 16 (26.7%) | 3 (12.5%) |
| 3 or more Vehicles | 3 (5.0%) | 0 (0.0%) |
| Total | 60 (100.0%) | 24 (100.0%) |
Real Estate & Mortgages in Andes
Real Estate and Mortgage Overview in Andes
| Characteristic | Without Mortgage | With Mortgage |
| Housing Units | 34 | 26 |
| Median Property Value | $222,200 | $190,000 |
| Median Household Income | - | - |
| Monthly Housing Costs | $489 | $0 |
| Real Estate Taxes | $2,350 | $0 |
Property Value by Mortgage Status in Andes
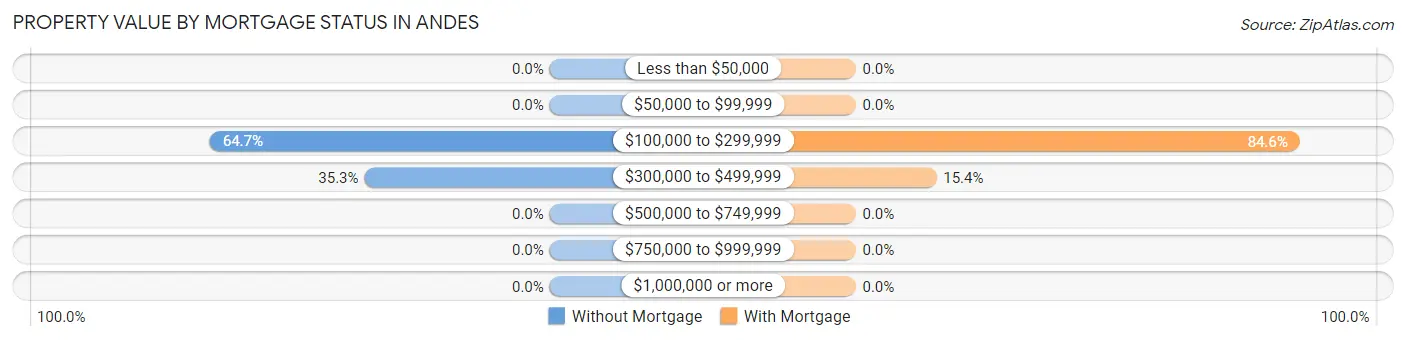
| Property Value | Without Mortgage | With Mortgage |
| Less than $50,000 | 0 (0.0%) | 0 (0.0%) |
| $50,000 to $99,999 | 0 (0.0%) | 0 (0.0%) |
| $100,000 to $299,999 | 22 (64.7%) | 22 (84.6%) |
| $300,000 to $499,999 | 12 (35.3%) | 4 (15.4%) |
| $500,000 to $749,999 | 0 (0.0%) | 0 (0.0%) |
| $750,000 to $999,999 | 0 (0.0%) | 0 (0.0%) |
| $1,000,000 or more | 0 (0.0%) | 0 (0.0%) |
| Total | 34 (100.0%) | 26 (100.0%) |
Household Income by Mortgage Status in Andes
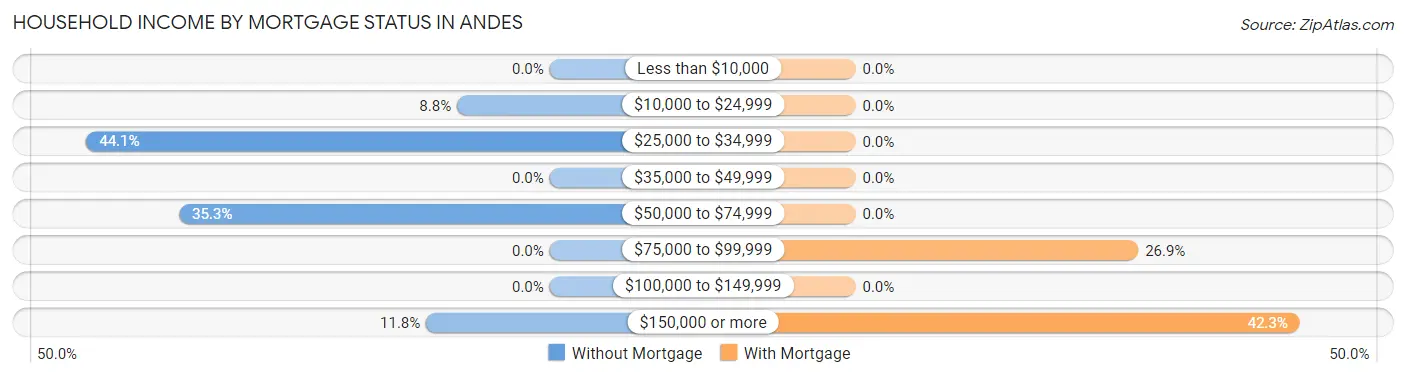
| Household Income | Without Mortgage | With Mortgage |
| Less than $10,000 | 0 (0.0%) | 0 (0.0%) |
| $10,000 to $24,999 | 3 (8.8%) | 0 (0.0%) |
| $25,000 to $34,999 | 15 (44.1%) | 0 (0.0%) |
| $35,000 to $49,999 | 0 (0.0%) | 0 (0.0%) |
| $50,000 to $74,999 | 12 (35.3%) | 0 (0.0%) |
| $75,000 to $99,999 | 0 (0.0%) | 7 (26.9%) |
| $100,000 to $149,999 | 0 (0.0%) | 0 (0.0%) |
| $150,000 or more | 4 (11.8%) | 11 (42.3%) |
| Total | 34 (100.0%) | 26 (100.0%) |
Property Value to Household Income Ratio in Andes
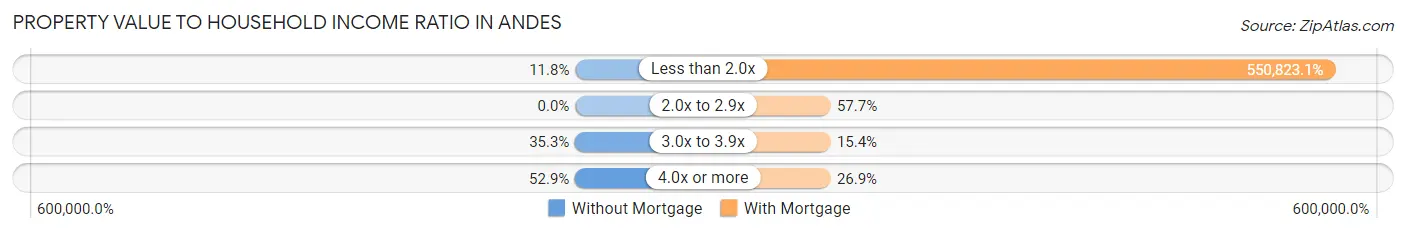
| Value-to-Income Ratio | Without Mortgage | With Mortgage |
| Less than 2.0x | 4 (11.8%) | 143,214 (550,823.1%) |
| 2.0x to 2.9x | 0 (0.0%) | 15 (57.7%) |
| 3.0x to 3.9x | 12 (35.3%) | 4 (15.4%) |
| 4.0x or more | 18 (52.9%) | 7 (26.9%) |
| Total | 34 (100.0%) | 26 (100.0%) |
Real Estate Taxes by Mortgage Status in Andes
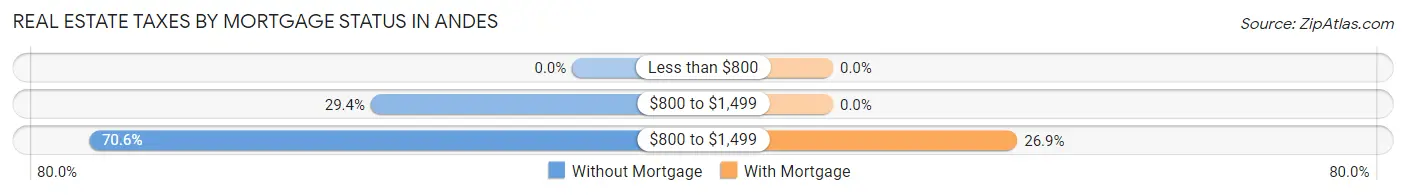
| Property Taxes | Without Mortgage | With Mortgage |
| Less than $800 | 0 (0.0%) | 0 (0.0%) |
| $800 to $1,499 | 10 (29.4%) | 0 (0.0%) |
| $800 to $1,499 | 24 (70.6%) | 7 (26.9%) |
| Total | 34 (100.0%) | 26 (100.0%) |
Health & Disability in Andes
Health Insurance Coverage by Age in Andes
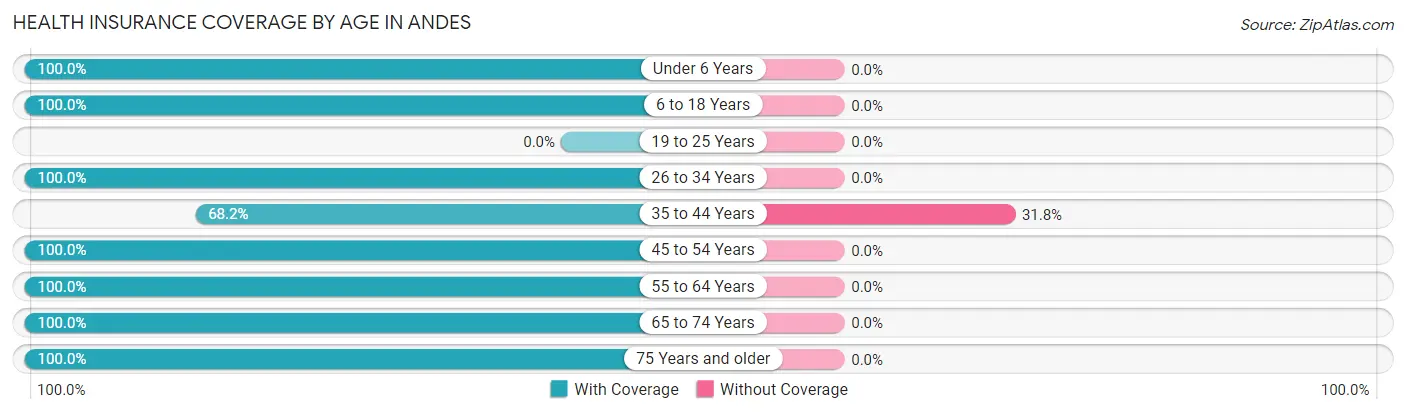
| Age Bracket | With Coverage | Without Coverage |
| Under 6 Years | 3 (100.0%) | 0 (0.0%) |
| 6 to 18 Years | 2 (100.0%) | 0 (0.0%) |
| 19 to 25 Years | 0 (0.0%) | 0 (0.0%) |
| 26 to 34 Years | 14 (100.0%) | 0 (0.0%) |
| 35 to 44 Years | 15 (68.2%) | 7 (31.8%) |
| 45 to 54 Years | 12 (100.0%) | 0 (0.0%) |
| 55 to 64 Years | 3 (100.0%) | 0 (0.0%) |
| 65 to 74 Years | 28 (100.0%) | 0 (0.0%) |
| 75 Years and older | 31 (100.0%) | 0 (0.0%) |
| Total | 108 (93.9%) | 7 (6.1%) |
Health Insurance Coverage by Citizenship Status in Andes
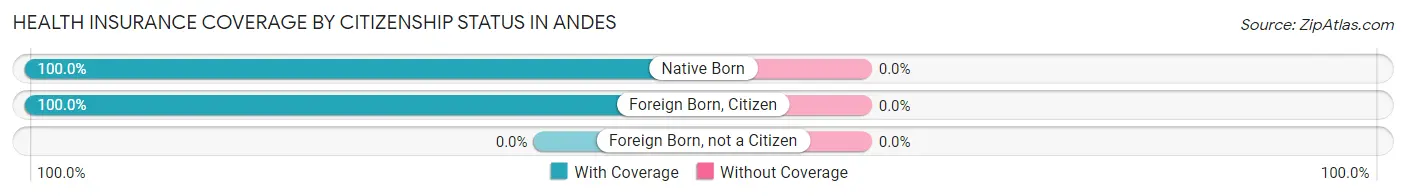
| Citizenship Status | With Coverage | Without Coverage |
| Native Born | 3 (100.0%) | 0 (0.0%) |
| Foreign Born, Citizen | 2 (100.0%) | 0 (0.0%) |
| Foreign Born, not a Citizen | 0 (0.0%) | 0 (0.0%) |
Health Insurance Coverage by Household Income in Andes
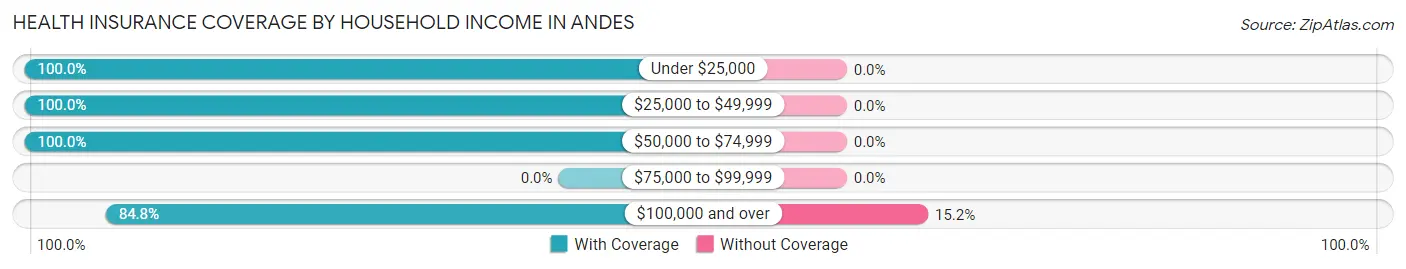
| Household Income | With Coverage | Without Coverage |
| Under $25,000 | 15 (100.0%) | 0 (0.0%) |
| $25,000 to $49,999 | 27 (100.0%) | 0 (0.0%) |
| $50,000 to $74,999 | 27 (100.0%) | 0 (0.0%) |
| $75,000 to $99,999 | 0 (0.0%) | 0 (0.0%) |
| $100,000 and over | 39 (84.8%) | 7 (15.2%) |
Public vs Private Health Insurance Coverage by Age in Andes
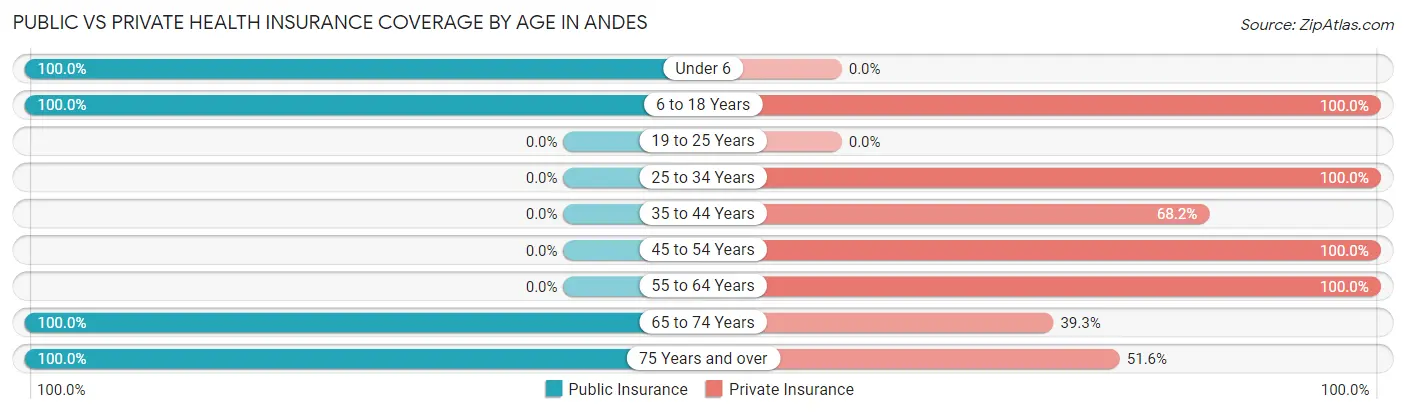
| Age Bracket | Public Insurance | Private Insurance |
| Under 6 | 3 (100.0%) | 0 (0.0%) |
| 6 to 18 Years | 2 (100.0%) | 2 (100.0%) |
| 19 to 25 Years | 0 (0.0%) | 0 (0.0%) |
| 25 to 34 Years | 0 (0.0%) | 14 (100.0%) |
| 35 to 44 Years | 0 (0.0%) | 15 (68.2%) |
| 45 to 54 Years | 0 (0.0%) | 12 (100.0%) |
| 55 to 64 Years | 0 (0.0%) | 3 (100.0%) |
| 65 to 74 Years | 28 (100.0%) | 11 (39.3%) |
| 75 Years and over | 31 (100.0%) | 16 (51.6%) |
| Total | 64 (55.6%) | 73 (63.5%) |
Disability Status by Sex by Age in Andes
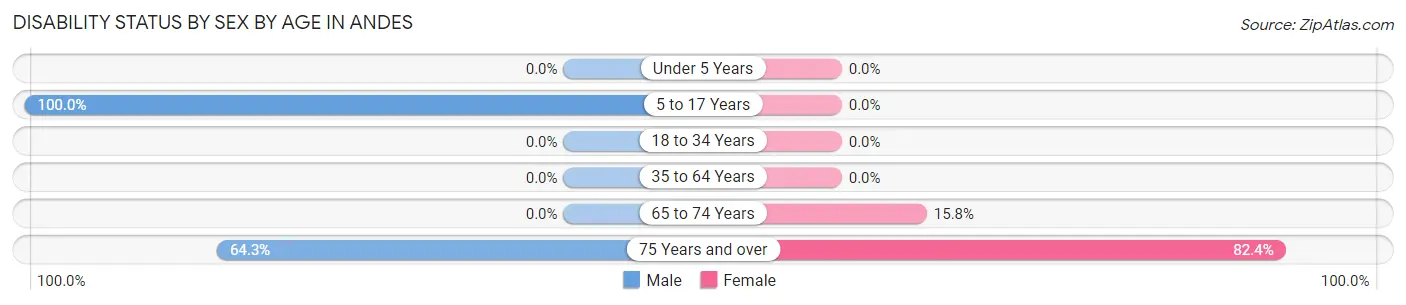
| Age Bracket | Male | Female |
| Under 5 Years | 0 (0.0%) | 0 (0.0%) |
| 5 to 17 Years | 2 (100.0%) | 0 (0.0%) |
| 18 to 34 Years | 0 (0.0%) | 0 (0.0%) |
| 35 to 64 Years | 0 (0.0%) | 0 (0.0%) |
| 65 to 74 Years | 0 (0.0%) | 3 (15.8%) |
| 75 Years and over | 9 (64.3%) | 14 (82.4%) |
Disability Class by Sex by Age in Andes
Disability Class: Hearing Difficulty
| Age Bracket | Male | Female |
| Under 5 Years | 0 (0.0%) | 0 (0.0%) |
| 5 to 17 Years | 0 (0.0%) | 0 (0.0%) |
| 18 to 34 Years | 0 (0.0%) | 0 (0.0%) |
| 35 to 64 Years | 0 (0.0%) | 0 (0.0%) |
| 65 to 74 Years | 0 (0.0%) | 0 (0.0%) |
| 75 Years and over | 0 (0.0%) | 0 (0.0%) |
Disability Class: Vision Difficulty
| Age Bracket | Male | Female |
| Under 5 Years | 0 (0.0%) | 0 (0.0%) |
| 5 to 17 Years | 0 (0.0%) | 0 (0.0%) |
| 18 to 34 Years | 0 (0.0%) | 0 (0.0%) |
| 35 to 64 Years | 0 (0.0%) | 0 (0.0%) |
| 65 to 74 Years | 0 (0.0%) | 0 (0.0%) |
| 75 Years and over | 0 (0.0%) | 0 (0.0%) |
Disability Class: Cognitive Difficulty
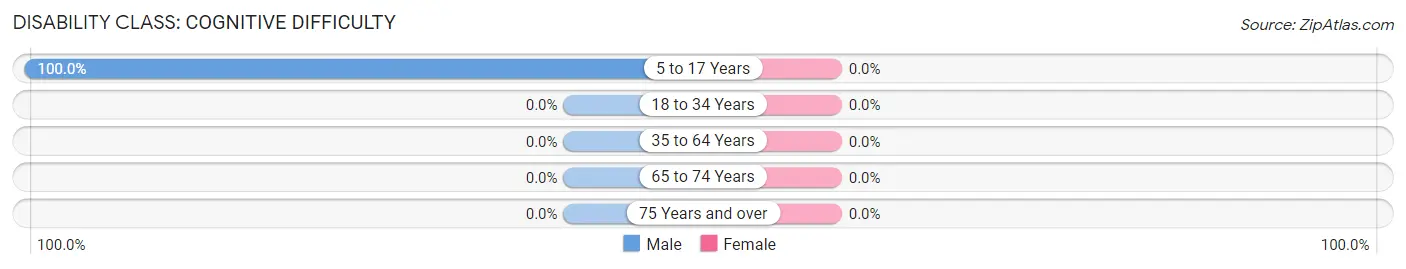
| Age Bracket | Male | Female |
| 5 to 17 Years | 2 (100.0%) | 0 (0.0%) |
| 18 to 34 Years | 0 (0.0%) | 0 (0.0%) |
| 35 to 64 Years | 0 (0.0%) | 0 (0.0%) |
| 65 to 74 Years | 0 (0.0%) | 0 (0.0%) |
| 75 Years and over | 0 (0.0%) | 0 (0.0%) |
Disability Class: Ambulatory Difficulty
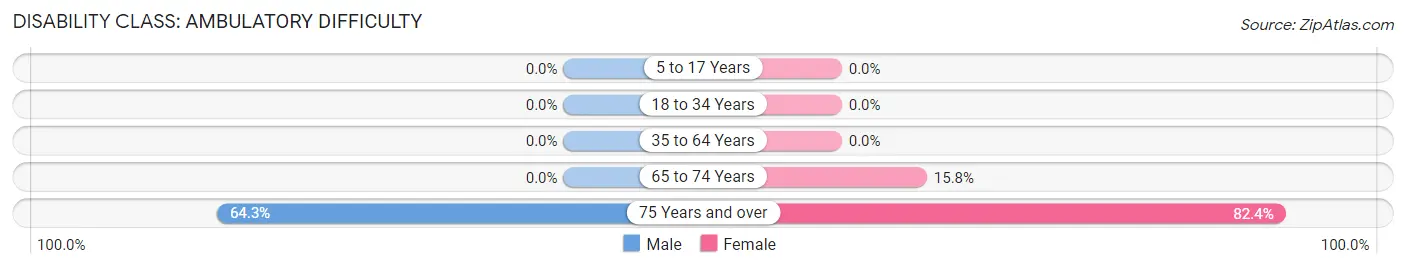
| Age Bracket | Male | Female |
| 5 to 17 Years | 0 (0.0%) | 0 (0.0%) |
| 18 to 34 Years | 0 (0.0%) | 0 (0.0%) |
| 35 to 64 Years | 0 (0.0%) | 0 (0.0%) |
| 65 to 74 Years | 0 (0.0%) | 3 (15.8%) |
| 75 Years and over | 9 (64.3%) | 14 (82.4%) |
Disability Class: Self-Care Difficulty
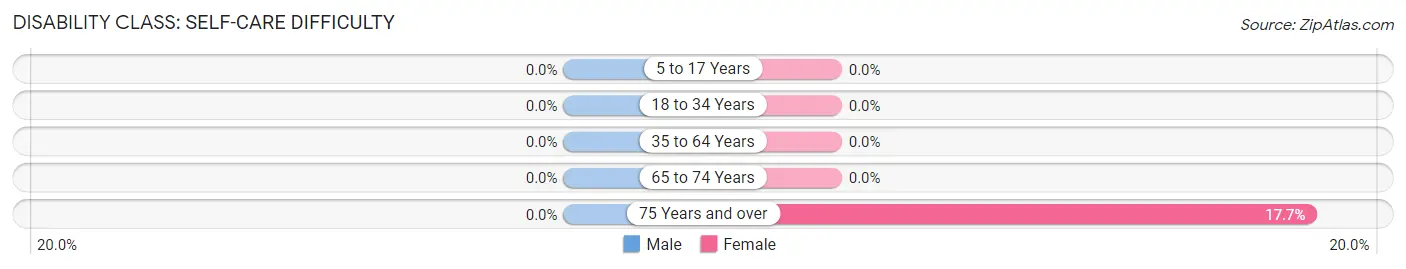
| Age Bracket | Male | Female |
| 5 to 17 Years | 0 (0.0%) | 0 (0.0%) |
| 18 to 34 Years | 0 (0.0%) | 0 (0.0%) |
| 35 to 64 Years | 0 (0.0%) | 0 (0.0%) |
| 65 to 74 Years | 0 (0.0%) | 0 (0.0%) |
| 75 Years and over | 0 (0.0%) | 3 (17.6%) |
Technology Access in Andes
Computing Device Access in Andes
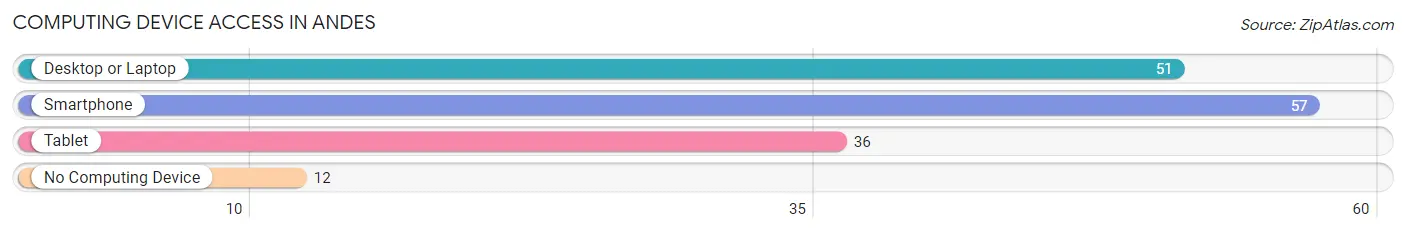
| Device Type | # Households | % Households |
| Desktop or Laptop | 51 | 60.7% |
| Smartphone | 57 | 67.9% |
| Tablet | 36 | 42.9% |
| No Computing Device | 12 | 14.3% |
| Total | 84 | 100.0% |
Internet Access in Andes
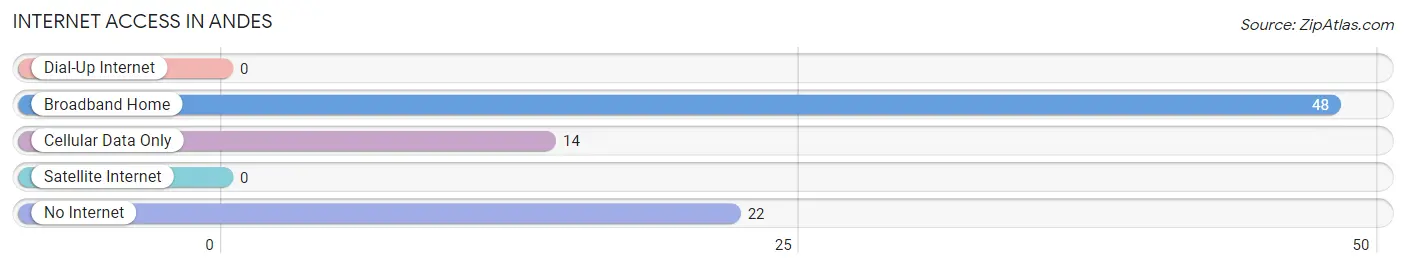
| Internet Type | # Households | % Households |
| Dial-Up Internet | 0 | 0.0% |
| Broadband Home | 48 | 57.1% |
| Cellular Data Only | 14 | 16.7% |
| Satellite Internet | 0 | 0.0% |
| No Internet | 22 | 26.2% |
| Total | 84 | 100.0% |
Andes Summary
Andes is a town located in the western part of Delaware County, New York, United States. The population was 1,082 at the 2010 census. The town is in the southwest part of the county and is south of the city of Oneonta.
History
The town of Andes was first settled in 1790 by a group of settlers from Connecticut. The town was formed from the town of Middletown in 1819. The town was named after the Andes Mountains in South America.
The first industry in the town was a sawmill, which was built in 1820. The first gristmill was built in 1825. The first store was opened in 1826.
The first school in the town was built in 1827 The first post office was established in 1829
The first newspaper in the town was the Andes Recorder which was established in 1845
Geography
Andes is located in the western part of Delaware County, New York. The town is bordered by the towns of Middletown to the north, Bovina to the east, Delhi to the south, and Meredith to the west.
The town is located in the Catskill Mountains and is home to several mountain peaks, including Slide Mountain, the highest peak in the Catskills. The town is also home to several lakes, including Pepacton Reservoir, the largest reservoir in New York State.
Economy
The economy of Andes is largely based on tourism. The town is home to several ski resorts, including Belleayre Mountain Ski Center, which is the largest ski resort in the Catskills. The town is also home to several state parks, including the Catskill State Park.
The town is also home to several small businesses including restaurants shops and lodging
Demographics
As of the 2010 census, there were 1,082 people, 441 households, and 287 families living in the town. The population density was 28.2 people per square mile (10.9/km2). There were 545 housing units at an average density of 14.3 per square mile (5.5/km2). The racial makeup of the town was 97.2% White, 0.3% African American, 0.2% Native American, 0.2% Asian, 0.2% from other races, and 1.9% from two or more races. Hispanic or Latino of any race were 1.3% of the population.
There were 441 households, out of which 28.2% had children under the age of 18 living with them, 51.6% were married couples living together, 9.3% had a female householder with no husband present, and 34.2% were non-families. 28.2% of all households were made up of individuals, and 11.3% had someone living alone who was 65 years of age or older. The average household size was 2.44 and the average family size was 2.97.
In the town, the population was spread out, with 24.2% under the age of 18, 6.2% from 18 to 24, 25.2% from 25 to 44, 28.2% from 45 to 64, and 16.2% who were 65 years of age or older. The median age was 41 years. For every 100 females, there were 97.2 males. For every 100 females age 18 and over, there were 94.2 males.
The median income for a household in the town was $37,500, and the median income for a family was $45,000. Males had a median income of $31,250 versus $25,000 for females. The per capita income for the town was $19,945. About 8.2% of families and 11.2% of the population were below the poverty line, including 15.2% of those under age 18 and 8.2% of those age 65 or over.
Common Questions
What is Per Capita Income in Andes?
Per Capita income in Andes is $68,906.
What is the Median Household income in Andes?
Median Household Income in Andes is $50,750.
What is Inequality or Gini Index in Andes?
Inequality or Gini Index in Andes is 0.54.
What is the Total Population of Andes?
Total Population of Andes is 115.
What is the Total Male Population of Andes?
Total Male Population of Andes is 65.
What is the Total Female Population of Andes?
Total Female Population of Andes is 50.
What is the Ratio of Males per 100 Females in Andes?
There are 130.00 Males per 100 Females in Andes.
What is the Ratio of Females per 100 Males in Andes?
There are 76.92 Females per 100 Males in Andes.
What is the Median Population Age in Andes?
Median Population Age in Andes is 68.4 Years.
What is the Average Family Size in Andes
Average Family Size in Andes is 2.1 People.
What is the Average Household Size in Andes
Average Household Size in Andes is 1.4 People.
How Large is the Labor Force in Andes?
There are 57 People in the Labor Forcein in Andes.
What is the Percentage of People in the Labor Force in Andes?
51.8% of People are in the Labor Force in Andes.
What is the Unemployment Rate in Andes?
Unemployment Rate in Andes is 10.5%.