Morrisonville, NY Map & Demographics
Morrisonville Map

Morrisonville Overview
$38,154
PER CAPITA INCOME
$87,865
AVG FAMILY INCOME
$66,419
AVG HOUSEHOLD INCOME
26.8%
WAGE / INCOME GAP [ % ]
73.2¢/ $1
WAGE / INCOME GAP [ $ ]
0.39
INEQUALITY / GINI INDEX
1,639
TOTAL POPULATION
764
MALE POPULATION
875
FEMALE POPULATION
87.31
MALES / 100 FEMALES
114.53
FEMALES / 100 MALES
44.6
MEDIAN AGE
2.8
AVG FAMILY SIZE
2.2
AVG HOUSEHOLD SIZE
892
LABOR FORCE [ PEOPLE ]
65.2%
PERCENT IN LABOR FORCE
0.3%
UNEMPLOYMENT RATE
Morrisonville Zip Codes
Morrisonville Area Codes
Income in Morrisonville
Income Overview in Morrisonville
Per Capita Income in Morrisonville is $38,154, while median incomes of families and households are $87,865 and $66,419 respectively.
| Characteristic | Number | Measure |
| Per Capita Income | 1,639 | $38,154 |
| Median Family Income | 489 | $87,865 |
| Mean Family Income | 489 | $103,695 |
| Median Household Income | 718 | $66,419 |
| Mean Household Income | 718 | $85,255 |
| Income Deficit | 489 | $0 |
| Wage / Income Gap (%) | 1,639 | 26.77% |
| Wage / Income Gap ($) | 1,639 | 73.23¢ per $1 |
| Gini / Inequality Index | 1,639 | 0.39 |
Earnings by Sex in Morrisonville
Average Earnings in Morrisonville are $45,357, $55,208 for men and $40,429 for women, a difference of 26.8%.
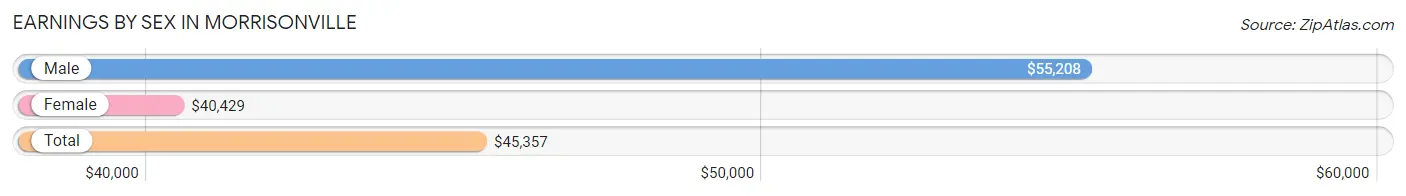
| Sex | Number | Average Earnings |
| Male | 502 (52.8%) | $55,208 |
| Female | 448 (47.2%) | $40,429 |
| Total | 950 (100.0%) | $45,357 |
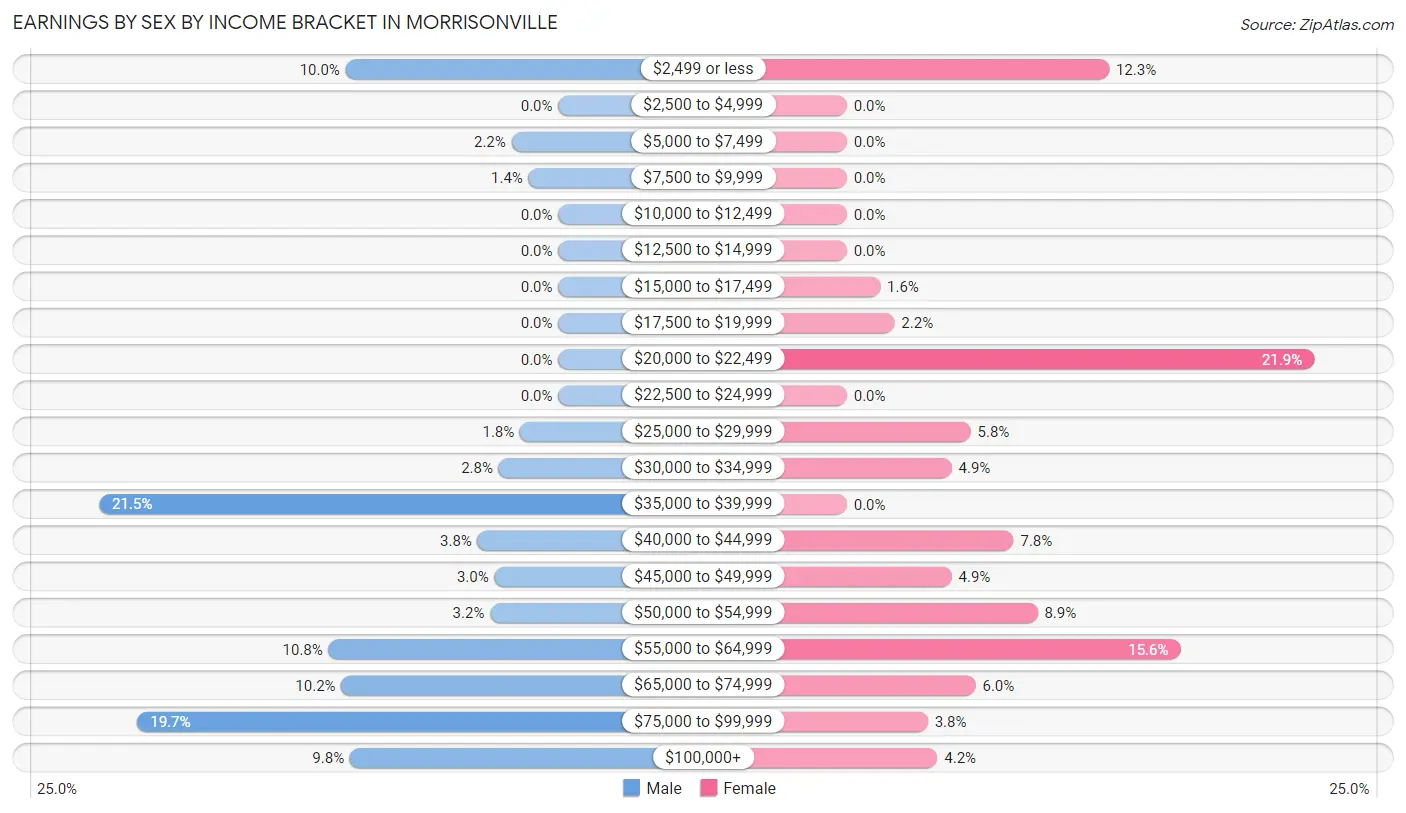
Earnings by Sex by Income Bracket in Morrisonville
The most common earnings brackets in Morrisonville are $35,000 to $39,999 for men (108 | 21.5%) and $20,000 to $22,499 for women (98 | 21.9%).
| Income | Male | Female |
| $2,499 or less | 50 (10.0%) | 55 (12.3%) |
| $2,500 to $4,999 | 0 (0.0%) | 0 (0.0%) |
| $5,000 to $7,499 | 11 (2.2%) | 0 (0.0%) |
| $7,500 to $9,999 | 7 (1.4%) | 0 (0.0%) |
| $10,000 to $12,499 | 0 (0.0%) | 0 (0.0%) |
| $12,500 to $14,999 | 0 (0.0%) | 0 (0.0%) |
| $15,000 to $17,499 | 0 (0.0%) | 7 (1.6%) |
| $17,500 to $19,999 | 0 (0.0%) | 10 (2.2%) |
| $20,000 to $22,499 | 0 (0.0%) | 98 (21.9%) |
| $22,500 to $24,999 | 0 (0.0%) | 0 (0.0%) |
| $25,000 to $29,999 | 9 (1.8%) | 26 (5.8%) |
| $30,000 to $34,999 | 14 (2.8%) | 22 (4.9%) |
| $35,000 to $39,999 | 108 (21.5%) | 0 (0.0%) |
| $40,000 to $44,999 | 19 (3.8%) | 35 (7.8%) |
| $45,000 to $49,999 | 15 (3.0%) | 22 (4.9%) |
| $50,000 to $54,999 | 16 (3.2%) | 40 (8.9%) |
| $55,000 to $64,999 | 54 (10.8%) | 70 (15.6%) |
| $65,000 to $74,999 | 51 (10.2%) | 27 (6.0%) |
| $75,000 to $99,999 | 99 (19.7%) | 17 (3.8%) |
| $100,000+ | 49 (9.8%) | 19 (4.2%) |
| Total | 502 (100.0%) | 448 (100.0%) |
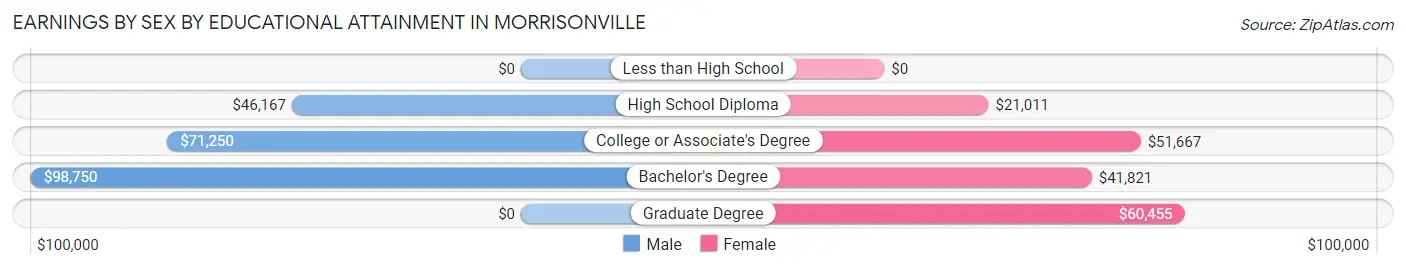
Earnings by Sex by Educational Attainment in Morrisonville
Average earnings in Morrisonville are $71,667 for men and $41,214 for women, a difference of 42.5%. Men with an educational attainment of bachelor's degree enjoy the highest average annual earnings of $98,750, while those with high school diploma education earn the least with $46,167. Women with an educational attainment of graduate degree earn the most with the average annual earnings of $60,455, while those with high school diploma education have the smallest earnings of $21,011.
| Educational Attainment | Male Income | Female Income |
| Less than High School | - | - |
| High School Diploma | $46,167 | $21,011 |
| College or Associate's Degree | $71,250 | $51,667 |
| Bachelor's Degree | $98,750 | $41,821 |
| Graduate Degree | - | - |
| Total | $71,667 | $41,214 |
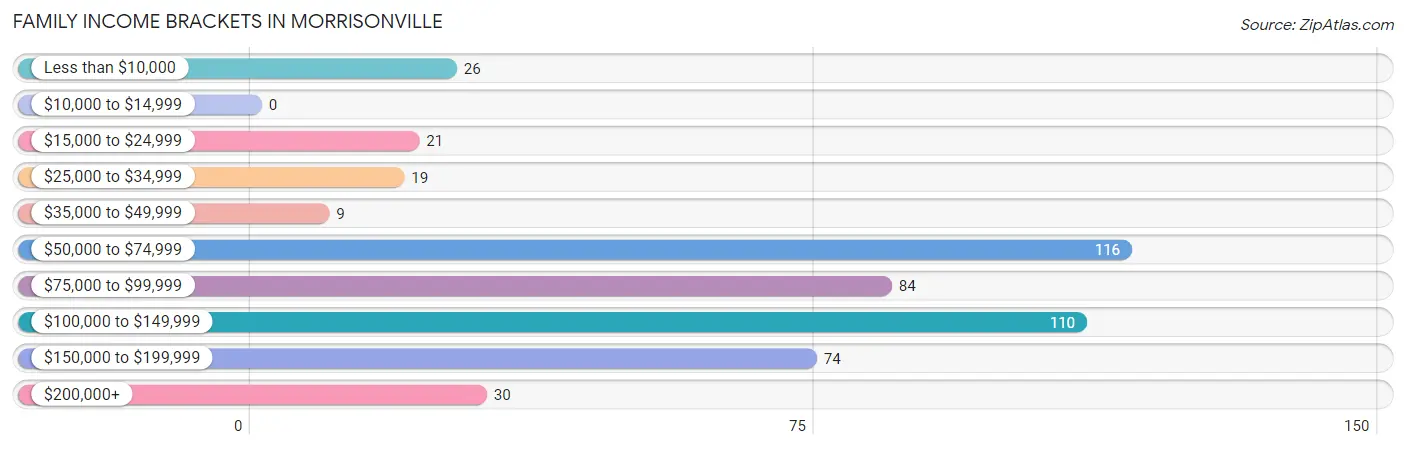
Family Income in Morrisonville
Family Income Brackets in Morrisonville
According to the Morrisonville family income data, there are 116 families falling into the $50,000 to $74,999 income range, which is the most common income bracket and makes up 23.7% of all families.
| Income Bracket | # Families | % Families |
| Less than $10,000 | 26 | 5.3% |
| $10,000 to $14,999 | 0 | 0.0% |
| $15,000 to $24,999 | 21 | 4.3% |
| $25,000 to $34,999 | 19 | 3.9% |
| $35,000 to $49,999 | 9 | 1.8% |
| $50,000 to $74,999 | 116 | 23.7% |
| $75,000 to $99,999 | 84 | 17.2% |
| $100,000 to $149,999 | 110 | 22.5% |
| $150,000 to $199,999 | 74 | 15.1% |
| $200,000+ | 30 | 6.1% |
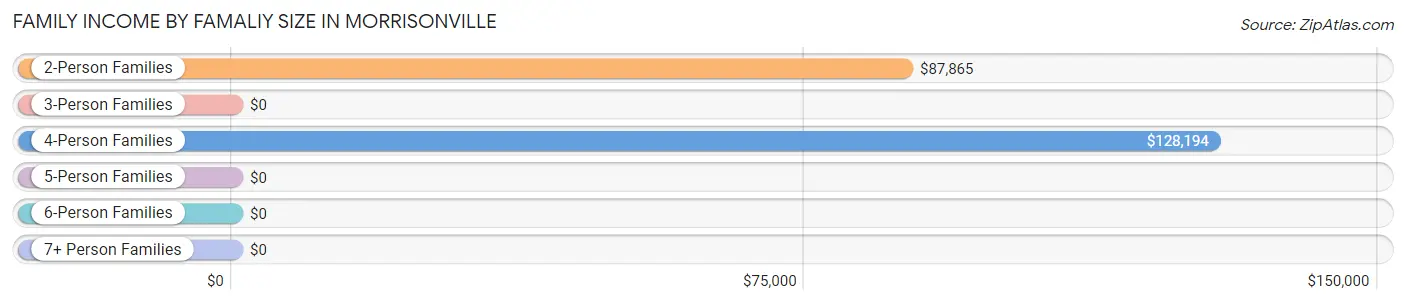
Family Income by Famaliy Size in Morrisonville
4-person families (47 | 9.6%) account for the highest median family income in Morrisonville with $128,194 per family, while 2-person families (251 | 51.3%) have the highest median income of $43,932 per family member.
| Income Bracket | # Families | Median Income |
| 2-Person Families | 251 (51.3%) | $87,865 |
| 3-Person Families | 163 (33.3%) | $0 |
| 4-Person Families | 47 (9.6%) | $128,194 |
| 5-Person Families | 17 (3.5%) | $0 |
| 6-Person Families | 0 (0.0%) | $0 |
| 7+ Person Families | 11 (2.2%) | $0 |
| Total | 489 (100.0%) | $87,865 |
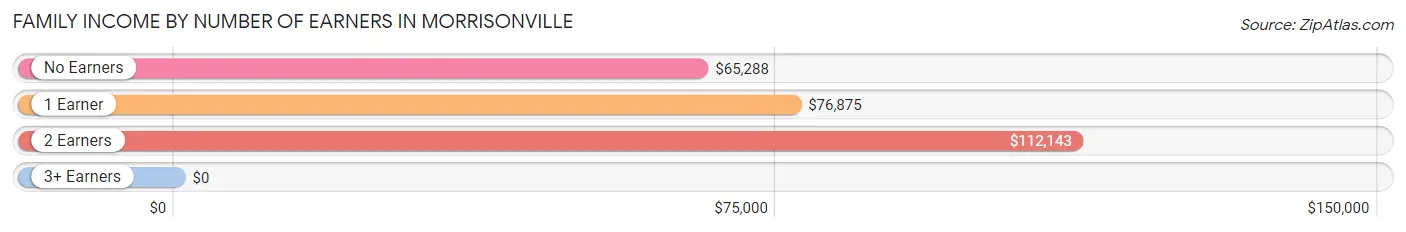
Family Income by Number of Earners in Morrisonville
| Number of Earners | # Families | Median Income |
| No Earners | 80 (16.4%) | $65,288 |
| 1 Earner | 96 (19.6%) | $76,875 |
| 2 Earners | 276 (56.4%) | $112,143 |
| 3+ Earners | 37 (7.6%) | $0 |
| Total | 489 (100.0%) | $87,865 |
Household Income in Morrisonville
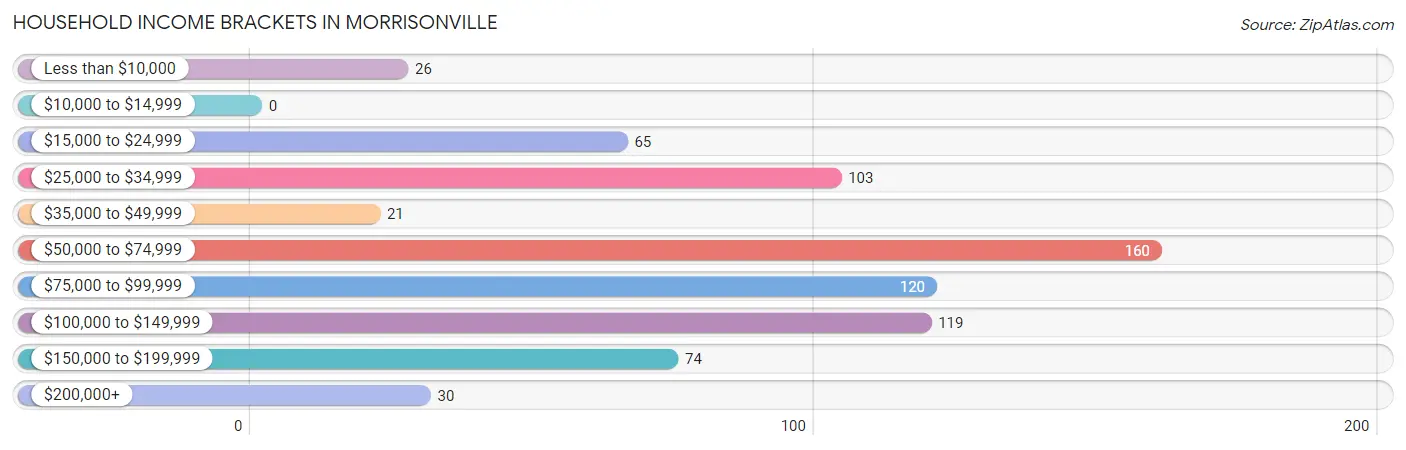
Household Income Brackets in Morrisonville
With 160 households falling in the category, the $50,000 to $74,999 income range is the most frequent in Morrisonville, accounting for 22.3% of all households.
| Income Bracket | # Households | % Households |
| Less than $10,000 | 26 | 3.6% |
| $10,000 to $14,999 | 0 | 0.0% |
| $15,000 to $24,999 | 65 | 9.1% |
| $25,000 to $34,999 | 103 | 14.3% |
| $35,000 to $49,999 | 21 | 2.9% |
| $50,000 to $74,999 | 160 | 22.3% |
| $75,000 to $99,999 | 120 | 16.7% |
| $100,000 to $149,999 | 119 | 16.6% |
| $150,000 to $199,999 | 74 | 10.3% |
| $200,000+ | 30 | 4.2% |
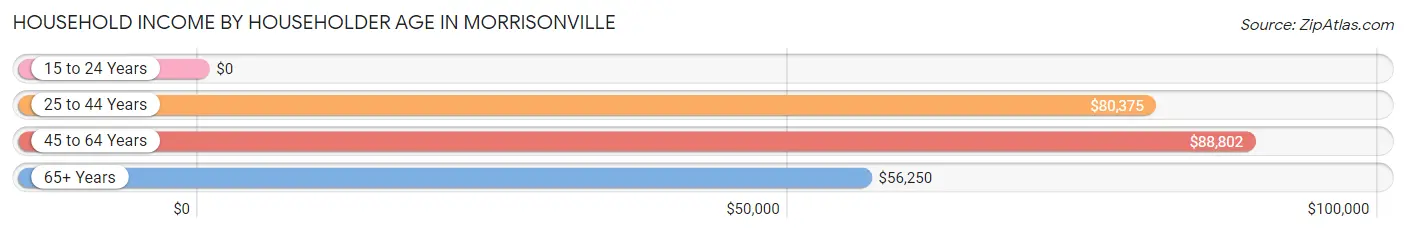
Household Income by Householder Age in Morrisonville
The median household income in Morrisonville is $66,419, with the highest median household income of $88,802 found in the 45 to 64 years age bracket for the primary householder. A total of 251 households (35.0%) fall into this category.
| Income Bracket | # Households | Median Income |
| 15 to 24 Years | 0 (0.0%) | $0 |
| 25 to 44 Years | 223 (31.1%) | $80,375 |
| 45 to 64 Years | 251 (35.0%) | $88,802 |
| 65+ Years | 244 (34.0%) | $56,250 |
| Total | 718 (100.0%) | $66,419 |
Poverty in Morrisonville
Income Below Poverty by Sex and Age in Morrisonville
With 7.1% poverty level for males and 8.5% for females among the residents of Morrisonville, 16 and 17 year old males and 12 to 14 year old females are the most vulnerable to poverty, with 21 males (41.2%) and 22 females (43.1%) in their respective age groups living below the poverty level.
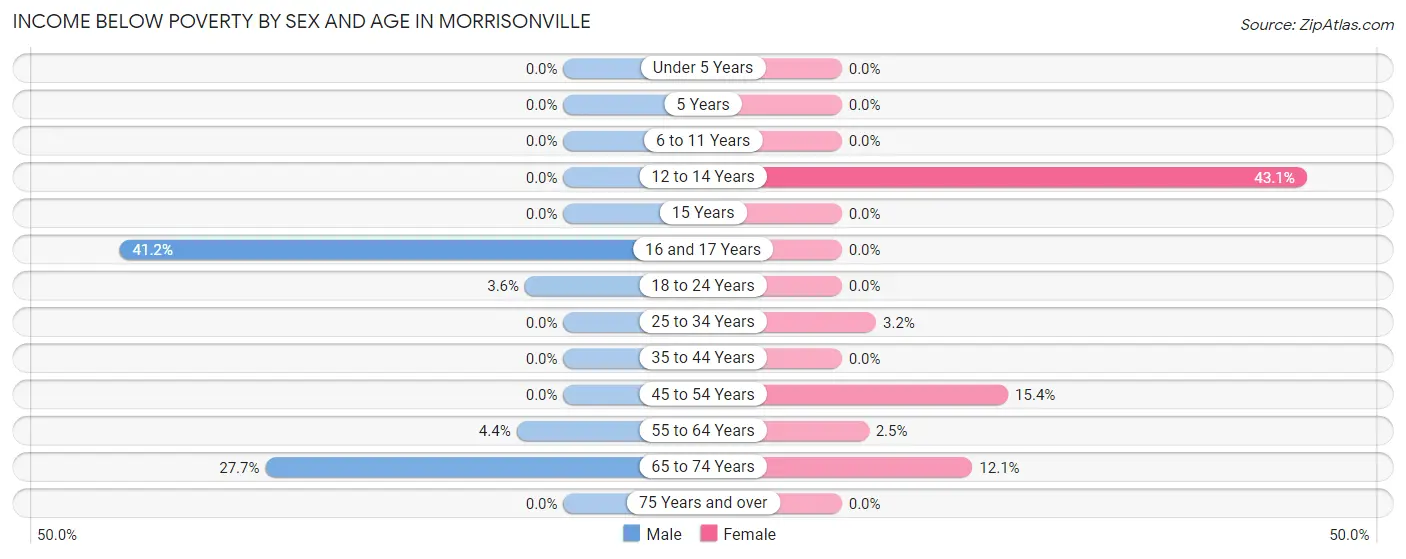
| Age Bracket | Male | Female |
| Under 5 Years | 0 (0.0%) | 0 (0.0%) |
| 5 Years | 0 (0.0%) | 0 (0.0%) |
| 6 to 11 Years | 0 (0.0%) | 0 (0.0%) |
| 12 to 14 Years | 0 (0.0%) | 22 (43.1%) |
| 15 Years | 0 (0.0%) | 0 (0.0%) |
| 16 and 17 Years | 21 (41.2%) | 0 (0.0%) |
| 18 to 24 Years | 4 (3.6%) | 0 (0.0%) |
| 25 to 34 Years | 0 (0.0%) | 5 (3.2%) |
| 35 to 44 Years | 0 (0.0%) | 0 (0.0%) |
| 45 to 54 Years | 0 (0.0%) | 21 (15.4%) |
| 55 to 64 Years | 3 (4.3%) | 2 (2.5%) |
| 65 to 74 Years | 26 (27.7%) | 24 (12.1%) |
| 75 Years and over | 0 (0.0%) | 0 (0.0%) |
| Total | 54 (7.1%) | 74 (8.5%) |
Income Above Poverty by Sex and Age in Morrisonville
According to the poverty statistics in Morrisonville, males aged under 5 years and females aged 6 to 11 years are the age groups that are most secure financially, with 100.0% of males and 100.0% of females in these age groups living above the poverty line.
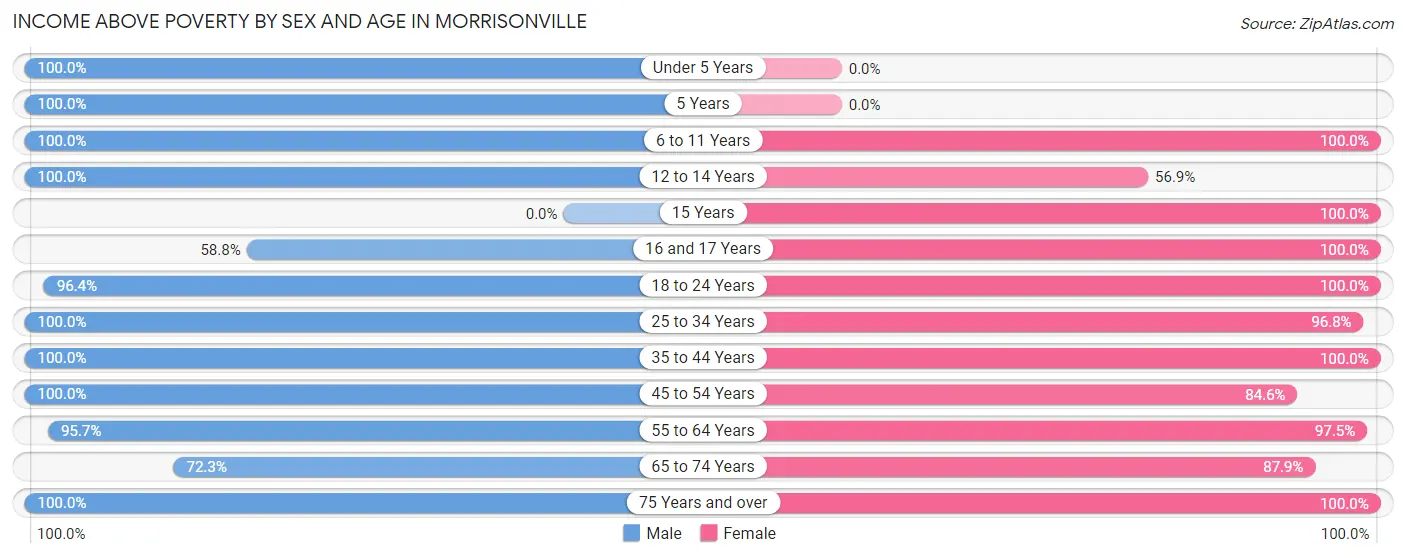
| Age Bracket | Male | Female |
| Under 5 Years | 59 (100.0%) | 0 (0.0%) |
| 5 Years | 53 (100.0%) | 0 (0.0%) |
| 6 to 11 Years | 19 (100.0%) | 71 (100.0%) |
| 12 to 14 Years | 7 (100.0%) | 29 (56.9%) |
| 15 Years | 0 (0.0%) | 7 (100.0%) |
| 16 and 17 Years | 30 (58.8%) | 27 (100.0%) |
| 18 to 24 Years | 108 (96.4%) | 8 (100.0%) |
| 25 to 34 Years | 69 (100.0%) | 152 (96.8%) |
| 35 to 44 Years | 68 (100.0%) | 61 (100.0%) |
| 45 to 54 Years | 110 (100.0%) | 115 (84.6%) |
| 55 to 64 Years | 66 (95.7%) | 78 (97.5%) |
| 65 to 74 Years | 68 (72.3%) | 174 (87.9%) |
| 75 Years and over | 49 (100.0%) | 79 (100.0%) |
| Total | 706 (92.9%) | 801 (91.5%) |
Income Below Poverty Among Married-Couple Families in Morrisonville
The poverty statistics for married-couple families in Morrisonville show that 5.9% or 26 of the total 440 families live below the poverty line. Families with no children have the highest poverty rate of 10.3%, comprising of 26 families. On the other hand, families with 1 or 2 children have the lowest poverty rate of 0.0%, which includes 0 families.
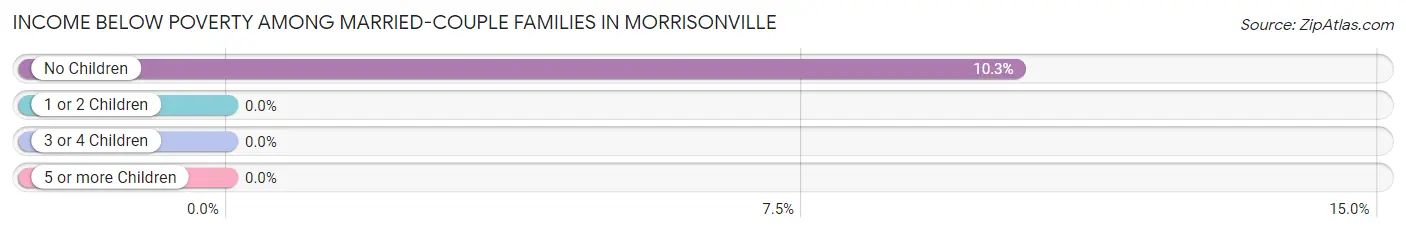
| Children | Above Poverty | Below Poverty |
| No Children | 227 (89.7%) | 26 (10.3%) |
| 1 or 2 Children | 168 (100.0%) | 0 (0.0%) |
| 3 or 4 Children | 19 (100.0%) | 0 (0.0%) |
| 5 or more Children | 0 (0.0%) | 0 (0.0%) |
| Total | 414 (94.1%) | 26 (5.9%) |
Income Below Poverty Among Single-Parent Households in Morrisonville
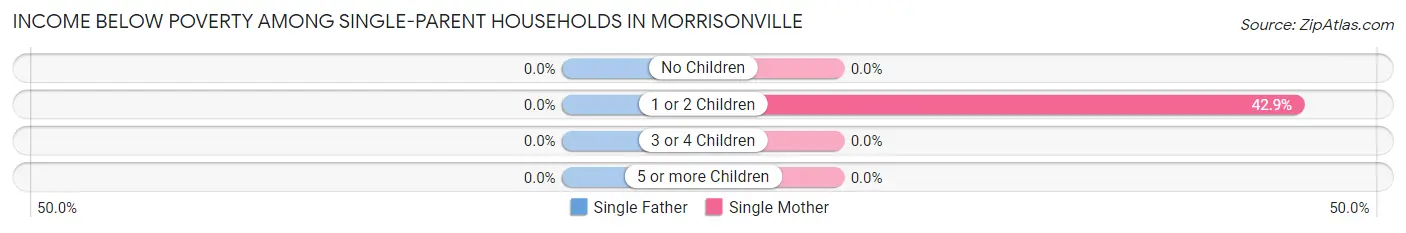
| Children | Single Father | Single Mother |
| No Children | 0 (0.0%) | 0 (0.0%) |
| 1 or 2 Children | 0 (0.0%) | 21 (42.9%) |
| 3 or 4 Children | 0 (0.0%) | 0 (0.0%) |
| 5 or more Children | 0 (0.0%) | 0 (0.0%) |
| Total | 0 (0.0%) | 21 (42.9%) |
Income Below Poverty Among Married-Couple vs Single-Parent Households in Morrisonville
The poverty data for Morrisonville shows that 26 of the married-couple family households (5.9%) and 21 of the single-parent households (42.9%) are living below the poverty level. Within the married-couple family households, those with no children have the highest poverty rate, with 26 households (10.3%) falling below the poverty line. Among the single-parent households, those with 1 or 2 children have the highest poverty rate, with 21 household (42.9%) living below poverty.
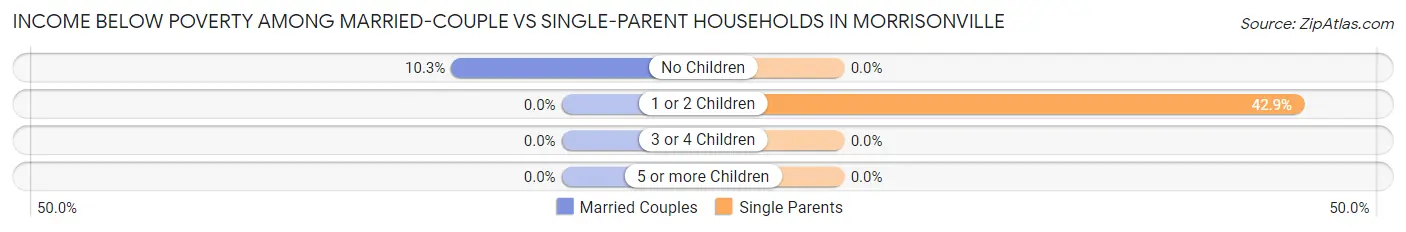
| Children | Married-Couple Families | Single-Parent Households |
| No Children | 26 (10.3%) | 0 (0.0%) |
| 1 or 2 Children | 0 (0.0%) | 21 (42.9%) |
| 3 or 4 Children | 0 (0.0%) | 0 (0.0%) |
| 5 or more Children | 0 (0.0%) | 0 (0.0%) |
| Total | 26 (5.9%) | 21 (42.9%) |
Race in Morrisonville
The most populous races in Morrisonville are White / Caucasian (1,592 | 97.1%), Two or more Races (31 | 1.9%), and Black / African American (12 | 0.7%).
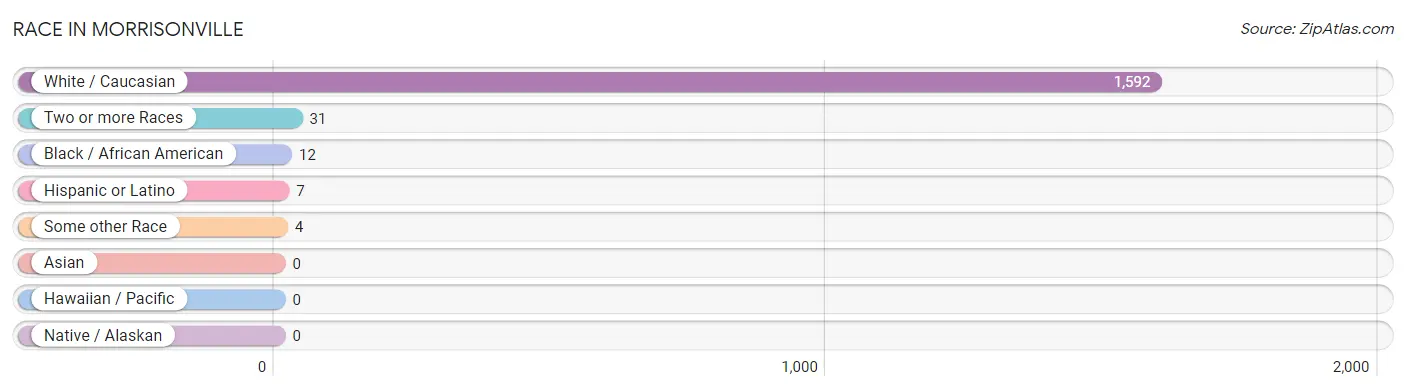
| Race | # Population | % Population |
| Asian | 0 | 0.0% |
| Black / African American | 12 | 0.7% |
| Hawaiian / Pacific | 0 | 0.0% |
| Hispanic or Latino | 7 | 0.4% |
| Native / Alaskan | 0 | 0.0% |
| White / Caucasian | 1,592 | 97.1% |
| Two or more Races | 31 | 1.9% |
| Some other Race | 4 | 0.2% |
| Total | 1,639 | 100.0% |
Ancestry in Morrisonville
The most populous ancestries reported in Morrisonville are English (274 | 16.7%), French (268 | 16.4%), German (228 | 13.9%), French Canadian (196 | 12.0%), and Scottish (142 | 8.7%), together accounting for 67.6% of all Morrisonville residents.
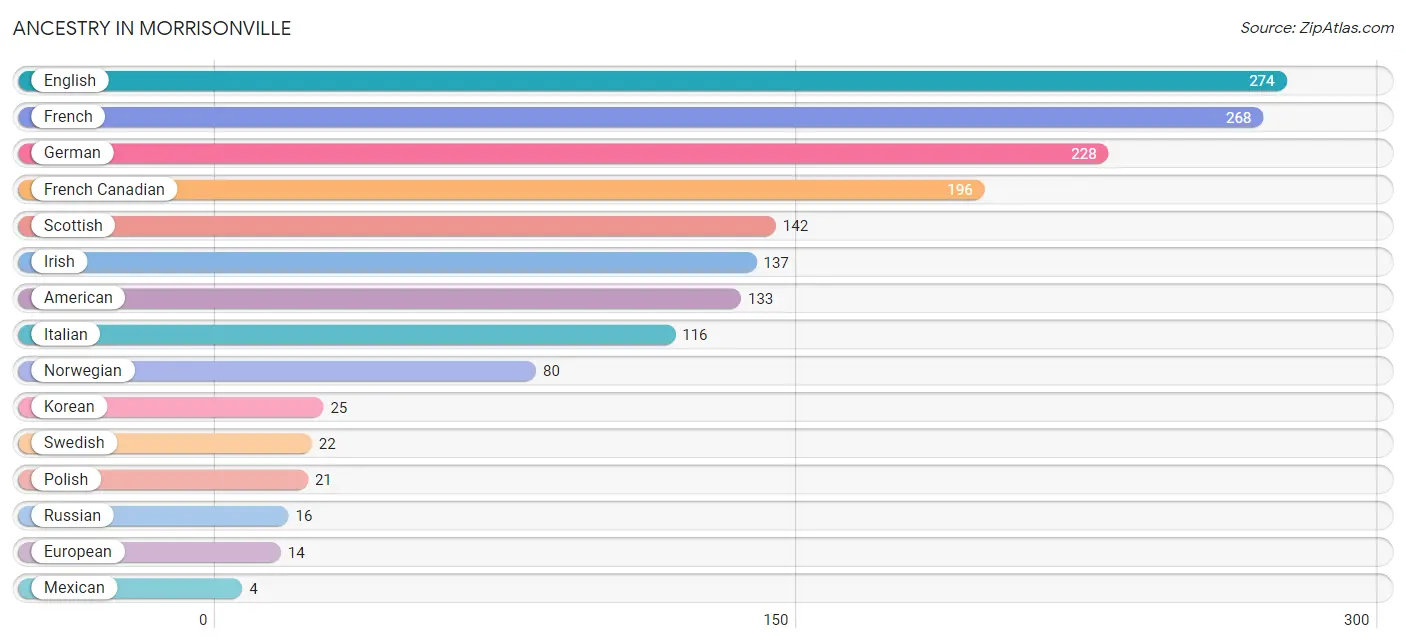
| Ancestry | # Population | % Population |
| American | 133 | 8.1% |
| English | 274 | 16.7% |
| European | 14 | 0.9% |
| French | 268 | 16.4% |
| French Canadian | 196 | 12.0% |
| German | 228 | 13.9% |
| Irish | 137 | 8.4% |
| Italian | 116 | 7.1% |
| Korean | 25 | 1.5% |
| Mexican | 4 | 0.2% |
| Norwegian | 80 | 4.9% |
| Polish | 21 | 1.3% |
| Russian | 16 | 1.0% |
| Scottish | 142 | 8.7% |
| Swedish | 22 | 1.3% | View All 15 Rows |
Immigrants in Morrisonville
The most numerous immigrant groups reported in Morrisonville came from Canada (74 | 4.5%), Latin America (7 | 0.4%), Central America (4 | 0.2%), Mexico (4 | 0.2%), and Asia (3 | 0.2%), together accounting for 5.6% of all Morrisonville residents.
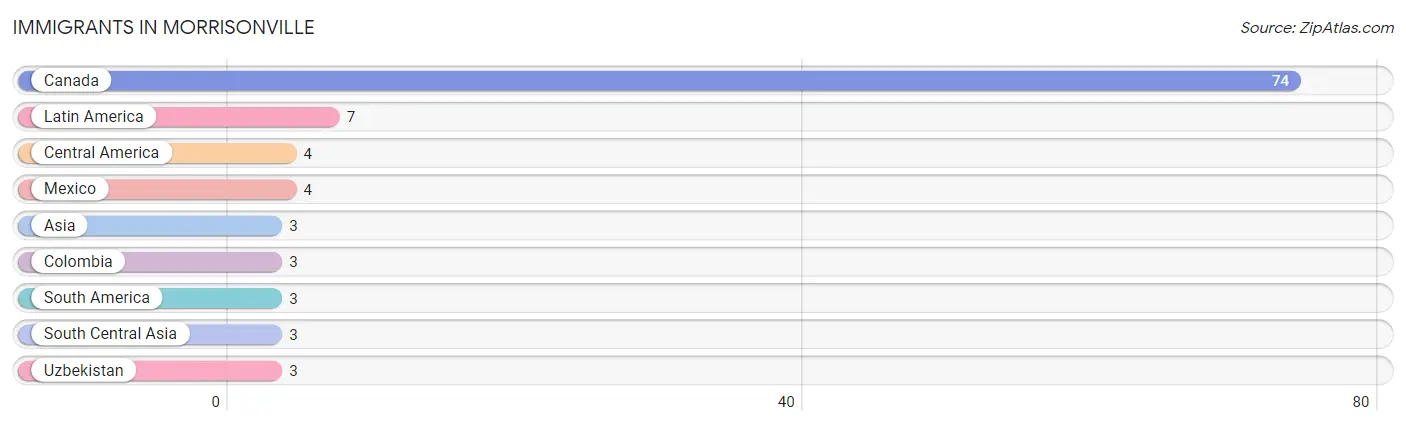
| Immigration Origin | # Population | % Population |
| Asia | 3 | 0.2% |
| Canada | 74 | 4.5% |
| Central America | 4 | 0.2% |
| Colombia | 3 | 0.2% |
| Latin America | 7 | 0.4% |
| Mexico | 4 | 0.2% |
| South America | 3 | 0.2% |
| South Central Asia | 3 | 0.2% |
| Uzbekistan | 3 | 0.2% | View All 9 Rows |
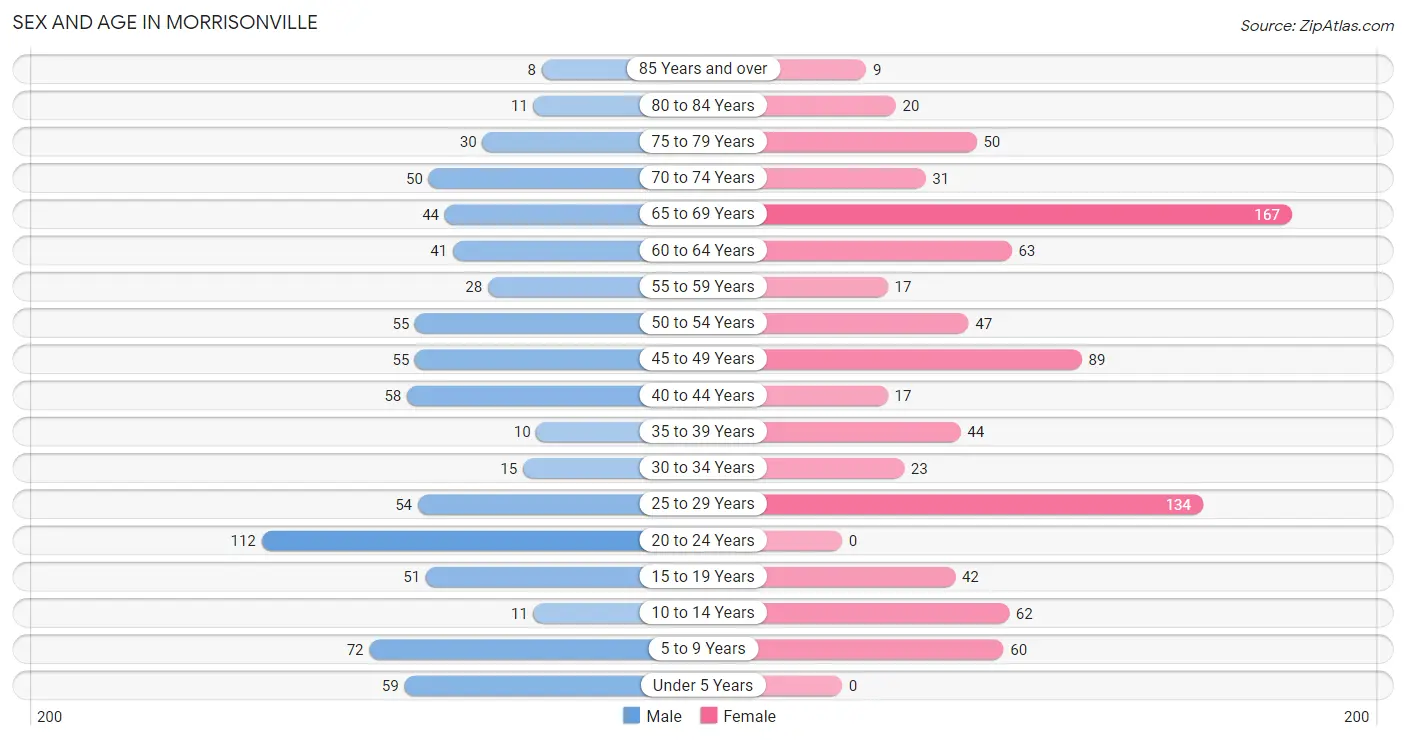
Sex and Age in Morrisonville
Sex and Age in Morrisonville
The most populous age groups in Morrisonville are 20 to 24 Years (112 | 14.7%) for men and 65 to 69 Years (167 | 19.1%) for women.
| Age Bracket | Male | Female |
| Under 5 Years | 59 (7.7%) | 0 (0.0%) |
| 5 to 9 Years | 72 (9.4%) | 60 (6.9%) |
| 10 to 14 Years | 11 (1.4%) | 62 (7.1%) |
| 15 to 19 Years | 51 (6.7%) | 42 (4.8%) |
| 20 to 24 Years | 112 (14.7%) | 0 (0.0%) |
| 25 to 29 Years | 54 (7.1%) | 134 (15.3%) |
| 30 to 34 Years | 15 (2.0%) | 23 (2.6%) |
| 35 to 39 Years | 10 (1.3%) | 44 (5.0%) |
| 40 to 44 Years | 58 (7.6%) | 17 (1.9%) |
| 45 to 49 Years | 55 (7.2%) | 89 (10.2%) |
| 50 to 54 Years | 55 (7.2%) | 47 (5.4%) |
| 55 to 59 Years | 28 (3.7%) | 17 (1.9%) |
| 60 to 64 Years | 41 (5.4%) | 63 (7.2%) |
| 65 to 69 Years | 44 (5.8%) | 167 (19.1%) |
| 70 to 74 Years | 50 (6.5%) | 31 (3.5%) |
| 75 to 79 Years | 30 (3.9%) | 50 (5.7%) |
| 80 to 84 Years | 11 (1.4%) | 20 (2.3%) |
| 85 Years and over | 8 (1.1%) | 9 (1.0%) |
| Total | 764 (100.0%) | 875 (100.0%) |
Families and Households in Morrisonville
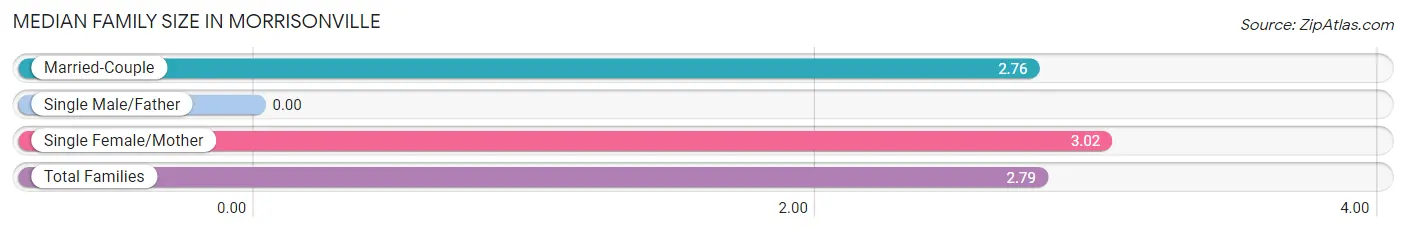
Median Family Size in Morrisonville
| Family Type | # Families | Family Size |
| Married-Couple | 440 (90.0%) | 2.76 |
| Single Male/Father | 0 (0.0%) | - |
| Single Female/Mother | 49 (10.0%) | 3.02 |
| Total Families | 489 (100.0%) | 2.79 |
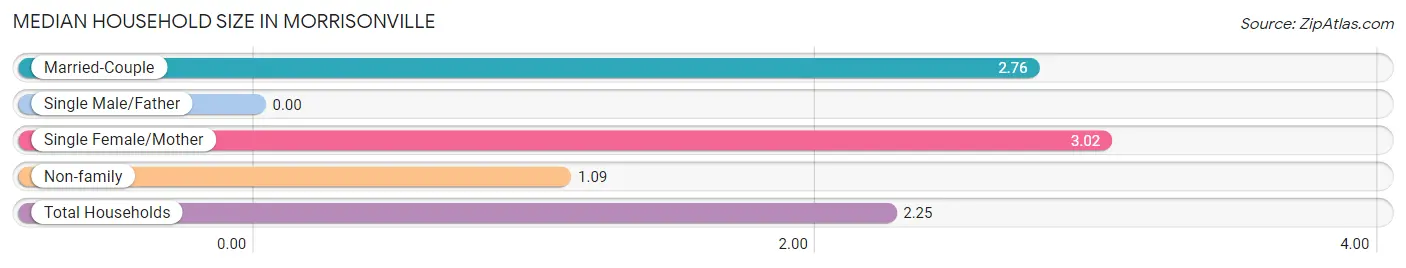
Median Household Size in Morrisonville
| Household Type | # Households | Household Size |
| Married-Couple | 440 (61.3%) | 2.76 |
| Single Male/Father | 0 (0.0%) | - |
| Single Female/Mother | 49 (6.8%) | 3.02 |
| Non-family | 229 (31.9%) | 1.09 |
| Total Households | 718 (100.0%) | 2.25 |
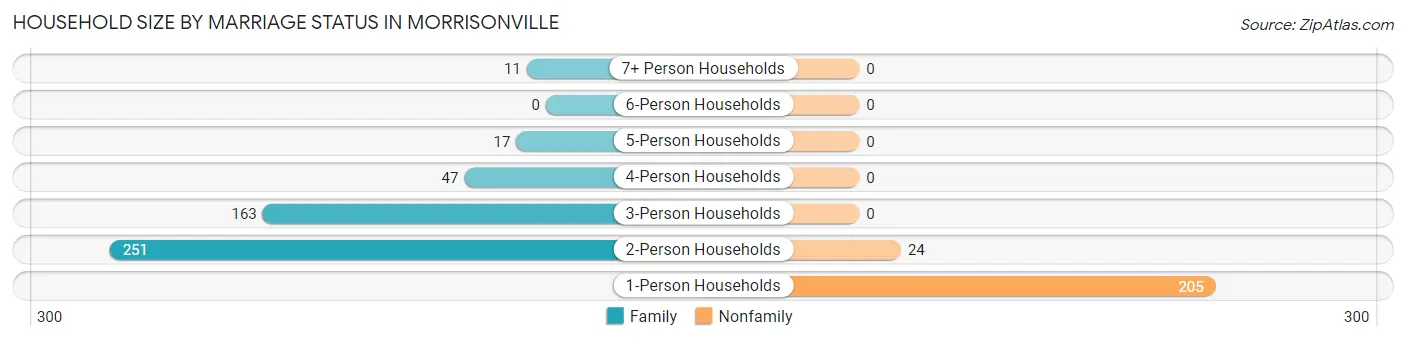
Household Size by Marriage Status in Morrisonville
Out of a total of 718 households in Morrisonville, 489 (68.1%) are family households, while 229 (31.9%) are nonfamily households. The most numerous type of family households are 2-person households, comprising 251, and the most common type of nonfamily households are 1-person households, comprising 205.
| Household Size | Family Households | Nonfamily Households |
| 1-Person Households | - | 205 (28.5%) |
| 2-Person Households | 251 (35.0%) | 24 (3.3%) |
| 3-Person Households | 163 (22.7%) | 0 (0.0%) |
| 4-Person Households | 47 (6.6%) | 0 (0.0%) |
| 5-Person Households | 17 (2.4%) | 0 (0.0%) |
| 6-Person Households | 0 (0.0%) | 0 (0.0%) |
| 7+ Person Households | 11 (1.5%) | 0 (0.0%) |
| Total | 489 (68.1%) | 229 (31.9%) |
Female Fertility in Morrisonville
Fertility by Age in Morrisonville
Average fertility rate in Morrisonville is 123.0 births per 1,000 women. Women in the age bracket of 20 to 34 years have the highest fertility rate with 274.0 births per 1,000 women. Women in the age bracket of 20 to 34 years acount for 100.0% of all women with births.
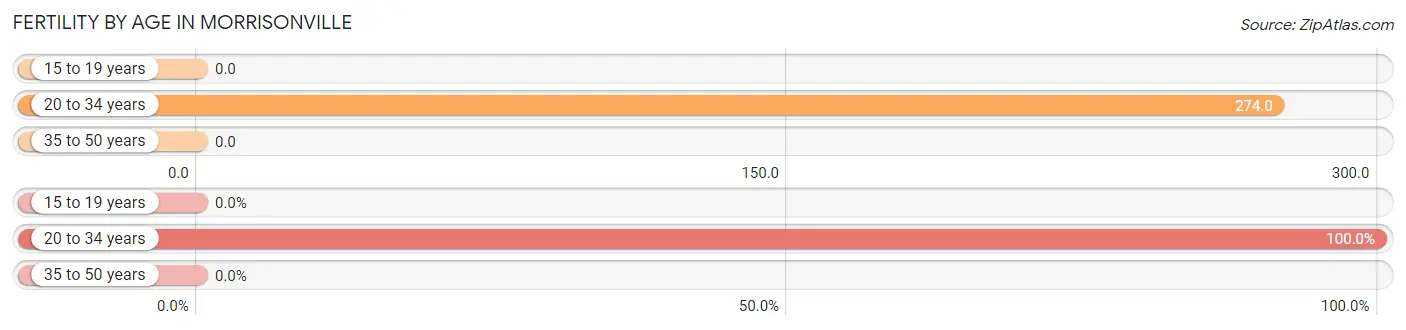
| Age Bracket | Women with Births | Births / 1,000 Women |
| 15 to 19 years | 0 (0.0%) | 0.0 |
| 20 to 34 years | 43 (100.0%) | 274.0 |
| 35 to 50 years | 0 (0.0%) | 0.0 |
| Total | 43 (100.0%) | 123.0 |
Fertility by Age by Marriage Status in Morrisonville
95.3% of women with births (43) in Morrisonville are married. The highest percentage of unmarried women with births falls into 20 to 34 years age bracket with 4.6% of them unmarried at the time of birth, while the lowest percentage of unmarried women with births belong to 20 to 34 years age bracket with 4.6% of them unmarried.
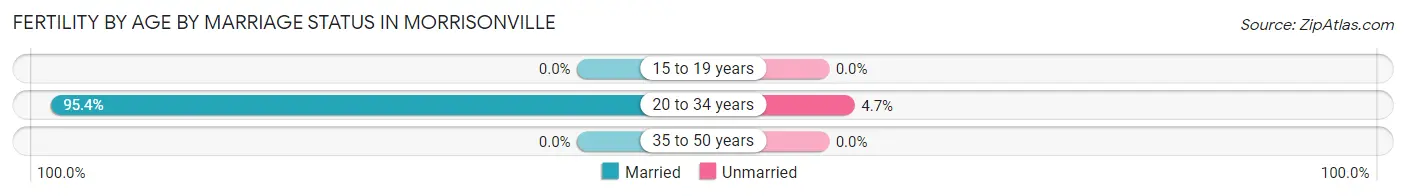
| Age Bracket | Married | Unmarried |
| 15 to 19 years | 0 (0.0%) | 0 (0.0%) |
| 20 to 34 years | 41 (95.4%) | 2 (4.6%) |
| 35 to 50 years | 0 (0.0%) | 0 (0.0%) |
| Total | 41 (95.4%) | 2 (4.6%) |
Fertility by Education in Morrisonville
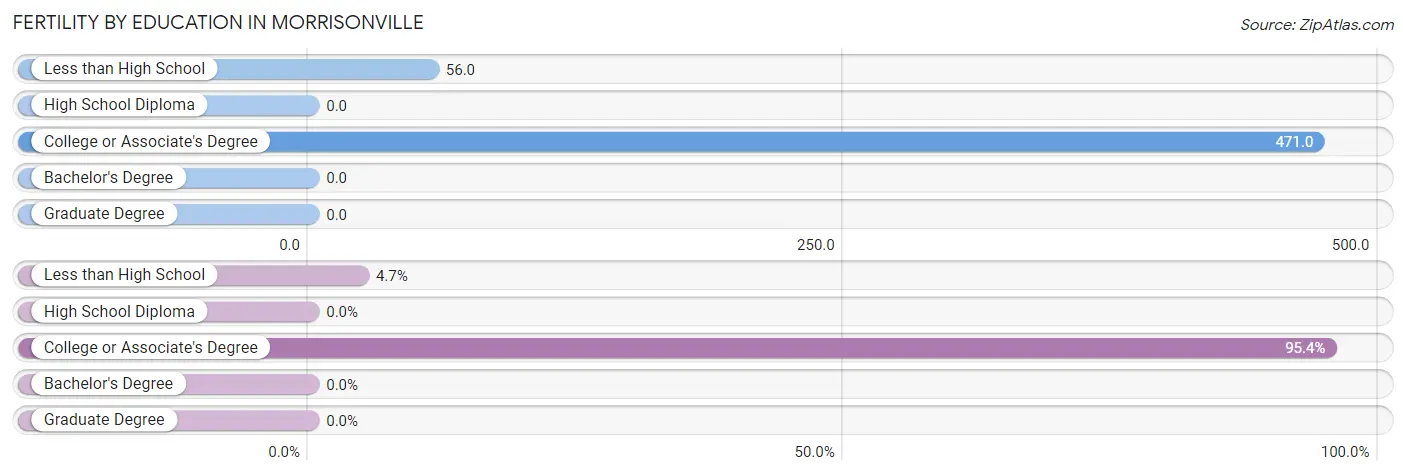
| Educational Attainment | Women with Births | Births / 1,000 Women |
| Less than High School | 2 (4.6%) | 56.0 |
| High School Diploma | 0 (0.0%) | 0.0 |
| College or Associate's Degree | 41 (95.4%) | 471.0 |
| Bachelor's Degree | 0 (0.0%) | 0.0 |
| Graduate Degree | 0 (0.0%) | 0.0 |
| Total | 43 (100.0%) | 123.0 |
Fertility by Education by Marriage Status in Morrisonville
4.6% of women with births in Morrisonville are unmarried. Women with the educational attainment of college or associate's degree are most likely to be married with 100.0% of them married at childbirth, while women with the educational attainment of less than high school are least likely to be married with 100.0% of them unmarried at childbirth.
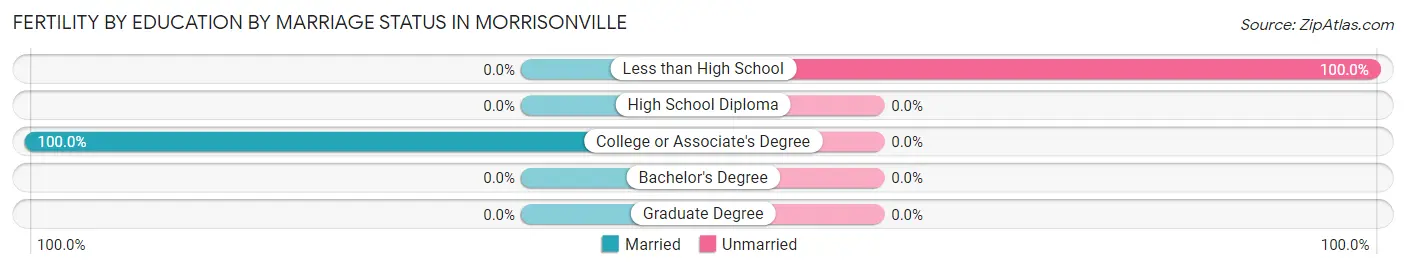
| Educational Attainment | Married | Unmarried |
| Less than High School | 0 (0.0%) | 2 (100.0%) |
| High School Diploma | 0 (0.0%) | 0 (0.0%) |
| College or Associate's Degree | 41 (100.0%) | 0 (0.0%) |
| Bachelor's Degree | 0 (0.0%) | 0 (0.0%) |
| Graduate Degree | 0 (0.0%) | 0 (0.0%) |
| Total | 41 (95.4%) | 2 (4.6%) |
Employment Characteristics in Morrisonville
Employment by Class of Employer in Morrisonville
Among the 890 employed individuals in Morrisonville, private company employees (311 | 34.9%), state government employees (172 | 19.3%), and not-for-profit organizations (156 | 17.5%) make up the most common classes of employment.
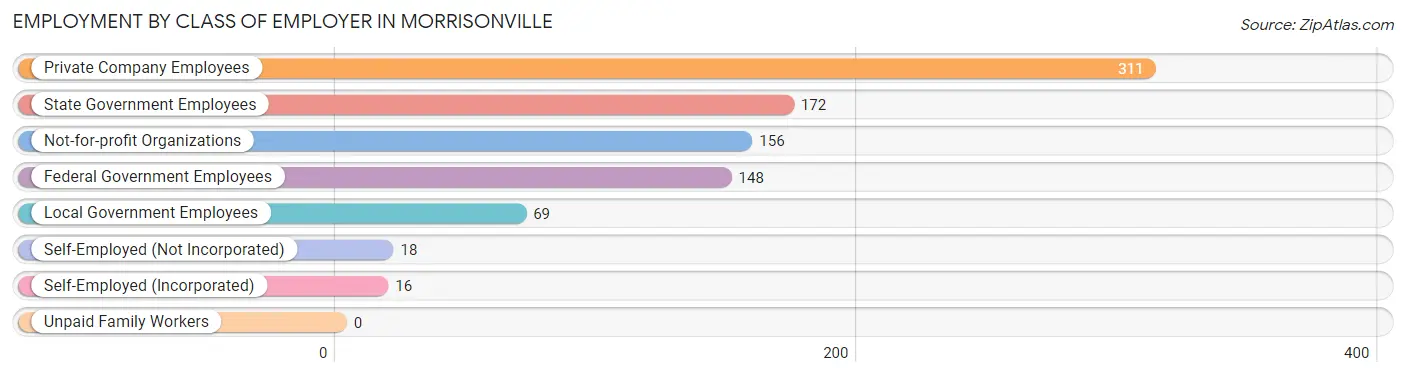
| Employer Class | # Employees | % Employees |
| Private Company Employees | 311 | 34.9% |
| Self-Employed (Incorporated) | 16 | 1.8% |
| Self-Employed (Not Incorporated) | 18 | 2.0% |
| Not-for-profit Organizations | 156 | 17.5% |
| Local Government Employees | 69 | 7.7% |
| State Government Employees | 172 | 19.3% |
| Federal Government Employees | 148 | 16.6% |
| Unpaid Family Workers | 0 | 0.0% |
| Total | 890 | 100.0% |
Employment Status by Age in Morrisonville
According to the labor force statistics for Morrisonville, out of the total population over 16 years of age (1,368), 65.2% or 892 individuals are in the labor force, with 0.3% or 3 of them unemployed. The age group with the highest labor force participation rate is 60 to 64 years, with 100.0% or 104 individuals in the labor force. Within the labor force, the 55 to 59 years age range has the highest percentage of unemployed individuals, with 8.3% or 2 of them being unemployed.
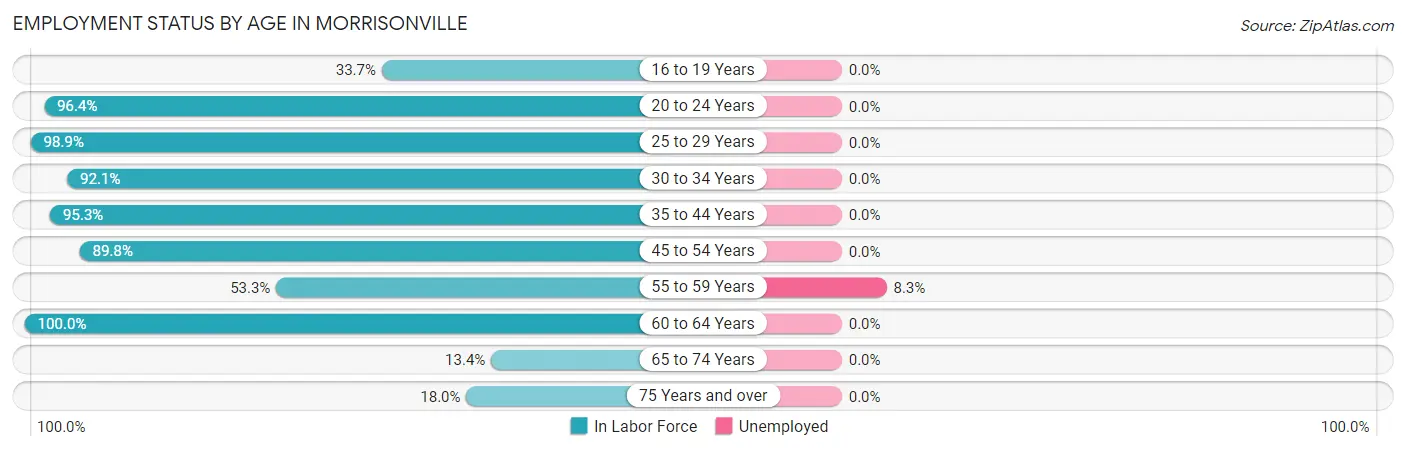
| Age Bracket | In Labor Force | Unemployed |
| 16 to 19 Years | 29 (33.7%) | 0 (0.0%) |
| 20 to 24 Years | 108 (96.4%) | 0 (0.0%) |
| 25 to 29 Years | 186 (98.9%) | 0 (0.0%) |
| 30 to 34 Years | 35 (92.1%) | 0 (0.0%) |
| 35 to 44 Years | 123 (95.3%) | 0 (0.0%) |
| 45 to 54 Years | 221 (89.8%) | 0 (0.0%) |
| 55 to 59 Years | 24 (53.3%) | 2 (8.3%) |
| 60 to 64 Years | 104 (100.0%) | 0 (0.0%) |
| 65 to 74 Years | 39 (13.4%) | 0 (0.0%) |
| 75 Years and over | 23 (18.0%) | 0 (0.0%) |
| Total | 892 (65.2%) | 3 (0.3%) |
Employment Status by Educational Attainment in Morrisonville
According to labor force statistics for Morrisonville, 92.4% of individuals (693) out of the total population between 25 and 64 years of age (750) are in the labor force, with 0.3% or 2 of them being unemployed. The group with the highest labor force participation rate are those with the educational attainment of bachelor's degree or higher, with 96.6% or 228 individuals in the labor force. Within the labor force, individuals with high school diploma education have the highest percentage of unemployment, with 1.3% or 2 of them being unemployed.
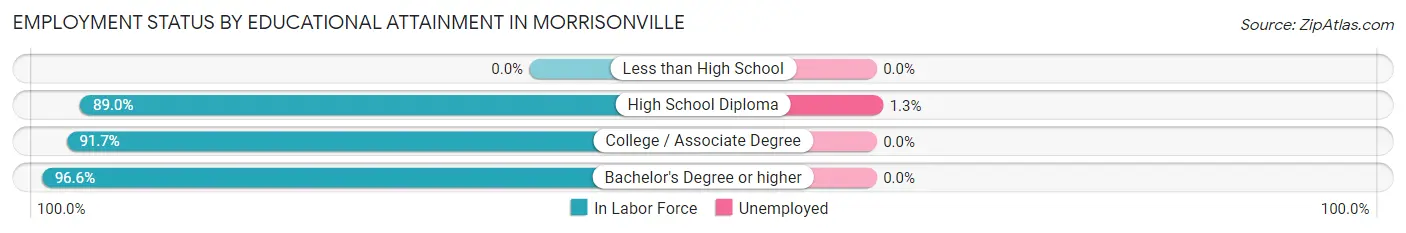
| Educational Attainment | In Labor Force | Unemployed |
| Less than High School | 0 (0.0%) | 0 (0.0%) |
| High School Diploma | 154 (89.0%) | 2 (1.3%) |
| College / Associate Degree | 311 (91.7%) | 0 (0.0%) |
| Bachelor's Degree or higher | 228 (96.6%) | 0 (0.0%) |
| Total | 693 (92.4%) | 2 (0.3%) |
Employment Occupations by Sex in Morrisonville
Management, Business, Science and Arts Occupations
The most common Management, Business, Science and Arts occupations in Morrisonville are Community & Social Service (138 | 17.6%), Business & Financial (122 | 15.6%), Management (77 | 9.9%), Education Instruction & Library (70 | 8.9%), and Education, Arts & Media (58 | 7.4%).
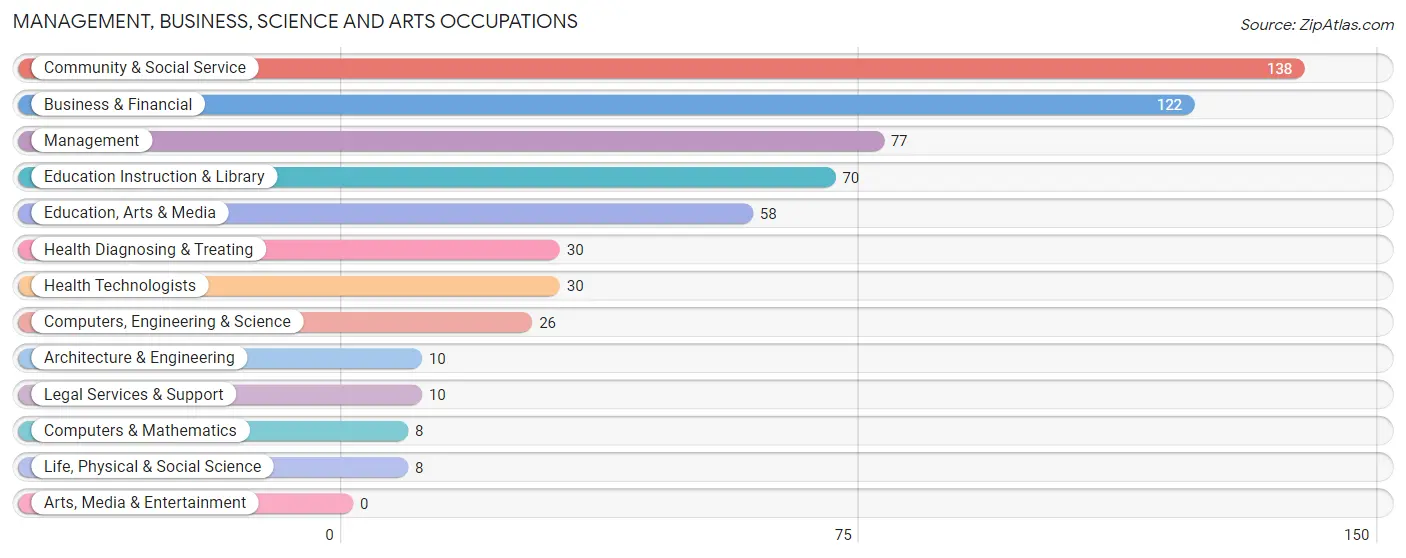
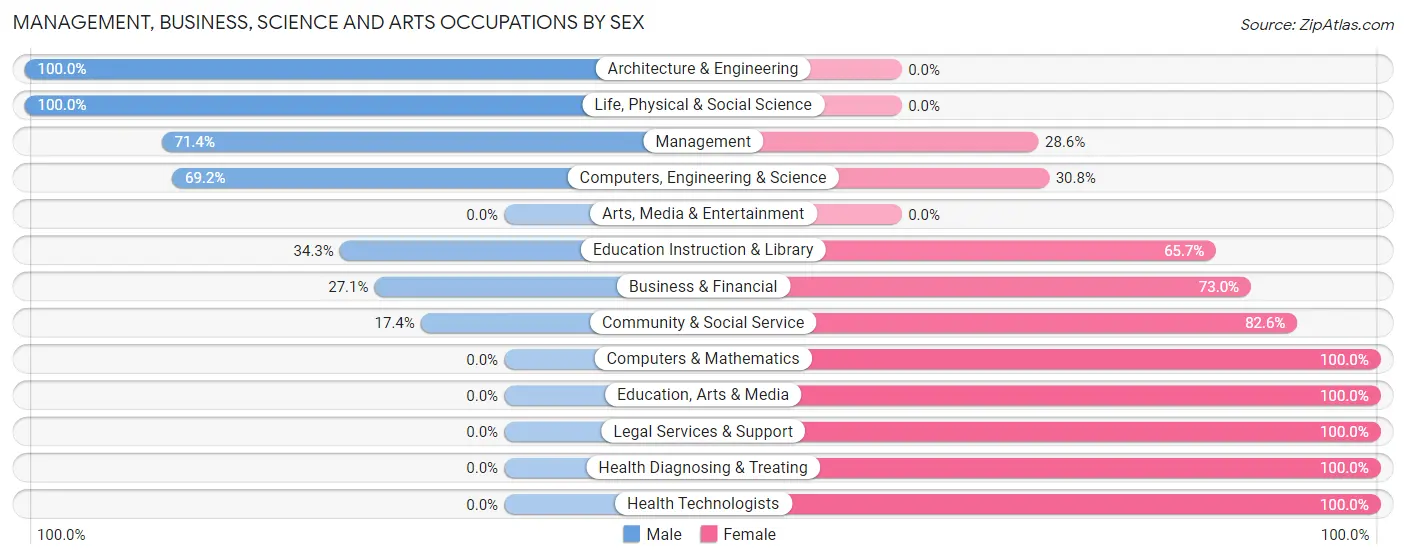
Management, Business, Science and Arts Occupations by Sex
Within the Management, Business, Science and Arts occupations in Morrisonville, the most male-oriented occupations are Architecture & Engineering (100.0%), Life, Physical & Social Science (100.0%), and Management (71.4%), while the most female-oriented occupations are Computers & Mathematics (100.0%), Education, Arts & Media (100.0%), and Legal Services & Support (100.0%).
| Occupation | Male | Female |
| Management | 55 (71.4%) | 22 (28.6%) |
| Business & Financial | 33 (27.1%) | 89 (73.0%) |
| Computers, Engineering & Science | 18 (69.2%) | 8 (30.8%) |
| Computers & Mathematics | 0 (0.0%) | 8 (100.0%) |
| Architecture & Engineering | 10 (100.0%) | 0 (0.0%) |
| Life, Physical & Social Science | 8 (100.0%) | 0 (0.0%) |
| Community & Social Service | 24 (17.4%) | 114 (82.6%) |
| Education, Arts & Media | 0 (0.0%) | 58 (100.0%) |
| Legal Services & Support | 0 (0.0%) | 10 (100.0%) |
| Education Instruction & Library | 24 (34.3%) | 46 (65.7%) |
| Arts, Media & Entertainment | 0 (0.0%) | 0 (0.0%) |
| Health Diagnosing & Treating | 0 (0.0%) | 30 (100.0%) |
| Health Technologists | 0 (0.0%) | 30 (100.0%) |
| Total (Category) | 130 (33.1%) | 263 (66.9%) |
| Total (Overall) | 365 (46.7%) | 417 (53.3%) |
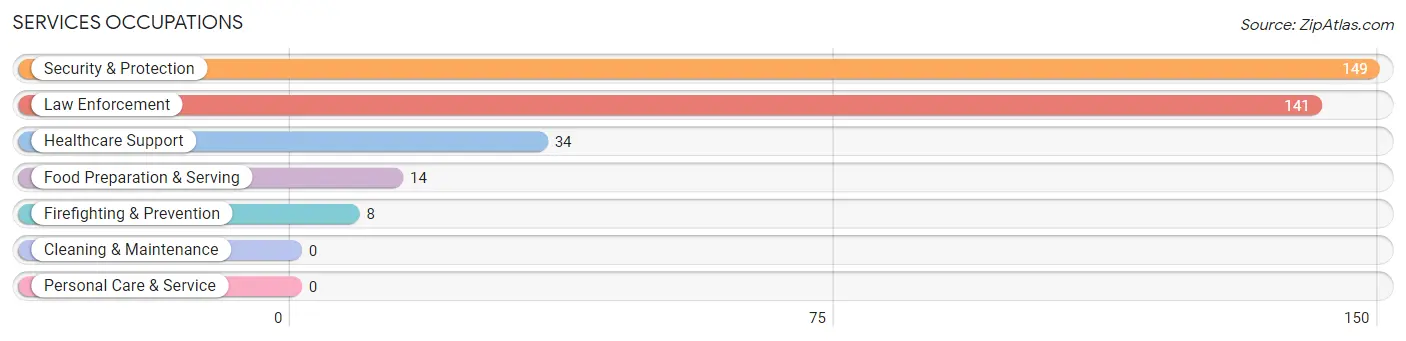
Services Occupations
The most common Services occupations in Morrisonville are Security & Protection (149 | 19.1%), Law Enforcement (141 | 18.0%), Healthcare Support (34 | 4.3%), Food Preparation & Serving (14 | 1.8%), and Firefighting & Prevention (8 | 1.0%).
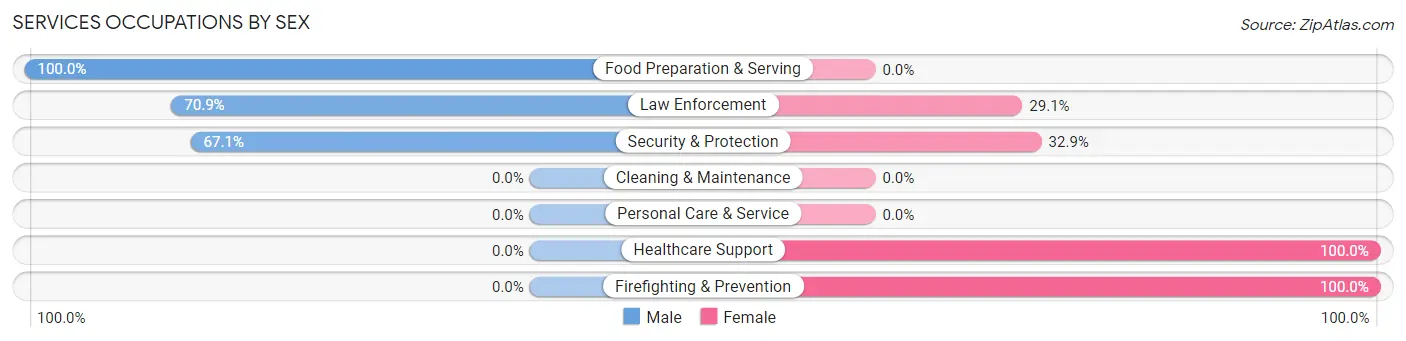
Services Occupations by Sex
Within the Services occupations in Morrisonville, the most male-oriented occupations are Food Preparation & Serving (100.0%), Law Enforcement (70.9%), and Security & Protection (67.1%), while the most female-oriented occupations are Healthcare Support (100.0%), Firefighting & Prevention (100.0%), and Security & Protection (32.9%).
| Occupation | Male | Female |
| Healthcare Support | 0 (0.0%) | 34 (100.0%) |
| Security & Protection | 100 (67.1%) | 49 (32.9%) |
| Firefighting & Prevention | 0 (0.0%) | 8 (100.0%) |
| Law Enforcement | 100 (70.9%) | 41 (29.1%) |
| Food Preparation & Serving | 14 (100.0%) | 0 (0.0%) |
| Cleaning & Maintenance | 0 (0.0%) | 0 (0.0%) |
| Personal Care & Service | 0 (0.0%) | 0 (0.0%) |
| Total (Category) | 114 (57.9%) | 83 (42.1%) |
| Total (Overall) | 365 (46.7%) | 417 (53.3%) |
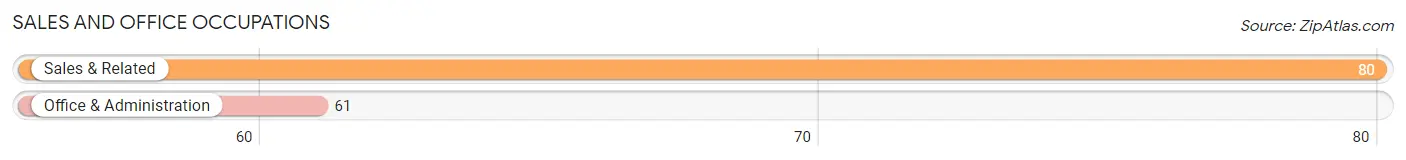
Sales and Office Occupations
The most common Sales and Office occupations in Morrisonville are Sales & Related (80 | 10.2%), and Office & Administration (61 | 7.8%).
Sales and Office Occupations by Sex
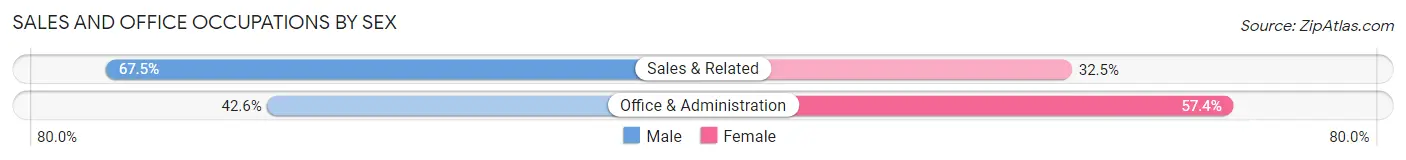
| Occupation | Male | Female |
| Sales & Related | 54 (67.5%) | 26 (32.5%) |
| Office & Administration | 26 (42.6%) | 35 (57.4%) |
| Total (Category) | 80 (56.7%) | 61 (43.3%) |
| Total (Overall) | 365 (46.7%) | 417 (53.3%) |
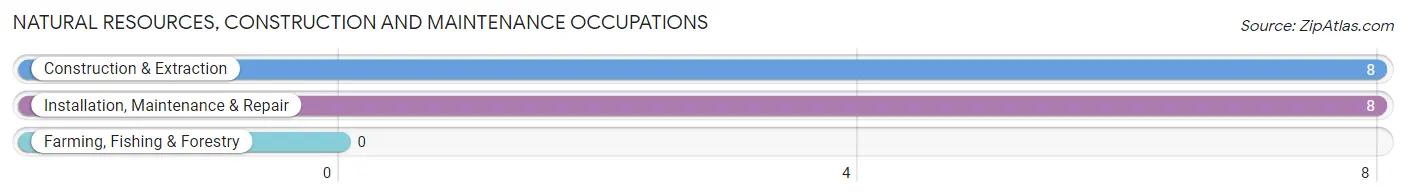
Natural Resources, Construction and Maintenance Occupations
The most common Natural Resources, Construction and Maintenance occupations in Morrisonville are Construction & Extraction (8 | 1.0%), and Installation, Maintenance & Repair (8 | 1.0%).
Natural Resources, Construction and Maintenance Occupations by Sex
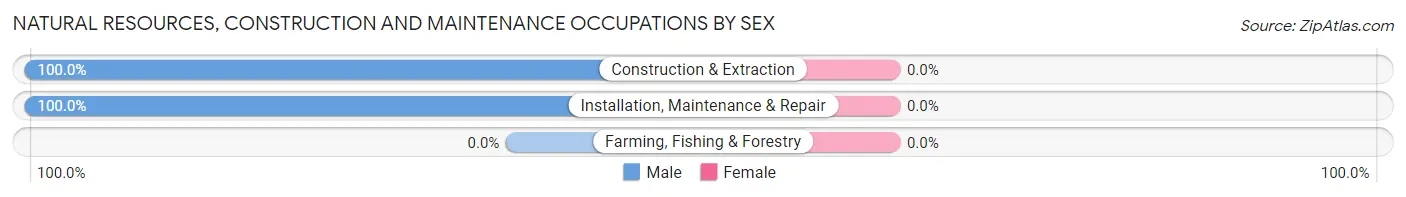
| Occupation | Male | Female |
| Farming, Fishing & Forestry | 0 (0.0%) | 0 (0.0%) |
| Construction & Extraction | 8 (100.0%) | 0 (0.0%) |
| Installation, Maintenance & Repair | 8 (100.0%) | 0 (0.0%) |
| Total (Category) | 16 (100.0%) | 0 (0.0%) |
| Total (Overall) | 365 (46.7%) | 417 (53.3%) |
Production, Transportation and Moving Occupations
The most common Production, Transportation and Moving occupations in Morrisonville are Material Moving (24 | 3.1%), and Transportation (11 | 1.4%).
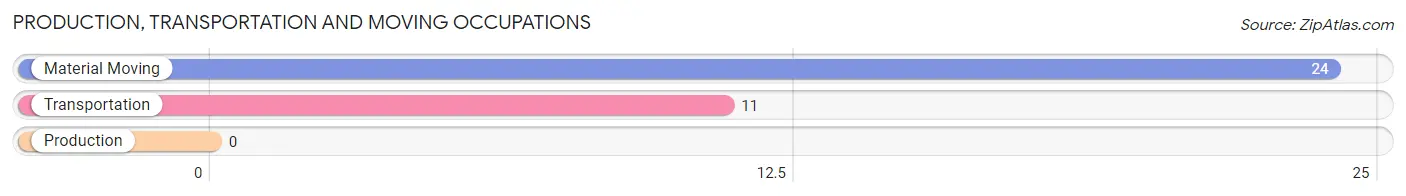
Production, Transportation and Moving Occupations by Sex
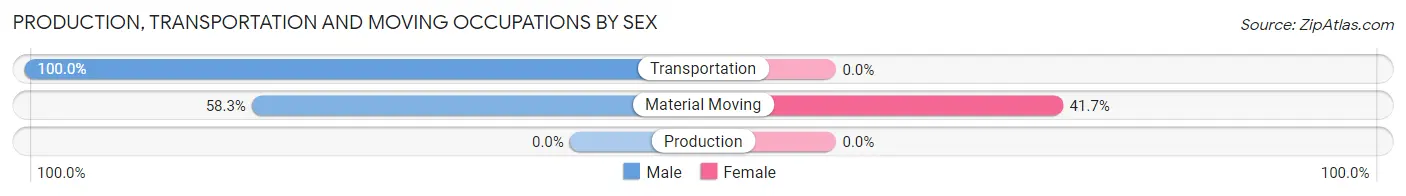
| Occupation | Male | Female |
| Production | 0 (0.0%) | 0 (0.0%) |
| Transportation | 11 (100.0%) | 0 (0.0%) |
| Material Moving | 14 (58.3%) | 10 (41.7%) |
| Total (Category) | 25 (71.4%) | 10 (28.6%) |
| Total (Overall) | 365 (46.7%) | 417 (53.3%) |
Employment Industries by Sex in Morrisonville
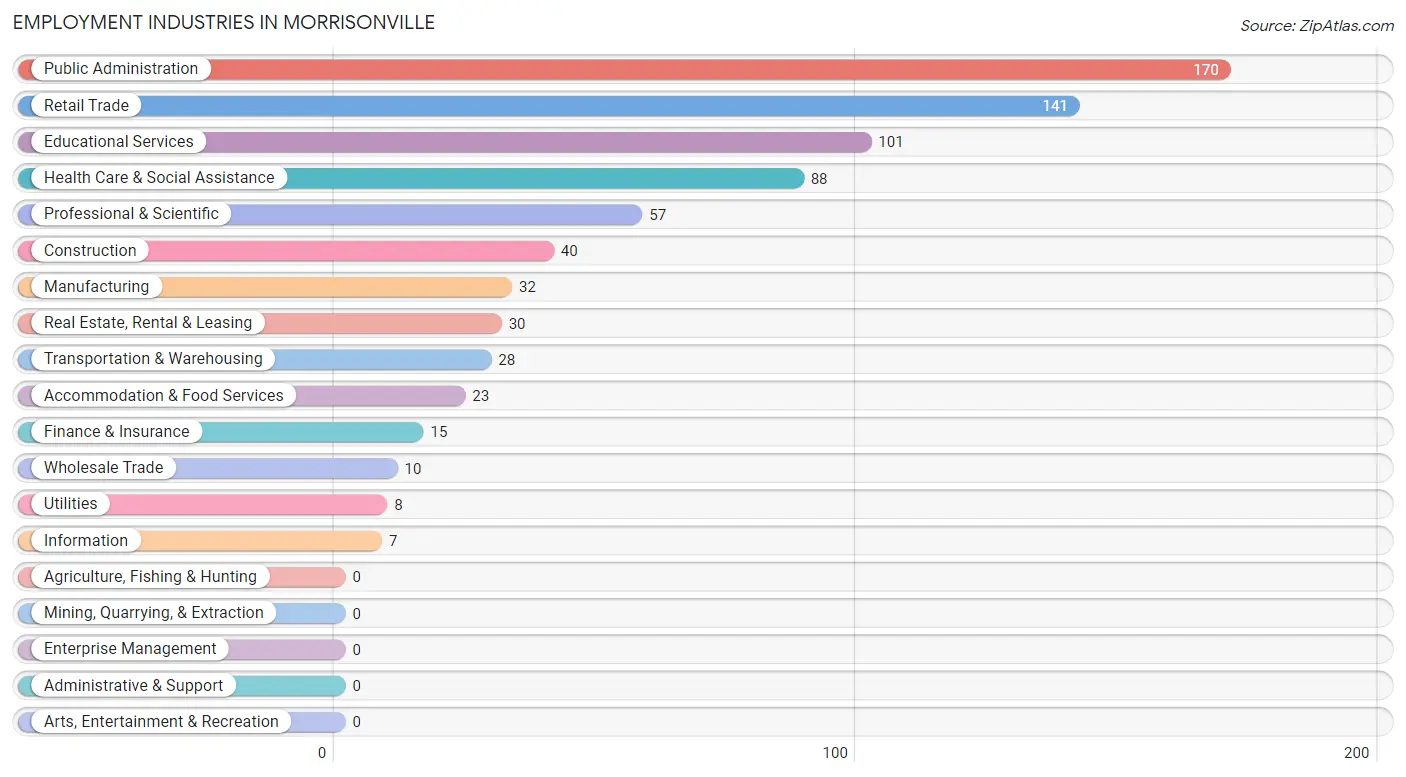
Employment Industries in Morrisonville
The major employment industries in Morrisonville include Public Administration (170 | 21.7%), Retail Trade (141 | 18.0%), Educational Services (101 | 12.9%), Health Care & Social Assistance (88 | 11.3%), and Professional & Scientific (57 | 7.3%).
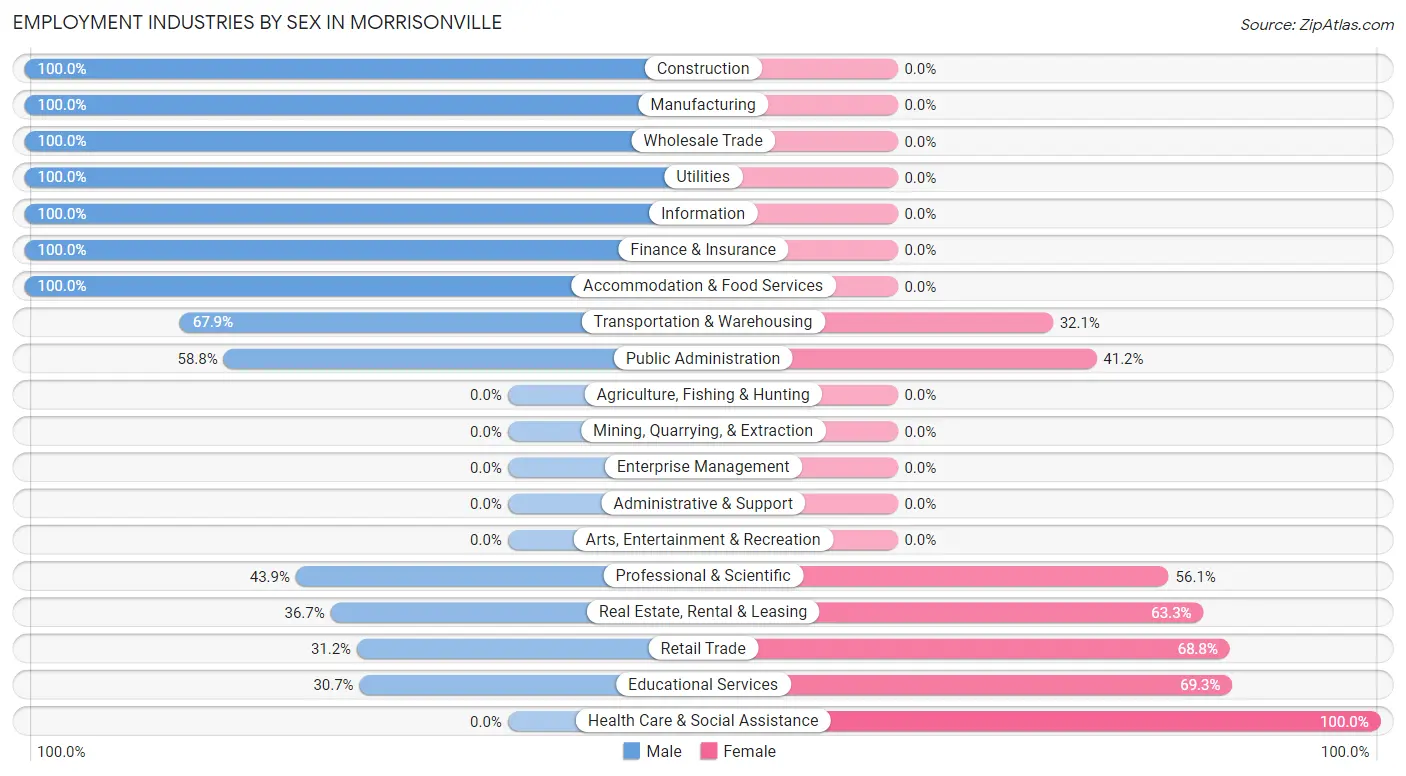
Employment Industries by Sex in Morrisonville
The Morrisonville industries that see more men than women are Construction (100.0%), Manufacturing (100.0%), and Wholesale Trade (100.0%), whereas the industries that tend to have a higher number of women are Health Care & Social Assistance (100.0%), Educational Services (69.3%), and Retail Trade (68.8%).
| Industry | Male | Female |
| Agriculture, Fishing & Hunting | 0 (0.0%) | 0 (0.0%) |
| Mining, Quarrying, & Extraction | 0 (0.0%) | 0 (0.0%) |
| Construction | 40 (100.0%) | 0 (0.0%) |
| Manufacturing | 32 (100.0%) | 0 (0.0%) |
| Wholesale Trade | 10 (100.0%) | 0 (0.0%) |
| Retail Trade | 44 (31.2%) | 97 (68.8%) |
| Transportation & Warehousing | 19 (67.9%) | 9 (32.1%) |
| Utilities | 8 (100.0%) | 0 (0.0%) |
| Information | 7 (100.0%) | 0 (0.0%) |
| Finance & Insurance | 15 (100.0%) | 0 (0.0%) |
| Real Estate, Rental & Leasing | 11 (36.7%) | 19 (63.3%) |
| Professional & Scientific | 25 (43.9%) | 32 (56.1%) |
| Enterprise Management | 0 (0.0%) | 0 (0.0%) |
| Administrative & Support | 0 (0.0%) | 0 (0.0%) |
| Educational Services | 31 (30.7%) | 70 (69.3%) |
| Health Care & Social Assistance | 0 (0.0%) | 88 (100.0%) |
| Arts, Entertainment & Recreation | 0 (0.0%) | 0 (0.0%) |
| Accommodation & Food Services | 23 (100.0%) | 0 (0.0%) |
| Public Administration | 100 (58.8%) | 70 (41.2%) |
| Total | 365 (46.7%) | 417 (53.3%) |
Education in Morrisonville
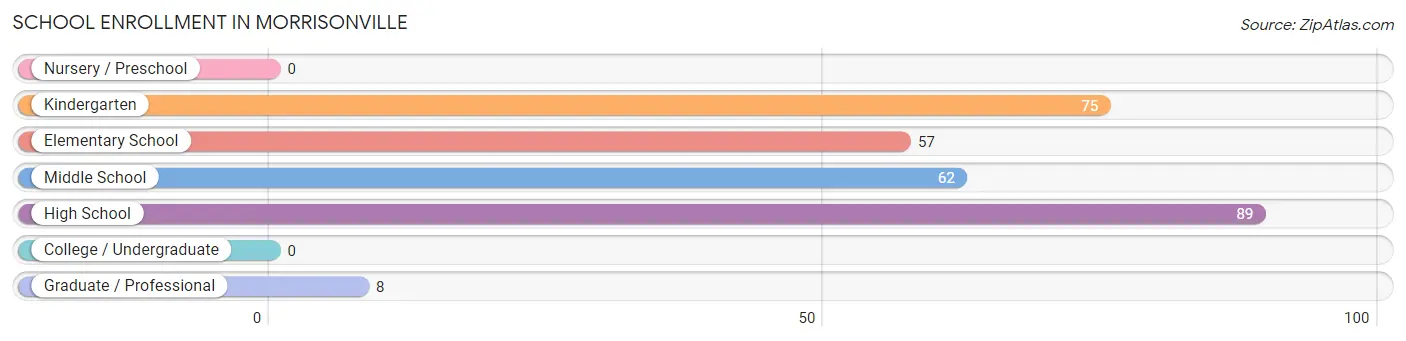
School Enrollment in Morrisonville
The most common levels of schooling among the 291 students in Morrisonville are high school (89 | 30.6%), kindergarten (75 | 25.8%), and middle school (62 | 21.3%).
| School Level | # Students | % Students |
| Nursery / Preschool | 0 | 0.0% |
| Kindergarten | 75 | 25.8% |
| Elementary School | 57 | 19.6% |
| Middle School | 62 | 21.3% |
| High School | 89 | 30.6% |
| College / Undergraduate | 0 | 0.0% |
| Graduate / Professional | 8 | 2.8% |
| Total | 291 | 100.0% |
School Enrollment by Age by Funding Source in Morrisonville
Out of a total of 291 students who are enrolled in schools in Morrisonville, 54 (18.6%) attend a private institution, while the remaining 237 (81.4%) are enrolled in public schools. The age group of 10 to 14 year olds has the highest likelihood of being enrolled in private schools, with 33 (45.2% in the age bracket) enrolled. Conversely, the age group of 5 to 9 year old has the lowest likelihood of being enrolled in a private school, with 132 (100.0% in the age bracket) attending a public institution.
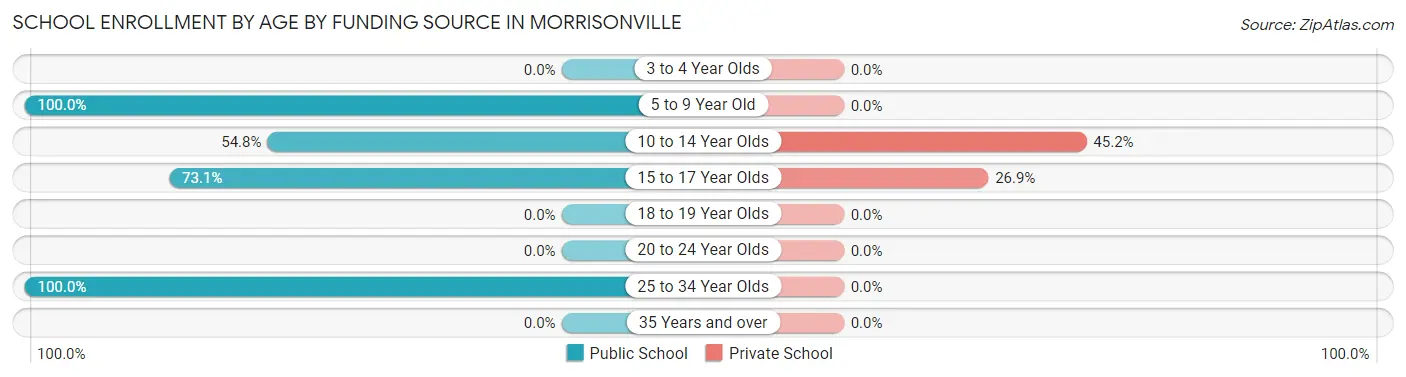
| Age Bracket | Public School | Private School |
| 3 to 4 Year Olds | 0 (0.0%) | 0 (0.0%) |
| 5 to 9 Year Old | 132 (100.0%) | 0 (0.0%) |
| 10 to 14 Year Olds | 40 (54.8%) | 33 (45.2%) |
| 15 to 17 Year Olds | 57 (73.1%) | 21 (26.9%) |
| 18 to 19 Year Olds | 0 (0.0%) | 0 (0.0%) |
| 20 to 24 Year Olds | 0 (0.0%) | 0 (0.0%) |
| 25 to 34 Year Olds | 8 (100.0%) | 0 (0.0%) |
| 35 Years and over | 0 (0.0%) | 0 (0.0%) |
| Total | 237 (81.4%) | 54 (18.6%) |
Educational Attainment by Field of Study in Morrisonville
Education (127 | 37.0%), business (53 | 15.4%), arts & humanities (38 | 11.1%), social sciences (29 | 8.5%), and science & technology (26 | 7.6%) are the most common fields of study among 343 individuals in Morrisonville who have obtained a bachelor's degree or higher.
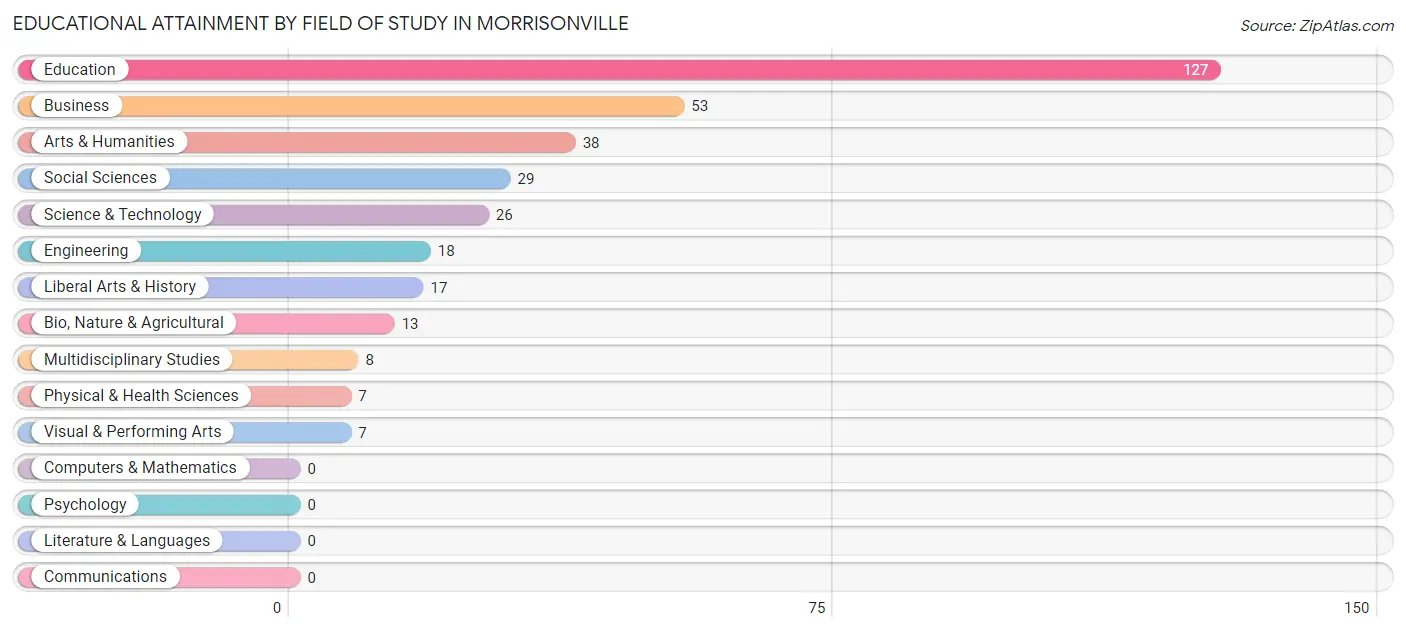
| Field of Study | # Graduates | % Graduates |
| Computers & Mathematics | 0 | 0.0% |
| Bio, Nature & Agricultural | 13 | 3.8% |
| Physical & Health Sciences | 7 | 2.0% |
| Psychology | 0 | 0.0% |
| Social Sciences | 29 | 8.5% |
| Engineering | 18 | 5.2% |
| Multidisciplinary Studies | 8 | 2.3% |
| Science & Technology | 26 | 7.6% |
| Business | 53 | 15.4% |
| Education | 127 | 37.0% |
| Literature & Languages | 0 | 0.0% |
| Liberal Arts & History | 17 | 5.0% |
| Visual & Performing Arts | 7 | 2.0% |
| Communications | 0 | 0.0% |
| Arts & Humanities | 38 | 11.1% |
| Total | 343 | 100.0% |
Transportation & Commute in Morrisonville
Vehicle Availability by Sex in Morrisonville
The most prevalent vehicle ownership categories in Morrisonville are males with 2 vehicles (231, accounting for 48.8%) and females with 2 vehicles (212, making up 55.4%).
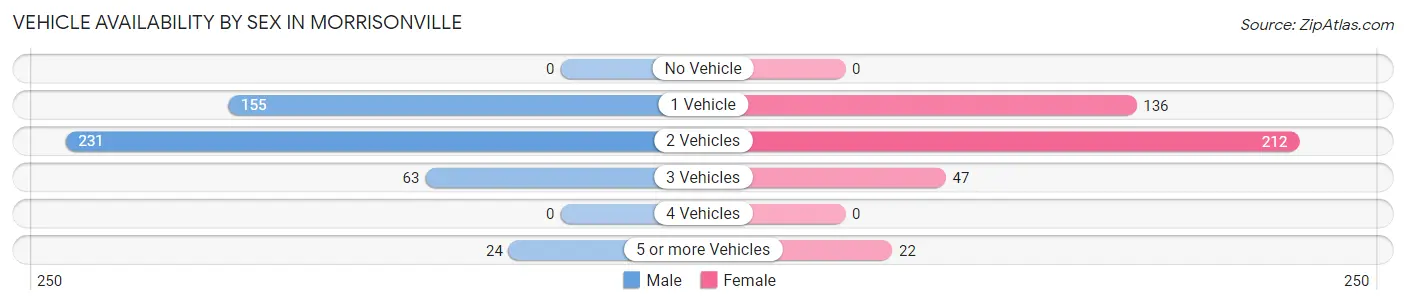
| Vehicles Available | Male | Female |
| No Vehicle | 0 (0.0%) | 0 (0.0%) |
| 1 Vehicle | 155 (32.8%) | 136 (32.6%) |
| 2 Vehicles | 231 (48.8%) | 212 (50.8%) |
| 3 Vehicles | 63 (13.3%) | 47 (11.3%) |
| 4 Vehicles | 0 (0.0%) | 0 (0.0%) |
| 5 or more Vehicles | 24 (5.1%) | 22 (5.3%) |
| Total | 473 (100.0%) | 417 (100.0%) |
Commute Time in Morrisonville
The most frequently occuring commute durations in Morrisonville are 15 to 19 minutes (293 commuters, 35.6%), 25 to 29 minutes (132 commuters, 16.0%), and 10 to 14 minutes (129 commuters, 15.7%).
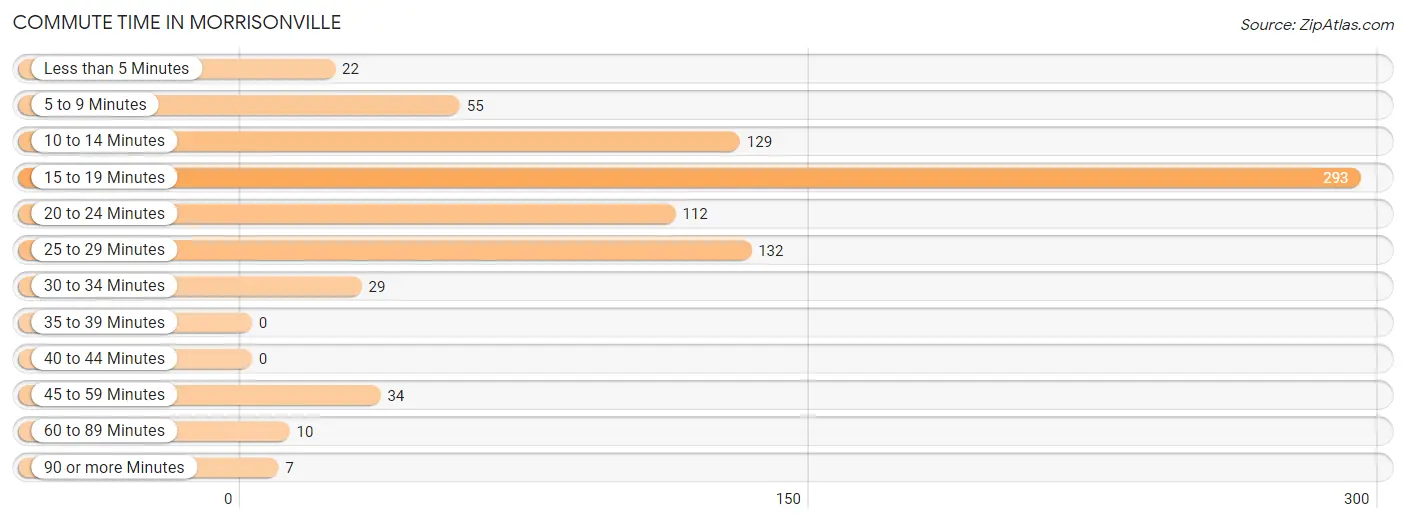
| Commute Time | # Commuters | % Commuters |
| Less than 5 Minutes | 22 | 2.7% |
| 5 to 9 Minutes | 55 | 6.7% |
| 10 to 14 Minutes | 129 | 15.7% |
| 15 to 19 Minutes | 293 | 35.6% |
| 20 to 24 Minutes | 112 | 13.6% |
| 25 to 29 Minutes | 132 | 16.0% |
| 30 to 34 Minutes | 29 | 3.5% |
| 35 to 39 Minutes | 0 | 0.0% |
| 40 to 44 Minutes | 0 | 0.0% |
| 45 to 59 Minutes | 34 | 4.1% |
| 60 to 89 Minutes | 10 | 1.2% |
| 90 or more Minutes | 7 | 0.9% |
Commute Time by Sex in Morrisonville
The most common commute times in Morrisonville are 25 to 29 minutes (132 commuters, 30.0%) for males and 15 to 19 minutes (184 commuters, 48.0%) for females.
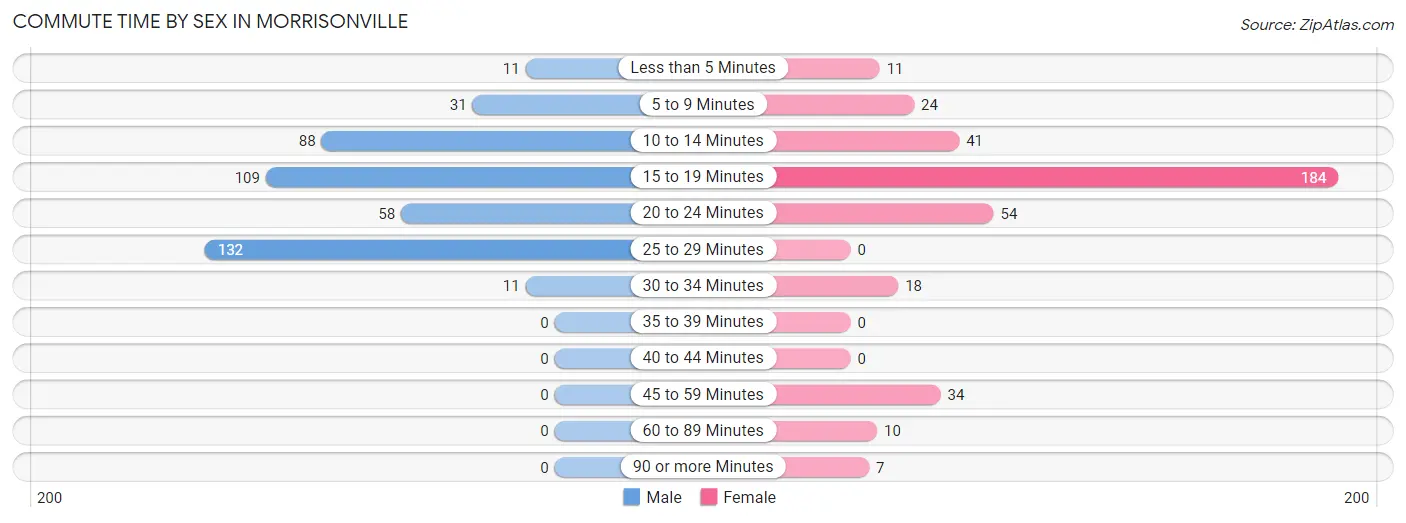
| Commute Time | Male | Female |
| Less than 5 Minutes | 11 (2.5%) | 11 (2.9%) |
| 5 to 9 Minutes | 31 (7.0%) | 24 (6.3%) |
| 10 to 14 Minutes | 88 (20.0%) | 41 (10.7%) |
| 15 to 19 Minutes | 109 (24.8%) | 184 (48.0%) |
| 20 to 24 Minutes | 58 (13.2%) | 54 (14.1%) |
| 25 to 29 Minutes | 132 (30.0%) | 0 (0.0%) |
| 30 to 34 Minutes | 11 (2.5%) | 18 (4.7%) |
| 35 to 39 Minutes | 0 (0.0%) | 0 (0.0%) |
| 40 to 44 Minutes | 0 (0.0%) | 0 (0.0%) |
| 45 to 59 Minutes | 0 (0.0%) | 34 (8.9%) |
| 60 to 89 Minutes | 0 (0.0%) | 10 (2.6%) |
| 90 or more Minutes | 0 (0.0%) | 7 (1.8%) |
Time of Departure to Work by Sex in Morrisonville
The most frequent times of departure to work in Morrisonville are 6:00 AM to 6:29 AM (201, 45.7%) for males and 7:30 AM to 7:59 AM (145, 37.9%) for females.
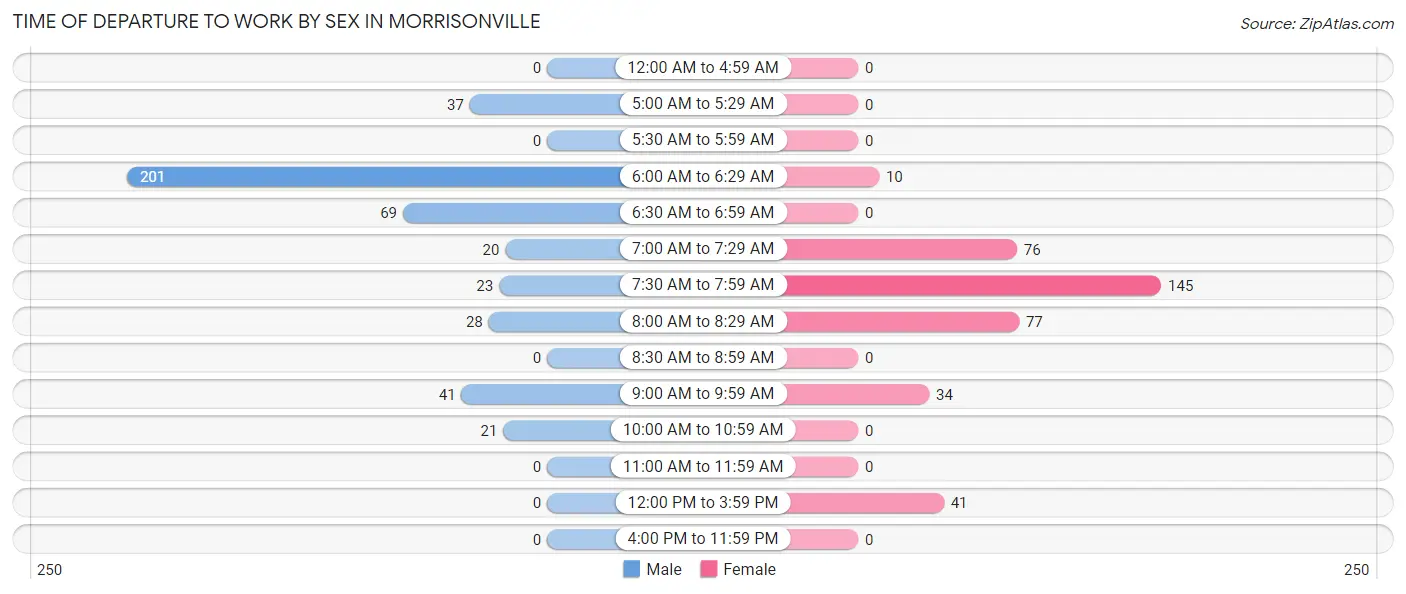
| Time of Departure | Male | Female |
| 12:00 AM to 4:59 AM | 0 (0.0%) | 0 (0.0%) |
| 5:00 AM to 5:29 AM | 37 (8.4%) | 0 (0.0%) |
| 5:30 AM to 5:59 AM | 0 (0.0%) | 0 (0.0%) |
| 6:00 AM to 6:29 AM | 201 (45.7%) | 10 (2.6%) |
| 6:30 AM to 6:59 AM | 69 (15.7%) | 0 (0.0%) |
| 7:00 AM to 7:29 AM | 20 (4.5%) | 76 (19.8%) |
| 7:30 AM to 7:59 AM | 23 (5.2%) | 145 (37.9%) |
| 8:00 AM to 8:29 AM | 28 (6.4%) | 77 (20.1%) |
| 8:30 AM to 8:59 AM | 0 (0.0%) | 0 (0.0%) |
| 9:00 AM to 9:59 AM | 41 (9.3%) | 34 (8.9%) |
| 10:00 AM to 10:59 AM | 21 (4.8%) | 0 (0.0%) |
| 11:00 AM to 11:59 AM | 0 (0.0%) | 0 (0.0%) |
| 12:00 PM to 3:59 PM | 0 (0.0%) | 41 (10.7%) |
| 4:00 PM to 11:59 PM | 0 (0.0%) | 0 (0.0%) |
| Total | 440 (100.0%) | 383 (100.0%) |
Housing Occupancy in Morrisonville
Occupancy by Ownership in Morrisonville
Of the total 718 dwellings in Morrisonville, owner-occupied units account for 490 (68.2%), while renter-occupied units make up 228 (31.8%).
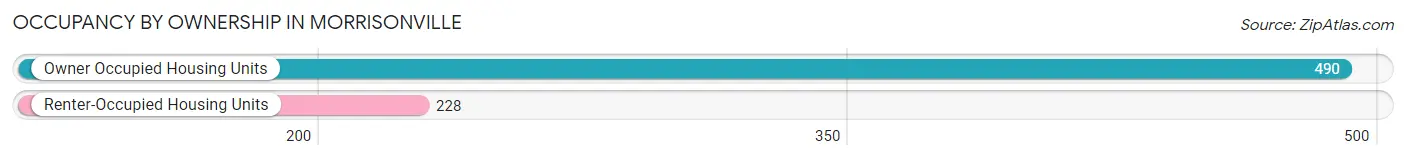
| Occupancy | # Housing Units | % Housing Units |
| Owner Occupied Housing Units | 490 | 68.2% |
| Renter-Occupied Housing Units | 228 | 31.8% |
| Total Occupied Housing Units | 718 | 100.0% |
Occupancy by Household Size in Morrisonville
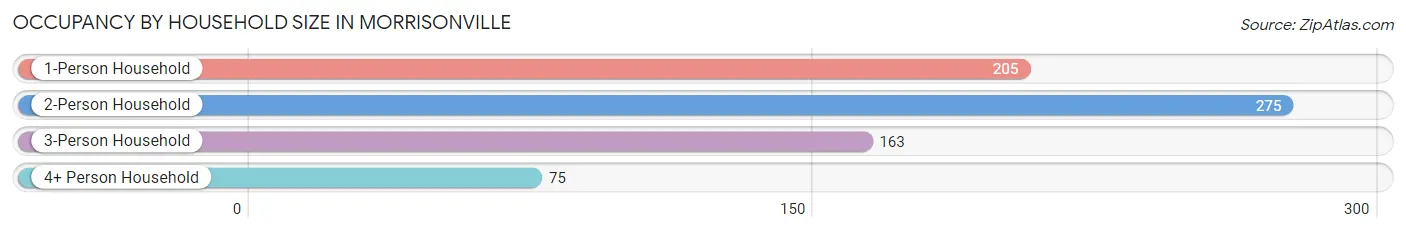
| Household Size | # Housing Units | % Housing Units |
| 1-Person Household | 205 | 28.5% |
| 2-Person Household | 275 | 38.3% |
| 3-Person Household | 163 | 22.7% |
| 4+ Person Household | 75 | 10.4% |
| Total Housing Units | 718 | 100.0% |
Occupancy by Ownership by Household Size in Morrisonville
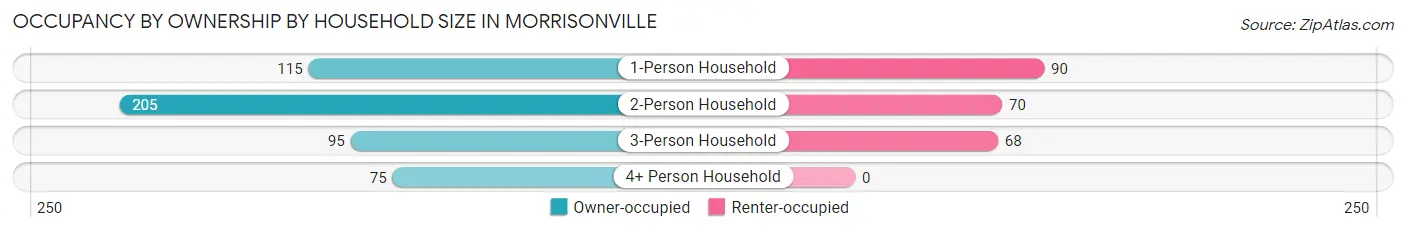
| Household Size | Owner-occupied | Renter-occupied |
| 1-Person Household | 115 (56.1%) | 90 (43.9%) |
| 2-Person Household | 205 (74.6%) | 70 (25.5%) |
| 3-Person Household | 95 (58.3%) | 68 (41.7%) |
| 4+ Person Household | 75 (100.0%) | 0 (0.0%) |
| Total Housing Units | 490 (68.2%) | 228 (31.8%) |
Occupancy by Educational Attainment in Morrisonville

| Household Size | Owner-occupied | Renter-occupied |
| Less than High School | 14 (53.8%) | 12 (46.2%) |
| High School Diploma | 81 (46.6%) | 93 (53.4%) |
| College/Associate Degree | 255 (71.8%) | 100 (28.2%) |
| Bachelor's Degree or higher | 140 (85.9%) | 23 (14.1%) |
Occupancy by Age of Householder in Morrisonville
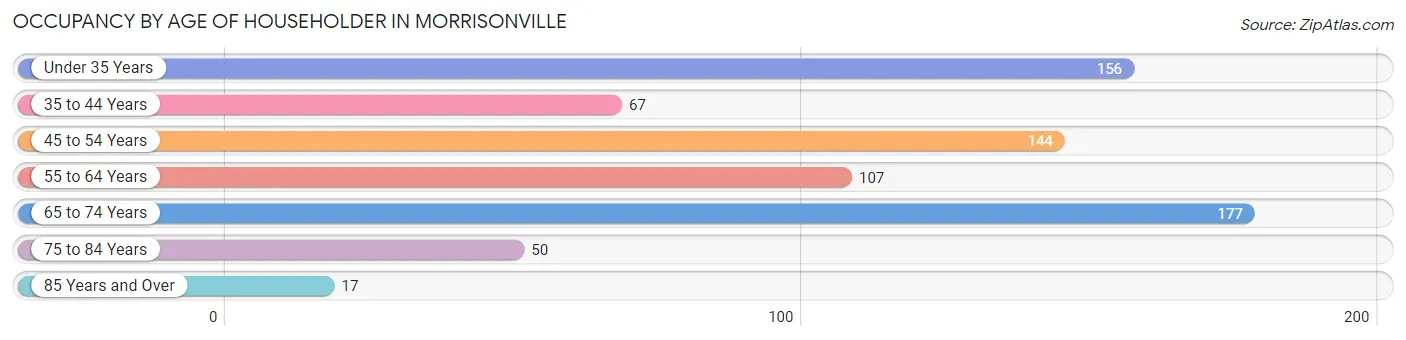
| Age Bracket | # Households | % Households |
| Under 35 Years | 156 | 21.7% |
| 35 to 44 Years | 67 | 9.3% |
| 45 to 54 Years | 144 | 20.1% |
| 55 to 64 Years | 107 | 14.9% |
| 65 to 74 Years | 177 | 24.6% |
| 75 to 84 Years | 50 | 7.0% |
| 85 Years and Over | 17 | 2.4% |
| Total | 718 | 100.0% |
Housing Finances in Morrisonville
Median Income by Occupancy in Morrisonville
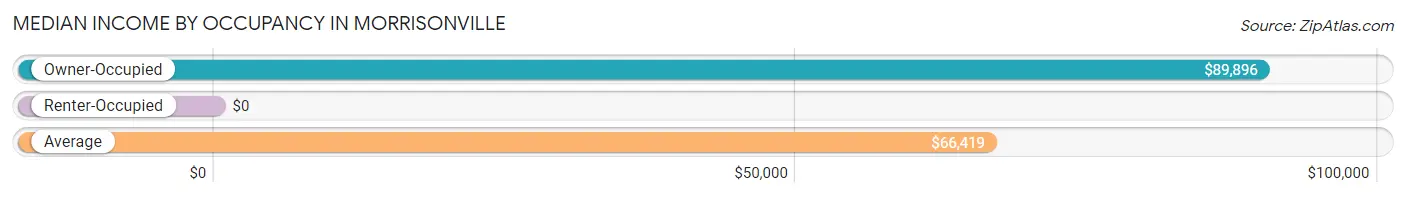
| Occupancy Type | # Households | Median Income |
| Owner-Occupied | 490 (68.2%) | $89,896 |
| Renter-Occupied | 228 (31.8%) | $0 |
| Average | 718 (100.0%) | $66,419 |
Occupancy by Householder Income Bracket in Morrisonville
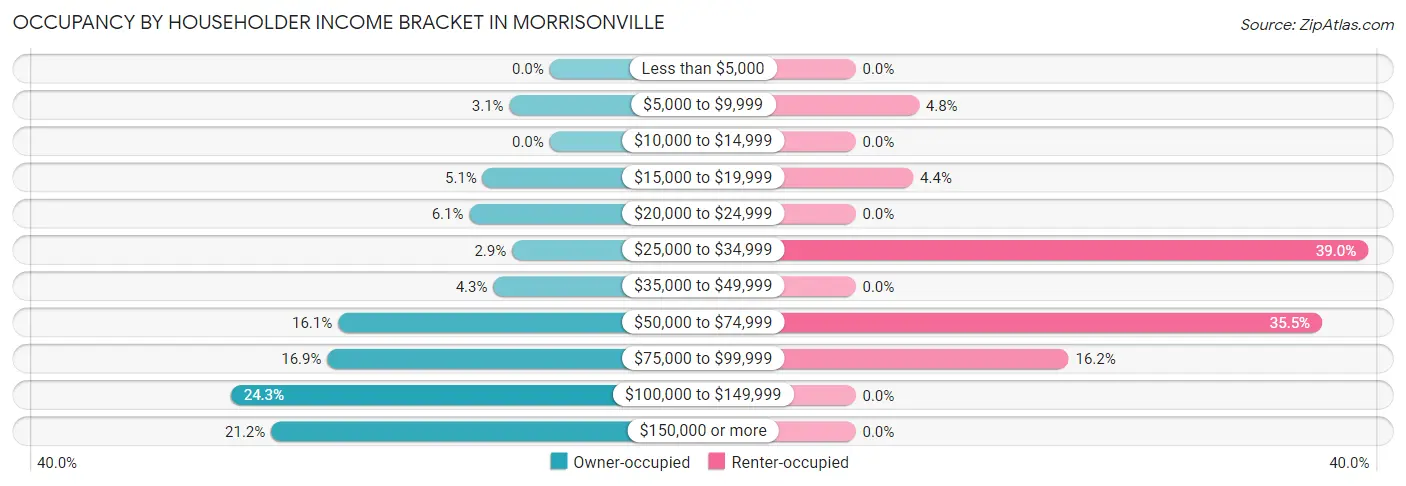
| Income Bracket | Owner-occupied | Renter-occupied |
| Less than $5,000 | 0 (0.0%) | 0 (0.0%) |
| $5,000 to $9,999 | 15 (3.1%) | 11 (4.8%) |
| $10,000 to $14,999 | 0 (0.0%) | 0 (0.0%) |
| $15,000 to $19,999 | 25 (5.1%) | 10 (4.4%) |
| $20,000 to $24,999 | 30 (6.1%) | 0 (0.0%) |
| $25,000 to $34,999 | 14 (2.9%) | 89 (39.0%) |
| $35,000 to $49,999 | 21 (4.3%) | 0 (0.0%) |
| $50,000 to $74,999 | 79 (16.1%) | 81 (35.5%) |
| $75,000 to $99,999 | 83 (16.9%) | 37 (16.2%) |
| $100,000 to $149,999 | 119 (24.3%) | 0 (0.0%) |
| $150,000 or more | 104 (21.2%) | 0 (0.0%) |
| Total | 490 (100.0%) | 228 (100.0%) |
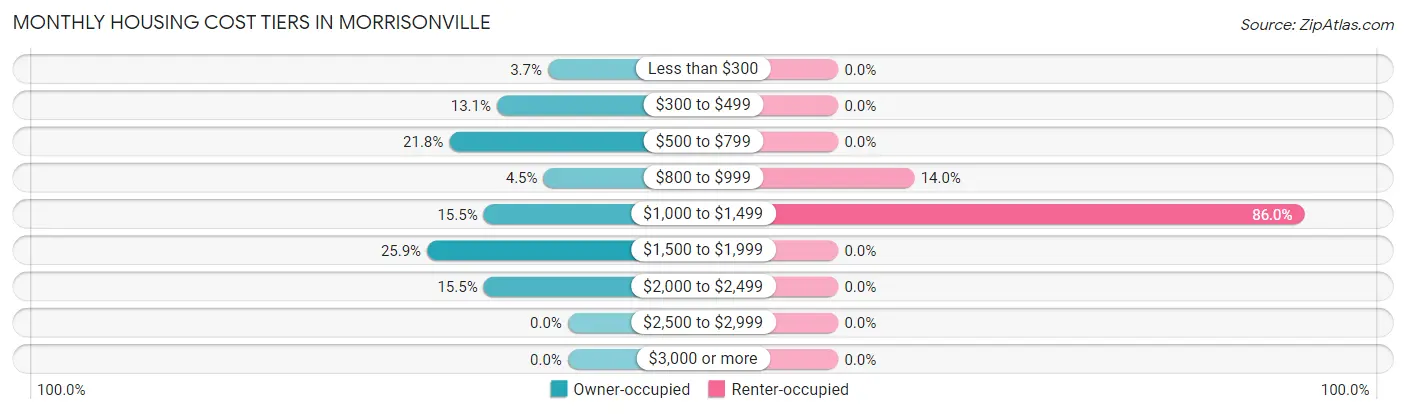
Monthly Housing Cost Tiers in Morrisonville
| Monthly Cost | Owner-occupied | Renter-occupied |
| Less than $300 | 18 (3.7%) | 0 (0.0%) |
| $300 to $499 | 64 (13.1%) | 0 (0.0%) |
| $500 to $799 | 107 (21.8%) | 0 (0.0%) |
| $800 to $999 | 22 (4.5%) | 32 (14.0%) |
| $1,000 to $1,499 | 76 (15.5%) | 196 (86.0%) |
| $1,500 to $1,999 | 127 (25.9%) | 0 (0.0%) |
| $2,000 to $2,499 | 76 (15.5%) | 0 (0.0%) |
| $2,500 to $2,999 | 0 (0.0%) | 0 (0.0%) |
| $3,000 or more | 0 (0.0%) | 0 (0.0%) |
| Total | 490 (100.0%) | 228 (100.0%) |
Physical Housing Characteristics in Morrisonville
Housing Structures in Morrisonville
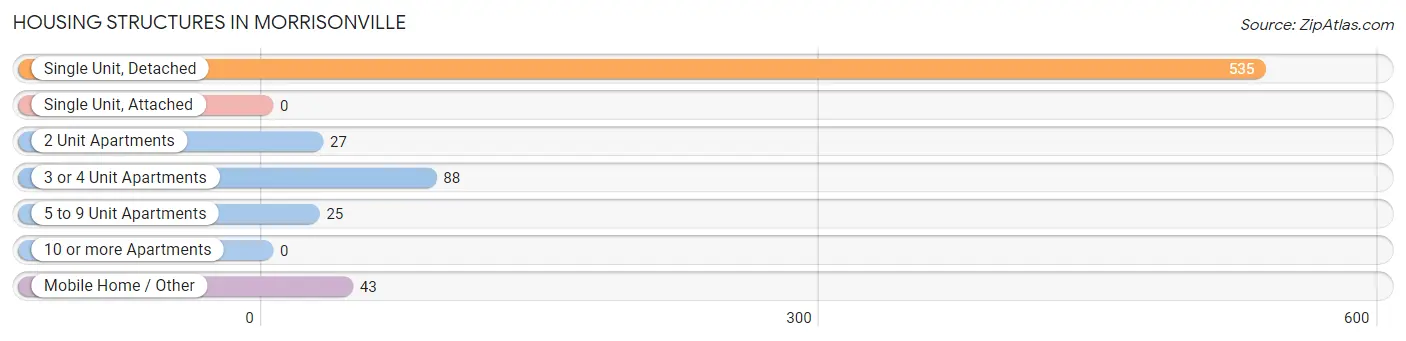
| Structure Type | # Housing Units | % Housing Units |
| Single Unit, Detached | 535 | 74.5% |
| Single Unit, Attached | 0 | 0.0% |
| 2 Unit Apartments | 27 | 3.8% |
| 3 or 4 Unit Apartments | 88 | 12.3% |
| 5 to 9 Unit Apartments | 25 | 3.5% |
| 10 or more Apartments | 0 | 0.0% |
| Mobile Home / Other | 43 | 6.0% |
| Total | 718 | 100.0% |
Housing Structures by Occupancy in Morrisonville
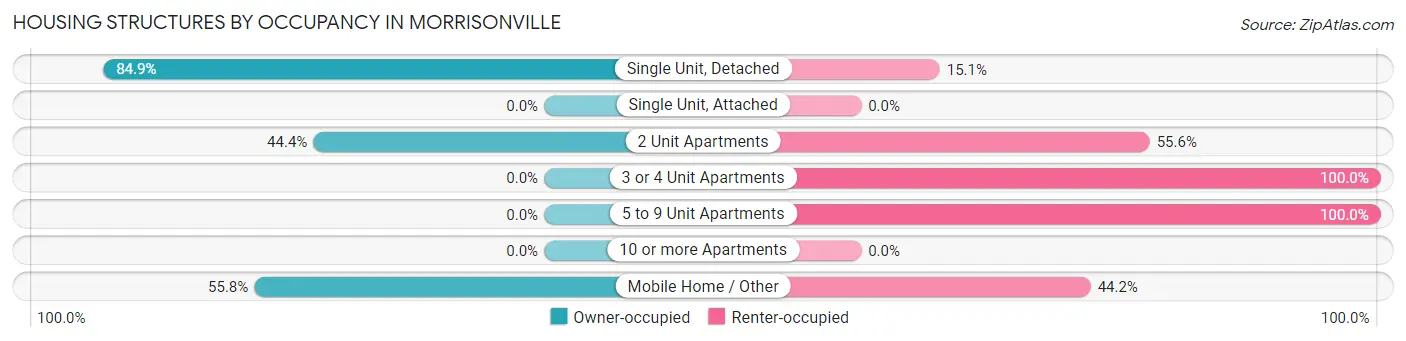
| Structure Type | Owner-occupied | Renter-occupied |
| Single Unit, Detached | 454 (84.9%) | 81 (15.1%) |
| Single Unit, Attached | 0 (0.0%) | 0 (0.0%) |
| 2 Unit Apartments | 12 (44.4%) | 15 (55.6%) |
| 3 or 4 Unit Apartments | 0 (0.0%) | 88 (100.0%) |
| 5 to 9 Unit Apartments | 0 (0.0%) | 25 (100.0%) |
| 10 or more Apartments | 0 (0.0%) | 0 (0.0%) |
| Mobile Home / Other | 24 (55.8%) | 19 (44.2%) |
| Total | 490 (68.2%) | 228 (31.8%) |
Housing Structures by Number of Rooms in Morrisonville
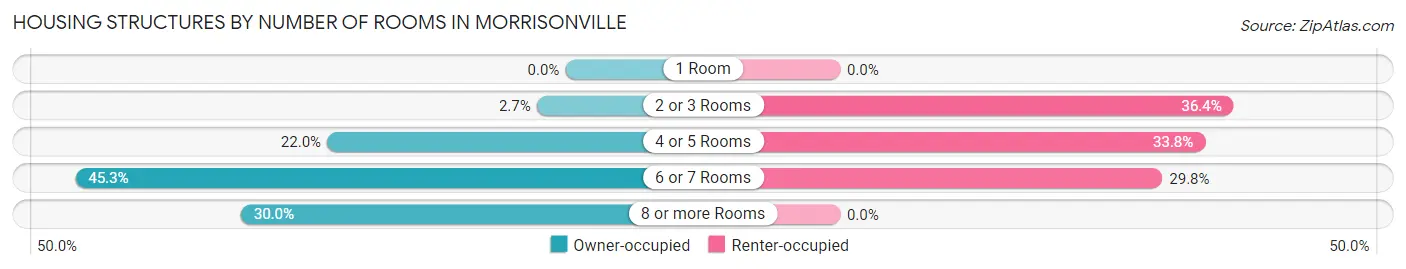
| Number of Rooms | Owner-occupied | Renter-occupied |
| 1 Room | 0 (0.0%) | 0 (0.0%) |
| 2 or 3 Rooms | 13 (2.6%) | 83 (36.4%) |
| 4 or 5 Rooms | 108 (22.0%) | 77 (33.8%) |
| 6 or 7 Rooms | 222 (45.3%) | 68 (29.8%) |
| 8 or more Rooms | 147 (30.0%) | 0 (0.0%) |
| Total | 490 (100.0%) | 228 (100.0%) |
Housing Structure by Heating Type in Morrisonville
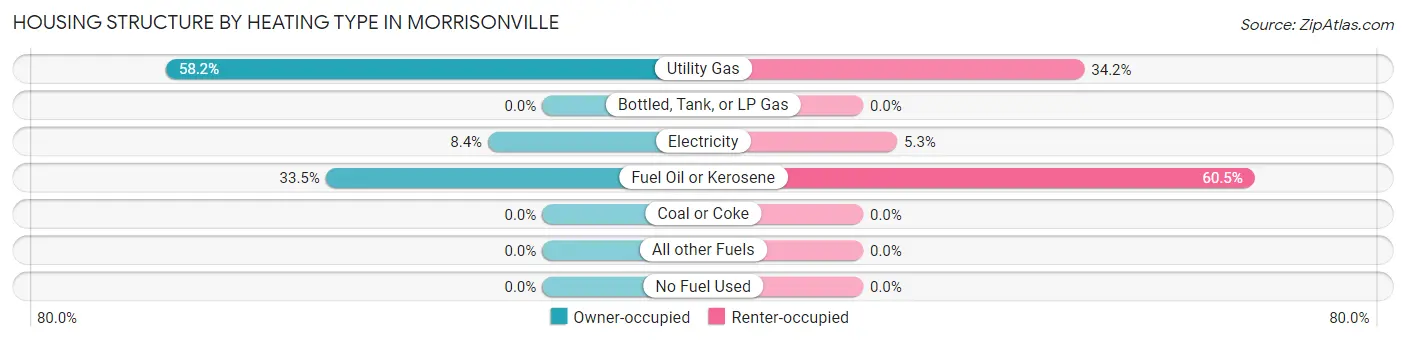
| Heating Type | Owner-occupied | Renter-occupied |
| Utility Gas | 285 (58.2%) | 78 (34.2%) |
| Bottled, Tank, or LP Gas | 0 (0.0%) | 0 (0.0%) |
| Electricity | 41 (8.4%) | 12 (5.3%) |
| Fuel Oil or Kerosene | 164 (33.5%) | 138 (60.5%) |
| Coal or Coke | 0 (0.0%) | 0 (0.0%) |
| All other Fuels | 0 (0.0%) | 0 (0.0%) |
| No Fuel Used | 0 (0.0%) | 0 (0.0%) |
| Total | 490 (100.0%) | 228 (100.0%) |
Household Vehicle Usage in Morrisonville
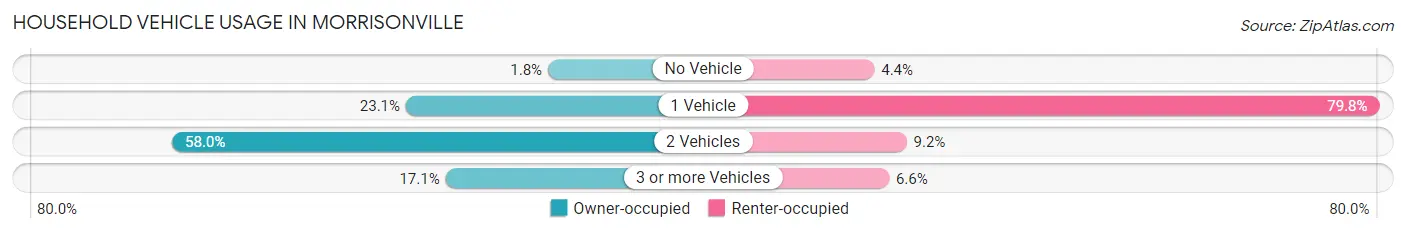
| Vehicles per Household | Owner-occupied | Renter-occupied |
| No Vehicle | 9 (1.8%) | 10 (4.4%) |
| 1 Vehicle | 113 (23.1%) | 182 (79.8%) |
| 2 Vehicles | 284 (58.0%) | 21 (9.2%) |
| 3 or more Vehicles | 84 (17.1%) | 15 (6.6%) |
| Total | 490 (100.0%) | 228 (100.0%) |
Real Estate & Mortgages in Morrisonville
Real Estate and Mortgage Overview in Morrisonville
| Characteristic | Without Mortgage | With Mortgage |
| Housing Units | 227 | 263 |
| Median Property Value | $208,500 | $221,800 |
| Median Household Income | $62,232 | $65 |
| Monthly Housing Costs | $551 | $0 |
| Real Estate Taxes | $3,750 | $10 |
Property Value by Mortgage Status in Morrisonville
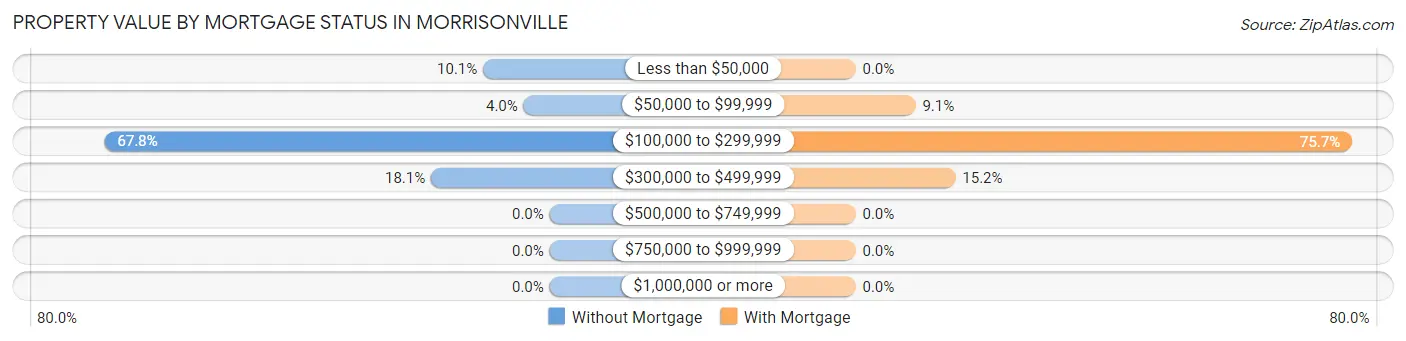
| Property Value | Without Mortgage | With Mortgage |
| Less than $50,000 | 23 (10.1%) | 0 (0.0%) |
| $50,000 to $99,999 | 9 (4.0%) | 24 (9.1%) |
| $100,000 to $299,999 | 154 (67.8%) | 199 (75.7%) |
| $300,000 to $499,999 | 41 (18.1%) | 40 (15.2%) |
| $500,000 to $749,999 | 0 (0.0%) | 0 (0.0%) |
| $750,000 to $999,999 | 0 (0.0%) | 0 (0.0%) |
| $1,000,000 or more | 0 (0.0%) | 0 (0.0%) |
| Total | 227 (100.0%) | 263 (100.0%) |
Household Income by Mortgage Status in Morrisonville
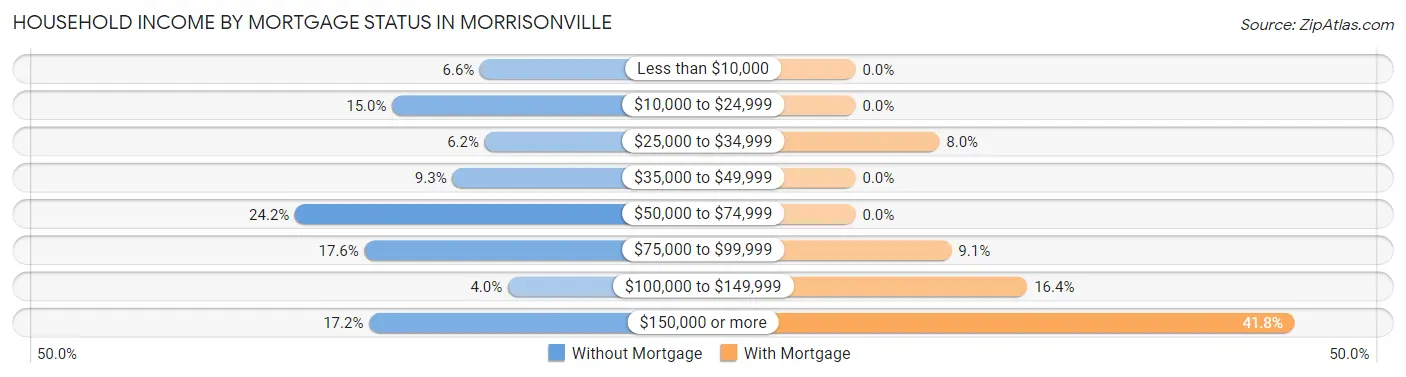
| Household Income | Without Mortgage | With Mortgage |
| Less than $10,000 | 15 (6.6%) | 0 (0.0%) |
| $10,000 to $24,999 | 34 (15.0%) | 0 (0.0%) |
| $25,000 to $34,999 | 14 (6.2%) | 21 (8.0%) |
| $35,000 to $49,999 | 21 (9.2%) | 0 (0.0%) |
| $50,000 to $74,999 | 55 (24.2%) | 0 (0.0%) |
| $75,000 to $99,999 | 40 (17.6%) | 24 (9.1%) |
| $100,000 to $149,999 | 9 (4.0%) | 43 (16.4%) |
| $150,000 or more | 39 (17.2%) | 110 (41.8%) |
| Total | 227 (100.0%) | 263 (100.0%) |
Property Value to Household Income Ratio in Morrisonville
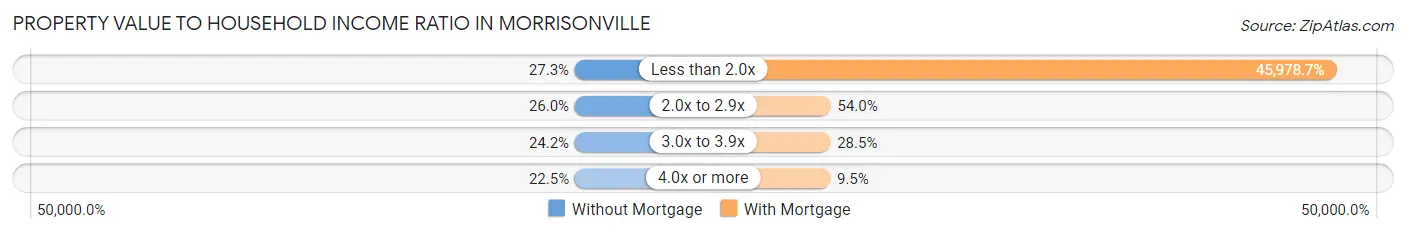
| Value-to-Income Ratio | Without Mortgage | With Mortgage |
| Less than 2.0x | 62 (27.3%) | 120,924 (45,978.7%) |
| 2.0x to 2.9x | 59 (26.0%) | 142 (54.0%) |
| 3.0x to 3.9x | 55 (24.2%) | 75 (28.5%) |
| 4.0x or more | 51 (22.5%) | 25 (9.5%) |
| Total | 227 (100.0%) | 263 (100.0%) |
Real Estate Taxes by Mortgage Status in Morrisonville
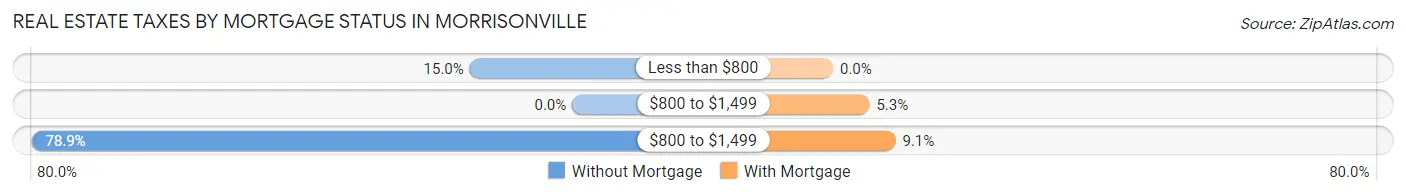
| Property Taxes | Without Mortgage | With Mortgage |
| Less than $800 | 34 (15.0%) | 0 (0.0%) |
| $800 to $1,499 | 0 (0.0%) | 14 (5.3%) |
| $800 to $1,499 | 179 (78.8%) | 24 (9.1%) |
| Total | 227 (100.0%) | 263 (100.0%) |
Health & Disability in Morrisonville
Health Insurance Coverage by Age in Morrisonville
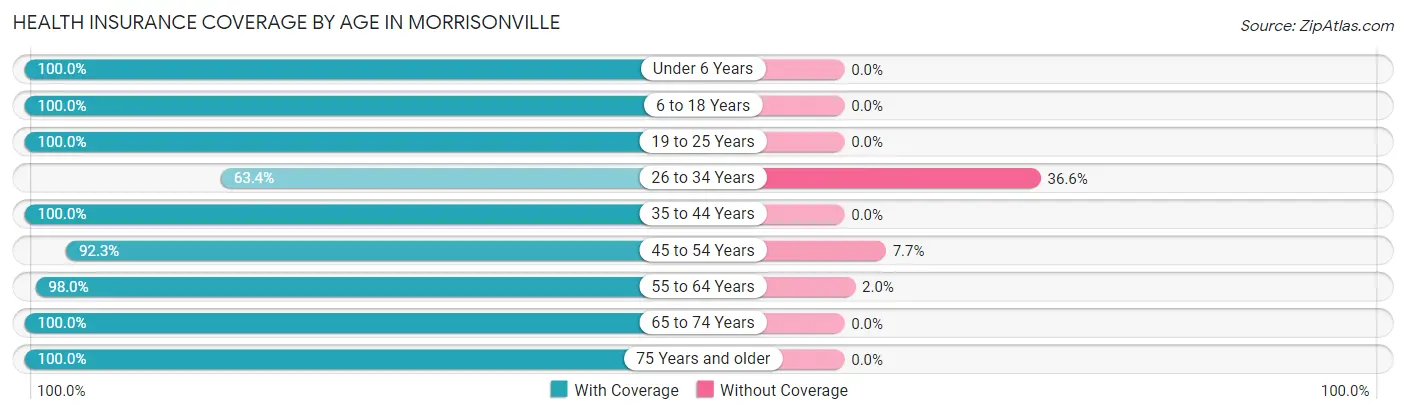
| Age Bracket | With Coverage | Without Coverage |
| Under 6 Years | 112 (100.0%) | 0 (0.0%) |
| 6 to 18 Years | 245 (100.0%) | 0 (0.0%) |
| 19 to 25 Years | 6 (100.0%) | 0 (0.0%) |
| 26 to 34 Years | 142 (63.4%) | 82 (36.6%) |
| 35 to 44 Years | 129 (100.0%) | 0 (0.0%) |
| 45 to 54 Years | 227 (92.3%) | 19 (7.7%) |
| 55 to 64 Years | 146 (98.0%) | 3 (2.0%) |
| 65 to 74 Years | 292 (100.0%) | 0 (0.0%) |
| 75 Years and older | 128 (100.0%) | 0 (0.0%) |
| Total | 1,427 (93.2%) | 104 (6.8%) |
Health Insurance Coverage by Citizenship Status in Morrisonville
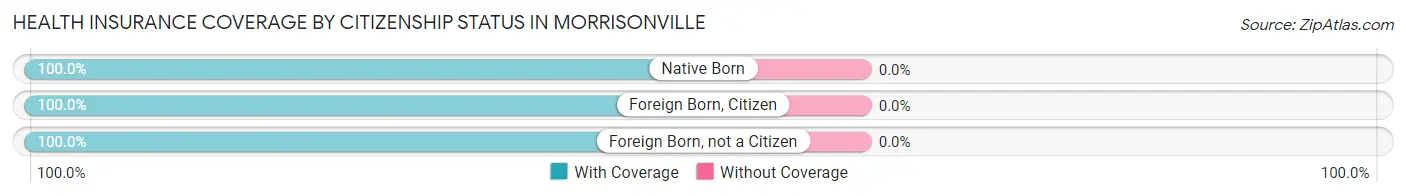
| Citizenship Status | With Coverage | Without Coverage |
| Native Born | 112 (100.0%) | 0 (0.0%) |
| Foreign Born, Citizen | 245 (100.0%) | 0 (0.0%) |
| Foreign Born, not a Citizen | 6 (100.0%) | 0 (0.0%) |
Health Insurance Coverage by Household Income in Morrisonville
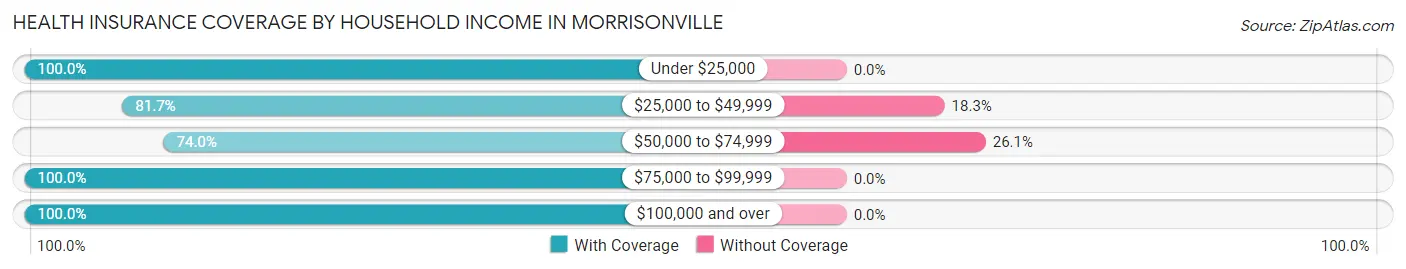
| Household Income | With Coverage | Without Coverage |
| Under $25,000 | 158 (100.0%) | 0 (0.0%) |
| $25,000 to $49,999 | 147 (81.7%) | 33 (18.3%) |
| $50,000 to $74,999 | 193 (74.0%) | 68 (26.1%) |
| $75,000 to $99,999 | 231 (100.0%) | 0 (0.0%) |
| $100,000 and over | 676 (100.0%) | 0 (0.0%) |
Public vs Private Health Insurance Coverage by Age in Morrisonville
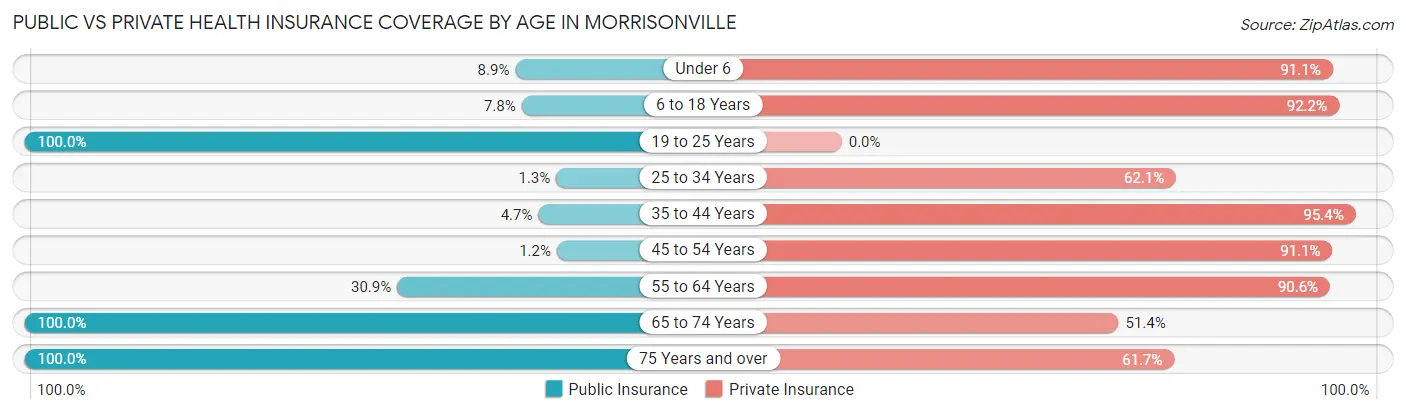
| Age Bracket | Public Insurance | Private Insurance |
| Under 6 | 10 (8.9%) | 102 (91.1%) |
| 6 to 18 Years | 19 (7.8%) | 226 (92.2%) |
| 19 to 25 Years | 6 (100.0%) | 0 (0.0%) |
| 25 to 34 Years | 3 (1.3%) | 139 (62.1%) |
| 35 to 44 Years | 6 (4.6%) | 123 (95.4%) |
| 45 to 54 Years | 3 (1.2%) | 224 (91.1%) |
| 55 to 64 Years | 46 (30.9%) | 135 (90.6%) |
| 65 to 74 Years | 292 (100.0%) | 150 (51.4%) |
| 75 Years and over | 128 (100.0%) | 79 (61.7%) |
| Total | 513 (33.5%) | 1,178 (76.9%) |
Disability Status by Sex by Age in Morrisonville
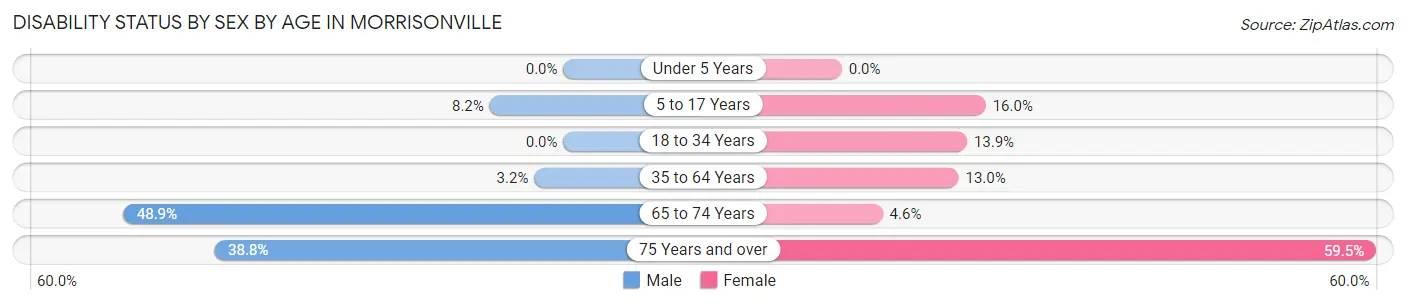
| Age Bracket | Male | Female |
| Under 5 Years | 0 (0.0%) | 0 (0.0%) |
| 5 to 17 Years | 11 (8.2%) | 25 (16.0%) |
| 18 to 34 Years | 0 (0.0%) | 23 (13.9%) |
| 35 to 64 Years | 8 (3.2%) | 36 (13.0%) |
| 65 to 74 Years | 46 (48.9%) | 9 (4.5%) |
| 75 Years and over | 19 (38.8%) | 47 (59.5%) |
Disability Class by Sex by Age in Morrisonville
Disability Class: Hearing Difficulty
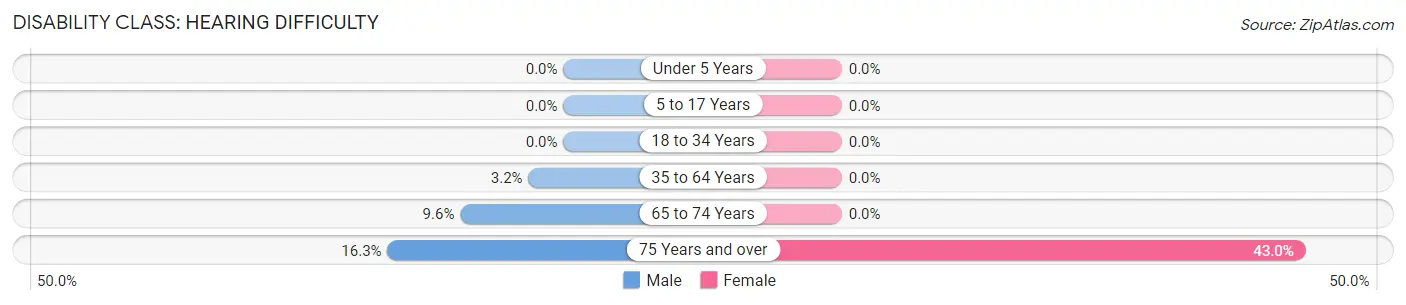
| Age Bracket | Male | Female |
| Under 5 Years | 0 (0.0%) | 0 (0.0%) |
| 5 to 17 Years | 0 (0.0%) | 0 (0.0%) |
| 18 to 34 Years | 0 (0.0%) | 0 (0.0%) |
| 35 to 64 Years | 8 (3.2%) | 0 (0.0%) |
| 65 to 74 Years | 9 (9.6%) | 0 (0.0%) |
| 75 Years and over | 8 (16.3%) | 34 (43.0%) |
Disability Class: Vision Difficulty
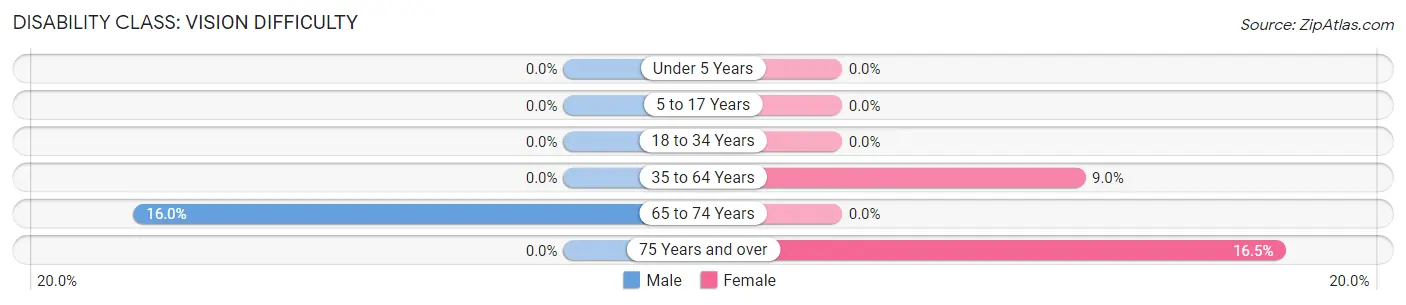
| Age Bracket | Male | Female |
| Under 5 Years | 0 (0.0%) | 0 (0.0%) |
| 5 to 17 Years | 0 (0.0%) | 0 (0.0%) |
| 18 to 34 Years | 0 (0.0%) | 0 (0.0%) |
| 35 to 64 Years | 0 (0.0%) | 25 (9.0%) |
| 65 to 74 Years | 15 (16.0%) | 0 (0.0%) |
| 75 Years and over | 0 (0.0%) | 13 (16.5%) |
Disability Class: Cognitive Difficulty
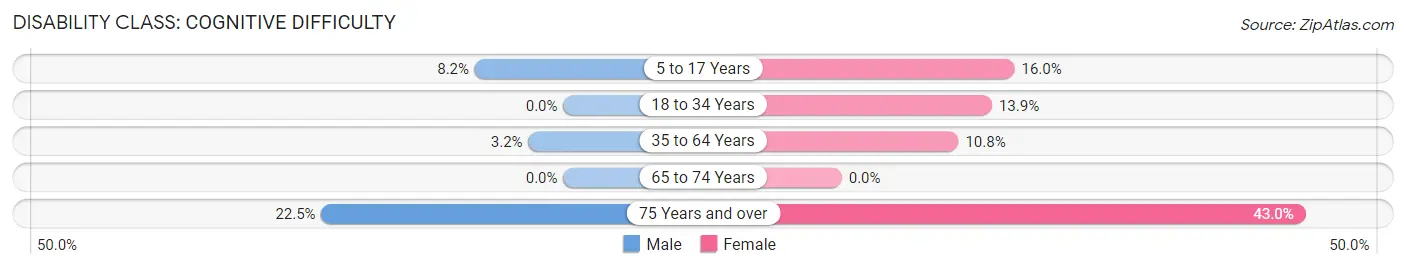
| Age Bracket | Male | Female |
| 5 to 17 Years | 11 (8.2%) | 25 (16.0%) |
| 18 to 34 Years | 0 (0.0%) | 23 (13.9%) |
| 35 to 64 Years | 8 (3.2%) | 30 (10.8%) |
| 65 to 74 Years | 0 (0.0%) | 0 (0.0%) |
| 75 Years and over | 11 (22.5%) | 34 (43.0%) |
Disability Class: Ambulatory Difficulty
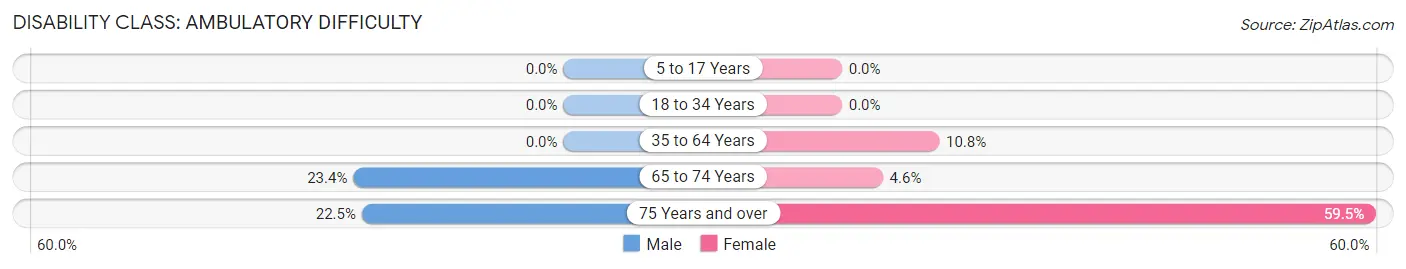
| Age Bracket | Male | Female |
| 5 to 17 Years | 0 (0.0%) | 0 (0.0%) |
| 18 to 34 Years | 0 (0.0%) | 0 (0.0%) |
| 35 to 64 Years | 0 (0.0%) | 30 (10.8%) |
| 65 to 74 Years | 22 (23.4%) | 9 (4.5%) |
| 75 Years and over | 11 (22.5%) | 47 (59.5%) |
Disability Class: Self-Care Difficulty
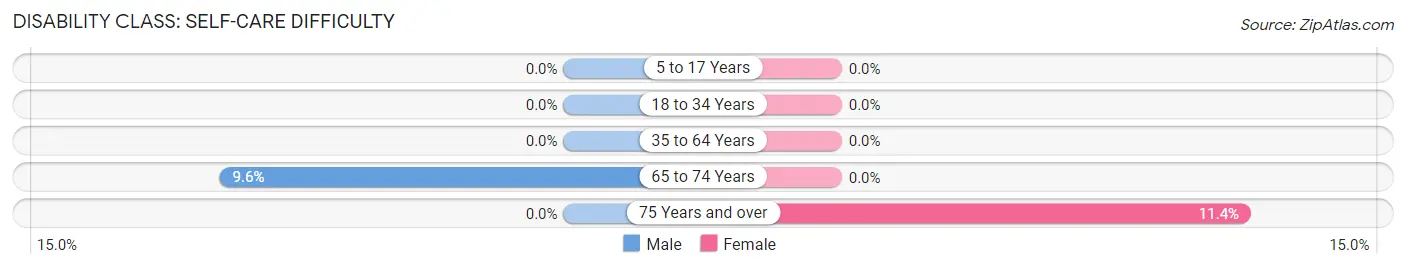
| Age Bracket | Male | Female |
| 5 to 17 Years | 0 (0.0%) | 0 (0.0%) |
| 18 to 34 Years | 0 (0.0%) | 0 (0.0%) |
| 35 to 64 Years | 0 (0.0%) | 0 (0.0%) |
| 65 to 74 Years | 9 (9.6%) | 0 (0.0%) |
| 75 Years and over | 0 (0.0%) | 9 (11.4%) |
Technology Access in Morrisonville
Computing Device Access in Morrisonville
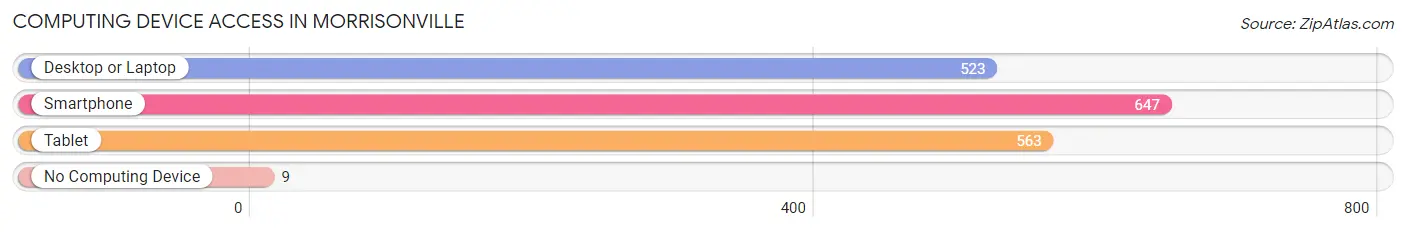
| Device Type | # Households | % Households |
| Desktop or Laptop | 523 | 72.8% |
| Smartphone | 647 | 90.1% |
| Tablet | 563 | 78.4% |
| No Computing Device | 9 | 1.3% |
| Total | 718 | 100.0% |
Internet Access in Morrisonville
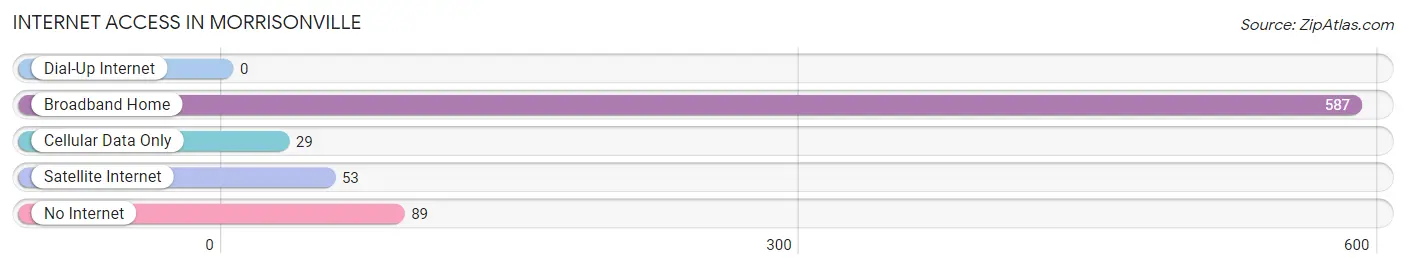
| Internet Type | # Households | % Households |
| Dial-Up Internet | 0 | 0.0% |
| Broadband Home | 587 | 81.8% |
| Cellular Data Only | 29 | 4.0% |
| Satellite Internet | 53 | 7.4% |
| No Internet | 89 | 12.4% |
| Total | 718 | 100.0% |
Morrisonville Summary
Morrisonville is a hamlet located in the town of Plattsburgh in Clinton County, New York. It is situated on the western shore of Lake Champlain, just south of the city of Plattsburgh. The hamlet is named after William Morrison, who was an early settler in the area.
History
The area that is now Morrisonville was first settled in the late 1700s by William Morrison, who was a veteran of the Revolutionary War. He purchased land in the area and built a log cabin. The area was known as Morrison’s Settlement until 1817, when it was officially named Morrisonville.
In the early 1800s, Morrisonville was a small farming community. The hamlet was home to a number of small businesses, including a blacksmith shop, a sawmill, and a gristmill. The hamlet also had a post office, which opened in 1820.
In the late 1800s, Morrisonville began to grow and develop. The hamlet was home to a number of factories, including a paper mill, a furniture factory, and a tannery. The hamlet also had a number of stores, including a general store, a drug store, and a hardware store.
In the early 1900s, Morrisonville was a thriving community. The hamlet had a number of churches, including the Methodist Episcopal Church, the Presbyterian Church, and the Catholic Church. The hamlet also had a number of schools, including a high school and a business college.
In the mid-1900s, Morrisonville began to decline. The factories and businesses began to close, and the population began to decline. The hamlet was also affected by the construction of the nearby Plattsburgh Air Force Base, which caused many of the residents to move away.
Geography
Morrisonville is located in the town of Plattsburgh in Clinton County, New York. It is situated on the western shore of Lake Champlain, just south of the city of Plattsburgh. The hamlet is located at an elevation of approximately 200 feet above sea level.
The hamlet is bordered to the north by the town of Plattsburgh, to the east by the town of Peru, to the south by the town of Beekmantown, and to the west by the town of Chazy. The hamlet is located approximately 25 miles south of the Canadian border.
Economy
Morrisonville’s economy is largely based on tourism and retail. The hamlet is home to a number of small businesses, including restaurants, shops, and a grocery store. The hamlet is also home to a number of small manufacturing companies, including a paper mill and a furniture factory.
The hamlet is also home to a number of recreational activities, including fishing, boating, and camping. The hamlet is also home to a number of parks, including the Morrisonville Beach Park and the Morrisonville Nature Preserve.
Demographics
As of the 2010 census, the population of Morrisonville was 1,845. The population is largely white (94.3%), with small percentages of African American (1.2%), Asian (1.1%), and Hispanic (1.1%) residents. The median household income is $45,000, and the median home value is $150,000.
The hamlet is served by the Plattsburgh City School District. The hamlet is also home to a number of churches, including the Methodist Episcopal Church, the Presbyterian Church, and the Catholic Church.
Common Questions
What is Per Capita Income in Morrisonville?
Per Capita income in Morrisonville is $38,154.
What is the Median Family Income in Morrisonville?
Median Family Income in Morrisonville is $87,865.
What is the Median Household income in Morrisonville?
Median Household Income in Morrisonville is $66,419.
What is Income or Wage Gap in Morrisonville?
Income or Wage Gap in Morrisonville is 26.8%.
Women in Morrisonville earn 73.2 cents for every dollar earned by a man.
What is Inequality or Gini Index in Morrisonville?
Inequality or Gini Index in Morrisonville is 0.39.
What is the Total Population of Morrisonville?
Total Population of Morrisonville is 1,639.
What is the Total Male Population of Morrisonville?
Total Male Population of Morrisonville is 764.
What is the Total Female Population of Morrisonville?
Total Female Population of Morrisonville is 875.
What is the Ratio of Males per 100 Females in Morrisonville?
There are 87.31 Males per 100 Females in Morrisonville.
What is the Ratio of Females per 100 Males in Morrisonville?
There are 114.53 Females per 100 Males in Morrisonville.
What is the Median Population Age in Morrisonville?
Median Population Age in Morrisonville is 44.6 Years.
What is the Average Family Size in Morrisonville
Average Family Size in Morrisonville is 2.8 People.
What is the Average Household Size in Morrisonville
Average Household Size in Morrisonville is 2.2 People.
How Large is the Labor Force in Morrisonville?
There are 892 People in the Labor Forcein in Morrisonville.
What is the Percentage of People in the Labor Force in Morrisonville?
65.2% of People are in the Labor Force in Morrisonville.
What is the Unemployment Rate in Morrisonville?
Unemployment Rate in Morrisonville is 0.3%.