Zip Codes with the Highest Percentage of Population Employed in Security & Protection in New York
RELATED REPORTS & OPTIONS
Security & Protection
New York
Compare Zip Codes
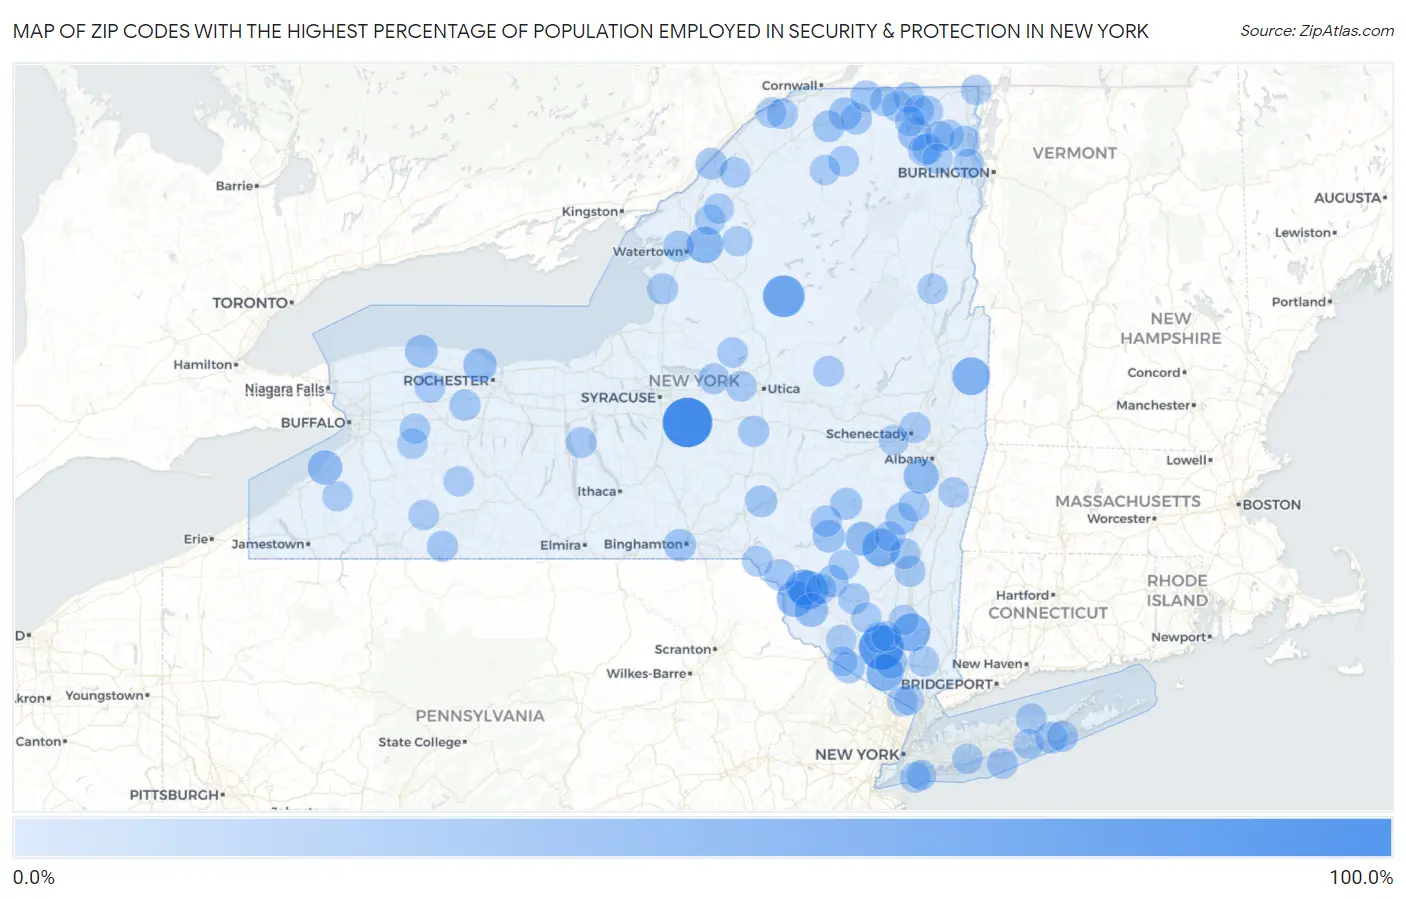
Map of Zip Codes with the Highest Percentage of Population Employed in Security & Protection in New York
0.0%
100.0%
Zip Codes with the Highest Percentage of Population Employed in Security & Protection in New York
| Zip Code | % Employed | vs State | vs National | |
| 1. | 13051 | 100.0% | 2.9%(+97.1)#1 | 2.1%(+97.9)#12 |
| 2. | 10914 | 76.3% | 2.9%(+73.4)#2 | 2.1%(+74.2)#19 |
| 3. | 13472 | 61.2% | 2.9%(+58.3)#3 | 2.1%(+59.1)#25 |
| 4. | 12787 | 47.1% | 2.9%(+44.1)#4 | 2.1%(+44.9)#44 |
| 5. | 12527 | 43.8% | 2.9%(+40.8)#5 | 2.1%(+41.6)#46 |
| 6. | 12448 | 43.2% | 2.9%(+40.3)#6 | 2.1%(+41.1)#47 |
| 7. | 12823 | 42.6% | 2.9%(+39.7)#7 | 2.1%(+40.5)#48 |
| 8. | 10975 | 38.7% | 2.9%(+35.8)#8 | 2.1%(+36.5)#58 |
| 9. | 12750 | 36.4% | 2.9%(+33.5)#9 | 2.1%(+34.2)#64 |
| 10. | 13638 | 36.2% | 2.9%(+33.3)#10 | 2.1%(+34.1)#65 |
| 11. | 12791 | 33.9% | 2.9%(+31.0)#11 | 2.1%(+31.8)#74 |
| 12. | 12161 | 30.8% | 2.9%(+27.9)#12 | 2.1%(+28.6)#94 |
| 13. | 14061 | 27.5% | 2.9%(+24.6)#13 | 2.1%(+25.4)#112 |
| 14. | 12480 | 25.5% | 2.9%(+22.6)#14 | 2.1%(+23.4)#125 |
| 15. | 12952 | 24.4% | 2.9%(+21.4)#15 | 2.1%(+22.2)#136 |
| 16. | 12778 | 24.1% | 2.9%(+21.2)#16 | 2.1%(+21.9)#139 |
| 17. | 14515 | 22.9% | 2.9%(+20.0)#17 | 2.1%(+20.8)#146 |
| 18. | 14571 | 18.8% | 2.9%(+15.8)#18 | 2.1%(+16.6)#230 |
| 19. | 12916 | 18.4% | 2.9%(+15.5)#19 | 2.1%(+16.2)#237 |
| 20. | 12455 | 18.0% | 2.9%(+15.1)#20 | 2.1%(+15.9)#250 |
| 21. | 13902 | 16.9% | 2.9%(+14.0)#21 | 2.1%(+14.7)#287 |
| 22. | 10917 | 16.4% | 2.9%(+13.5)#22 | 2.1%(+14.3)#299 |
| 23. | 12473 | 15.9% | 2.9%(+13.0)#23 | 2.1%(+13.8)#323 |
| 24. | 12765 | 15.3% | 2.9%(+12.4)#24 | 2.1%(+13.2)#349 |
| 25. | 12434 | 15.3% | 2.9%(+12.4)#25 | 2.1%(+13.2)#350 |
| 26. | 11972 | 15.2% | 2.9%(+12.3)#26 | 2.1%(+13.0)#354 |
| 27. | 13859 | 15.1% | 2.9%(+12.2)#27 | 2.1%(+12.9)#359 |
| 28. | 12967 | 14.7% | 2.9%(+11.8)#28 | 2.1%(+12.6)#373 |
| 29. | 10969 | 14.6% | 2.9%(+11.7)#29 | 2.1%(+12.5)#379 |
| 30. | 13614 | 14.5% | 2.9%(+11.6)#30 | 2.1%(+12.4)#390 |
| 31. | 12966 | 14.1% | 2.9%(+11.1)#31 | 2.1%(+11.9)#413 |
| 32. | 12760 | 13.7% | 2.9%(+10.8)#32 | 2.1%(+11.6)#432 |
| 33. | 12981 | 13.5% | 2.9%(+10.6)#33 | 2.1%(+11.4)#447 |
| 34. | 12459 | 13.5% | 2.9%(+10.6)#34 | 2.1%(+11.3)#448 |
| 35. | 12926 | 13.4% | 2.9%(+10.5)#35 | 2.1%(+11.3)#454 |
| 36. | 12574 | 12.4% | 2.9%(+9.50)#36 | 2.1%(+10.3)#516 |
| 37. | 14511 | 12.2% | 2.9%(+9.26)#37 | 2.1%(+10.0)#538 |
| 38. | 13314 | 12.1% | 2.9%(+9.21)#38 | 2.1%(+9.97)#543 |
| 39. | 13636 | 11.9% | 2.9%(+8.99)#39 | 2.1%(+9.76)#558 |
| 40. | 12920 | 11.5% | 2.9%(+8.62)#40 | 2.1%(+9.38)#597 |
| 41. | 12923 | 11.5% | 2.9%(+8.55)#41 | 2.1%(+9.31)#608 |
| 42. | 13615 | 11.4% | 2.9%(+8.51)#42 | 2.1%(+9.27)#613 |
| 43. | 12428 | 11.4% | 2.9%(+8.44)#43 | 2.1%(+9.20)#617 |
| 44. | 11959 | 11.0% | 2.9%(+8.13)#44 | 2.1%(+8.89)#644 |
| 45. | 12058 | 11.0% | 2.9%(+8.12)#45 | 2.1%(+8.88)#647 |
| 46. | 12903 | 11.0% | 2.9%(+8.12)#46 | 2.1%(+8.88)#648 |
| 47. | 12456 | 11.0% | 2.9%(+8.12)#47 | 2.1%(+8.88)#649 |
| 48. | 12978 | 11.0% | 2.9%(+8.05)#48 | 2.1%(+8.81)#651 |
| 49. | 14707 | 10.7% | 2.9%(+7.80)#49 | 2.1%(+8.57)#676 |
| 50. | 12935 | 10.7% | 2.9%(+7.77)#50 | 2.1%(+8.54)#679 |
| 51. | 13621 | 10.6% | 2.9%(+7.70)#51 | 2.1%(+8.47)#690 |
| 52. | 13054 | 10.5% | 2.9%(+7.61)#52 | 2.1%(+8.37)#701 |
| 53. | 12008 | 10.4% | 2.9%(+7.45)#53 | 2.1%(+8.21)#726 |
| 54. | 13470 | 10.2% | 2.9%(+7.28)#54 | 2.1%(+8.04)#746 |
| 55. | 14541 | 10.0% | 2.9%(+7.06)#55 | 2.1%(+7.82)#768 |
| 56. | 13490 | 10.0% | 2.9%(+7.06)#56 | 2.1%(+7.82)#770 |
| 57. | 12962 | 9.9% | 2.9%(+7.02)#57 | 2.1%(+7.78)#777 |
| 58. | 13783 | 9.9% | 2.9%(+6.98)#58 | 2.1%(+7.74)#783 |
| 59. | 12543 | 9.7% | 2.9%(+6.74)#59 | 2.1%(+7.51)#809 |
| 60. | 11697 | 9.6% | 2.9%(+6.73)#60 | 2.1%(+7.49)#812 |
| 61. | 12980 | 9.4% | 2.9%(+6.49)#61 | 2.1%(+7.25)#854 |
| 62. | 10965 | 9.3% | 2.9%(+6.39)#62 | 2.1%(+7.16)#859 |
| 63. | 11786 | 9.3% | 2.9%(+6.36)#63 | 2.1%(+7.12)#866 |
| 64. | 11770 | 9.2% | 2.9%(+6.30)#64 | 2.1%(+7.06)#877 |
| 65. | 12934 | 9.2% | 2.9%(+6.26)#65 | 2.1%(+7.03)#881 |
| 66. | 13633 | 9.1% | 2.9%(+6.18)#66 | 2.1%(+6.94)#893 |
| 67. | 13694 | 9.1% | 2.9%(+6.16)#67 | 2.1%(+6.92)#900 |
| 68. | 13673 | 9.0% | 2.9%(+6.14)#68 | 2.1%(+6.90)#904 |
| 69. | 12754 | 9.0% | 2.9%(+6.08)#69 | 2.1%(+6.84)#917 |
| 70. | 14167 | 9.0% | 2.9%(+6.06)#70 | 2.1%(+6.82)#921 |
| 71. | 10588 | 8.9% | 2.9%(+6.03)#71 | 2.1%(+6.79)#926 |
| 72. | 12918 | 8.9% | 2.9%(+5.99)#72 | 2.1%(+6.76)#931 |
| 73. | 13363 | 8.9% | 2.9%(+5.99)#73 | 2.1%(+6.76)#932 |
| 74. | 14058 | 8.9% | 2.9%(+5.94)#74 | 2.1%(+6.71)#942 |
| 75. | 12427 | 8.8% | 2.9%(+5.90)#75 | 2.1%(+6.66)#949 |
| 76. | 12136 | 8.8% | 2.9%(+5.88)#76 | 2.1%(+6.64)#955 |
| 77. | 12985 | 8.8% | 2.9%(+5.87)#77 | 2.1%(+6.64)#956 |
| 78. | 12725 | 8.8% | 2.9%(+5.86)#78 | 2.1%(+6.62)#958 |
| 79. | 12056 | 8.7% | 2.9%(+5.82)#79 | 2.1%(+6.58)#964 |
| 80. | 14836 | 8.6% | 2.9%(+5.69)#80 | 2.1%(+6.45)#984 |
| 81. | 12979 | 8.6% | 2.9%(+5.65)#81 | 2.1%(+6.41)#996 |
| 82. | 12575 | 8.5% | 2.9%(+5.57)#82 | 2.1%(+6.34)#1,011 |
| 83. | 12566 | 8.5% | 2.9%(+5.57)#83 | 2.1%(+6.33)#1,012 |
| 84. | 14011 | 8.4% | 2.9%(+5.50)#84 | 2.1%(+6.27)#1,034 |
| 85. | 14714 | 8.4% | 2.9%(+5.46)#85 | 2.1%(+6.23)#1,050 |
| 86. | 10913 | 8.4% | 2.9%(+5.45)#86 | 2.1%(+6.21)#1,057 |
| 87. | 12975 | 8.3% | 2.9%(+5.42)#87 | 2.1%(+6.18)#1,066 |
| 88. | 11719 | 8.3% | 2.9%(+5.39)#88 | 2.1%(+6.15)#1,074 |
| 89. | 11694 | 8.3% | 2.9%(+5.39)#89 | 2.1%(+6.15)#1,075 |
| 90. | 13608 | 8.3% | 2.9%(+5.34)#90 | 2.1%(+6.10)#1,083 |
| 91. | 11762 | 8.2% | 2.9%(+5.30)#91 | 2.1%(+6.06)#1,095 |
| 92. | 13672 | 8.2% | 2.9%(+5.29)#92 | 2.1%(+6.05)#1,098 |
| 93. | 10963 | 8.1% | 2.9%(+5.23)#93 | 2.1%(+6.00)#1,111 |
| 94. | 12917 | 8.1% | 2.9%(+5.22)#94 | 2.1%(+5.99)#1,118 |
| 95. | 12808 | 8.1% | 2.9%(+5.17)#95 | 2.1%(+5.93)#1,138 |
| 96. | 12955 | 8.0% | 2.9%(+5.13)#96 | 2.1%(+5.90)#1,150 |
| 97. | 12542 | 7.9% | 2.9%(+5.01)#97 | 2.1%(+5.77)#1,195 |
| 98. | 13665 | 7.9% | 2.9%(+4.96)#98 | 2.1%(+5.72)#1,215 |
| 99. | 14041 | 7.8% | 2.9%(+4.93)#99 | 2.1%(+5.69)#1,225 |
| 100. | 10998 | 7.8% | 2.9%(+4.92)#100 | 2.1%(+5.68)#1,229 |
Common Questions
What are the Top 10 Zip Codes with the Highest Percentage of Population Employed in Security & Protection in New York?
Top 10 Zip Codes with the Highest Percentage of Population Employed in Security & Protection in New York are:
What zip code has the Highest Percentage of Population Employed in Security & Protection in New York?
13051 has the Highest Percentage of Population Employed in Security & Protection in New York with 100.0%.
What is the Percentage of Population Employed in Security & Protection in the State of New York?
Percentage of Population Employed in Security & Protection in New York is 2.9%.
What is the Percentage of Population Employed in Security & Protection in the United States?
Percentage of Population Employed in Security & Protection in the United States is 2.1%.