Zip Codes with the Highest Percentage of Population Employed in Security & Protection in Lyon Mountain, NY
RELATED REPORTS & OPTIONS
Security & Protection
Lyon Mountain
Compare Zip Codes
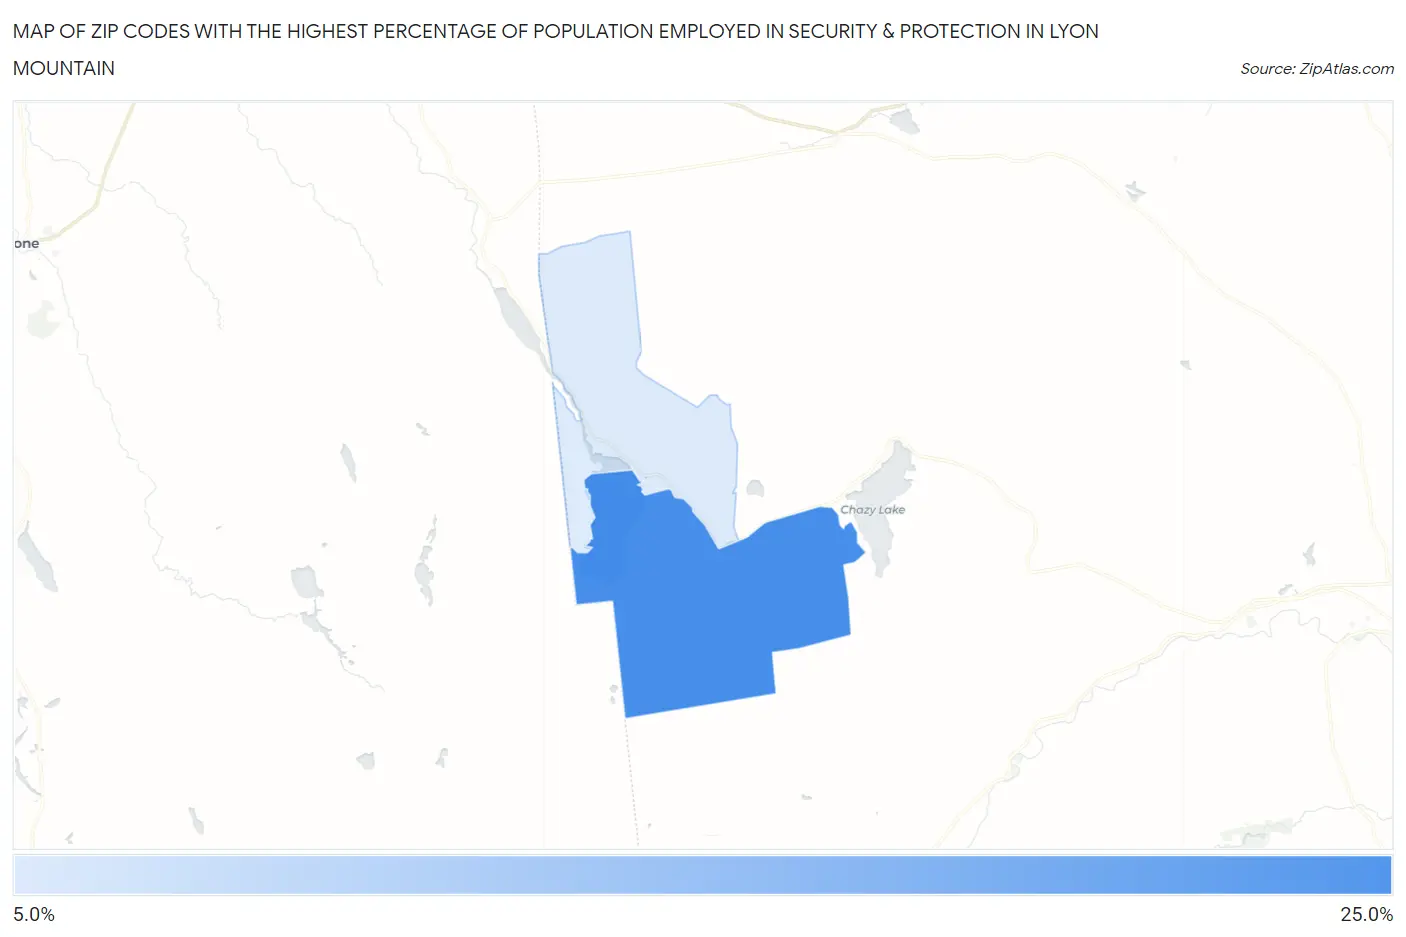
Map of Zip Codes with the Highest Percentage of Population Employed in Security & Protection in Lyon Mountain
8.0%
24.4%
Zip Codes with the Highest Percentage of Population Employed in Security & Protection in Lyon Mountain, NY
| Zip Code | % Employed | vs State | vs National | |
| 1. | 12952 | 24.4% | 2.9%(+21.4)#15 | 2.1%(+22.2)#136 |
| 2. | 12955 | 8.0% | 2.9%(+5.13)#96 | 2.1%(+5.90)#1,150 |
1
Common Questions
What are the Top Zip Codes with the Highest Percentage of Population Employed in Security & Protection in Lyon Mountain, NY?
Top Zip Codes with the Highest Percentage of Population Employed in Security & Protection in Lyon Mountain, NY are:
What zip code has the Highest Percentage of Population Employed in Security & Protection in Lyon Mountain, NY?
12952 has the Highest Percentage of Population Employed in Security & Protection in Lyon Mountain, NY with 24.4%.
What is the Percentage of Population Employed in Security & Protection in New York?
Percentage of Population Employed in Security & Protection in New York is 2.9%.
What is the Percentage of Population Employed in Security & Protection in the United States?
Percentage of Population Employed in Security & Protection in the United States is 2.1%.