Zip Codes with the Highest Percentage of Population Employed in Security & Protection in Buffalo, NY

RELATED REPORTS & OPTIONS

Security & Protection
Population
Families and Households
Female Fertility
Female Fertility (Unmarried)
Race (Community Size)
Race (Percentage)
Ancestry (Community Size)
AfghanAfricanAlbanianAlsatianAmericanArabArgentineanArmenianAustralianAustrianBahamianBarbadianBelgianBelizeanBhutaneseBlackfeetBolivianBrazilianBritishBritish West IndianBulgarianBurmeseCajunCambodianCanadianCarpatho RusynCelticCentral AmericanCentral American IndianCherokeeChileanChippewaColombianCosta RicanCreekCroatianCubanCzechCzechoslovakianDanishDominicanDutchDutch West IndianEastern EuropeanEcuadorianEgyptianEnglishEstonianEthiopianEuropeanFilipinoFinnishFrenchFrench American IndianFrench CanadianGermanGerman RussianGhanaianGreekGuamanian / ChamorroGuatemalanGuyaneseHaitianHonduranHungarianIcelanderIndian (Asian)IndonesianIranianIraqiIrishIroquoisIsraeliItalianJamaicanJapaneseJordanianKenyanKoreanLaotianLatvianLebaneseLithuanianMacedonianMalaysianMalteseMexicanMexican American IndianMongolianMoroccanNative HawaiianNavajoNicaraguanNigerianNorthern EuropeanNorwegianOkinawanPakistaniPalestinianPanamanianPennsylvania GermanPeruvianPolishPortuguesePuerto RicanRomanianRussianSalvadoranSamoanScandinavianScotch-IrishScottishSerbianSiouxSlavicSlovakSloveneSomaliSouth AfricanSouth AmericanSouth American IndianSpaniardSpanishSri LankanSubsaharan AfricanSudaneseSwedishSwissSyrianTaiwaneseThaiTrinidadian and TobagonianTurkishUkrainianVenezuelanVietnameseWelshWest IndianYugoslavian
Ancestry (Percentage)
AfghanAfricanAlbanianAlsatianAmericanArabArgentineanArmenianAustralianAustrianBahamianBarbadianBelgianBelizeanBhutaneseBlackfeetBolivianBrazilianBritishBritish West IndianBulgarianBurmeseCajunCambodianCanadianCarpatho RusynCelticCentral AmericanCentral American IndianCherokeeChileanChippewaColombianCosta RicanCreekCroatianCubanCzechCzechoslovakianDanishDominicanDutchDutch West IndianEastern EuropeanEcuadorianEgyptianEnglishEstonianEthiopianEuropeanFilipinoFinnishFrenchFrench American IndianFrench CanadianGermanGerman RussianGhanaianGreekGuamanian / ChamorroGuatemalanGuyaneseHaitianHonduranHungarianIcelanderIndian (Asian)IndonesianIranianIraqiIrishIroquoisIsraeliItalianJamaicanJapaneseJordanianKenyanKoreanLaotianLatvianLebaneseLithuanianMacedonianMalaysianMalteseMexicanMexican American IndianMongolianMoroccanNative HawaiianNavajoNicaraguanNigerianNorthern EuropeanNorwegianOkinawanPakistaniPalestinianPanamanianPennsylvania GermanPeruvianPolishPortuguesePuerto RicanRomanianRussianSalvadoranSamoanScandinavianScotch-IrishScottishSerbianSiouxSlavicSlovakSloveneSomaliSouth AfricanSouth AmericanSouth American IndianSpaniardSpanishSri LankanSubsaharan AfricanSudaneseSwedishSwissSyrianTaiwaneseThaiTrinidadian and TobagonianTurkishUkrainianVenezuelanVietnameseWelshWest IndianYugoslavian
Immigrant Origin (Total)
AfghanistanAfricaAlbaniaArgentinaAsiaAustraliaAustriaBangladeshBarbadosBelarusBosnia and HerzegovinaBrazilBulgariaBurma / MyanmarCameroonCanadaCaribbeanCentral AmericaChinaColombiaCongoCosta RicaCroatiaCubaCzechoslovakiaDominican RepublicEastern AfricaEastern AsiaEastern EuropeEcuadorEgyptEl SalvadorEnglandEritreaEthiopiaEuropeFranceGermanyGhanaGreeceGuatemalaGuyanaHaitiHondurasHong KongHungaryIndiaIndonesiaIranIraqIrelandIsraelItalyJamaicaJapanJordanKazakhstanKenyaKoreaKuwaitLaosLatin AmericaLatviaLebanonLiberiaLithuaniaMalaysiaMexicoMiddle AfricaMoldovaMoroccoNepalNetherlandsNigeriaNorth MacedoniaNorthern AfricaNorthern EuropeNorwayOceaniaPakistanPanamaPeruPhilippinesPolandRomaniaRussiaSaudi ArabiaScotlandSerbiaSierra LeoneSingaporeSomaliaSouth AfricaSouth AmericaSouth Central AsiaSouth Eastern AsiaSouthern EuropeSpainSri LankaSt. Vincent and the GrenadinesSudanSwedenSwitzerlandSyriaTaiwanThailandTrinidad and TobagoTurkeyUgandaUkraineUzbekistanVenezuelaVietnamWest IndiesWestern AfricaWestern AsiaWestern EuropeYemenZaire
Immigrant Origin (Percentage)
AfghanistanAfricaAlbaniaArgentinaAsiaAustraliaAustriaBangladeshBarbadosBelarusBosnia and HerzegovinaBrazilBulgariaBurma / MyanmarCameroonCanadaCaribbeanCentral AmericaChinaColombiaCongoCosta RicaCroatiaCubaCzechoslovakiaDominican RepublicEastern AfricaEastern AsiaEastern EuropeEcuadorEgyptEl SalvadorEnglandEritreaEthiopiaEuropeFranceGermanyGhanaGreeceGuatemalaGuyanaHaitiHondurasHong KongHungaryIndiaIndonesiaIranIraqIrelandIsraelItalyJamaicaJapanJordanKazakhstanKenyaKoreaKuwaitLaosLatin AmericaLatviaLebanonLiberiaLithuaniaMalaysiaMexicoMiddle AfricaMoldovaMoroccoNepalNetherlandsNigeriaNorth MacedoniaNorthern AfricaNorthern EuropeNorwayOceaniaPakistanPanamaPeruPhilippinesPolandRomaniaRussiaSaudi ArabiaScotlandSerbiaSierra LeoneSingaporeSomaliaSouth AfricaSouth AmericaSouth Central AsiaSouth Eastern AsiaSouthern EuropeSpainSri LankaSt. Vincent and the GrenadinesSudanSwedenSwitzerlandSyriaTaiwanThailandTrinidad and TobagoTurkeyUgandaUkraineUzbekistanVenezuelaVietnamWest IndiesWestern AfricaWestern AsiaWestern EuropeYemenZaire
Income
Income (Families)
Income (Households)
Poverty
Poverty (Families)
Unemployment
Employment Occupations
Employment Industries
Employer Class
Commute Time
Commute Means
School Enrollment
Education by Degree Field
Occupancy
Finances
Physical Characteristics
Buffalo
Compare Zip Codes
Comparison Subject

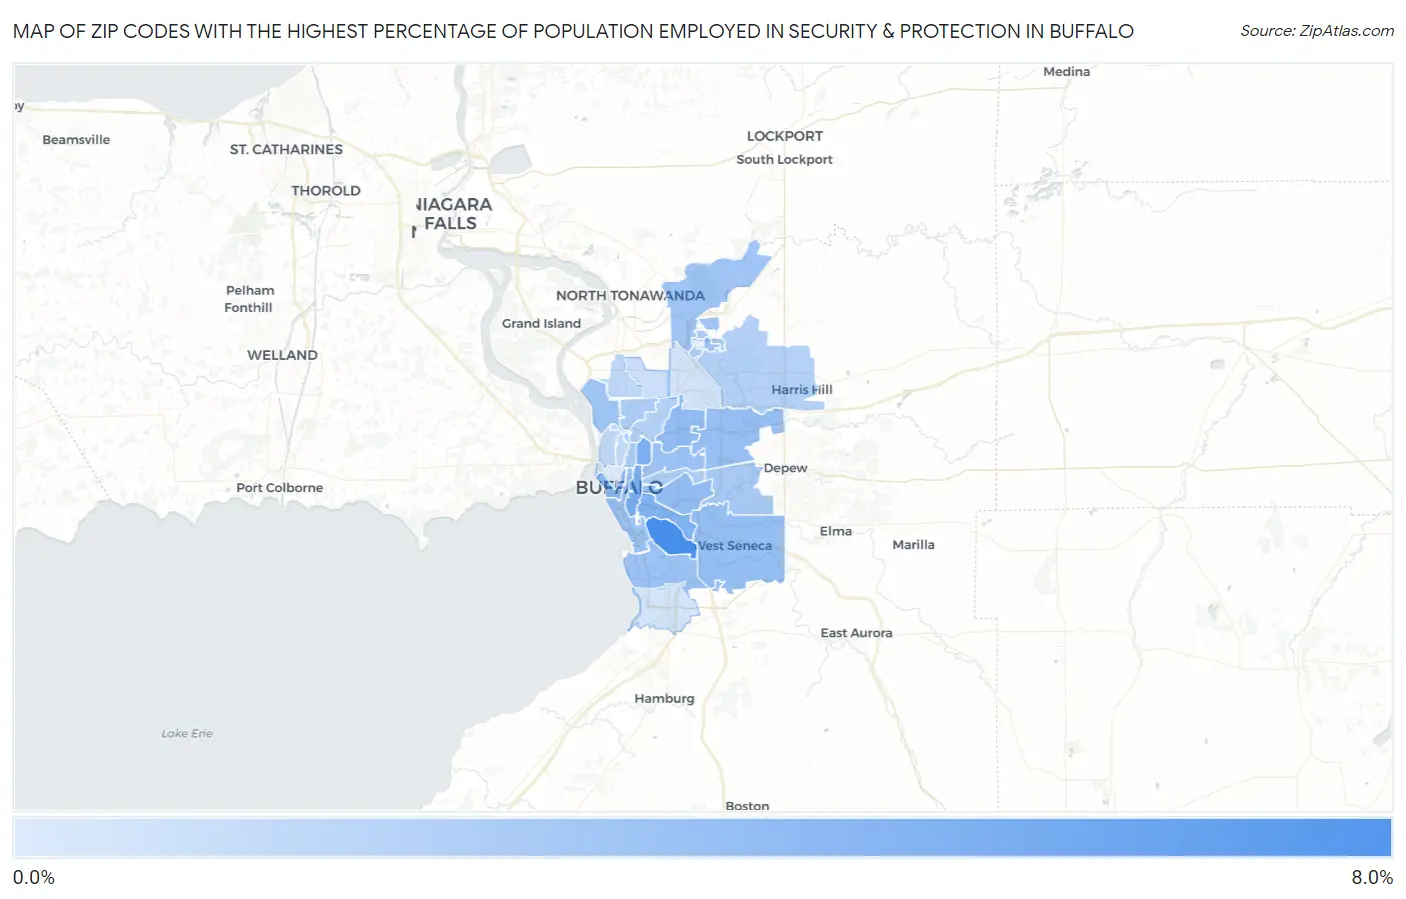
Map of Zip Codes with the Highest Percentage of Population Employed in Security & Protection in Buffalo

0.0%
8.0%
Zip Codes with the Highest Percentage of Population Employed in Security & Protection in Buffalo Map

Zip Codes with the Highest Percentage of Population Employed in Security & Protection in Buffalo, NY

Zip Code % Employed vs State vs National
1.142206.4%2.9%(+3.50)#1502.1%(+4.27)#1,823
2.142044.3%2.9%(+1.41)#3592.1%(+2.17)#3,903
3.142084.2%2.9%(+1.26)#3922.1%(+2.02)#4,178
4.142104.0%2.9%(+1.05)#4282.1%(+1.82)#4,562
5.142023.5%2.9%(+0.553)#5252.1%(+1.32)#5,769
6.142153.3%2.9%(+0.396)#5692.1%(+1.16)#6,219
7.142063.3%2.9%(+0.370)#5732.1%(+1.13)#6,304
8.142243.1%2.9%(+0.225)#6052.1%(+0.989)#6,749
9.142253.0%2.9%(+0.129)#6292.1%(+0.892)#7,066
10.142183.0%2.9%(+0.053)#6462.1%(+0.816)#7,366
11.142112.9%2.9%(+0.006)#6612.1%(+0.769)#7,573
12.142072.8%2.9%(-0.120)#7032.1%(+0.643)#8,145
13.142032.7%2.9%(-0.186)#7272.1%(+0.578)#8,413
14.142282.7%2.9%(-0.211)#7342.1%(+0.552)#8,532
15.142272.4%2.9%(-0.560)#8522.1%(+0.203)#10,316
16.142092.3%2.9%(-0.589)#8602.1%(+0.174)#10,504
17.142612.2%2.9%(-0.689)#8922.1%(+0.074)#11,116
18.142162.2%2.9%(-0.717)#9002.1%(+0.046)#11,289
19.142122.2%2.9%(-0.740)#9092.1%(+0.023)#11,439
20.142211.9%2.9%(-0.988)#9802.1%(-0.224)#13,057
21.142141.9%2.9%(-1.01)#9892.1%(-0.250)#13,230
22.142131.6%2.9%(-1.33)#1,0902.1%(-0.571)#15,588
23.142171.5%2.9%(-1.42)#1,1132.1%(-0.653)#16,245
24.142221.3%2.9%(-1.60)#1,1562.1%(-0.833)#17,617
25.142230.95%2.9%(-1.96)#1,2682.1%(-1.20)#20,444
26.142260.76%2.9%(-2.15)#1,3052.1%(-1.39)#21,687
27.142190.67%2.9%(-2.24)#1,3252.1%(-1.48)#22,286
28.142010.25%2.9%(-2.66)#1,4002.1%(-1.90)#24,351

Common Questions

What are the Top 10 Zip Codes with the Highest Percentage of Population Employed in Security & Protection in Buffalo, NY?
Top 10 Zip Codes with the Highest Percentage of Population Employed in Security & Protection in Buffalo, NY are:
#1
6.4%
#2
4.3%
#3
4.2%
#4
4.0%
#5
3.5%
#6
3.3%
#7
3.3%
#8
3.1%
#9
3.0%
#10
3.0%
What zip code has the Highest Percentage of Population Employed in Security & Protection in Buffalo, NY?
14220 has the Highest Percentage of Population Employed in Security & Protection in Buffalo, NY with 6.4%.
What is the Percentage of Population Employed in Security & Protection in Buffalo, NY?
Percentage of Population Employed in Security & Protection in Buffalo is 3.0%.
What is the Percentage of Population Employed in Security & Protection in New York?
Percentage of Population Employed in Security & Protection in New York is 2.9%.
What is the Percentage of Population Employed in Security & Protection in the United States?
Percentage of Population Employed in Security & Protection in the United States is 2.1%.