Zip Codes with the Highest Percentage of Population Employed in Security & Protection in Brooklyn, NY

RELATED REPORTS & OPTIONS

Security & Protection
Population
Families and Households
Female Fertility
Female Fertility (Unmarried)
Race (Community Size)
Race (Percentage)
Ancestry (Community Size)
AfghanAfricanAlbanianAlsatianAmericanApacheArabArgentineanArmenianAssyrian / Chaldean / SyriacAustralianAustrianBahamianBangladeshiBarbadianBasqueBelgianBelizeanBermudanBhutaneseBlackfeetBolivianBrazilianBritishBritish West IndianBulgarianBurmeseCajunCambodianCanadianCape VerdeanCarpatho RusynCelticCentral AmericanCentral American IndianCherokeeChickasawChileanChippewaChoctawColombianCosta RicanCreekCroatianCrowCubanCypriotCzechCzechoslovakianDanishDominicanDutchDutch West IndianEastern EuropeanEcuadorianEgyptianEnglishEstonianEthiopianEuropeanFilipinoFinnishFrenchFrench American IndianFrench CanadianGermanGerman RussianGhanaianGreekGuamanian / ChamorroGuatemalanGuyaneseHaitianHonduranHungarianIcelanderIndian (Asian)IndonesianIranianIraqiIrishIroquoisIsraeliItalianJamaicanJapaneseJordanianKenyanKoreanLaotianLatvianLebaneseLiberianLithuanianLumbeeLuxembourgerMacedonianMalaysianMalteseMexicanMexican American IndianMongolianMoroccanNative HawaiianNavajoNew ZealanderNicaraguanNigerianNorthern EuropeanNorwegianOkinawanPakistaniPalestinianPanamanianParaguayanPennsylvania GermanPeruvianPolishPortuguesePuebloPuerto RicanRomanianRussianSalvadoranSamoanScandinavianScotch-IrishScottishSeminoleSenegaleseSerbianSierra LeoneanSiouxSlavicSlovakSloveneSomaliSouth AfricanSouth AmericanSouth American IndianSoviet UnionSpaniardSpanishSpanish AmericanSpanish American IndianSri LankanSubsaharan AfricanSudaneseSwedishSwissSyrianThaiTrinidadian and TobagonianTurkishU.S. Virgin IslanderUgandanUkrainianUruguayanVenezuelanVietnameseWelshWest IndianYugoslavian
Ancestry (Percentage)
AfghanAfricanAlbanianAlsatianAmericanApacheArabArgentineanArmenianAssyrian / Chaldean / SyriacAustralianAustrianBahamianBangladeshiBarbadianBasqueBelgianBelizeanBermudanBhutaneseBlackfeetBolivianBrazilianBritishBritish West IndianBulgarianBurmeseCajunCambodianCanadianCape VerdeanCarpatho RusynCelticCentral AmericanCentral American IndianCherokeeChickasawChileanChippewaChoctawColombianCosta RicanCreekCroatianCrowCubanCypriotCzechCzechoslovakianDanishDominicanDutchDutch West IndianEastern EuropeanEcuadorianEgyptianEnglishEstonianEthiopianEuropeanFilipinoFinnishFrenchFrench American IndianFrench CanadianGermanGerman RussianGhanaianGreekGuamanian / ChamorroGuatemalanGuyaneseHaitianHonduranHungarianIcelanderIndian (Asian)IndonesianIranianIraqiIrishIroquoisIsraeliItalianJamaicanJapaneseJordanianKenyanKoreanLaotianLatvianLebaneseLiberianLithuanianLumbeeLuxembourgerMacedonianMalaysianMalteseMexicanMexican American IndianMongolianMoroccanNative HawaiianNavajoNew ZealanderNicaraguanNigerianNorthern EuropeanNorwegianOkinawanPakistaniPalestinianPanamanianParaguayanPennsylvania GermanPeruvianPolishPortuguesePuebloPuerto RicanRomanianRussianSalvadoranSamoanScandinavianScotch-IrishScottishSeminoleSenegaleseSerbianSierra LeoneanSiouxSlavicSlovakSloveneSomaliSouth AfricanSouth AmericanSouth American IndianSoviet UnionSpaniardSpanishSpanish AmericanSpanish American IndianSri LankanSubsaharan AfricanSudaneseSwedishSwissSyrianThaiTrinidadian and TobagonianTurkishU.S. Virgin IslanderUgandanUkrainianUruguayanVenezuelanVietnameseWelshWest IndianYugoslavian
Immigrant Origin (Total)
AfghanistanAfricaAlbaniaArgentinaArmeniaAsiaAustraliaAustriaBahamasBangladeshBarbadosBelarusBelgiumBelizeBoliviaBosnia and HerzegovinaBrazilBulgariaBurma / MyanmarCambodiaCameroonCanadaCaribbeanCentral AmericaChileChinaColombiaCongoCosta RicaCroatiaCubaCzechoslovakiaDenmarkDominicaDominican RepublicEastern AfricaEastern AsiaEastern EuropeEcuadorEgyptEl SalvadorEnglandEritreaEthiopiaEuropeFranceGermanyGhanaGreeceGrenadaGuatemalaGuyanaHaitiHondurasHong KongHungaryIndiaIndonesiaIranIraqIrelandIsraelItalyJamaicaJapanJordanKazakhstanKenyaKoreaKuwaitLaosLatin AmericaLatviaLebanonLiberiaLithuaniaMalaysiaMexicoMicronesiaMiddle AfricaMoldovaMoroccoNepalNetherlandsNicaraguaNigeriaNorth MacedoniaNorthern AfricaNorthern EuropeNorwayOceaniaPakistanPanamaPeruPhilippinesPolandPortugalRomaniaRussiaSaudi ArabiaScotlandSenegalSerbiaSierra LeoneSingaporeSomaliaSouth AfricaSouth AmericaSouth Central AsiaSouth Eastern AsiaSouthern EuropeSpainSri LankaSt. Vincent and the GrenadinesSudanSwedenSwitzerlandSyriaTaiwanThailandTrinidad and TobagoTurkeyUgandaUkraineUruguayUzbekistanVenezuelaVietnamWest IndiesWestern AfricaWestern AsiaWestern EuropeYemenZaireZimbabwe
Immigrant Origin (Percentage)
AfghanistanAfricaAlbaniaArgentinaArmeniaAsiaAustraliaAustriaBahamasBangladeshBarbadosBelarusBelgiumBelizeBoliviaBosnia and HerzegovinaBrazilBulgariaBurma / MyanmarCambodiaCameroonCanadaCaribbeanCentral AmericaChileChinaColombiaCongoCosta RicaCroatiaCubaCzechoslovakiaDenmarkDominicaDominican RepublicEastern AfricaEastern AsiaEastern EuropeEcuadorEgyptEl SalvadorEnglandEritreaEthiopiaEuropeFranceGermanyGhanaGreeceGrenadaGuatemalaGuyanaHaitiHondurasHong KongHungaryIndiaIndonesiaIranIraqIrelandIsraelItalyJamaicaJapanJordanKazakhstanKenyaKoreaKuwaitLaosLatin AmericaLatviaLebanonLiberiaLithuaniaMalaysiaMexicoMicronesiaMiddle AfricaMoldovaMoroccoNepalNetherlandsNicaraguaNigeriaNorth MacedoniaNorthern AfricaNorthern EuropeNorwayOceaniaPakistanPanamaPeruPhilippinesPolandPortugalRomaniaRussiaSaudi ArabiaScotlandSenegalSerbiaSierra LeoneSingaporeSomaliaSouth AfricaSouth AmericaSouth Central AsiaSouth Eastern AsiaSouthern EuropeSpainSri LankaSt. Vincent and the GrenadinesSudanSwedenSwitzerlandSyriaTaiwanThailandTrinidad and TobagoTurkeyUgandaUkraineUruguayUzbekistanVenezuelaVietnamWest IndiesWestern AfricaWestern AsiaWestern EuropeYemenZaireZimbabwe
Income
Income (Families)
Income (Households)
Poverty
Poverty (Families)
Unemployment
Employment Occupations
Employment Industries
Employer Class
Commute Time
Commute Means
School Enrollment
Education by Degree Field
Occupancy
Finances
Physical Characteristics
Brooklyn
Compare Zip Codes
Comparison Subject

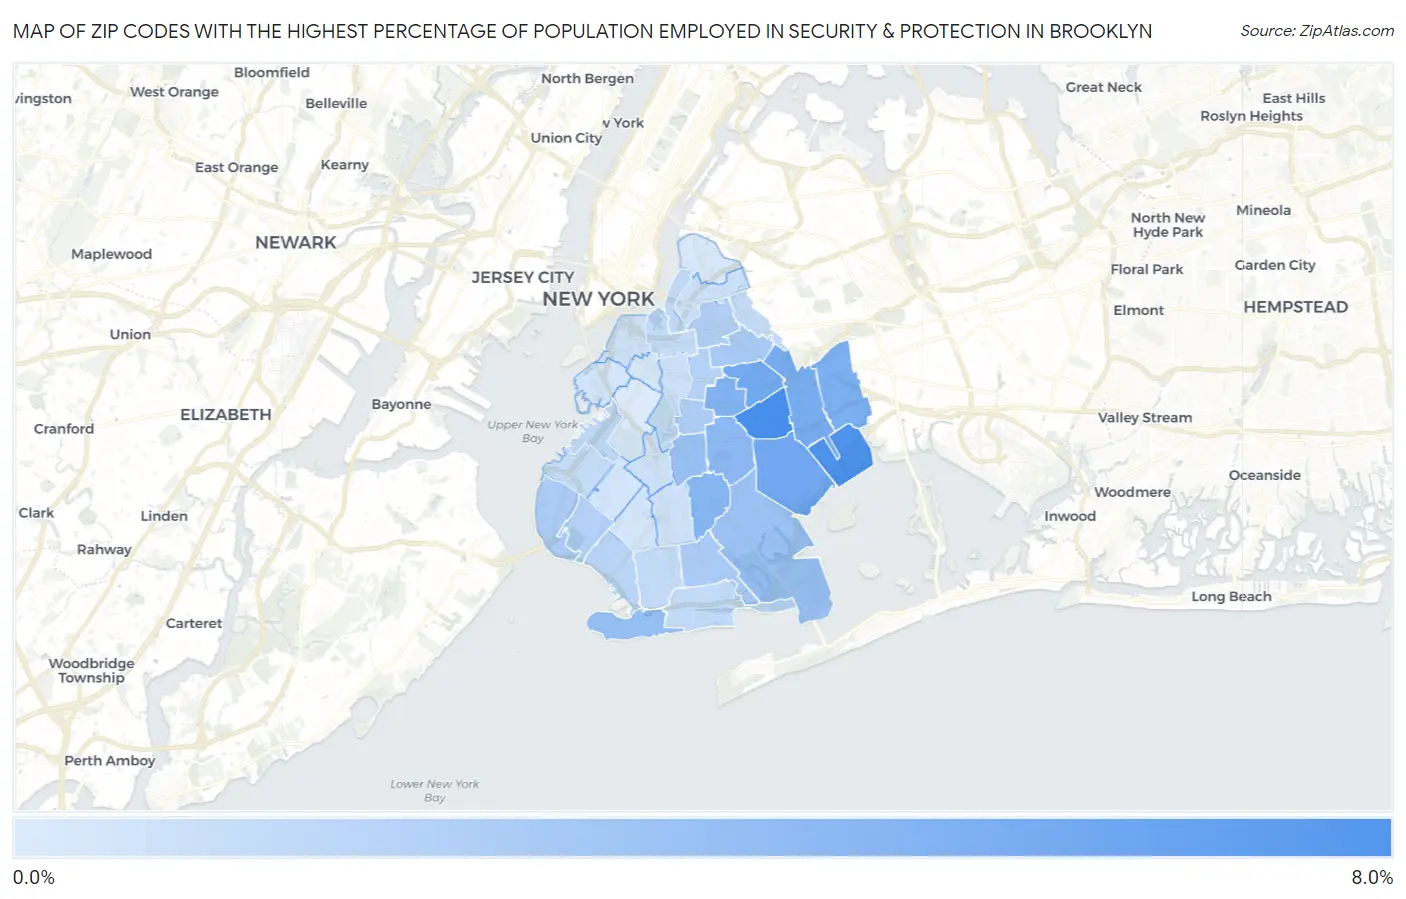
Map of Zip Codes with the Highest Percentage of Population Employed in Security & Protection in Brooklyn

0.0%
8.0%
Zip Codes with the Highest Percentage of Population Employed in Security & Protection in Brooklyn Map

Zip Codes with the Highest Percentage of Population Employed in Security & Protection in Brooklyn, NY

Zip Code % Employed vs State vs National
1.112126.9%2.9%(+4.00)#1202.1%(+4.77)#1,573
2.112396.6%2.9%(+3.66)#1412.1%(+4.42)#1,757
3.112365.2%2.9%(+2.25)#2362.1%(+3.01)#2,753
4.112335.1%2.9%(+2.14)#2502.1%(+2.91)#2,856
5.112074.8%2.9%(+1.93)#2732.1%(+2.69)#3,126
6.112084.7%2.9%(+1.80)#2892.1%(+2.56)#3,288
7.112134.5%2.9%(+1.61)#3272.1%(+2.38)#3,576
8.112104.2%2.9%(+1.32)#3772.1%(+2.08)#4,063
9.112034.0%2.9%(+1.13)#4142.1%(+1.89)#4,422
10.112243.6%2.9%(+0.733)#4882.1%(+1.50)#5,297
11.112263.6%2.9%(+0.649)#5042.1%(+1.41)#5,506
12.112343.4%2.9%(+0.486)#5392.1%(+1.25)#5,937
13.112212.8%2.9%(-0.062)#6842.1%(+0.701)#7,870
14.112092.8%2.9%(-0.160)#7192.1%(+0.604)#8,307
15.112292.7%2.9%(-0.181)#7252.1%(+0.582)#8,398
16.112252.7%2.9%(-0.214)#7372.1%(+0.549)#8,542
17.112062.6%2.9%(-0.352)#7762.1%(+0.411)#9,207
18.112282.4%2.9%(-0.518)#8322.1%(+0.245)#10,086
19.112162.3%2.9%(-0.590)#8612.1%(+0.173)#10,510
20.112142.1%2.9%(-0.809)#9322.1%(-0.046)#11,890
21.112322.0%2.9%(-0.928)#9612.1%(-0.165)#12,664
22.112491.8%2.9%(-1.14)#1,0242.1%(-0.373)#14,128
23.112351.8%2.9%(-1.16)#1,0342.1%(-0.393)#14,262
24.112231.7%2.9%(-1.19)#1,0442.1%(-0.424)#14,491
25.112051.7%2.9%(-1.22)#1,0572.1%(-0.457)#14,744
26.112371.7%2.9%(-1.23)#1,0612.1%(-0.462)#14,781
27.112201.6%2.9%(-1.31)#1,0842.1%(-0.551)#15,442
28.112111.3%2.9%(-1.57)#1,1502.1%(-0.807)#17,414
29.112011.3%2.9%(-1.60)#1,1592.1%(-0.835)#17,632
30.112381.3%2.9%(-1.60)#1,1612.1%(-0.840)#17,664
31.112301.3%2.9%(-1.62)#1,1652.1%(-0.859)#17,831
32.112181.2%2.9%(-1.69)#1,1842.1%(-0.925)#18,326
33.112311.1%2.9%(-1.81)#1,2212.1%(-1.05)#19,272
34.112191.0%2.9%(-1.87)#1,2432.1%(-1.11)#19,734
35.112041.0%2.9%(-1.88)#1,2442.1%(-1.11)#19,772
36.112171.0%2.9%(-1.89)#1,2502.1%(-1.13)#19,888
37.112220.92%2.9%(-1.99)#1,2752.1%(-1.23)#20,654
38.112150.70%2.9%(-2.21)#1,3152.1%(-1.45)#22,090

Common Questions

What are the Top 10 Zip Codes with the Highest Percentage of Population Employed in Security & Protection in Brooklyn, NY?
Top 10 Zip Codes with the Highest Percentage of Population Employed in Security & Protection in Brooklyn, NY are:
#1
6.9%
#2
6.6%
#3
5.2%
#4
5.1%
#5
4.8%
#6
4.7%
#7
4.5%
#8
4.2%
#9
4.0%
#10
3.6%
What zip code has the Highest Percentage of Population Employed in Security & Protection in Brooklyn, NY?
11212 has the Highest Percentage of Population Employed in Security & Protection in Brooklyn, NY with 6.9%.
What is the Percentage of Population Employed in Security & Protection in New York?
Percentage of Population Employed in Security & Protection in New York is 2.9%.
What is the Percentage of Population Employed in Security & Protection in the United States?
Percentage of Population Employed in Security & Protection in the United States is 2.1%.