Glens Falls North, NY Map & Demographics
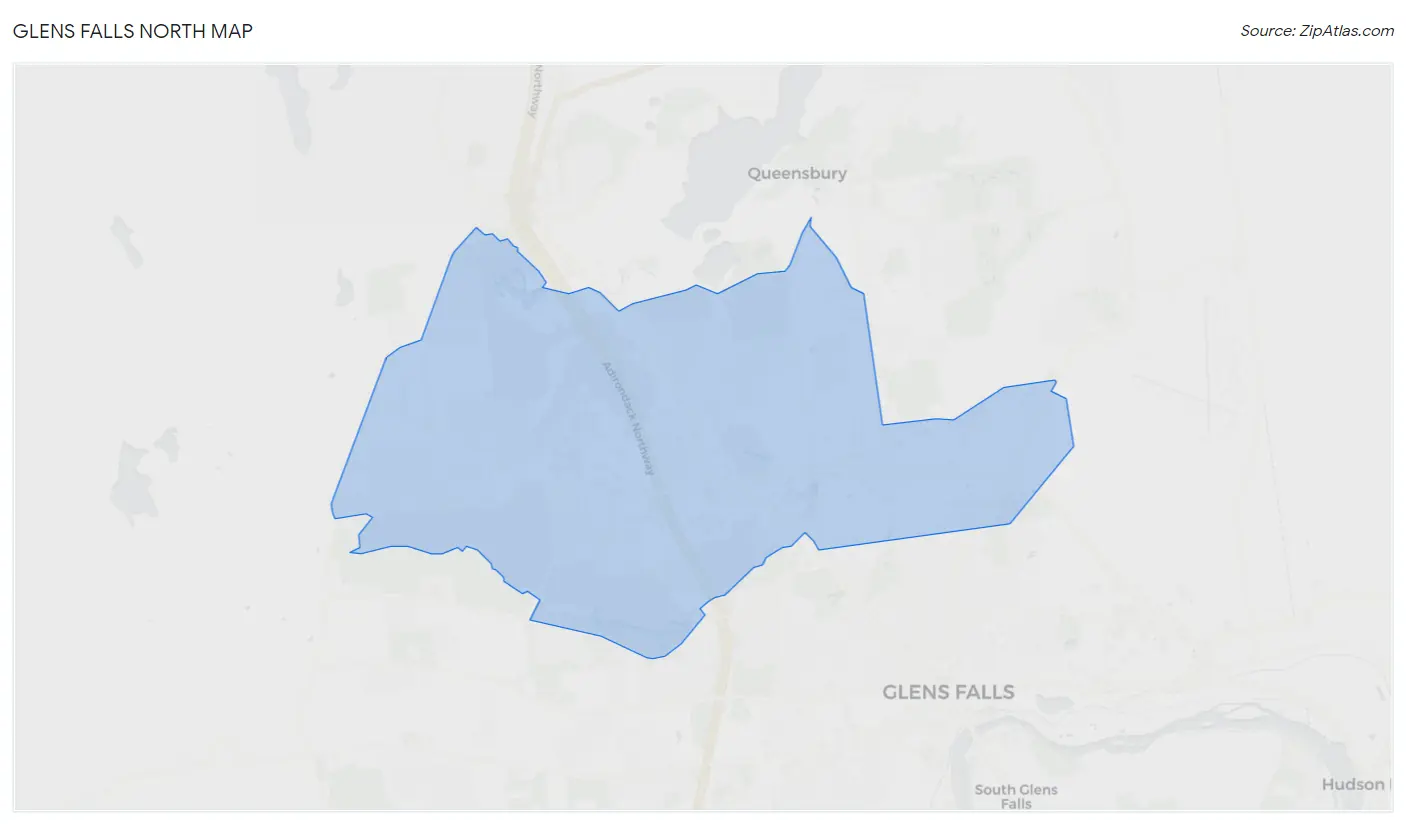
Glens Falls North Map
Glens Falls North Overview
$53,988
PER CAPITA INCOME
$97,035
AVG FAMILY INCOME
$78,889
AVG HOUSEHOLD INCOME
23.7%
WAGE / INCOME GAP [ % ]
76.3¢/ $1
WAGE / INCOME GAP [ $ ]
0.49
INEQUALITY / GINI INDEX
8,996
TOTAL POPULATION
4,299
MALE POPULATION
4,697
FEMALE POPULATION
91.53
MALES / 100 FEMALES
109.26
FEMALES / 100 MALES
45.9
MEDIAN AGE
2.6
AVG FAMILY SIZE
2.0
AVG HOUSEHOLD SIZE
4,650
LABOR FORCE [ PEOPLE ]
61.4%
PERCENT IN LABOR FORCE
5.0%
UNEMPLOYMENT RATE
Income in Glens Falls North
Income Overview in Glens Falls North
Per Capita Income in Glens Falls North is $53,988, while median incomes of families and households are $97,035 and $78,889 respectively.
| Characteristic | Number | Measure |
| Per Capita Income | 8,996 | $53,988 |
| Median Family Income | 2,712 | $97,035 |
| Mean Family Income | 2,712 | $148,194 |
| Median Household Income | 4,324 | $78,889 |
| Mean Household Income | 4,324 | $115,040 |
| Income Deficit | 2,712 | $0 |
| Wage / Income Gap (%) | 8,996 | 23.71% |
| Wage / Income Gap ($) | 8,996 | 76.29¢ per $1 |
| Gini / Inequality Index | 8,996 | 0.49 |
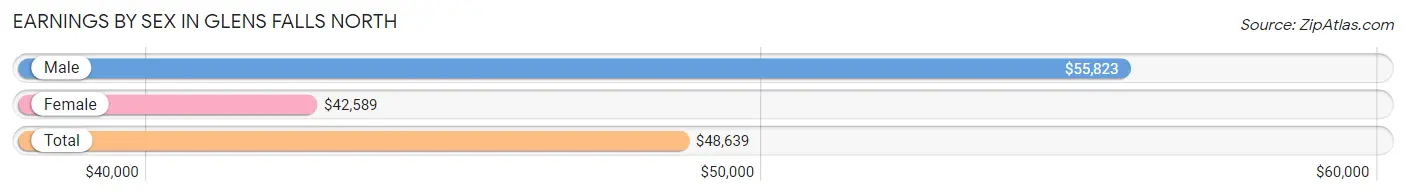
Earnings by Sex in Glens Falls North
Average Earnings in Glens Falls North are $48,639, $55,823 for men and $42,589 for women, a difference of 23.7%.
| Sex | Number | Average Earnings |
| Male | 2,406 (49.5%) | $55,823 |
| Female | 2,453 (50.5%) | $42,589 |
| Total | 4,859 (100.0%) | $48,639 |
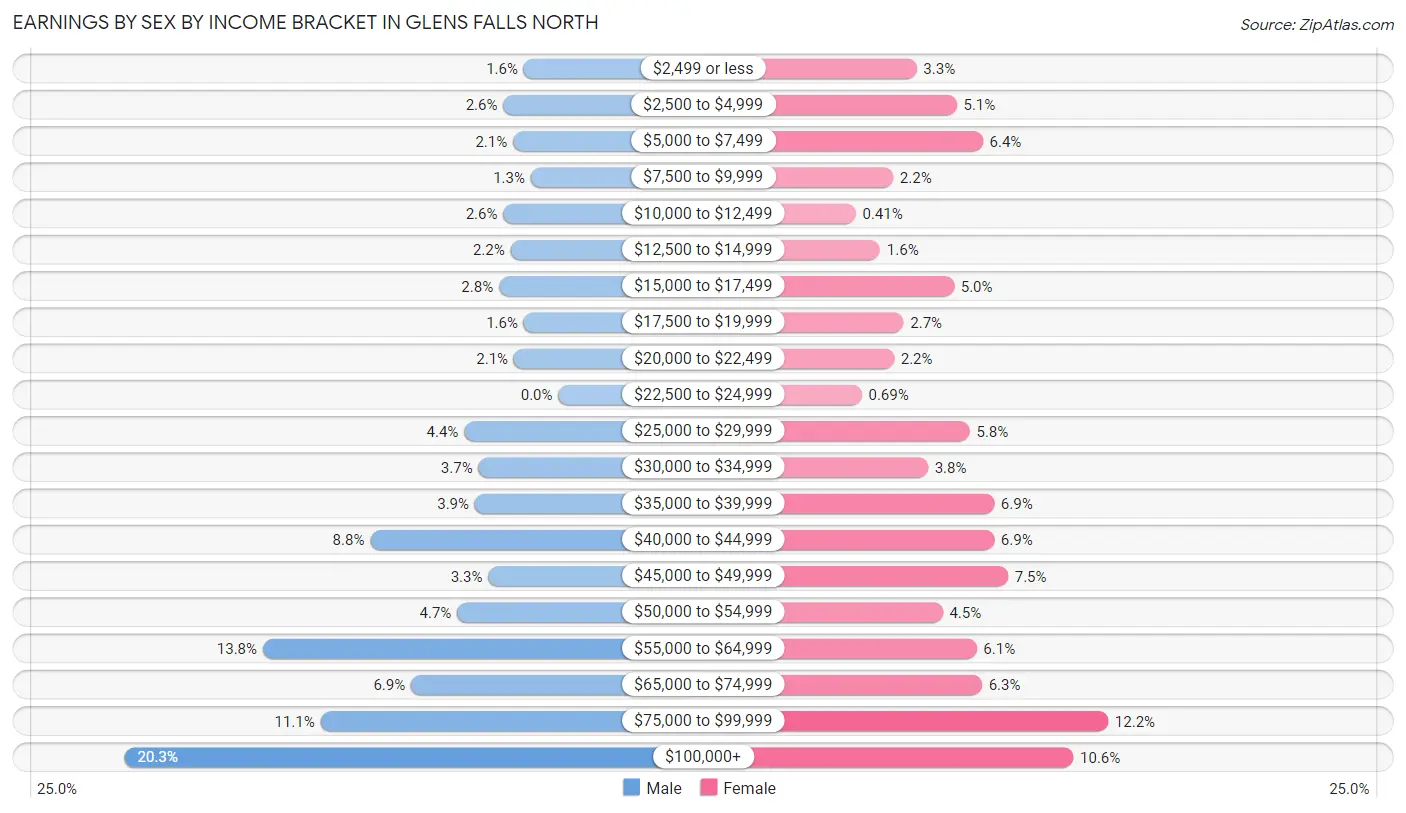
Earnings by Sex by Income Bracket in Glens Falls North
The most common earnings brackets in Glens Falls North are $100,000+ for men (489 | 20.3%) and $75,000 to $99,999 for women (300 | 12.2%).
| Income | Male | Female |
| $2,499 or less | 39 (1.6%) | 80 (3.3%) |
| $2,500 to $4,999 | 62 (2.6%) | 126 (5.1%) |
| $5,000 to $7,499 | 51 (2.1%) | 156 (6.4%) |
| $7,500 to $9,999 | 31 (1.3%) | 53 (2.2%) |
| $10,000 to $12,499 | 62 (2.6%) | 10 (0.4%) |
| $12,500 to $14,999 | 54 (2.2%) | 38 (1.5%) |
| $15,000 to $17,499 | 67 (2.8%) | 123 (5.0%) |
| $17,500 to $19,999 | 39 (1.6%) | 65 (2.6%) |
| $20,000 to $22,499 | 50 (2.1%) | 54 (2.2%) |
| $22,500 to $24,999 | 0 (0.0%) | 17 (0.7%) |
| $25,000 to $29,999 | 106 (4.4%) | 141 (5.8%) |
| $30,000 to $34,999 | 90 (3.7%) | 93 (3.8%) |
| $35,000 to $39,999 | 94 (3.9%) | 169 (6.9%) |
| $40,000 to $44,999 | 212 (8.8%) | 169 (6.9%) |
| $45,000 to $49,999 | 79 (3.3%) | 185 (7.5%) |
| $50,000 to $54,999 | 114 (4.7%) | 110 (4.5%) |
| $55,000 to $64,999 | 333 (13.8%) | 149 (6.1%) |
| $65,000 to $74,999 | 166 (6.9%) | 155 (6.3%) |
| $75,000 to $99,999 | 268 (11.1%) | 300 (12.2%) |
| $100,000+ | 489 (20.3%) | 260 (10.6%) |
| Total | 2,406 (100.0%) | 2,453 (100.0%) |
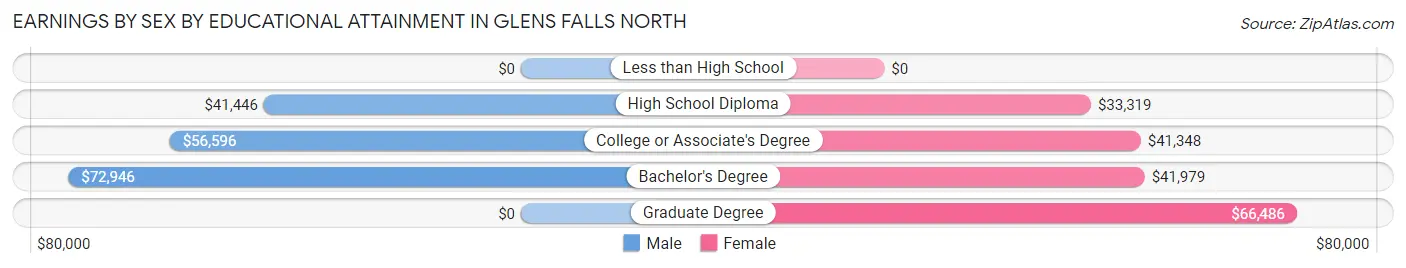
Earnings by Sex by Educational Attainment in Glens Falls North
Average earnings in Glens Falls North are $59,300 for men and $45,391 for women, a difference of 23.5%. Men with an educational attainment of bachelor's degree enjoy the highest average annual earnings of $72,946, while those with high school diploma education earn the least with $41,446. Women with an educational attainment of graduate degree earn the most with the average annual earnings of $66,486, while those with high school diploma education have the smallest earnings of $33,319.
| Educational Attainment | Male Income | Female Income |
| Less than High School | - | - |
| High School Diploma | $41,446 | $33,319 |
| College or Associate's Degree | $56,596 | $41,348 |
| Bachelor's Degree | $72,946 | $41,979 |
| Graduate Degree | - | - |
| Total | $59,300 | $45,391 |
Family Income in Glens Falls North
Family Income Brackets in Glens Falls North
According to the Glens Falls North family income data, there are 570 families falling into the $100,000 to $149,999 income range, which is the most common income bracket and makes up 21.0% of all families. Conversely, the less than $10,000 income bracket is the least frequent group with only 22 families (0.8%) belonging to this category.
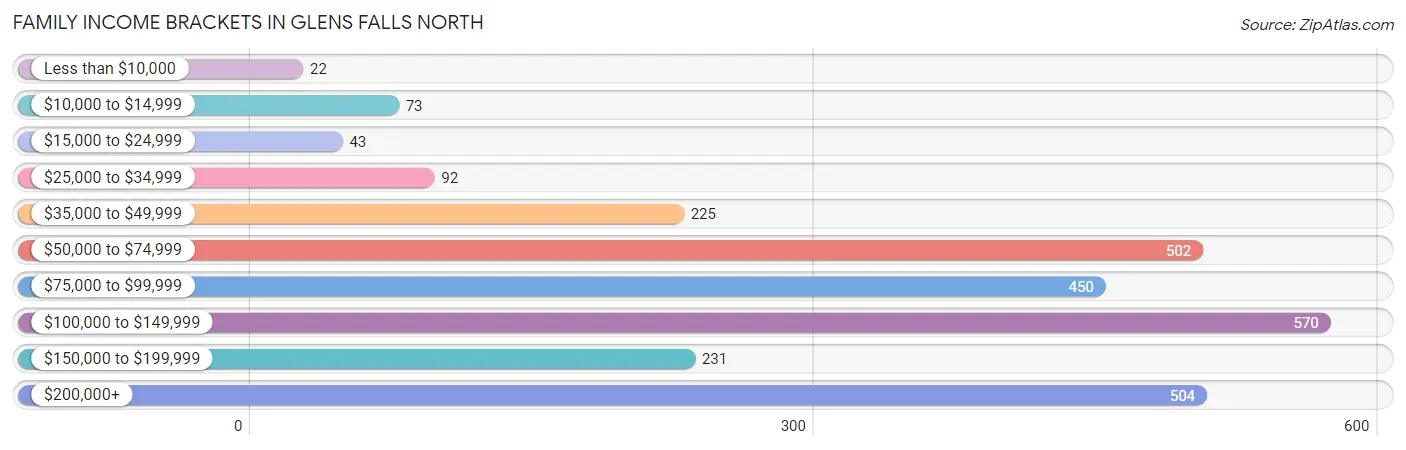
| Income Bracket | # Families | % Families |
| Less than $10,000 | 22 | 0.8% |
| $10,000 to $14,999 | 73 | 2.7% |
| $15,000 to $24,999 | 43 | 1.6% |
| $25,000 to $34,999 | 92 | 3.4% |
| $35,000 to $49,999 | 225 | 8.3% |
| $50,000 to $74,999 | 502 | 18.5% |
| $75,000 to $99,999 | 450 | 16.6% |
| $100,000 to $149,999 | 570 | 21.0% |
| $150,000 to $199,999 | 231 | 8.5% |
| $200,000+ | 504 | 18.6% |
Family Income by Famaliy Size in Glens Falls North
5-person families (151 | 5.6%) account for the highest median family income in Glens Falls North with $115,511 per family, while 2-person families (1,710 | 63.0%) have the highest median income of $46,330 per family member.
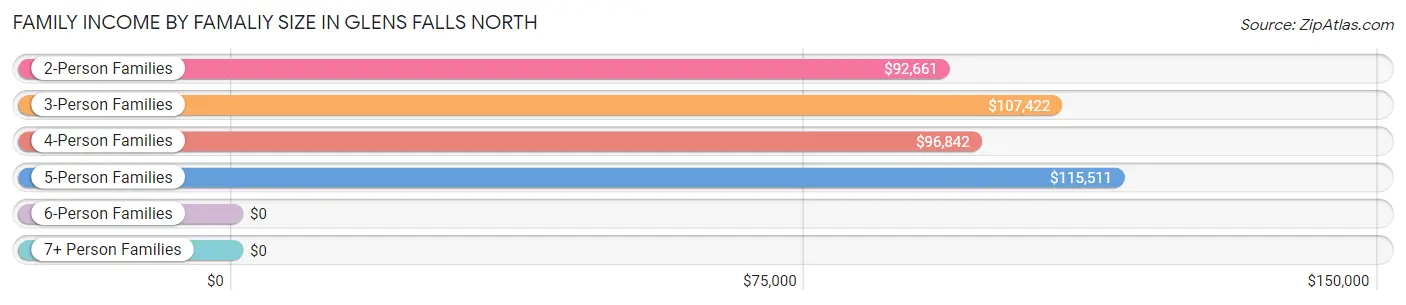
| Income Bracket | # Families | Median Income |
| 2-Person Families | 1,710 (63.0%) | $92,661 |
| 3-Person Families | 387 (14.3%) | $107,422 |
| 4-Person Families | 464 (17.1%) | $96,842 |
| 5-Person Families | 151 (5.6%) | $115,511 |
| 6-Person Families | 0 (0.0%) | $0 |
| 7+ Person Families | 0 (0.0%) | $0 |
| Total | 2,712 (100.0%) | $97,035 |
Family Income by Number of Earners in Glens Falls North
The median family income in Glens Falls North is $97,035, with families comprising 3+ earners (222) having the highest median family income of $161,538, while families with no earners (555) have the lowest median family income of $68,354, accounting for 8.2% and 20.5% of families, respectively.
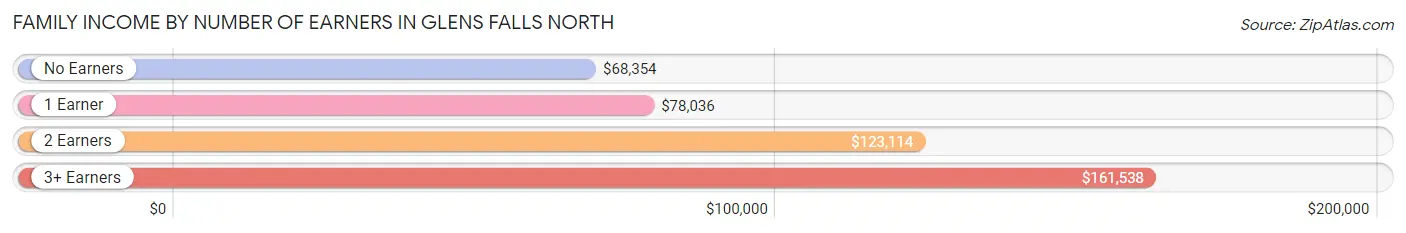
| Number of Earners | # Families | Median Income |
| No Earners | 555 (20.5%) | $68,354 |
| 1 Earner | 933 (34.4%) | $78,036 |
| 2 Earners | 1,002 (36.9%) | $123,114 |
| 3+ Earners | 222 (8.2%) | $161,538 |
| Total | 2,712 (100.0%) | $97,035 |
Household Income in Glens Falls North
Household Income Brackets in Glens Falls North
With 770 households falling in the category, the $100,000 to $149,999 income range is the most frequent in Glens Falls North, accounting for 17.8% of all households. In contrast, only 112 households (2.6%) fall into the less than $10,000 income bracket, making it the least populous group.
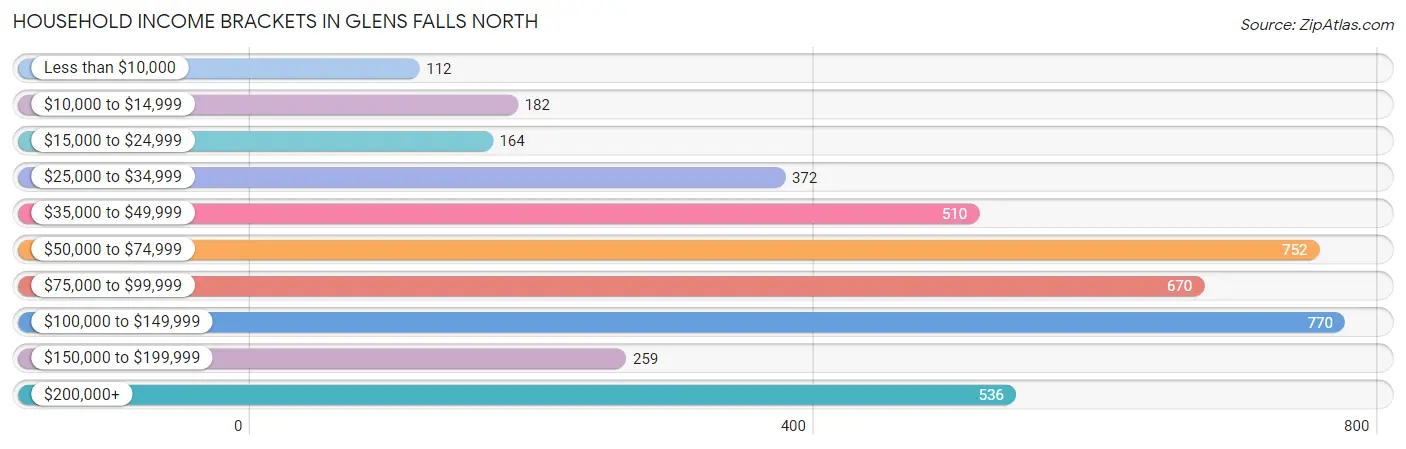
| Income Bracket | # Households | % Households |
| Less than $10,000 | 112 | 2.6% |
| $10,000 to $14,999 | 182 | 4.2% |
| $15,000 to $24,999 | 164 | 3.8% |
| $25,000 to $34,999 | 372 | 8.6% |
| $35,000 to $49,999 | 510 | 11.8% |
| $50,000 to $74,999 | 752 | 17.4% |
| $75,000 to $99,999 | 670 | 15.5% |
| $100,000 to $149,999 | 770 | 17.8% |
| $150,000 to $199,999 | 259 | 6.0% |
| $200,000+ | 536 | 12.4% |
Household Income by Householder Age in Glens Falls North
The median household income in Glens Falls North is $78,889, with the highest median household income of $95,602 found in the 45 to 64 years age bracket for the primary householder. A total of 1,391 households (32.2%) fall into this category. Meanwhile, the 15 to 24 years age bracket for the primary householder has the lowest median household income of $0, with 59 households (1.4%) in this group.
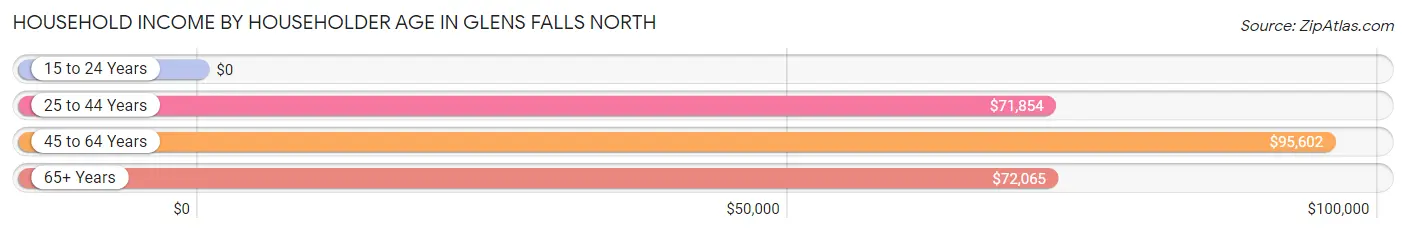
| Income Bracket | # Households | Median Income |
| 15 to 24 Years | 59 (1.4%) | $0 |
| 25 to 44 Years | 1,430 (33.1%) | $71,854 |
| 45 to 64 Years | 1,391 (32.2%) | $95,602 |
| 65+ Years | 1,444 (33.4%) | $72,065 |
| Total | 4,324 (100.0%) | $78,889 |
Poverty in Glens Falls North
Income Below Poverty by Sex and Age in Glens Falls North
With 6.1% poverty level for males and 8.5% for females among the residents of Glens Falls North, 6 to 11 year old males and 15 year old females are the most vulnerable to poverty, with 44 males (16.2%) and 19 females (28.8%) in their respective age groups living below the poverty level.
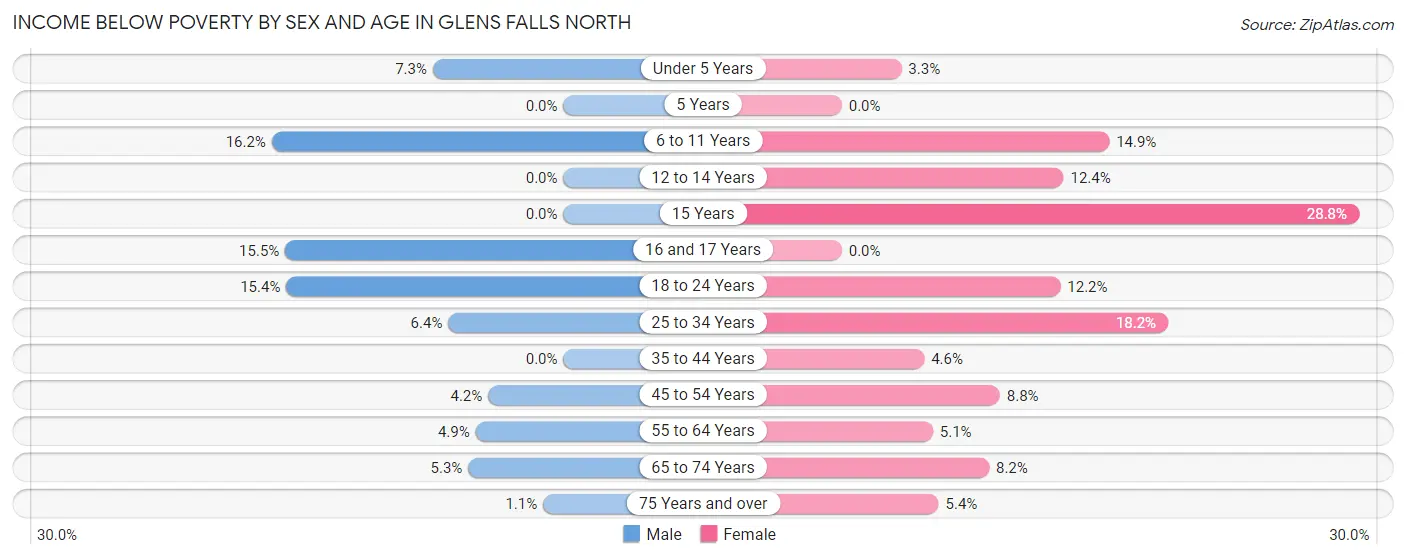
| Age Bracket | Male | Female |
| Under 5 Years | 25 (7.3%) | 8 (3.3%) |
| 5 Years | 0 (0.0%) | 0 (0.0%) |
| 6 to 11 Years | 44 (16.2%) | 21 (14.9%) |
| 12 to 14 Years | 0 (0.0%) | 10 (12.3%) |
| 15 Years | 0 (0.0%) | 19 (28.8%) |
| 16 and 17 Years | 11 (15.5%) | 0 (0.0%) |
| 18 to 24 Years | 48 (15.4%) | 28 (12.2%) |
| 25 to 34 Years | 46 (6.4%) | 126 (18.2%) |
| 35 to 44 Years | 0 (0.0%) | 22 (4.6%) |
| 45 to 54 Years | 18 (4.2%) | 38 (8.8%) |
| 55 to 64 Years | 25 (4.9%) | 56 (5.1%) |
| 65 to 74 Years | 42 (5.3%) | 42 (8.2%) |
| 75 Years and over | 3 (1.1%) | 31 (5.4%) |
| Total | 262 (6.1%) | 401 (8.5%) |
Income Above Poverty by Sex and Age in Glens Falls North
According to the poverty statistics in Glens Falls North, males aged 5 years and females aged 5 years are the age groups that are most secure financially, with 100.0% of males and 100.0% of females in these age groups living above the poverty line.
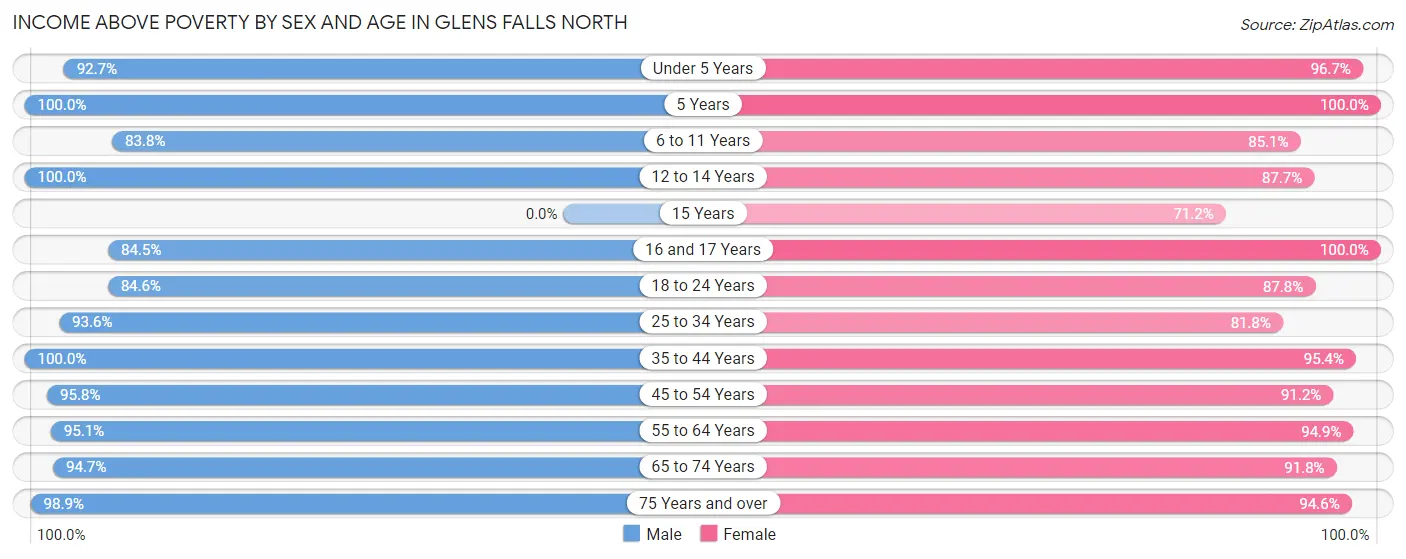
| Age Bracket | Male | Female |
| Under 5 Years | 319 (92.7%) | 233 (96.7%) |
| 5 Years | 41 (100.0%) | 109 (100.0%) |
| 6 to 11 Years | 227 (83.8%) | 120 (85.1%) |
| 12 to 14 Years | 129 (100.0%) | 71 (87.6%) |
| 15 Years | 0 (0.0%) | 47 (71.2%) |
| 16 and 17 Years | 60 (84.5%) | 33 (100.0%) |
| 18 to 24 Years | 263 (84.6%) | 202 (87.8%) |
| 25 to 34 Years | 672 (93.6%) | 568 (81.8%) |
| 35 to 44 Years | 416 (100.0%) | 457 (95.4%) |
| 45 to 54 Years | 412 (95.8%) | 394 (91.2%) |
| 55 to 64 Years | 486 (95.1%) | 1,048 (94.9%) |
| 65 to 74 Years | 750 (94.7%) | 470 (91.8%) |
| 75 Years and over | 262 (98.9%) | 544 (94.6%) |
| Total | 4,037 (93.9%) | 4,296 (91.5%) |
Income Below Poverty Among Married-Couple Families in Glens Falls North
The poverty statistics for married-couple families in Glens Falls North show that 1.4% or 28 of the total 2,044 families live below the poverty line. Families with no children have the highest poverty rate of 1.9%, comprising of 28 families. On the other hand, families with 1 or 2 children have the lowest poverty rate of 0.0%, which includes 0 families.
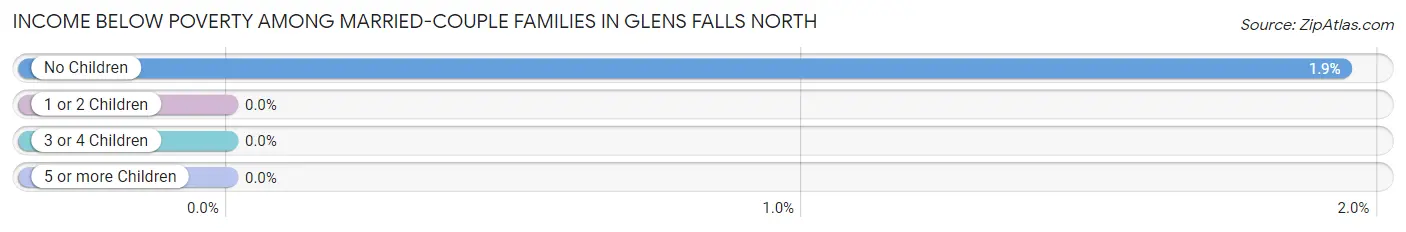
| Children | Above Poverty | Below Poverty |
| No Children | 1,416 (98.1%) | 28 (1.9%) |
| 1 or 2 Children | 536 (100.0%) | 0 (0.0%) |
| 3 or 4 Children | 64 (100.0%) | 0 (0.0%) |
| 5 or more Children | 0 (0.0%) | 0 (0.0%) |
| Total | 2,016 (98.6%) | 28 (1.4%) |
Income Below Poverty Among Single-Parent Households in Glens Falls North
According to the poverty data in Glens Falls North, 4.6% or 10 single-father households and 17.7% or 80 single-mother households are living below the poverty line. Among single-father households, those with 1 or 2 children have the highest poverty rate, with 10 households (5.4%) experiencing poverty. Likewise, among single-mother households, those with 3 or 4 children have the highest poverty rate, with 35 households (52.2%) falling below the poverty line.
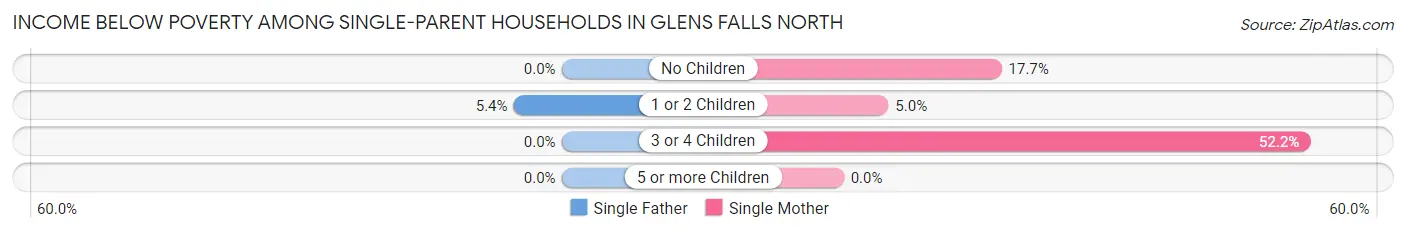
| Children | Single Father | Single Mother |
| No Children | 0 (0.0%) | 36 (17.6%) |
| 1 or 2 Children | 10 (5.4%) | 9 (5.0%) |
| 3 or 4 Children | 0 (0.0%) | 35 (52.2%) |
| 5 or more Children | 0 (0.0%) | 0 (0.0%) |
| Total | 10 (4.6%) | 80 (17.7%) |
Income Below Poverty Among Married-Couple vs Single-Parent Households in Glens Falls North
The poverty data for Glens Falls North shows that 28 of the married-couple family households (1.4%) and 90 of the single-parent households (13.5%) are living below the poverty level. Within the married-couple family households, those with no children have the highest poverty rate, with 28 households (1.9%) falling below the poverty line. Among the single-parent households, those with 3 or 4 children have the highest poverty rate, with 35 household (52.2%) living below poverty.
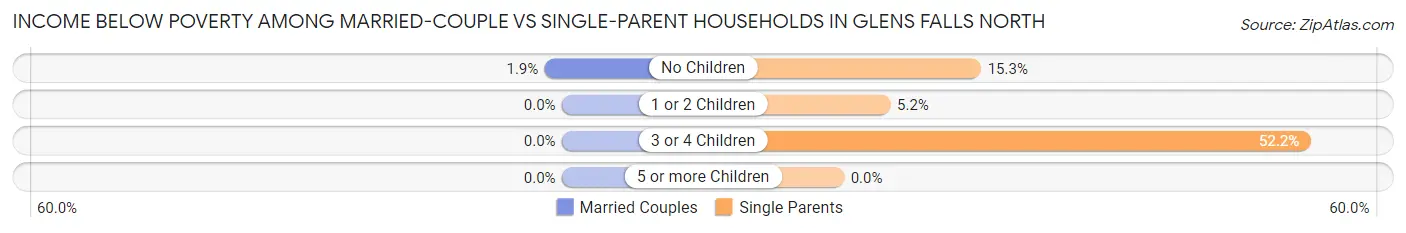
| Children | Married-Couple Families | Single-Parent Households |
| No Children | 28 (1.9%) | 36 (15.3%) |
| 1 or 2 Children | 0 (0.0%) | 19 (5.2%) |
| 3 or 4 Children | 0 (0.0%) | 35 (52.2%) |
| 5 or more Children | 0 (0.0%) | 0 (0.0%) |
| Total | 28 (1.4%) | 90 (13.5%) |
Race in Glens Falls North
The most populous races in Glens Falls North are White / Caucasian (8,627 | 95.9%), Two or more Races (203 | 2.3%), and Hispanic or Latino (138 | 1.5%).
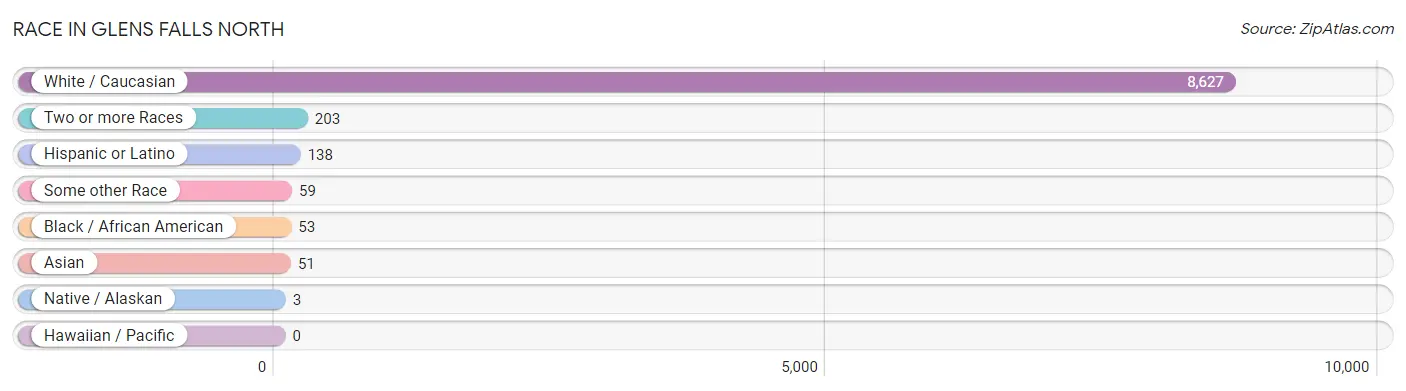
| Race | # Population | % Population |
| Asian | 51 | 0.6% |
| Black / African American | 53 | 0.6% |
| Hawaiian / Pacific | 0 | 0.0% |
| Hispanic or Latino | 138 | 1.5% |
| Native / Alaskan | 3 | 0.0% |
| White / Caucasian | 8,627 | 95.9% |
| Two or more Races | 203 | 2.3% |
| Some other Race | 59 | 0.7% |
| Total | 8,996 | 100.0% |
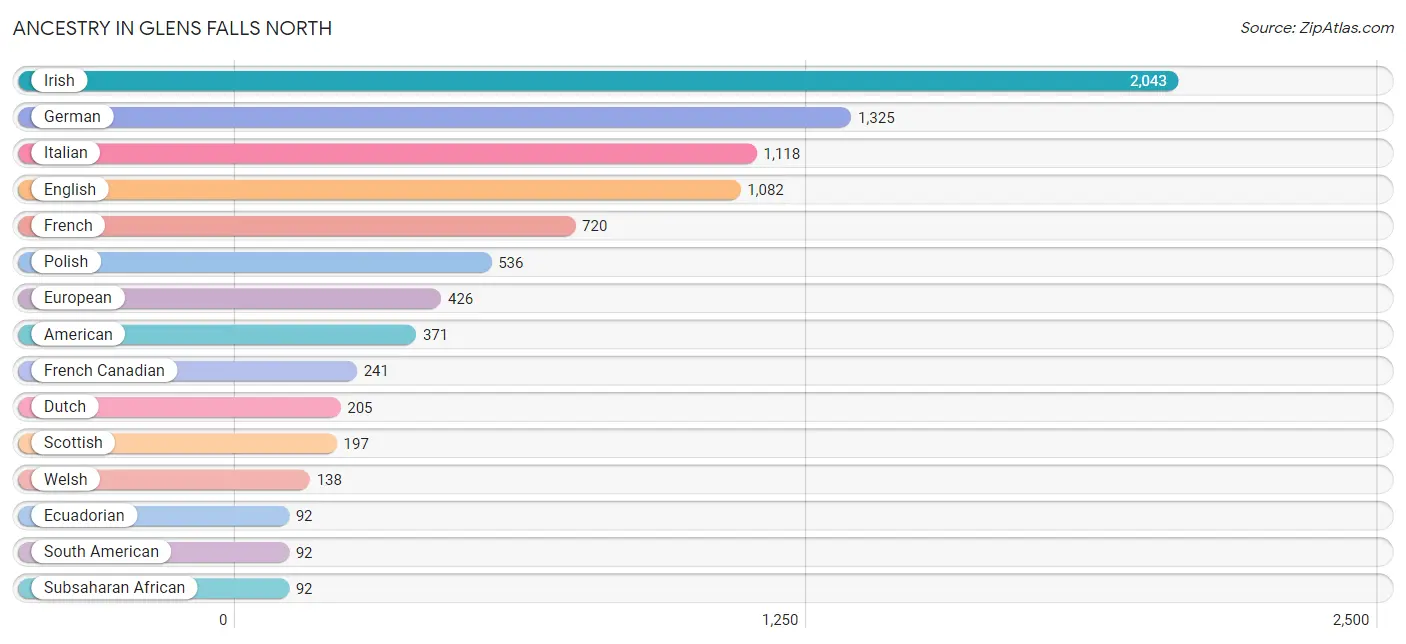
Ancestry in Glens Falls North
The most populous ancestries reported in Glens Falls North are Irish (2,043 | 22.7%), German (1,325 | 14.7%), Italian (1,118 | 12.4%), English (1,082 | 12.0%), and French (720 | 8.0%), together accounting for 69.9% of all Glens Falls North residents.
| Ancestry | # Population | % Population |
| African | 26 | 0.3% |
| Alaska Native | 3 | 0.0% |
| American | 371 | 4.1% |
| Arab | 20 | 0.2% |
| Austrian | 7 | 0.1% |
| British | 29 | 0.3% |
| Canadian | 26 | 0.3% |
| Central American | 46 | 0.5% |
| Czechoslovakian | 23 | 0.3% |
| Danish | 18 | 0.2% |
| Dutch | 205 | 2.3% |
| Eastern European | 30 | 0.3% |
| Ecuadorian | 92 | 1.0% |
| English | 1,082 | 12.0% |
| European | 426 | 4.7% |
| Finnish | 17 | 0.2% |
| French | 720 | 8.0% |
| French American Indian | 12 | 0.1% |
| French Canadian | 241 | 2.7% |
| German | 1,325 | 14.7% |
| Greek | 50 | 0.6% |
| Guatemalan | 46 | 0.5% |
| Haitian | 21 | 0.2% |
| Hungarian | 89 | 1.0% |
| Irish | 2,043 | 22.7% |
| Italian | 1,118 | 12.4% |
| Korean | 40 | 0.4% |
| Lebanese | 11 | 0.1% |
| Lithuanian | 31 | 0.3% |
| Norwegian | 46 | 0.5% |
| Polish | 536 | 6.0% |
| Portuguese | 9 | 0.1% |
| Russian | 14 | 0.2% |
| Scandinavian | 10 | 0.1% |
| Scotch-Irish | 76 | 0.8% |
| Scottish | 197 | 2.2% |
| Slavic | 24 | 0.3% |
| Slovak | 68 | 0.8% |
| South African | 66 | 0.7% |
| South American | 92 | 1.0% |
| Subsaharan African | 92 | 1.0% |
| Swedish | 33 | 0.4% |
| Syrian | 9 | 0.1% |
| Thai | 33 | 0.4% |
| Ukrainian | 10 | 0.1% |
| Welsh | 138 | 1.5% | View All 46 Rows |
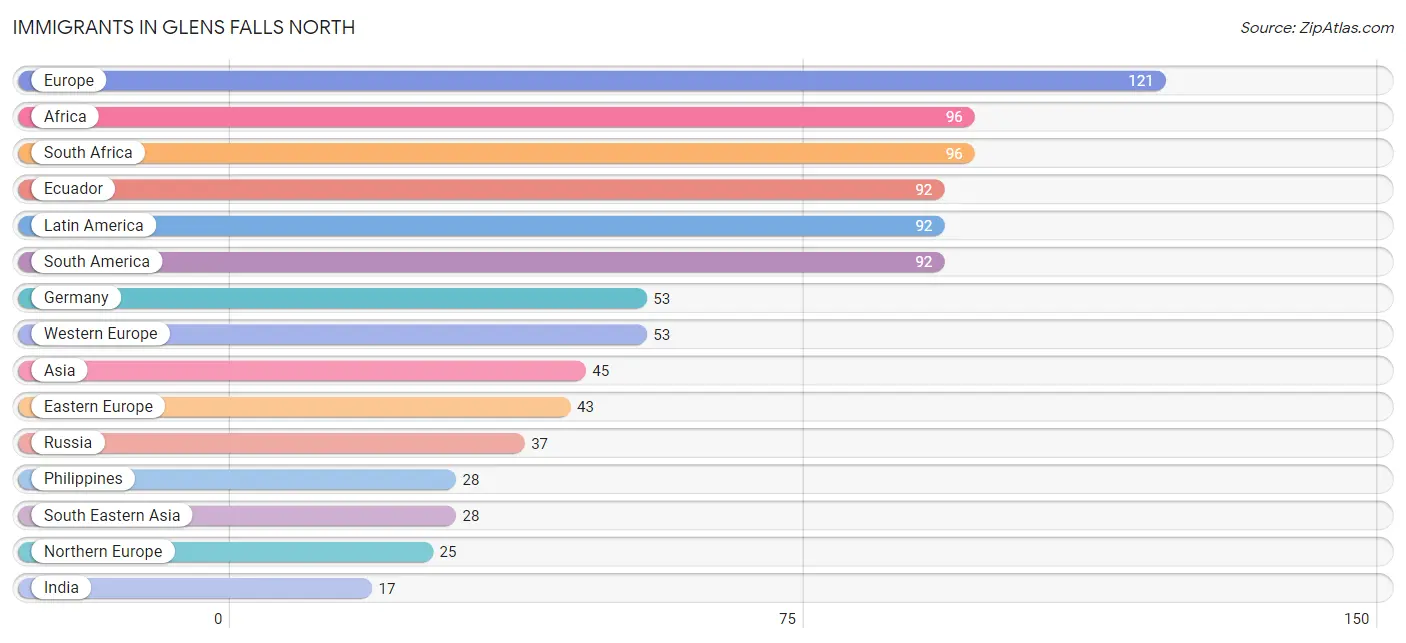
Immigrants in Glens Falls North
The most numerous immigrant groups reported in Glens Falls North came from Europe (121 | 1.3%), Africa (96 | 1.1%), South Africa (96 | 1.1%), Ecuador (92 | 1.0%), and Latin America (92 | 1.0%), together accounting for 5.5% of all Glens Falls North residents.
| Immigration Origin | # Population | % Population |
| Africa | 96 | 1.1% |
| Asia | 45 | 0.5% |
| Eastern Europe | 43 | 0.5% |
| Ecuador | 92 | 1.0% |
| Europe | 121 | 1.3% |
| Germany | 53 | 0.6% |
| Hungary | 6 | 0.1% |
| India | 17 | 0.2% |
| Ireland | 9 | 0.1% |
| Latin America | 92 | 1.0% |
| Northern Europe | 25 | 0.3% |
| Philippines | 28 | 0.3% |
| Russia | 37 | 0.4% |
| Scotland | 16 | 0.2% |
| South Africa | 96 | 1.1% |
| South America | 92 | 1.0% |
| South Central Asia | 17 | 0.2% |
| South Eastern Asia | 28 | 0.3% |
| Western Europe | 53 | 0.6% | View All 19 Rows |
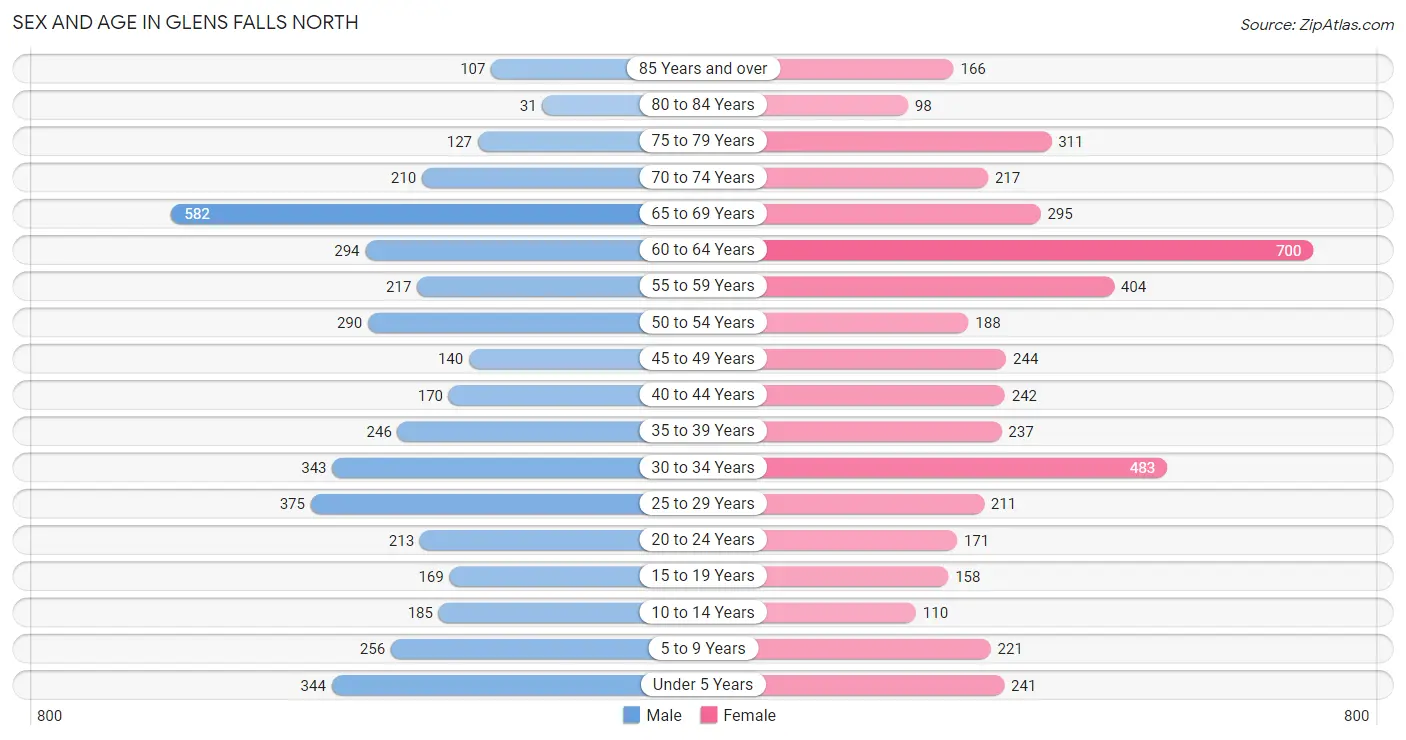
Sex and Age in Glens Falls North
Sex and Age in Glens Falls North
The most populous age groups in Glens Falls North are 65 to 69 Years (582 | 13.5%) for men and 60 to 64 Years (700 | 14.9%) for women.
| Age Bracket | Male | Female |
| Under 5 Years | 344 (8.0%) | 241 (5.1%) |
| 5 to 9 Years | 256 (5.9%) | 221 (4.7%) |
| 10 to 14 Years | 185 (4.3%) | 110 (2.3%) |
| 15 to 19 Years | 169 (3.9%) | 158 (3.4%) |
| 20 to 24 Years | 213 (5.0%) | 171 (3.6%) |
| 25 to 29 Years | 375 (8.7%) | 211 (4.5%) |
| 30 to 34 Years | 343 (8.0%) | 483 (10.3%) |
| 35 to 39 Years | 246 (5.7%) | 237 (5.1%) |
| 40 to 44 Years | 170 (4.0%) | 242 (5.1%) |
| 45 to 49 Years | 140 (3.3%) | 244 (5.2%) |
| 50 to 54 Years | 290 (6.8%) | 188 (4.0%) |
| 55 to 59 Years | 217 (5.1%) | 404 (8.6%) |
| 60 to 64 Years | 294 (6.8%) | 700 (14.9%) |
| 65 to 69 Years | 582 (13.5%) | 295 (6.3%) |
| 70 to 74 Years | 210 (4.9%) | 217 (4.6%) |
| 75 to 79 Years | 127 (2.9%) | 311 (6.6%) |
| 80 to 84 Years | 31 (0.7%) | 98 (2.1%) |
| 85 Years and over | 107 (2.5%) | 166 (3.5%) |
| Total | 4,299 (100.0%) | 4,697 (100.0%) |
Families and Households in Glens Falls North
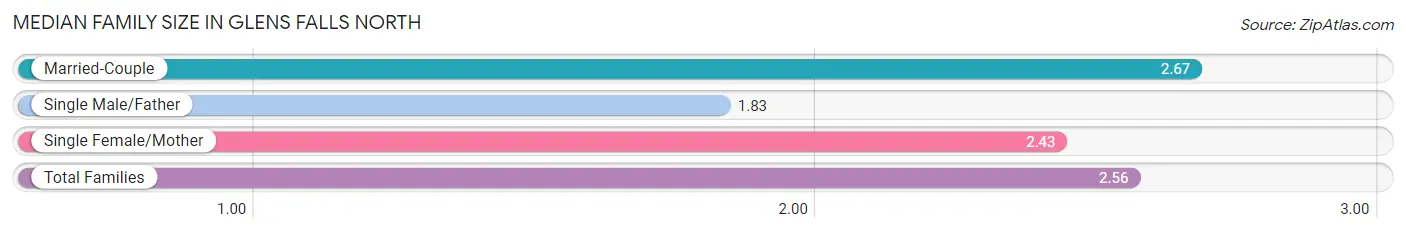
Median Family Size in Glens Falls North
The median family size in Glens Falls North is 2.56 persons per family, with married-couple families (2,044 | 75.4%) accounting for the largest median family size of 2.67 persons per family. On the other hand, single male/father families (217 | 8.0%) represent the smallest median family size with 1.83 persons per family.
| Family Type | # Families | Family Size |
| Married-Couple | 2,044 (75.4%) | 2.67 |
| Single Male/Father | 217 (8.0%) | 1.83 |
| Single Female/Mother | 451 (16.6%) | 2.43 |
| Total Families | 2,712 (100.0%) | 2.56 |
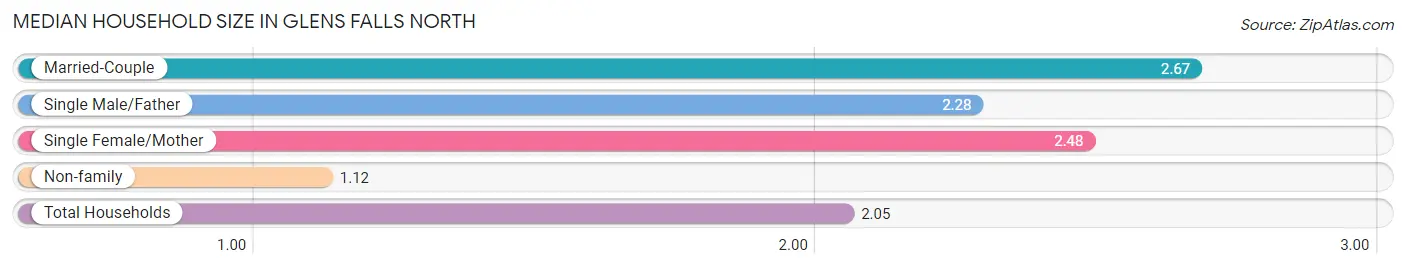
Median Household Size in Glens Falls North
The median household size in Glens Falls North is 2.05 persons per household, with married-couple households (2,044 | 47.3%) accounting for the largest median household size of 2.67 persons per household. non-family households (1,612 | 37.3%) represent the smallest median household size with 1.12 persons per household.
| Household Type | # Households | Household Size |
| Married-Couple | 2,044 (47.3%) | 2.67 |
| Single Male/Father | 217 (5.0%) | 2.28 |
| Single Female/Mother | 451 (10.4%) | 2.48 |
| Non-family | 1,612 (37.3%) | 1.12 |
| Total Households | 4,324 (100.0%) | 2.05 |
Household Size by Marriage Status in Glens Falls North
Out of a total of 4,324 households in Glens Falls North, 2,712 (62.7%) are family households, while 1,612 (37.3%) are nonfamily households. The most numerous type of family households are 2-person households, comprising 1,619, and the most common type of nonfamily households are 1-person households, comprising 1,394.
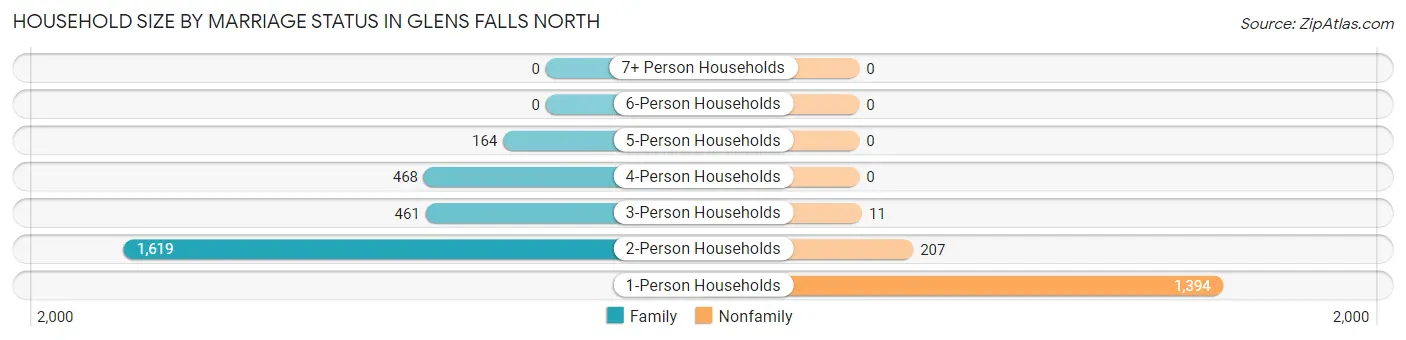
| Household Size | Family Households | Nonfamily Households |
| 1-Person Households | - | 1,394 (32.2%) |
| 2-Person Households | 1,619 (37.4%) | 207 (4.8%) |
| 3-Person Households | 461 (10.7%) | 11 (0.3%) |
| 4-Person Households | 468 (10.8%) | 0 (0.0%) |
| 5-Person Households | 164 (3.8%) | 0 (0.0%) |
| 6-Person Households | 0 (0.0%) | 0 (0.0%) |
| 7+ Person Households | 0 (0.0%) | 0 (0.0%) |
| Total | 2,712 (62.7%) | 1,612 (37.3%) |
Female Fertility in Glens Falls North
Fertility by Age in Glens Falls North
Average fertility rate in Glens Falls North is 37.0 births per 1,000 women. Women in the age bracket of 20 to 34 years have the highest fertility rate with 50.0 births per 1,000 women. Women in the age bracket of 20 to 34 years acount for 66.1% of all women with births.
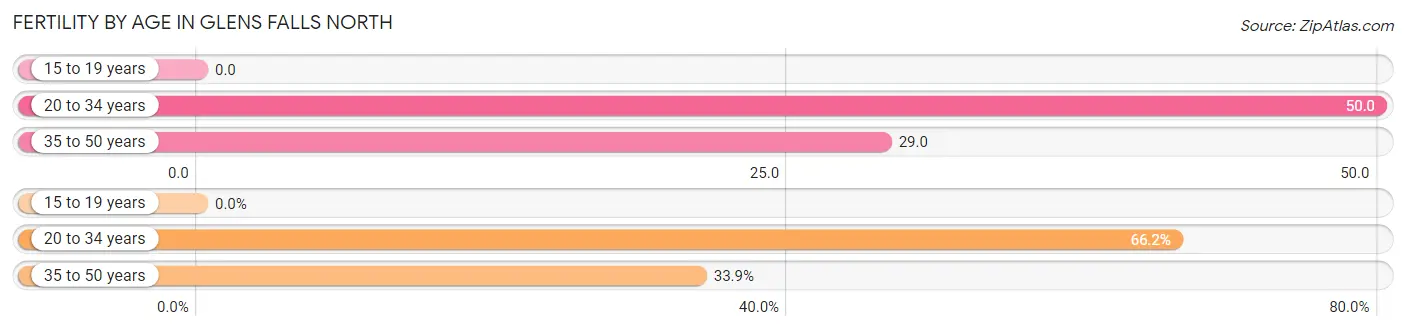
| Age Bracket | Women with Births | Births / 1,000 Women |
| 15 to 19 years | 0 (0.0%) | 0.0 |
| 20 to 34 years | 43 (66.1%) | 50.0 |
| 35 to 50 years | 22 (33.9%) | 29.0 |
| Total | 65 (100.0%) | 37.0 |
Fertility by Age by Marriage Status in Glens Falls North
66.2% of women with births (65) in Glens Falls North are married. The highest percentage of unmarried women with births falls into 35 to 50 years age bracket with 100.0% of them unmarried at the time of birth, while the lowest percentage of unmarried women with births belong to 20 to 34 years age bracket with 0.0% of them unmarried.
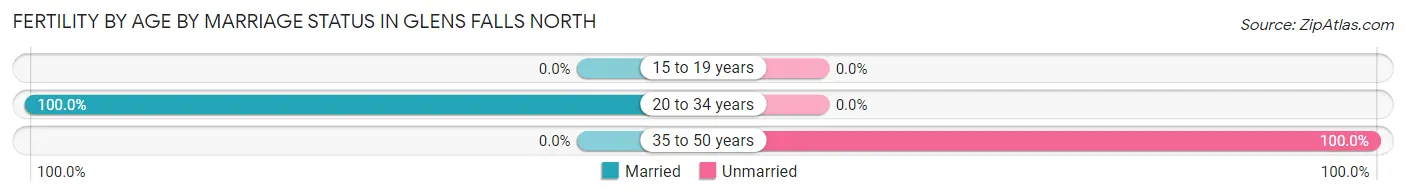
| Age Bracket | Married | Unmarried |
| 15 to 19 years | 0 (0.0%) | 0 (0.0%) |
| 20 to 34 years | 43 (100.0%) | 0 (0.0%) |
| 35 to 50 years | 0 (0.0%) | 22 (100.0%) |
| Total | 43 (66.1%) | 22 (33.9%) |
Fertility by Education in Glens Falls North
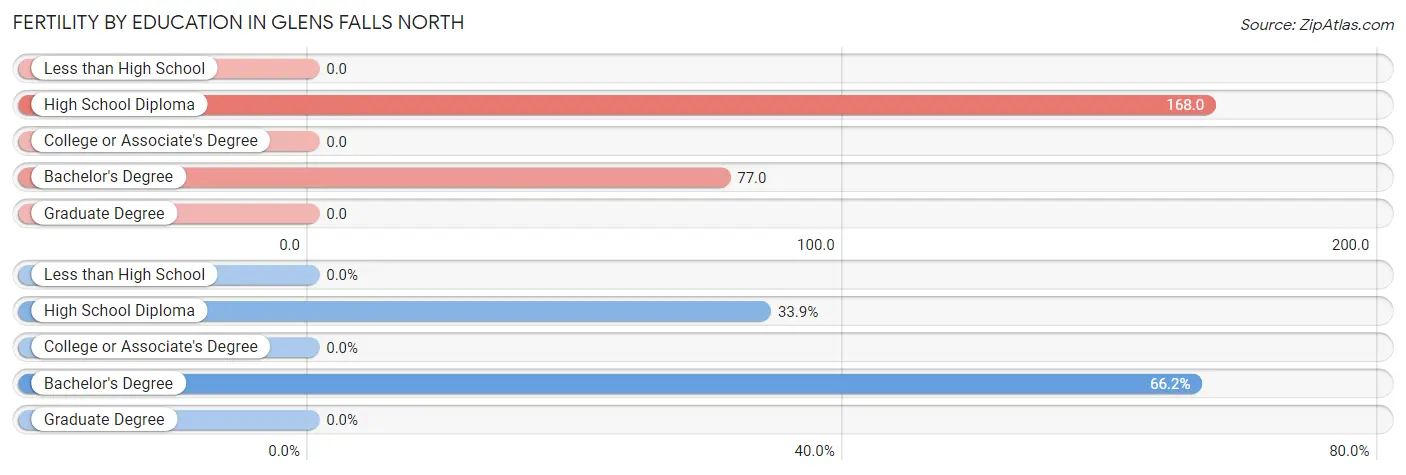
| Educational Attainment | Women with Births | Births / 1,000 Women |
| Less than High School | 0 (0.0%) | 0.0 |
| High School Diploma | 22 (33.9%) | 168.0 |
| College or Associate's Degree | 0 (0.0%) | 0.0 |
| Bachelor's Degree | 43 (66.1%) | 77.0 |
| Graduate Degree | 0 (0.0%) | 0.0 |
| Total | 65 (100.0%) | 37.0 |
Fertility by Education by Marriage Status in Glens Falls North
33.9% of women with births in Glens Falls North are unmarried. Women with the educational attainment of bachelor's degree are most likely to be married with 100.0% of them married at childbirth, while women with the educational attainment of high school diploma are least likely to be married with 100.0% of them unmarried at childbirth.
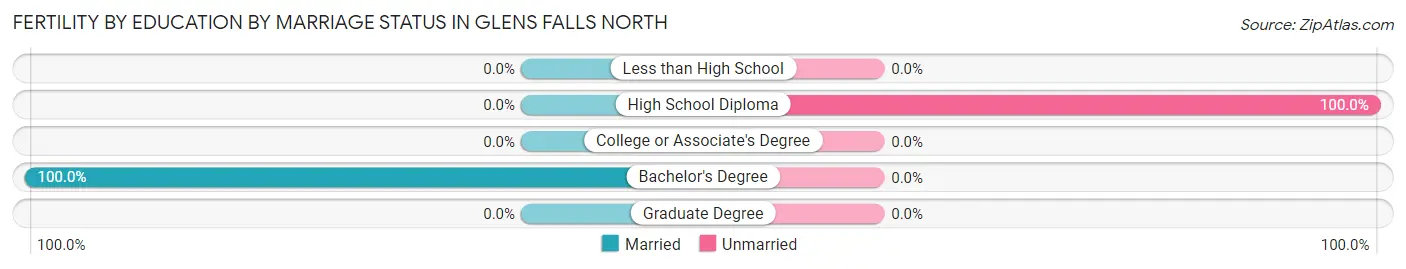
| Educational Attainment | Married | Unmarried |
| Less than High School | 0 (0.0%) | 0 (0.0%) |
| High School Diploma | 0 (0.0%) | 22 (100.0%) |
| College or Associate's Degree | 0 (0.0%) | 0 (0.0%) |
| Bachelor's Degree | 43 (100.0%) | 0 (0.0%) |
| Graduate Degree | 0 (0.0%) | 0 (0.0%) |
| Total | 43 (66.1%) | 22 (33.9%) |
Employment Characteristics in Glens Falls North
Employment by Class of Employer in Glens Falls North
Among the 4,389 employed individuals in Glens Falls North, private company employees (2,474 | 56.4%), local government employees (528 | 12.0%), and not-for-profit organizations (513 | 11.7%) make up the most common classes of employment.
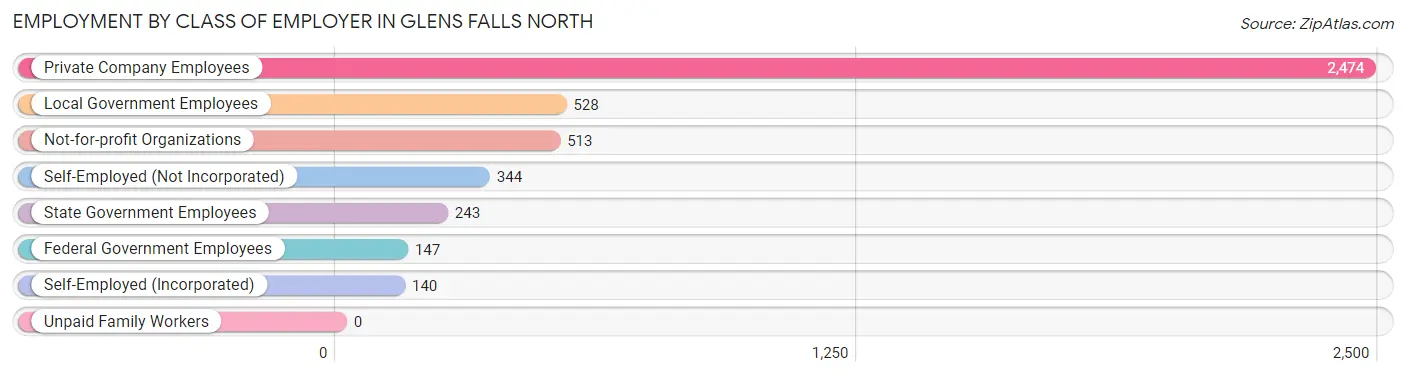
| Employer Class | # Employees | % Employees |
| Private Company Employees | 2,474 | 56.4% |
| Self-Employed (Incorporated) | 140 | 3.2% |
| Self-Employed (Not Incorporated) | 344 | 7.8% |
| Not-for-profit Organizations | 513 | 11.7% |
| Local Government Employees | 528 | 12.0% |
| State Government Employees | 243 | 5.5% |
| Federal Government Employees | 147 | 3.4% |
| Unpaid Family Workers | 0 | 0.0% |
| Total | 4,389 | 100.0% |
Employment Status by Age in Glens Falls North
According to the labor force statistics for Glens Falls North, out of the total population over 16 years of age (7,573), 61.4% or 4,650 individuals are in the labor force, with 5.0% or 232 of them unemployed. The age group with the highest labor force participation rate is 35 to 44 years, with 93.1% or 833 individuals in the labor force. Within the labor force, the 20 to 24 years age range has the highest percentage of unemployed individuals, with 23.1% or 79 of them being unemployed.
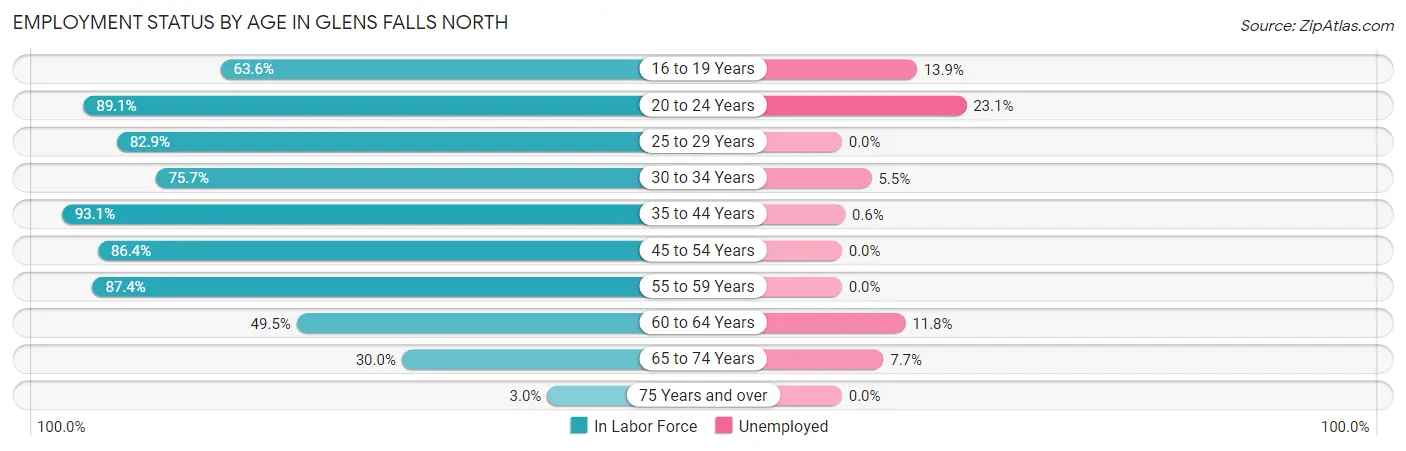
| Age Bracket | In Labor Force | Unemployed |
| 16 to 19 Years | 166 (63.6%) | 23 (13.9%) |
| 20 to 24 Years | 342 (89.1%) | 79 (23.1%) |
| 25 to 29 Years | 486 (82.9%) | 0 (0.0%) |
| 30 to 34 Years | 625 (75.7%) | 34 (5.5%) |
| 35 to 44 Years | 833 (93.1%) | 5 (0.6%) |
| 45 to 54 Years | 745 (86.4%) | 0 (0.0%) |
| 55 to 59 Years | 543 (87.4%) | 0 (0.0%) |
| 60 to 64 Years | 492 (49.5%) | 58 (11.8%) |
| 65 to 74 Years | 391 (30.0%) | 30 (7.7%) |
| 75 Years and over | 25 (3.0%) | 0 (0.0%) |
| Total | 4,650 (61.4%) | 232 (5.0%) |
Employment Status by Educational Attainment in Glens Falls North
According to labor force statistics for Glens Falls North, 77.8% of individuals (3,722) out of the total population between 25 and 64 years of age (4,784) are in the labor force, with 2.6% or 97 of them being unemployed. The group with the highest labor force participation rate are those with the educational attainment of college / associate degree, with 81.4% or 1,315 individuals in the labor force. Within the labor force, individuals with college / associate degree education have the highest percentage of unemployment, with 5.5% or 72 of them being unemployed.
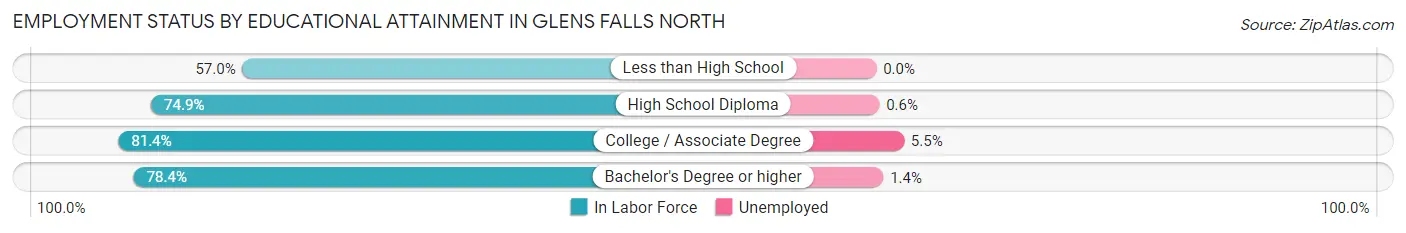
| Educational Attainment | In Labor Force | Unemployed |
| Less than High School | 98 (57.0%) | 0 (0.0%) |
| High School Diploma | 793 (74.9%) | 6 (0.6%) |
| College / Associate Degree | 1,315 (81.4%) | 89 (5.5%) |
| Bachelor's Degree or higher | 1,519 (78.4%) | 27 (1.4%) |
| Total | 3,722 (77.8%) | 124 (2.6%) |
Employment Occupations by Sex in Glens Falls North
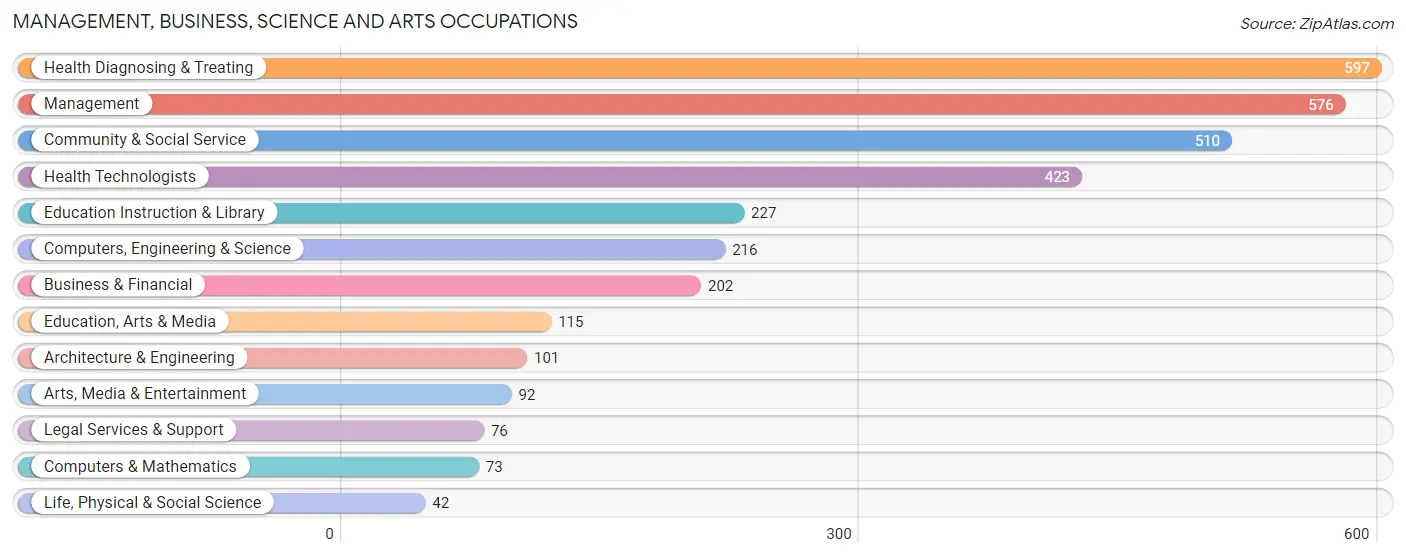
Management, Business, Science and Arts Occupations
The most common Management, Business, Science and Arts occupations in Glens Falls North are Health Diagnosing & Treating (597 | 13.8%), Management (576 | 13.3%), Community & Social Service (510 | 11.8%), Health Technologists (423 | 9.8%), and Education Instruction & Library (227 | 5.2%).
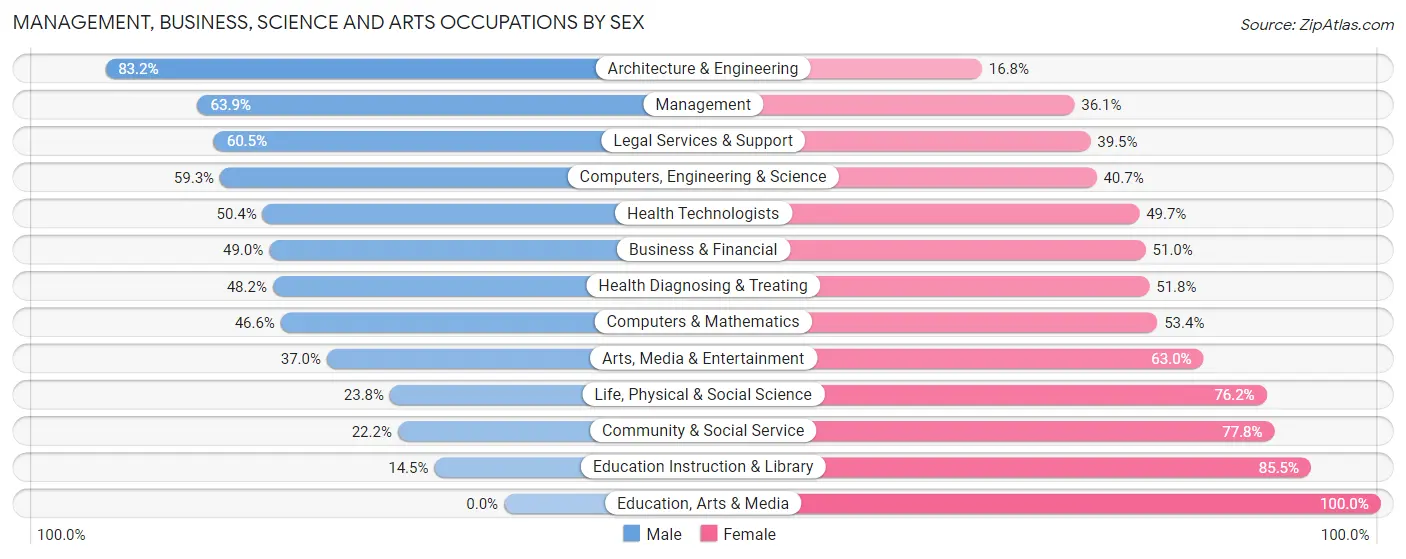
Management, Business, Science and Arts Occupations by Sex
Within the Management, Business, Science and Arts occupations in Glens Falls North, the most male-oriented occupations are Architecture & Engineering (83.2%), Management (63.9%), and Legal Services & Support (60.5%), while the most female-oriented occupations are Education, Arts & Media (100.0%), Education Instruction & Library (85.5%), and Community & Social Service (77.8%).
| Occupation | Male | Female |
| Management | 368 (63.9%) | 208 (36.1%) |
| Business & Financial | 99 (49.0%) | 103 (51.0%) |
| Computers, Engineering & Science | 128 (59.3%) | 88 (40.7%) |
| Computers & Mathematics | 34 (46.6%) | 39 (53.4%) |
| Architecture & Engineering | 84 (83.2%) | 17 (16.8%) |
| Life, Physical & Social Science | 10 (23.8%) | 32 (76.2%) |
| Community & Social Service | 113 (22.2%) | 397 (77.8%) |
| Education, Arts & Media | 0 (0.0%) | 115 (100.0%) |
| Legal Services & Support | 46 (60.5%) | 30 (39.5%) |
| Education Instruction & Library | 33 (14.5%) | 194 (85.5%) |
| Arts, Media & Entertainment | 34 (37.0%) | 58 (63.0%) |
| Health Diagnosing & Treating | 288 (48.2%) | 309 (51.8%) |
| Health Technologists | 213 (50.3%) | 210 (49.6%) |
| Total (Category) | 996 (47.4%) | 1,105 (52.6%) |
| Total (Overall) | 2,168 (50.2%) | 2,154 (49.8%) |
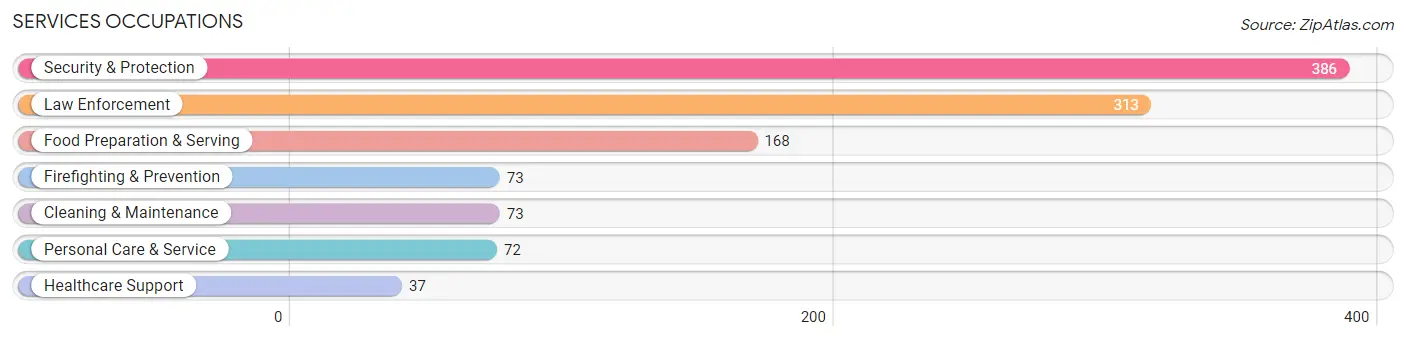
Services Occupations
The most common Services occupations in Glens Falls North are Security & Protection (386 | 8.9%), Law Enforcement (313 | 7.2%), Food Preparation & Serving (168 | 3.9%), Firefighting & Prevention (73 | 1.7%), and Cleaning & Maintenance (73 | 1.7%).
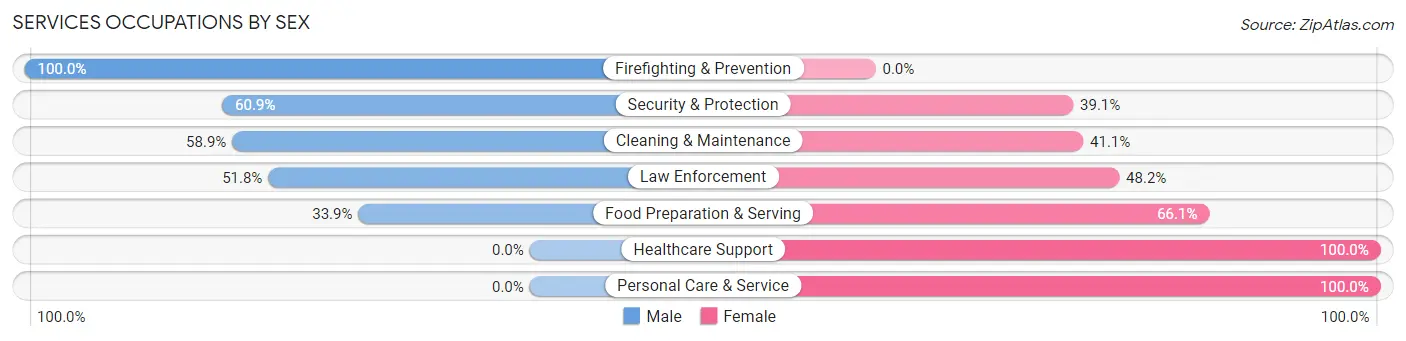
Services Occupations by Sex
Within the Services occupations in Glens Falls North, the most male-oriented occupations are Firefighting & Prevention (100.0%), Security & Protection (60.9%), and Cleaning & Maintenance (58.9%), while the most female-oriented occupations are Healthcare Support (100.0%), Personal Care & Service (100.0%), and Food Preparation & Serving (66.1%).
| Occupation | Male | Female |
| Healthcare Support | 0 (0.0%) | 37 (100.0%) |
| Security & Protection | 235 (60.9%) | 151 (39.1%) |
| Firefighting & Prevention | 73 (100.0%) | 0 (0.0%) |
| Law Enforcement | 162 (51.8%) | 151 (48.2%) |
| Food Preparation & Serving | 57 (33.9%) | 111 (66.1%) |
| Cleaning & Maintenance | 43 (58.9%) | 30 (41.1%) |
| Personal Care & Service | 0 (0.0%) | 72 (100.0%) |
| Total (Category) | 335 (45.5%) | 401 (54.5%) |
| Total (Overall) | 2,168 (50.2%) | 2,154 (49.8%) |
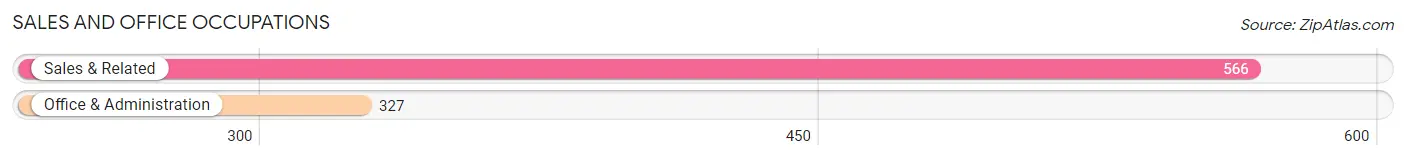
Sales and Office Occupations
The most common Sales and Office occupations in Glens Falls North are Sales & Related (566 | 13.1%), and Office & Administration (327 | 7.6%).
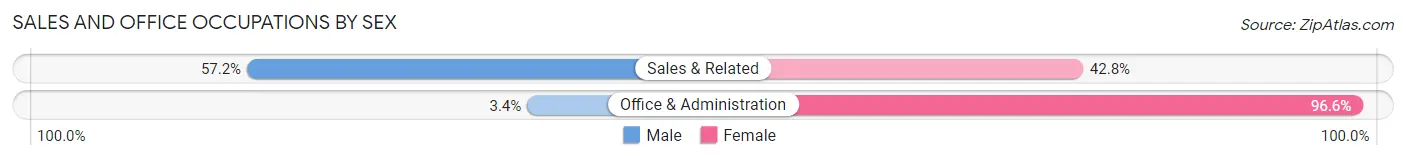
Sales and Office Occupations by Sex
| Occupation | Male | Female |
| Sales & Related | 324 (57.2%) | 242 (42.8%) |
| Office & Administration | 11 (3.4%) | 316 (96.6%) |
| Total (Category) | 335 (37.5%) | 558 (62.5%) |
| Total (Overall) | 2,168 (50.2%) | 2,154 (49.8%) |
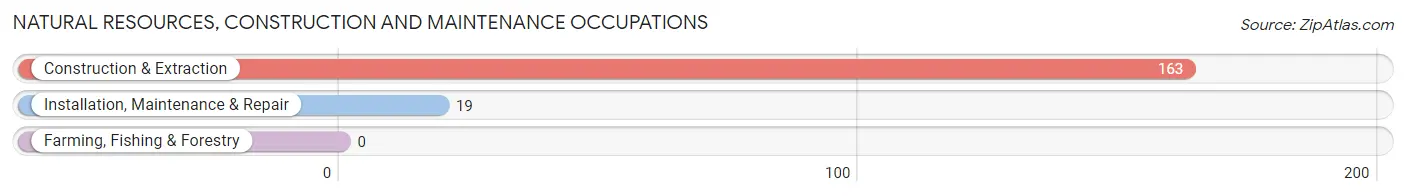
Natural Resources, Construction and Maintenance Occupations
The most common Natural Resources, Construction and Maintenance occupations in Glens Falls North are Construction & Extraction (163 | 3.8%), and Installation, Maintenance & Repair (19 | 0.4%).
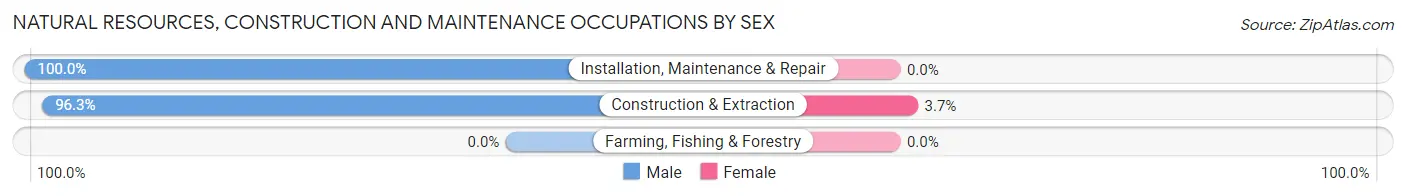
Natural Resources, Construction and Maintenance Occupations by Sex
| Occupation | Male | Female |
| Farming, Fishing & Forestry | 0 (0.0%) | 0 (0.0%) |
| Construction & Extraction | 157 (96.3%) | 6 (3.7%) |
| Installation, Maintenance & Repair | 19 (100.0%) | 0 (0.0%) |
| Total (Category) | 176 (96.7%) | 6 (3.3%) |
| Total (Overall) | 2,168 (50.2%) | 2,154 (49.8%) |
Production, Transportation and Moving Occupations
The most common Production, Transportation and Moving occupations in Glens Falls North are Transportation (178 | 4.1%), Material Moving (122 | 2.8%), and Production (110 | 2.5%).
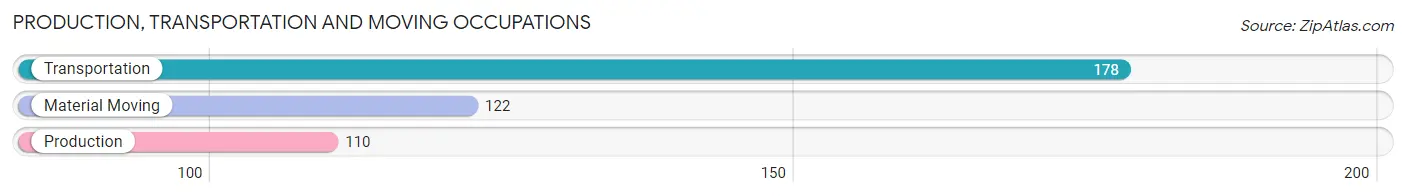
Production, Transportation and Moving Occupations by Sex
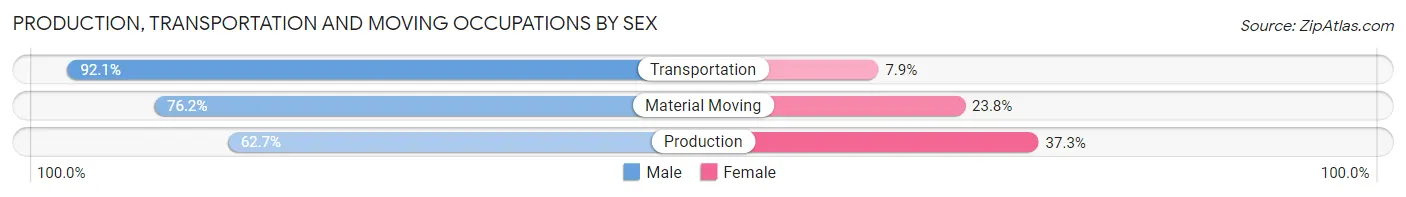
| Occupation | Male | Female |
| Production | 69 (62.7%) | 41 (37.3%) |
| Transportation | 164 (92.1%) | 14 (7.9%) |
| Material Moving | 93 (76.2%) | 29 (23.8%) |
| Total (Category) | 326 (79.5%) | 84 (20.5%) |
| Total (Overall) | 2,168 (50.2%) | 2,154 (49.8%) |
Employment Industries by Sex in Glens Falls North
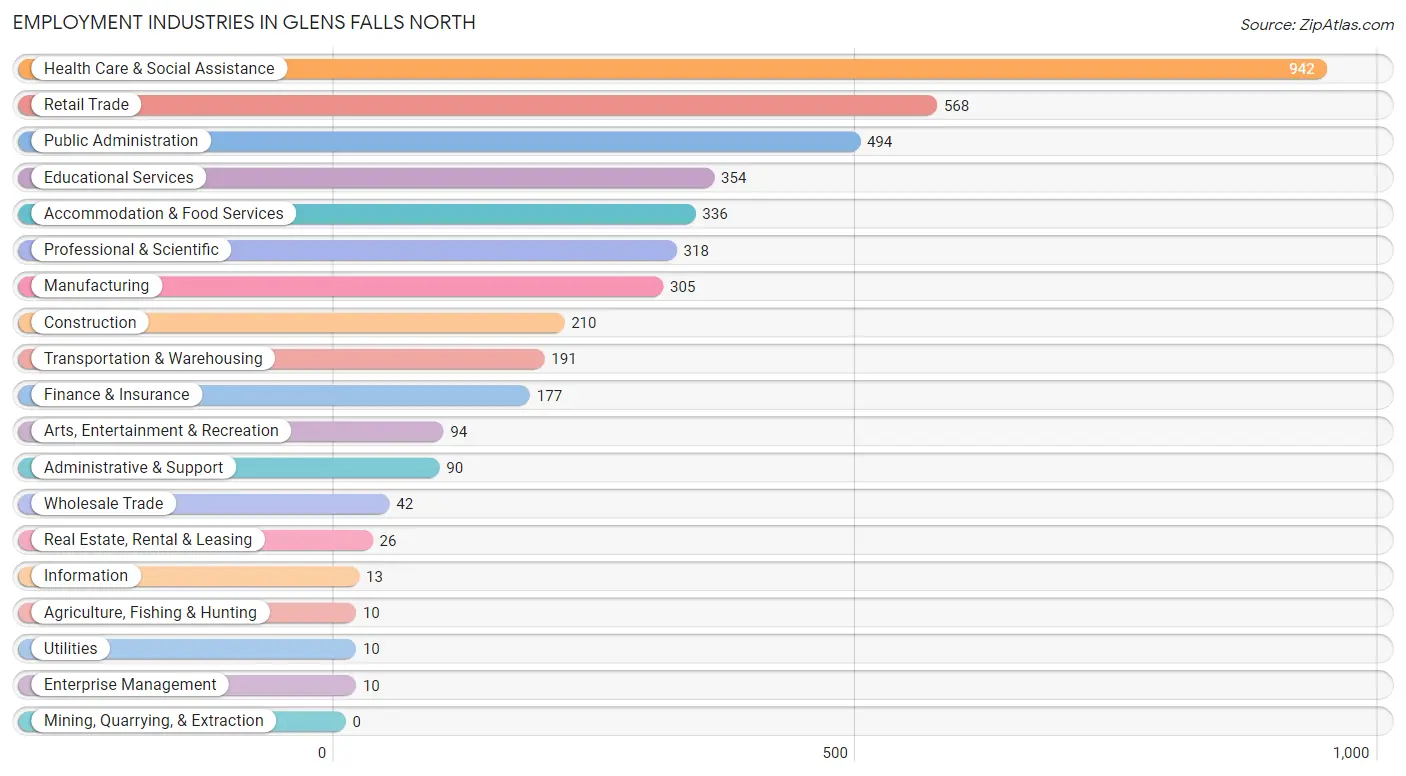
Employment Industries in Glens Falls North
The major employment industries in Glens Falls North include Health Care & Social Assistance (942 | 21.8%), Retail Trade (568 | 13.1%), Public Administration (494 | 11.4%), Educational Services (354 | 8.2%), and Accommodation & Food Services (336 | 7.8%).
Employment Industries by Sex in Glens Falls North
The Glens Falls North industries that see more men than women are Agriculture, Fishing & Hunting (100.0%), Transportation & Warehousing (100.0%), and Utilities (100.0%), whereas the industries that tend to have a higher number of women are Educational Services (85.3%), Health Care & Social Assistance (68.1%), and Professional & Scientific (61.3%).
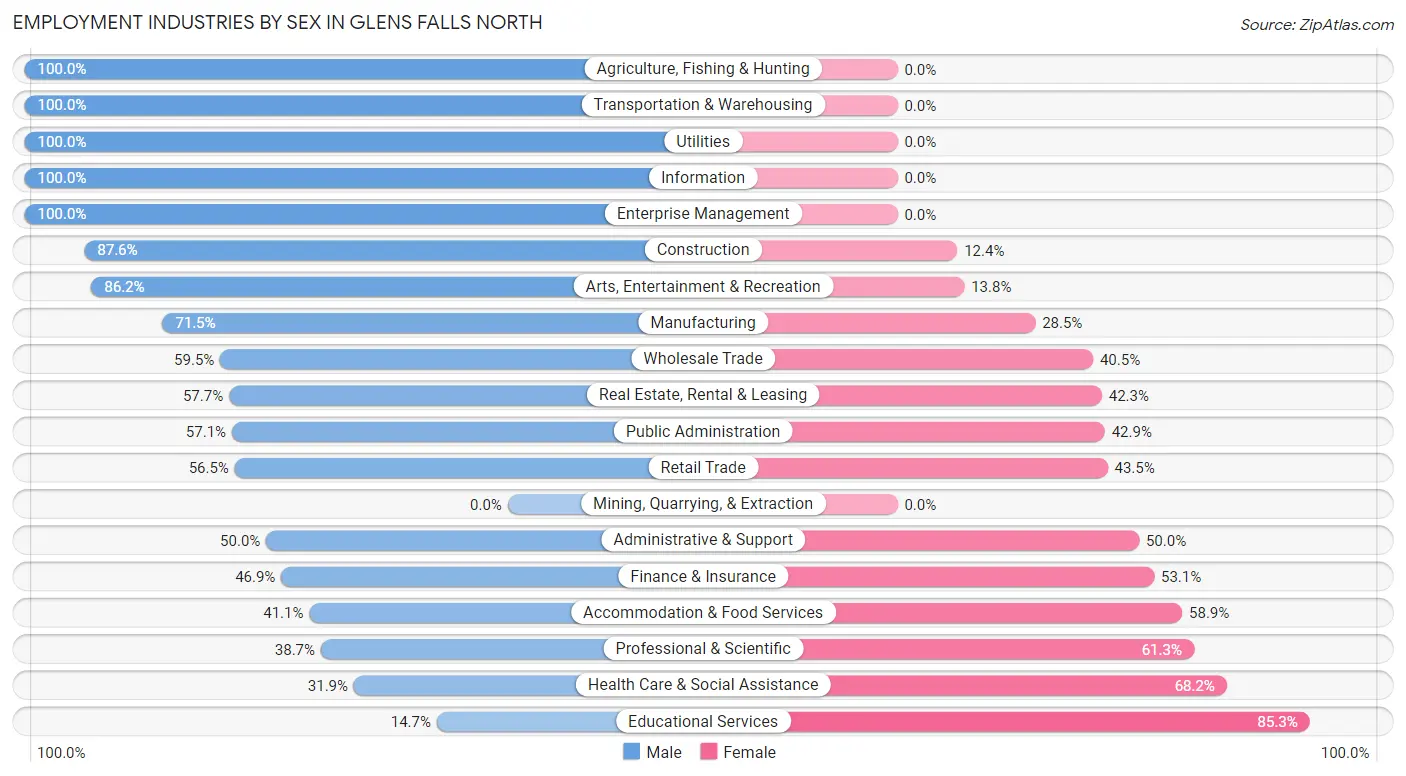
| Industry | Male | Female |
| Agriculture, Fishing & Hunting | 10 (100.0%) | 0 (0.0%) |
| Mining, Quarrying, & Extraction | 0 (0.0%) | 0 (0.0%) |
| Construction | 184 (87.6%) | 26 (12.4%) |
| Manufacturing | 218 (71.5%) | 87 (28.5%) |
| Wholesale Trade | 25 (59.5%) | 17 (40.5%) |
| Retail Trade | 321 (56.5%) | 247 (43.5%) |
| Transportation & Warehousing | 191 (100.0%) | 0 (0.0%) |
| Utilities | 10 (100.0%) | 0 (0.0%) |
| Information | 13 (100.0%) | 0 (0.0%) |
| Finance & Insurance | 83 (46.9%) | 94 (53.1%) |
| Real Estate, Rental & Leasing | 15 (57.7%) | 11 (42.3%) |
| Professional & Scientific | 123 (38.7%) | 195 (61.3%) |
| Enterprise Management | 10 (100.0%) | 0 (0.0%) |
| Administrative & Support | 45 (50.0%) | 45 (50.0%) |
| Educational Services | 52 (14.7%) | 302 (85.3%) |
| Health Care & Social Assistance | 300 (31.9%) | 642 (68.1%) |
| Arts, Entertainment & Recreation | 81 (86.2%) | 13 (13.8%) |
| Accommodation & Food Services | 138 (41.1%) | 198 (58.9%) |
| Public Administration | 282 (57.1%) | 212 (42.9%) |
| Total | 2,168 (50.2%) | 2,154 (49.8%) |
Education in Glens Falls North
School Enrollment in Glens Falls North
The most common levels of schooling among the 1,545 students in Glens Falls North are elementary school (332 | 21.5%), college / undergraduate (300 | 19.4%), and high school (270 | 17.5%).
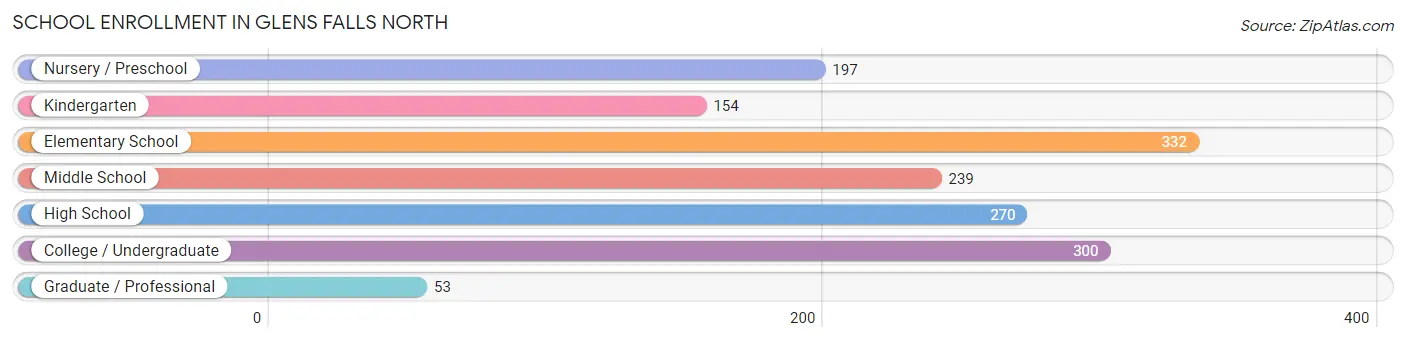
| School Level | # Students | % Students |
| Nursery / Preschool | 197 | 12.8% |
| Kindergarten | 154 | 10.0% |
| Elementary School | 332 | 21.5% |
| Middle School | 239 | 15.5% |
| High School | 270 | 17.5% |
| College / Undergraduate | 300 | 19.4% |
| Graduate / Professional | 53 | 3.4% |
| Total | 1,545 | 100.0% |
School Enrollment by Age by Funding Source in Glens Falls North
Out of a total of 1,545 students who are enrolled in schools in Glens Falls North, 219 (14.2%) attend a private institution, while the remaining 1,326 (85.8%) are enrolled in public schools. The age group of 3 to 4 year olds has the highest likelihood of being enrolled in private schools, with 99 (52.7% in the age bracket) enrolled. Conversely, the age group of 10 to 14 year olds has the lowest likelihood of being enrolled in a private school, with 295 (100.0% in the age bracket) attending a public institution.
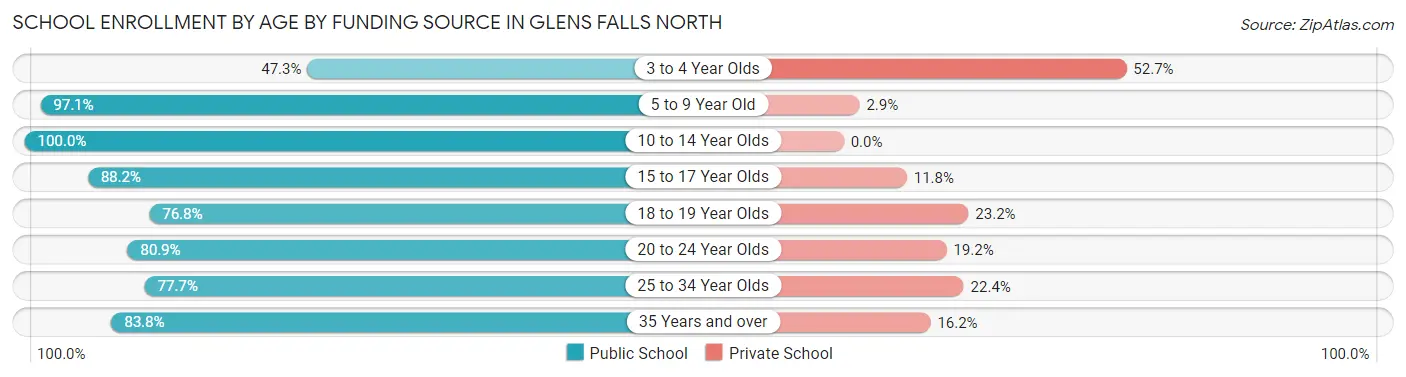
| Age Bracket | Public School | Private School |
| 3 to 4 Year Olds | 89 (47.3%) | 99 (52.7%) |
| 5 to 9 Year Old | 463 (97.1%) | 14 (2.9%) |
| 10 to 14 Year Olds | 295 (100.0%) | 0 (0.0%) |
| 15 to 17 Year Olds | 150 (88.2%) | 20 (11.8%) |
| 18 to 19 Year Olds | 76 (76.8%) | 23 (23.2%) |
| 20 to 24 Year Olds | 38 (80.8%) | 9 (19.2%) |
| 25 to 34 Year Olds | 132 (77.6%) | 38 (22.4%) |
| 35 Years and over | 83 (83.8%) | 16 (16.2%) |
| Total | 1,326 (85.8%) | 219 (14.2%) |
Educational Attainment by Field of Study in Glens Falls North
Business (448 | 14.9%), education (447 | 14.8%), arts & humanities (317 | 10.5%), social sciences (264 | 8.8%), and visual & performing arts (262 | 8.7%) are the most common fields of study among 3,013 individuals in Glens Falls North who have obtained a bachelor's degree or higher.
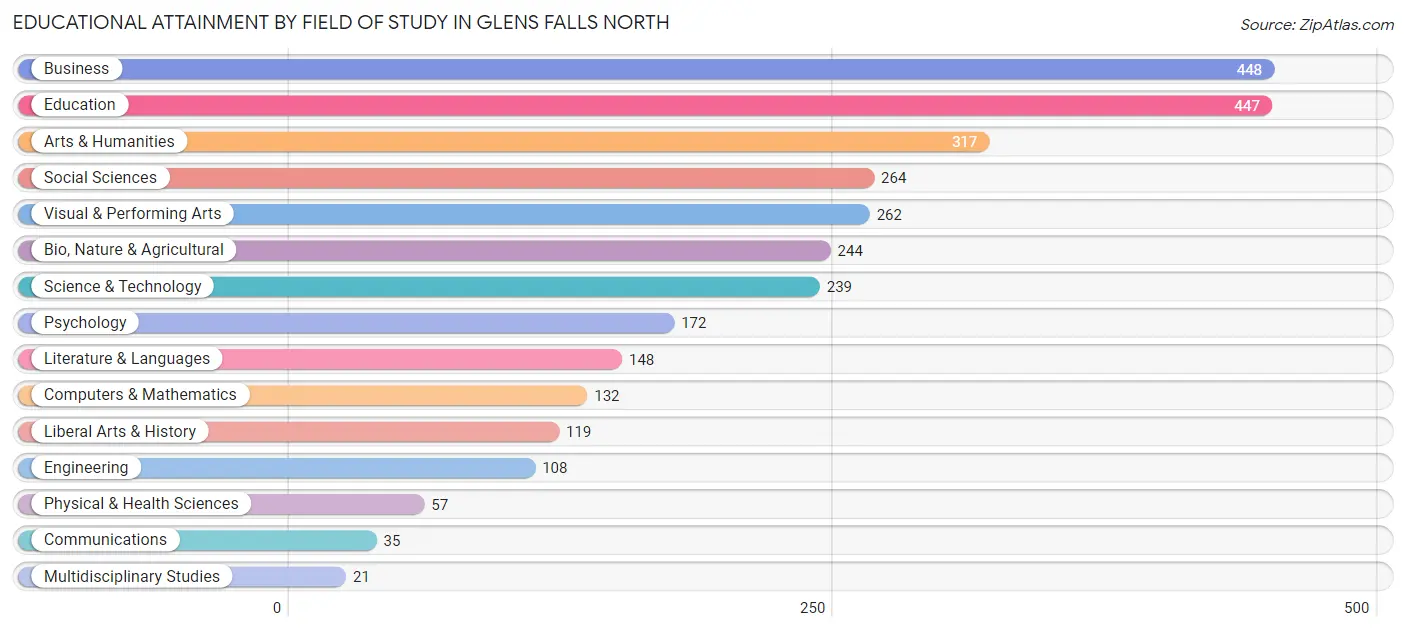
| Field of Study | # Graduates | % Graduates |
| Computers & Mathematics | 132 | 4.4% |
| Bio, Nature & Agricultural | 244 | 8.1% |
| Physical & Health Sciences | 57 | 1.9% |
| Psychology | 172 | 5.7% |
| Social Sciences | 264 | 8.8% |
| Engineering | 108 | 3.6% |
| Multidisciplinary Studies | 21 | 0.7% |
| Science & Technology | 239 | 7.9% |
| Business | 448 | 14.9% |
| Education | 447 | 14.8% |
| Literature & Languages | 148 | 4.9% |
| Liberal Arts & History | 119 | 4.0% |
| Visual & Performing Arts | 262 | 8.7% |
| Communications | 35 | 1.2% |
| Arts & Humanities | 317 | 10.5% |
| Total | 3,013 | 100.0% |
Transportation & Commute in Glens Falls North
Vehicle Availability by Sex in Glens Falls North
The most prevalent vehicle ownership categories in Glens Falls North are males with 2 vehicles (1,218, accounting for 53.7%) and females with 2 vehicles (1,013, making up 57.4%).
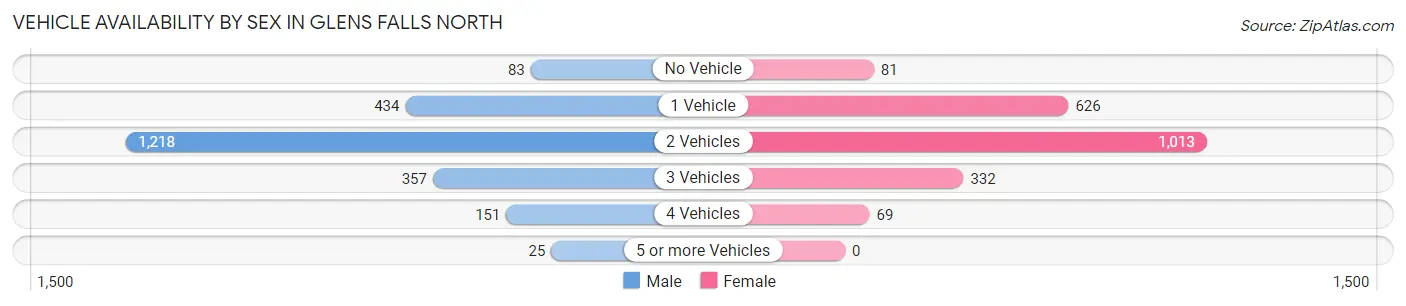
| Vehicles Available | Male | Female |
| No Vehicle | 83 (3.7%) | 81 (3.8%) |
| 1 Vehicle | 434 (19.1%) | 626 (29.5%) |
| 2 Vehicles | 1,218 (53.7%) | 1,013 (47.8%) |
| 3 Vehicles | 357 (15.7%) | 332 (15.7%) |
| 4 Vehicles | 151 (6.7%) | 69 (3.3%) |
| 5 or more Vehicles | 25 (1.1%) | 0 (0.0%) |
| Total | 2,268 (100.0%) | 2,121 (100.0%) |
Commute Time in Glens Falls North
The most frequently occuring commute durations in Glens Falls North are 10 to 14 minutes (1,051 commuters, 26.1%), 5 to 9 minutes (707 commuters, 17.6%), and 20 to 24 minutes (622 commuters, 15.5%).
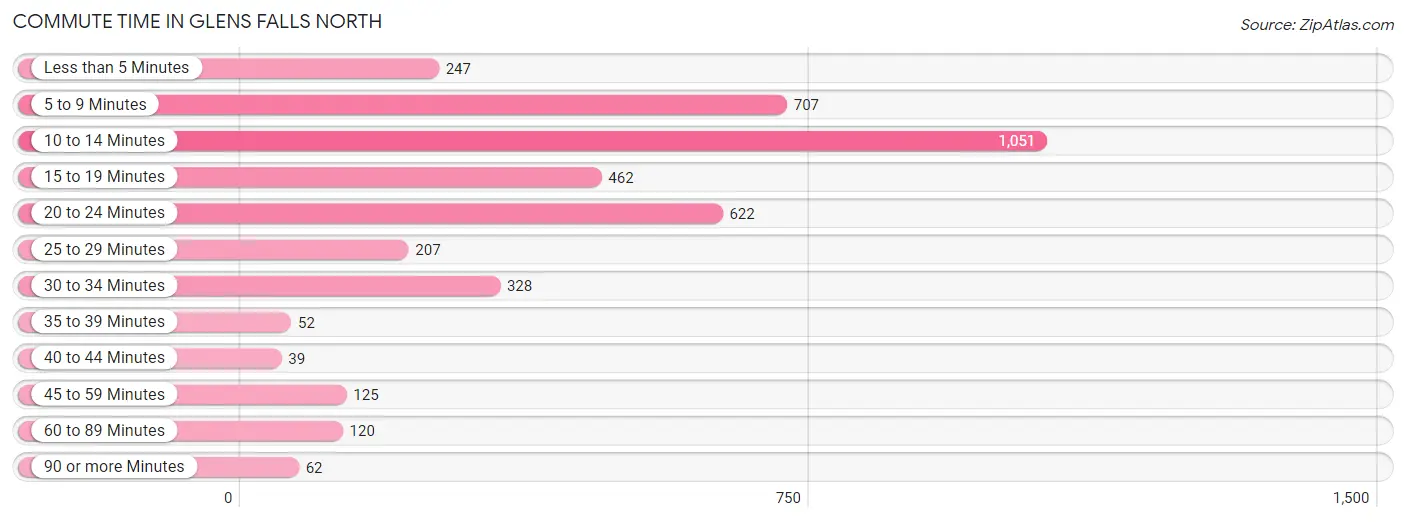
| Commute Time | # Commuters | % Commuters |
| Less than 5 Minutes | 247 | 6.1% |
| 5 to 9 Minutes | 707 | 17.6% |
| 10 to 14 Minutes | 1,051 | 26.1% |
| 15 to 19 Minutes | 462 | 11.5% |
| 20 to 24 Minutes | 622 | 15.5% |
| 25 to 29 Minutes | 207 | 5.1% |
| 30 to 34 Minutes | 328 | 8.2% |
| 35 to 39 Minutes | 52 | 1.3% |
| 40 to 44 Minutes | 39 | 1.0% |
| 45 to 59 Minutes | 125 | 3.1% |
| 60 to 89 Minutes | 120 | 3.0% |
| 90 or more Minutes | 62 | 1.5% |
Commute Time by Sex in Glens Falls North
The most common commute times in Glens Falls North are 10 to 14 minutes (547 commuters, 25.4%) for males and 10 to 14 minutes (504 commuters, 27.0%) for females.
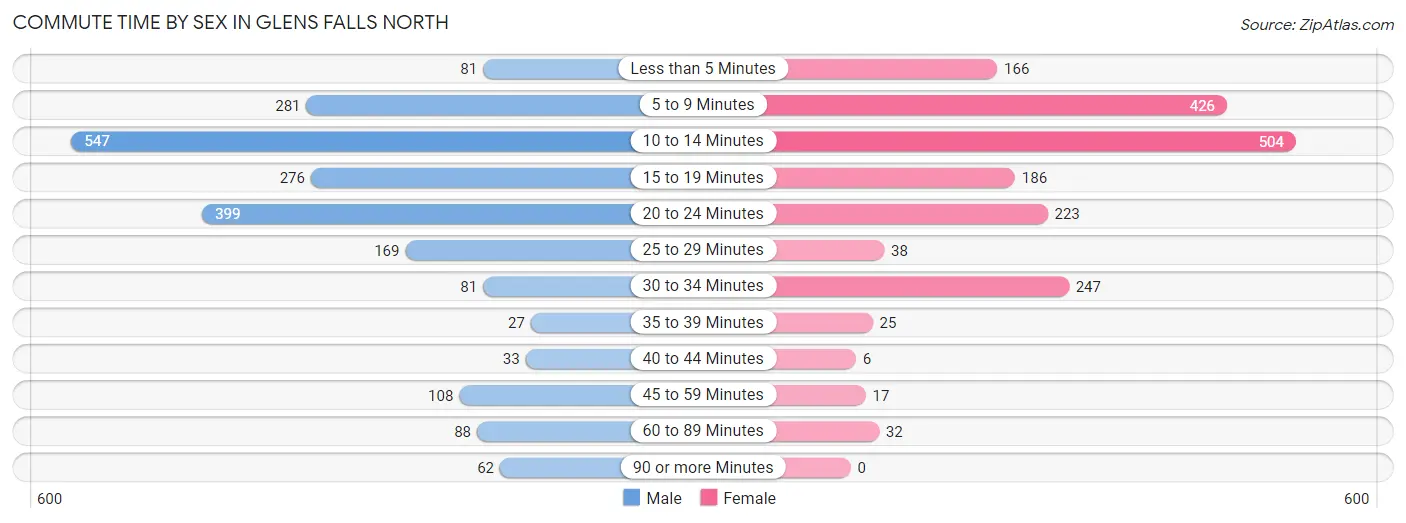
| Commute Time | Male | Female |
| Less than 5 Minutes | 81 (3.8%) | 166 (8.9%) |
| 5 to 9 Minutes | 281 (13.1%) | 426 (22.8%) |
| 10 to 14 Minutes | 547 (25.4%) | 504 (27.0%) |
| 15 to 19 Minutes | 276 (12.8%) | 186 (10.0%) |
| 20 to 24 Minutes | 399 (18.5%) | 223 (11.9%) |
| 25 to 29 Minutes | 169 (7.9%) | 38 (2.0%) |
| 30 to 34 Minutes | 81 (3.8%) | 247 (13.2%) |
| 35 to 39 Minutes | 27 (1.3%) | 25 (1.3%) |
| 40 to 44 Minutes | 33 (1.5%) | 6 (0.3%) |
| 45 to 59 Minutes | 108 (5.0%) | 17 (0.9%) |
| 60 to 89 Minutes | 88 (4.1%) | 32 (1.7%) |
| 90 or more Minutes | 62 (2.9%) | 0 (0.0%) |
Time of Departure to Work by Sex in Glens Falls North
The most frequent times of departure to work in Glens Falls North are 8:00 AM to 8:29 AM (268, 12.4%) for males and 7:30 AM to 7:59 AM (369, 19.7%) for females.
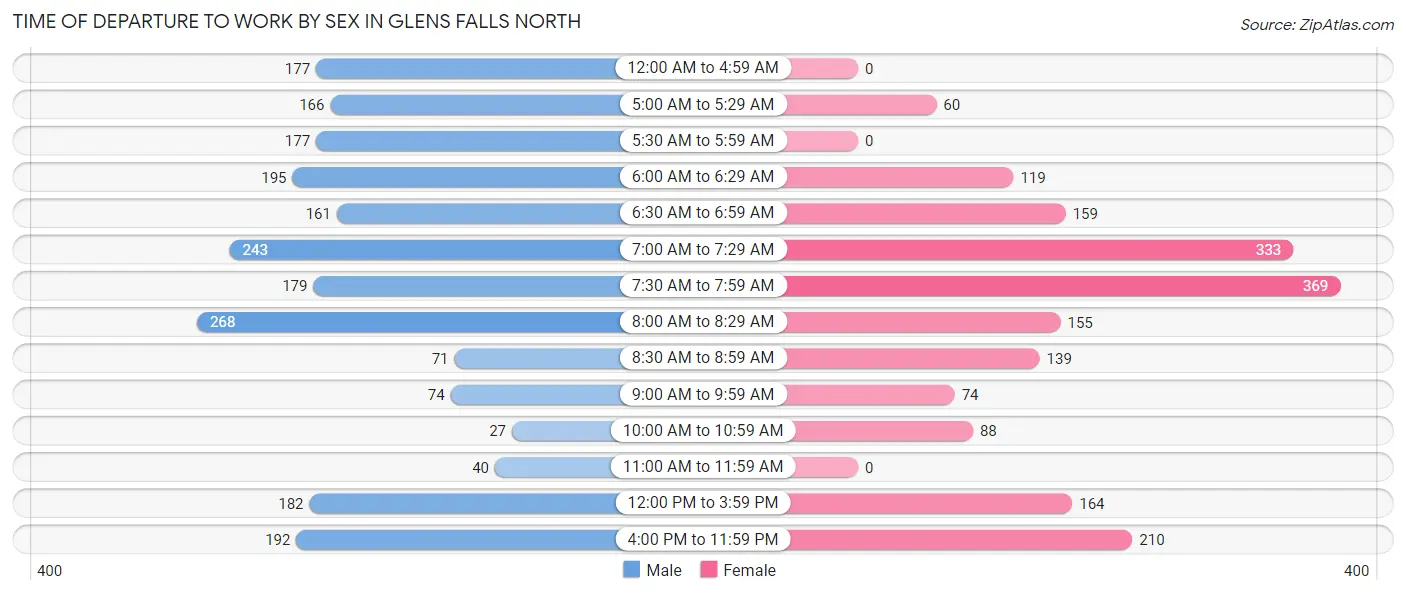
| Time of Departure | Male | Female |
| 12:00 AM to 4:59 AM | 177 (8.2%) | 0 (0.0%) |
| 5:00 AM to 5:29 AM | 166 (7.7%) | 60 (3.2%) |
| 5:30 AM to 5:59 AM | 177 (8.2%) | 0 (0.0%) |
| 6:00 AM to 6:29 AM | 195 (9.1%) | 119 (6.4%) |
| 6:30 AM to 6:59 AM | 161 (7.5%) | 159 (8.5%) |
| 7:00 AM to 7:29 AM | 243 (11.3%) | 333 (17.8%) |
| 7:30 AM to 7:59 AM | 179 (8.3%) | 369 (19.7%) |
| 8:00 AM to 8:29 AM | 268 (12.4%) | 155 (8.3%) |
| 8:30 AM to 8:59 AM | 71 (3.3%) | 139 (7.4%) |
| 9:00 AM to 9:59 AM | 74 (3.4%) | 74 (4.0%) |
| 10:00 AM to 10:59 AM | 27 (1.3%) | 88 (4.7%) |
| 11:00 AM to 11:59 AM | 40 (1.9%) | 0 (0.0%) |
| 12:00 PM to 3:59 PM | 182 (8.5%) | 164 (8.8%) |
| 4:00 PM to 11:59 PM | 192 (8.9%) | 210 (11.2%) |
| Total | 2,152 (100.0%) | 1,870 (100.0%) |
Housing Occupancy in Glens Falls North
Occupancy by Ownership in Glens Falls North
Of the total 4,324 dwellings in Glens Falls North, owner-occupied units account for 2,620 (60.6%), while renter-occupied units make up 1,704 (39.4%).
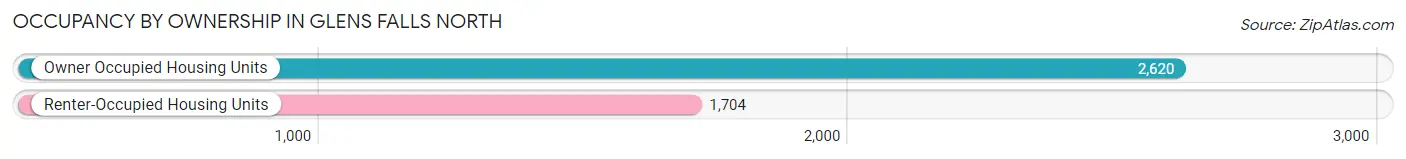
| Occupancy | # Housing Units | % Housing Units |
| Owner Occupied Housing Units | 2,620 | 60.6% |
| Renter-Occupied Housing Units | 1,704 | 39.4% |
| Total Occupied Housing Units | 4,324 | 100.0% |
Occupancy by Household Size in Glens Falls North
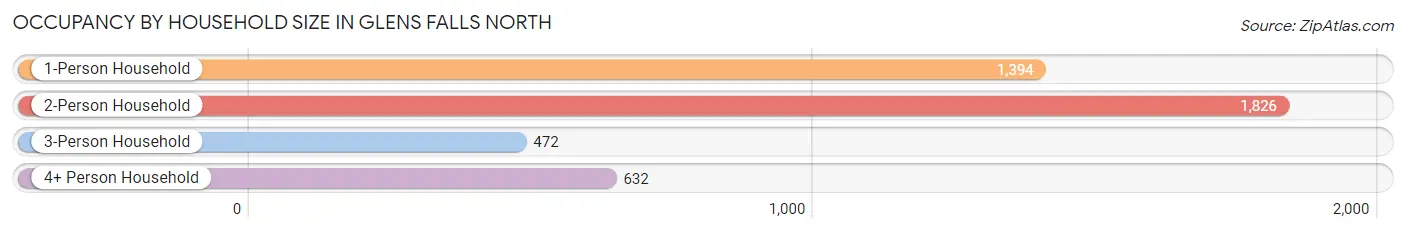
| Household Size | # Housing Units | % Housing Units |
| 1-Person Household | 1,394 | 32.2% |
| 2-Person Household | 1,826 | 42.2% |
| 3-Person Household | 472 | 10.9% |
| 4+ Person Household | 632 | 14.6% |
| Total Housing Units | 4,324 | 100.0% |
Occupancy by Ownership by Household Size in Glens Falls North
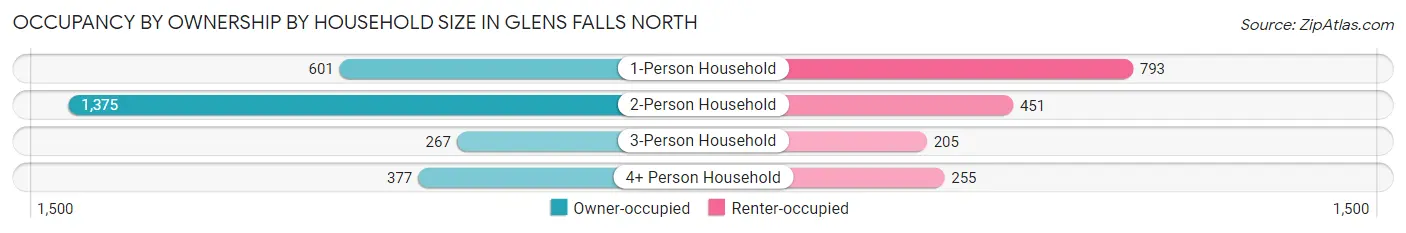
| Household Size | Owner-occupied | Renter-occupied |
| 1-Person Household | 601 (43.1%) | 793 (56.9%) |
| 2-Person Household | 1,375 (75.3%) | 451 (24.7%) |
| 3-Person Household | 267 (56.6%) | 205 (43.4%) |
| 4+ Person Household | 377 (59.7%) | 255 (40.4%) |
| Total Housing Units | 2,620 (60.6%) | 1,704 (39.4%) |
Occupancy by Educational Attainment in Glens Falls North
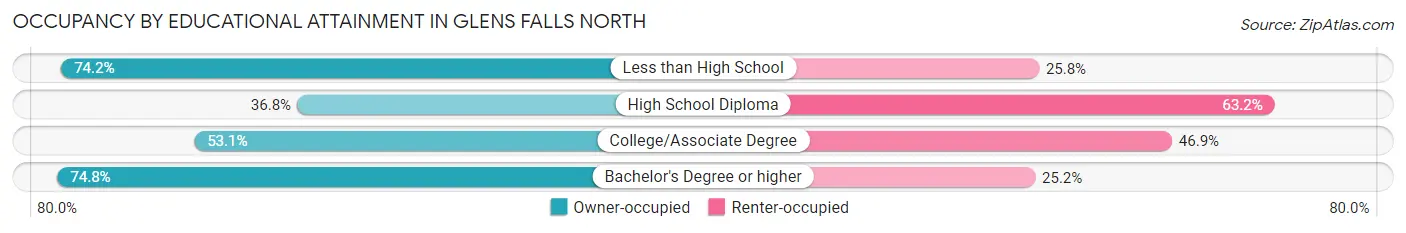
| Household Size | Owner-occupied | Renter-occupied |
| Less than High School | 181 (74.2%) | 63 (25.8%) |
| High School Diploma | 325 (36.8%) | 558 (63.2%) |
| College/Associate Degree | 678 (53.1%) | 599 (46.9%) |
| Bachelor's Degree or higher | 1,436 (74.8%) | 484 (25.2%) |
Occupancy by Age of Householder in Glens Falls North
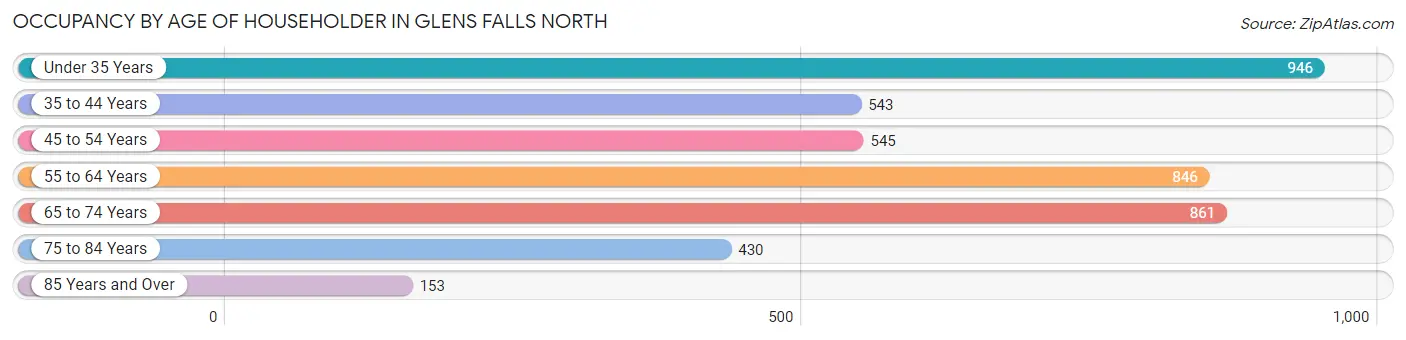
| Age Bracket | # Households | % Households |
| Under 35 Years | 946 | 21.9% |
| 35 to 44 Years | 543 | 12.6% |
| 45 to 54 Years | 545 | 12.6% |
| 55 to 64 Years | 846 | 19.6% |
| 65 to 74 Years | 861 | 19.9% |
| 75 to 84 Years | 430 | 9.9% |
| 85 Years and Over | 153 | 3.5% |
| Total | 4,324 | 100.0% |
Housing Finances in Glens Falls North
Median Income by Occupancy in Glens Falls North
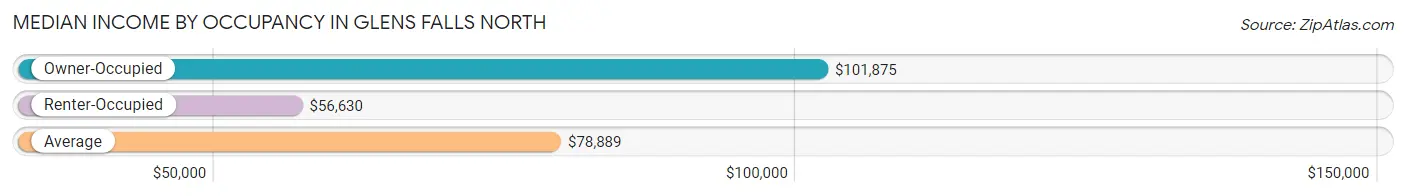
| Occupancy Type | # Households | Median Income |
| Owner-Occupied | 2,620 (60.6%) | $101,875 |
| Renter-Occupied | 1,704 (39.4%) | $56,630 |
| Average | 4,324 (100.0%) | $78,889 |
Occupancy by Householder Income Bracket in Glens Falls North
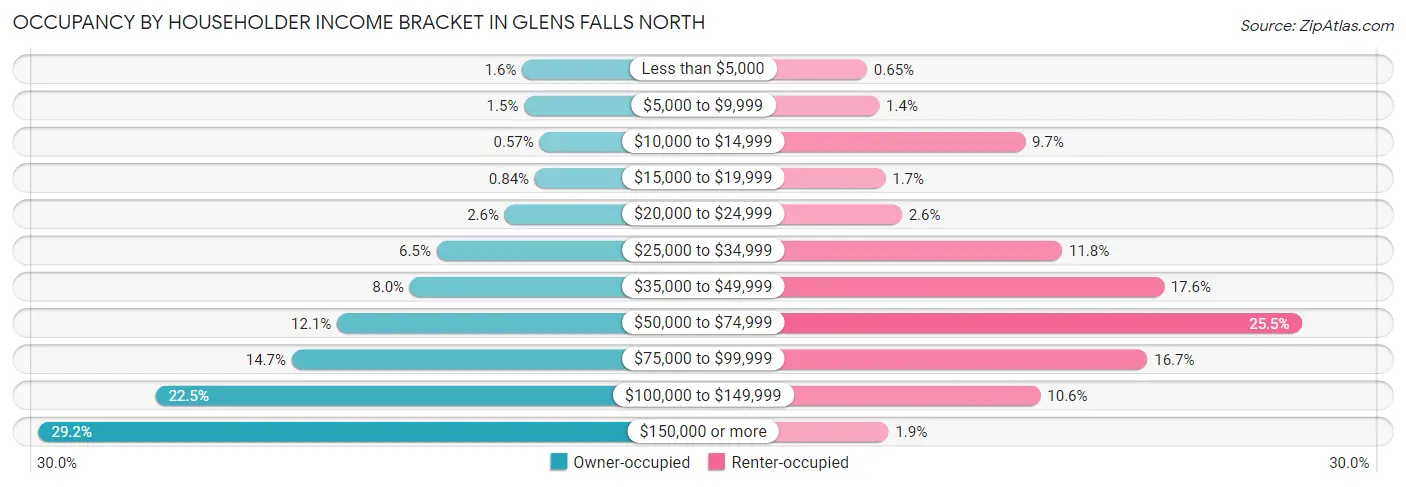
| Income Bracket | Owner-occupied | Renter-occupied |
| Less than $5,000 | 41 (1.6%) | 11 (0.6%) |
| $5,000 to $9,999 | 38 (1.5%) | 23 (1.3%) |
| $10,000 to $14,999 | 15 (0.6%) | 165 (9.7%) |
| $15,000 to $19,999 | 22 (0.8%) | 29 (1.7%) |
| $20,000 to $24,999 | 67 (2.6%) | 45 (2.6%) |
| $25,000 to $34,999 | 169 (6.5%) | 201 (11.8%) |
| $35,000 to $49,999 | 209 (8.0%) | 300 (17.6%) |
| $50,000 to $74,999 | 318 (12.1%) | 434 (25.5%) |
| $75,000 to $99,999 | 386 (14.7%) | 284 (16.7%) |
| $100,000 to $149,999 | 590 (22.5%) | 180 (10.6%) |
| $150,000 or more | 765 (29.2%) | 32 (1.9%) |
| Total | 2,620 (100.0%) | 1,704 (100.0%) |
Monthly Housing Cost Tiers in Glens Falls North
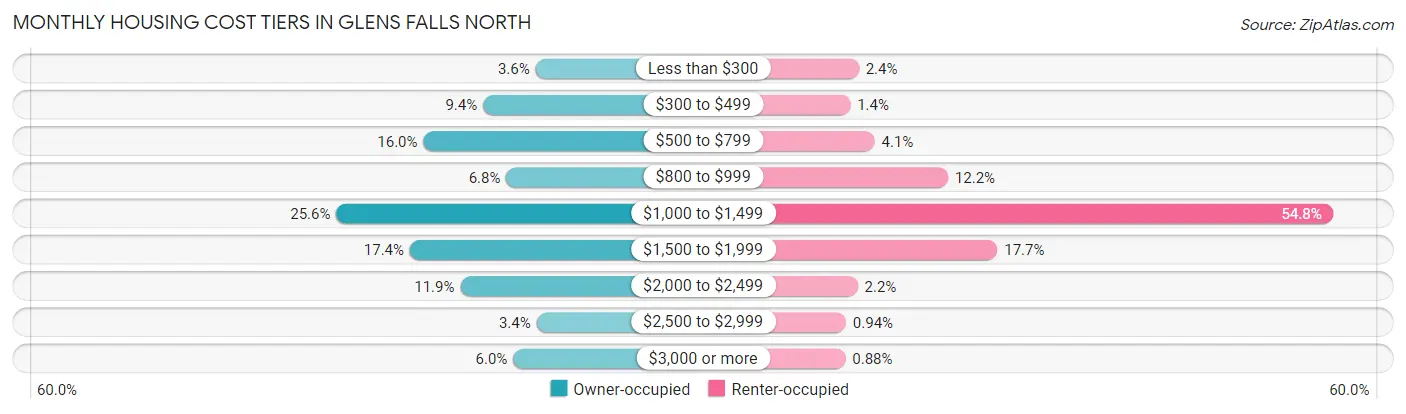
| Monthly Cost | Owner-occupied | Renter-occupied |
| Less than $300 | 93 (3.5%) | 40 (2.4%) |
| $300 to $499 | 245 (9.3%) | 24 (1.4%) |
| $500 to $799 | 418 (16.0%) | 70 (4.1%) |
| $800 to $999 | 178 (6.8%) | 208 (12.2%) |
| $1,000 to $1,499 | 670 (25.6%) | 934 (54.8%) |
| $1,500 to $1,999 | 457 (17.4%) | 301 (17.7%) |
| $2,000 to $2,499 | 311 (11.9%) | 38 (2.2%) |
| $2,500 to $2,999 | 90 (3.4%) | 16 (0.9%) |
| $3,000 or more | 158 (6.0%) | 15 (0.9%) |
| Total | 2,620 (100.0%) | 1,704 (100.0%) |
Physical Housing Characteristics in Glens Falls North
Housing Structures in Glens Falls North
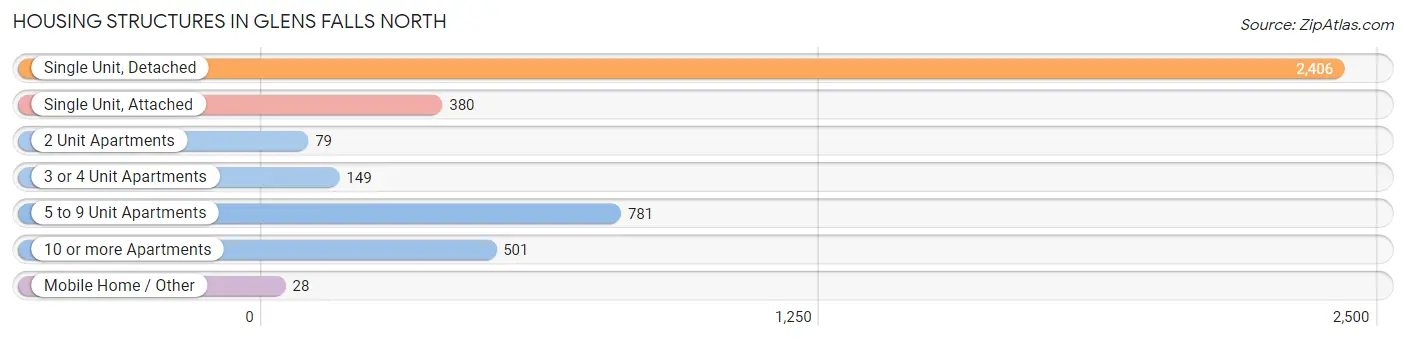
| Structure Type | # Housing Units | % Housing Units |
| Single Unit, Detached | 2,406 | 55.6% |
| Single Unit, Attached | 380 | 8.8% |
| 2 Unit Apartments | 79 | 1.8% |
| 3 or 4 Unit Apartments | 149 | 3.5% |
| 5 to 9 Unit Apartments | 781 | 18.1% |
| 10 or more Apartments | 501 | 11.6% |
| Mobile Home / Other | 28 | 0.6% |
| Total | 4,324 | 100.0% |
Housing Structures by Occupancy in Glens Falls North
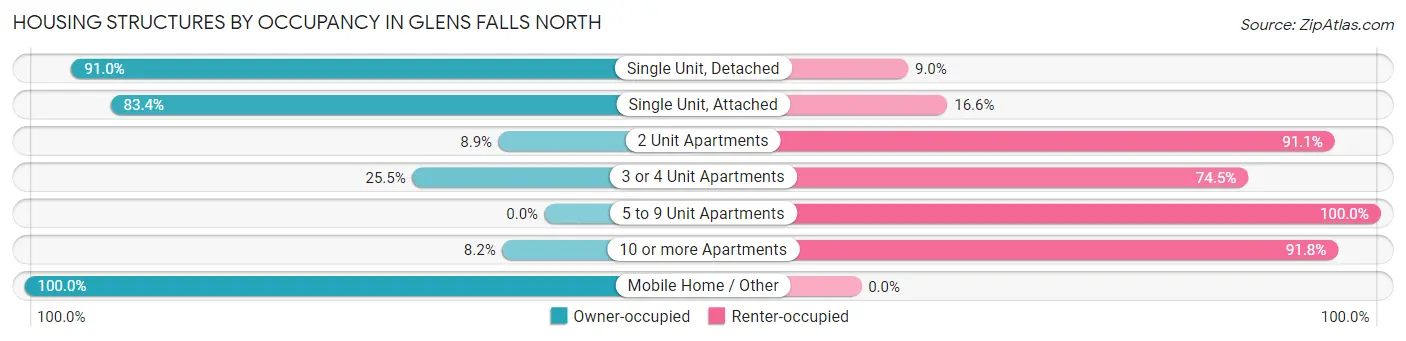
| Structure Type | Owner-occupied | Renter-occupied |
| Single Unit, Detached | 2,189 (91.0%) | 217 (9.0%) |
| Single Unit, Attached | 317 (83.4%) | 63 (16.6%) |
| 2 Unit Apartments | 7 (8.9%) | 72 (91.1%) |
| 3 or 4 Unit Apartments | 38 (25.5%) | 111 (74.5%) |
| 5 to 9 Unit Apartments | 0 (0.0%) | 781 (100.0%) |
| 10 or more Apartments | 41 (8.2%) | 460 (91.8%) |
| Mobile Home / Other | 28 (100.0%) | 0 (0.0%) |
| Total | 2,620 (60.6%) | 1,704 (39.4%) |
Housing Structures by Number of Rooms in Glens Falls North
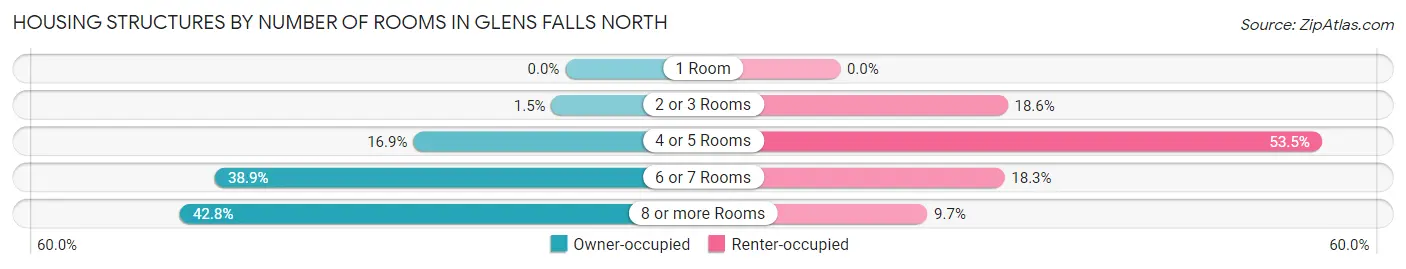
| Number of Rooms | Owner-occupied | Renter-occupied |
| 1 Room | 0 (0.0%) | 0 (0.0%) |
| 2 or 3 Rooms | 40 (1.5%) | 317 (18.6%) |
| 4 or 5 Rooms | 442 (16.9%) | 911 (53.5%) |
| 6 or 7 Rooms | 1,018 (38.9%) | 311 (18.2%) |
| 8 or more Rooms | 1,120 (42.7%) | 165 (9.7%) |
| Total | 2,620 (100.0%) | 1,704 (100.0%) |
Housing Structure by Heating Type in Glens Falls North
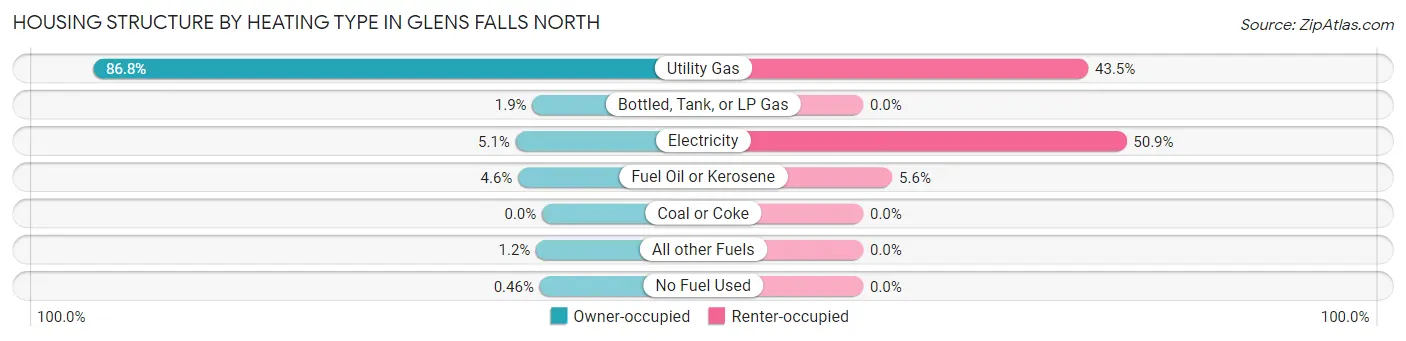
| Heating Type | Owner-occupied | Renter-occupied |
| Utility Gas | 2,274 (86.8%) | 741 (43.5%) |
| Bottled, Tank, or LP Gas | 49 (1.9%) | 0 (0.0%) |
| Electricity | 134 (5.1%) | 867 (50.9%) |
| Fuel Oil or Kerosene | 121 (4.6%) | 96 (5.6%) |
| Coal or Coke | 0 (0.0%) | 0 (0.0%) |
| All other Fuels | 30 (1.1%) | 0 (0.0%) |
| No Fuel Used | 12 (0.5%) | 0 (0.0%) |
| Total | 2,620 (100.0%) | 1,704 (100.0%) |
Household Vehicle Usage in Glens Falls North
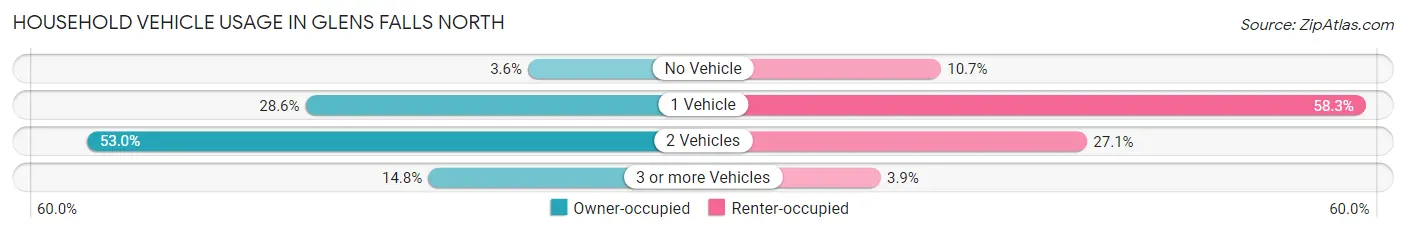
| Vehicles per Household | Owner-occupied | Renter-occupied |
| No Vehicle | 95 (3.6%) | 182 (10.7%) |
| 1 Vehicle | 748 (28.5%) | 994 (58.3%) |
| 2 Vehicles | 1,389 (53.0%) | 461 (27.1%) |
| 3 or more Vehicles | 388 (14.8%) | 67 (3.9%) |
| Total | 2,620 (100.0%) | 1,704 (100.0%) |
Real Estate & Mortgages in Glens Falls North
Real Estate and Mortgage Overview in Glens Falls North
| Characteristic | Without Mortgage | With Mortgage |
| Housing Units | 926 | 1,694 |
| Median Property Value | $224,900 | $274,900 |
| Median Household Income | $63,472 | $627 |
| Monthly Housing Costs | $643 | $158 |
| Real Estate Taxes | $3,444 | $29 |
Property Value by Mortgage Status in Glens Falls North
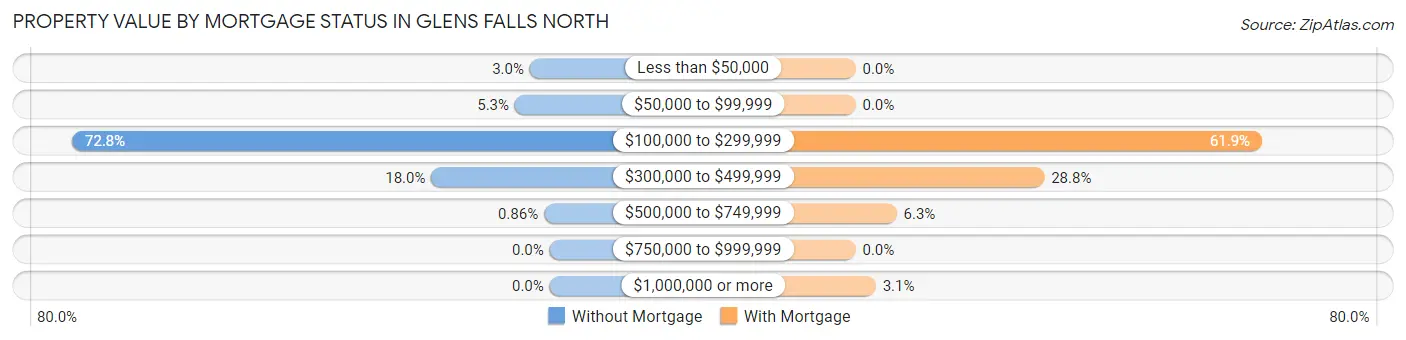
| Property Value | Without Mortgage | With Mortgage |
| Less than $50,000 | 28 (3.0%) | 0 (0.0%) |
| $50,000 to $99,999 | 49 (5.3%) | 0 (0.0%) |
| $100,000 to $299,999 | 674 (72.8%) | 1,049 (61.9%) |
| $300,000 to $499,999 | 167 (18.0%) | 487 (28.7%) |
| $500,000 to $749,999 | 8 (0.9%) | 106 (6.3%) |
| $750,000 to $999,999 | 0 (0.0%) | 0 (0.0%) |
| $1,000,000 or more | 0 (0.0%) | 52 (3.1%) |
| Total | 926 (100.0%) | 1,694 (100.0%) |
Household Income by Mortgage Status in Glens Falls North
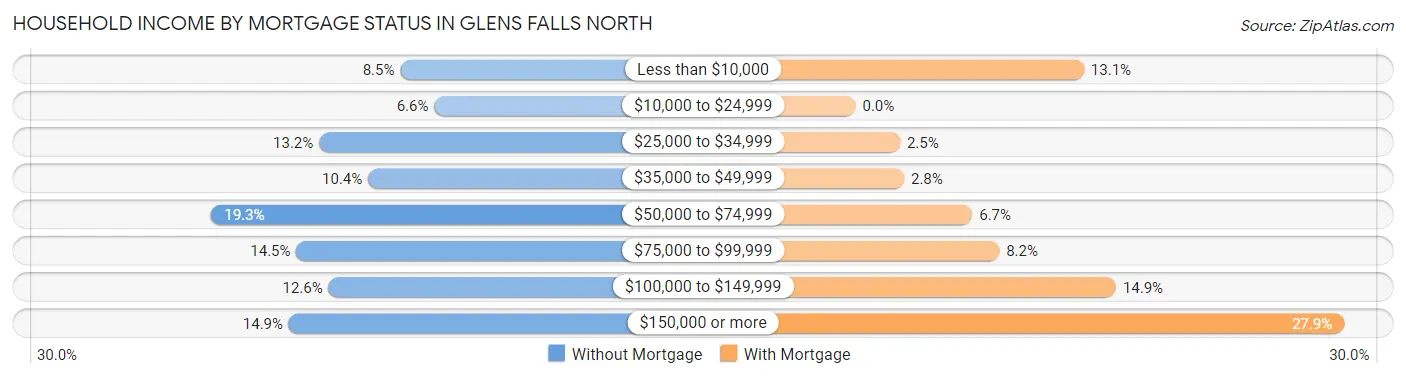
| Household Income | Without Mortgage | With Mortgage |
| Less than $10,000 | 79 (8.5%) | 221 (13.1%) |
| $10,000 to $24,999 | 61 (6.6%) | 0 (0.0%) |
| $25,000 to $34,999 | 122 (13.2%) | 43 (2.5%) |
| $35,000 to $49,999 | 96 (10.4%) | 47 (2.8%) |
| $50,000 to $74,999 | 179 (19.3%) | 113 (6.7%) |
| $75,000 to $99,999 | 134 (14.5%) | 139 (8.2%) |
| $100,000 to $149,999 | 117 (12.6%) | 252 (14.9%) |
| $150,000 or more | 138 (14.9%) | 473 (27.9%) |
| Total | 926 (100.0%) | 1,694 (100.0%) |
Property Value to Household Income Ratio in Glens Falls North
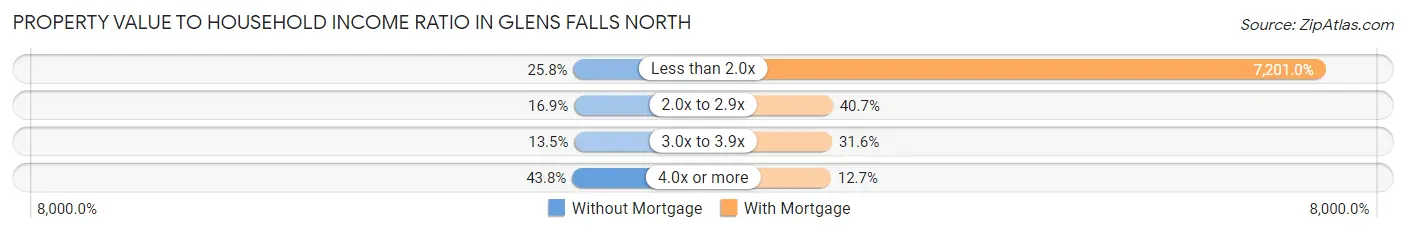
| Value-to-Income Ratio | Without Mortgage | With Mortgage |
| Less than 2.0x | 239 (25.8%) | 121,985 (7,201.0%) |
| 2.0x to 2.9x | 156 (16.9%) | 690 (40.7%) |
| 3.0x to 3.9x | 125 (13.5%) | 535 (31.6%) |
| 4.0x or more | 406 (43.8%) | 215 (12.7%) |
| Total | 926 (100.0%) | 1,694 (100.0%) |
Real Estate Taxes by Mortgage Status in Glens Falls North
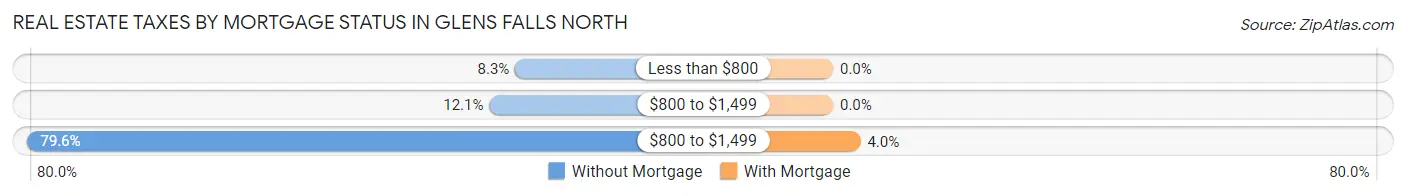
| Property Taxes | Without Mortgage | With Mortgage |
| Less than $800 | 77 (8.3%) | 0 (0.0%) |
| $800 to $1,499 | 112 (12.1%) | 0 (0.0%) |
| $800 to $1,499 | 737 (79.6%) | 68 (4.0%) |
| Total | 926 (100.0%) | 1,694 (100.0%) |
Health & Disability in Glens Falls North
Health Insurance Coverage by Age in Glens Falls North
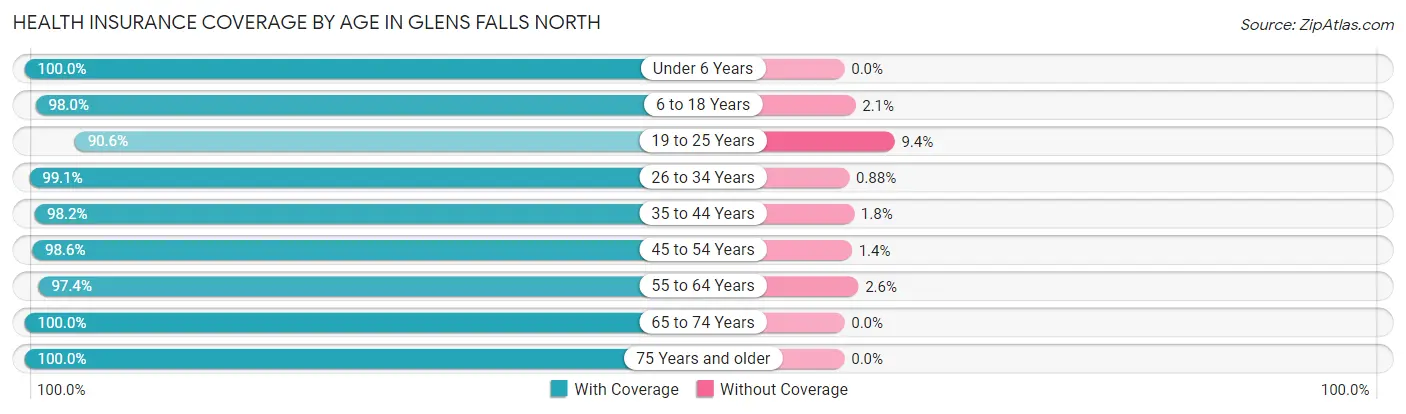
| Age Bracket | With Coverage | Without Coverage |
| Under 6 Years | 735 (100.0%) | 0 (0.0%) |
| 6 to 18 Years | 811 (98.0%) | 17 (2.1%) |
| 19 to 25 Years | 717 (90.6%) | 74 (9.4%) |
| 26 to 34 Years | 1,017 (99.1%) | 9 (0.9%) |
| 35 to 44 Years | 879 (98.2%) | 16 (1.8%) |
| 45 to 54 Years | 850 (98.6%) | 12 (1.4%) |
| 55 to 64 Years | 1,573 (97.4%) | 42 (2.6%) |
| 65 to 74 Years | 1,304 (100.0%) | 0 (0.0%) |
| 75 Years and older | 840 (100.0%) | 0 (0.0%) |
| Total | 8,726 (98.1%) | 170 (1.9%) |
Health Insurance Coverage by Citizenship Status in Glens Falls North
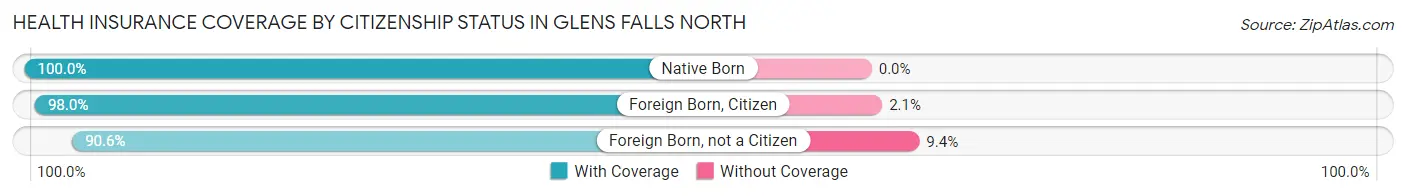
| Citizenship Status | With Coverage | Without Coverage |
| Native Born | 735 (100.0%) | 0 (0.0%) |
| Foreign Born, Citizen | 811 (98.0%) | 17 (2.1%) |
| Foreign Born, not a Citizen | 717 (90.6%) | 74 (9.4%) |
Health Insurance Coverage by Household Income in Glens Falls North
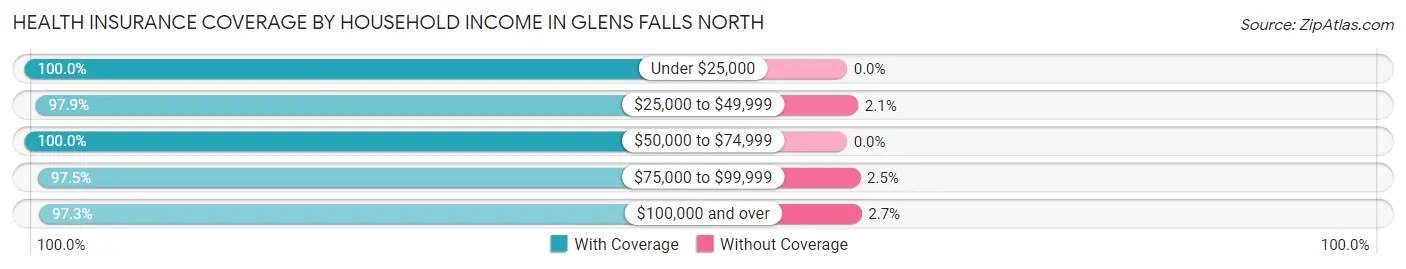
| Household Income | With Coverage | Without Coverage |
| Under $25,000 | 660 (100.0%) | 0 (0.0%) |
| $25,000 to $49,999 | 1,320 (97.9%) | 28 (2.1%) |
| $50,000 to $74,999 | 1,410 (100.0%) | 0 (0.0%) |
| $75,000 to $99,999 | 1,411 (97.5%) | 36 (2.5%) |
| $100,000 and over | 3,797 (97.3%) | 106 (2.7%) |
Public vs Private Health Insurance Coverage by Age in Glens Falls North
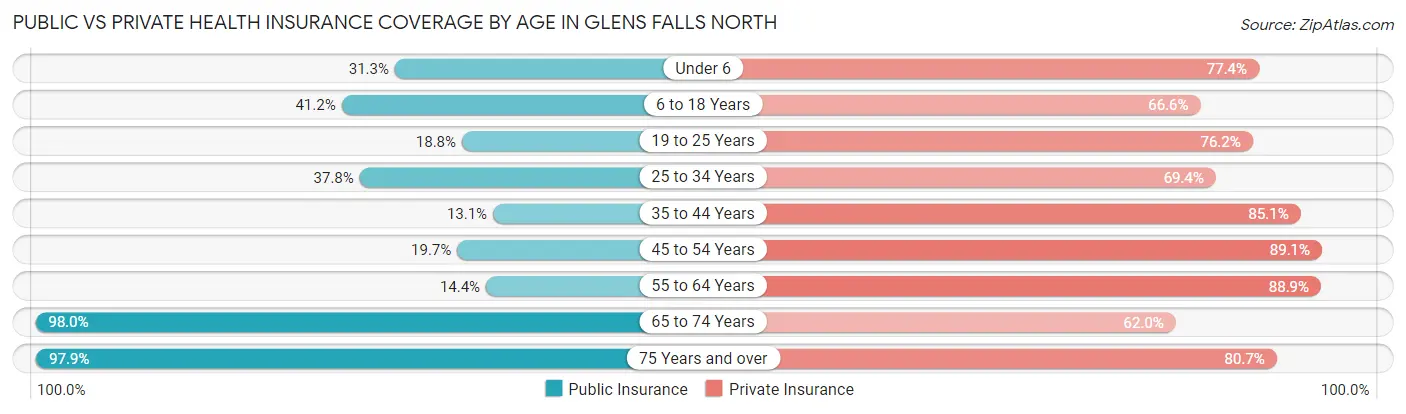
| Age Bracket | Public Insurance | Private Insurance |
| Under 6 | 230 (31.3%) | 569 (77.4%) |
| 6 to 18 Years | 341 (41.2%) | 551 (66.5%) |
| 19 to 25 Years | 149 (18.8%) | 603 (76.2%) |
| 25 to 34 Years | 388 (37.8%) | 712 (69.4%) |
| 35 to 44 Years | 117 (13.1%) | 762 (85.1%) |
| 45 to 54 Years | 170 (19.7%) | 768 (89.1%) |
| 55 to 64 Years | 232 (14.4%) | 1,436 (88.9%) |
| 65 to 74 Years | 1,278 (98.0%) | 808 (62.0%) |
| 75 Years and over | 822 (97.9%) | 678 (80.7%) |
| Total | 3,727 (41.9%) | 6,887 (77.4%) |
Disability Status by Sex by Age in Glens Falls North
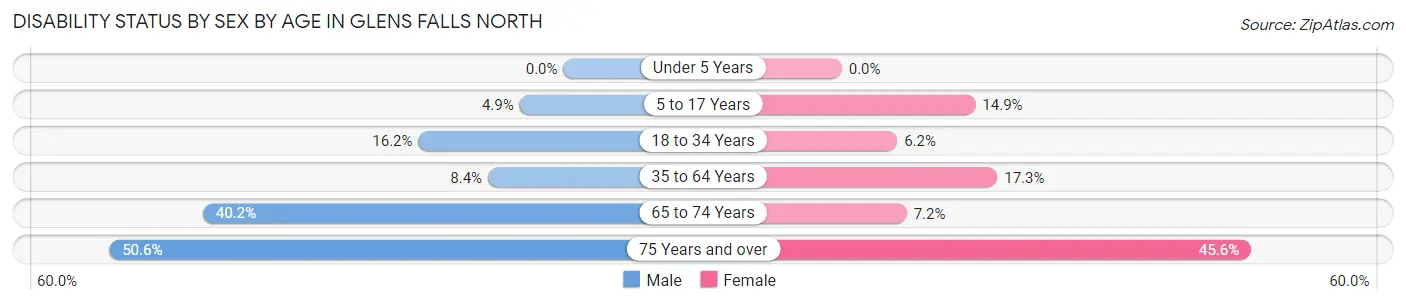
| Age Bracket | Male | Female |
| Under 5 Years | 0 (0.0%) | 0 (0.0%) |
| 5 to 17 Years | 25 (4.9%) | 64 (14.9%) |
| 18 to 34 Years | 150 (16.2%) | 57 (6.2%) |
| 35 to 64 Years | 114 (8.4%) | 349 (17.3%) |
| 65 to 74 Years | 318 (40.2%) | 37 (7.2%) |
| 75 Years and over | 134 (50.6%) | 262 (45.6%) |
Disability Class by Sex by Age in Glens Falls North
Disability Class: Hearing Difficulty
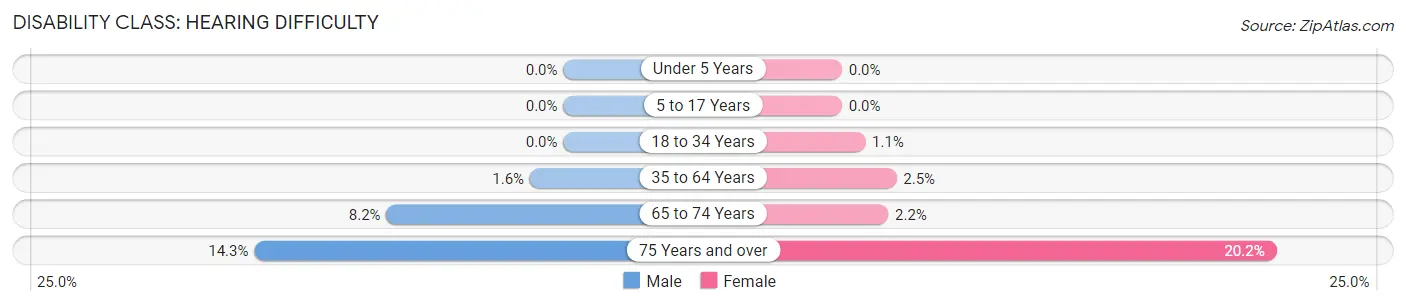
| Age Bracket | Male | Female |
| Under 5 Years | 0 (0.0%) | 0 (0.0%) |
| 5 to 17 Years | 0 (0.0%) | 0 (0.0%) |
| 18 to 34 Years | 0 (0.0%) | 10 (1.1%) |
| 35 to 64 Years | 21 (1.5%) | 51 (2.5%) |
| 65 to 74 Years | 65 (8.2%) | 11 (2.1%) |
| 75 Years and over | 38 (14.3%) | 116 (20.2%) |
Disability Class: Vision Difficulty
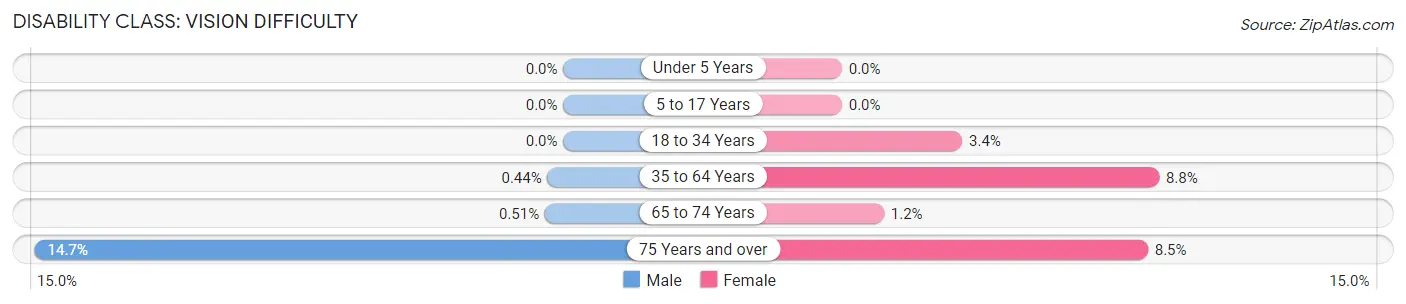
| Age Bracket | Male | Female |
| Under 5 Years | 0 (0.0%) | 0 (0.0%) |
| 5 to 17 Years | 0 (0.0%) | 0 (0.0%) |
| 18 to 34 Years | 0 (0.0%) | 31 (3.4%) |
| 35 to 64 Years | 6 (0.4%) | 178 (8.8%) |
| 65 to 74 Years | 4 (0.5%) | 6 (1.2%) |
| 75 Years and over | 39 (14.7%) | 49 (8.5%) |
Disability Class: Cognitive Difficulty
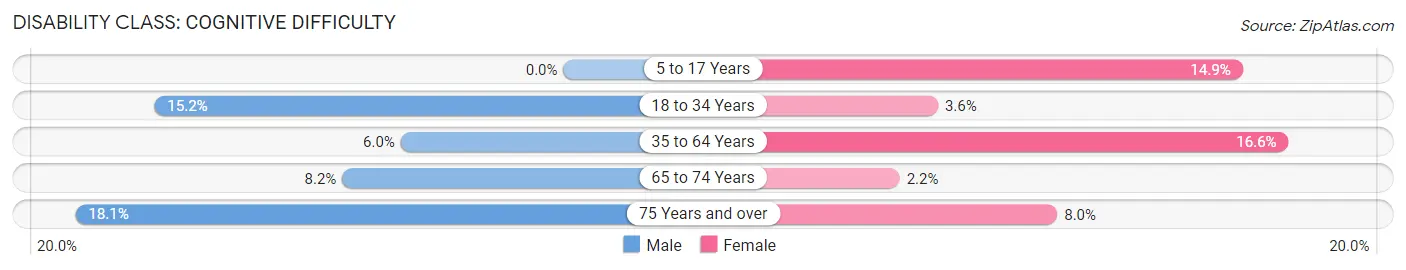
| Age Bracket | Male | Female |
| 5 to 17 Years | 0 (0.0%) | 64 (14.9%) |
| 18 to 34 Years | 141 (15.2%) | 33 (3.6%) |
| 35 to 64 Years | 82 (6.0%) | 334 (16.6%) |
| 65 to 74 Years | 65 (8.2%) | 11 (2.1%) |
| 75 Years and over | 48 (18.1%) | 46 (8.0%) |
Disability Class: Ambulatory Difficulty
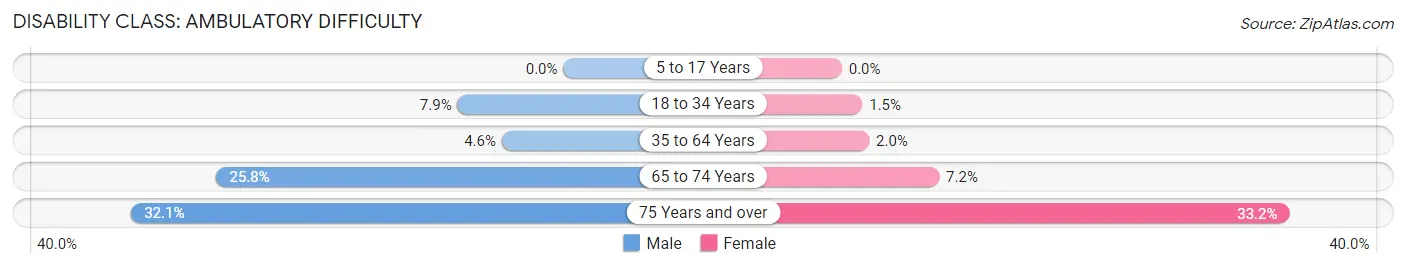
| Age Bracket | Male | Female |
| 5 to 17 Years | 0 (0.0%) | 0 (0.0%) |
| 18 to 34 Years | 73 (7.9%) | 14 (1.5%) |
| 35 to 64 Years | 62 (4.6%) | 41 (2.0%) |
| 65 to 74 Years | 204 (25.8%) | 37 (7.2%) |
| 75 Years and over | 85 (32.1%) | 191 (33.2%) |
Disability Class: Self-Care Difficulty
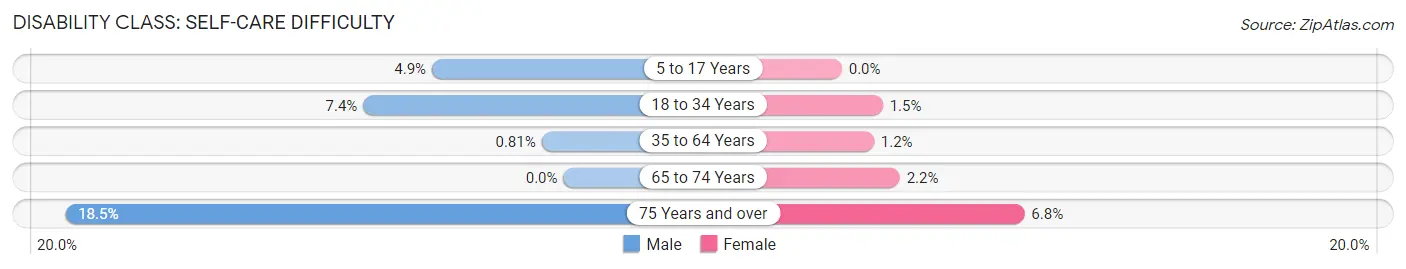
| Age Bracket | Male | Female |
| 5 to 17 Years | 25 (4.9%) | 0 (0.0%) |
| 18 to 34 Years | 69 (7.4%) | 14 (1.5%) |
| 35 to 64 Years | 11 (0.8%) | 24 (1.2%) |
| 65 to 74 Years | 0 (0.0%) | 11 (2.1%) |
| 75 Years and over | 49 (18.5%) | 39 (6.8%) |
Technology Access in Glens Falls North
Computing Device Access in Glens Falls North
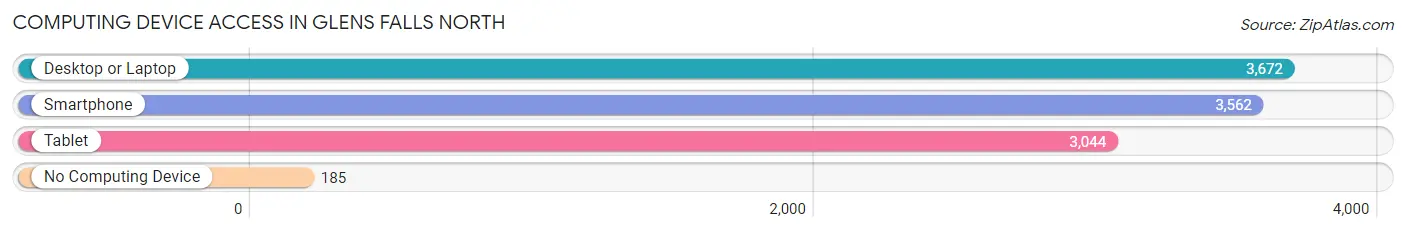
| Device Type | # Households | % Households |
| Desktop or Laptop | 3,672 | 84.9% |
| Smartphone | 3,562 | 82.4% |
| Tablet | 3,044 | 70.4% |
| No Computing Device | 185 | 4.3% |
| Total | 4,324 | 100.0% |
Internet Access in Glens Falls North
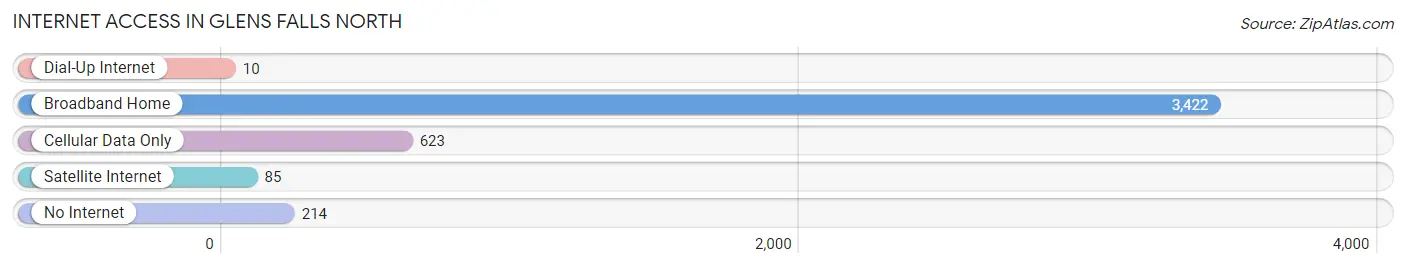
| Internet Type | # Households | % Households |
| Dial-Up Internet | 10 | 0.2% |
| Broadband Home | 3,422 | 79.1% |
| Cellular Data Only | 623 | 14.4% |
| Satellite Internet | 85 | 2.0% |
| No Internet | 214 | 5.0% |
| Total | 4,324 | 100.0% |
Glens Falls North Summary
Glens Falls North, NY is a small town located in the Adirondack Mountains of upstate New York. It is situated in the foothills of the Adirondacks, about 30 miles north of Albany and about 20 miles south of Lake George. The town is part of the Glens Falls Metropolitan Statistical Area, which includes the towns of Glens Falls, Queensbury, and South Glens Falls. The population of Glens Falls North was 2,845 at the 2010 census.
History
Glens Falls North was first settled in 1762 by a group of Dutch settlers led by Johannes Van Dyke. The town was originally known as “Van Dyke’s Town” and was later renamed “Glens Falls” after the nearby waterfall. The town was incorporated in 1839 and was the first town in the county to be incorporated.
In the late 19th century, Glens Falls North was a popular tourist destination due to its proximity to the Adirondack Mountains. The town was home to several resorts and hotels, including the Glens Falls Hotel, which was built in 1876 and was one of the largest hotels in the area.
Geography
Glens Falls North is located in the foothills of the Adirondack Mountains in upstate New York. The town is situated on the western edge of the Adirondack Park, about 30 miles north of Albany and about 20 miles south of Lake George. The town is part of the Glens Falls Metropolitan Statistical Area, which includes the towns of Glens Falls, Queensbury, and South Glens Falls.
The town is located on the western edge of the Adirondack Park and is bordered by the towns of Queensbury to the north, South Glens Falls to the east, and Fort Edward to the south. The town is situated on the western edge of the Adirondack Mountains and is home to several small lakes, including Lake George, Lake Luzerne, and Lake Van Dyke.
Economy
Glens Falls North is a small town with a population of just over 2,800 people. The town’s economy is largely based on tourism, with many visitors coming to the area to enjoy the nearby Adirondack Mountains. The town is also home to several small businesses, including restaurants, retail stores, and professional services.
The town is also home to several large employers, including Glens Falls Hospital, Glens Falls National Bank, and Glens Falls Insurance. The town is also home to several manufacturing companies, including Glens Falls Plastics and Glens Falls Manufacturing.
Demographics
As of the 2010 census, the population of Glens Falls North was 2,845. The racial makeup of the town was 97.2% White, 0.7% African American, 0.3% Native American, 0.7% Asian, 0.1% Pacific Islander, 0.3% from other races, and 0.9% from two or more races. Hispanic or Latino of any race were 1.3% of the population.
The median income for a household in the town was $45,938, and the median income for a family was $54,844. The per capita income for the town was $22,945. About 8.2% of families and 10.3% of the population were below the poverty line, including 14.2% of those under age 18 and 5.2% of those age 65 or over.
Common Questions
What is Per Capita Income in Glens Falls North?
Per Capita income in Glens Falls North is $53,988.
What is the Median Family Income in Glens Falls North?
Median Family Income in Glens Falls North is $97,035.
What is the Median Household income in Glens Falls North?
Median Household Income in Glens Falls North is $78,889.
What is Income or Wage Gap in Glens Falls North?
Income or Wage Gap in Glens Falls North is 23.7%.
Women in Glens Falls North earn 76.3 cents for every dollar earned by a man.
What is Inequality or Gini Index in Glens Falls North?
Inequality or Gini Index in Glens Falls North is 0.49.
What is the Total Population of Glens Falls North?
Total Population of Glens Falls North is 8,996.
What is the Total Male Population of Glens Falls North?
Total Male Population of Glens Falls North is 4,299.
What is the Total Female Population of Glens Falls North?
Total Female Population of Glens Falls North is 4,697.
What is the Ratio of Males per 100 Females in Glens Falls North?
There are 91.53 Males per 100 Females in Glens Falls North.
What is the Ratio of Females per 100 Males in Glens Falls North?
There are 109.26 Females per 100 Males in Glens Falls North.
What is the Median Population Age in Glens Falls North?
Median Population Age in Glens Falls North is 45.9 Years.
What is the Average Family Size in Glens Falls North
Average Family Size in Glens Falls North is 2.6 People.
What is the Average Household Size in Glens Falls North
Average Household Size in Glens Falls North is 2.0 People.
How Large is the Labor Force in Glens Falls North?
There are 4,650 People in the Labor Forcein in Glens Falls North.
What is the Percentage of People in the Labor Force in Glens Falls North?
61.4% of People are in the Labor Force in Glens Falls North.
What is the Unemployment Rate in Glens Falls North?
Unemployment Rate in Glens Falls North is 5.0%.