Zip Codes with the Highest Percentage of Population Employed in Security & Protection in Staten Island, NY
RELATED REPORTS & OPTIONS
Security & Protection
Staten Island
Compare Zip Codes
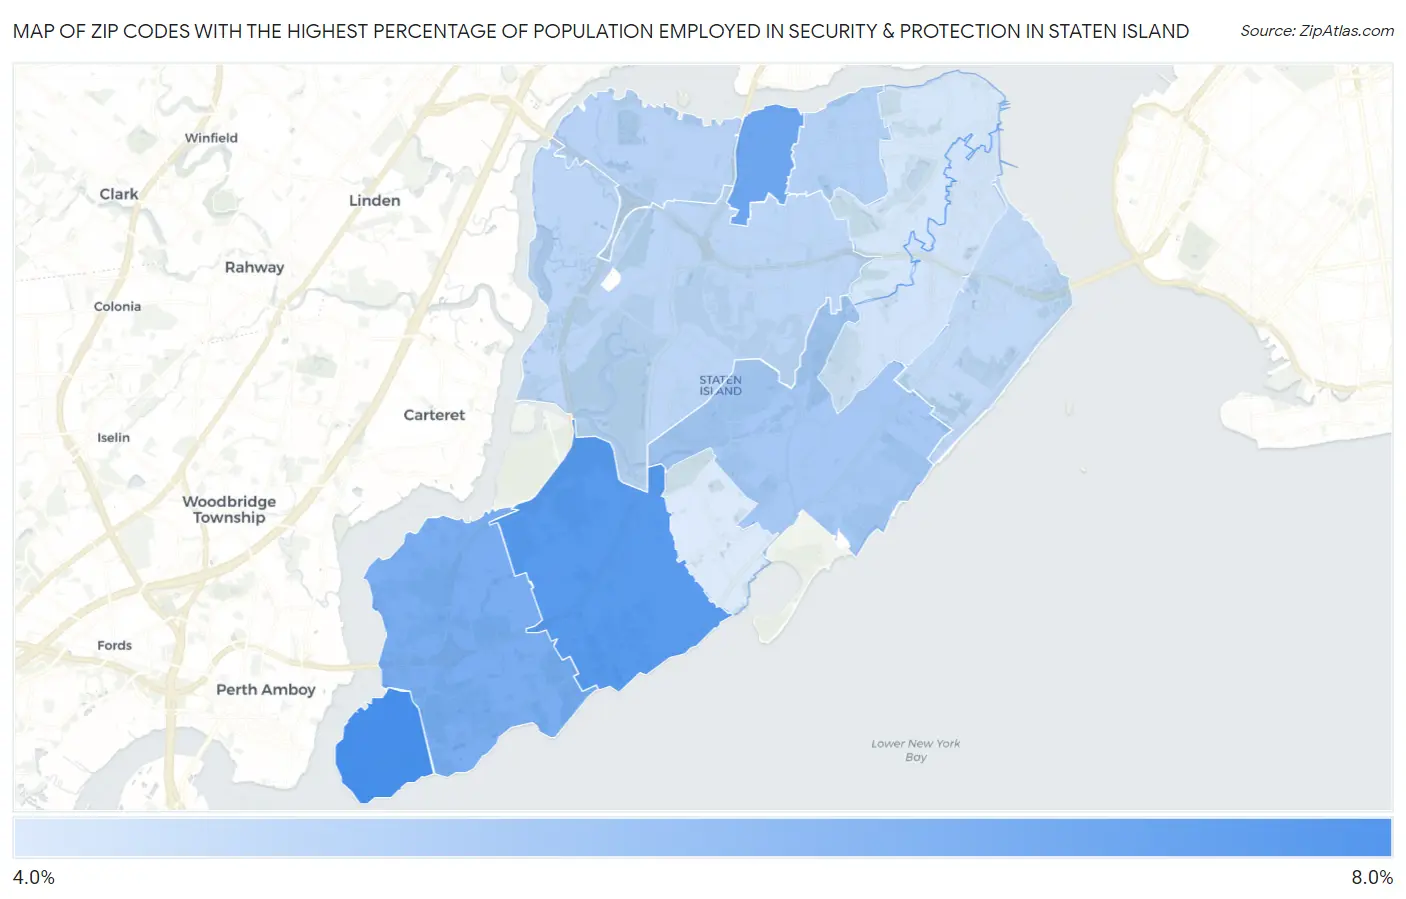
Map of Zip Codes with the Highest Percentage of Population Employed in Security & Protection in Staten Island
4.2%
7.3%
Zip Codes with the Highest Percentage of Population Employed in Security & Protection in Staten Island, NY
| Zip Code | % Employed | vs State | vs National | |
| 1. | 10307 | 7.3% | 2.9%(+4.42)#109 | 2.1%(+5.18)#1,389 |
| 2. | 10312 | 7.0% | 2.9%(+4.08)#118 | 2.1%(+4.85)#1,532 |
| 3. | 10302 | 6.5% | 2.9%(+3.57)#146 | 2.1%(+4.33)#1,794 |
| 4. | 10309 | 6.3% | 2.9%(+3.35)#157 | 2.1%(+4.12)#1,913 |
| 5. | 10306 | 5.3% | 2.9%(+2.41)#222 | 2.1%(+3.17)#2,613 |
| 6. | 10310 | 5.0% | 2.9%(+2.14)#252 | 2.1%(+2.90)#2,869 |
| 7. | 10303 | 5.0% | 2.9%(+2.04)#260 | 2.1%(+2.81)#2,976 |
| 8. | 10314 | 4.9% | 2.9%(+1.97)#268 | 2.1%(+2.73)#3,069 |
| 9. | 10305 | 4.8% | 2.9%(+1.86)#281 | 2.1%(+2.63)#3,200 |
| 10. | 10304 | 4.4% | 2.9%(+1.52)#341 | 2.1%(+2.28)#3,724 |
| 11. | 10301 | 4.3% | 2.9%(+1.43)#355 | 2.1%(+2.19)#3,875 |
| 12. | 10308 | 4.2% | 2.9%(+1.28)#387 | 2.1%(+2.04)#4,138 |
1
Common Questions
What are the Top 10 Zip Codes with the Highest Percentage of Population Employed in Security & Protection in Staten Island, NY?
Top 10 Zip Codes with the Highest Percentage of Population Employed in Security & Protection in Staten Island, NY are:
What zip code has the Highest Percentage of Population Employed in Security & Protection in Staten Island, NY?
10307 has the Highest Percentage of Population Employed in Security & Protection in Staten Island, NY with 7.3%.
What is the Percentage of Population Employed in Security & Protection in New York?
Percentage of Population Employed in Security & Protection in New York is 2.9%.
What is the Percentage of Population Employed in Security & Protection in the United States?
Percentage of Population Employed in Security & Protection in the United States is 2.1%.