Cayuga, NY Map & Demographics
Cayuga Map
Cayuga Overview
$42,915
PER CAPITA INCOME
$93,000
AVG FAMILY INCOME
$74,167
AVG HOUSEHOLD INCOME
20.8%
WAGE / INCOME GAP [ % ]
79.2¢/ $1
WAGE / INCOME GAP [ $ ]
0.41
INEQUALITY / GINI INDEX
387
TOTAL POPULATION
172
MALE POPULATION
215
FEMALE POPULATION
80.00
MALES / 100 FEMALES
125.00
FEMALES / 100 MALES
54.7
MEDIAN AGE
2.7
AVG FAMILY SIZE
2.1
AVG HOUSEHOLD SIZE
230
LABOR FORCE [ PEOPLE ]
65.5%
PERCENT IN LABOR FORCE
0.9%
UNEMPLOYMENT RATE
Cayuga Zip Codes
Cayuga Area Codes
Income in Cayuga
Income Overview in Cayuga
Per Capita Income in Cayuga is $42,915, while median incomes of families and households are $93,000 and $74,167 respectively.
| Characteristic | Number | Measure |
| Per Capita Income | 387 | $42,915 |
| Median Family Income | 104 | $93,000 |
| Mean Family Income | 104 | $118,888 |
| Median Household Income | 184 | $74,167 |
| Mean Household Income | 184 | $92,346 |
| Income Deficit | 104 | $0 |
| Wage / Income Gap (%) | 387 | 20.79% |
| Wage / Income Gap ($) | 387 | 79.21¢ per $1 |
| Gini / Inequality Index | 387 | 0.41 |
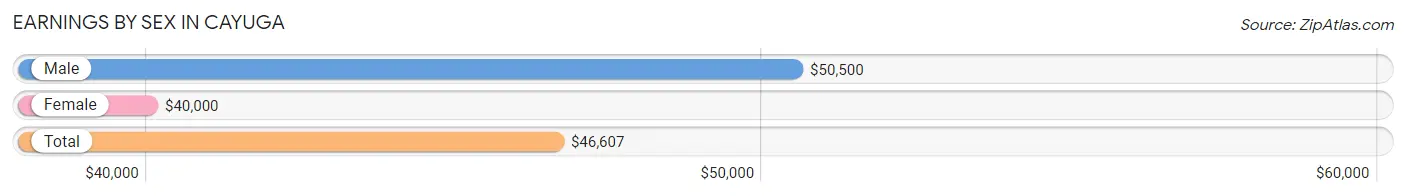
Earnings by Sex in Cayuga
Average Earnings in Cayuga are $46,607, $50,500 for men and $40,000 for women, a difference of 20.8%.
| Sex | Number | Average Earnings |
| Male | 116 (47.9%) | $50,500 |
| Female | 126 (52.1%) | $40,000 |
| Total | 242 (100.0%) | $46,607 |
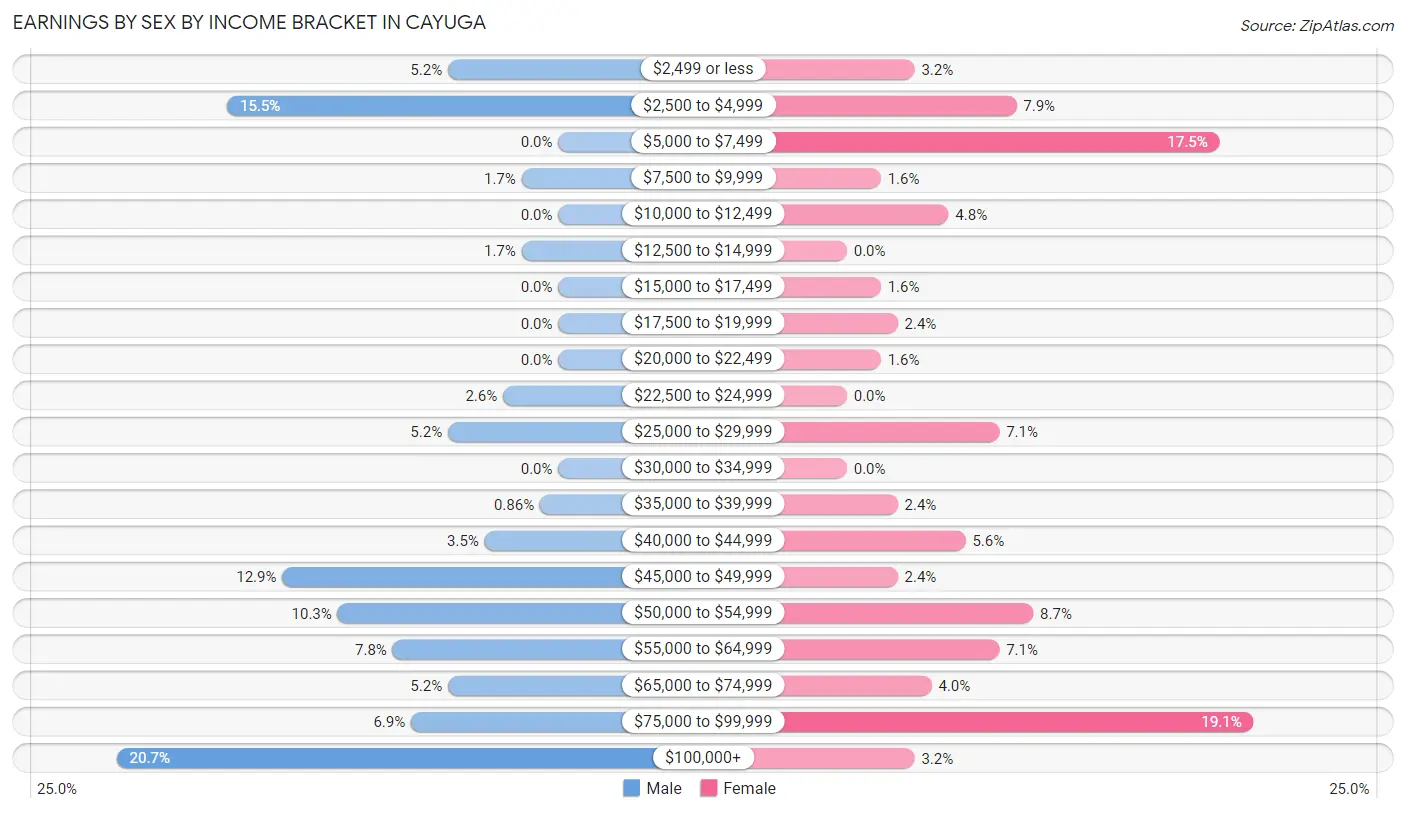
Earnings by Sex by Income Bracket in Cayuga
The most common earnings brackets in Cayuga are $100,000+ for men (24 | 20.7%) and $75,000 to $99,999 for women (24 | 19.1%).
| Income | Male | Female |
| $2,499 or less | 6 (5.2%) | 4 (3.2%) |
| $2,500 to $4,999 | 18 (15.5%) | 10 (7.9%) |
| $5,000 to $7,499 | 0 (0.0%) | 22 (17.5%) |
| $7,500 to $9,999 | 2 (1.7%) | 2 (1.6%) |
| $10,000 to $12,499 | 0 (0.0%) | 6 (4.8%) |
| $12,500 to $14,999 | 2 (1.7%) | 0 (0.0%) |
| $15,000 to $17,499 | 0 (0.0%) | 2 (1.6%) |
| $17,500 to $19,999 | 0 (0.0%) | 3 (2.4%) |
| $20,000 to $22,499 | 0 (0.0%) | 2 (1.6%) |
| $22,500 to $24,999 | 3 (2.6%) | 0 (0.0%) |
| $25,000 to $29,999 | 6 (5.2%) | 9 (7.1%) |
| $30,000 to $34,999 | 0 (0.0%) | 0 (0.0%) |
| $35,000 to $39,999 | 1 (0.9%) | 3 (2.4%) |
| $40,000 to $44,999 | 4 (3.5%) | 7 (5.6%) |
| $45,000 to $49,999 | 15 (12.9%) | 3 (2.4%) |
| $50,000 to $54,999 | 12 (10.3%) | 11 (8.7%) |
| $55,000 to $64,999 | 9 (7.8%) | 9 (7.1%) |
| $65,000 to $74,999 | 6 (5.2%) | 5 (4.0%) |
| $75,000 to $99,999 | 8 (6.9%) | 24 (19.1%) |
| $100,000+ | 24 (20.7%) | 4 (3.2%) |
| Total | 116 (100.0%) | 126 (100.0%) |
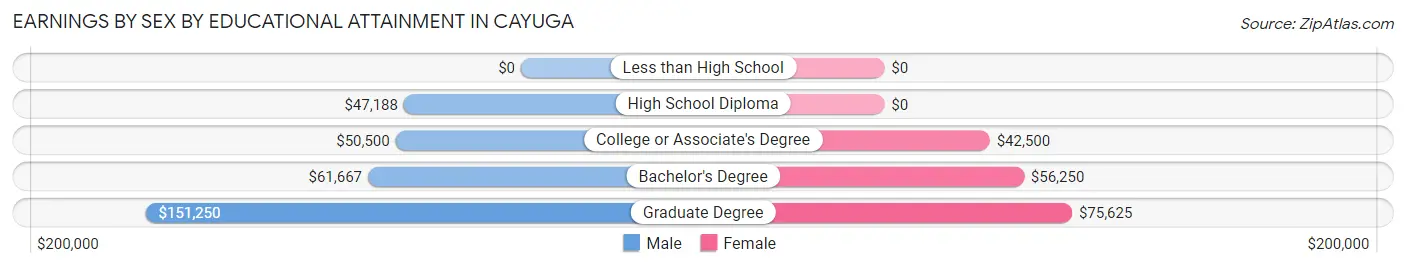
Earnings by Sex by Educational Attainment in Cayuga
Average earnings in Cayuga are $53,393 for men and $53,636 for women, a difference of 0.4%. Men with an educational attainment of graduate degree enjoy the highest average annual earnings of $151,250, while those with high school diploma education earn the least with $47,188. Women with an educational attainment of graduate degree earn the most with the average annual earnings of $75,625, while those with college or associate's degree education have the smallest earnings of $42,500.
| Educational Attainment | Male Income | Female Income |
| Less than High School | - | - |
| High School Diploma | $47,188 | $0 |
| College or Associate's Degree | $50,500 | $42,500 |
| Bachelor's Degree | $61,667 | $56,250 |
| Graduate Degree | $151,250 | $75,625 |
| Total | $53,393 | $53,636 |
Family Income in Cayuga
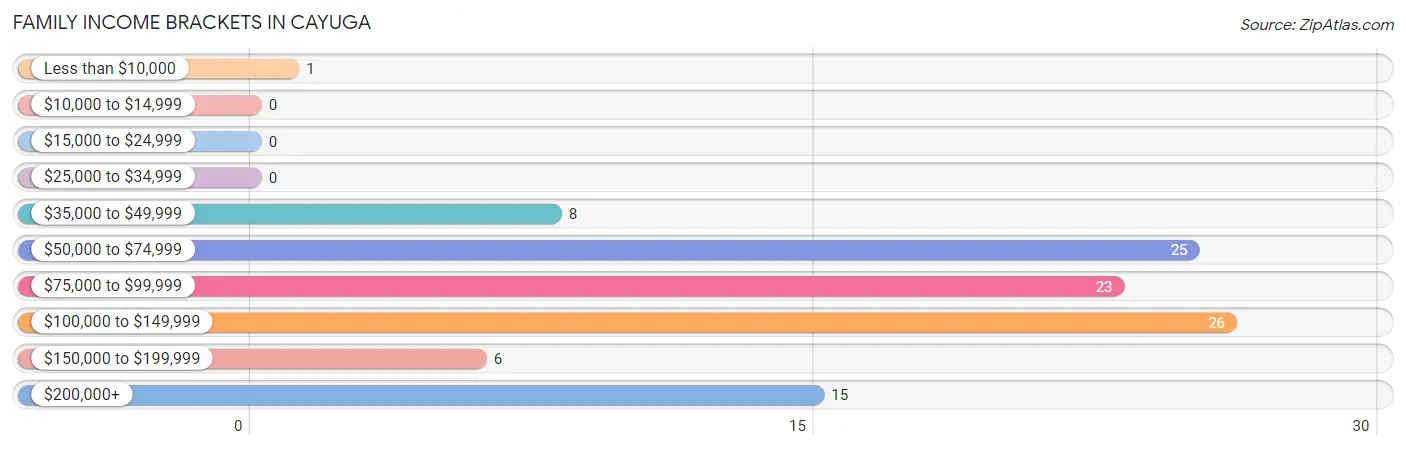
Family Income Brackets in Cayuga
According to the Cayuga family income data, there are 26 families falling into the $100,000 to $149,999 income range, which is the most common income bracket and makes up 25.0% of all families.
| Income Bracket | # Families | % Families |
| Less than $10,000 | 1 | 1.0% |
| $10,000 to $14,999 | 0 | 0.0% |
| $15,000 to $24,999 | 0 | 0.0% |
| $25,000 to $34,999 | 0 | 0.0% |
| $35,000 to $49,999 | 8 | 7.7% |
| $50,000 to $74,999 | 25 | 24.0% |
| $75,000 to $99,999 | 23 | 22.1% |
| $100,000 to $149,999 | 26 | 25.0% |
| $150,000 to $199,999 | 6 | 5.8% |
| $200,000+ | 15 | 14.4% |
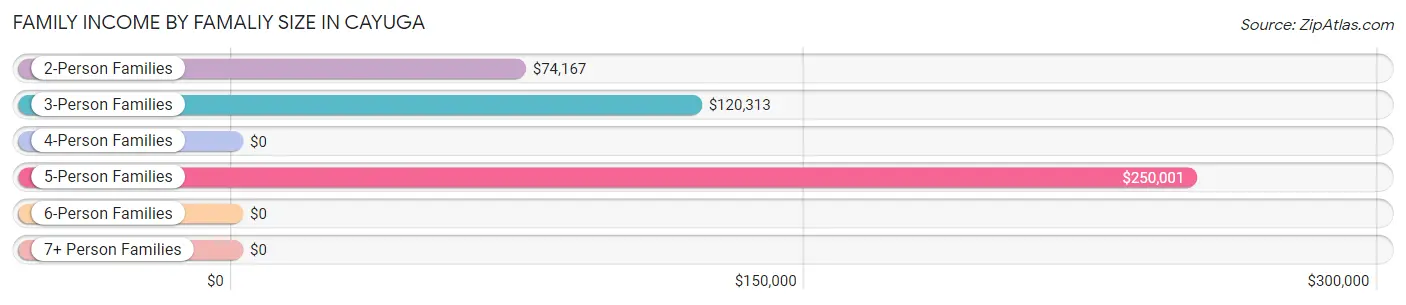
Family Income by Famaliy Size in Cayuga
5-person families (17 | 16.4%) account for the highest median family income in Cayuga with $250,001 per family, while 5-person families (17 | 16.4%) have the highest median income of $50,000 per family member.
| Income Bracket | # Families | Median Income |
| 2-Person Families | 64 (61.5%) | $74,167 |
| 3-Person Families | 17 (16.4%) | $120,313 |
| 4-Person Families | 6 (5.8%) | $0 |
| 5-Person Families | 17 (16.4%) | $250,001 |
| 6-Person Families | 0 (0.0%) | $0 |
| 7+ Person Families | 0 (0.0%) | $0 |
| Total | 104 (100.0%) | $93,000 |
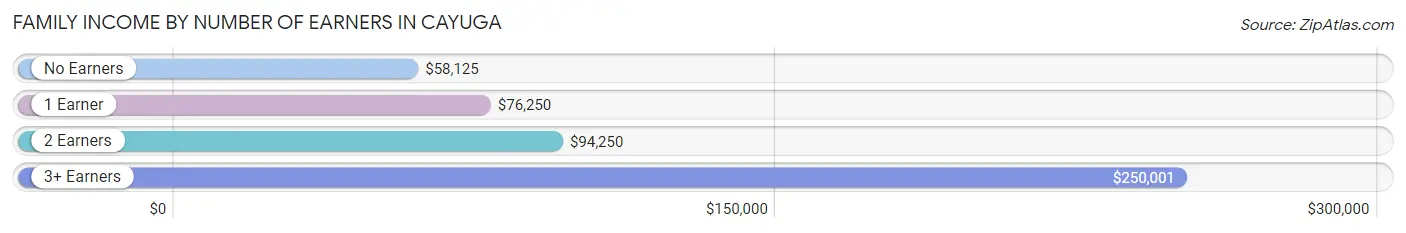
Family Income by Number of Earners in Cayuga
The median family income in Cayuga is $93,000, with families comprising 3+ earners (17) having the highest median family income of $250,001, while families with no earners (22) have the lowest median family income of $58,125, accounting for 16.4% and 21.1% of families, respectively.
| Number of Earners | # Families | Median Income |
| No Earners | 22 (21.1%) | $58,125 |
| 1 Earner | 10 (9.6%) | $76,250 |
| 2 Earners | 55 (52.9%) | $94,250 |
| 3+ Earners | 17 (16.4%) | $250,001 |
| Total | 104 (100.0%) | $93,000 |
Household Income in Cayuga
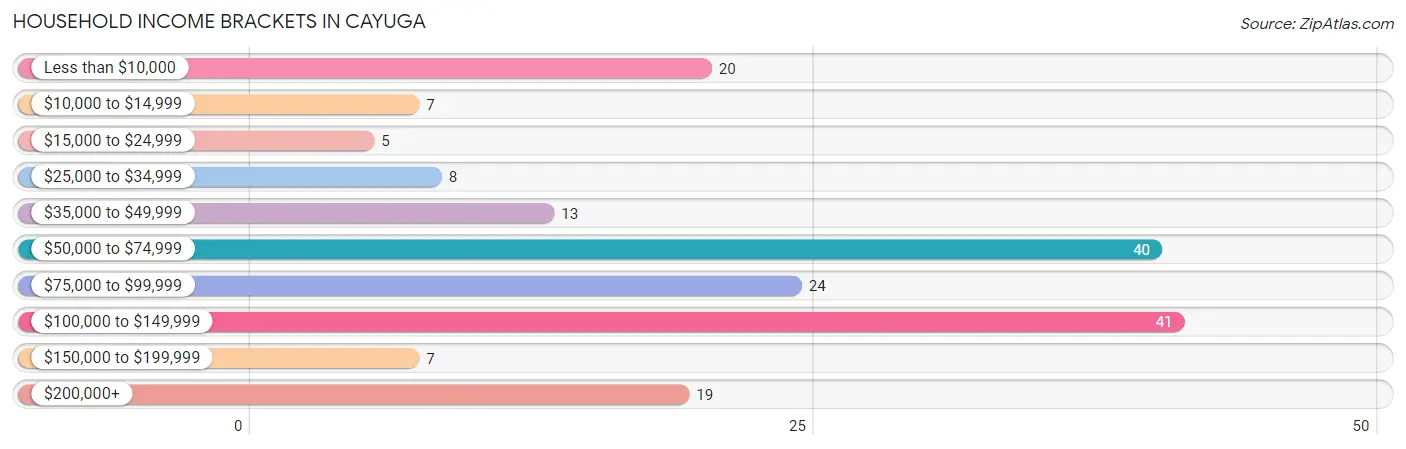
Household Income Brackets in Cayuga
With 41 households falling in the category, the $100,000 to $149,999 income range is the most frequent in Cayuga, accounting for 22.3% of all households. In contrast, only 5 households (2.7%) fall into the $15,000 to $24,999 income bracket, making it the least populous group.
| Income Bracket | # Households | % Households |
| Less than $10,000 | 20 | 10.9% |
| $10,000 to $14,999 | 7 | 3.8% |
| $15,000 to $24,999 | 5 | 2.7% |
| $25,000 to $34,999 | 8 | 4.3% |
| $35,000 to $49,999 | 13 | 7.1% |
| $50,000 to $74,999 | 40 | 21.7% |
| $75,000 to $99,999 | 24 | 13.0% |
| $100,000 to $149,999 | 41 | 22.3% |
| $150,000 to $199,999 | 7 | 3.8% |
| $200,000+ | 19 | 10.3% |
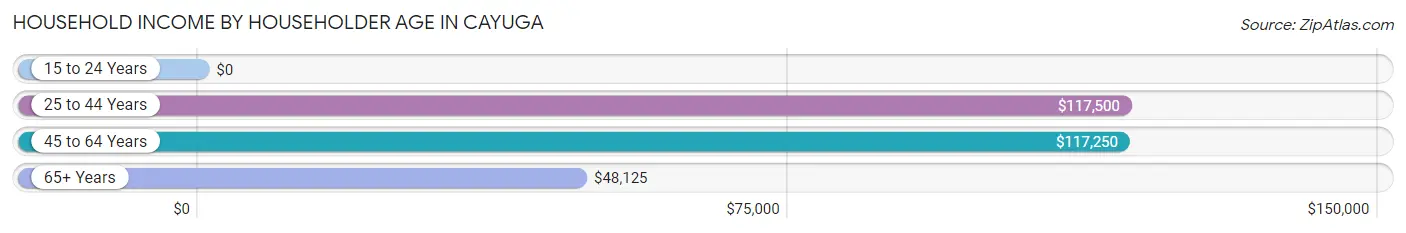
Household Income by Householder Age in Cayuga
The median household income in Cayuga is $74,167, with the highest median household income of $117,500 found in the 25 to 44 years age bracket for the primary householder. A total of 26 households (14.1%) fall into this category.
| Income Bracket | # Households | Median Income |
| 15 to 24 Years | 0 (0.0%) | $0 |
| 25 to 44 Years | 26 (14.1%) | $117,500 |
| 45 to 64 Years | 81 (44.0%) | $117,250 |
| 65+ Years | 77 (41.8%) | $48,125 |
| Total | 184 (100.0%) | $74,167 |
Poverty in Cayuga
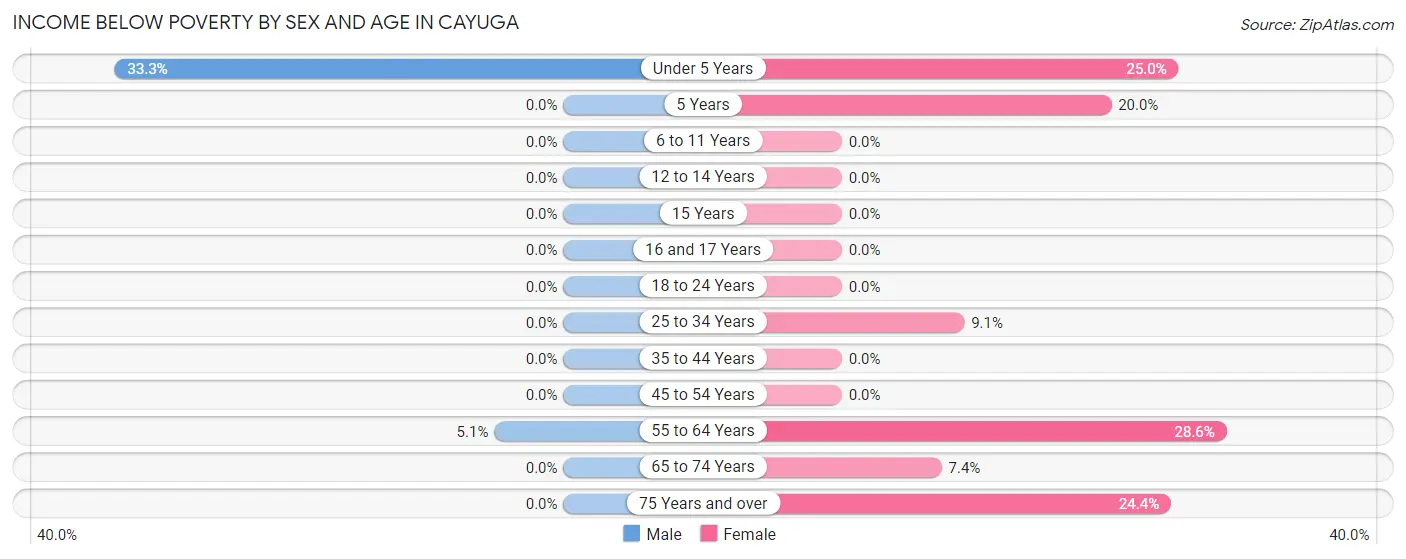
Income Below Poverty by Sex and Age in Cayuga
With 1.7% poverty level for males and 13.0% for females among the residents of Cayuga, under 5 year old males and 55 to 64 year old females are the most vulnerable to poverty, with 1 males (33.3%) and 12 females (28.6%) in their respective age groups living below the poverty level.
| Age Bracket | Male | Female |
| Under 5 Years | 1 (33.3%) | 1 (25.0%) |
| 5 Years | 0 (0.0%) | 1 (20.0%) |
| 6 to 11 Years | 0 (0.0%) | 0 (0.0%) |
| 12 to 14 Years | 0 (0.0%) | 0 (0.0%) |
| 15 Years | 0 (0.0%) | 0 (0.0%) |
| 16 and 17 Years | 0 (0.0%) | 0 (0.0%) |
| 18 to 24 Years | 0 (0.0%) | 0 (0.0%) |
| 25 to 34 Years | 0 (0.0%) | 1 (9.1%) |
| 35 to 44 Years | 0 (0.0%) | 0 (0.0%) |
| 45 to 54 Years | 0 (0.0%) | 0 (0.0%) |
| 55 to 64 Years | 2 (5.1%) | 12 (28.6%) |
| 65 to 74 Years | 0 (0.0%) | 2 (7.4%) |
| 75 Years and over | 0 (0.0%) | 11 (24.4%) |
| Total | 3 (1.7%) | 28 (13.0%) |
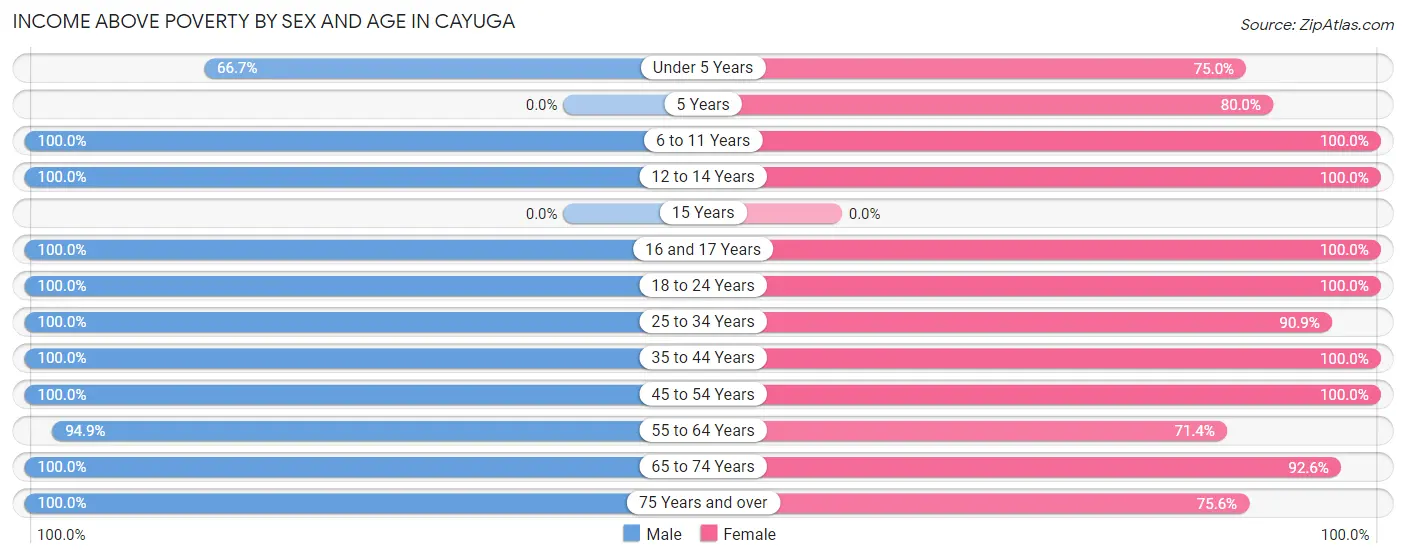
Income Above Poverty by Sex and Age in Cayuga
According to the poverty statistics in Cayuga, males aged 6 to 11 years and females aged 6 to 11 years are the age groups that are most secure financially, with 100.0% of males and 100.0% of females in these age groups living above the poverty line.
| Age Bracket | Male | Female |
| Under 5 Years | 2 (66.7%) | 3 (75.0%) |
| 5 Years | 0 (0.0%) | 4 (80.0%) |
| 6 to 11 Years | 10 (100.0%) | 9 (100.0%) |
| 12 to 14 Years | 3 (100.0%) | 2 (100.0%) |
| 15 Years | 0 (0.0%) | 0 (0.0%) |
| 16 and 17 Years | 3 (100.0%) | 23 (100.0%) |
| 18 to 24 Years | 13 (100.0%) | 9 (100.0%) |
| 25 to 34 Years | 21 (100.0%) | 10 (90.9%) |
| 35 to 44 Years | 11 (100.0%) | 11 (100.0%) |
| 45 to 54 Years | 31 (100.0%) | 27 (100.0%) |
| 55 to 64 Years | 37 (94.9%) | 30 (71.4%) |
| 65 to 74 Years | 17 (100.0%) | 25 (92.6%) |
| 75 Years and over | 21 (100.0%) | 34 (75.6%) |
| Total | 169 (98.3%) | 187 (87.0%) |
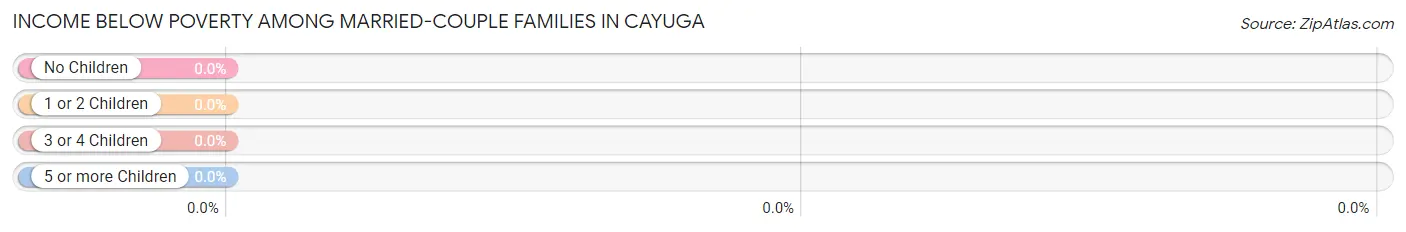
Income Below Poverty Among Married-Couple Families in Cayuga
| Children | Above Poverty | Below Poverty |
| No Children | 57 (100.0%) | 0 (0.0%) |
| 1 or 2 Children | 23 (100.0%) | 0 (0.0%) |
| 3 or 4 Children | 6 (100.0%) | 0 (0.0%) |
| 5 or more Children | 0 (0.0%) | 0 (0.0%) |
| Total | 86 (100.0%) | 0 (0.0%) |
Income Below Poverty Among Single-Parent Households in Cayuga
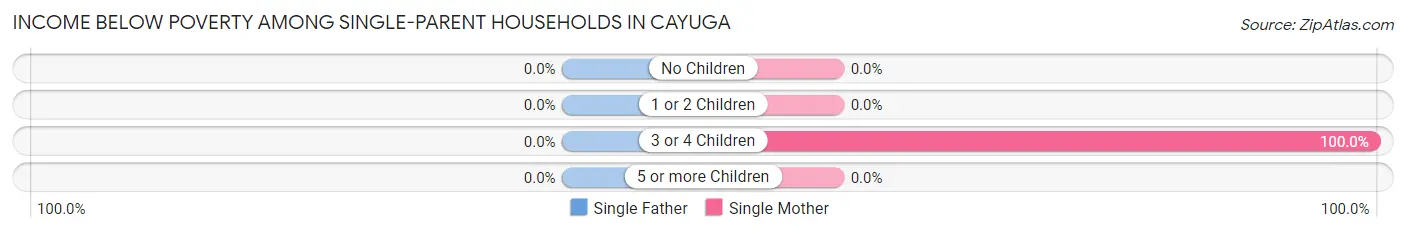
| Children | Single Father | Single Mother |
| No Children | 0 (0.0%) | 0 (0.0%) |
| 1 or 2 Children | 0 (0.0%) | 0 (0.0%) |
| 3 or 4 Children | 0 (0.0%) | 1 (100.0%) |
| 5 or more Children | 0 (0.0%) | 0 (0.0%) |
| Total | 0 (0.0%) | 1 (7.7%) |
Income Below Poverty Among Married-Couple vs Single-Parent Households in Cayuga
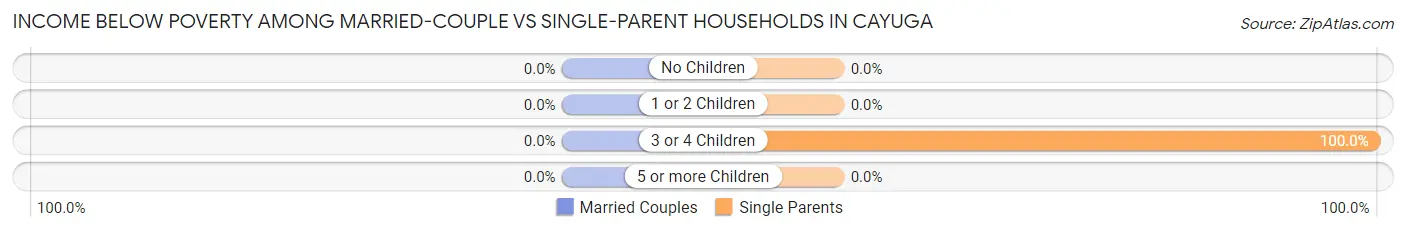
| Children | Married-Couple Families | Single-Parent Households |
| No Children | 0 (0.0%) | 0 (0.0%) |
| 1 or 2 Children | 0 (0.0%) | 0 (0.0%) |
| 3 or 4 Children | 0 (0.0%) | 1 (100.0%) |
| 5 or more Children | 0 (0.0%) | 0 (0.0%) |
| Total | 0 (0.0%) | 1 (5.6%) |
Race in Cayuga
The most populous races in Cayuga are White / Caucasian (355 | 91.7%), Two or more Races (18 | 4.6%), and Hispanic or Latino (14 | 3.6%).
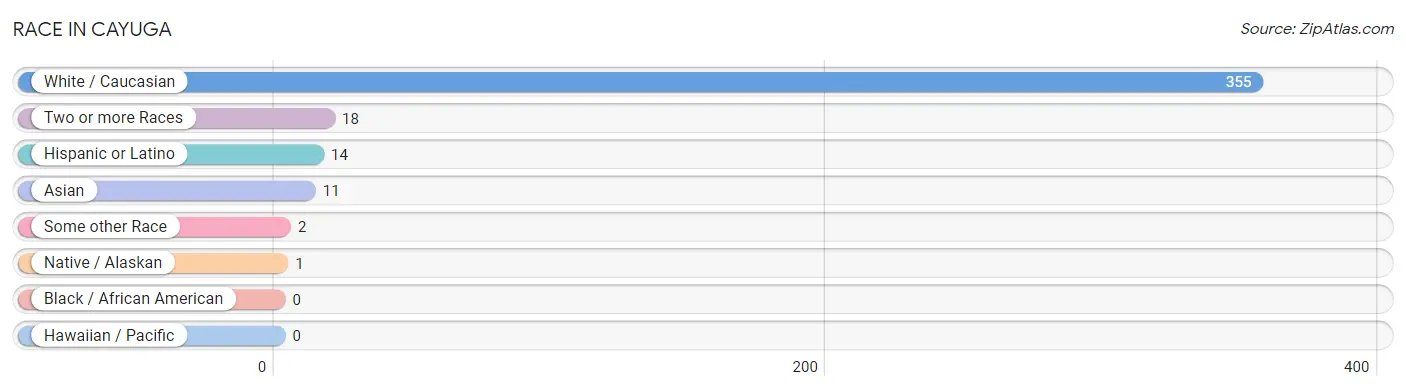
| Race | # Population | % Population |
| Asian | 11 | 2.8% |
| Black / African American | 0 | 0.0% |
| Hawaiian / Pacific | 0 | 0.0% |
| Hispanic or Latino | 14 | 3.6% |
| Native / Alaskan | 1 | 0.3% |
| White / Caucasian | 355 | 91.7% |
| Two or more Races | 18 | 4.6% |
| Some other Race | 2 | 0.5% |
| Total | 387 | 100.0% |
Ancestry in Cayuga
The most populous ancestries reported in Cayuga are Irish (105 | 27.1%), English (94 | 24.3%), German (59 | 15.2%), Italian (37 | 9.6%), and Polish (29 | 7.5%), together accounting for 83.7% of all Cayuga residents.
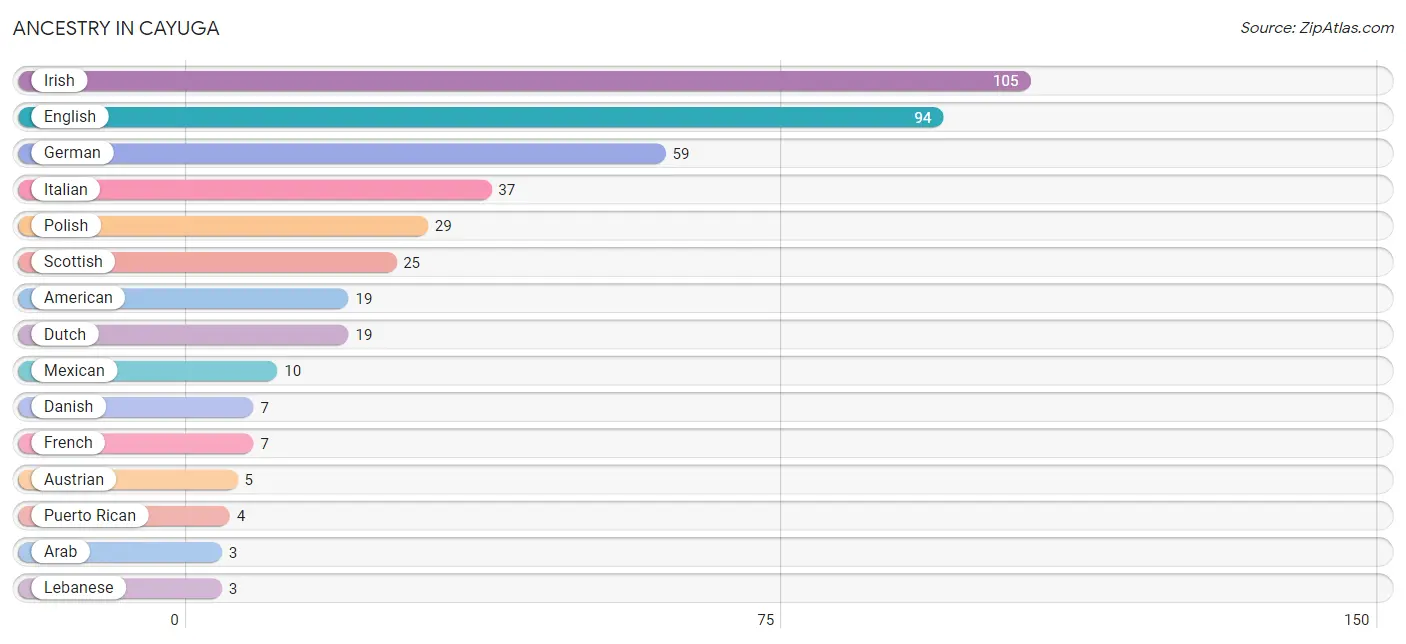
| Ancestry | # Population | % Population |
| American | 19 | 4.9% |
| Arab | 3 | 0.8% |
| Austrian | 5 | 1.3% |
| Danish | 7 | 1.8% |
| Dutch | 19 | 4.9% |
| English | 94 | 24.3% |
| European | 2 | 0.5% |
| French | 7 | 1.8% |
| French Canadian | 2 | 0.5% |
| German | 59 | 15.2% |
| Hungarian | 1 | 0.3% |
| Irish | 105 | 27.1% |
| Iroquois | 1 | 0.3% |
| Italian | 37 | 9.6% |
| Jamaican | 2 | 0.5% |
| Lebanese | 3 | 0.8% |
| Mexican | 10 | 2.6% |
| Pakistani | 3 | 0.8% |
| Polish | 29 | 7.5% |
| Puerto Rican | 4 | 1.0% |
| Scotch-Irish | 2 | 0.5% |
| Scottish | 25 | 6.5% |
| Swedish | 2 | 0.5% |
| Thai | 2 | 0.5% |
| Ukrainian | 2 | 0.5% | View All 25 Rows |
Immigrants in Cayuga
The most numerous immigrant groups reported in Cayuga came from Asia (7 | 1.8%), Nepal (7 | 1.8%), South Central Asia (7 | 1.8%), Europe (3 | 0.8%), and Southern Europe (3 | 0.8%), together accounting for 7.0% of all Cayuga residents.
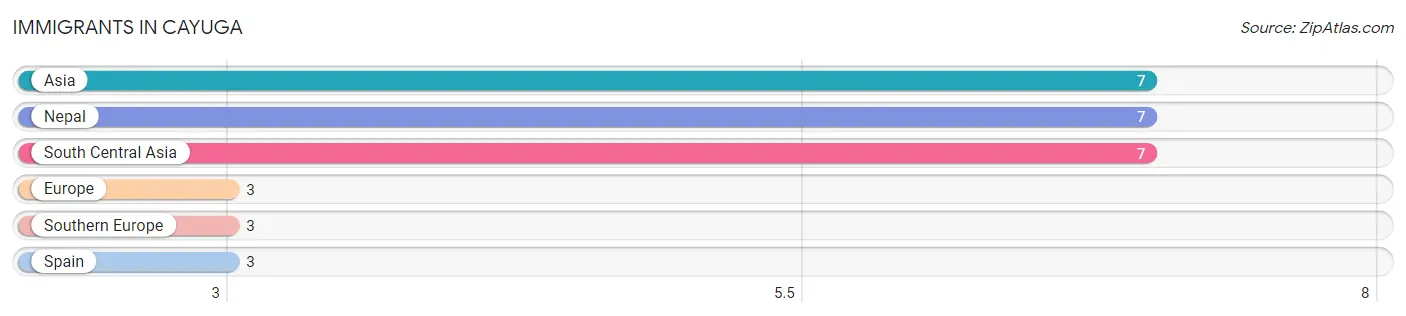
| Immigration Origin | # Population | % Population |
| Asia | 7 | 1.8% |
| Europe | 3 | 0.8% |
| Nepal | 7 | 1.8% |
| South Central Asia | 7 | 1.8% |
| Southern Europe | 3 | 0.8% |
| Spain | 3 | 0.8% | View All 6 Rows |
Sex and Age in Cayuga
Sex and Age in Cayuga
The most populous age groups in Cayuga are 55 to 59 Years (26 | 15.1%) for men and 15 to 19 Years (25 | 11.6%) for women.
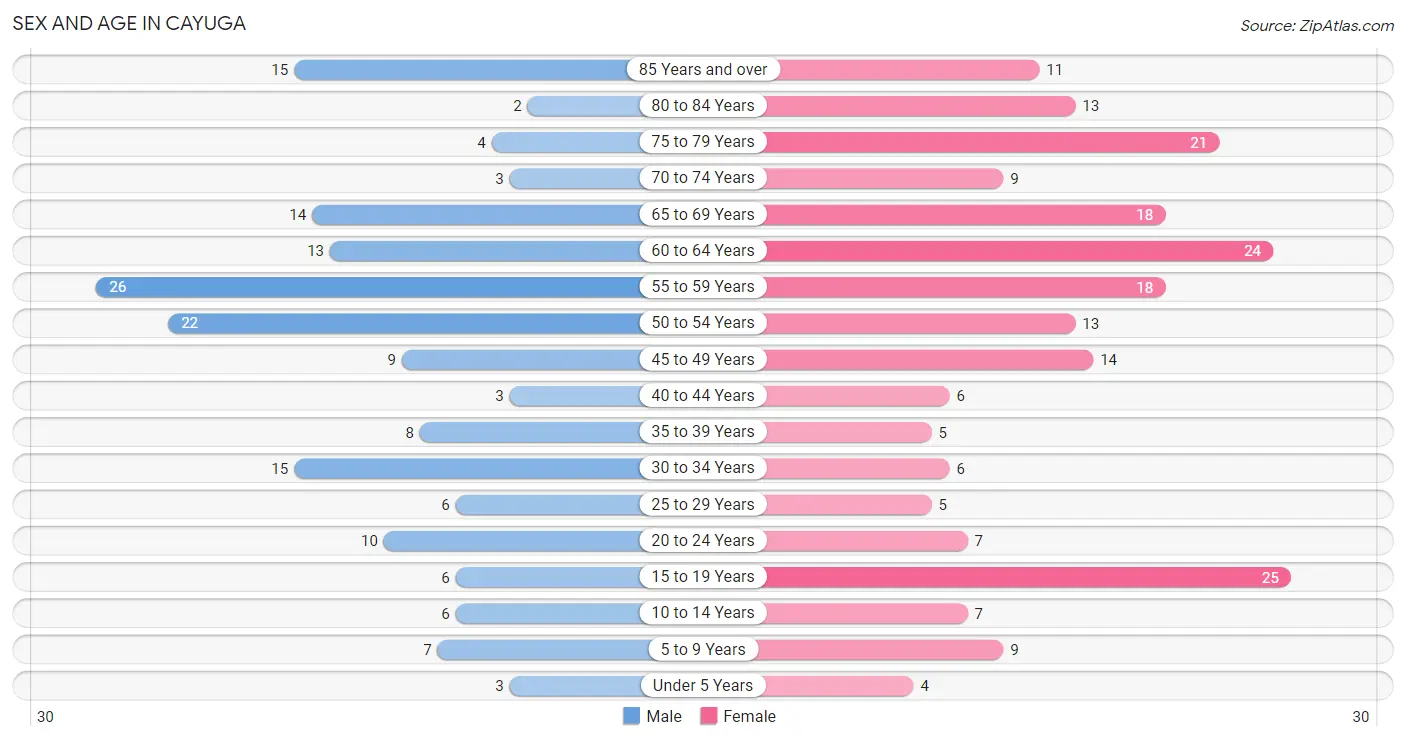
| Age Bracket | Male | Female |
| Under 5 Years | 3 (1.7%) | 4 (1.9%) |
| 5 to 9 Years | 7 (4.1%) | 9 (4.2%) |
| 10 to 14 Years | 6 (3.5%) | 7 (3.3%) |
| 15 to 19 Years | 6 (3.5%) | 25 (11.6%) |
| 20 to 24 Years | 10 (5.8%) | 7 (3.3%) |
| 25 to 29 Years | 6 (3.5%) | 5 (2.3%) |
| 30 to 34 Years | 15 (8.7%) | 6 (2.8%) |
| 35 to 39 Years | 8 (4.6%) | 5 (2.3%) |
| 40 to 44 Years | 3 (1.7%) | 6 (2.8%) |
| 45 to 49 Years | 9 (5.2%) | 14 (6.5%) |
| 50 to 54 Years | 22 (12.8%) | 13 (6.0%) |
| 55 to 59 Years | 26 (15.1%) | 18 (8.4%) |
| 60 to 64 Years | 13 (7.6%) | 24 (11.2%) |
| 65 to 69 Years | 14 (8.1%) | 18 (8.4%) |
| 70 to 74 Years | 3 (1.7%) | 9 (4.2%) |
| 75 to 79 Years | 4 (2.3%) | 21 (9.8%) |
| 80 to 84 Years | 2 (1.2%) | 13 (6.0%) |
| 85 Years and over | 15 (8.7%) | 11 (5.1%) |
| Total | 172 (100.0%) | 215 (100.0%) |
Families and Households in Cayuga
Median Family Size in Cayuga
The median family size in Cayuga is 2.70 persons per family, with married-couple families (86 | 82.7%) accounting for the largest median family size of 2.79 persons per family. On the other hand, single female/mother families (13 | 12.5%) represent the smallest median family size with 2.23 persons per family.
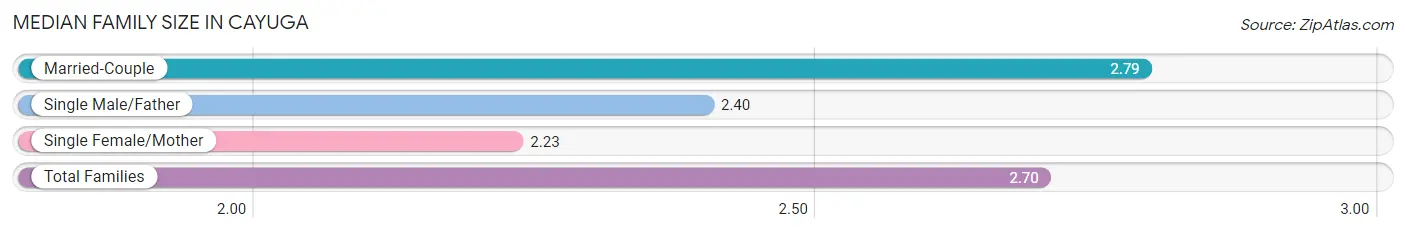
| Family Type | # Families | Family Size |
| Married-Couple | 86 (82.7%) | 2.79 |
| Single Male/Father | 5 (4.8%) | 2.40 |
| Single Female/Mother | 13 (12.5%) | 2.23 |
| Total Families | 104 (100.0%) | 2.70 |
Median Household Size in Cayuga
The median household size in Cayuga is 2.10 persons per household, with single male/father households (5 | 2.7%) accounting for the largest median household size of 3.6 persons per household. non-family households (80 | 43.5%) represent the smallest median household size with 1.20 persons per household.
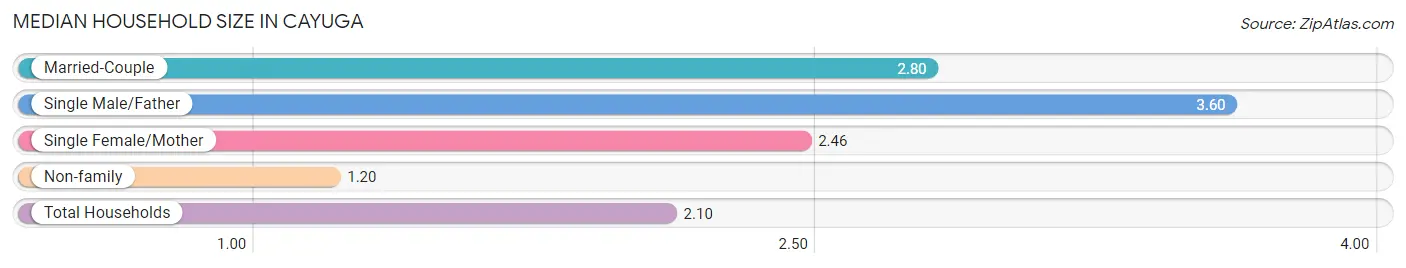
| Household Type | # Households | Household Size |
| Married-Couple | 86 (46.7%) | 2.80 |
| Single Male/Father | 5 (2.7%) | 3.60 |
| Single Female/Mother | 13 (7.1%) | 2.46 |
| Non-family | 80 (43.5%) | 1.20 |
| Total Households | 184 (100.0%) | 2.10 |
Household Size by Marriage Status in Cayuga
Out of a total of 184 households in Cayuga, 104 (56.5%) are family households, while 80 (43.5%) are nonfamily households. The most numerous type of family households are 2-person households, comprising 59, and the most common type of nonfamily households are 1-person households, comprising 61.
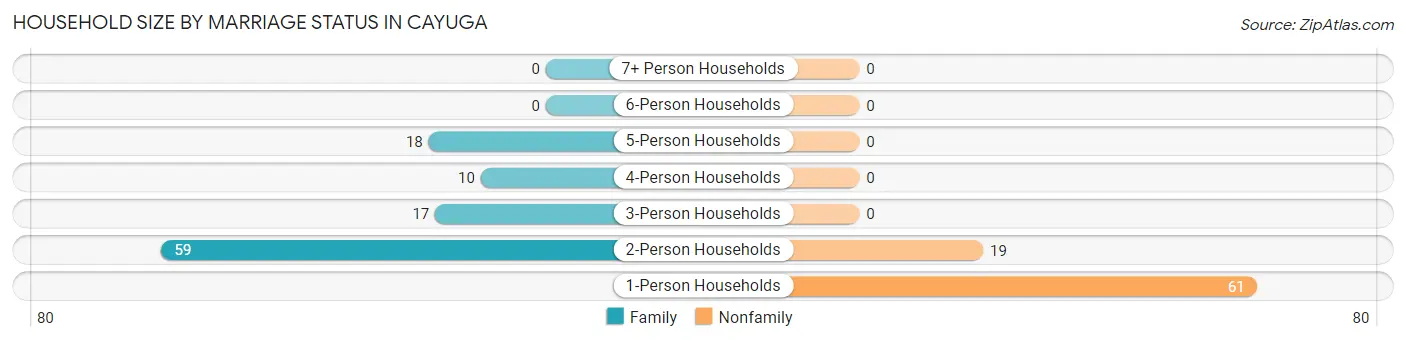
| Household Size | Family Households | Nonfamily Households |
| 1-Person Households | - | 61 (33.2%) |
| 2-Person Households | 59 (32.1%) | 19 (10.3%) |
| 3-Person Households | 17 (9.2%) | 0 (0.0%) |
| 4-Person Households | 10 (5.4%) | 0 (0.0%) |
| 5-Person Households | 18 (9.8%) | 0 (0.0%) |
| 6-Person Households | 0 (0.0%) | 0 (0.0%) |
| 7+ Person Households | 0 (0.0%) | 0 (0.0%) |
| Total | 104 (56.5%) | 80 (43.5%) |
Female Fertility in Cayuga
Fertility by Age in Cayuga
Average fertility rate in Cayuga is 14.0 births per 1,000 women. Women in the age bracket of 20 to 34 years have the highest fertility rate with 56.0 births per 1,000 women. Women in the age bracket of 20 to 34 years acount for 100.0% of all women with births.
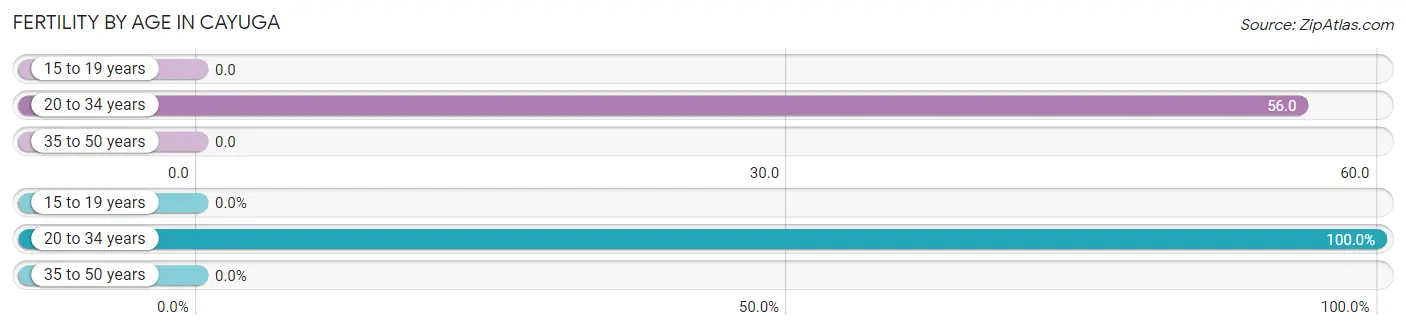
| Age Bracket | Women with Births | Births / 1,000 Women |
| 15 to 19 years | 0 (0.0%) | 0.0 |
| 20 to 34 years | 1 (100.0%) | 56.0 |
| 35 to 50 years | 0 (0.0%) | 0.0 |
| Total | 1 (100.0%) | 14.0 |
Fertility by Age by Marriage Status in Cayuga
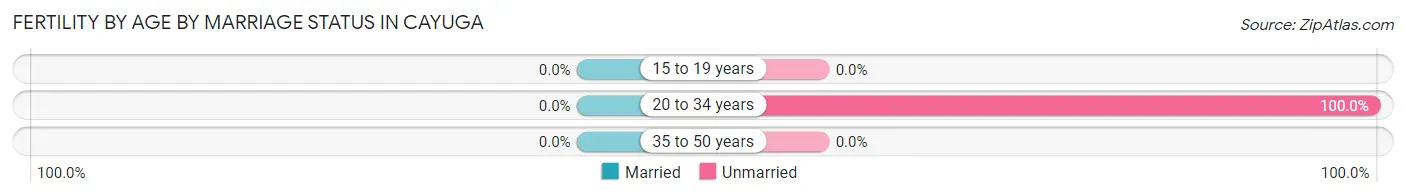
| Age Bracket | Married | Unmarried |
| 15 to 19 years | 0 (0.0%) | 0 (0.0%) |
| 20 to 34 years | 0 (0.0%) | 1 (100.0%) |
| 35 to 50 years | 0 (0.0%) | 0 (0.0%) |
| Total | 0 (0.0%) | 1 (100.0%) |
Fertility by Education in Cayuga
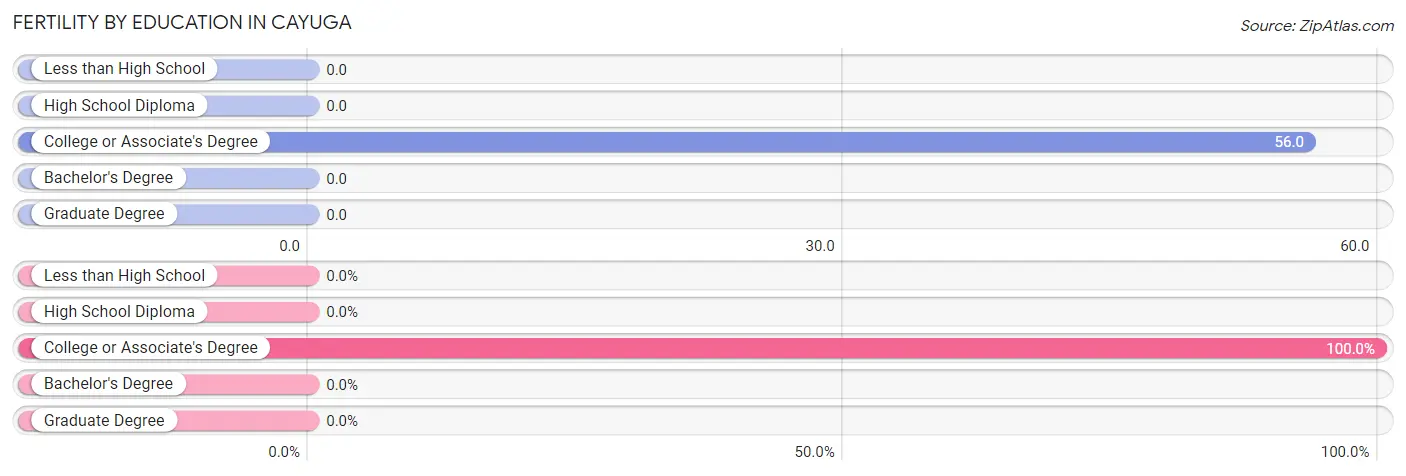
| Educational Attainment | Women with Births | Births / 1,000 Women |
| Less than High School | 0 (0.0%) | 0.0 |
| High School Diploma | 0 (0.0%) | 0.0 |
| College or Associate's Degree | 1 (100.0%) | 56.0 |
| Bachelor's Degree | 0 (0.0%) | 0.0 |
| Graduate Degree | 0 (0.0%) | 0.0 |
| Total | 1 (100.0%) | 14.0 |
Fertility by Education by Marriage Status in Cayuga
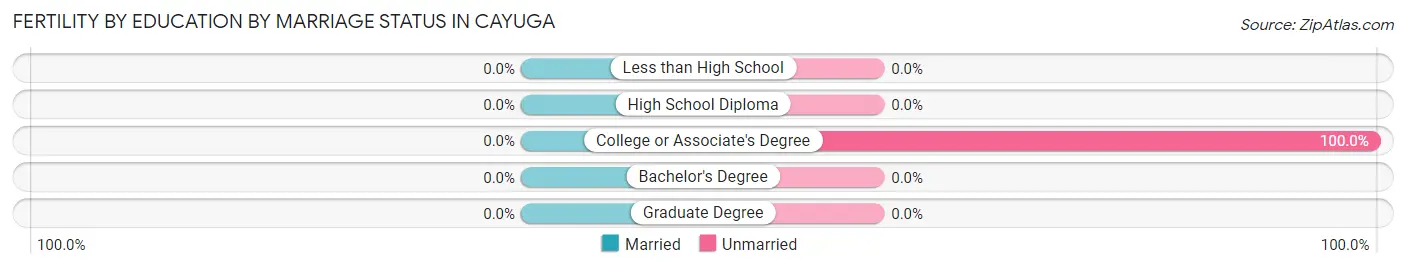
| Educational Attainment | Married | Unmarried |
| Less than High School | 0 (0.0%) | 0 (0.0%) |
| High School Diploma | 0 (0.0%) | 0 (0.0%) |
| College or Associate's Degree | 0 (0.0%) | 1 (100.0%) |
| Bachelor's Degree | 0 (0.0%) | 0 (0.0%) |
| Graduate Degree | 0 (0.0%) | 0 (0.0%) |
| Total | 0 (0.0%) | 1 (100.0%) |
Employment Characteristics in Cayuga
Employment by Class of Employer in Cayuga
Among the 226 employed individuals in Cayuga, private company employees (113 | 50.0%), local government employees (38 | 16.8%), and not-for-profit organizations (26 | 11.5%) make up the most common classes of employment.
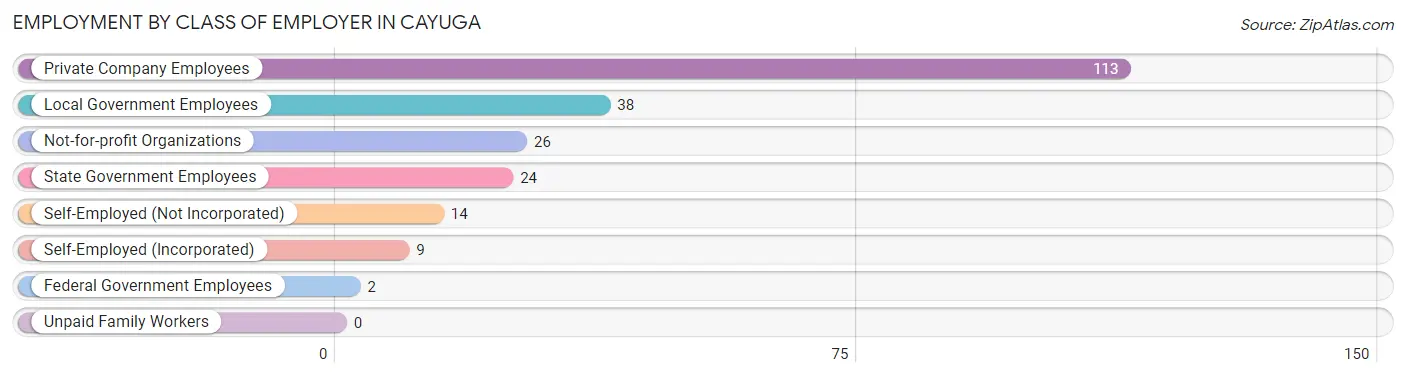
| Employer Class | # Employees | % Employees |
| Private Company Employees | 113 | 50.0% |
| Self-Employed (Incorporated) | 9 | 4.0% |
| Self-Employed (Not Incorporated) | 14 | 6.2% |
| Not-for-profit Organizations | 26 | 11.5% |
| Local Government Employees | 38 | 16.8% |
| State Government Employees | 24 | 10.6% |
| Federal Government Employees | 2 | 0.9% |
| Unpaid Family Workers | 0 | 0.0% |
| Total | 226 | 100.0% |
Employment Status by Age in Cayuga
According to the labor force statistics for Cayuga, out of the total population over 16 years of age (351), 65.5% or 230 individuals are in the labor force, with 0.9% or 2 of them unemployed. The age group with the highest labor force participation rate is 20 to 24 years, with 100.0% or 17 individuals in the labor force. Within the labor force, the 60 to 64 years age range has the highest percentage of unemployed individuals, with 10.0% or 2 of them being unemployed.
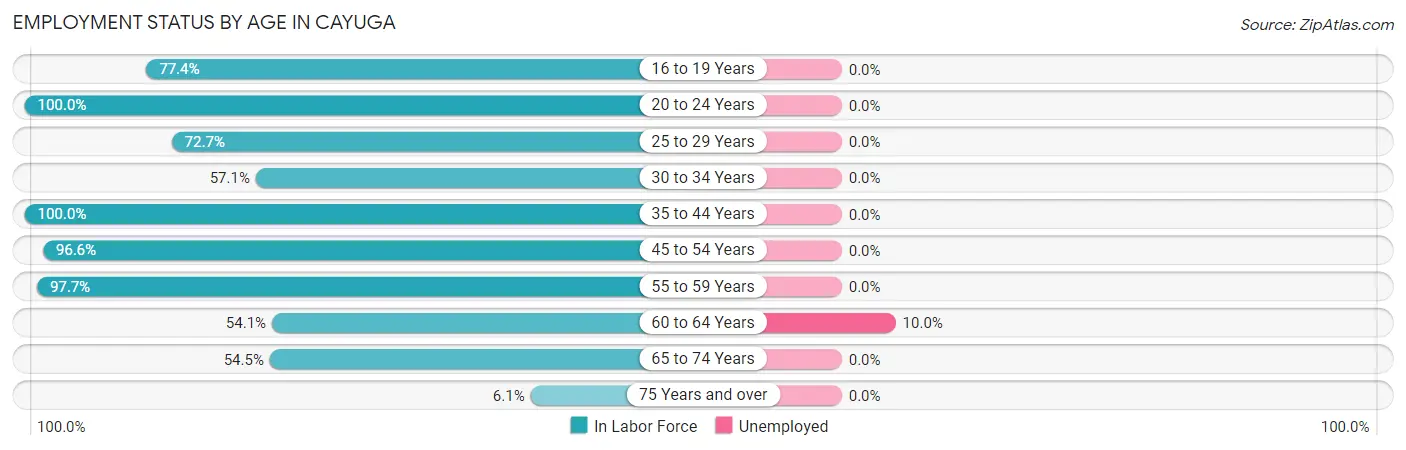
| Age Bracket | In Labor Force | Unemployed |
| 16 to 19 Years | 24 (77.4%) | 0 (0.0%) |
| 20 to 24 Years | 17 (100.0%) | 0 (0.0%) |
| 25 to 29 Years | 8 (72.7%) | 0 (0.0%) |
| 30 to 34 Years | 12 (57.1%) | 0 (0.0%) |
| 35 to 44 Years | 22 (100.0%) | 0 (0.0%) |
| 45 to 54 Years | 56 (96.6%) | 0 (0.0%) |
| 55 to 59 Years | 43 (97.7%) | 0 (0.0%) |
| 60 to 64 Years | 20 (54.1%) | 2 (10.0%) |
| 65 to 74 Years | 24 (54.5%) | 0 (0.0%) |
| 75 Years and over | 4 (6.1%) | 0 (0.0%) |
| Total | 230 (65.5%) | 2 (0.9%) |
Employment Status by Educational Attainment in Cayuga
According to labor force statistics for Cayuga, 83.4% of individuals (161) out of the total population between 25 and 64 years of age (193) are in the labor force, with 1.2% or 2 of them being unemployed. The group with the highest labor force participation rate are those with the educational attainment of bachelor's degree or higher, with 98.2% or 55 individuals in the labor force. Within the labor force, individuals with college / associate degree education have the highest percentage of unemployment, with 3.5% or 2 of them being unemployed.
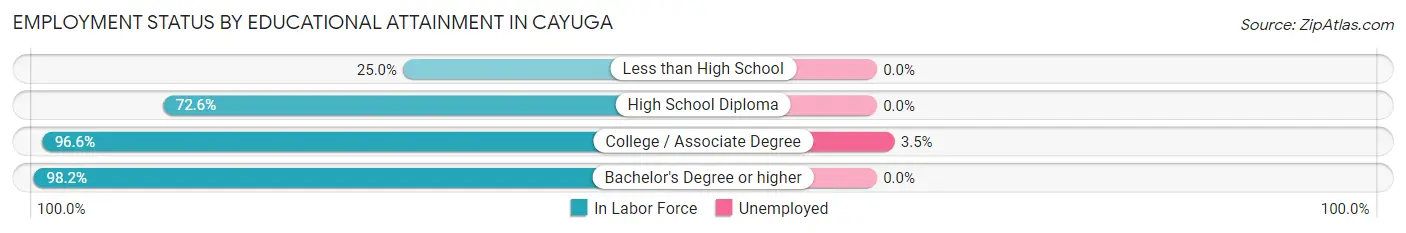
| Educational Attainment | In Labor Force | Unemployed |
| Less than High School | 4 (25.0%) | 0 (0.0%) |
| High School Diploma | 45 (72.6%) | 0 (0.0%) |
| College / Associate Degree | 57 (96.6%) | 2 (3.5%) |
| Bachelor's Degree or higher | 55 (98.2%) | 0 (0.0%) |
| Total | 161 (83.4%) | 2 (1.2%) |
Employment Occupations by Sex in Cayuga
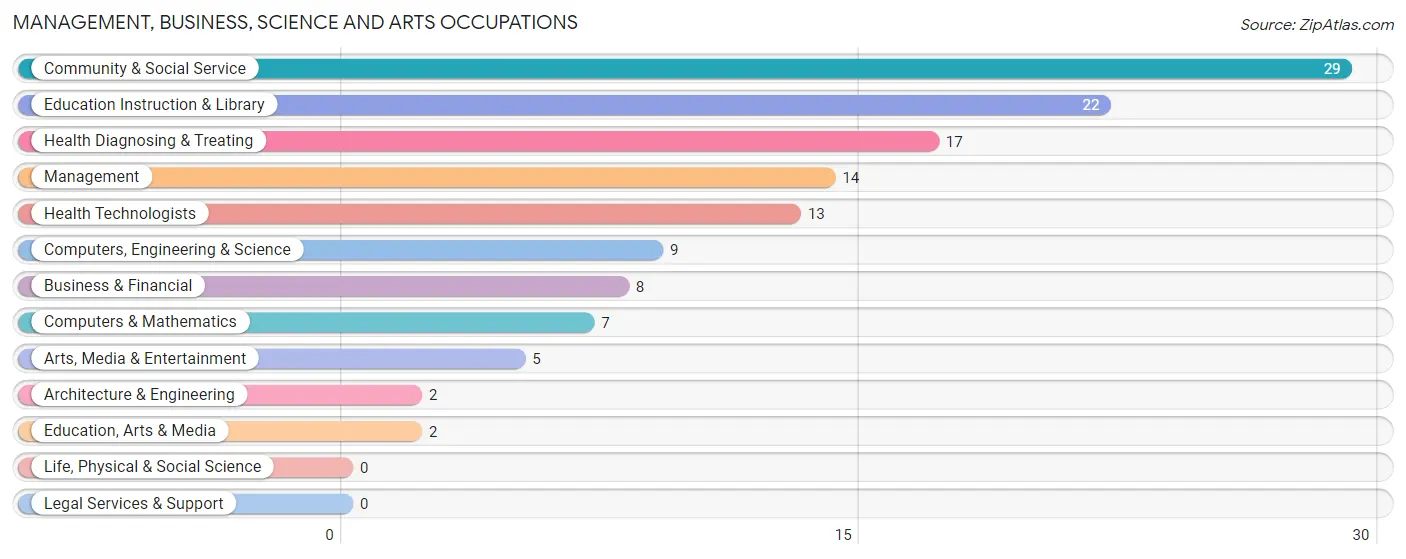
Management, Business, Science and Arts Occupations
The most common Management, Business, Science and Arts occupations in Cayuga are Community & Social Service (29 | 12.7%), Education Instruction & Library (22 | 9.7%), Health Diagnosing & Treating (17 | 7.5%), Management (14 | 6.1%), and Health Technologists (13 | 5.7%).
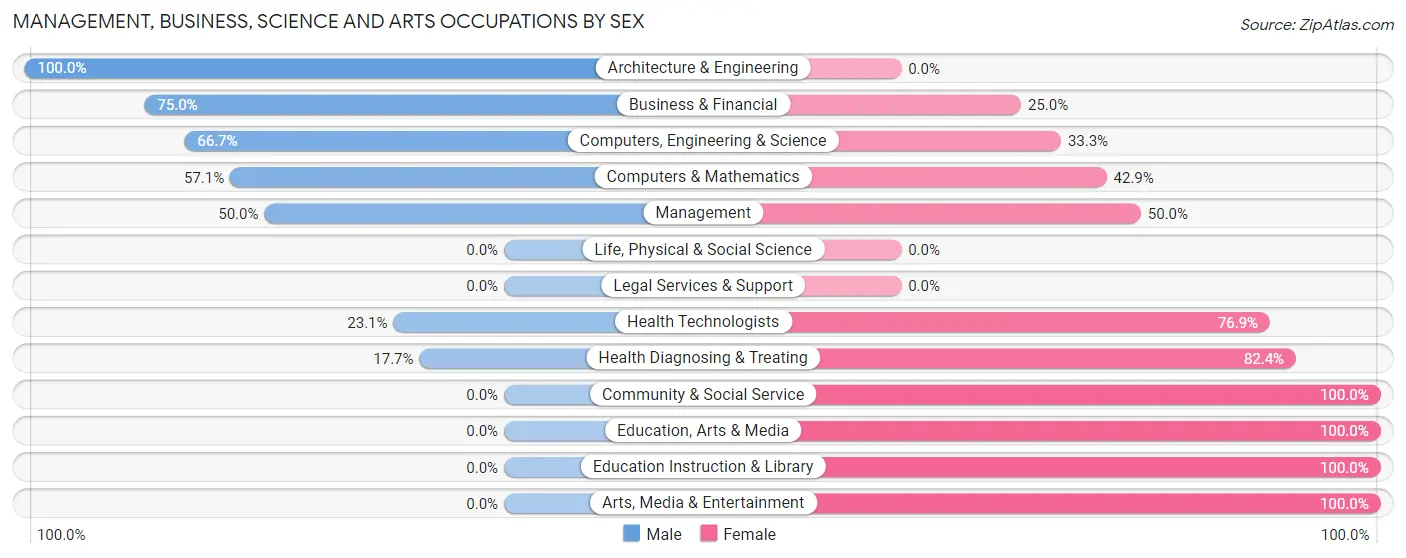
Management, Business, Science and Arts Occupations by Sex
Within the Management, Business, Science and Arts occupations in Cayuga, the most male-oriented occupations are Architecture & Engineering (100.0%), Business & Financial (75.0%), and Computers, Engineering & Science (66.7%), while the most female-oriented occupations are Community & Social Service (100.0%), Education, Arts & Media (100.0%), and Education Instruction & Library (100.0%).
| Occupation | Male | Female |
| Management | 7 (50.0%) | 7 (50.0%) |
| Business & Financial | 6 (75.0%) | 2 (25.0%) |
| Computers, Engineering & Science | 6 (66.7%) | 3 (33.3%) |
| Computers & Mathematics | 4 (57.1%) | 3 (42.9%) |
| Architecture & Engineering | 2 (100.0%) | 0 (0.0%) |
| Life, Physical & Social Science | 0 (0.0%) | 0 (0.0%) |
| Community & Social Service | 0 (0.0%) | 29 (100.0%) |
| Education, Arts & Media | 0 (0.0%) | 2 (100.0%) |
| Legal Services & Support | 0 (0.0%) | 0 (0.0%) |
| Education Instruction & Library | 0 (0.0%) | 22 (100.0%) |
| Arts, Media & Entertainment | 0 (0.0%) | 5 (100.0%) |
| Health Diagnosing & Treating | 3 (17.6%) | 14 (82.4%) |
| Health Technologists | 3 (23.1%) | 10 (76.9%) |
| Total (Category) | 22 (28.6%) | 55 (71.4%) |
| Total (Overall) | 111 (48.7%) | 117 (51.3%) |
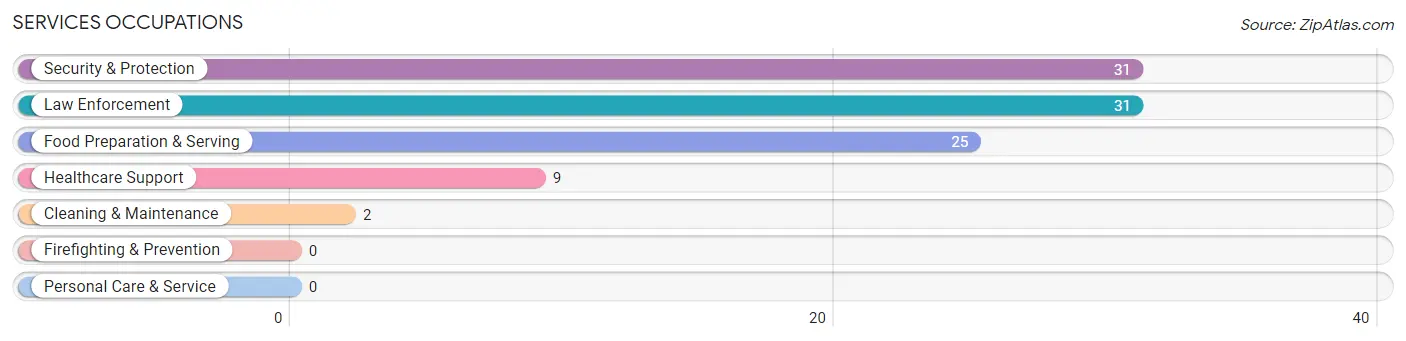
Services Occupations
The most common Services occupations in Cayuga are Security & Protection (31 | 13.6%), Law Enforcement (31 | 13.6%), Food Preparation & Serving (25 | 11.0%), Healthcare Support (9 | 4.0%), and Cleaning & Maintenance (2 | 0.9%).
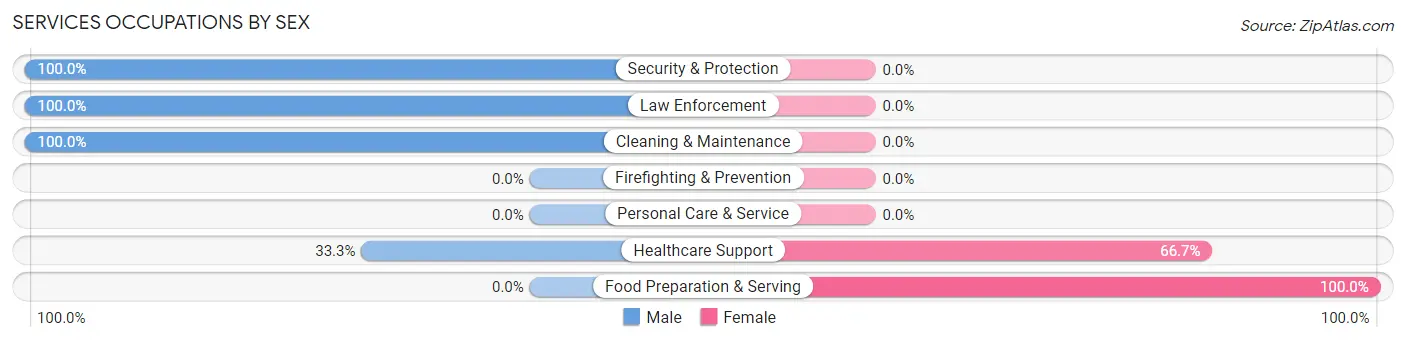
Services Occupations by Sex
Within the Services occupations in Cayuga, the most male-oriented occupations are Security & Protection (100.0%), Law Enforcement (100.0%), and Cleaning & Maintenance (100.0%), while the most female-oriented occupations are Food Preparation & Serving (100.0%), and Healthcare Support (66.7%).
| Occupation | Male | Female |
| Healthcare Support | 3 (33.3%) | 6 (66.7%) |
| Security & Protection | 31 (100.0%) | 0 (0.0%) |
| Firefighting & Prevention | 0 (0.0%) | 0 (0.0%) |
| Law Enforcement | 31 (100.0%) | 0 (0.0%) |
| Food Preparation & Serving | 0 (0.0%) | 25 (100.0%) |
| Cleaning & Maintenance | 2 (100.0%) | 0 (0.0%) |
| Personal Care & Service | 0 (0.0%) | 0 (0.0%) |
| Total (Category) | 36 (53.7%) | 31 (46.3%) |
| Total (Overall) | 111 (48.7%) | 117 (51.3%) |
Sales and Office Occupations
The most common Sales and Office occupations in Cayuga are Office & Administration (46 | 20.2%), and Sales & Related (6 | 2.6%).
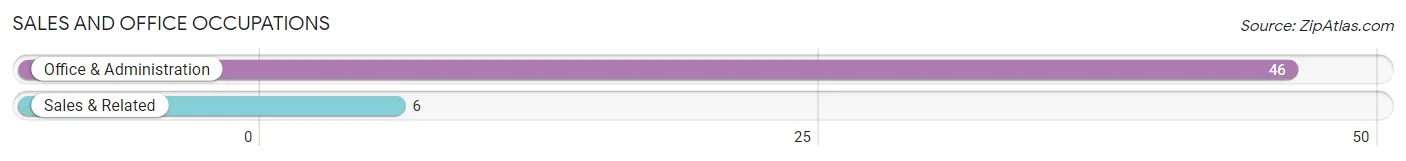
Sales and Office Occupations by Sex

| Occupation | Male | Female |
| Sales & Related | 5 (83.3%) | 1 (16.7%) |
| Office & Administration | 19 (41.3%) | 27 (58.7%) |
| Total (Category) | 24 (46.2%) | 28 (53.8%) |
| Total (Overall) | 111 (48.7%) | 117 (51.3%) |
Natural Resources, Construction and Maintenance Occupations
The most common Natural Resources, Construction and Maintenance occupations in Cayuga are , and Construction & Extraction (1 | 0.4%).
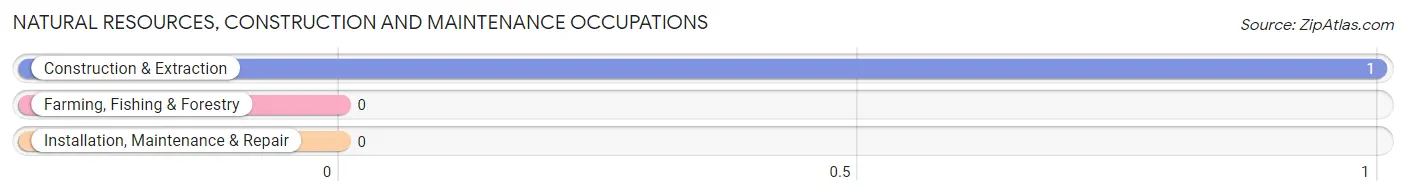
Natural Resources, Construction and Maintenance Occupations by Sex
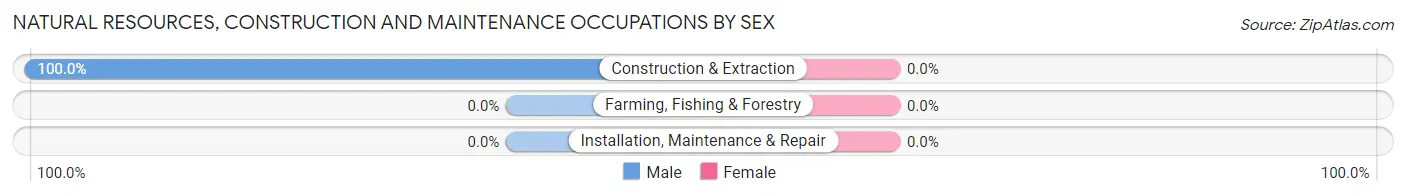
| Occupation | Male | Female |
| Farming, Fishing & Forestry | 0 (0.0%) | 0 (0.0%) |
| Construction & Extraction | 1 (100.0%) | 0 (0.0%) |
| Installation, Maintenance & Repair | 0 (0.0%) | 0 (0.0%) |
| Total (Category) | 1 (100.0%) | 0 (0.0%) |
| Total (Overall) | 111 (48.7%) | 117 (51.3%) |
Production, Transportation and Moving Occupations
The most common Production, Transportation and Moving occupations in Cayuga are Material Moving (16 | 7.0%), Production (12 | 5.3%), and Transportation (3 | 1.3%).
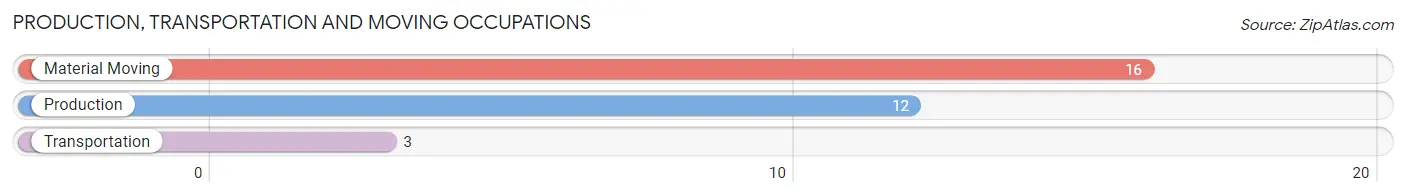
Production, Transportation and Moving Occupations by Sex
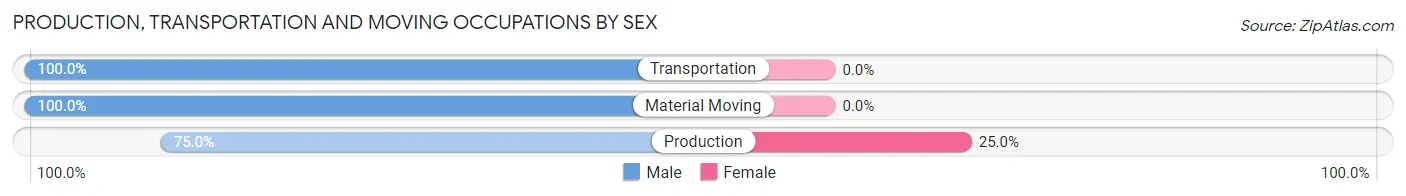
| Occupation | Male | Female |
| Production | 9 (75.0%) | 3 (25.0%) |
| Transportation | 3 (100.0%) | 0 (0.0%) |
| Material Moving | 16 (100.0%) | 0 (0.0%) |
| Total (Category) | 28 (90.3%) | 3 (9.7%) |
| Total (Overall) | 111 (48.7%) | 117 (51.3%) |
Employment Industries by Sex in Cayuga
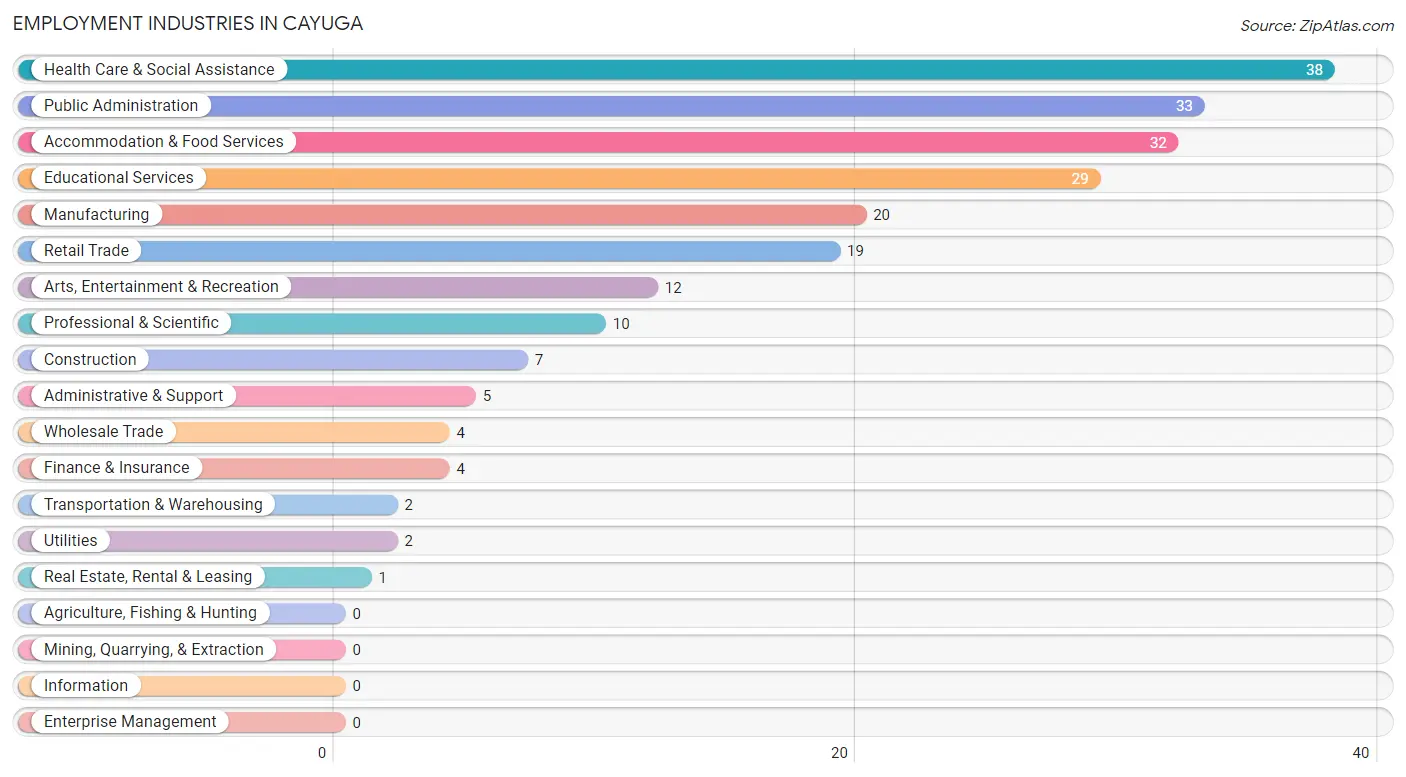
Employment Industries in Cayuga
The major employment industries in Cayuga include Health Care & Social Assistance (38 | 16.7%), Public Administration (33 | 14.5%), Accommodation & Food Services (32 | 14.0%), Educational Services (29 | 12.7%), and Manufacturing (20 | 8.8%).
Employment Industries by Sex in Cayuga
The Cayuga industries that see more men than women are Construction (100.0%), Wholesale Trade (100.0%), and Utilities (100.0%), whereas the industries that tend to have a higher number of women are Transportation & Warehousing (100.0%), Finance & Insurance (100.0%), and Educational Services (100.0%).
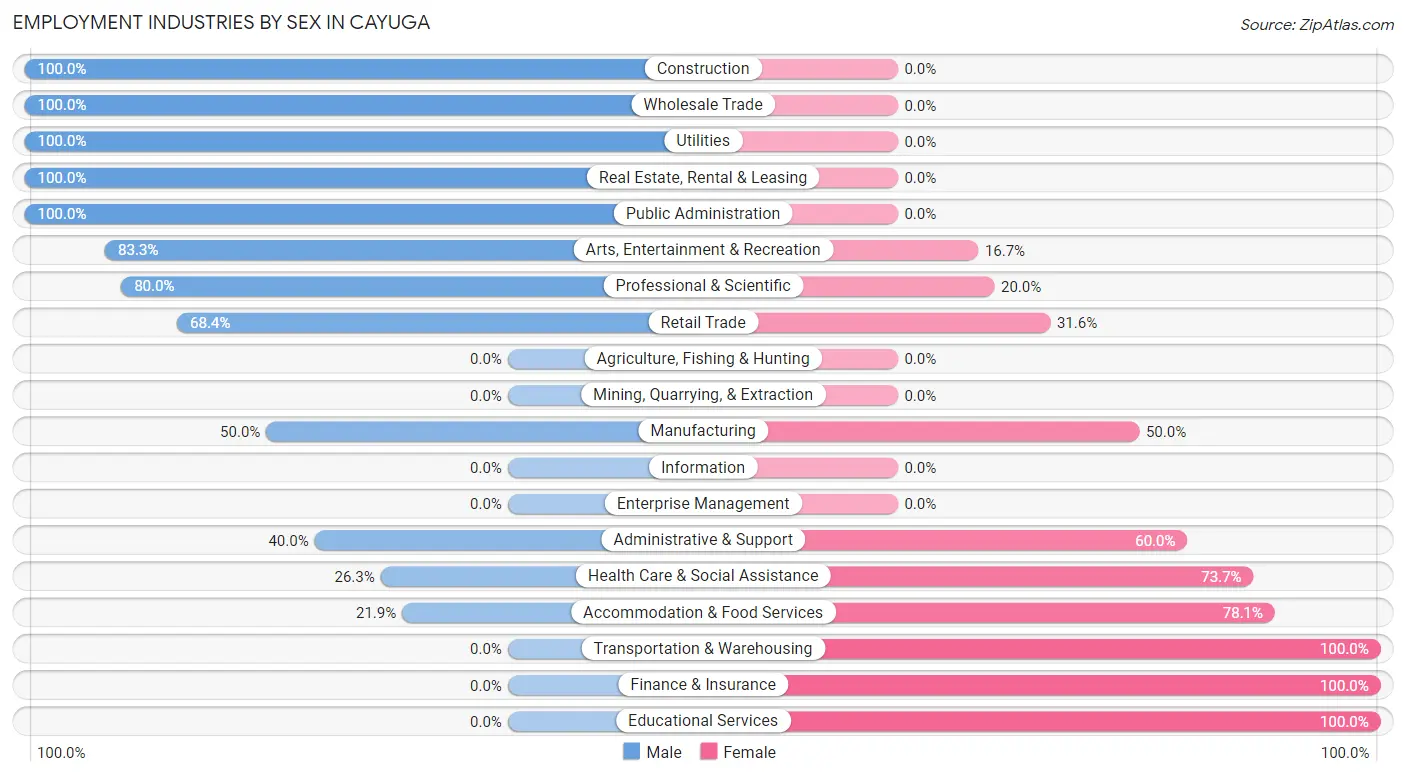
| Industry | Male | Female |
| Agriculture, Fishing & Hunting | 0 (0.0%) | 0 (0.0%) |
| Mining, Quarrying, & Extraction | 0 (0.0%) | 0 (0.0%) |
| Construction | 7 (100.0%) | 0 (0.0%) |
| Manufacturing | 10 (50.0%) | 10 (50.0%) |
| Wholesale Trade | 4 (100.0%) | 0 (0.0%) |
| Retail Trade | 13 (68.4%) | 6 (31.6%) |
| Transportation & Warehousing | 0 (0.0%) | 2 (100.0%) |
| Utilities | 2 (100.0%) | 0 (0.0%) |
| Information | 0 (0.0%) | 0 (0.0%) |
| Finance & Insurance | 0 (0.0%) | 4 (100.0%) |
| Real Estate, Rental & Leasing | 1 (100.0%) | 0 (0.0%) |
| Professional & Scientific | 8 (80.0%) | 2 (20.0%) |
| Enterprise Management | 0 (0.0%) | 0 (0.0%) |
| Administrative & Support | 2 (40.0%) | 3 (60.0%) |
| Educational Services | 0 (0.0%) | 29 (100.0%) |
| Health Care & Social Assistance | 10 (26.3%) | 28 (73.7%) |
| Arts, Entertainment & Recreation | 10 (83.3%) | 2 (16.7%) |
| Accommodation & Food Services | 7 (21.9%) | 25 (78.1%) |
| Public Administration | 33 (100.0%) | 0 (0.0%) |
| Total | 111 (48.7%) | 117 (51.3%) |
Education in Cayuga
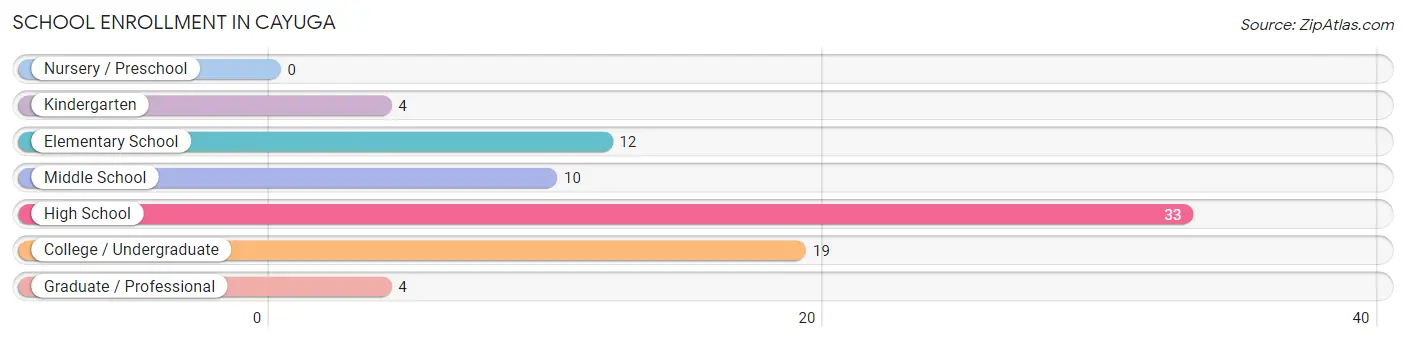
School Enrollment in Cayuga
The most common levels of schooling among the 82 students in Cayuga are high school (33 | 40.2%), college / undergraduate (19 | 23.2%), and elementary school (12 | 14.6%).
| School Level | # Students | % Students |
| Nursery / Preschool | 0 | 0.0% |
| Kindergarten | 4 | 4.9% |
| Elementary School | 12 | 14.6% |
| Middle School | 10 | 12.2% |
| High School | 33 | 40.2% |
| College / Undergraduate | 19 | 23.2% |
| Graduate / Professional | 4 | 4.9% |
| Total | 82 | 100.0% |
School Enrollment by Age by Funding Source in Cayuga
Out of a total of 82 students who are enrolled in schools in Cayuga, 2 (2.4%) attend a private institution, while the remaining 80 (97.6%) are enrolled in public schools. The age group of 25 to 34 year olds has the highest likelihood of being enrolled in private schools, with 2 (33.3% in the age bracket) enrolled. Conversely, the age group of 5 to 9 year old has the lowest likelihood of being enrolled in a private school, with 15 (100.0% in the age bracket) attending a public institution.
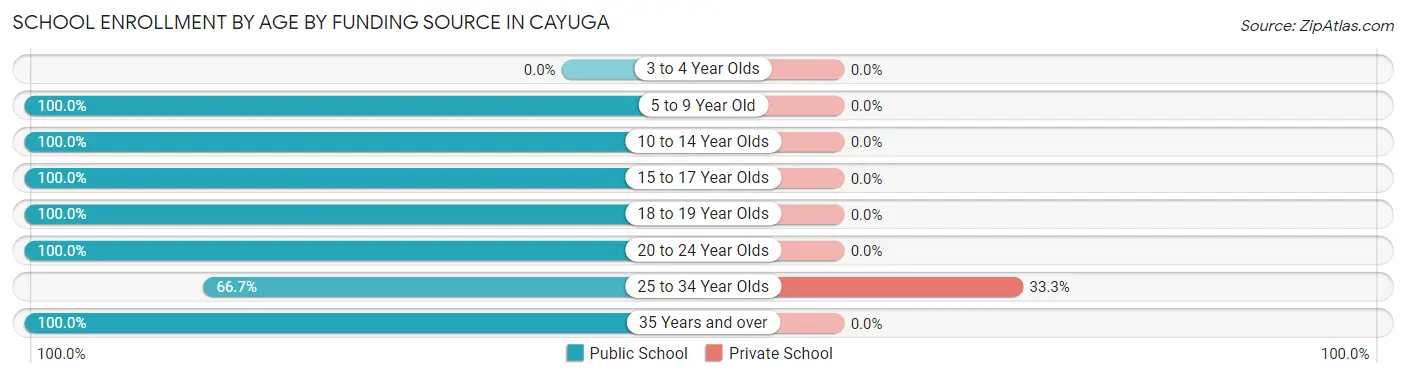
| Age Bracket | Public School | Private School |
| 3 to 4 Year Olds | 0 (0.0%) | 0 (0.0%) |
| 5 to 9 Year Old | 15 (100.0%) | 0 (0.0%) |
| 10 to 14 Year Olds | 13 (100.0%) | 0 (0.0%) |
| 15 to 17 Year Olds | 26 (100.0%) | 0 (0.0%) |
| 18 to 19 Year Olds | 5 (100.0%) | 0 (0.0%) |
| 20 to 24 Year Olds | 4 (100.0%) | 0 (0.0%) |
| 25 to 34 Year Olds | 4 (66.7%) | 2 (33.3%) |
| 35 Years and over | 13 (100.0%) | 0 (0.0%) |
| Total | 80 (97.6%) | 2 (2.4%) |
Educational Attainment by Field of Study in Cayuga
Education (31 | 42.5%), science & technology (8 | 11.0%), business (6 | 8.2%), liberal arts & history (5 | 6.9%), and bio, nature & agricultural (3 | 4.1%) are the most common fields of study among 73 individuals in Cayuga who have obtained a bachelor's degree or higher.
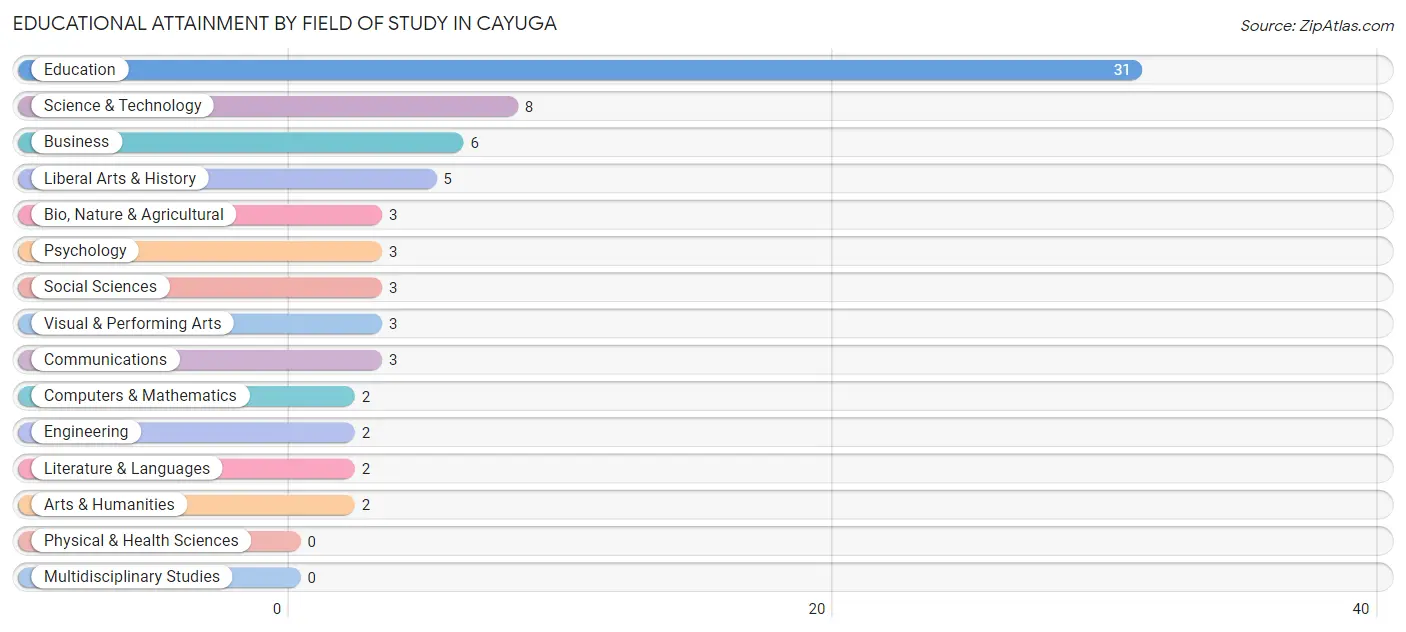
| Field of Study | # Graduates | % Graduates |
| Computers & Mathematics | 2 | 2.7% |
| Bio, Nature & Agricultural | 3 | 4.1% |
| Physical & Health Sciences | 0 | 0.0% |
| Psychology | 3 | 4.1% |
| Social Sciences | 3 | 4.1% |
| Engineering | 2 | 2.7% |
| Multidisciplinary Studies | 0 | 0.0% |
| Science & Technology | 8 | 11.0% |
| Business | 6 | 8.2% |
| Education | 31 | 42.5% |
| Literature & Languages | 2 | 2.7% |
| Liberal Arts & History | 5 | 6.9% |
| Visual & Performing Arts | 3 | 4.1% |
| Communications | 3 | 4.1% |
| Arts & Humanities | 2 | 2.7% |
| Total | 73 | 100.0% |
Transportation & Commute in Cayuga
Vehicle Availability by Sex in Cayuga
The most prevalent vehicle ownership categories in Cayuga are males with 2 vehicles (57, accounting for 51.3%) and females with 2 vehicles (64, making up 49.6%).
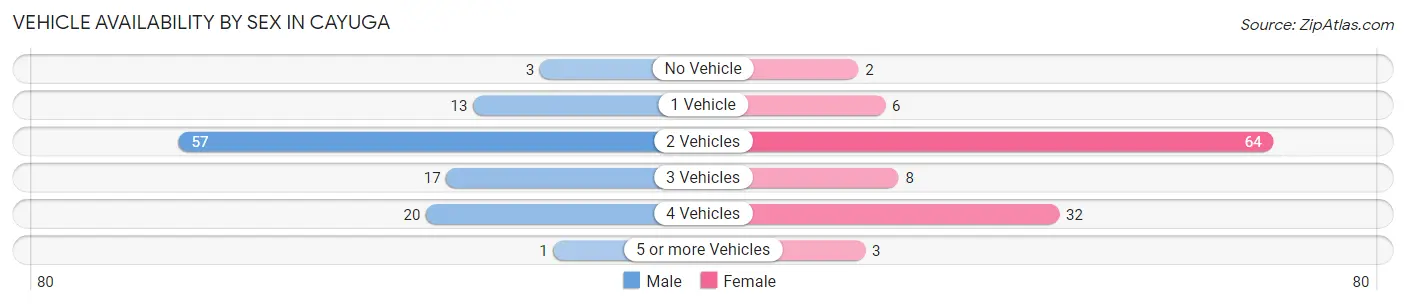
| Vehicles Available | Male | Female |
| No Vehicle | 3 (2.7%) | 2 (1.7%) |
| 1 Vehicle | 13 (11.7%) | 6 (5.2%) |
| 2 Vehicles | 57 (51.3%) | 64 (55.6%) |
| 3 Vehicles | 17 (15.3%) | 8 (7.0%) |
| 4 Vehicles | 20 (18.0%) | 32 (27.8%) |
| 5 or more Vehicles | 1 (0.9%) | 3 (2.6%) |
| Total | 111 (100.0%) | 115 (100.0%) |
Commute Time in Cayuga
The most frequently occuring commute durations in Cayuga are 10 to 14 minutes (62 commuters, 28.6%), 15 to 19 minutes (52 commuters, 24.0%), and 20 to 24 minutes (35 commuters, 16.1%).
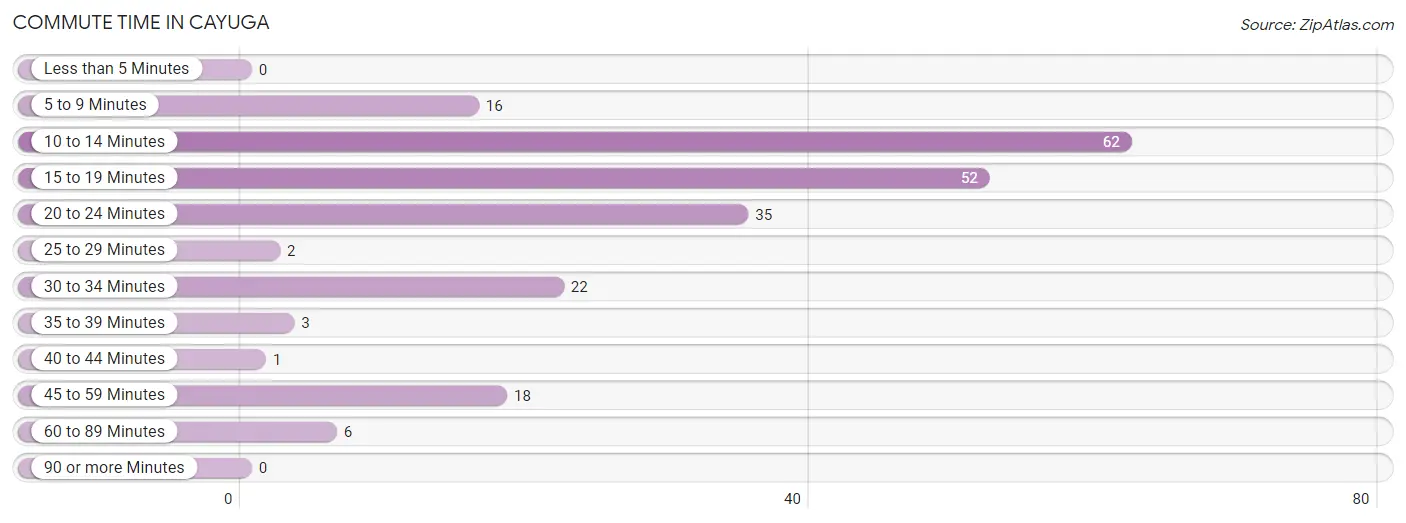
| Commute Time | # Commuters | % Commuters |
| Less than 5 Minutes | 0 | 0.0% |
| 5 to 9 Minutes | 16 | 7.4% |
| 10 to 14 Minutes | 62 | 28.6% |
| 15 to 19 Minutes | 52 | 24.0% |
| 20 to 24 Minutes | 35 | 16.1% |
| 25 to 29 Minutes | 2 | 0.9% |
| 30 to 34 Minutes | 22 | 10.1% |
| 35 to 39 Minutes | 3 | 1.4% |
| 40 to 44 Minutes | 1 | 0.5% |
| 45 to 59 Minutes | 18 | 8.3% |
| 60 to 89 Minutes | 6 | 2.8% |
| 90 or more Minutes | 0 | 0.0% |
Commute Time by Sex in Cayuga
The most common commute times in Cayuga are 15 to 19 minutes (33 commuters, 30.0%) for males and 10 to 14 minutes (41 commuters, 38.3%) for females.
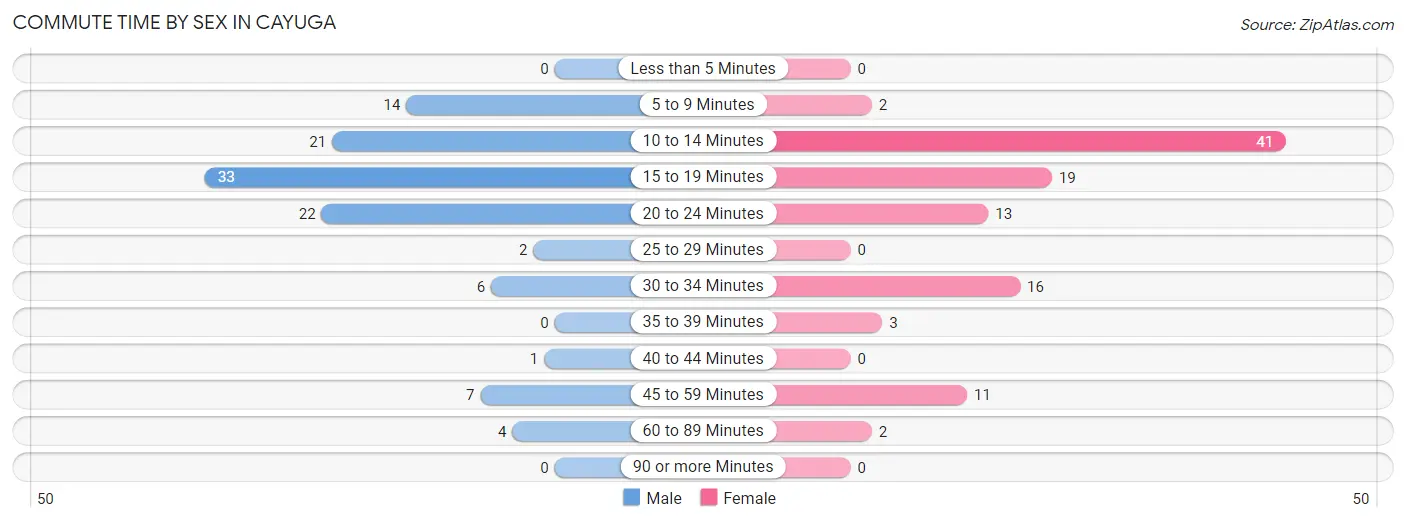
| Commute Time | Male | Female |
| Less than 5 Minutes | 0 (0.0%) | 0 (0.0%) |
| 5 to 9 Minutes | 14 (12.7%) | 2 (1.9%) |
| 10 to 14 Minutes | 21 (19.1%) | 41 (38.3%) |
| 15 to 19 Minutes | 33 (30.0%) | 19 (17.8%) |
| 20 to 24 Minutes | 22 (20.0%) | 13 (12.1%) |
| 25 to 29 Minutes | 2 (1.8%) | 0 (0.0%) |
| 30 to 34 Minutes | 6 (5.4%) | 16 (14.9%) |
| 35 to 39 Minutes | 0 (0.0%) | 3 (2.8%) |
| 40 to 44 Minutes | 1 (0.9%) | 0 (0.0%) |
| 45 to 59 Minutes | 7 (6.4%) | 11 (10.3%) |
| 60 to 89 Minutes | 4 (3.6%) | 2 (1.9%) |
| 90 or more Minutes | 0 (0.0%) | 0 (0.0%) |
Time of Departure to Work by Sex in Cayuga
The most frequent times of departure to work in Cayuga are 8:00 AM to 8:29 AM (23, 20.9%) for males and 4:00 PM to 11:59 PM (27, 25.2%) for females.
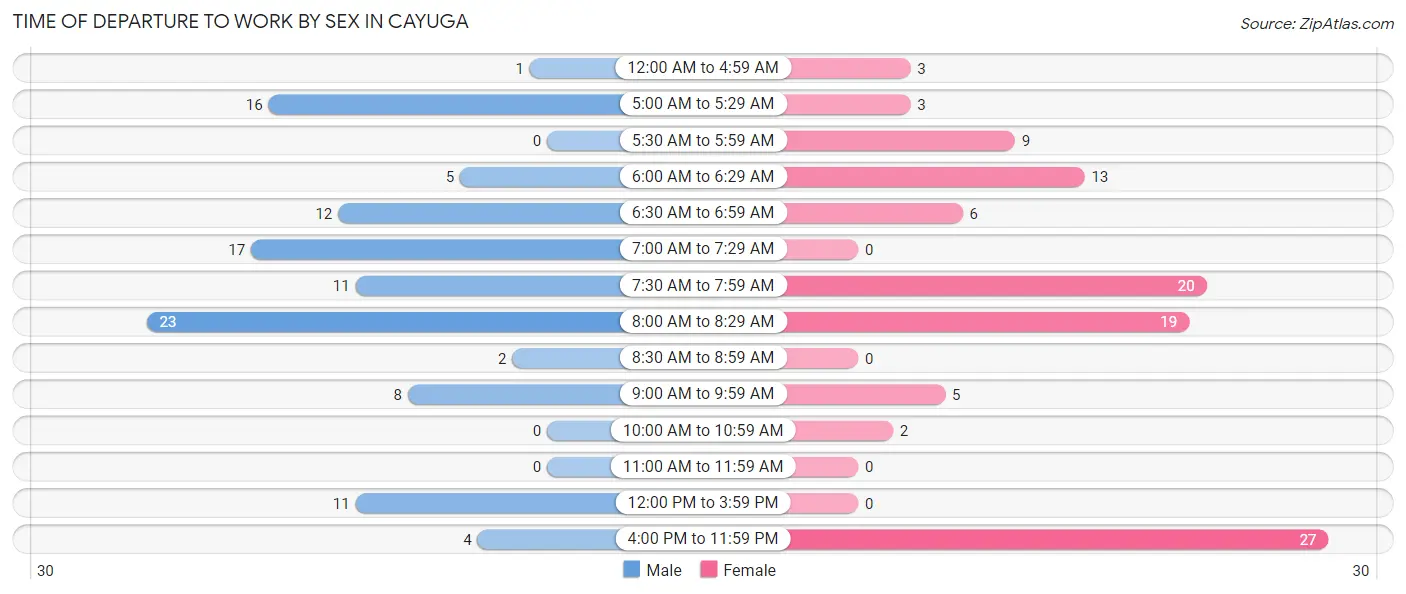
| Time of Departure | Male | Female |
| 12:00 AM to 4:59 AM | 1 (0.9%) | 3 (2.8%) |
| 5:00 AM to 5:29 AM | 16 (14.5%) | 3 (2.8%) |
| 5:30 AM to 5:59 AM | 0 (0.0%) | 9 (8.4%) |
| 6:00 AM to 6:29 AM | 5 (4.5%) | 13 (12.1%) |
| 6:30 AM to 6:59 AM | 12 (10.9%) | 6 (5.6%) |
| 7:00 AM to 7:29 AM | 17 (15.4%) | 0 (0.0%) |
| 7:30 AM to 7:59 AM | 11 (10.0%) | 20 (18.7%) |
| 8:00 AM to 8:29 AM | 23 (20.9%) | 19 (17.8%) |
| 8:30 AM to 8:59 AM | 2 (1.8%) | 0 (0.0%) |
| 9:00 AM to 9:59 AM | 8 (7.3%) | 5 (4.7%) |
| 10:00 AM to 10:59 AM | 0 (0.0%) | 2 (1.9%) |
| 11:00 AM to 11:59 AM | 0 (0.0%) | 0 (0.0%) |
| 12:00 PM to 3:59 PM | 11 (10.0%) | 0 (0.0%) |
| 4:00 PM to 11:59 PM | 4 (3.6%) | 27 (25.2%) |
| Total | 110 (100.0%) | 107 (100.0%) |
Housing Occupancy in Cayuga
Occupancy by Ownership in Cayuga
Of the total 184 dwellings in Cayuga, owner-occupied units account for 147 (79.9%), while renter-occupied units make up 37 (20.1%).
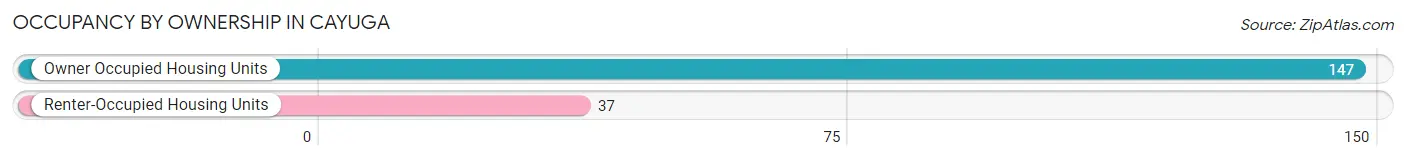
| Occupancy | # Housing Units | % Housing Units |
| Owner Occupied Housing Units | 147 | 79.9% |
| Renter-Occupied Housing Units | 37 | 20.1% |
| Total Occupied Housing Units | 184 | 100.0% |
Occupancy by Household Size in Cayuga
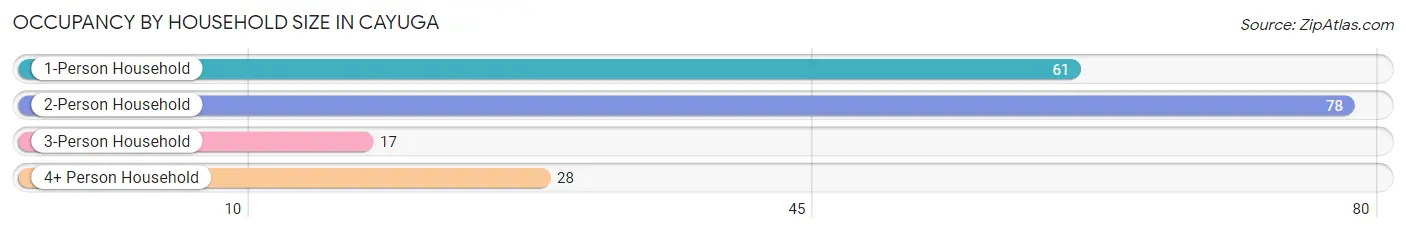
| Household Size | # Housing Units | % Housing Units |
| 1-Person Household | 61 | 33.2% |
| 2-Person Household | 78 | 42.4% |
| 3-Person Household | 17 | 9.2% |
| 4+ Person Household | 28 | 15.2% |
| Total Housing Units | 184 | 100.0% |
Occupancy by Ownership by Household Size in Cayuga
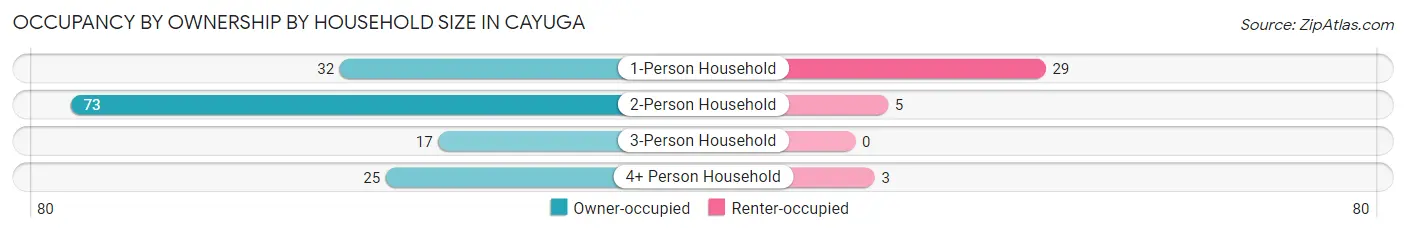
| Household Size | Owner-occupied | Renter-occupied |
| 1-Person Household | 32 (52.5%) | 29 (47.5%) |
| 2-Person Household | 73 (93.6%) | 5 (6.4%) |
| 3-Person Household | 17 (100.0%) | 0 (0.0%) |
| 4+ Person Household | 25 (89.3%) | 3 (10.7%) |
| Total Housing Units | 147 (79.9%) | 37 (20.1%) |
Occupancy by Educational Attainment in Cayuga
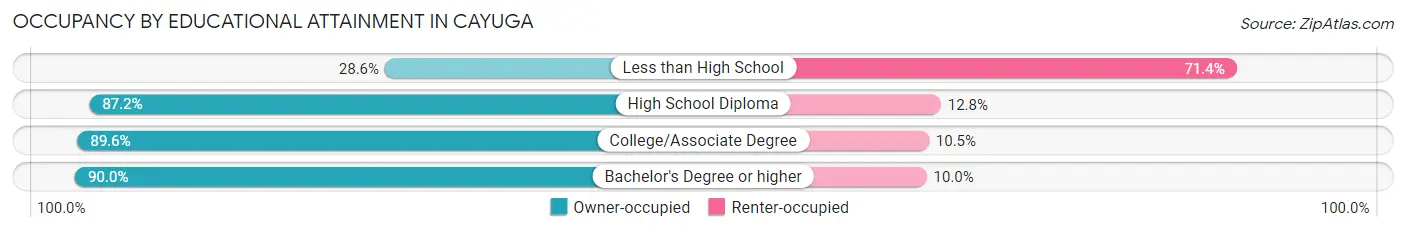
| Household Size | Owner-occupied | Renter-occupied |
| Less than High School | 8 (28.6%) | 20 (71.4%) |
| High School Diploma | 34 (87.2%) | 5 (12.8%) |
| College/Associate Degree | 60 (89.5%) | 7 (10.4%) |
| Bachelor's Degree or higher | 45 (90.0%) | 5 (10.0%) |
Occupancy by Age of Householder in Cayuga
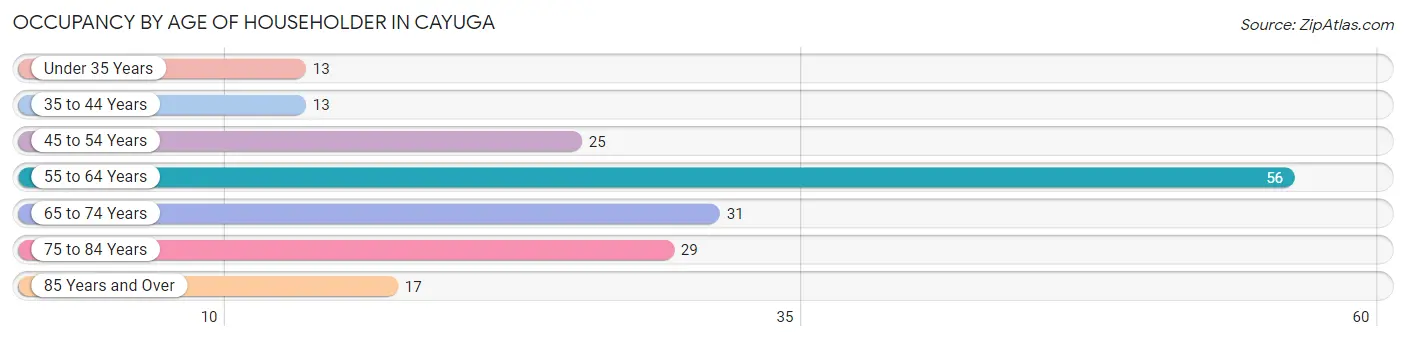
| Age Bracket | # Households | % Households |
| Under 35 Years | 13 | 7.1% |
| 35 to 44 Years | 13 | 7.1% |
| 45 to 54 Years | 25 | 13.6% |
| 55 to 64 Years | 56 | 30.4% |
| 65 to 74 Years | 31 | 16.9% |
| 75 to 84 Years | 29 | 15.8% |
| 85 Years and Over | 17 | 9.2% |
| Total | 184 | 100.0% |
Housing Finances in Cayuga
Median Income by Occupancy in Cayuga
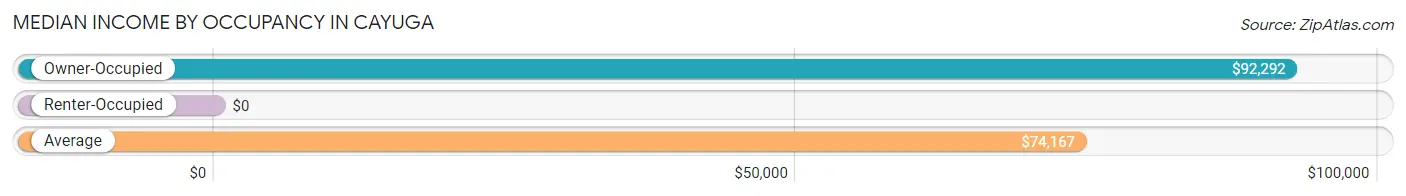
| Occupancy Type | # Households | Median Income |
| Owner-Occupied | 147 (79.9%) | $92,292 |
| Renter-Occupied | 37 (20.1%) | $0 |
| Average | 184 (100.0%) | $74,167 |
Occupancy by Householder Income Bracket in Cayuga
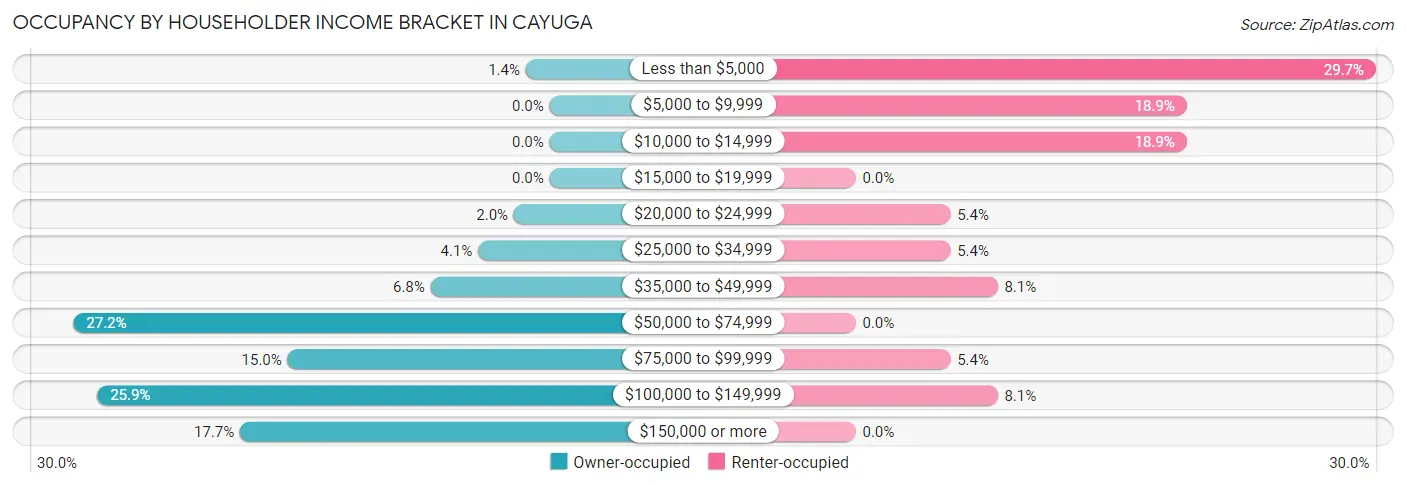
| Income Bracket | Owner-occupied | Renter-occupied |
| Less than $5,000 | 2 (1.4%) | 11 (29.7%) |
| $5,000 to $9,999 | 0 (0.0%) | 7 (18.9%) |
| $10,000 to $14,999 | 0 (0.0%) | 7 (18.9%) |
| $15,000 to $19,999 | 0 (0.0%) | 0 (0.0%) |
| $20,000 to $24,999 | 3 (2.0%) | 2 (5.4%) |
| $25,000 to $34,999 | 6 (4.1%) | 2 (5.4%) |
| $35,000 to $49,999 | 10 (6.8%) | 3 (8.1%) |
| $50,000 to $74,999 | 40 (27.2%) | 0 (0.0%) |
| $75,000 to $99,999 | 22 (15.0%) | 2 (5.4%) |
| $100,000 to $149,999 | 38 (25.9%) | 3 (8.1%) |
| $150,000 or more | 26 (17.7%) | 0 (0.0%) |
| Total | 147 (100.0%) | 37 (100.0%) |
Monthly Housing Cost Tiers in Cayuga
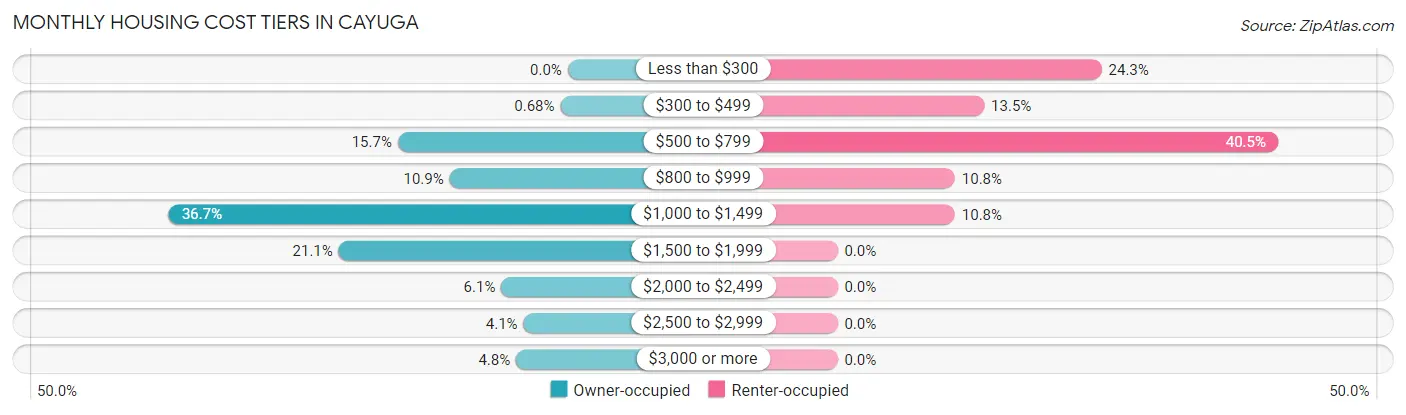
| Monthly Cost | Owner-occupied | Renter-occupied |
| Less than $300 | 0 (0.0%) | 9 (24.3%) |
| $300 to $499 | 1 (0.7%) | 5 (13.5%) |
| $500 to $799 | 23 (15.7%) | 15 (40.5%) |
| $800 to $999 | 16 (10.9%) | 4 (10.8%) |
| $1,000 to $1,499 | 54 (36.7%) | 4 (10.8%) |
| $1,500 to $1,999 | 31 (21.1%) | 0 (0.0%) |
| $2,000 to $2,499 | 9 (6.1%) | 0 (0.0%) |
| $2,500 to $2,999 | 6 (4.1%) | 0 (0.0%) |
| $3,000 or more | 7 (4.8%) | 0 (0.0%) |
| Total | 147 (100.0%) | 37 (100.0%) |
Physical Housing Characteristics in Cayuga
Housing Structures in Cayuga
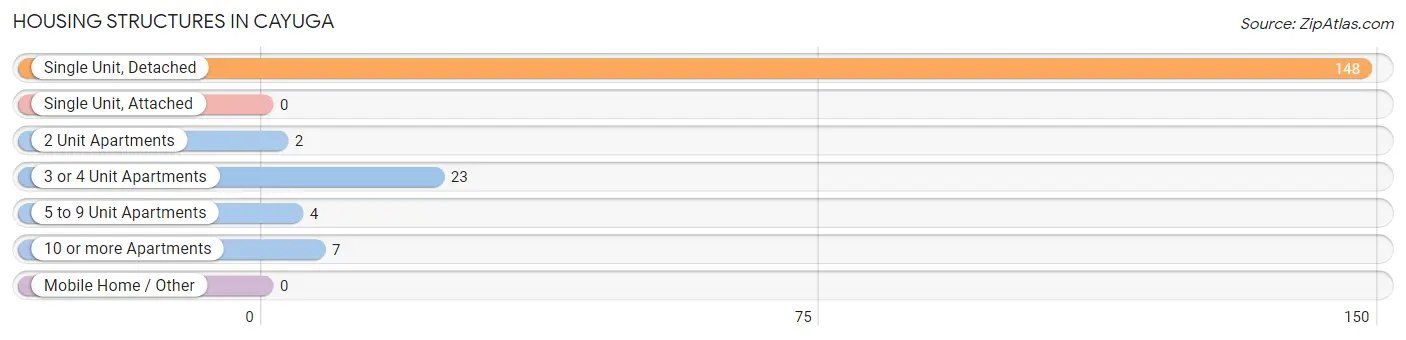
| Structure Type | # Housing Units | % Housing Units |
| Single Unit, Detached | 148 | 80.4% |
| Single Unit, Attached | 0 | 0.0% |
| 2 Unit Apartments | 2 | 1.1% |
| 3 or 4 Unit Apartments | 23 | 12.5% |
| 5 to 9 Unit Apartments | 4 | 2.2% |
| 10 or more Apartments | 7 | 3.8% |
| Mobile Home / Other | 0 | 0.0% |
| Total | 184 | 100.0% |
Housing Structures by Occupancy in Cayuga
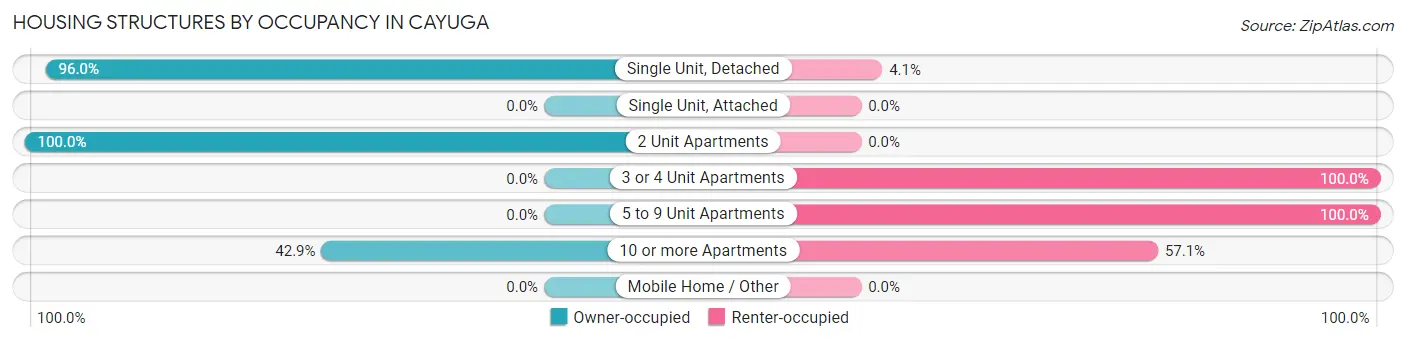
| Structure Type | Owner-occupied | Renter-occupied |
| Single Unit, Detached | 142 (96.0%) | 6 (4.1%) |
| Single Unit, Attached | 0 (0.0%) | 0 (0.0%) |
| 2 Unit Apartments | 2 (100.0%) | 0 (0.0%) |
| 3 or 4 Unit Apartments | 0 (0.0%) | 23 (100.0%) |
| 5 to 9 Unit Apartments | 0 (0.0%) | 4 (100.0%) |
| 10 or more Apartments | 3 (42.9%) | 4 (57.1%) |
| Mobile Home / Other | 0 (0.0%) | 0 (0.0%) |
| Total | 147 (79.9%) | 37 (20.1%) |
Housing Structures by Number of Rooms in Cayuga
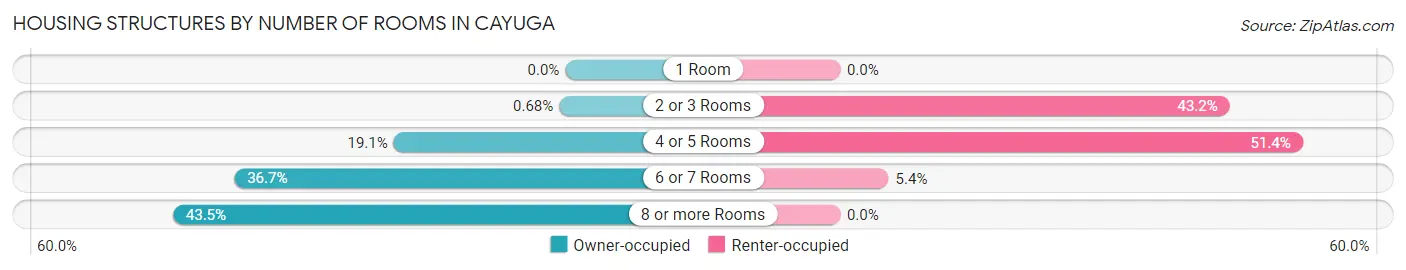
| Number of Rooms | Owner-occupied | Renter-occupied |
| 1 Room | 0 (0.0%) | 0 (0.0%) |
| 2 or 3 Rooms | 1 (0.7%) | 16 (43.2%) |
| 4 or 5 Rooms | 28 (19.1%) | 19 (51.3%) |
| 6 or 7 Rooms | 54 (36.7%) | 2 (5.4%) |
| 8 or more Rooms | 64 (43.5%) | 0 (0.0%) |
| Total | 147 (100.0%) | 37 (100.0%) |
Housing Structure by Heating Type in Cayuga
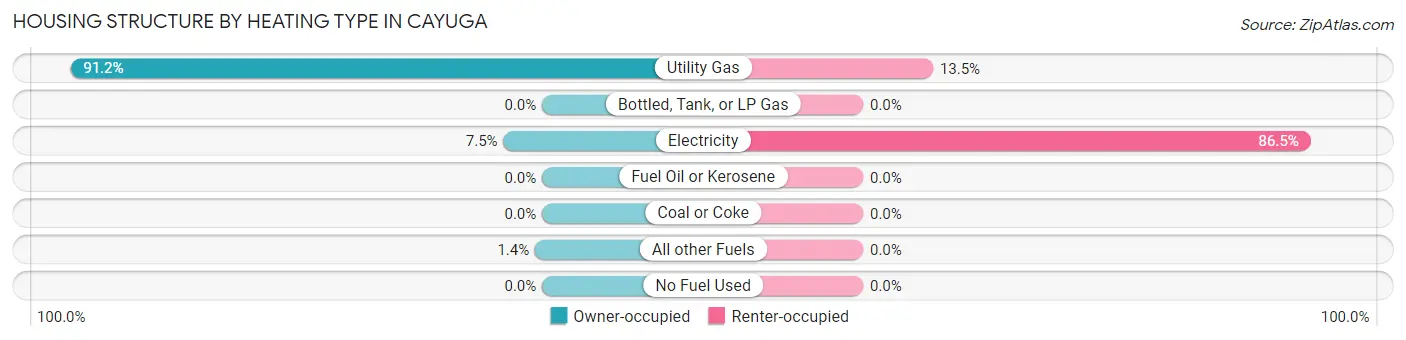
| Heating Type | Owner-occupied | Renter-occupied |
| Utility Gas | 134 (91.2%) | 5 (13.5%) |
| Bottled, Tank, or LP Gas | 0 (0.0%) | 0 (0.0%) |
| Electricity | 11 (7.5%) | 32 (86.5%) |
| Fuel Oil or Kerosene | 0 (0.0%) | 0 (0.0%) |
| Coal or Coke | 0 (0.0%) | 0 (0.0%) |
| All other Fuels | 2 (1.4%) | 0 (0.0%) |
| No Fuel Used | 0 (0.0%) | 0 (0.0%) |
| Total | 147 (100.0%) | 37 (100.0%) |
Household Vehicle Usage in Cayuga
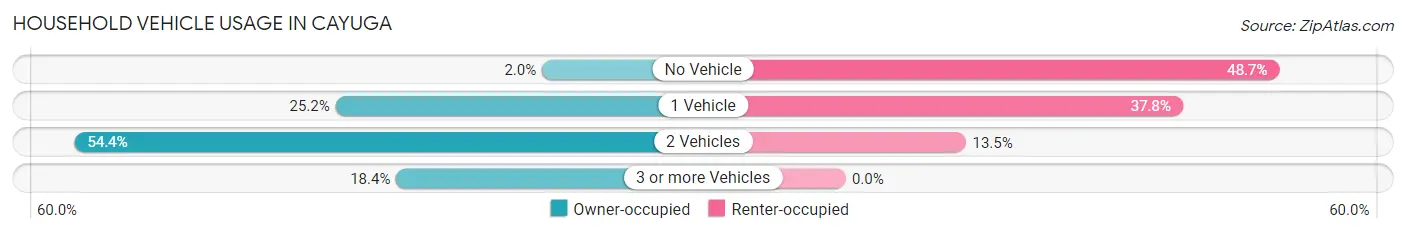
| Vehicles per Household | Owner-occupied | Renter-occupied |
| No Vehicle | 3 (2.0%) | 18 (48.6%) |
| 1 Vehicle | 37 (25.2%) | 14 (37.8%) |
| 2 Vehicles | 80 (54.4%) | 5 (13.5%) |
| 3 or more Vehicles | 27 (18.4%) | 0 (0.0%) |
| Total | 147 (100.0%) | 37 (100.0%) |
Real Estate & Mortgages in Cayuga
Real Estate and Mortgage Overview in Cayuga
| Characteristic | Without Mortgage | With Mortgage |
| Housing Units | 55 | 92 |
| Median Property Value | $156,300 | $148,400 |
| Median Household Income | $62,125 | $22 |
| Monthly Housing Costs | $917 | $6 |
| Real Estate Taxes | $4,750 | $8 |
Property Value by Mortgage Status in Cayuga
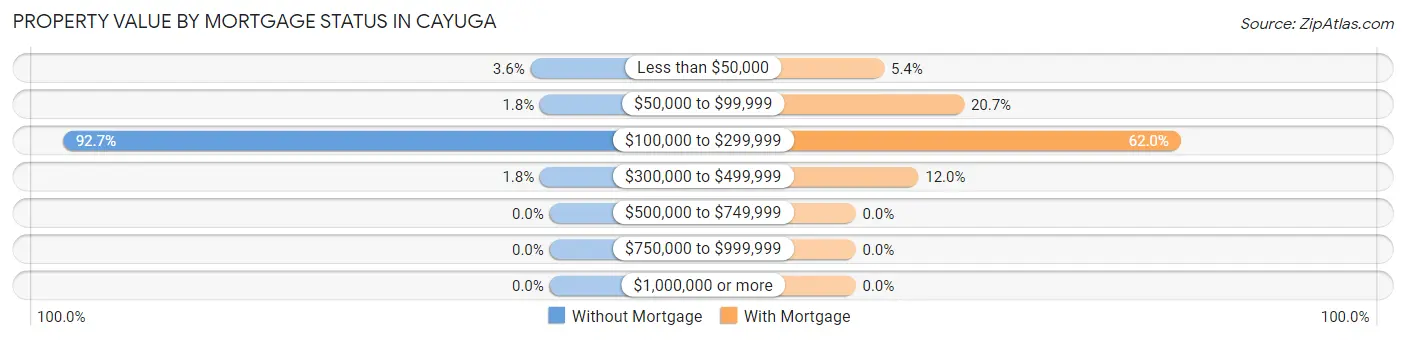
| Property Value | Without Mortgage | With Mortgage |
| Less than $50,000 | 2 (3.6%) | 5 (5.4%) |
| $50,000 to $99,999 | 1 (1.8%) | 19 (20.6%) |
| $100,000 to $299,999 | 51 (92.7%) | 57 (62.0%) |
| $300,000 to $499,999 | 1 (1.8%) | 11 (12.0%) |
| $500,000 to $749,999 | 0 (0.0%) | 0 (0.0%) |
| $750,000 to $999,999 | 0 (0.0%) | 0 (0.0%) |
| $1,000,000 or more | 0 (0.0%) | 0 (0.0%) |
| Total | 55 (100.0%) | 92 (100.0%) |
Household Income by Mortgage Status in Cayuga
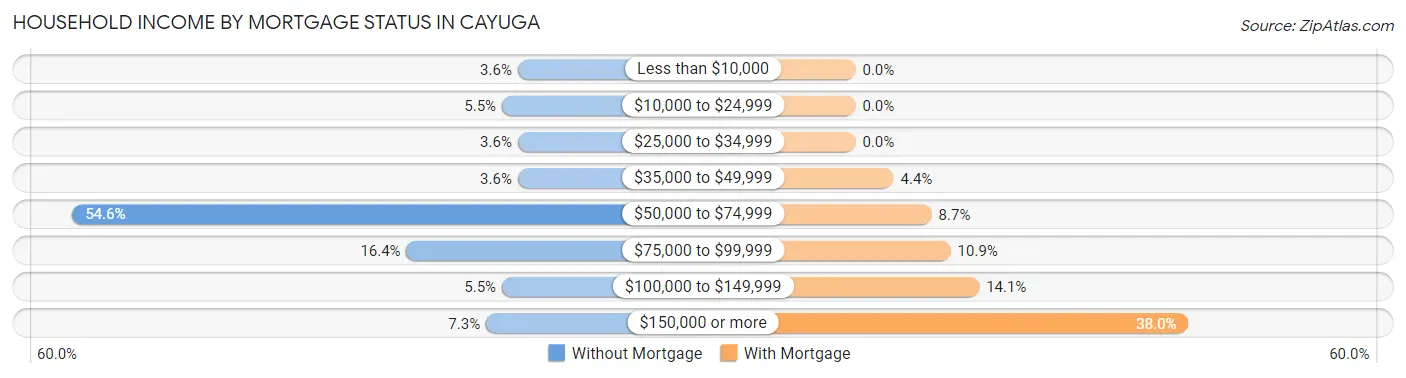
| Household Income | Without Mortgage | With Mortgage |
| Less than $10,000 | 2 (3.6%) | 0 (0.0%) |
| $10,000 to $24,999 | 3 (5.4%) | 0 (0.0%) |
| $25,000 to $34,999 | 2 (3.6%) | 0 (0.0%) |
| $35,000 to $49,999 | 2 (3.6%) | 4 (4.3%) |
| $50,000 to $74,999 | 30 (54.5%) | 8 (8.7%) |
| $75,000 to $99,999 | 9 (16.4%) | 10 (10.9%) |
| $100,000 to $149,999 | 3 (5.4%) | 13 (14.1%) |
| $150,000 or more | 4 (7.3%) | 35 (38.0%) |
| Total | 55 (100.0%) | 92 (100.0%) |
Property Value to Household Income Ratio in Cayuga
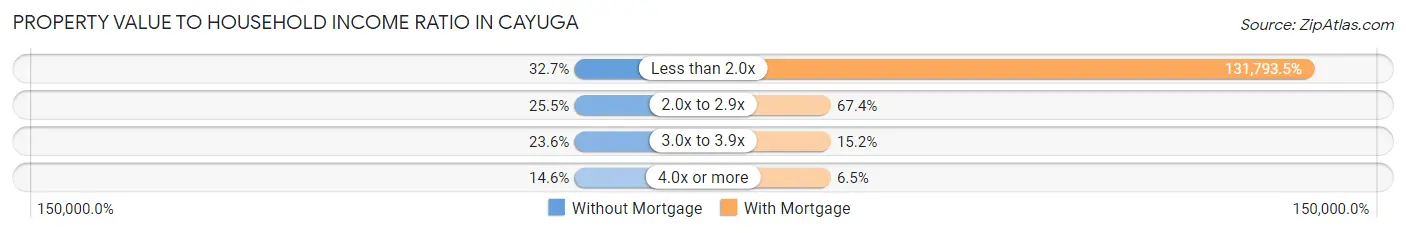
| Value-to-Income Ratio | Without Mortgage | With Mortgage |
| Less than 2.0x | 18 (32.7%) | 121,250 (131,793.5%) |
| 2.0x to 2.9x | 14 (25.5%) | 62 (67.4%) |
| 3.0x to 3.9x | 13 (23.6%) | 14 (15.2%) |
| 4.0x or more | 8 (14.5%) | 6 (6.5%) |
| Total | 55 (100.0%) | 92 (100.0%) |
Real Estate Taxes by Mortgage Status in Cayuga
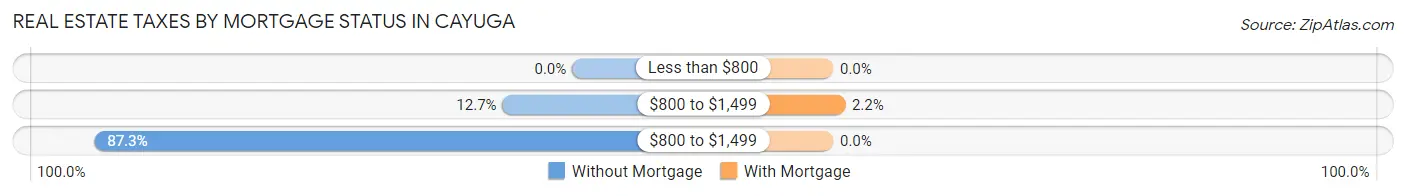
| Property Taxes | Without Mortgage | With Mortgage |
| Less than $800 | 0 (0.0%) | 0 (0.0%) |
| $800 to $1,499 | 7 (12.7%) | 2 (2.2%) |
| $800 to $1,499 | 48 (87.3%) | 0 (0.0%) |
| Total | 55 (100.0%) | 92 (100.0%) |
Health & Disability in Cayuga
Health Insurance Coverage by Age in Cayuga
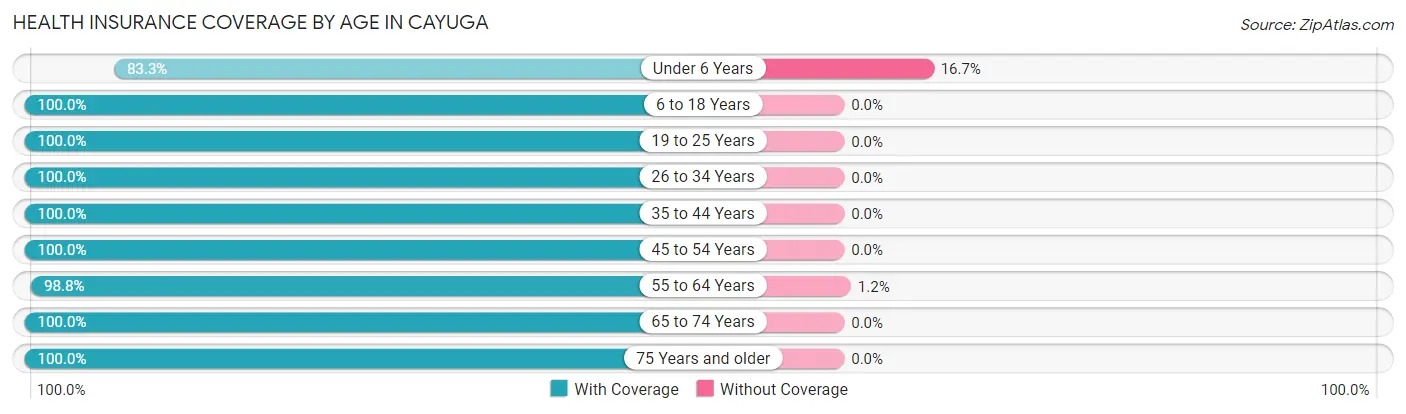
| Age Bracket | With Coverage | Without Coverage |
| Under 6 Years | 10 (83.3%) | 2 (16.7%) |
| 6 to 18 Years | 55 (100.0%) | 0 (0.0%) |
| 19 to 25 Years | 17 (100.0%) | 0 (0.0%) |
| 26 to 34 Years | 32 (100.0%) | 0 (0.0%) |
| 35 to 44 Years | 22 (100.0%) | 0 (0.0%) |
| 45 to 54 Years | 58 (100.0%) | 0 (0.0%) |
| 55 to 64 Years | 80 (98.8%) | 1 (1.2%) |
| 65 to 74 Years | 44 (100.0%) | 0 (0.0%) |
| 75 Years and older | 66 (100.0%) | 0 (0.0%) |
| Total | 384 (99.2%) | 3 (0.8%) |
Health Insurance Coverage by Citizenship Status in Cayuga
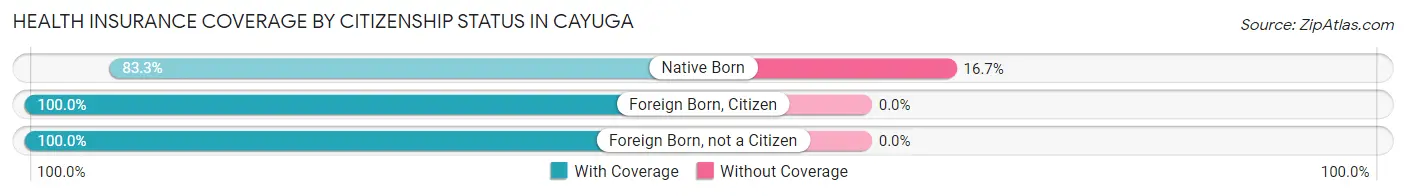
| Citizenship Status | With Coverage | Without Coverage |
| Native Born | 10 (83.3%) | 2 (16.7%) |
| Foreign Born, Citizen | 55 (100.0%) | 0 (0.0%) |
| Foreign Born, not a Citizen | 17 (100.0%) | 0 (0.0%) |
Health Insurance Coverage by Household Income in Cayuga
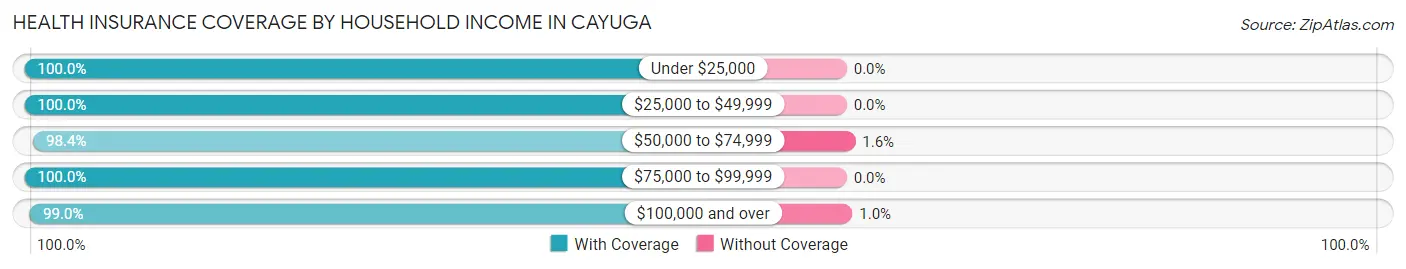
| Household Income | With Coverage | Without Coverage |
| Under $25,000 | 32 (100.0%) | 0 (0.0%) |
| $25,000 to $49,999 | 36 (100.0%) | 0 (0.0%) |
| $50,000 to $74,999 | 61 (98.4%) | 1 (1.6%) |
| $75,000 to $99,999 | 65 (100.0%) | 0 (0.0%) |
| $100,000 and over | 190 (99.0%) | 2 (1.0%) |
Public vs Private Health Insurance Coverage by Age in Cayuga
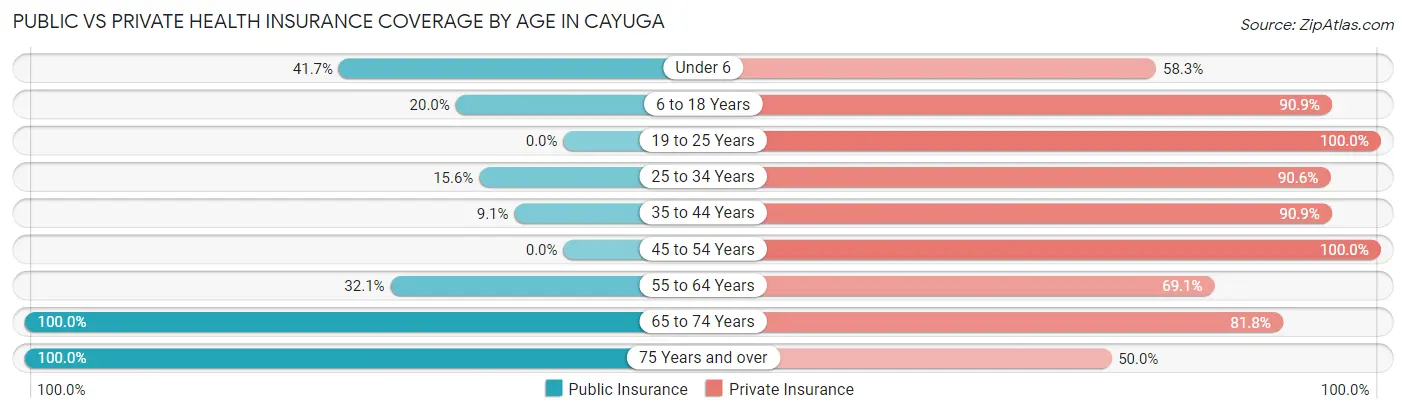
| Age Bracket | Public Insurance | Private Insurance |
| Under 6 | 5 (41.7%) | 7 (58.3%) |
| 6 to 18 Years | 11 (20.0%) | 50 (90.9%) |
| 19 to 25 Years | 0 (0.0%) | 17 (100.0%) |
| 25 to 34 Years | 5 (15.6%) | 29 (90.6%) |
| 35 to 44 Years | 2 (9.1%) | 20 (90.9%) |
| 45 to 54 Years | 0 (0.0%) | 58 (100.0%) |
| 55 to 64 Years | 26 (32.1%) | 56 (69.1%) |
| 65 to 74 Years | 44 (100.0%) | 36 (81.8%) |
| 75 Years and over | 66 (100.0%) | 33 (50.0%) |
| Total | 159 (41.1%) | 306 (79.1%) |
Disability Status by Sex by Age in Cayuga
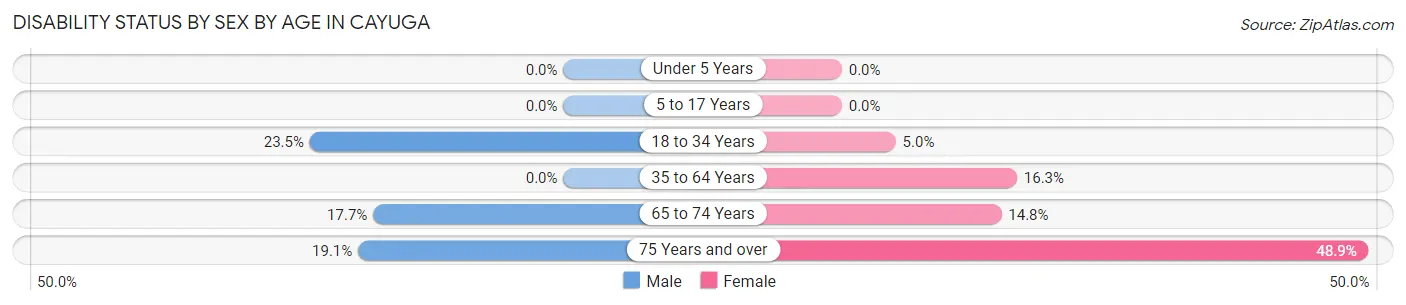
| Age Bracket | Male | Female |
| Under 5 Years | 0 (0.0%) | 0 (0.0%) |
| 5 to 17 Years | 0 (0.0%) | 0 (0.0%) |
| 18 to 34 Years | 8 (23.5%) | 1 (5.0%) |
| 35 to 64 Years | 0 (0.0%) | 13 (16.3%) |
| 65 to 74 Years | 3 (17.6%) | 4 (14.8%) |
| 75 Years and over | 4 (19.1%) | 22 (48.9%) |
Disability Class by Sex by Age in Cayuga
Disability Class: Hearing Difficulty
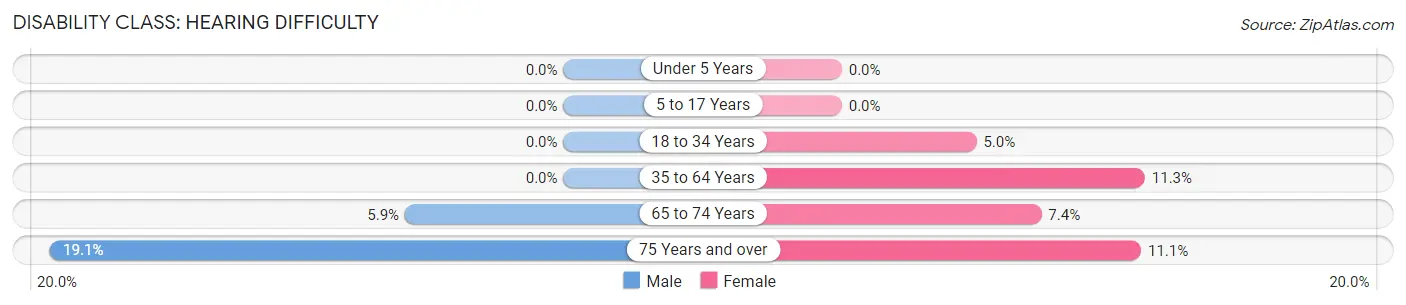
| Age Bracket | Male | Female |
| Under 5 Years | 0 (0.0%) | 0 (0.0%) |
| 5 to 17 Years | 0 (0.0%) | 0 (0.0%) |
| 18 to 34 Years | 0 (0.0%) | 1 (5.0%) |
| 35 to 64 Years | 0 (0.0%) | 9 (11.3%) |
| 65 to 74 Years | 1 (5.9%) | 2 (7.4%) |
| 75 Years and over | 4 (19.1%) | 5 (11.1%) |
Disability Class: Vision Difficulty
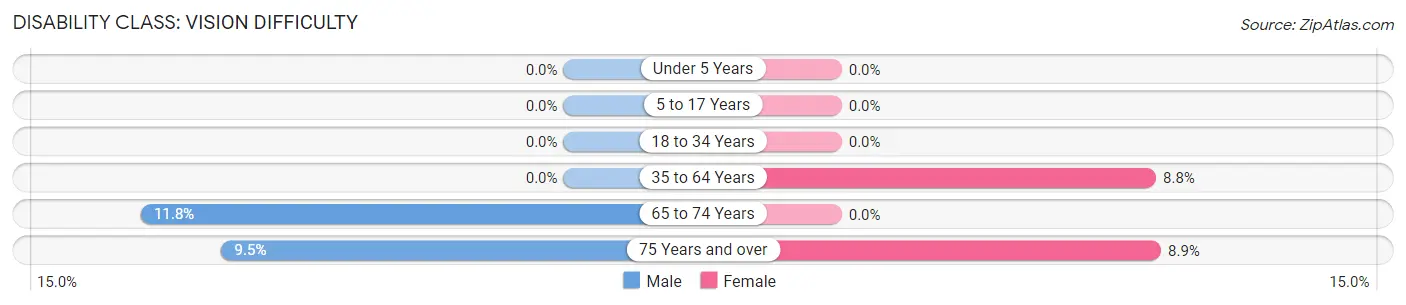
| Age Bracket | Male | Female |
| Under 5 Years | 0 (0.0%) | 0 (0.0%) |
| 5 to 17 Years | 0 (0.0%) | 0 (0.0%) |
| 18 to 34 Years | 0 (0.0%) | 0 (0.0%) |
| 35 to 64 Years | 0 (0.0%) | 7 (8.7%) |
| 65 to 74 Years | 2 (11.8%) | 0 (0.0%) |
| 75 Years and over | 2 (9.5%) | 4 (8.9%) |
Disability Class: Cognitive Difficulty
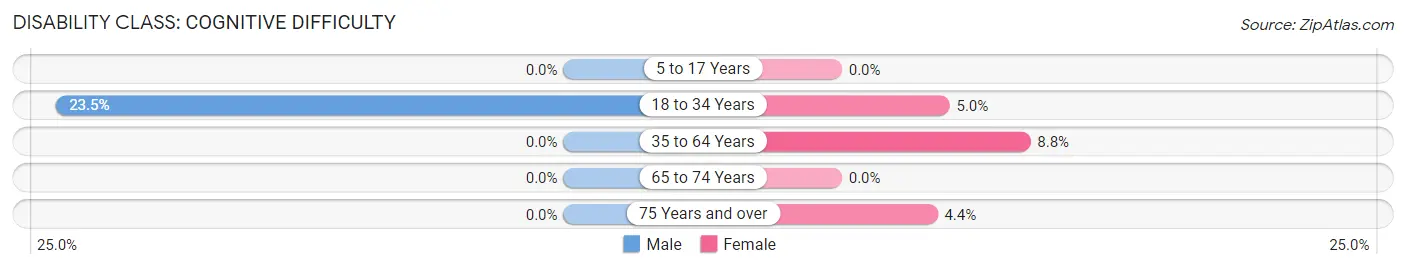
| Age Bracket | Male | Female |
| 5 to 17 Years | 0 (0.0%) | 0 (0.0%) |
| 18 to 34 Years | 8 (23.5%) | 1 (5.0%) |
| 35 to 64 Years | 0 (0.0%) | 7 (8.7%) |
| 65 to 74 Years | 0 (0.0%) | 0 (0.0%) |
| 75 Years and over | 0 (0.0%) | 2 (4.4%) |
Disability Class: Ambulatory Difficulty
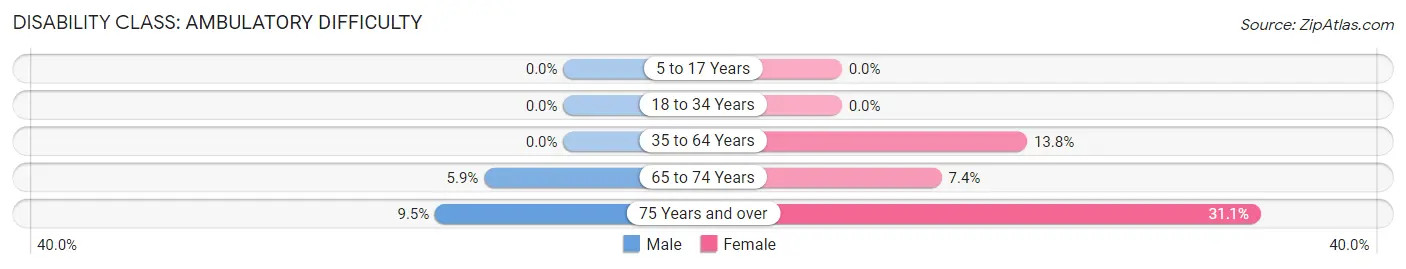
| Age Bracket | Male | Female |
| 5 to 17 Years | 0 (0.0%) | 0 (0.0%) |
| 18 to 34 Years | 0 (0.0%) | 0 (0.0%) |
| 35 to 64 Years | 0 (0.0%) | 11 (13.8%) |
| 65 to 74 Years | 1 (5.9%) | 2 (7.4%) |
| 75 Years and over | 2 (9.5%) | 14 (31.1%) |
Disability Class: Self-Care Difficulty
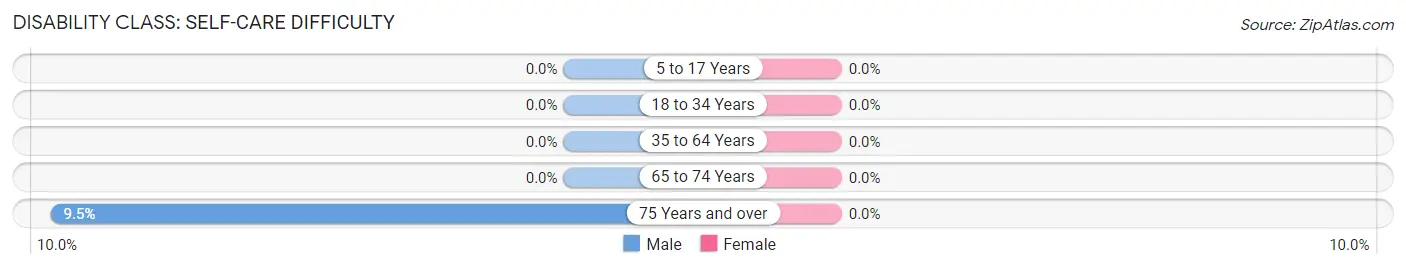
| Age Bracket | Male | Female |
| 5 to 17 Years | 0 (0.0%) | 0 (0.0%) |
| 18 to 34 Years | 0 (0.0%) | 0 (0.0%) |
| 35 to 64 Years | 0 (0.0%) | 0 (0.0%) |
| 65 to 74 Years | 0 (0.0%) | 0 (0.0%) |
| 75 Years and over | 2 (9.5%) | 0 (0.0%) |
Technology Access in Cayuga
Computing Device Access in Cayuga
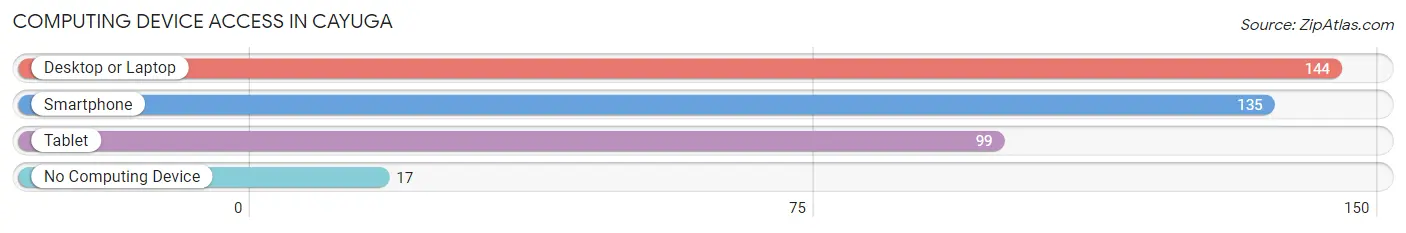
| Device Type | # Households | % Households |
| Desktop or Laptop | 144 | 78.3% |
| Smartphone | 135 | 73.4% |
| Tablet | 99 | 53.8% |
| No Computing Device | 17 | 9.2% |
| Total | 184 | 100.0% |
Internet Access in Cayuga
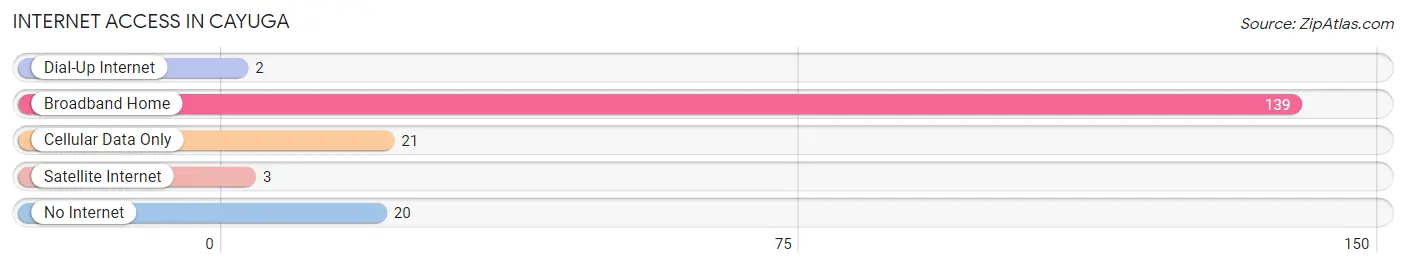
| Internet Type | # Households | % Households |
| Dial-Up Internet | 2 | 1.1% |
| Broadband Home | 139 | 75.5% |
| Cellular Data Only | 21 | 11.4% |
| Satellite Internet | 3 | 1.6% |
| No Internet | 20 | 10.9% |
| Total | 184 | 100.0% |
Cayuga Summary
Cayuga is a town located in Cayuga County, New York, United States. The population was 4,845 at the 2010 census. The town is named after the Cayuga Nation, one of the original Five Nations of the Iroquois Confederacy.
History
The area that is now Cayuga was first settled by Europeans in 1789. The town was formed in 1806 from the Town of Aurelius. The town was named after the Cayuga Nation, one of the original Five Nations of the Iroquois Confederacy.
The town was the site of the Battle of Cayuga in 1813, during the War of 1812. The battle was fought between a British force and a combined force of American militia and Native Americans. The British were victorious, but the battle was a strategic victory for the Americans, as it delayed the British advance and allowed the Americans to regroup and prepare for the Battle of Sodus Point.
Geography
Cayuga is located in the northwest corner of Cayuga County, bordered by Seneca County to the north, Onondaga County to the east, and the Town of Aurelius to the south. According to the United States Census Bureau, the town has a total area of 36.2 square miles, of which 35.9 square miles is land and 0.3 square miles, or 0.86%, is water.
The town is located on the northern shore of Cayuga Lake, one of the Finger Lakes. The east town line is the border of Onondaga County, and the north town line is the border of Seneca County.
Economy
Cayuga is a rural town with a strong agricultural base. The town is home to several farms, including dairy farms, vegetable farms, and fruit farms. The town is also home to several wineries, including Long Point Winery and Cayuga Ridge Estate Winery.
The town is also home to several businesses, including a lumber yard, a hardware store, and a variety of restaurants and shops.
Demographics
As of the census of 2010, there were 4,845 people, 1,845 households, and 1,269 families residing in the town. The population density was 135.2 people per square mile (52.2/km2). There were 2,039 housing units at an average density of 56.7 per square mile (21.9/km2). The racial makeup of the town was 97.2% White, 0.7% African American, 0.2% Native American, 0.3% Asian, 0.1% Pacific Islander, 0.3% from other races, and 1.2% from two or more races. Hispanic or Latino of any race were 1.7% of the population.
There were 1,845 households, out of which 32.2% had children under the age of 18 living with them, 54.2% were married couples living together, 10.2% had a female householder with no husband present, and 30.7% were non-families. 25.2% of all households were made up of individuals, and 11.2% had someone living alone who was 65 years of age or older. The average household size was 2.60 and the average family size was 3.09.
In the town, the population was spread out, with 25.7% under the age of 18, 6.7% from 18 to 24, 25.7% from 25 to 44, 27.2% from 45 to 64, and 14.7% who were 65 years of age or older. The median age was 40 years. For every 100 females, there were 97.2 males. For every 100 females age 18 and over, there were 94.2 males.
The median income for a household in the town was $45,000, and the median income for a family was $51,250. Males had a median income of $36,250 versus $27,500 for females. The per capita income for the town was $20,945. About 6.2% of families and 8.2% of the population were below the poverty line, including 10.2% of those under age 18 and 6.2% of those age 65 or over.
Common Questions
What is Per Capita Income in Cayuga?
Per Capita income in Cayuga is $42,915.
What is the Median Family Income in Cayuga?
Median Family Income in Cayuga is $93,000.
What is the Median Household income in Cayuga?
Median Household Income in Cayuga is $74,167.
What is Income or Wage Gap in Cayuga?
Income or Wage Gap in Cayuga is 20.8%.
Women in Cayuga earn 79.2 cents for every dollar earned by a man.
What is Inequality or Gini Index in Cayuga?
Inequality or Gini Index in Cayuga is 0.41.
What is the Total Population of Cayuga?
Total Population of Cayuga is 387.
What is the Total Male Population of Cayuga?
Total Male Population of Cayuga is 172.
What is the Total Female Population of Cayuga?
Total Female Population of Cayuga is 215.
What is the Ratio of Males per 100 Females in Cayuga?
There are 80.00 Males per 100 Females in Cayuga.
What is the Ratio of Females per 100 Males in Cayuga?
There are 125.00 Females per 100 Males in Cayuga.
What is the Median Population Age in Cayuga?
Median Population Age in Cayuga is 54.7 Years.
What is the Average Family Size in Cayuga
Average Family Size in Cayuga is 2.7 People.
What is the Average Household Size in Cayuga
Average Household Size in Cayuga is 2.1 People.
How Large is the Labor Force in Cayuga?
There are 230 People in the Labor Forcein in Cayuga.
What is the Percentage of People in the Labor Force in Cayuga?
65.5% of People are in the Labor Force in Cayuga.
What is the Unemployment Rate in Cayuga?
Unemployment Rate in Cayuga is 0.9%.