Blodgett Mills, NY Map & Demographics
Blodgett Mills Map
Blodgett Mills Overview
$24,236
PER CAPITA INCOME
$59,464
AVG FAMILY INCOME
$59,464
AVG HOUSEHOLD INCOME
0.35
INEQUALITY / GINI INDEX
221
TOTAL POPULATION
145
MALE POPULATION
76
FEMALE POPULATION
190.79
MALES / 100 FEMALES
52.41
FEMALES / 100 MALES
25.8
MEDIAN AGE
3.3
AVG FAMILY SIZE
3.3
AVG HOUSEHOLD SIZE
152
LABOR FORCE [ PEOPLE ]
76.0%
PERCENT IN LABOR FORCE
8.6%
UNEMPLOYMENT RATE
Blodgett Mills Zip Codes
Blodgett Mills Area Codes
Income in Blodgett Mills
Income Overview in Blodgett Mills
Per Capita Income in Blodgett Mills is $24,236, while median incomes of families and households are $59,464 and $59,464 respectively.
| Characteristic | Number | Measure |
| Per Capita Income | 221 | $24,236 |
| Median Family Income | 67 | $59,464 |
| Mean Family Income | 67 | $74,991 |
| Median Household Income | 67 | $59,464 |
| Mean Household Income | 67 | $74,991 |
| Income Deficit | 67 | $0 |
| Wage / Income Gap (%) | 221 | 0.00% |
| Wage / Income Gap ($) | 221 | 100.00¢ per $1 |
| Gini / Inequality Index | 221 | 0.35 |
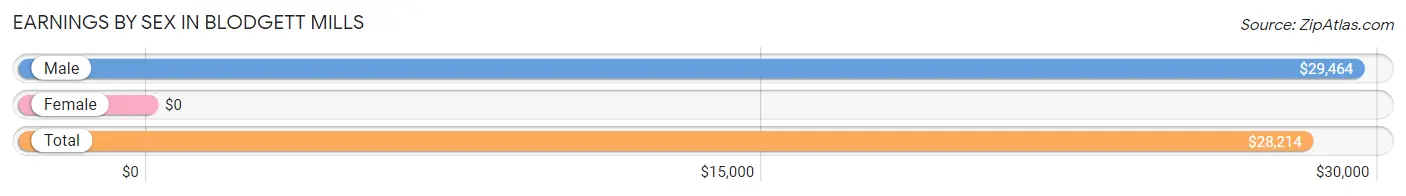
Earnings by Sex in Blodgett Mills
| Sex | Number | Average Earnings |
| Male | 94 (61.8%) | $29,464 |
| Female | 58 (38.2%) | $0 |
| Total | 152 (100.0%) | $28,214 |
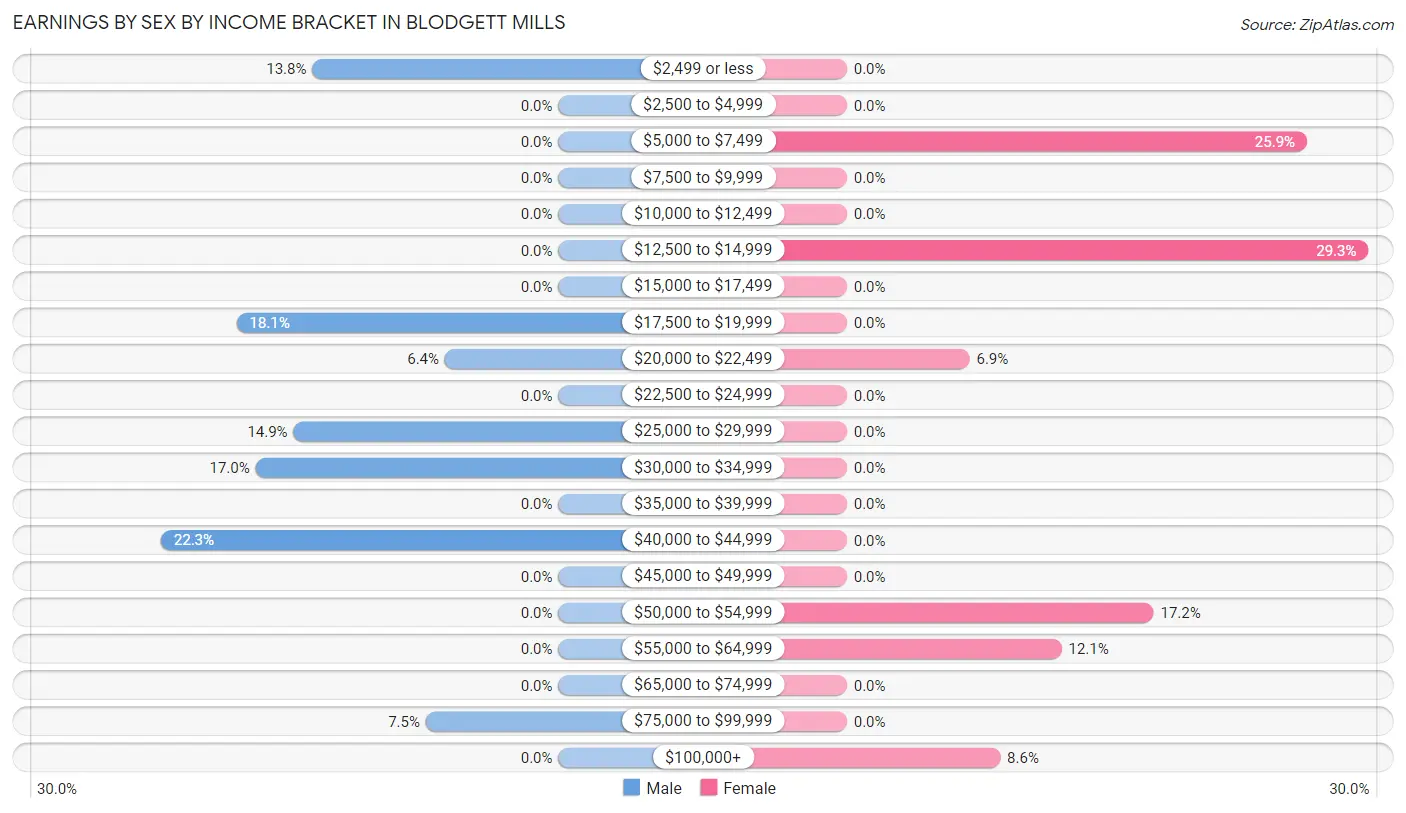
Earnings by Sex by Income Bracket in Blodgett Mills
The most common earnings brackets in Blodgett Mills are $40,000 to $44,999 for men (21 | 22.3%) and $12,500 to $14,999 for women (17 | 29.3%).
| Income | Male | Female |
| $2,499 or less | 13 (13.8%) | 0 (0.0%) |
| $2,500 to $4,999 | 0 (0.0%) | 0 (0.0%) |
| $5,000 to $7,499 | 0 (0.0%) | 15 (25.9%) |
| $7,500 to $9,999 | 0 (0.0%) | 0 (0.0%) |
| $10,000 to $12,499 | 0 (0.0%) | 0 (0.0%) |
| $12,500 to $14,999 | 0 (0.0%) | 17 (29.3%) |
| $15,000 to $17,499 | 0 (0.0%) | 0 (0.0%) |
| $17,500 to $19,999 | 17 (18.1%) | 0 (0.0%) |
| $20,000 to $22,499 | 6 (6.4%) | 4 (6.9%) |
| $22,500 to $24,999 | 0 (0.0%) | 0 (0.0%) |
| $25,000 to $29,999 | 14 (14.9%) | 0 (0.0%) |
| $30,000 to $34,999 | 16 (17.0%) | 0 (0.0%) |
| $35,000 to $39,999 | 0 (0.0%) | 0 (0.0%) |
| $40,000 to $44,999 | 21 (22.3%) | 0 (0.0%) |
| $45,000 to $49,999 | 0 (0.0%) | 0 (0.0%) |
| $50,000 to $54,999 | 0 (0.0%) | 10 (17.2%) |
| $55,000 to $64,999 | 0 (0.0%) | 7 (12.1%) |
| $65,000 to $74,999 | 0 (0.0%) | 0 (0.0%) |
| $75,000 to $99,999 | 7 (7.4%) | 0 (0.0%) |
| $100,000+ | 0 (0.0%) | 5 (8.6%) |
| Total | 94 (100.0%) | 58 (100.0%) |
Earnings by Sex by Educational Attainment in Blodgett Mills
| Educational Attainment | Male Income | Female Income |
| Less than High School | - | - |
| High School Diploma | - | - |
| College or Associate's Degree | - | - |
| Bachelor's Degree | - | - |
| Graduate Degree | - | - |
| Total | $42,727 | $0 |
Family Income in Blodgett Mills
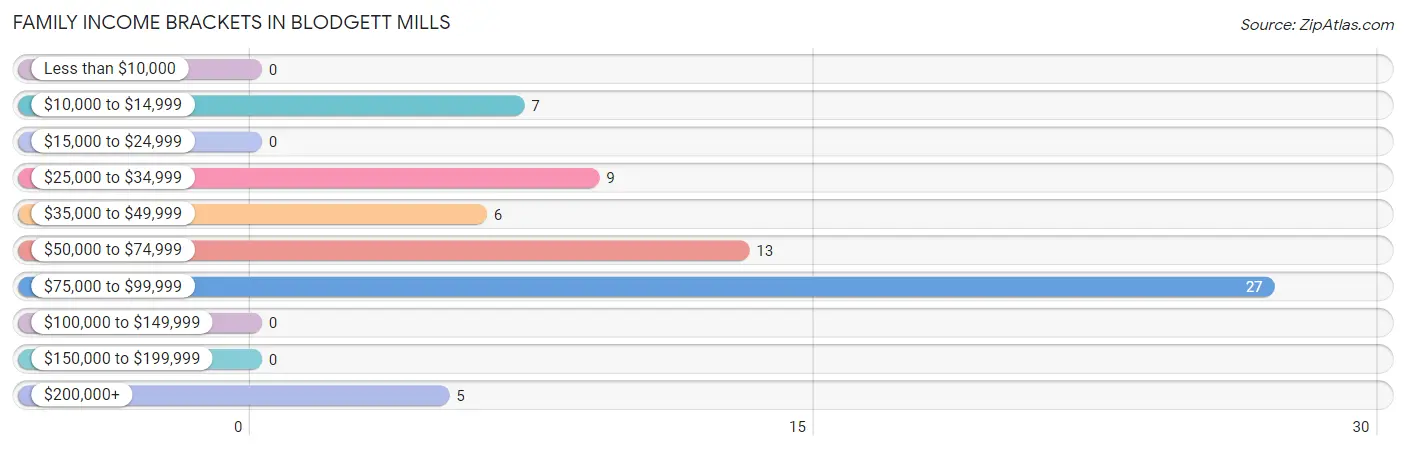
Family Income Brackets in Blodgett Mills
According to the Blodgett Mills family income data, there are 27 families falling into the $75,000 to $99,999 income range, which is the most common income bracket and makes up 40.3% of all families.
| Income Bracket | # Families | % Families |
| Less than $10,000 | 0 | 0.0% |
| $10,000 to $14,999 | 7 | 10.4% |
| $15,000 to $24,999 | 0 | 0.0% |
| $25,000 to $34,999 | 9 | 13.4% |
| $35,000 to $49,999 | 6 | 9.0% |
| $50,000 to $74,999 | 13 | 19.4% |
| $75,000 to $99,999 | 27 | 40.3% |
| $100,000 to $149,999 | 0 | 0.0% |
| $150,000 to $199,999 | 0 | 0.0% |
| $200,000+ | 5 | 7.5% |
Family Income by Famaliy Size in Blodgett Mills
| Income Bracket | # Families | Median Income |
| 2-Person Families | 32 (47.8%) | $0 |
| 3-Person Families | 24 (35.8%) | $0 |
| 4-Person Families | 6 (9.0%) | $0 |
| 5-Person Families | 0 (0.0%) | $0 |
| 6-Person Families | 5 (7.5%) | $0 |
| 7+ Person Families | 0 (0.0%) | $0 |
| Total | 67 (100.0%) | $59,464 |
Family Income by Number of Earners in Blodgett Mills
| Number of Earners | # Families | Median Income |
| No Earners | 13 (19.4%) | $0 |
| 1 Earner | 16 (23.9%) | $0 |
| 2 Earners | 16 (23.9%) | $0 |
| 3+ Earners | 22 (32.8%) | $0 |
| Total | 67 (100.0%) | $59,464 |
Household Income in Blodgett Mills
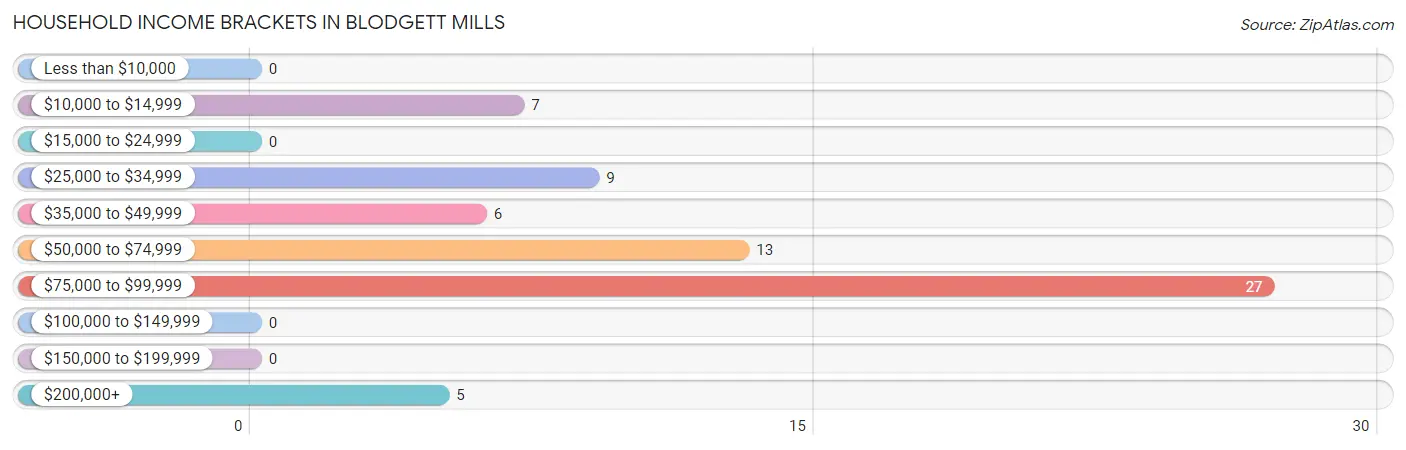
Household Income Brackets in Blodgett Mills
With 27 households falling in the category, the $75,000 to $99,999 income range is the most frequent in Blodgett Mills, accounting for 40.3% of all households.
| Income Bracket | # Households | % Households |
| Less than $10,000 | 0 | 0.0% |
| $10,000 to $14,999 | 7 | 10.4% |
| $15,000 to $24,999 | 0 | 0.0% |
| $25,000 to $34,999 | 9 | 13.4% |
| $35,000 to $49,999 | 6 | 9.0% |
| $50,000 to $74,999 | 13 | 19.4% |
| $75,000 to $99,999 | 27 | 40.3% |
| $100,000 to $149,999 | 0 | 0.0% |
| $150,000 to $199,999 | 0 | 0.0% |
| $200,000+ | 5 | 7.5% |
Household Income by Householder Age in Blodgett Mills
The median household income in Blodgett Mills is $59,464, with the highest median household income of $88,015 found in the 45 to 64 years age bracket for the primary householder. A total of 37 households (55.2%) fall into this category.
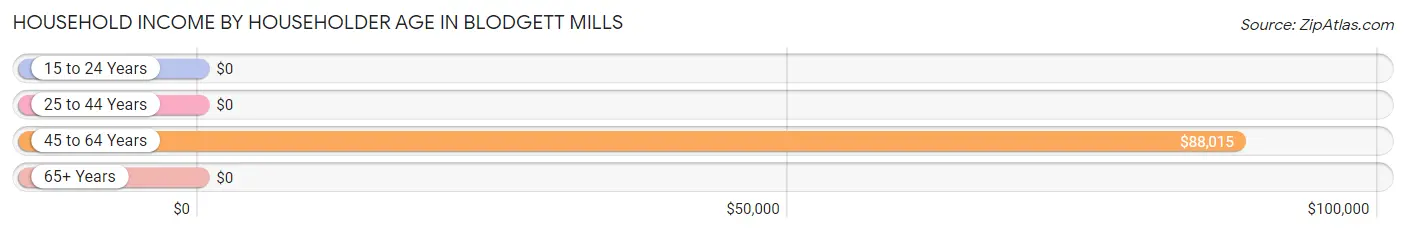
| Income Bracket | # Households | Median Income |
| 15 to 24 Years | 0 (0.0%) | $0 |
| 25 to 44 Years | 17 (25.4%) | $0 |
| 45 to 64 Years | 37 (55.2%) | $88,015 |
| 65+ Years | 13 (19.4%) | $0 |
| Total | 67 (100.0%) | $59,464 |
Poverty in Blodgett Mills
Income Below Poverty by Sex and Age in Blodgett Mills
With 4.8% poverty level for males and 10.5% for females among the residents of Blodgett Mills, 75 year old and over males and 75 year old and over females are the most vulnerable to poverty, with 7 males (100.0%) and 8 females (100.0%) in their respective age groups living below the poverty level.
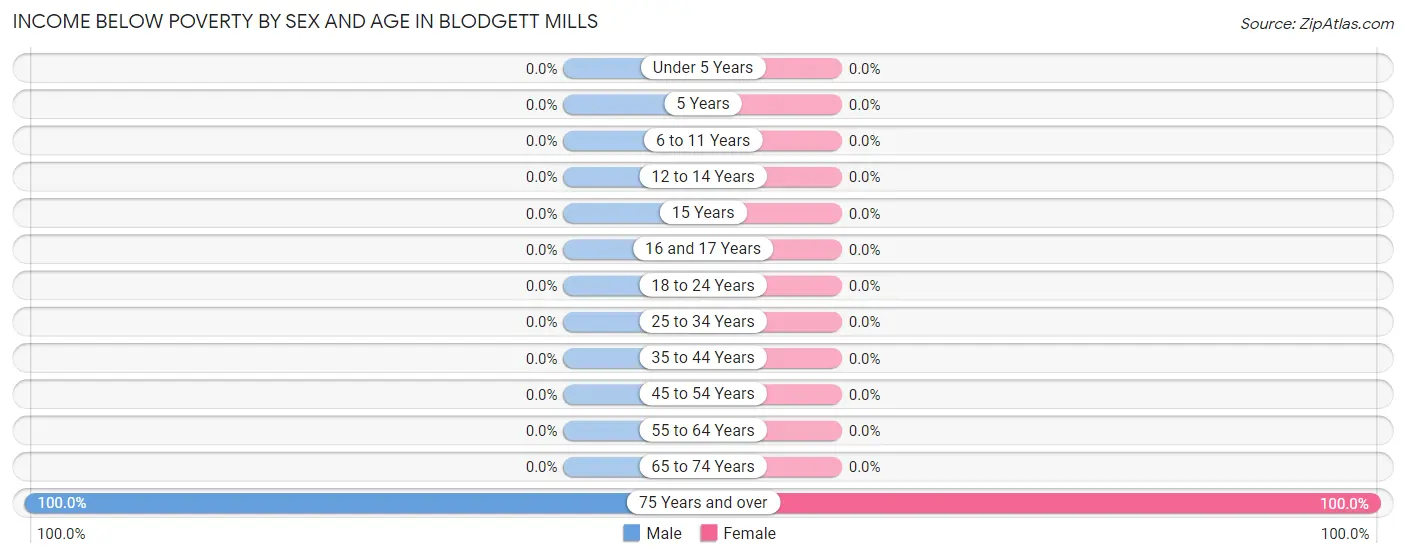
| Age Bracket | Male | Female |
| Under 5 Years | 0 (0.0%) | 0 (0.0%) |
| 5 Years | 0 (0.0%) | 0 (0.0%) |
| 6 to 11 Years | 0 (0.0%) | 0 (0.0%) |
| 12 to 14 Years | 0 (0.0%) | 0 (0.0%) |
| 15 Years | 0 (0.0%) | 0 (0.0%) |
| 16 and 17 Years | 0 (0.0%) | 0 (0.0%) |
| 18 to 24 Years | 0 (0.0%) | 0 (0.0%) |
| 25 to 34 Years | 0 (0.0%) | 0 (0.0%) |
| 35 to 44 Years | 0 (0.0%) | 0 (0.0%) |
| 45 to 54 Years | 0 (0.0%) | 0 (0.0%) |
| 55 to 64 Years | 0 (0.0%) | 0 (0.0%) |
| 65 to 74 Years | 0 (0.0%) | 0 (0.0%) |
| 75 Years and over | 7 (100.0%) | 8 (100.0%) |
| Total | 7 (4.8%) | 8 (10.5%) |
Income Above Poverty by Sex and Age in Blodgett Mills
According to the poverty statistics in Blodgett Mills, males aged under 5 years and females aged 18 to 24 years are the age groups that are most secure financially, with 100.0% of males and 100.0% of females in these age groups living above the poverty line.
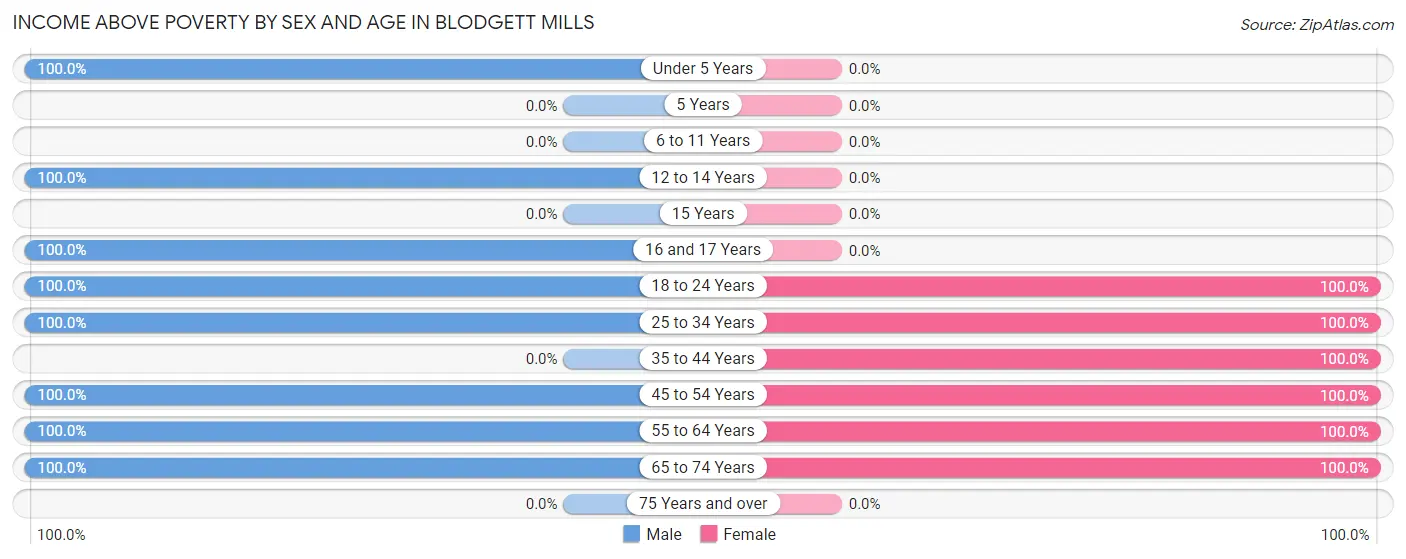
| Age Bracket | Male | Female |
| Under 5 Years | 7 (100.0%) | 0 (0.0%) |
| 5 Years | 0 (0.0%) | 0 (0.0%) |
| 6 to 11 Years | 0 (0.0%) | 0 (0.0%) |
| 12 to 14 Years | 14 (100.0%) | 0 (0.0%) |
| 15 Years | 0 (0.0%) | 0 (0.0%) |
| 16 and 17 Years | 7 (100.0%) | 0 (0.0%) |
| 18 to 24 Years | 60 (100.0%) | 15 (100.0%) |
| 25 to 34 Years | 21 (100.0%) | 10 (100.0%) |
| 35 to 44 Years | 0 (0.0%) | 11 (100.0%) |
| 45 to 54 Years | 7 (100.0%) | 5 (100.0%) |
| 55 to 64 Years | 15 (100.0%) | 17 (100.0%) |
| 65 to 74 Years | 7 (100.0%) | 10 (100.0%) |
| 75 Years and over | 0 (0.0%) | 0 (0.0%) |
| Total | 138 (95.2%) | 68 (89.5%) |
Income Below Poverty Among Married-Couple Families in Blodgett Mills
The poverty statistics for married-couple families in Blodgett Mills show that 25.0% or 7 of the total 28 families live below the poverty line. Families with no children have the highest poverty rate of 25.0%, comprising of 7 families. On the other hand, families with no children have the lowest poverty rate of 25.0%, which includes 7 families.
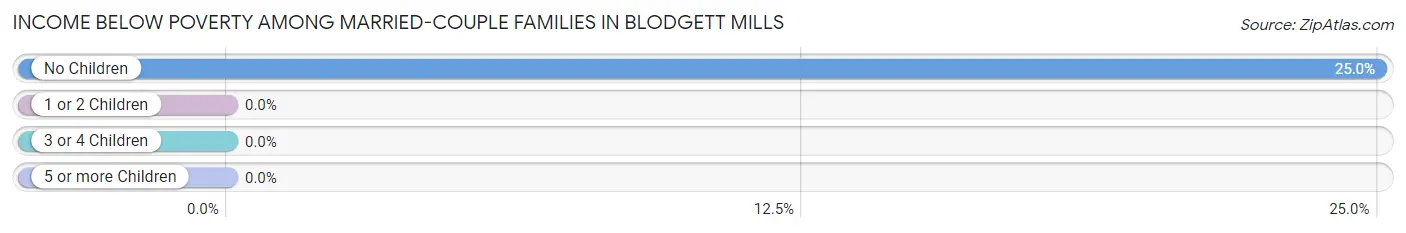
| Children | Above Poverty | Below Poverty |
| No Children | 21 (75.0%) | 7 (25.0%) |
| 1 or 2 Children | 0 (0.0%) | 0 (0.0%) |
| 3 or 4 Children | 0 (0.0%) | 0 (0.0%) |
| 5 or more Children | 0 (0.0%) | 0 (0.0%) |
| Total | 21 (75.0%) | 7 (25.0%) |
Income Below Poverty Among Single-Parent Households in Blodgett Mills
| Children | Single Father | Single Mother |
| No Children | 0 (0.0%) | 0 (0.0%) |
| 1 or 2 Children | 0 (0.0%) | 0 (0.0%) |
| 3 or 4 Children | 0 (0.0%) | 0 (0.0%) |
| 5 or more Children | 0 (0.0%) | 0 (0.0%) |
| Total | 0 (0.0%) | 0 (0.0%) |
Income Below Poverty Among Married-Couple vs Single-Parent Households in Blodgett Mills
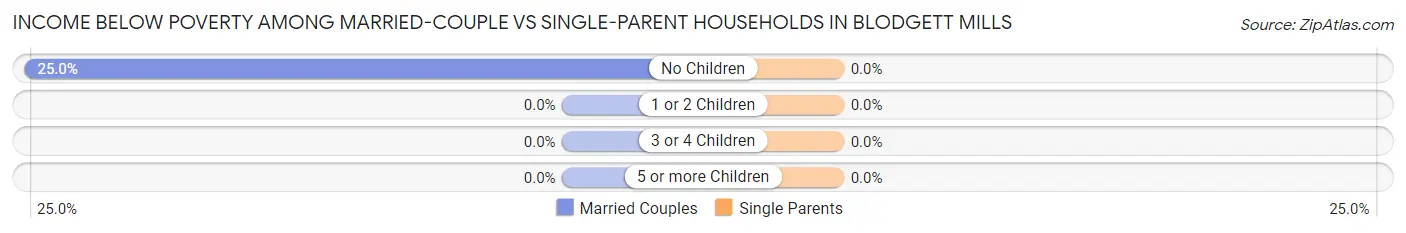
| Children | Married-Couple Families | Single-Parent Households |
| No Children | 7 (25.0%) | 0 (0.0%) |
| 1 or 2 Children | 0 (0.0%) | 0 (0.0%) |
| 3 or 4 Children | 0 (0.0%) | 0 (0.0%) |
| 5 or more Children | 0 (0.0%) | 0 (0.0%) |
| Total | 7 (25.0%) | 0 (0.0%) |
Race in Blodgett Mills
The most populous races in Blodgett Mills are White / Caucasian (208 | 94.1%), Hispanic or Latino (17 | 7.7%), and Two or more Races (13 | 5.9%).
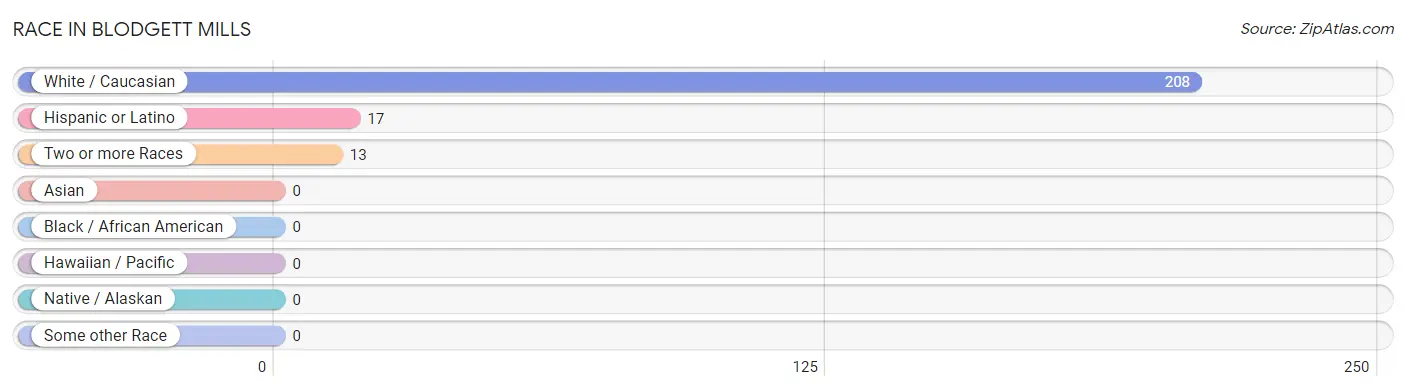
| Race | # Population | % Population |
| Asian | 0 | 0.0% |
| Black / African American | 0 | 0.0% |
| Hawaiian / Pacific | 0 | 0.0% |
| Hispanic or Latino | 17 | 7.7% |
| Native / Alaskan | 0 | 0.0% |
| White / Caucasian | 208 | 94.1% |
| Two or more Races | 13 | 5.9% |
| Some other Race | 0 | 0.0% |
| Total | 221 | 100.0% |
Ancestry in Blodgett Mills
The most populous ancestries reported in Blodgett Mills are Polish (26 | 11.8%), Peruvian (17 | 7.7%), South American (17 | 7.7%), and European (10 | 4.5%), together accounting for 31.7% of all Blodgett Mills residents.
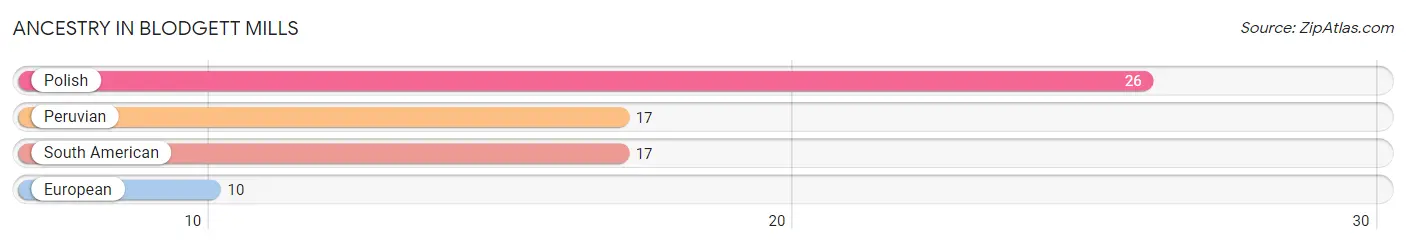
| Ancestry | # Population | % Population |
| European | 10 | 4.5% |
| Peruvian | 17 | 7.7% |
| Polish | 26 | 11.8% |
| South American | 17 | 7.7% | View All 4 Rows |
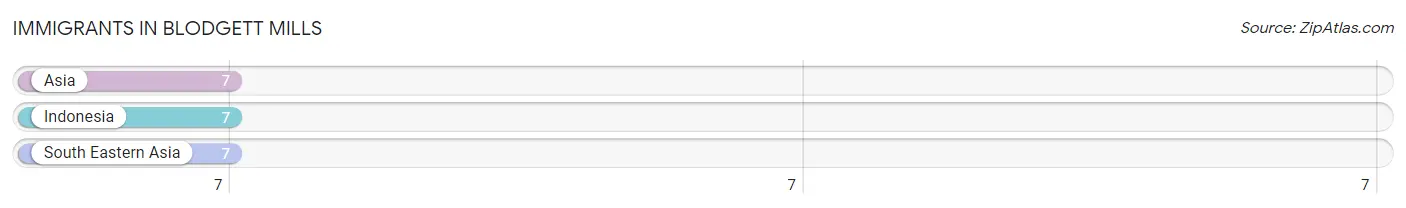
Immigrants in Blodgett Mills
The most numerous immigrant groups reported in Blodgett Mills came from Asia (7 | 3.2%), Indonesia (7 | 3.2%), and South Eastern Asia (7 | 3.2%), together accounting for 9.5% of all Blodgett Mills residents.
| Immigration Origin | # Population | % Population |
| Asia | 7 | 3.2% |
| Indonesia | 7 | 3.2% |
| South Eastern Asia | 7 | 3.2% | View All 3 Rows |
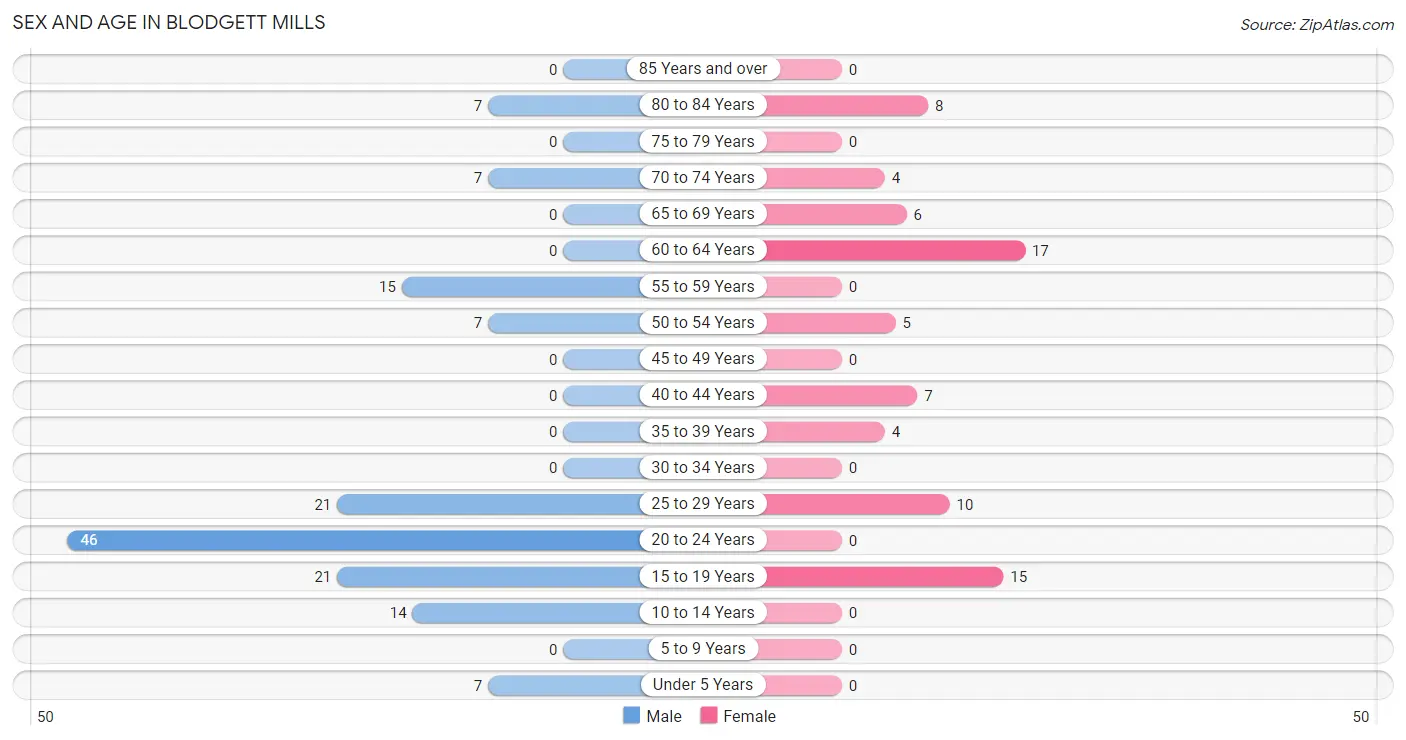
Sex and Age in Blodgett Mills
Sex and Age in Blodgett Mills
The most populous age groups in Blodgett Mills are 20 to 24 Years (46 | 31.7%) for men and 60 to 64 Years (17 | 22.4%) for women.
| Age Bracket | Male | Female |
| Under 5 Years | 7 (4.8%) | 0 (0.0%) |
| 5 to 9 Years | 0 (0.0%) | 0 (0.0%) |
| 10 to 14 Years | 14 (9.7%) | 0 (0.0%) |
| 15 to 19 Years | 21 (14.5%) | 15 (19.7%) |
| 20 to 24 Years | 46 (31.7%) | 0 (0.0%) |
| 25 to 29 Years | 21 (14.5%) | 10 (13.2%) |
| 30 to 34 Years | 0 (0.0%) | 0 (0.0%) |
| 35 to 39 Years | 0 (0.0%) | 4 (5.3%) |
| 40 to 44 Years | 0 (0.0%) | 7 (9.2%) |
| 45 to 49 Years | 0 (0.0%) | 0 (0.0%) |
| 50 to 54 Years | 7 (4.8%) | 5 (6.6%) |
| 55 to 59 Years | 15 (10.3%) | 0 (0.0%) |
| 60 to 64 Years | 0 (0.0%) | 17 (22.4%) |
| 65 to 69 Years | 0 (0.0%) | 6 (7.9%) |
| 70 to 74 Years | 7 (4.8%) | 4 (5.3%) |
| 75 to 79 Years | 0 (0.0%) | 0 (0.0%) |
| 80 to 84 Years | 7 (4.8%) | 8 (10.5%) |
| 85 Years and over | 0 (0.0%) | 0 (0.0%) |
| Total | 145 (100.0%) | 76 (100.0%) |
Families and Households in Blodgett Mills
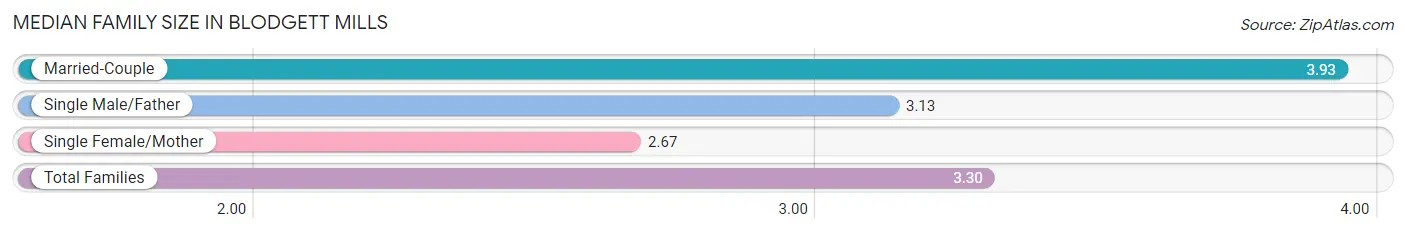
Median Family Size in Blodgett Mills
The median family size in Blodgett Mills is 3.30 persons per family, with married-couple families (28 | 41.8%) accounting for the largest median family size of 3.93 persons per family. On the other hand, single female/mother families (24 | 35.8%) represent the smallest median family size with 2.67 persons per family.
| Family Type | # Families | Family Size |
| Married-Couple | 28 (41.8%) | 3.93 |
| Single Male/Father | 15 (22.4%) | 3.13 |
| Single Female/Mother | 24 (35.8%) | 2.67 |
| Total Families | 67 (100.0%) | 3.30 |
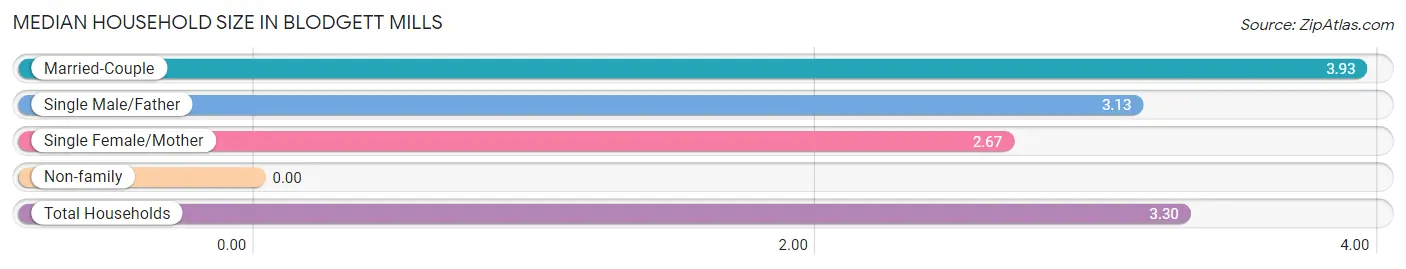
Median Household Size in Blodgett Mills
| Household Type | # Households | Household Size |
| Married-Couple | 28 (41.8%) | 3.93 |
| Single Male/Father | 15 (22.4%) | 3.13 |
| Single Female/Mother | 24 (35.8%) | 2.67 |
| Non-family | 0 (0.0%) | - |
| Total Households | 67 (100.0%) | 3.30 |
Household Size by Marriage Status in Blodgett Mills
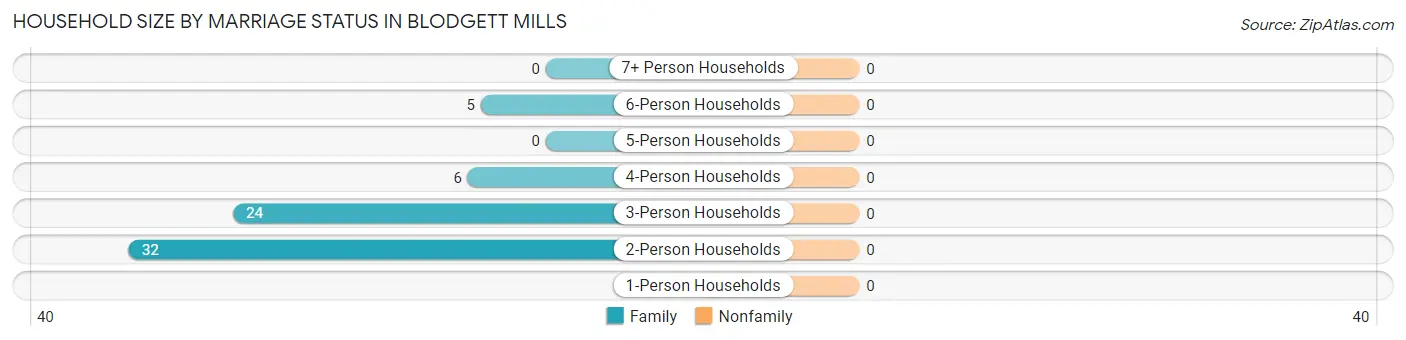
| Household Size | Family Households | Nonfamily Households |
| 1-Person Households | - | 0 (0.0%) |
| 2-Person Households | 32 (47.8%) | 0 (0.0%) |
| 3-Person Households | 24 (35.8%) | 0 (0.0%) |
| 4-Person Households | 6 (9.0%) | 0 (0.0%) |
| 5-Person Households | 0 (0.0%) | 0 (0.0%) |
| 6-Person Households | 5 (7.5%) | 0 (0.0%) |
| 7+ Person Households | 0 (0.0%) | 0 (0.0%) |
| Total | 67 (100.0%) | 0 (0.0%) |
Female Fertility in Blodgett Mills
Fertility by Age in Blodgett Mills
Average fertility rate in Blodgett Mills is 98.0 births per 1,000 women. Women in the age bracket of 35 to 50 years have the highest fertility rate with 250.0 births per 1,000 women. Women in the age bracket of 35 to 50 years acount for 100.0% of all women with births.
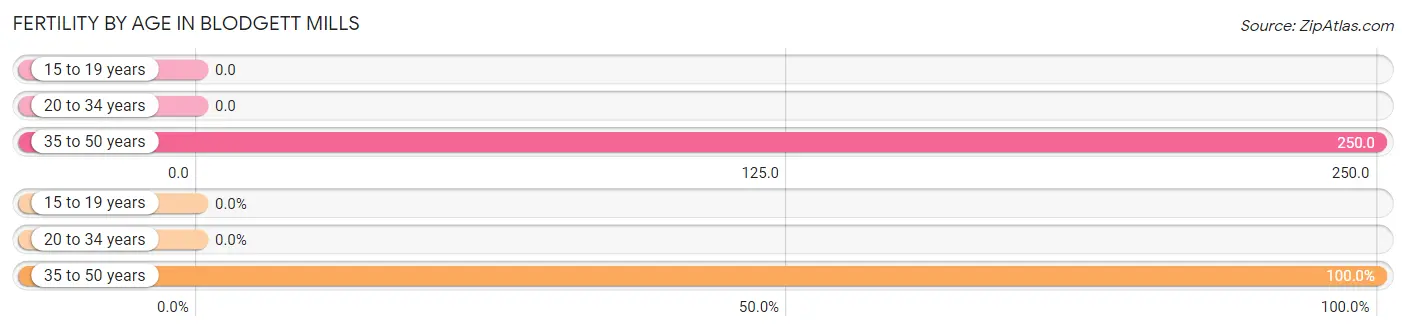
| Age Bracket | Women with Births | Births / 1,000 Women |
| 15 to 19 years | 0 (0.0%) | 0.0 |
| 20 to 34 years | 0 (0.0%) | 0.0 |
| 35 to 50 years | 4 (100.0%) | 250.0 |
| Total | 4 (100.0%) | 98.0 |
Fertility by Age by Marriage Status in Blodgett Mills
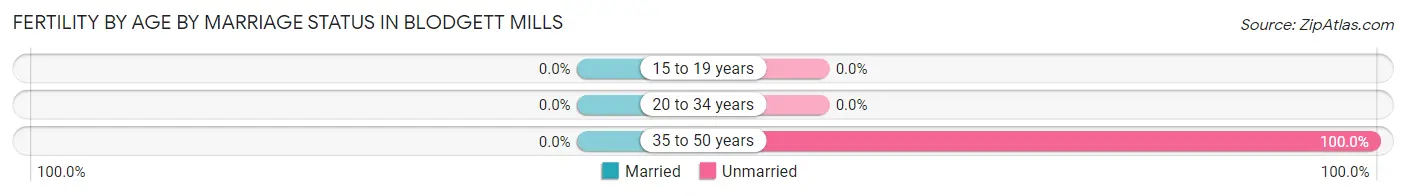
| Age Bracket | Married | Unmarried |
| 15 to 19 years | 0 (0.0%) | 0 (0.0%) |
| 20 to 34 years | 0 (0.0%) | 0 (0.0%) |
| 35 to 50 years | 0 (0.0%) | 4 (100.0%) |
| Total | 0 (0.0%) | 4 (100.0%) |
Fertility by Education in Blodgett Mills
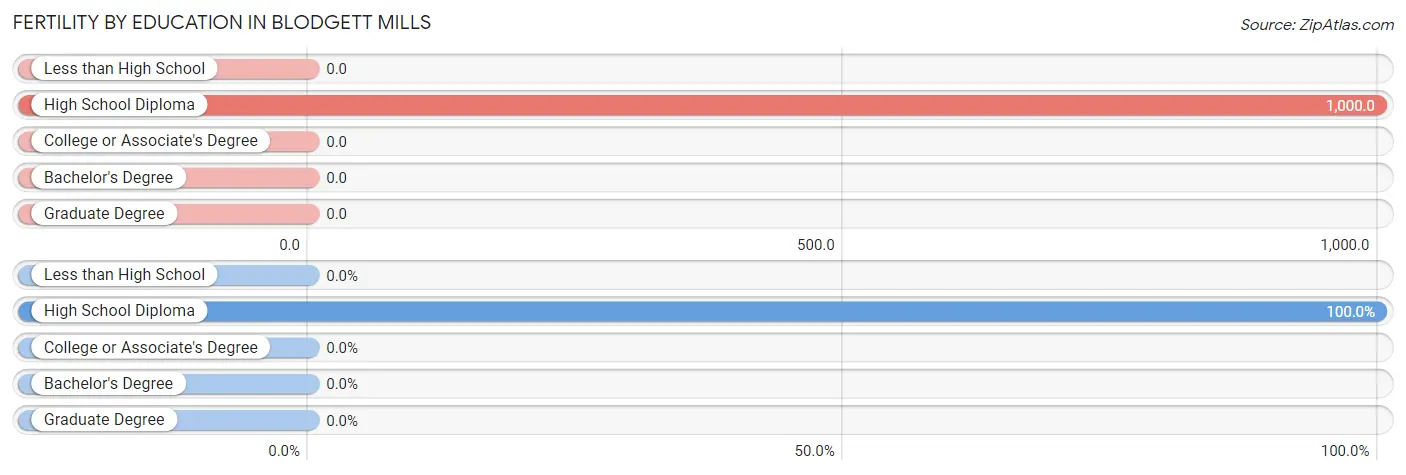
| Educational Attainment | Women with Births | Births / 1,000 Women |
| Less than High School | 0 (0.0%) | 0.0 |
| High School Diploma | 4 (100.0%) | 1,000.0 |
| College or Associate's Degree | 0 (0.0%) | 0.0 |
| Bachelor's Degree | 0 (0.0%) | 0.0 |
| Graduate Degree | 0 (0.0%) | 0.0 |
| Total | 4 (100.0%) | 98.0 |
Fertility by Education by Marriage Status in Blodgett Mills
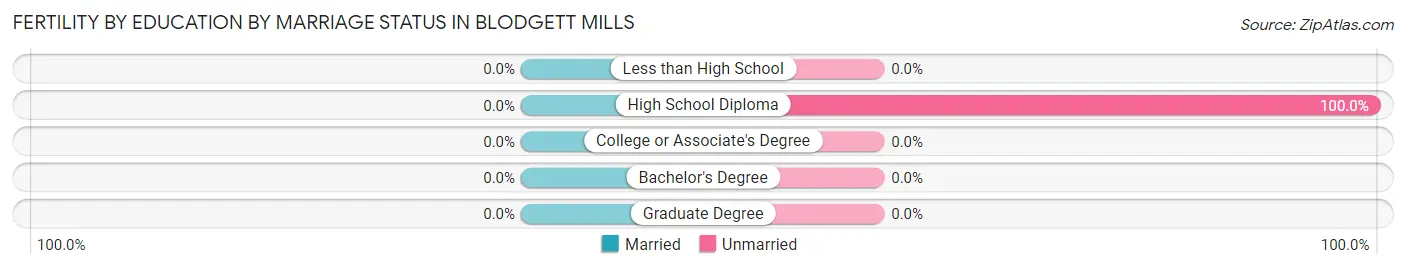
| Educational Attainment | Married | Unmarried |
| Less than High School | 0 (0.0%) | 0 (0.0%) |
| High School Diploma | 0 (0.0%) | 4 (100.0%) |
| College or Associate's Degree | 0 (0.0%) | 0 (0.0%) |
| Bachelor's Degree | 0 (0.0%) | 0 (0.0%) |
| Graduate Degree | 0 (0.0%) | 0 (0.0%) |
| Total | 0 (0.0%) | 4 (100.0%) |
Employment Characteristics in Blodgett Mills
Employment by Class of Employer in Blodgett Mills
Among the 139 employed individuals in Blodgett Mills, private company employees (102 | 73.4%), not-for-profit organizations (20 | 14.4%), and local government employees (17 | 12.2%) make up the most common classes of employment.
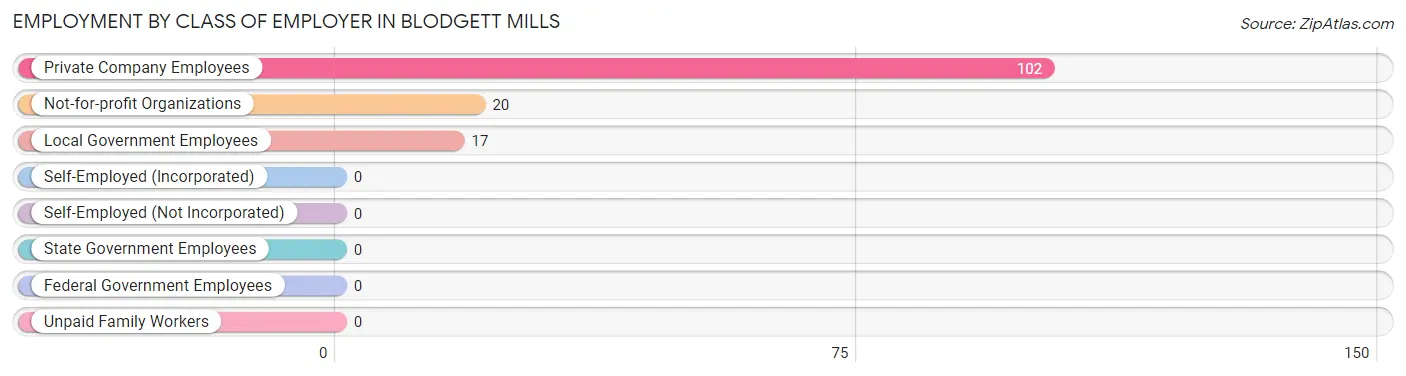
| Employer Class | # Employees | % Employees |
| Private Company Employees | 102 | 73.4% |
| Self-Employed (Incorporated) | 0 | 0.0% |
| Self-Employed (Not Incorporated) | 0 | 0.0% |
| Not-for-profit Organizations | 20 | 14.4% |
| Local Government Employees | 17 | 12.2% |
| State Government Employees | 0 | 0.0% |
| Federal Government Employees | 0 | 0.0% |
| Unpaid Family Workers | 0 | 0.0% |
| Total | 139 | 100.0% |
Employment Status by Age in Blodgett Mills
According to the labor force statistics for Blodgett Mills, out of the total population over 16 years of age (200), 76.0% or 152 individuals are in the labor force, with 8.6% or 13 of them unemployed. The age group with the highest labor force participation rate is 20 to 24 years, with 100.0% or 46 individuals in the labor force. Within the labor force, the 20 to 24 years age range has the highest percentage of unemployed individuals, with 28.3% or 13 of them being unemployed.
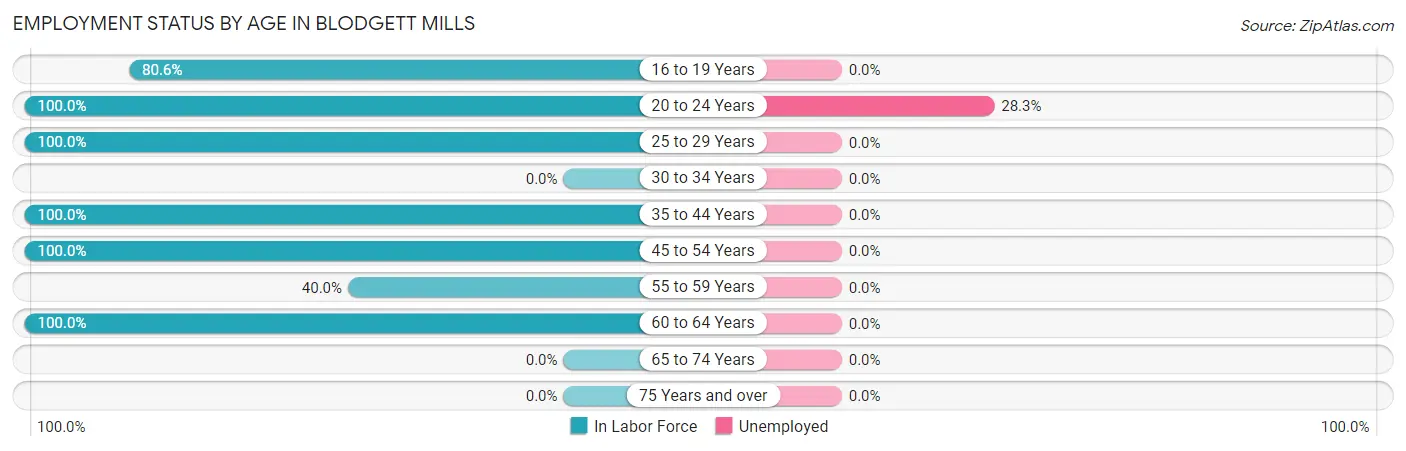
| Age Bracket | In Labor Force | Unemployed |
| 16 to 19 Years | 29 (80.6%) | 0 (0.0%) |
| 20 to 24 Years | 46 (100.0%) | 13 (28.3%) |
| 25 to 29 Years | 31 (100.0%) | 0 (0.0%) |
| 30 to 34 Years | 0 (0.0%) | 0 (0.0%) |
| 35 to 44 Years | 11 (100.0%) | 0 (0.0%) |
| 45 to 54 Years | 12 (100.0%) | 0 (0.0%) |
| 55 to 59 Years | 6 (40.0%) | 0 (0.0%) |
| 60 to 64 Years | 17 (100.0%) | 0 (0.0%) |
| 65 to 74 Years | 0 (0.0%) | 0 (0.0%) |
| 75 Years and over | 0 (0.0%) | 0 (0.0%) |
| Total | 152 (76.0%) | 13 (8.6%) |
Employment Status by Educational Attainment in Blodgett Mills
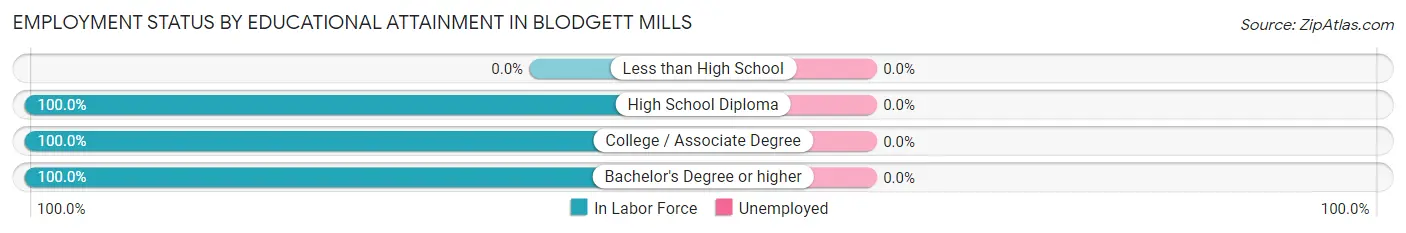
| Educational Attainment | In Labor Force | Unemployed |
| Less than High School | 0 (0.0%) | 0 (0.0%) |
| High School Diploma | 21 (100.0%) | 0 (0.0%) |
| College / Associate Degree | 19 (100.0%) | 0 (0.0%) |
| Bachelor's Degree or higher | 37 (100.0%) | 0 (0.0%) |
| Total | 77 (89.5%) | 0 (0.0%) |
Employment Occupations by Sex in Blodgett Mills
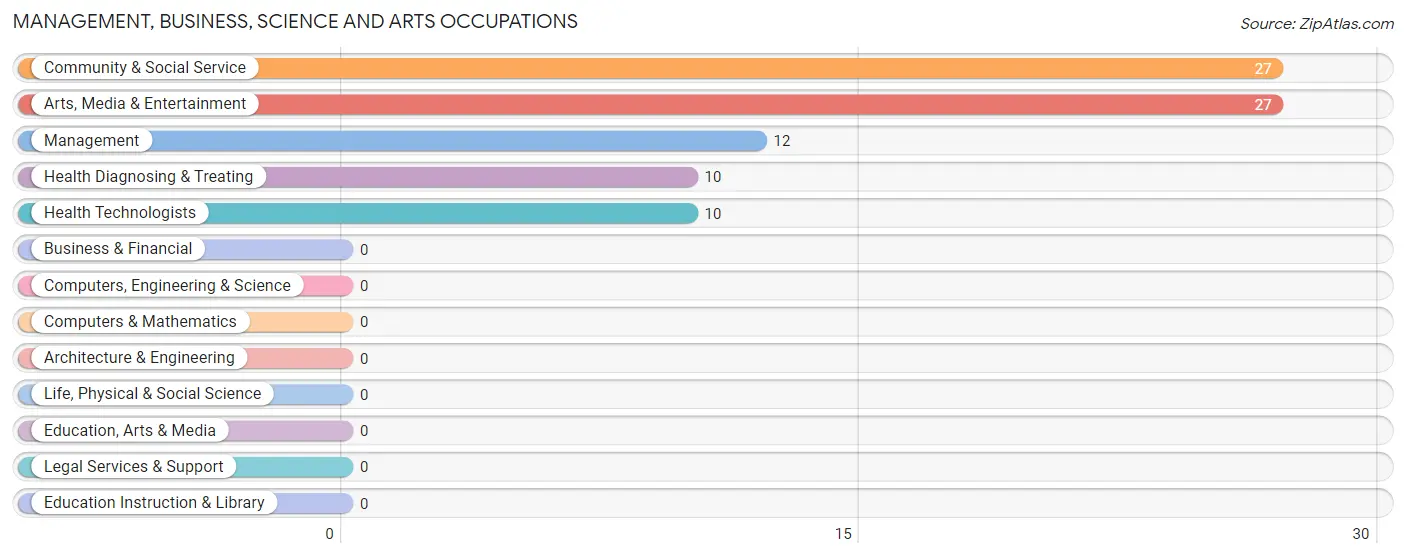
Management, Business, Science and Arts Occupations
The most common Management, Business, Science and Arts occupations in Blodgett Mills are Community & Social Service (27 | 19.4%), Arts, Media & Entertainment (27 | 19.4%), Management (12 | 8.6%), Health Diagnosing & Treating (10 | 7.2%), and Health Technologists (10 | 7.2%).
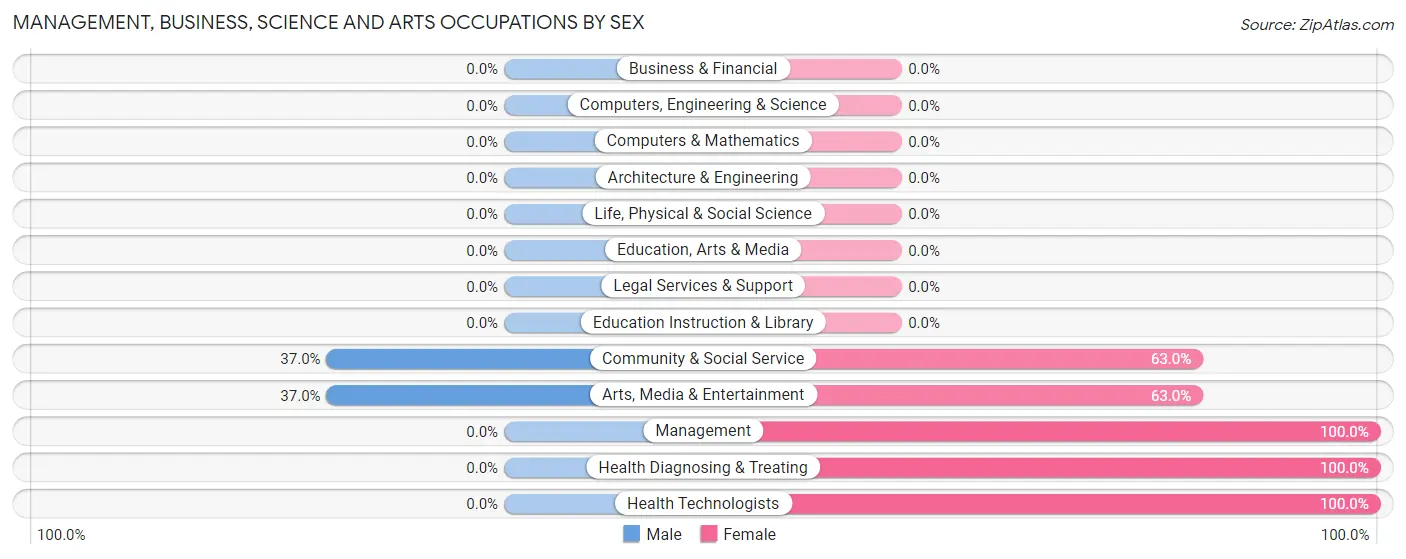
Management, Business, Science and Arts Occupations by Sex
Within the Management, Business, Science and Arts occupations in Blodgett Mills, the most male-oriented occupations are Community & Social Service (37.0%), and Arts, Media & Entertainment (37.0%), while the most female-oriented occupations are Management (100.0%), Health Diagnosing & Treating (100.0%), and Health Technologists (100.0%).
| Occupation | Male | Female |
| Management | 0 (0.0%) | 12 (100.0%) |
| Business & Financial | 0 (0.0%) | 0 (0.0%) |
| Computers, Engineering & Science | 0 (0.0%) | 0 (0.0%) |
| Computers & Mathematics | 0 (0.0%) | 0 (0.0%) |
| Architecture & Engineering | 0 (0.0%) | 0 (0.0%) |
| Life, Physical & Social Science | 0 (0.0%) | 0 (0.0%) |
| Community & Social Service | 10 (37.0%) | 17 (63.0%) |
| Education, Arts & Media | 0 (0.0%) | 0 (0.0%) |
| Legal Services & Support | 0 (0.0%) | 0 (0.0%) |
| Education Instruction & Library | 0 (0.0%) | 0 (0.0%) |
| Arts, Media & Entertainment | 10 (37.0%) | 17 (63.0%) |
| Health Diagnosing & Treating | 0 (0.0%) | 10 (100.0%) |
| Health Technologists | 0 (0.0%) | 10 (100.0%) |
| Total (Category) | 10 (20.4%) | 39 (79.6%) |
| Total (Overall) | 81 (58.3%) | 58 (41.7%) |
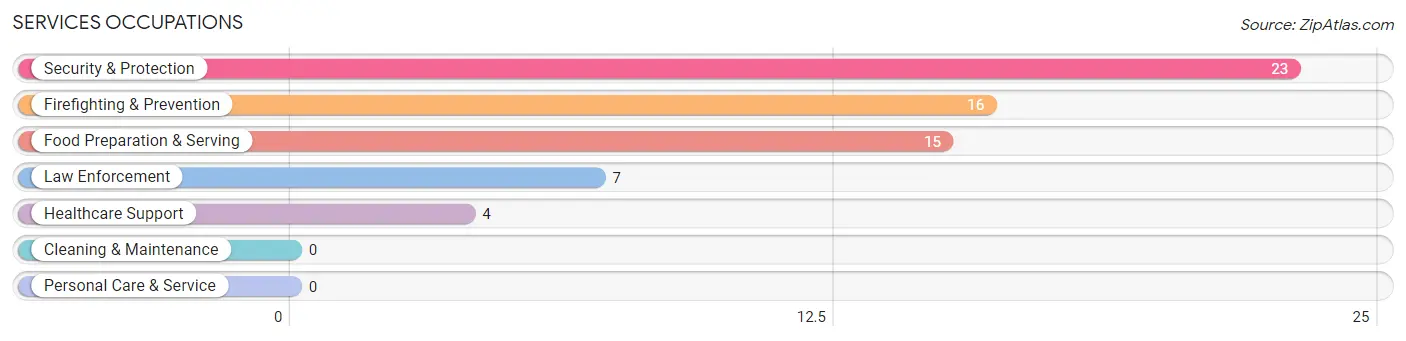
Services Occupations
The most common Services occupations in Blodgett Mills are Security & Protection (23 | 16.6%), Firefighting & Prevention (16 | 11.5%), Food Preparation & Serving (15 | 10.8%), Law Enforcement (7 | 5.0%), and Healthcare Support (4 | 2.9%).
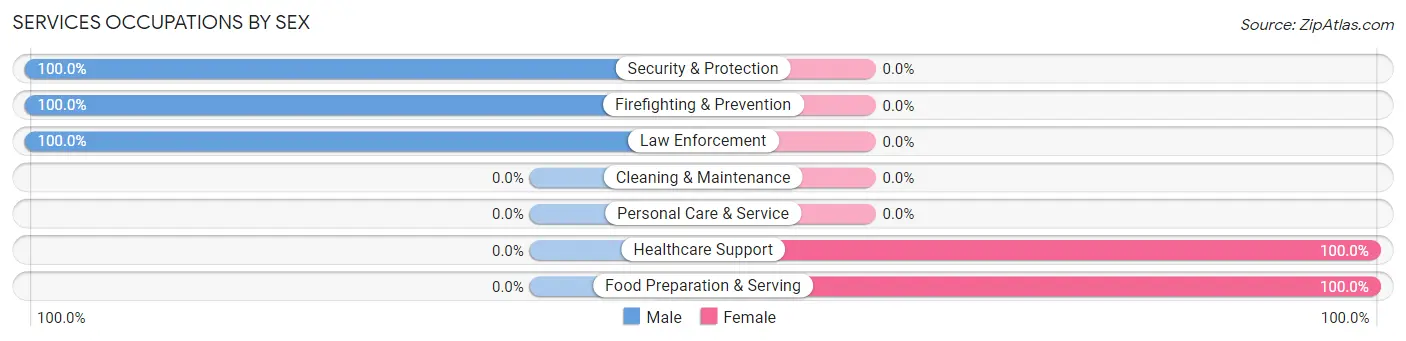
Services Occupations by Sex
Within the Services occupations in Blodgett Mills, the most male-oriented occupations are Security & Protection (100.0%), Firefighting & Prevention (100.0%), and Law Enforcement (100.0%), while the most female-oriented occupations are Healthcare Support (100.0%), and Food Preparation & Serving (100.0%).
| Occupation | Male | Female |
| Healthcare Support | 0 (0.0%) | 4 (100.0%) |
| Security & Protection | 23 (100.0%) | 0 (0.0%) |
| Firefighting & Prevention | 16 (100.0%) | 0 (0.0%) |
| Law Enforcement | 7 (100.0%) | 0 (0.0%) |
| Food Preparation & Serving | 0 (0.0%) | 15 (100.0%) |
| Cleaning & Maintenance | 0 (0.0%) | 0 (0.0%) |
| Personal Care & Service | 0 (0.0%) | 0 (0.0%) |
| Total (Category) | 23 (54.8%) | 19 (45.2%) |
| Total (Overall) | 81 (58.3%) | 58 (41.7%) |
Sales and Office Occupations
The most common Sales and Office occupations in Blodgett Mills are , and Sales & Related (6 | 4.3%).
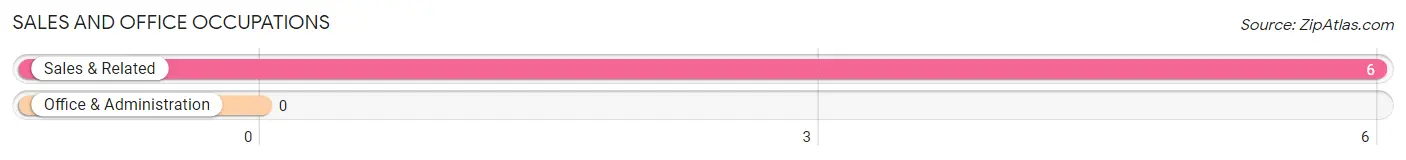
Sales and Office Occupations by Sex
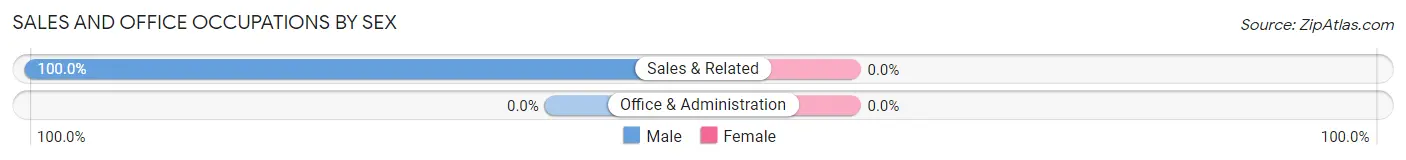
| Occupation | Male | Female |
| Sales & Related | 6 (100.0%) | 0 (0.0%) |
| Office & Administration | 0 (0.0%) | 0 (0.0%) |
| Total (Category) | 6 (100.0%) | 0 (0.0%) |
| Total (Overall) | 81 (58.3%) | 58 (41.7%) |
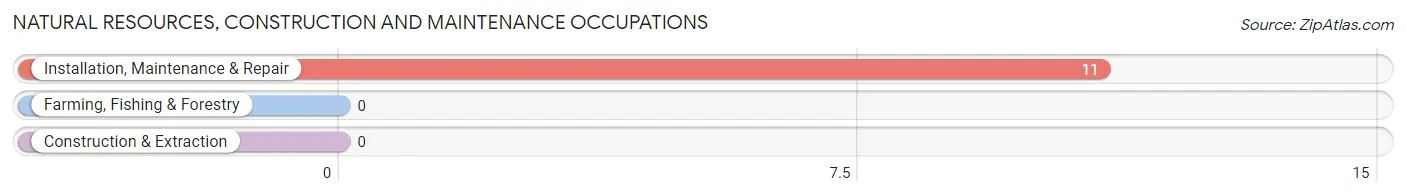
Natural Resources, Construction and Maintenance Occupations
The most common Natural Resources, Construction and Maintenance occupations in Blodgett Mills are , and Installation, Maintenance & Repair (11 | 7.9%).
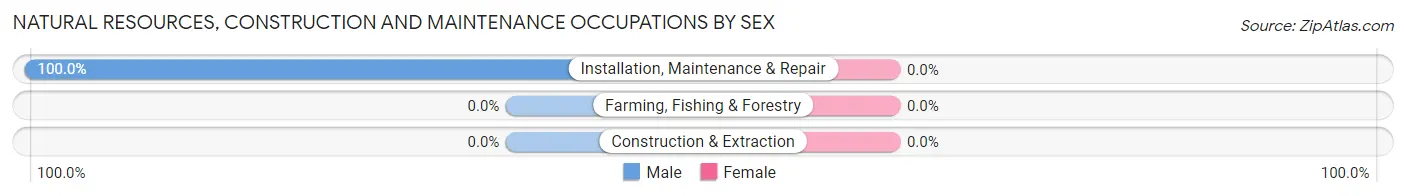
Natural Resources, Construction and Maintenance Occupations by Sex
| Occupation | Male | Female |
| Farming, Fishing & Forestry | 0 (0.0%) | 0 (0.0%) |
| Construction & Extraction | 0 (0.0%) | 0 (0.0%) |
| Installation, Maintenance & Repair | 11 (100.0%) | 0 (0.0%) |
| Total (Category) | 11 (100.0%) | 0 (0.0%) |
| Total (Overall) | 81 (58.3%) | 58 (41.7%) |
Production, Transportation and Moving Occupations
The most common Production, Transportation and Moving occupations in Blodgett Mills are , and Transportation (31 | 22.3%).
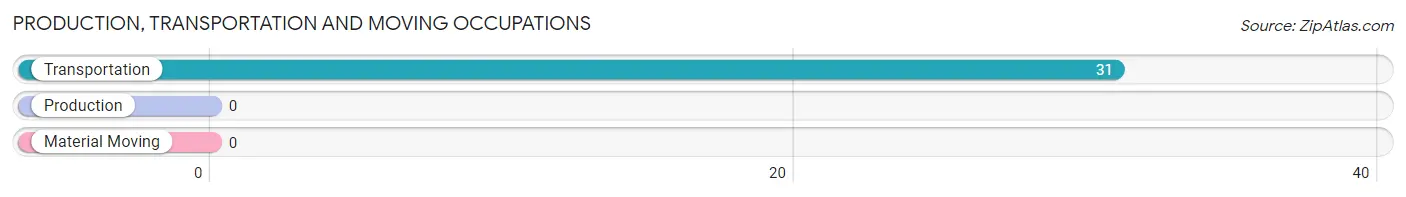
Production, Transportation and Moving Occupations by Sex
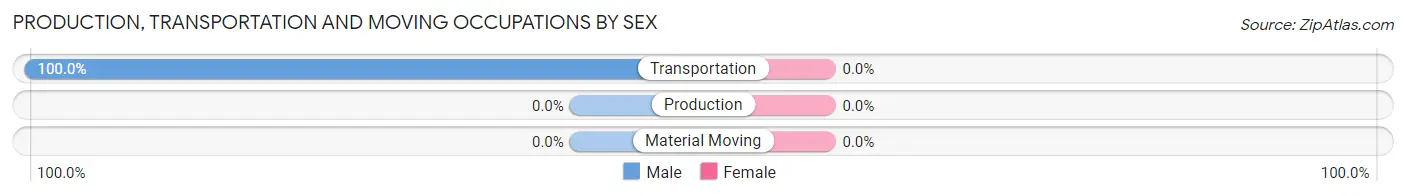
| Occupation | Male | Female |
| Production | 0 (0.0%) | 0 (0.0%) |
| Transportation | 31 (100.0%) | 0 (0.0%) |
| Material Moving | 0 (0.0%) | 0 (0.0%) |
| Total (Category) | 31 (100.0%) | 0 (0.0%) |
| Total (Overall) | 81 (58.3%) | 58 (41.7%) |
Employment Industries by Sex in Blodgett Mills
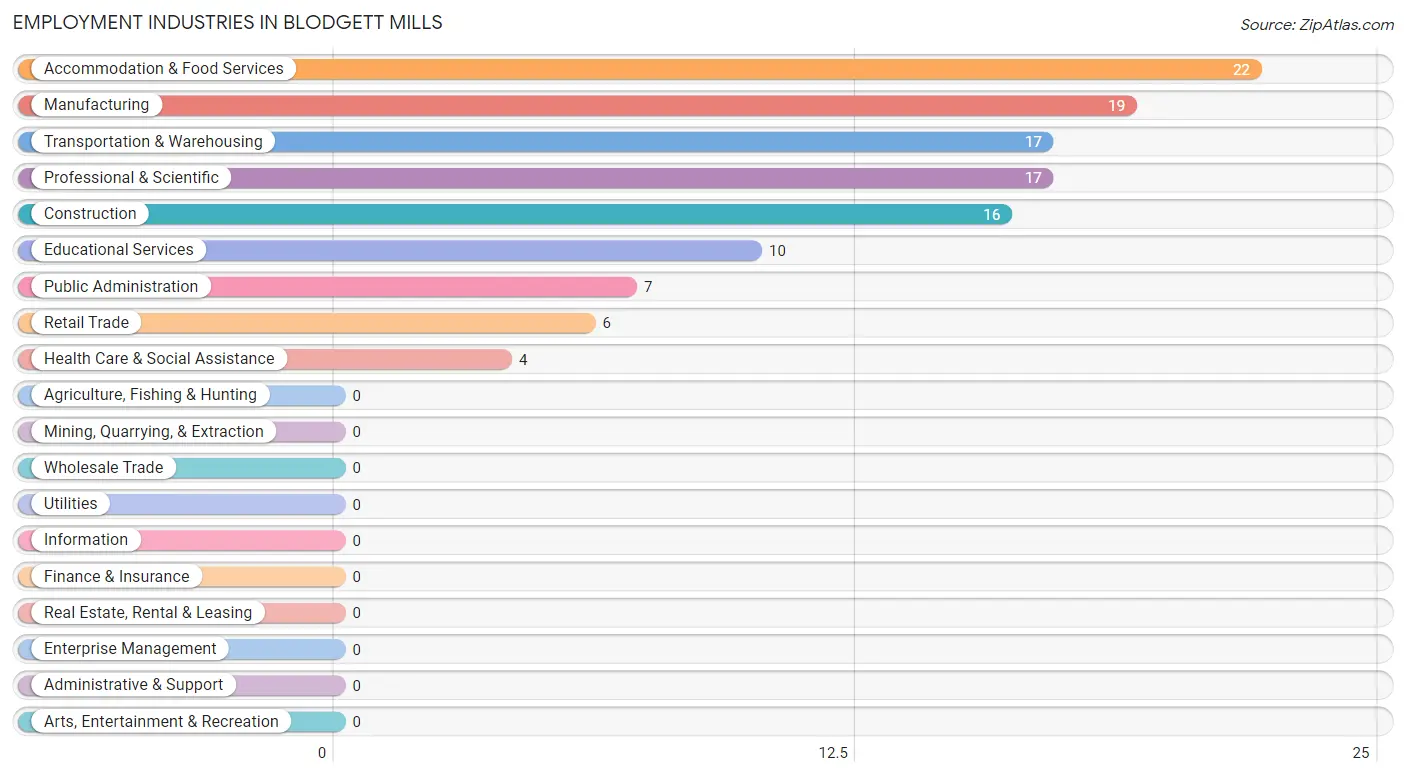
Employment Industries in Blodgett Mills
The major employment industries in Blodgett Mills include Accommodation & Food Services (22 | 15.8%), Manufacturing (19 | 13.7%), Transportation & Warehousing (17 | 12.2%), Professional & Scientific (17 | 12.2%), and Construction (16 | 11.5%).
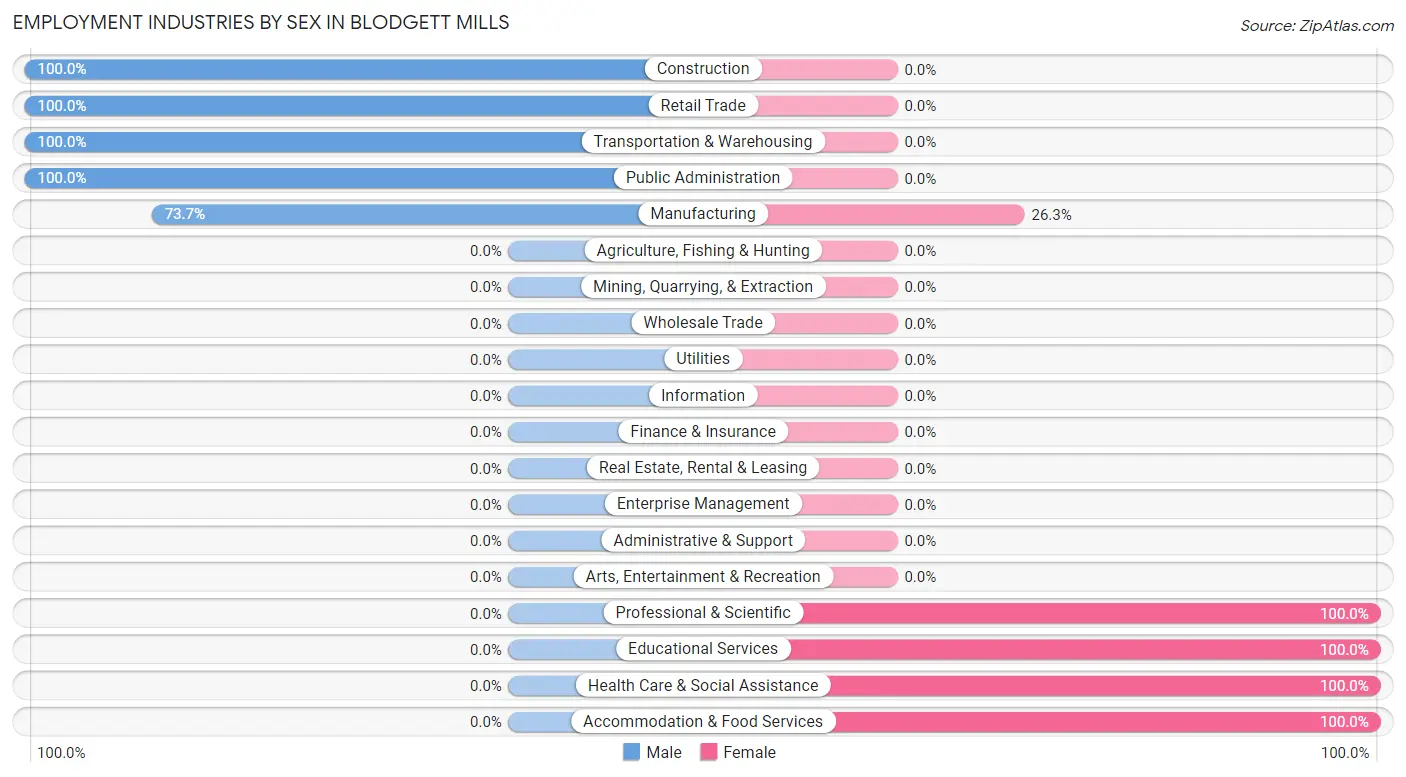
Employment Industries by Sex in Blodgett Mills
The Blodgett Mills industries that see more men than women are Construction (100.0%), Retail Trade (100.0%), and Transportation & Warehousing (100.0%), whereas the industries that tend to have a higher number of women are Professional & Scientific (100.0%), Educational Services (100.0%), and Health Care & Social Assistance (100.0%).
| Industry | Male | Female |
| Agriculture, Fishing & Hunting | 0 (0.0%) | 0 (0.0%) |
| Mining, Quarrying, & Extraction | 0 (0.0%) | 0 (0.0%) |
| Construction | 16 (100.0%) | 0 (0.0%) |
| Manufacturing | 14 (73.7%) | 5 (26.3%) |
| Wholesale Trade | 0 (0.0%) | 0 (0.0%) |
| Retail Trade | 6 (100.0%) | 0 (0.0%) |
| Transportation & Warehousing | 17 (100.0%) | 0 (0.0%) |
| Utilities | 0 (0.0%) | 0 (0.0%) |
| Information | 0 (0.0%) | 0 (0.0%) |
| Finance & Insurance | 0 (0.0%) | 0 (0.0%) |
| Real Estate, Rental & Leasing | 0 (0.0%) | 0 (0.0%) |
| Professional & Scientific | 0 (0.0%) | 17 (100.0%) |
| Enterprise Management | 0 (0.0%) | 0 (0.0%) |
| Administrative & Support | 0 (0.0%) | 0 (0.0%) |
| Educational Services | 0 (0.0%) | 10 (100.0%) |
| Health Care & Social Assistance | 0 (0.0%) | 4 (100.0%) |
| Arts, Entertainment & Recreation | 0 (0.0%) | 0 (0.0%) |
| Accommodation & Food Services | 0 (0.0%) | 22 (100.0%) |
| Public Administration | 7 (100.0%) | 0 (0.0%) |
| Total | 81 (58.3%) | 58 (41.7%) |
Education in Blodgett Mills
School Enrollment in Blodgett Mills
The most common levels of schooling among the 52 students in Blodgett Mills are graduate / professional (16 | 30.8%), college / undergraduate (15 | 28.8%), and middle school (14 | 26.9%).
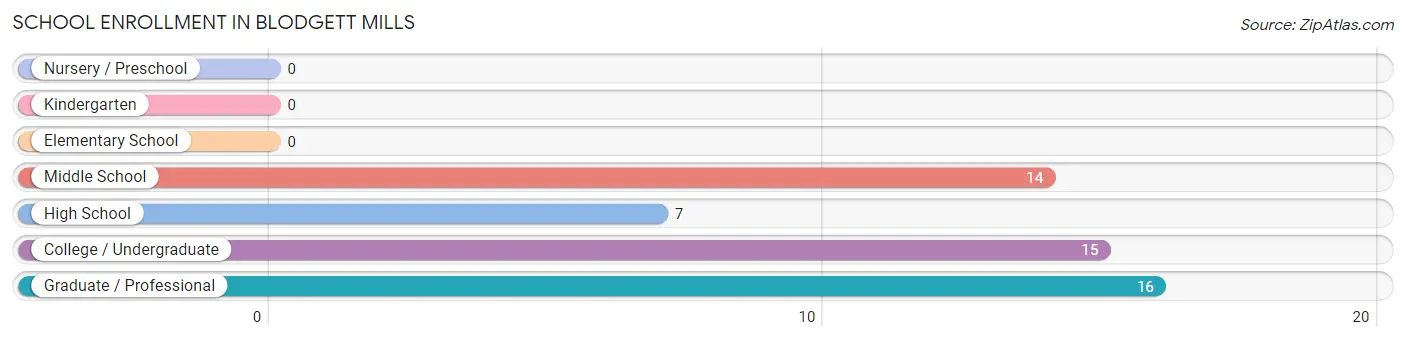
| School Level | # Students | % Students |
| Nursery / Preschool | 0 | 0.0% |
| Kindergarten | 0 | 0.0% |
| Elementary School | 0 | 0.0% |
| Middle School | 14 | 26.9% |
| High School | 7 | 13.5% |
| College / Undergraduate | 15 | 28.8% |
| Graduate / Professional | 16 | 30.8% |
| Total | 52 | 100.0% |
School Enrollment by Age by Funding Source in Blodgett Mills
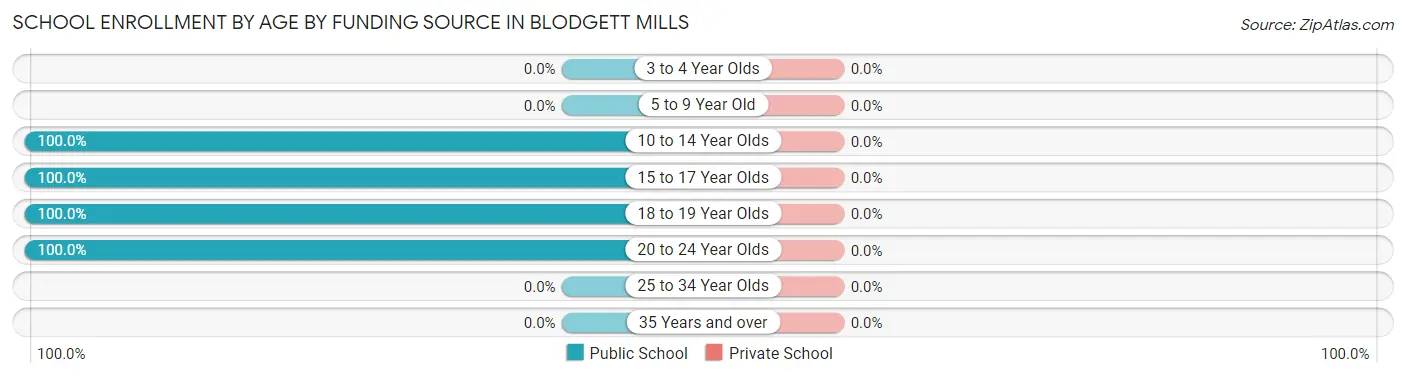
| Age Bracket | Public School | Private School |
| 3 to 4 Year Olds | 0 (0.0%) | 0 (0.0%) |
| 5 to 9 Year Old | 0 (0.0%) | 0 (0.0%) |
| 10 to 14 Year Olds | 14 (100.0%) | 0 (0.0%) |
| 15 to 17 Year Olds | 7 (100.0%) | 0 (0.0%) |
| 18 to 19 Year Olds | 15 (100.0%) | 0 (0.0%) |
| 20 to 24 Year Olds | 16 (100.0%) | 0 (0.0%) |
| 25 to 34 Year Olds | 0 (0.0%) | 0 (0.0%) |
| 35 Years and over | 0 (0.0%) | 0 (0.0%) |
| Total | 52 (100.0%) | 0 (0.0%) |
Educational Attainment by Field of Study in Blodgett Mills
Visual & performing arts (27 | 50.0%), literature & languages (17 | 31.5%), and science & technology (10 | 18.5%) are the most common fields of study among 54 individuals in Blodgett Mills who have obtained a bachelor's degree or higher.
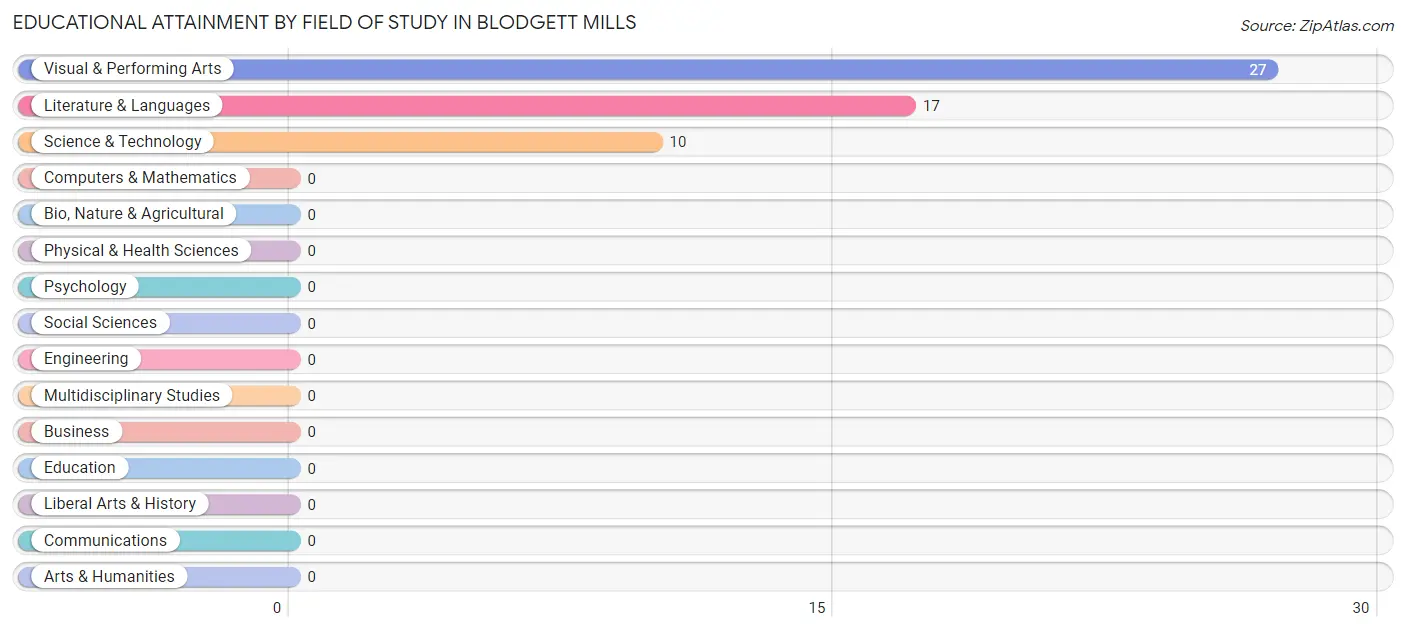
| Field of Study | # Graduates | % Graduates |
| Computers & Mathematics | 0 | 0.0% |
| Bio, Nature & Agricultural | 0 | 0.0% |
| Physical & Health Sciences | 0 | 0.0% |
| Psychology | 0 | 0.0% |
| Social Sciences | 0 | 0.0% |
| Engineering | 0 | 0.0% |
| Multidisciplinary Studies | 0 | 0.0% |
| Science & Technology | 10 | 18.5% |
| Business | 0 | 0.0% |
| Education | 0 | 0.0% |
| Literature & Languages | 17 | 31.5% |
| Liberal Arts & History | 0 | 0.0% |
| Visual & Performing Arts | 27 | 50.0% |
| Communications | 0 | 0.0% |
| Arts & Humanities | 0 | 0.0% |
| Total | 54 | 100.0% |
Transportation & Commute in Blodgett Mills
Vehicle Availability by Sex in Blodgett Mills
The most prevalent vehicle ownership categories in Blodgett Mills are males with 3 vehicles (41, accounting for 50.6%) and females with 3 vehicles (34, making up 70.7%).
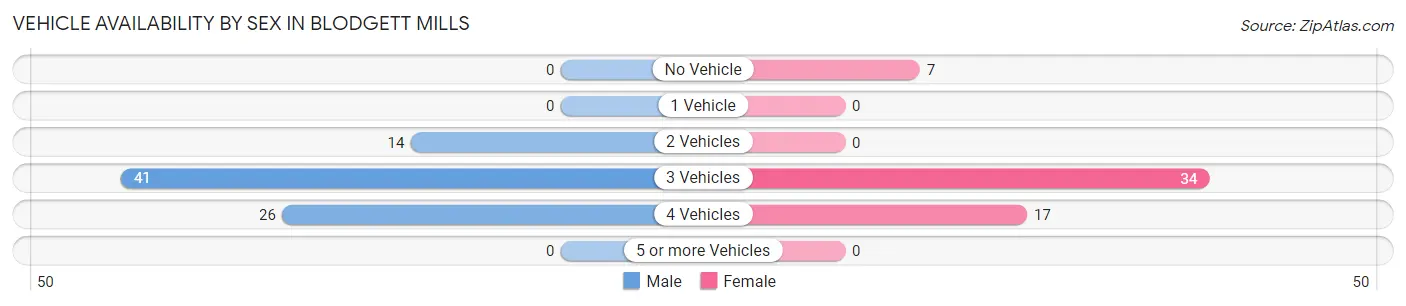
| Vehicles Available | Male | Female |
| No Vehicle | 0 (0.0%) | 7 (12.1%) |
| 1 Vehicle | 0 (0.0%) | 0 (0.0%) |
| 2 Vehicles | 14 (17.3%) | 0 (0.0%) |
| 3 Vehicles | 41 (50.6%) | 34 (58.6%) |
| 4 Vehicles | 26 (32.1%) | 17 (29.3%) |
| 5 or more Vehicles | 0 (0.0%) | 0 (0.0%) |
| Total | 81 (100.0%) | 58 (100.0%) |
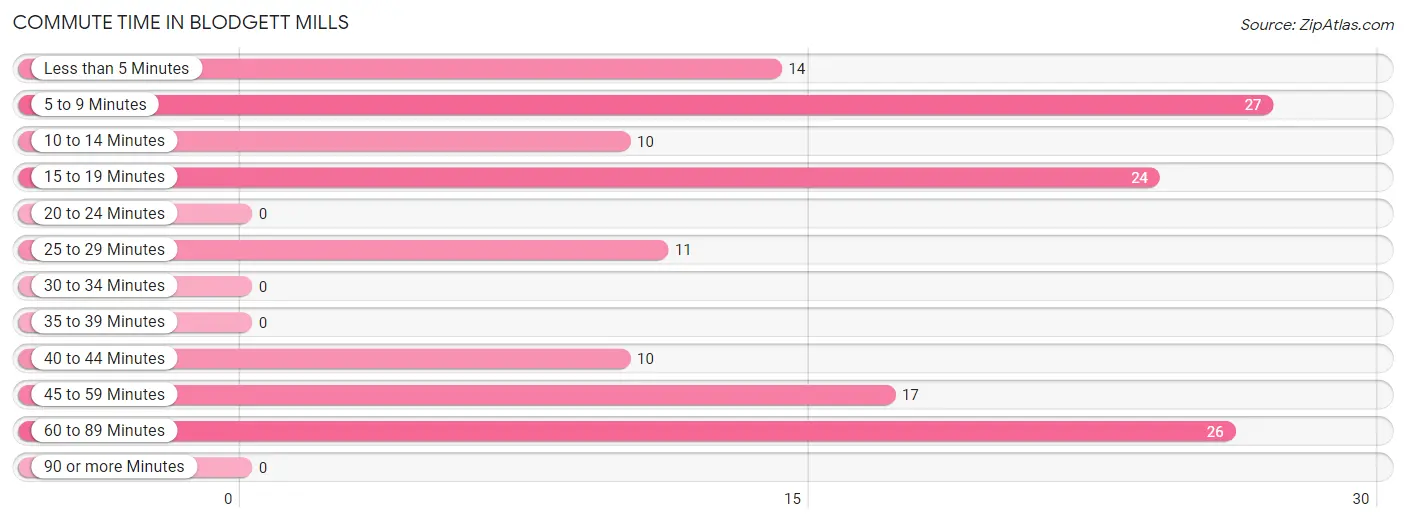
Commute Time in Blodgett Mills
The most frequently occuring commute durations in Blodgett Mills are 5 to 9 minutes (27 commuters, 19.4%), 60 to 89 minutes (26 commuters, 18.7%), and 15 to 19 minutes (24 commuters, 17.3%).
| Commute Time | # Commuters | % Commuters |
| Less than 5 Minutes | 14 | 10.1% |
| 5 to 9 Minutes | 27 | 19.4% |
| 10 to 14 Minutes | 10 | 7.2% |
| 15 to 19 Minutes | 24 | 17.3% |
| 20 to 24 Minutes | 0 | 0.0% |
| 25 to 29 Minutes | 11 | 7.9% |
| 30 to 34 Minutes | 0 | 0.0% |
| 35 to 39 Minutes | 0 | 0.0% |
| 40 to 44 Minutes | 10 | 7.2% |
| 45 to 59 Minutes | 17 | 12.2% |
| 60 to 89 Minutes | 26 | 18.7% |
| 90 or more Minutes | 0 | 0.0% |
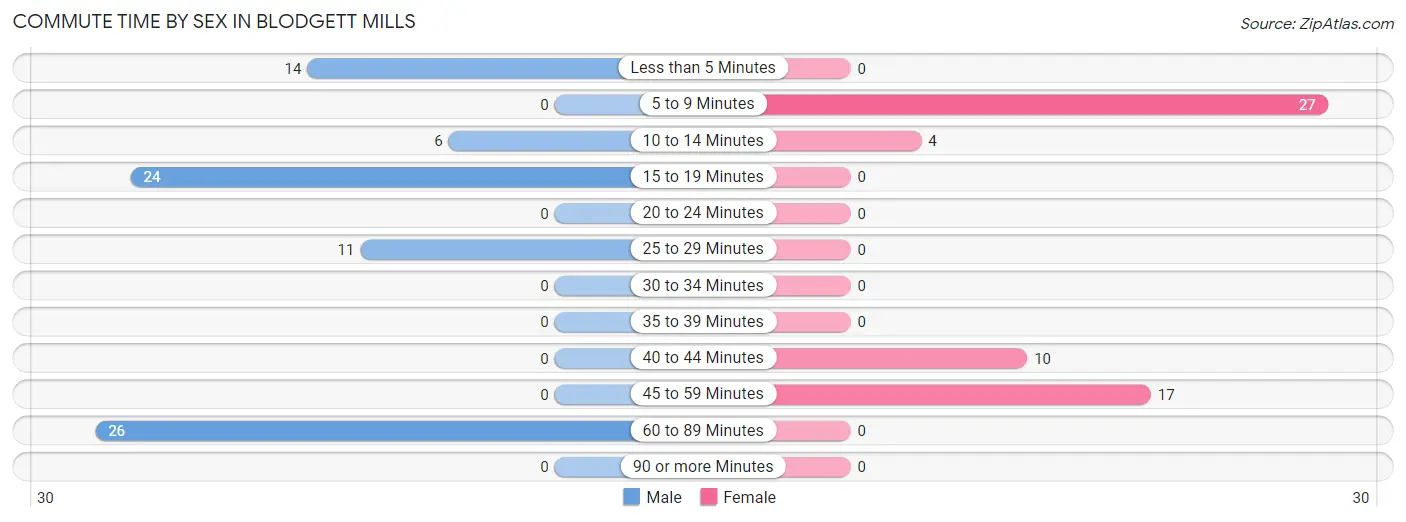
Commute Time by Sex in Blodgett Mills
The most common commute times in Blodgett Mills are 60 to 89 minutes (26 commuters, 32.1%) for males and 5 to 9 minutes (27 commuters, 46.6%) for females.
| Commute Time | Male | Female |
| Less than 5 Minutes | 14 (17.3%) | 0 (0.0%) |
| 5 to 9 Minutes | 0 (0.0%) | 27 (46.6%) |
| 10 to 14 Minutes | 6 (7.4%) | 4 (6.9%) |
| 15 to 19 Minutes | 24 (29.6%) | 0 (0.0%) |
| 20 to 24 Minutes | 0 (0.0%) | 0 (0.0%) |
| 25 to 29 Minutes | 11 (13.6%) | 0 (0.0%) |
| 30 to 34 Minutes | 0 (0.0%) | 0 (0.0%) |
| 35 to 39 Minutes | 0 (0.0%) | 0 (0.0%) |
| 40 to 44 Minutes | 0 (0.0%) | 10 (17.2%) |
| 45 to 59 Minutes | 0 (0.0%) | 17 (29.3%) |
| 60 to 89 Minutes | 26 (32.1%) | 0 (0.0%) |
| 90 or more Minutes | 0 (0.0%) | 0 (0.0%) |
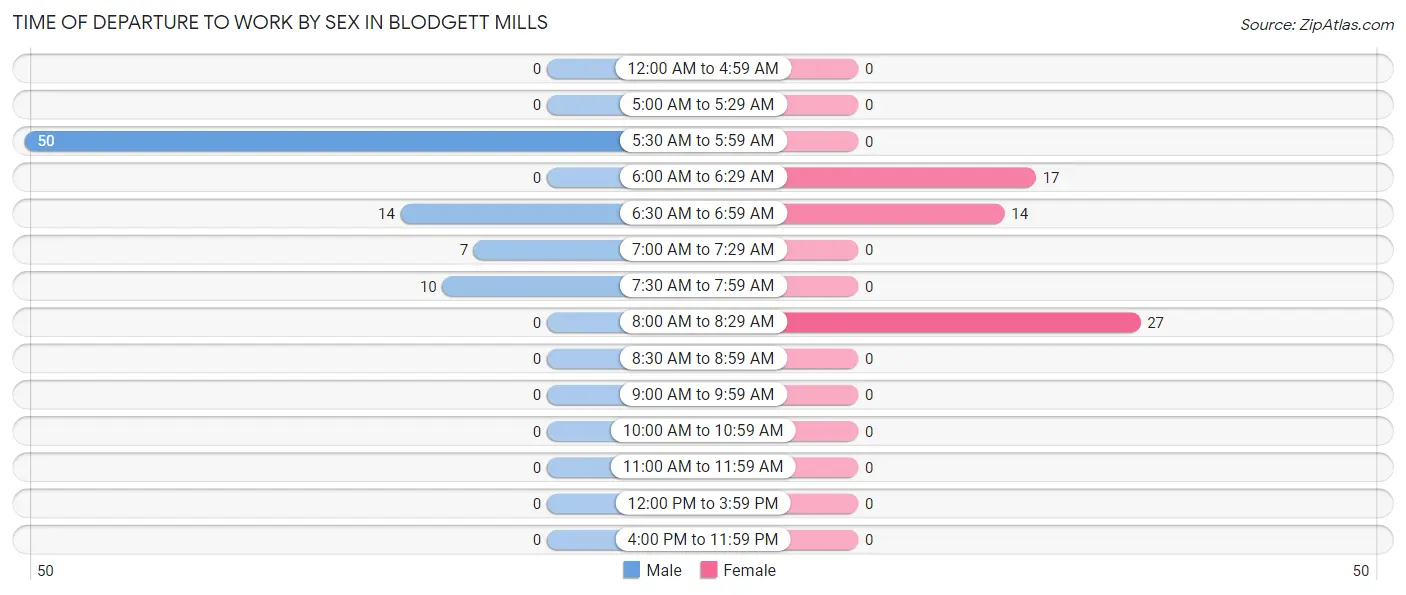
Time of Departure to Work by Sex in Blodgett Mills
The most frequent times of departure to work in Blodgett Mills are 5:30 AM to 5:59 AM (50, 61.7%) for males and 8:00 AM to 8:29 AM (27, 46.6%) for females.
| Time of Departure | Male | Female |
| 12:00 AM to 4:59 AM | 0 (0.0%) | 0 (0.0%) |
| 5:00 AM to 5:29 AM | 0 (0.0%) | 0 (0.0%) |
| 5:30 AM to 5:59 AM | 50 (61.7%) | 0 (0.0%) |
| 6:00 AM to 6:29 AM | 0 (0.0%) | 17 (29.3%) |
| 6:30 AM to 6:59 AM | 14 (17.3%) | 14 (24.1%) |
| 7:00 AM to 7:29 AM | 7 (8.6%) | 0 (0.0%) |
| 7:30 AM to 7:59 AM | 10 (12.3%) | 0 (0.0%) |
| 8:00 AM to 8:29 AM | 0 (0.0%) | 27 (46.6%) |
| 8:30 AM to 8:59 AM | 0 (0.0%) | 0 (0.0%) |
| 9:00 AM to 9:59 AM | 0 (0.0%) | 0 (0.0%) |
| 10:00 AM to 10:59 AM | 0 (0.0%) | 0 (0.0%) |
| 11:00 AM to 11:59 AM | 0 (0.0%) | 0 (0.0%) |
| 12:00 PM to 3:59 PM | 0 (0.0%) | 0 (0.0%) |
| 4:00 PM to 11:59 PM | 0 (0.0%) | 0 (0.0%) |
| Total | 81 (100.0%) | 58 (100.0%) |
Housing Occupancy in Blodgett Mills
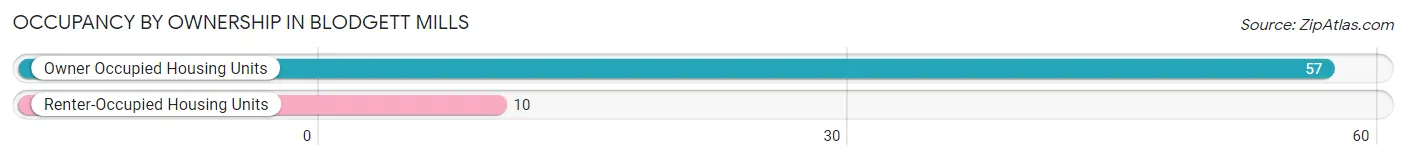
Occupancy by Ownership in Blodgett Mills
Of the total 67 dwellings in Blodgett Mills, owner-occupied units account for 57 (85.1%), while renter-occupied units make up 10 (14.9%).
| Occupancy | # Housing Units | % Housing Units |
| Owner Occupied Housing Units | 57 | 85.1% |
| Renter-Occupied Housing Units | 10 | 14.9% |
| Total Occupied Housing Units | 67 | 100.0% |
Occupancy by Household Size in Blodgett Mills
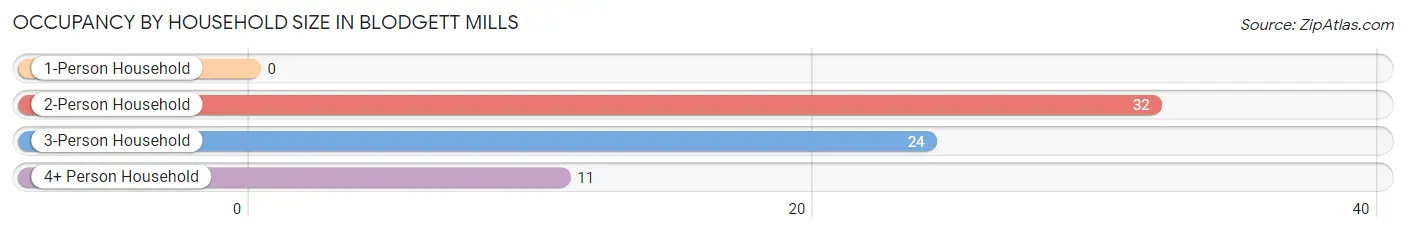
| Household Size | # Housing Units | % Housing Units |
| 1-Person Household | 0 | 0.0% |
| 2-Person Household | 32 | 47.8% |
| 3-Person Household | 24 | 35.8% |
| 4+ Person Household | 11 | 16.4% |
| Total Housing Units | 67 | 100.0% |
Occupancy by Ownership by Household Size in Blodgett Mills
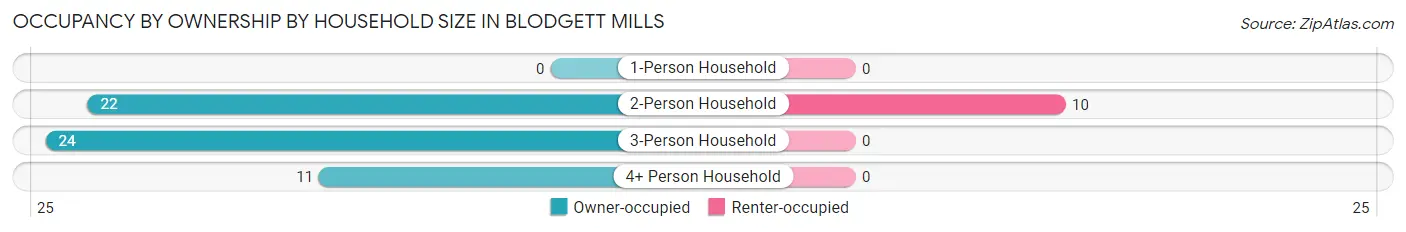
| Household Size | Owner-occupied | Renter-occupied |
| 1-Person Household | 0 (0.0%) | 0 (0.0%) |
| 2-Person Household | 22 (68.8%) | 10 (31.2%) |
| 3-Person Household | 24 (100.0%) | 0 (0.0%) |
| 4+ Person Household | 11 (100.0%) | 0 (0.0%) |
| Total Housing Units | 57 (85.1%) | 10 (14.9%) |
Occupancy by Educational Attainment in Blodgett Mills
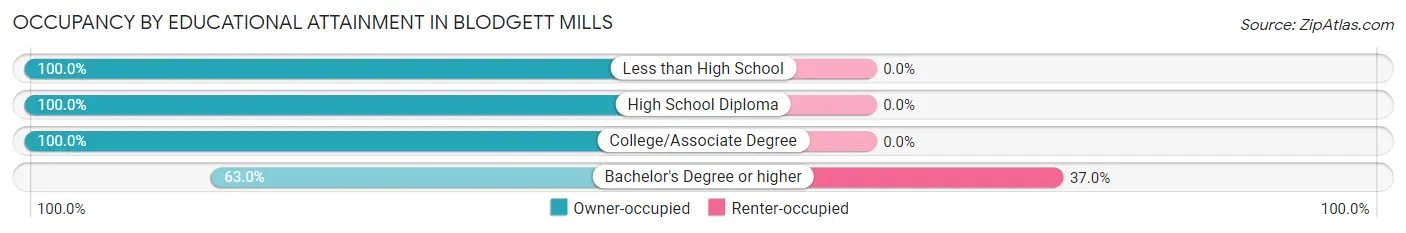
| Household Size | Owner-occupied | Renter-occupied |
| Less than High School | 9 (100.0%) | 0 (0.0%) |
| High School Diploma | 19 (100.0%) | 0 (0.0%) |
| College/Associate Degree | 12 (100.0%) | 0 (0.0%) |
| Bachelor's Degree or higher | 17 (63.0%) | 10 (37.0%) |
Occupancy by Age of Householder in Blodgett Mills
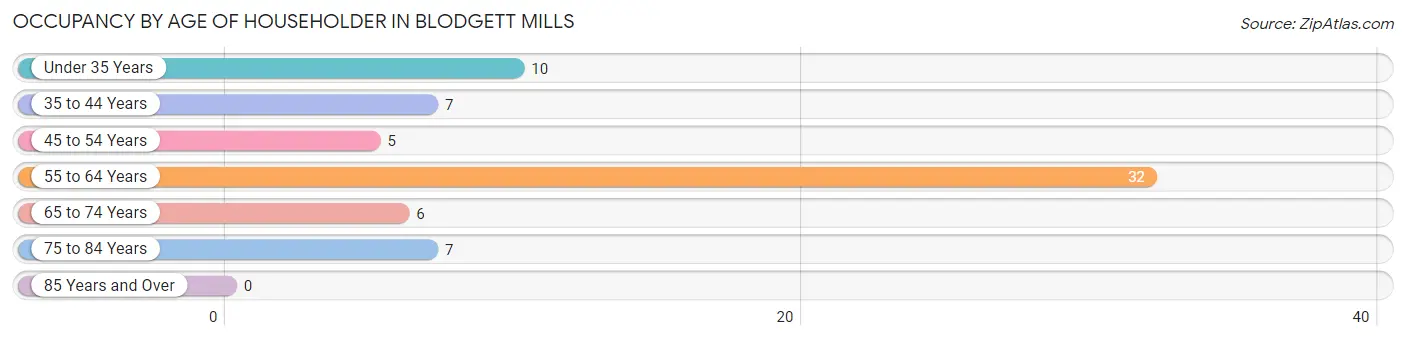
| Age Bracket | # Households | % Households |
| Under 35 Years | 10 | 14.9% |
| 35 to 44 Years | 7 | 10.4% |
| 45 to 54 Years | 5 | 7.5% |
| 55 to 64 Years | 32 | 47.8% |
| 65 to 74 Years | 6 | 9.0% |
| 75 to 84 Years | 7 | 10.4% |
| 85 Years and Over | 0 | 0.0% |
| Total | 67 | 100.0% |
Housing Finances in Blodgett Mills
Median Income by Occupancy in Blodgett Mills
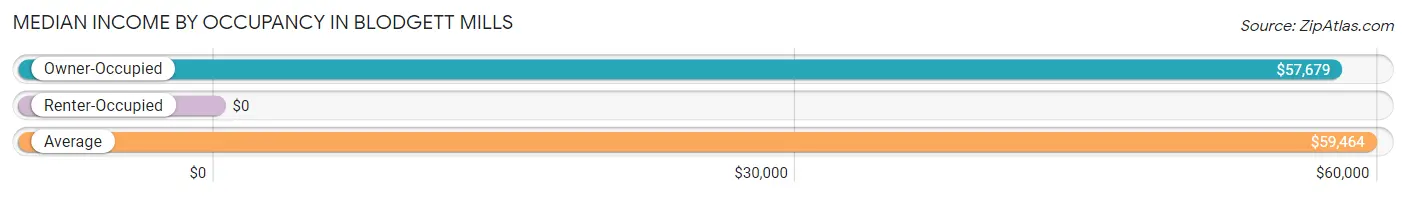
| Occupancy Type | # Households | Median Income |
| Owner-Occupied | 57 (85.1%) | $57,679 |
| Renter-Occupied | 10 (14.9%) | $0 |
| Average | 67 (100.0%) | $59,464 |
Occupancy by Householder Income Bracket in Blodgett Mills
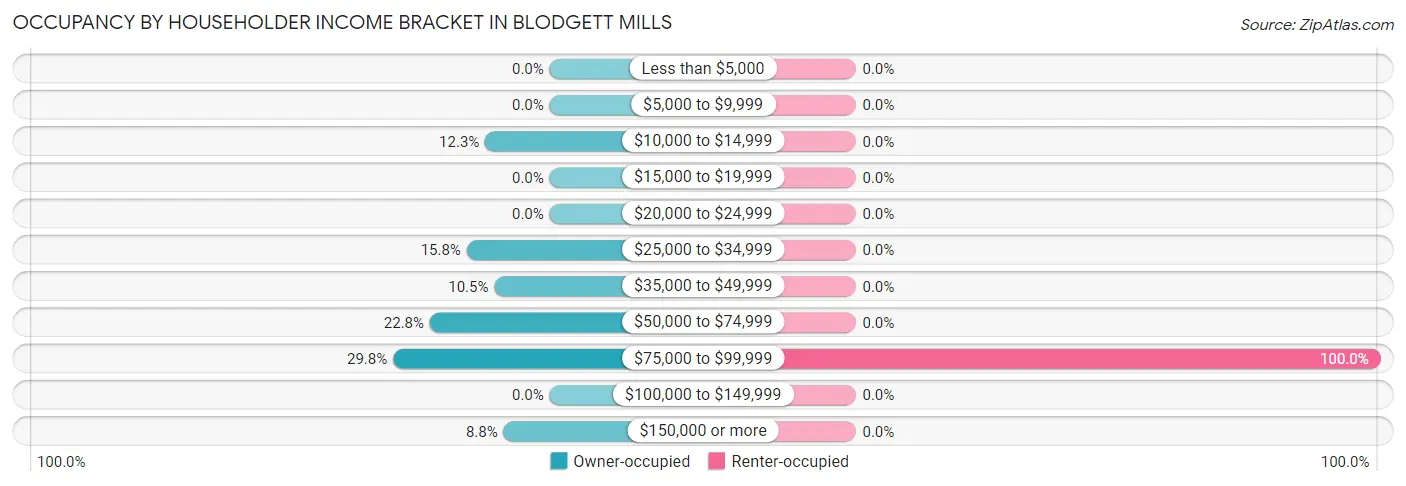
| Income Bracket | Owner-occupied | Renter-occupied |
| Less than $5,000 | 0 (0.0%) | 0 (0.0%) |
| $5,000 to $9,999 | 0 (0.0%) | 0 (0.0%) |
| $10,000 to $14,999 | 7 (12.3%) | 0 (0.0%) |
| $15,000 to $19,999 | 0 (0.0%) | 0 (0.0%) |
| $20,000 to $24,999 | 0 (0.0%) | 0 (0.0%) |
| $25,000 to $34,999 | 9 (15.8%) | 0 (0.0%) |
| $35,000 to $49,999 | 6 (10.5%) | 0 (0.0%) |
| $50,000 to $74,999 | 13 (22.8%) | 0 (0.0%) |
| $75,000 to $99,999 | 17 (29.8%) | 10 (100.0%) |
| $100,000 to $149,999 | 0 (0.0%) | 0 (0.0%) |
| $150,000 or more | 5 (8.8%) | 0 (0.0%) |
| Total | 57 (100.0%) | 10 (100.0%) |
Monthly Housing Cost Tiers in Blodgett Mills
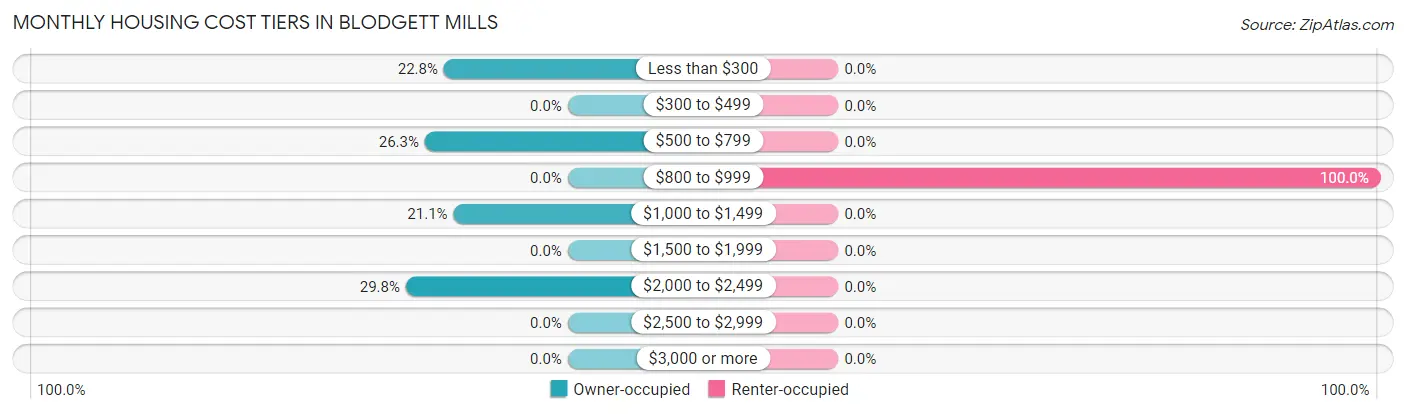
| Monthly Cost | Owner-occupied | Renter-occupied |
| Less than $300 | 13 (22.8%) | 0 (0.0%) |
| $300 to $499 | 0 (0.0%) | 0 (0.0%) |
| $500 to $799 | 15 (26.3%) | 0 (0.0%) |
| $800 to $999 | 0 (0.0%) | 10 (100.0%) |
| $1,000 to $1,499 | 12 (21.0%) | 0 (0.0%) |
| $1,500 to $1,999 | 0 (0.0%) | 0 (0.0%) |
| $2,000 to $2,499 | 17 (29.8%) | 0 (0.0%) |
| $2,500 to $2,999 | 0 (0.0%) | 0 (0.0%) |
| $3,000 or more | 0 (0.0%) | 0 (0.0%) |
| Total | 57 (100.0%) | 10 (100.0%) |
Physical Housing Characteristics in Blodgett Mills
Housing Structures in Blodgett Mills
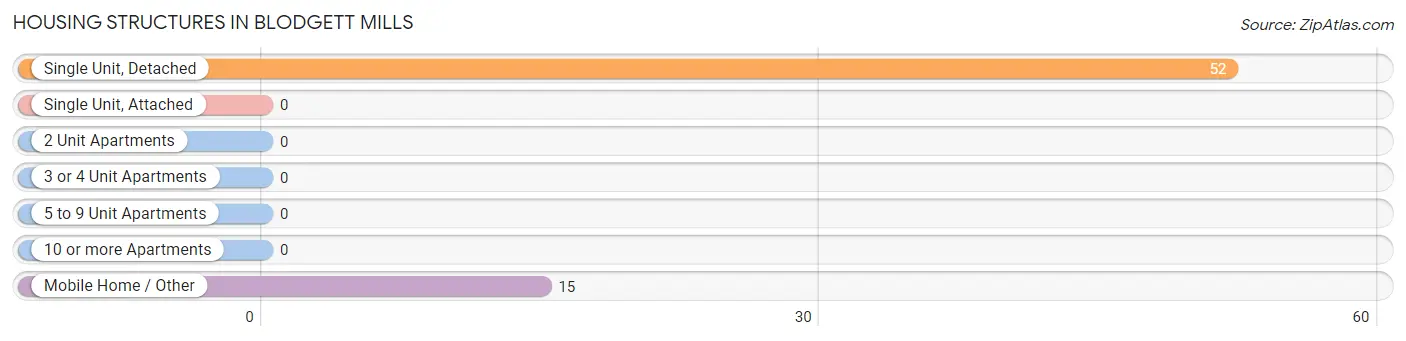
| Structure Type | # Housing Units | % Housing Units |
| Single Unit, Detached | 52 | 77.6% |
| Single Unit, Attached | 0 | 0.0% |
| 2 Unit Apartments | 0 | 0.0% |
| 3 or 4 Unit Apartments | 0 | 0.0% |
| 5 to 9 Unit Apartments | 0 | 0.0% |
| 10 or more Apartments | 0 | 0.0% |
| Mobile Home / Other | 15 | 22.4% |
| Total | 67 | 100.0% |
Housing Structures by Occupancy in Blodgett Mills
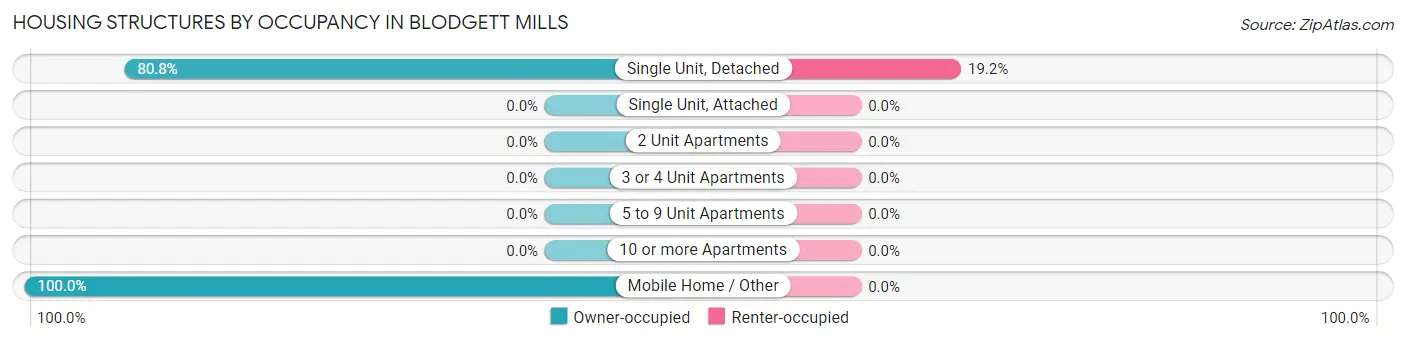
| Structure Type | Owner-occupied | Renter-occupied |
| Single Unit, Detached | 42 (80.8%) | 10 (19.2%) |
| Single Unit, Attached | 0 (0.0%) | 0 (0.0%) |
| 2 Unit Apartments | 0 (0.0%) | 0 (0.0%) |
| 3 or 4 Unit Apartments | 0 (0.0%) | 0 (0.0%) |
| 5 to 9 Unit Apartments | 0 (0.0%) | 0 (0.0%) |
| 10 or more Apartments | 0 (0.0%) | 0 (0.0%) |
| Mobile Home / Other | 15 (100.0%) | 0 (0.0%) |
| Total | 57 (85.1%) | 10 (14.9%) |
Housing Structures by Number of Rooms in Blodgett Mills
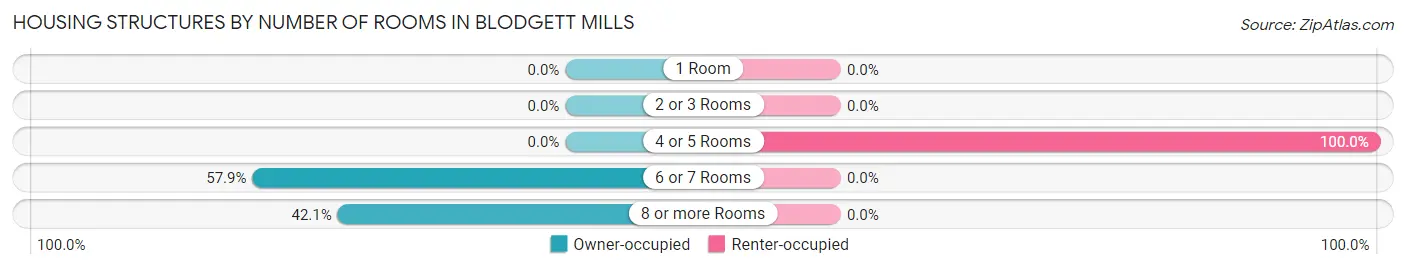
| Number of Rooms | Owner-occupied | Renter-occupied |
| 1 Room | 0 (0.0%) | 0 (0.0%) |
| 2 or 3 Rooms | 0 (0.0%) | 0 (0.0%) |
| 4 or 5 Rooms | 0 (0.0%) | 10 (100.0%) |
| 6 or 7 Rooms | 33 (57.9%) | 0 (0.0%) |
| 8 or more Rooms | 24 (42.1%) | 0 (0.0%) |
| Total | 57 (100.0%) | 10 (100.0%) |
Housing Structure by Heating Type in Blodgett Mills
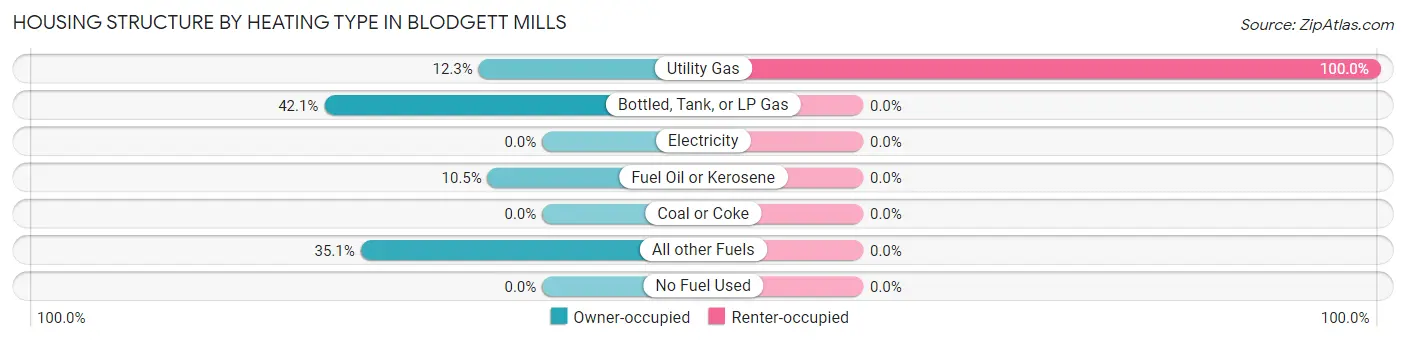
| Heating Type | Owner-occupied | Renter-occupied |
| Utility Gas | 7 (12.3%) | 10 (100.0%) |
| Bottled, Tank, or LP Gas | 24 (42.1%) | 0 (0.0%) |
| Electricity | 0 (0.0%) | 0 (0.0%) |
| Fuel Oil or Kerosene | 6 (10.5%) | 0 (0.0%) |
| Coal or Coke | 0 (0.0%) | 0 (0.0%) |
| All other Fuels | 20 (35.1%) | 0 (0.0%) |
| No Fuel Used | 0 (0.0%) | 0 (0.0%) |
| Total | 57 (100.0%) | 10 (100.0%) |
Household Vehicle Usage in Blodgett Mills
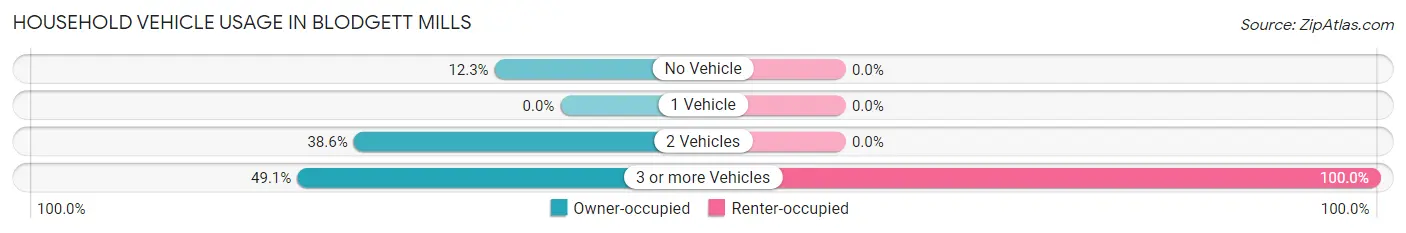
| Vehicles per Household | Owner-occupied | Renter-occupied |
| No Vehicle | 7 (12.3%) | 0 (0.0%) |
| 1 Vehicle | 0 (0.0%) | 0 (0.0%) |
| 2 Vehicles | 22 (38.6%) | 0 (0.0%) |
| 3 or more Vehicles | 28 (49.1%) | 10 (100.0%) |
| Total | 57 (100.0%) | 10 (100.0%) |
Real Estate & Mortgages in Blodgett Mills
Real Estate and Mortgage Overview in Blodgett Mills
| Characteristic | Without Mortgage | With Mortgage |
| Housing Units | 28 | 29 |
| Median Property Value | $145,800 | $0 |
| Median Household Income | $31,944 | $5 |
| Monthly Housing Costs | - | - |
| Real Estate Taxes | $938 | $0 |
Property Value by Mortgage Status in Blodgett Mills
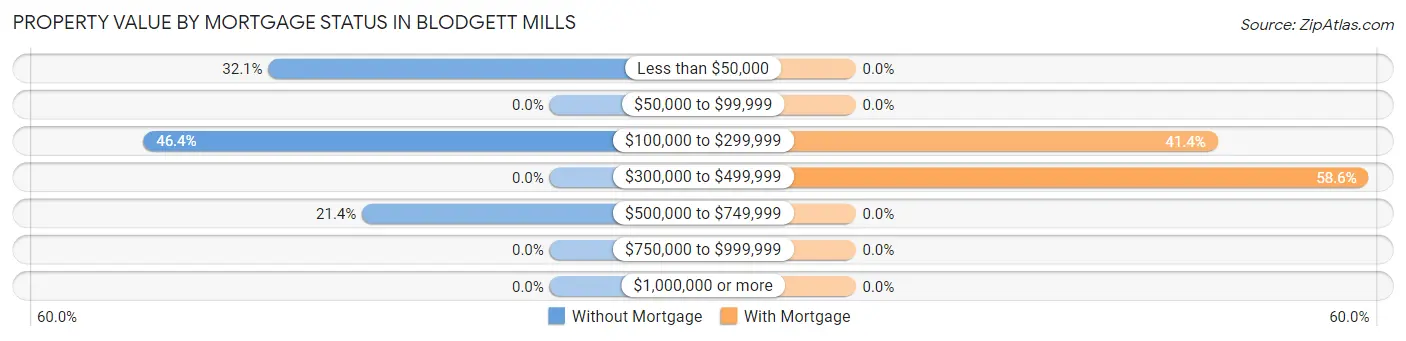
| Property Value | Without Mortgage | With Mortgage |
| Less than $50,000 | 9 (32.1%) | 0 (0.0%) |
| $50,000 to $99,999 | 0 (0.0%) | 0 (0.0%) |
| $100,000 to $299,999 | 13 (46.4%) | 12 (41.4%) |
| $300,000 to $499,999 | 0 (0.0%) | 17 (58.6%) |
| $500,000 to $749,999 | 6 (21.4%) | 0 (0.0%) |
| $750,000 to $999,999 | 0 (0.0%) | 0 (0.0%) |
| $1,000,000 or more | 0 (0.0%) | 0 (0.0%) |
| Total | 28 (100.0%) | 29 (100.0%) |
Household Income by Mortgage Status in Blodgett Mills
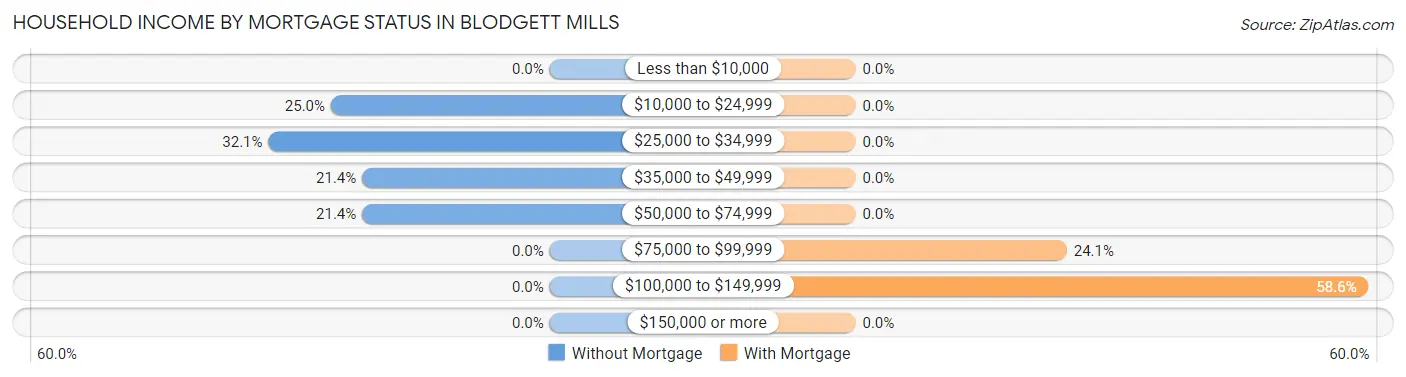
| Household Income | Without Mortgage | With Mortgage |
| Less than $10,000 | 0 (0.0%) | 0 (0.0%) |
| $10,000 to $24,999 | 7 (25.0%) | 0 (0.0%) |
| $25,000 to $34,999 | 9 (32.1%) | 0 (0.0%) |
| $35,000 to $49,999 | 6 (21.4%) | 0 (0.0%) |
| $50,000 to $74,999 | 6 (21.4%) | 0 (0.0%) |
| $75,000 to $99,999 | 0 (0.0%) | 7 (24.1%) |
| $100,000 to $149,999 | 0 (0.0%) | 17 (58.6%) |
| $150,000 or more | 0 (0.0%) | 0 (0.0%) |
| Total | 28 (100.0%) | 29 (100.0%) |
Property Value to Household Income Ratio in Blodgett Mills
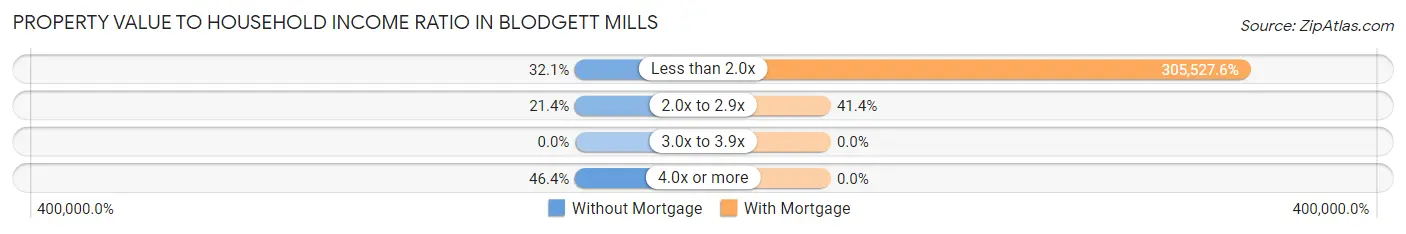
| Value-to-Income Ratio | Without Mortgage | With Mortgage |
| Less than 2.0x | 9 (32.1%) | 88,603 (305,527.6%) |
| 2.0x to 2.9x | 6 (21.4%) | 12 (41.4%) |
| 3.0x to 3.9x | 0 (0.0%) | 0 (0.0%) |
| 4.0x or more | 13 (46.4%) | 0 (0.0%) |
| Total | 28 (100.0%) | 29 (100.0%) |
Real Estate Taxes by Mortgage Status in Blodgett Mills
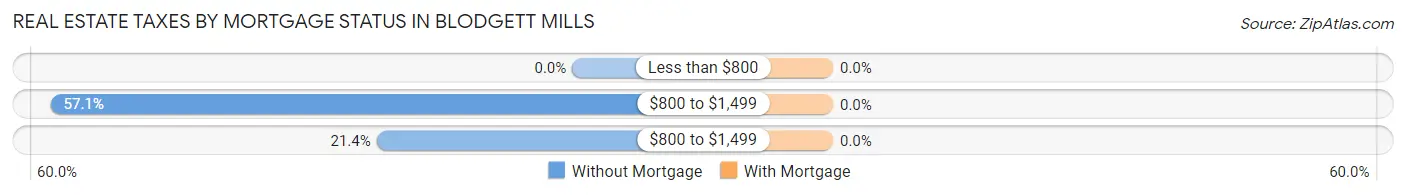
| Property Taxes | Without Mortgage | With Mortgage |
| Less than $800 | 0 (0.0%) | 0 (0.0%) |
| $800 to $1,499 | 16 (57.1%) | 0 (0.0%) |
| $800 to $1,499 | 6 (21.4%) | 0 (0.0%) |
| Total | 28 (100.0%) | 29 (100.0%) |
Health & Disability in Blodgett Mills
Health Insurance Coverage by Age in Blodgett Mills
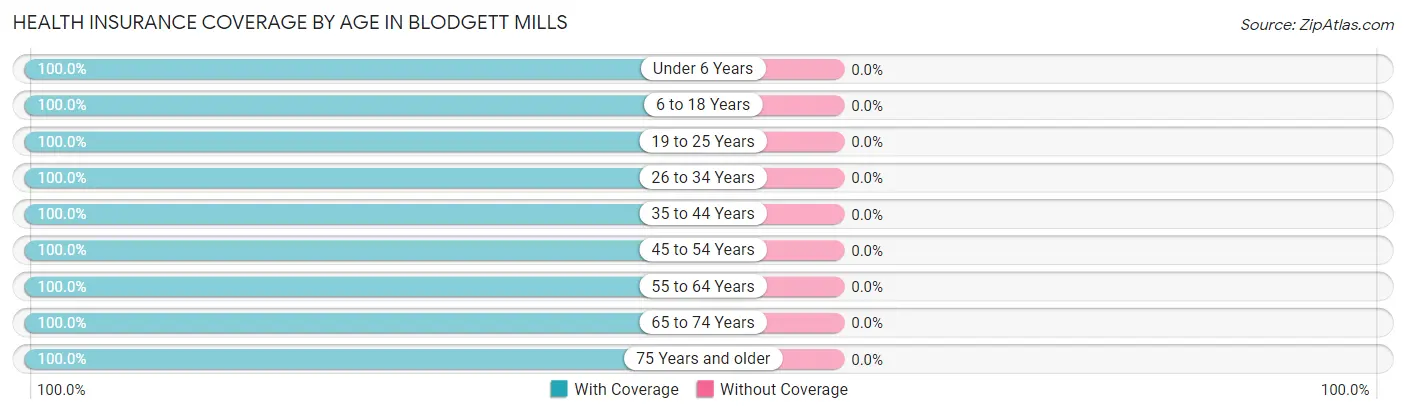
| Age Bracket | With Coverage | Without Coverage |
| Under 6 Years | 7 (100.0%) | 0 (0.0%) |
| 6 to 18 Years | 21 (100.0%) | 0 (0.0%) |
| 19 to 25 Years | 85 (100.0%) | 0 (0.0%) |
| 26 to 34 Years | 21 (100.0%) | 0 (0.0%) |
| 35 to 44 Years | 11 (100.0%) | 0 (0.0%) |
| 45 to 54 Years | 12 (100.0%) | 0 (0.0%) |
| 55 to 64 Years | 32 (100.0%) | 0 (0.0%) |
| 65 to 74 Years | 17 (100.0%) | 0 (0.0%) |
| 75 Years and older | 15 (100.0%) | 0 (0.0%) |
| Total | 221 (100.0%) | 0 (0.0%) |
Health Insurance Coverage by Citizenship Status in Blodgett Mills
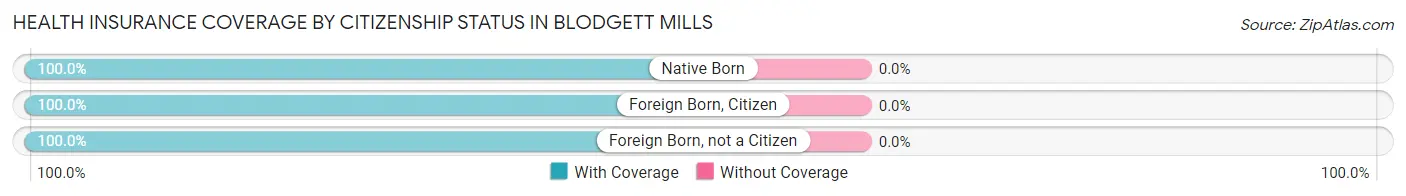
| Citizenship Status | With Coverage | Without Coverage |
| Native Born | 7 (100.0%) | 0 (0.0%) |
| Foreign Born, Citizen | 21 (100.0%) | 0 (0.0%) |
| Foreign Born, not a Citizen | 85 (100.0%) | 0 (0.0%) |
Health Insurance Coverage by Household Income in Blodgett Mills
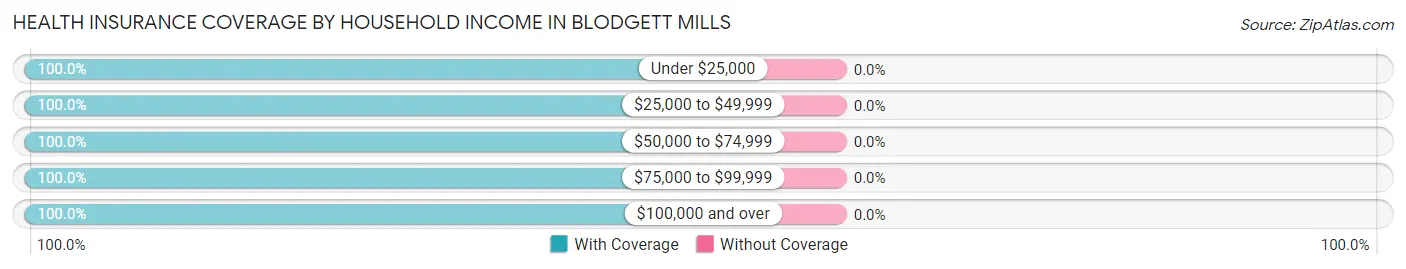
| Household Income | With Coverage | Without Coverage |
| Under $25,000 | 15 (100.0%) | 0 (0.0%) |
| $25,000 to $49,999 | 47 (100.0%) | 0 (0.0%) |
| $50,000 to $74,999 | 34 (100.0%) | 0 (0.0%) |
| $75,000 to $99,999 | 64 (100.0%) | 0 (0.0%) |
| $100,000 and over | 61 (100.0%) | 0 (0.0%) |
Public vs Private Health Insurance Coverage by Age in Blodgett Mills
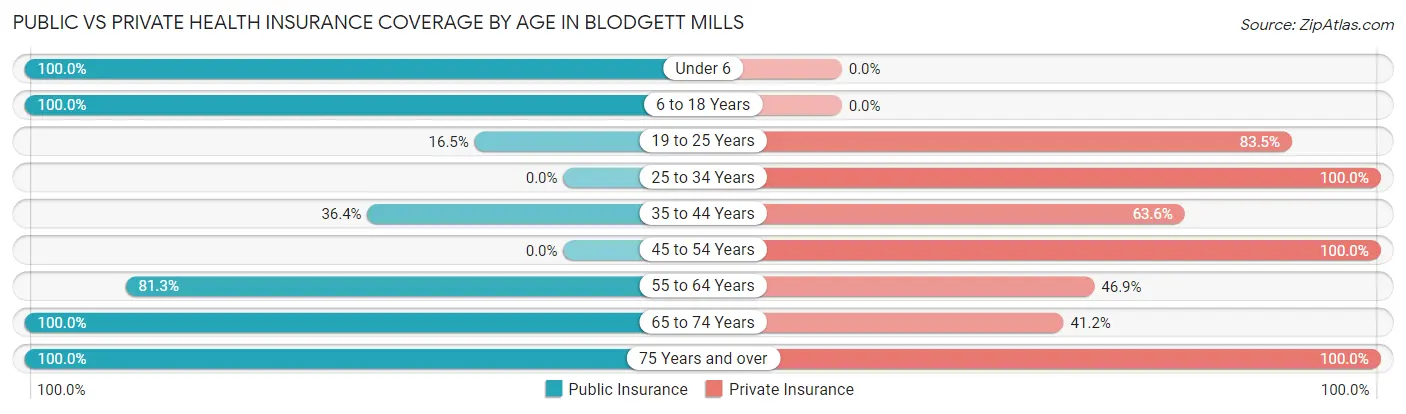
| Age Bracket | Public Insurance | Private Insurance |
| Under 6 | 7 (100.0%) | 0 (0.0%) |
| 6 to 18 Years | 21 (100.0%) | 0 (0.0%) |
| 19 to 25 Years | 14 (16.5%) | 71 (83.5%) |
| 25 to 34 Years | 0 (0.0%) | 21 (100.0%) |
| 35 to 44 Years | 4 (36.4%) | 7 (63.6%) |
| 45 to 54 Years | 0 (0.0%) | 12 (100.0%) |
| 55 to 64 Years | 26 (81.2%) | 15 (46.9%) |
| 65 to 74 Years | 17 (100.0%) | 7 (41.2%) |
| 75 Years and over | 15 (100.0%) | 15 (100.0%) |
| Total | 104 (47.1%) | 148 (67.0%) |
Disability Status by Sex by Age in Blodgett Mills
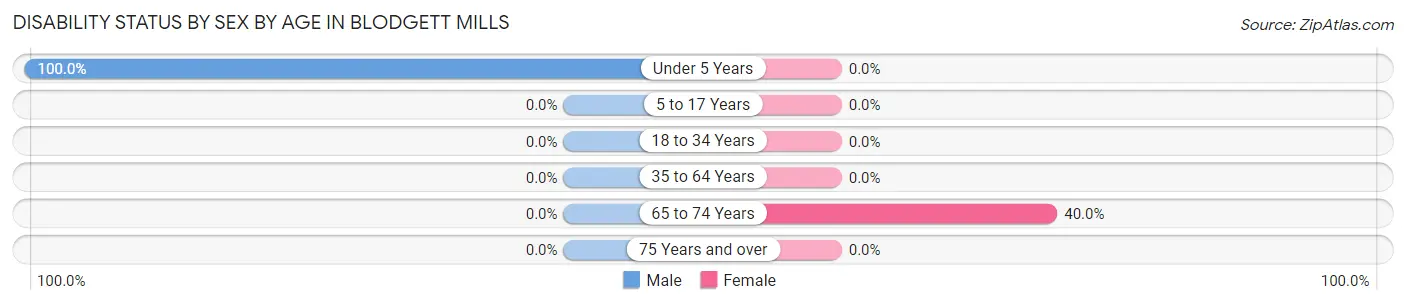
| Age Bracket | Male | Female |
| Under 5 Years | 7 (100.0%) | 0 (0.0%) |
| 5 to 17 Years | 0 (0.0%) | 0 (0.0%) |
| 18 to 34 Years | 0 (0.0%) | 0 (0.0%) |
| 35 to 64 Years | 0 (0.0%) | 0 (0.0%) |
| 65 to 74 Years | 0 (0.0%) | 4 (40.0%) |
| 75 Years and over | 0 (0.0%) | 0 (0.0%) |
Disability Class by Sex by Age in Blodgett Mills
Disability Class: Hearing Difficulty
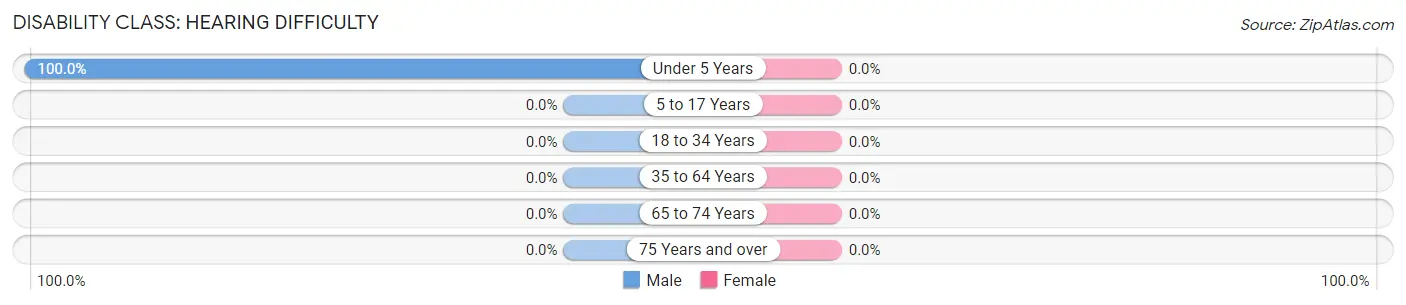
| Age Bracket | Male | Female |
| Under 5 Years | 7 (100.0%) | 0 (0.0%) |
| 5 to 17 Years | 0 (0.0%) | 0 (0.0%) |
| 18 to 34 Years | 0 (0.0%) | 0 (0.0%) |
| 35 to 64 Years | 0 (0.0%) | 0 (0.0%) |
| 65 to 74 Years | 0 (0.0%) | 0 (0.0%) |
| 75 Years and over | 0 (0.0%) | 0 (0.0%) |
Disability Class: Vision Difficulty
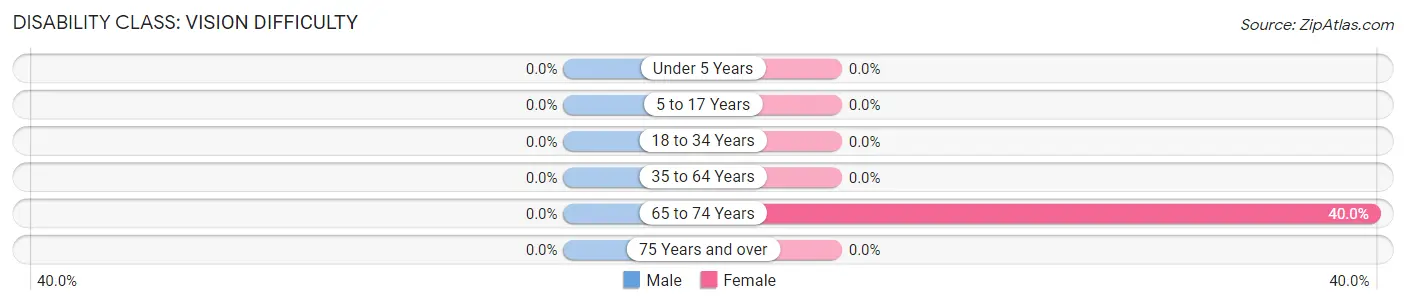
| Age Bracket | Male | Female |
| Under 5 Years | 0 (0.0%) | 0 (0.0%) |
| 5 to 17 Years | 0 (0.0%) | 0 (0.0%) |
| 18 to 34 Years | 0 (0.0%) | 0 (0.0%) |
| 35 to 64 Years | 0 (0.0%) | 0 (0.0%) |
| 65 to 74 Years | 0 (0.0%) | 4 (40.0%) |
| 75 Years and over | 0 (0.0%) | 0 (0.0%) |
Disability Class: Cognitive Difficulty
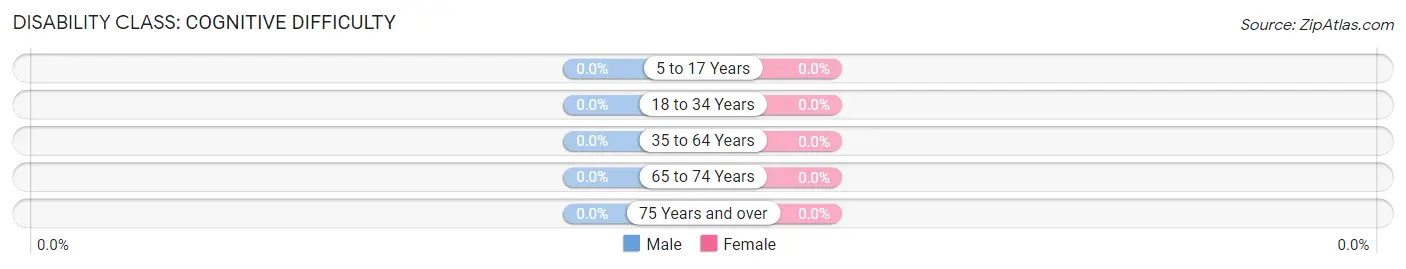
| Age Bracket | Male | Female |
| 5 to 17 Years | 0 (0.0%) | 0 (0.0%) |
| 18 to 34 Years | 0 (0.0%) | 0 (0.0%) |
| 35 to 64 Years | 0 (0.0%) | 0 (0.0%) |
| 65 to 74 Years | 0 (0.0%) | 0 (0.0%) |
| 75 Years and over | 0 (0.0%) | 0 (0.0%) |
Disability Class: Ambulatory Difficulty
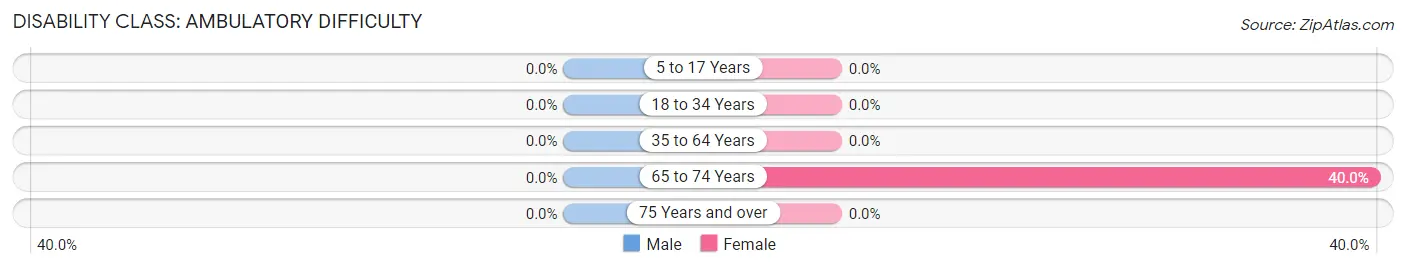
| Age Bracket | Male | Female |
| 5 to 17 Years | 0 (0.0%) | 0 (0.0%) |
| 18 to 34 Years | 0 (0.0%) | 0 (0.0%) |
| 35 to 64 Years | 0 (0.0%) | 0 (0.0%) |
| 65 to 74 Years | 0 (0.0%) | 4 (40.0%) |
| 75 Years and over | 0 (0.0%) | 0 (0.0%) |
Disability Class: Self-Care Difficulty
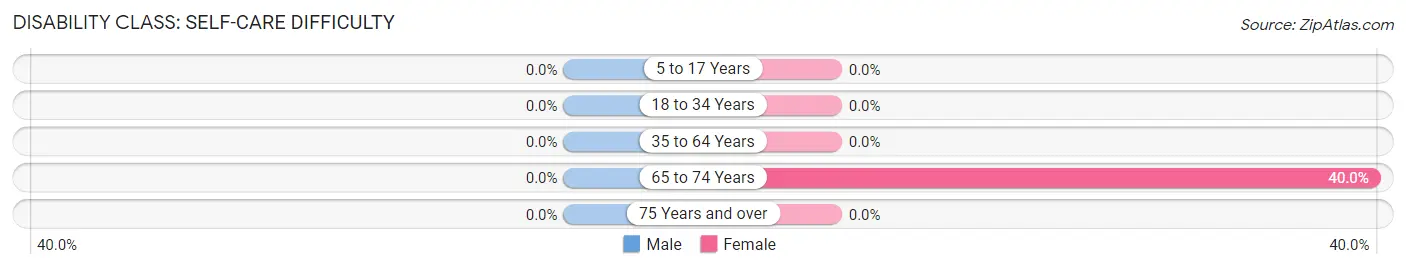
| Age Bracket | Male | Female |
| 5 to 17 Years | 0 (0.0%) | 0 (0.0%) |
| 18 to 34 Years | 0 (0.0%) | 0 (0.0%) |
| 35 to 64 Years | 0 (0.0%) | 0 (0.0%) |
| 65 to 74 Years | 0 (0.0%) | 4 (40.0%) |
| 75 Years and over | 0 (0.0%) | 0 (0.0%) |
Technology Access in Blodgett Mills
Computing Device Access in Blodgett Mills
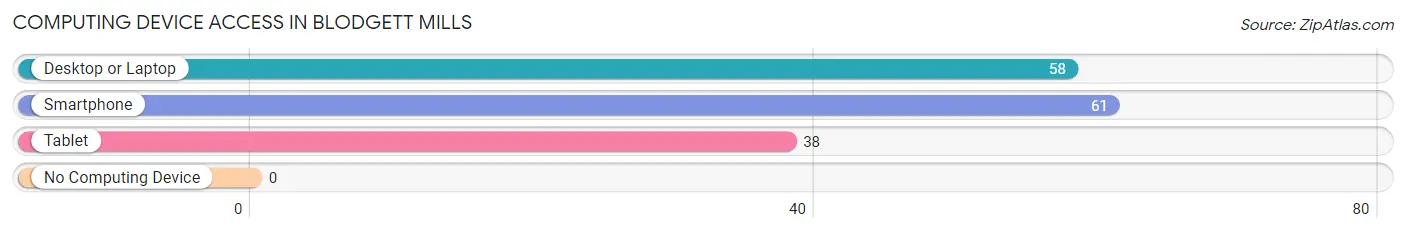
| Device Type | # Households | % Households |
| Desktop or Laptop | 58 | 86.6% |
| Smartphone | 61 | 91.0% |
| Tablet | 38 | 56.7% |
| No Computing Device | 0 | 0.0% |
| Total | 67 | 100.0% |
Internet Access in Blodgett Mills
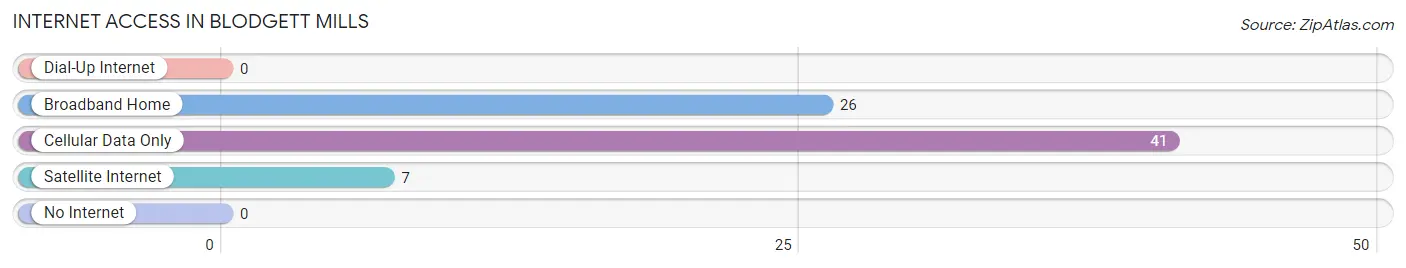
| Internet Type | # Households | % Households |
| Dial-Up Internet | 0 | 0.0% |
| Broadband Home | 26 | 38.8% |
| Cellular Data Only | 41 | 61.2% |
| Satellite Internet | 7 | 10.4% |
| No Internet | 0 | 0.0% |
| Total | 67 | 100.0% |
Blodgett Mills Summary
Blodgett Mills is a small hamlet located in Cortland County, New York. It is situated in the town of Cincinnatus, and is located on the banks of the Tioughnioga River. The hamlet is named after the Blodgett family, who were early settlers in the area.
Geography
Blodgett Mills is located at 42°37'N, 76°2'W (42.6167, -76.0333). It is situated in the town of Cincinnatus, and is located on the banks of the Tioughnioga River. The hamlet is located in the Finger Lakes region of New York, and is surrounded by rolling hills and farmland. The nearest major city is Syracuse, which is located about 30 miles to the north.
Demographics
As of the 2010 census, the population of Blodgett Mills was 545. The racial makeup of the hamlet was 97.3% White, 0.7% African American, 0.2% Native American, 0.2% Asian, 0.2% from other races, and 1.6% from two or more races. Hispanic or Latino of any race were 1.1% of the population.
Economy
The economy of Blodgett Mills is largely based on agriculture. The hamlet is home to several farms, which produce a variety of crops, including corn, soybeans, hay, and wheat. The hamlet is also home to several small businesses, including a general store, a gas station, and a few restaurants.
History
Blodgett Mills was first settled in the early 1800s by the Blodgett family. The family built a grist mill on the banks of the Tioughnioga River, which was used to grind grain for local farmers. The hamlet was officially incorporated in 1845, and the Blodgett family continued to operate the mill until the early 1900s.
In the late 1800s, the hamlet began to grow and develop. A post office was established in 1887, and a railroad line was built in the early 1900s. The railroad line connected Blodgett Mills to nearby towns and cities, and allowed for the transportation of goods and people.
In the early 1900s, the hamlet began to decline. The grist mill closed in the 1920s, and the railroad line was abandoned in the 1940s. The population of the hamlet began to decline, and by the 1970s, the population had dropped to just over 200 people.
Today, Blodgett Mills is a small, rural hamlet. The population has remained relatively stable since the 1970s, and the hamlet is still largely agricultural. The hamlet is home to several small businesses, and is a popular destination for outdoor recreation.
Common Questions
What is Per Capita Income in Blodgett Mills?
Per Capita income in Blodgett Mills is $24,236.
What is the Median Family Income in Blodgett Mills?
Median Family Income in Blodgett Mills is $59,464.
What is the Median Household income in Blodgett Mills?
Median Household Income in Blodgett Mills is $59,464.
What is Inequality or Gini Index in Blodgett Mills?
Inequality or Gini Index in Blodgett Mills is 0.35.
What is the Total Population of Blodgett Mills?
Total Population of Blodgett Mills is 221.
What is the Total Male Population of Blodgett Mills?
Total Male Population of Blodgett Mills is 145.
What is the Total Female Population of Blodgett Mills?
Total Female Population of Blodgett Mills is 76.
What is the Ratio of Males per 100 Females in Blodgett Mills?
There are 190.79 Males per 100 Females in Blodgett Mills.
What is the Ratio of Females per 100 Males in Blodgett Mills?
There are 52.41 Females per 100 Males in Blodgett Mills.
What is the Median Population Age in Blodgett Mills?
Median Population Age in Blodgett Mills is 25.8 Years.
What is the Average Family Size in Blodgett Mills
Average Family Size in Blodgett Mills is 3.3 People.
What is the Average Household Size in Blodgett Mills
Average Household Size in Blodgett Mills is 3.3 People.
How Large is the Labor Force in Blodgett Mills?
There are 152 People in the Labor Forcein in Blodgett Mills.
What is the Percentage of People in the Labor Force in Blodgett Mills?
76.0% of People are in the Labor Force in Blodgett Mills.
What is the Unemployment Rate in Blodgett Mills?
Unemployment Rate in Blodgett Mills is 8.6%.