Area Code 551 Map & Demographics
Area Code 551 Map
Area Code 551 Overview
$61,076
PER CAPITA INCOME
$140,542
AVG FAMILY INCOME
$117,366
AVG HOUSEHOLD INCOME
28.3%
WAGE / INCOME GAP [ % ]
71.7¢/ $1
WAGE / INCOME GAP [ $ ]
$10,641
FAMILY INCOME DEFICIT
9.62
INEQUALITY / GINI INDEX
624,417
TOTAL POPULATION
313,991
MALE POPULATION
310,426
FEMALE POPULATION
101.15
MALES / 100 FEMALES
98.86
FEMALES / 100 MALES
38.4
MEDIAN AGE
3.1
AVG FAMILY SIZE
2.5
AVG HOUSEHOLD SIZE
352,895
LABOR FORCE [ PEOPLE ]
69.1%
PERCENT IN LABOR FORCE
5.4%
UNEMPLOYMENT RATE
Income in Area Code 551
Income Overview in Area Code 551
Per Capita Income in Area Code 551 is $61,076, while median incomes of families and households are $140,542 and $117,366 respectively.
| Characteristic | Number | Measure |
| Per Capita Income | 624,417 | $61,076 |
| Median Family Income | 153,837 | $140,542 |
| Mean Family Income | 153,837 | $3,768,347 |
| Median Household Income | 246,125 | $117,366 |
| Mean Household Income | 246,125 | $3,220,855 |
| Income Deficit | 153,837 | $10,641 |
| Wage / Income Gap (%) | 624,417 | 28.25% |
| Wage / Income Gap ($) | 624,417 | 71.75¢ per $1 |
| Gini / Inequality Index | 624,417 | 9.62 |
Earnings by Sex in Area Code 551
Average Earnings in Area Code 551 are $68,416, $79,805 for men and $57,064 for women, a difference of 28.5%.
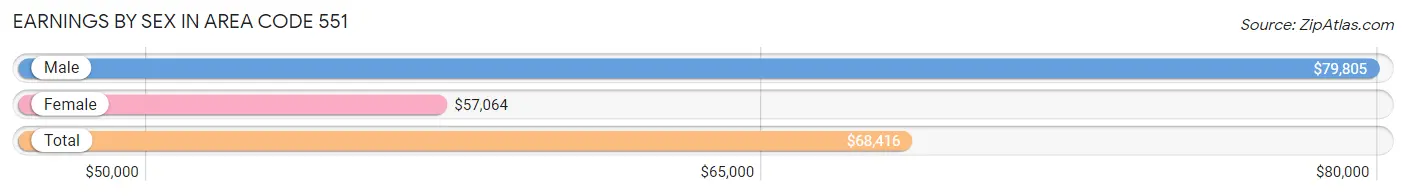
| Sex | Number | Average Earnings |
| Male | 192,133 (54.1%) | $79,805 |
| Female | 162,834 (45.9%) | $57,064 |
| Total | 354,967 (100.0%) | $68,416 |
Earnings by Sex by Income Bracket in Area Code 551
The most common earnings brackets in Area Code 551 are $100,000+ for men (58,086 | 30.2%) and $100,000+ for women (31,199 | 19.2%).
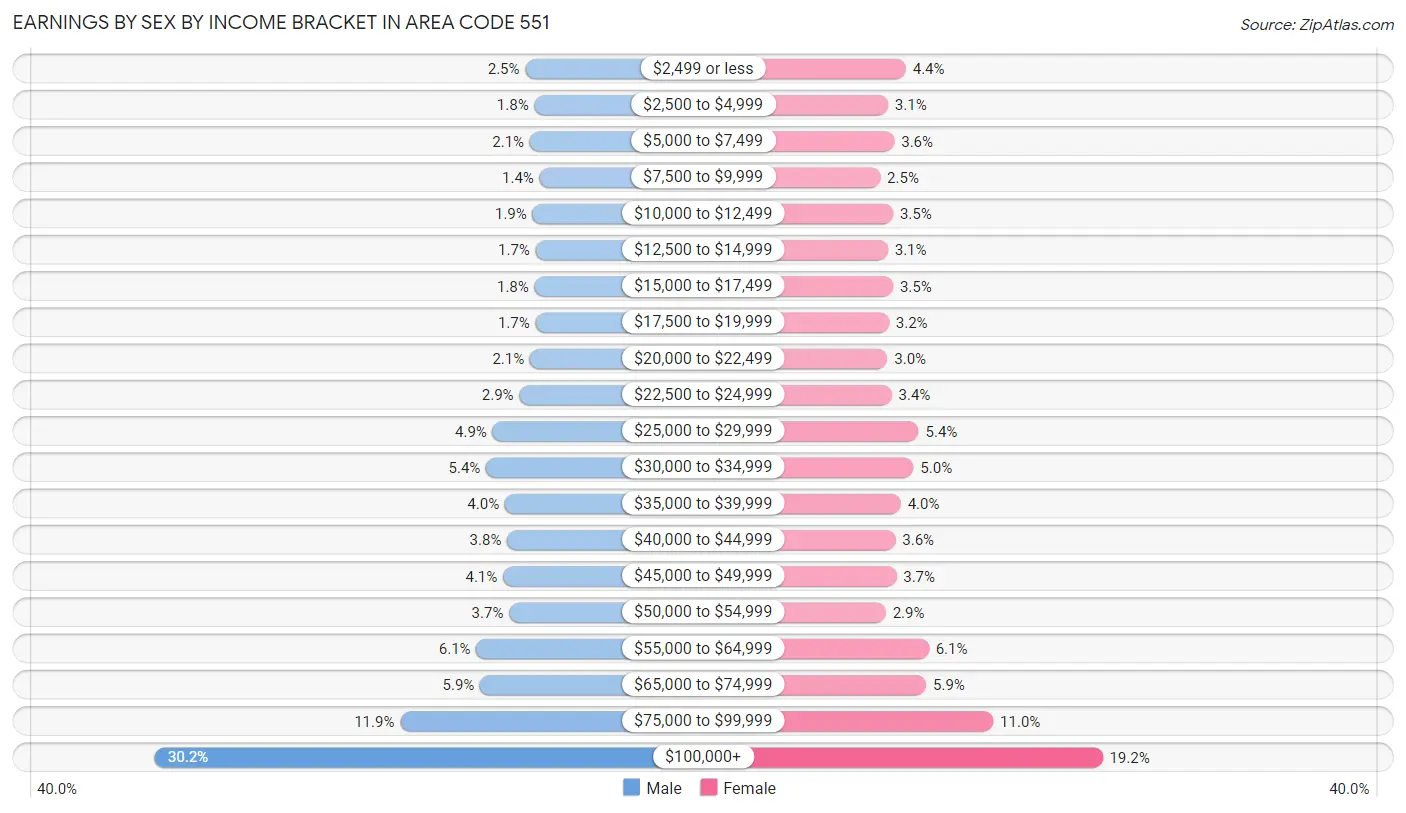
| Income | Male | Female |
| $2,499 or less | 4,737 (2.5%) | 7,201 (4.4%) |
| $2,500 to $4,999 | 3,435 (1.8%) | 5,020 (3.1%) |
| $5,000 to $7,499 | 4,092 (2.1%) | 5,794 (3.6%) |
| $7,500 to $9,999 | 2,683 (1.4%) | 4,066 (2.5%) |
| $10,000 to $12,499 | 3,712 (1.9%) | 5,641 (3.5%) |
| $12,500 to $14,999 | 3,257 (1.7%) | 5,007 (3.1%) |
| $15,000 to $17,499 | 3,416 (1.8%) | 5,637 (3.5%) |
| $17,500 to $19,999 | 3,284 (1.7%) | 5,134 (3.2%) |
| $20,000 to $22,499 | 4,068 (2.1%) | 4,943 (3.0%) |
| $22,500 to $24,999 | 5,619 (2.9%) | 5,477 (3.4%) |
| $25,000 to $29,999 | 9,452 (4.9%) | 8,758 (5.4%) |
| $30,000 to $34,999 | 10,386 (5.4%) | 8,132 (5.0%) |
| $35,000 to $39,999 | 7,689 (4.0%) | 6,579 (4.0%) |
| $40,000 to $44,999 | 7,367 (3.8%) | 5,929 (3.6%) |
| $45,000 to $49,999 | 7,945 (4.1%) | 6,039 (3.7%) |
| $50,000 to $54,999 | 7,064 (3.7%) | 4,750 (2.9%) |
| $55,000 to $64,999 | 11,802 (6.1%) | 9,991 (6.1%) |
| $65,000 to $74,999 | 11,263 (5.9%) | 9,677 (5.9%) |
| $75,000 to $99,999 | 22,776 (11.8%) | 17,860 (11.0%) |
| $100,000+ | 58,086 (30.2%) | 31,199 (19.2%) |
| Total | 192,133 (100.0%) | 162,834 (100.0%) |
Earnings by Sex by Educational Attainment in Area Code 551
Average earnings in Area Code 551 are $1,922,262 for men and $1,384,779 for women, a difference of 28.0%. Men with an educational attainment of graduate degree enjoy the highest average annual earnings of $2,651,199, while those with less than high school education earn the least with $675,928. Women with an educational attainment of graduate degree earn the most with the average annual earnings of $1,837,344, while those with less than high school education have the smallest earnings of $457,039.
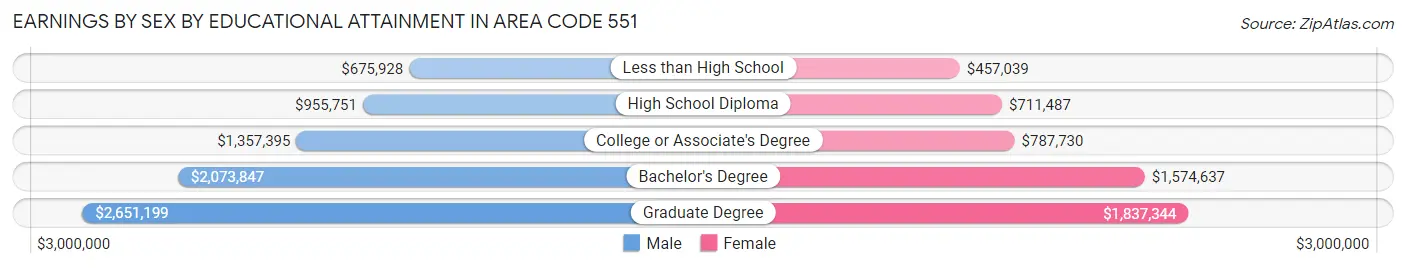
| Educational Attainment | Male Income | Female Income |
| Less than High School | $675,928 | $457,039 |
| High School Diploma | $955,751 | $711,487 |
| College or Associate's Degree | $1,357,395 | $787,730 |
| Bachelor's Degree | $2,073,847 | $1,574,637 |
| Graduate Degree | $2,651,199 | $1,837,344 |
| Total | $1,922,262 | $1,384,779 |
Family Income in Area Code 551
Family Income Brackets in Area Code 551
According to the Area Code 551 family income data, there are 1,037,323 families falling into the $200,000+ income range, which is the most common income bracket and makes up 674.3% of all families. Conversely, the $10,000 to $14,999 income bracket is the least frequent group with only 54,920 families (35.7%) belonging to this category.

| Income Bracket | # Families | % Families |
| Less than $10,000 | 88,456 | 57.5% |
| $10,000 to $14,999 | 54,920 | 35.7% |
| $15,000 to $24,999 | 131,992 | 85.8% |
| $25,000 to $34,999 | 173,836 | 113.0% |
| $35,000 to $49,999 | 216,295 | 140.6% |
| $50,000 to $74,999 | 394,438 | 256.4% |
| $75,000 to $99,999 | 305,520 | 198.6% |
| $100,000 to $149,999 | 585,504 | 380.6% |
| $150,000 to $199,999 | 395,361 | 257.0% |
| $200,000+ | 1,037,323 | 674.3% |
Family Income by Famaliy Size in Area Code 551
7+ person families (2,269 | 1.5%) account for the highest median family income in Area Code 551 with $155,149 per family, while 2-person families (65,135 | 42.3%) have the highest median income of $61,819 per family member.
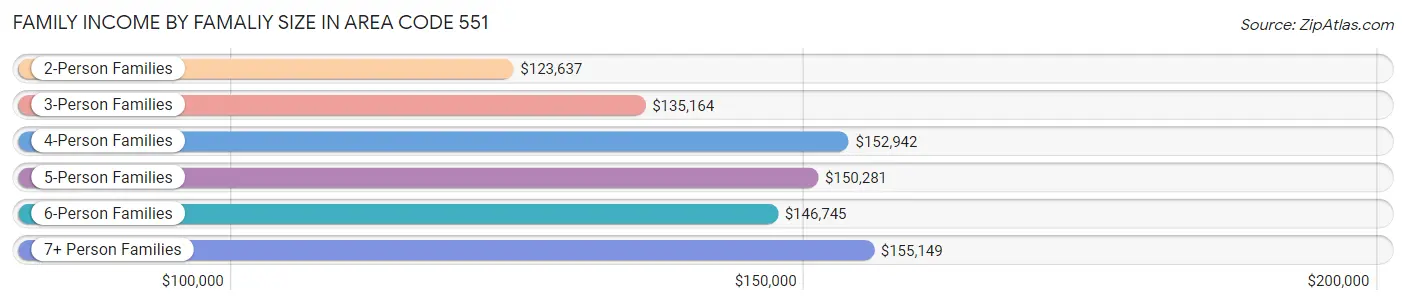
| Income Bracket | # Families | Median Income |
| 2-Person Families | 65,135 (42.3%) | $123,637 |
| 3-Person Families | 39,590 (25.7%) | $135,164 |
| 4-Person Families | 30,274 (19.7%) | $152,942 |
| 5-Person Families | 13,206 (8.6%) | $150,281 |
| 6-Person Families | 3,363 (2.2%) | $146,745 |
| 7+ Person Families | 2,269 (1.5%) | $155,149 |
| Total | 153,837 (100.0%) | $140,542 |
Family Income by Number of Earners in Area Code 551
The median family income in Area Code 551 is $140,542, with families comprising 3+ earners (20,439) having the highest median family income of $175,916, while families with no earners (14,330) have the lowest median family income of $44,840, accounting for 13.3% and 9.3% of families, respectively.
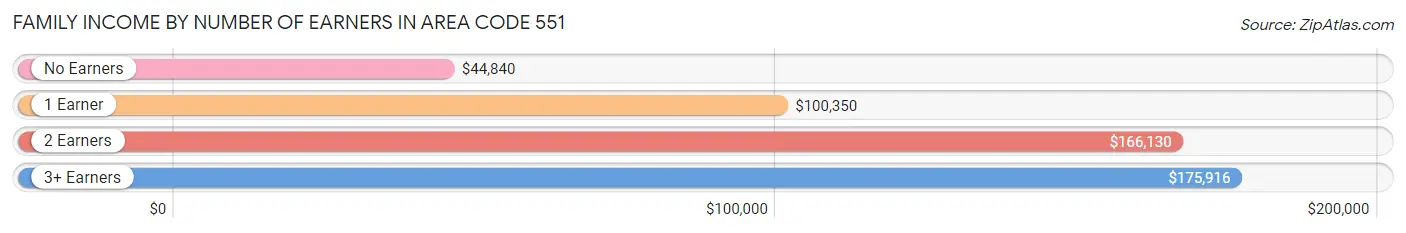
| Number of Earners | # Families | Median Income |
| No Earners | 14,330 (9.3%) | $44,840 |
| 1 Earner | 50,615 (32.9%) | $100,350 |
| 2 Earners | 68,453 (44.5%) | $166,130 |
| 3+ Earners | 20,439 (13.3%) | $175,916 |
| Total | 153,837 (100.0%) | $140,542 |
Household Income in Area Code 551
Household Income Brackets in Area Code 551
With 1,293,387 households falling in the category, the $200,000+ income range is the most frequent in Area Code 551, accounting for 525.5% of all households. In contrast, only 183,117 households (74.4%) fall into the $10,000 to $14,999 income bracket, making it the least populous group.
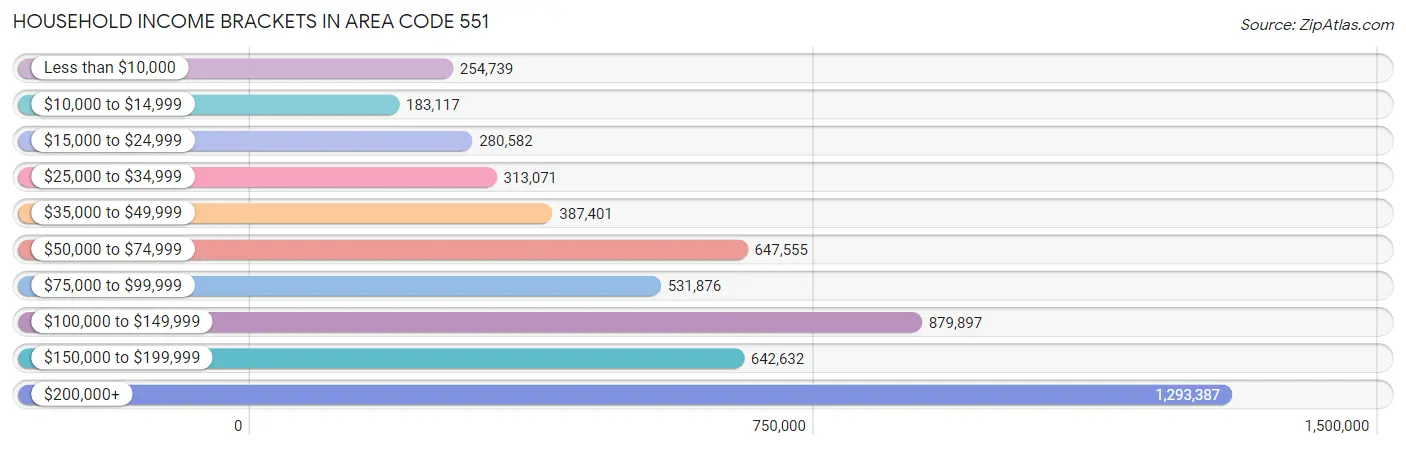
| Income Bracket | # Households | % Households |
| Less than $10,000 | 254,739 | 103.5% |
| $10,000 to $14,999 | 183,117 | 74.4% |
| $15,000 to $24,999 | 280,582 | 114.0% |
| $25,000 to $34,999 | 313,071 | 127.2% |
| $35,000 to $49,999 | 387,401 | 157.4% |
| $50,000 to $74,999 | 647,555 | 263.1% |
| $75,000 to $99,999 | 531,876 | 216.1% |
| $100,000 to $149,999 | 879,897 | 357.5% |
| $150,000 to $199,999 | 642,632 | 261.1% |
| $200,000+ | 1,293,387 | 525.5% |
Household Income by Householder Age in Area Code 551
The median household income in Area Code 551 is $117,366, with the highest median household income of $134,325 found in the 25 to 44 years age bracket for the primary householder. A total of 99,333 households (40.4%) fall into this category. Meanwhile, the 15 to 24 years age bracket for the primary householder has the lowest median household income of $59,420, with 5,625 households (2.3%) in this group.
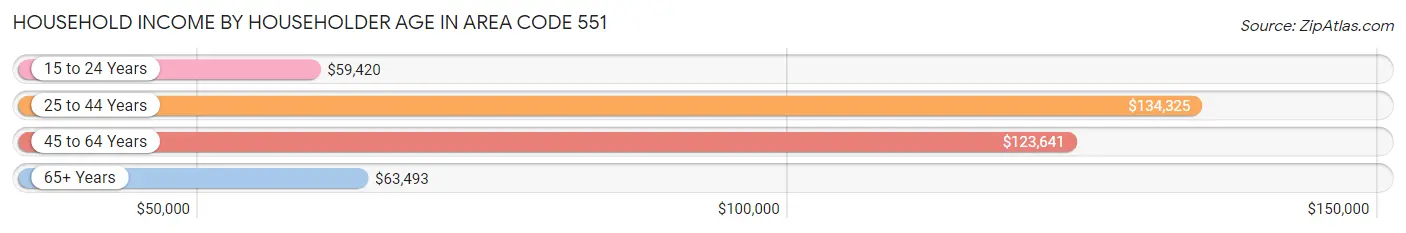
| Income Bracket | # Households | Median Income |
| 15 to 24 Years | 5,625 (2.3%) | $59,420 |
| 25 to 44 Years | 99,333 (40.4%) | $134,325 |
| 45 to 64 Years | 89,230 (36.2%) | $123,641 |
| 65+ Years | 51,937 (21.1%) | $63,493 |
| Total | 246,125 (100.0%) | $117,366 |
Poverty in Area Code 551
Income Below Poverty by Sex and Age in Area Code 551
With 11.0% poverty level for males and 14.1% for females among the residents of Area Code 551, 5 year old males and 15 year old females are the most vulnerable to poverty, with 715 males (22.9%) and 648 females (21.2%) in their respective age groups living below the poverty level.
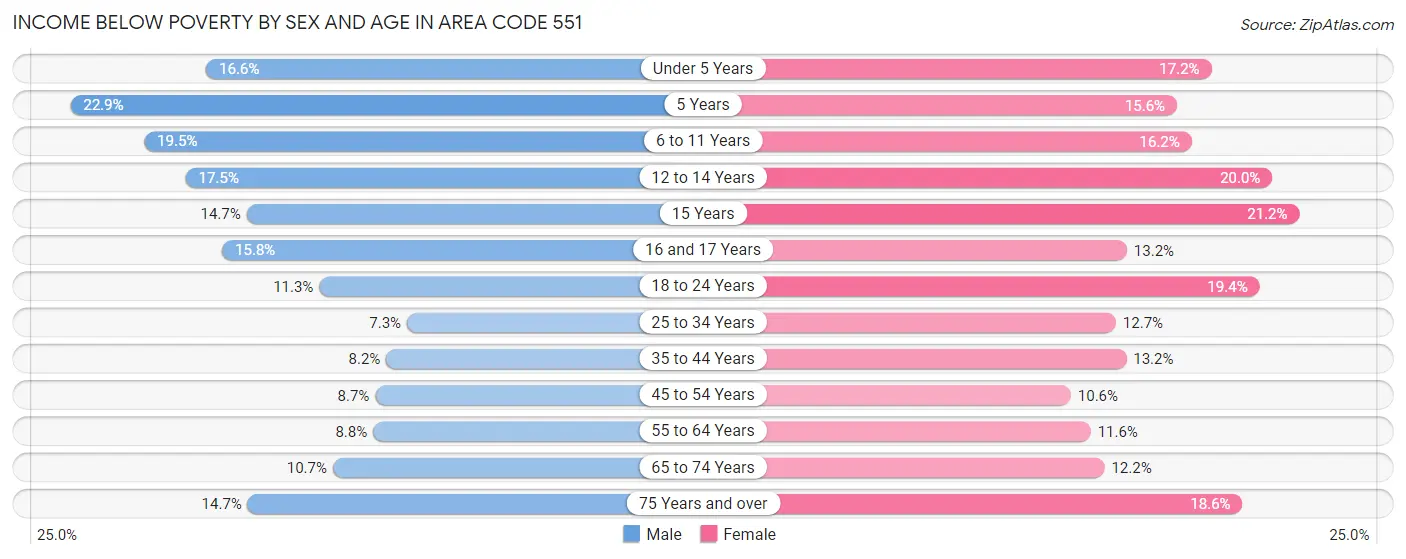
| Age Bracket | Male | Female |
| Under 5 Years | 3,266 (16.6%) | 2,968 (17.2%) |
| 5 Years | 715 (22.9%) | 465 (15.5%) |
| 6 to 11 Years | 4,280 (19.5%) | 3,208 (16.2%) |
| 12 to 14 Years | 1,834 (17.5%) | 2,090 (20.0%) |
| 15 Years | 555 (14.7%) | 648 (21.2%) |
| 16 and 17 Years | 1,035 (15.8%) | 992 (13.2%) |
| 18 to 24 Years | 2,631 (11.3%) | 4,618 (19.4%) |
| 25 to 34 Years | 3,968 (7.3%) | 6,528 (12.7%) |
| 35 to 44 Years | 4,022 (8.2%) | 6,045 (13.2%) |
| 45 to 54 Years | 3,551 (8.7%) | 4,227 (10.6%) |
| 55 to 64 Years | 3,195 (8.8%) | 4,360 (11.6%) |
| 65 to 74 Years | 2,412 (10.7%) | 3,132 (12.2%) |
| 75 Years and over | 1,986 (14.6%) | 3,941 (18.6%) |
| Total | 33,450 (11.0%) | 43,222 (14.1%) |
Income Above Poverty by Sex and Age in Area Code 551
According to the poverty statistics in Area Code 551, males aged 25 to 34 years and females aged 45 to 54 years are the age groups that are most secure financially, with 92.7% of males and 89.4% of females in these age groups living above the poverty line.
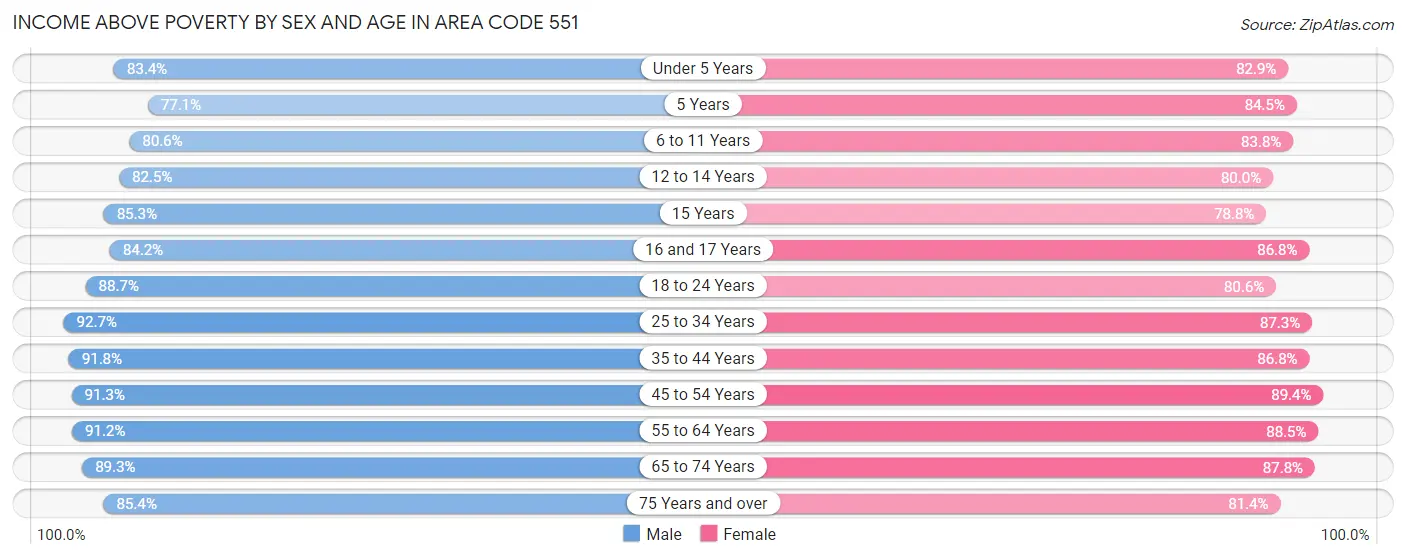
| Age Bracket | Male | Female |
| Under 5 Years | 16,430 (83.4%) | 14,341 (82.9%) |
| 5 Years | 2,410 (77.1%) | 2,526 (84.5%) |
| 6 to 11 Years | 17,723 (80.5%) | 16,552 (83.8%) |
| 12 to 14 Years | 8,631 (82.5%) | 8,375 (80.0%) |
| 15 Years | 3,220 (85.3%) | 2,405 (78.8%) |
| 16 and 17 Years | 5,500 (84.2%) | 6,505 (86.8%) |
| 18 to 24 Years | 20,589 (88.7%) | 19,216 (80.6%) |
| 25 to 34 Years | 50,698 (92.7%) | 44,799 (87.3%) |
| 35 to 44 Years | 44,935 (91.8%) | 39,766 (86.8%) |
| 45 to 54 Years | 37,103 (91.3%) | 35,540 (89.4%) |
| 55 to 64 Years | 32,979 (91.2%) | 33,385 (88.4%) |
| 65 to 74 Years | 20,138 (89.3%) | 22,563 (87.8%) |
| 75 Years and over | 11,572 (85.4%) | 17,259 (81.4%) |
| Total | 271,928 (89.0%) | 263,232 (85.9%) |
Income Below Poverty Among Married-Couple Families in Area Code 551
The poverty statistics for married-couple families in Area Code 551 show that 5.1% or 5,486 of the total 106,667 families live below the poverty line. Families with 5 or more children have the highest poverty rate of 32.3%, comprising of 96 families. On the other hand, families with no children have the lowest poverty rate of 3.4%, which includes 1,982 families.
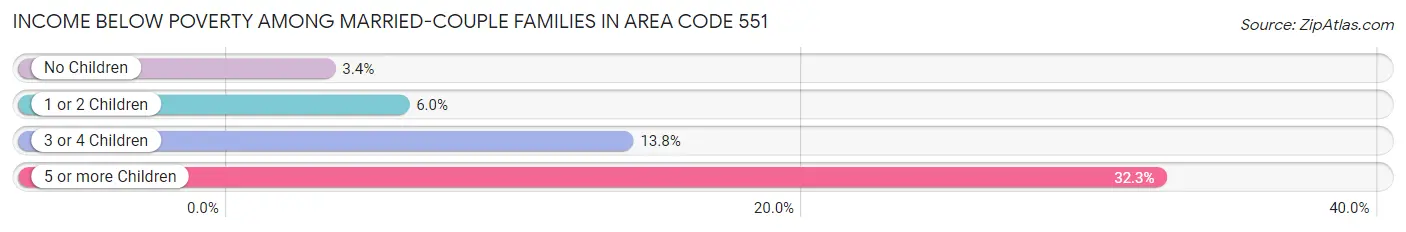
| Children | Above Poverty | Below Poverty |
| No Children | 56,462 (96.6%) | 1,982 (3.4%) |
| 1 or 2 Children | 38,438 (94.0%) | 2,437 (6.0%) |
| 3 or 4 Children | 6,080 (86.2%) | 971 (13.8%) |
| 5 or more Children | 201 (67.7%) | 96 (32.3%) |
| Total | 101,181 (94.9%) | 5,486 (5.1%) |
Income Below Poverty Among Single-Parent Households in Area Code 551
According to the poverty data in Area Code 551, 8.6% or 1,210 single-father households and 23.0% or 7,640 single-mother households are living below the poverty line. Among single-father households, those with 5 or more children have the highest poverty rate, with 34 households (100.0%) experiencing poverty. Likewise, among single-mother households, those with 5 or more children have the highest poverty rate, with 100 households (67.1%) falling below the poverty line.
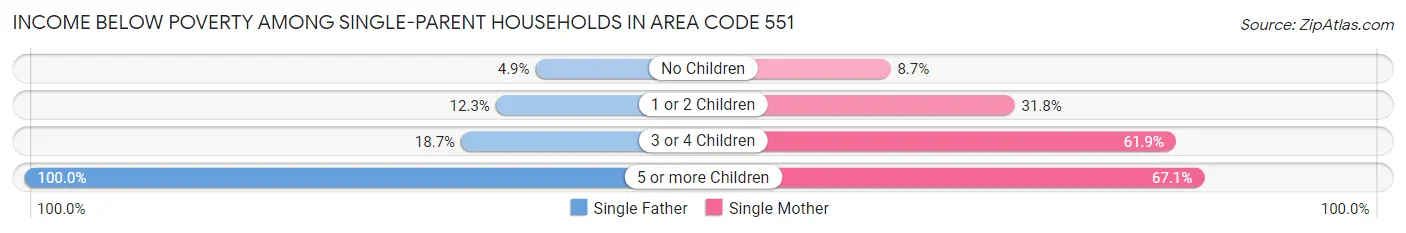
| Children | Single Father | Single Mother |
| No Children | 385 (4.9%) | 1,337 (8.7%) |
| 1 or 2 Children | 652 (12.3%) | 5,010 (31.8%) |
| 3 or 4 Children | 139 (18.7%) | 1,193 (61.9%) |
| 5 or more Children | 34 (100.0%) | 100 (67.1%) |
| Total | 1,210 (8.6%) | 7,640 (23.0%) |
Income Below Poverty Among Married-Couple vs Single-Parent Households in Area Code 551
The poverty data for Area Code 551 shows that 5,486 of the married-couple family households (5.1%) and 8,850 of the single-parent households (18.8%) are living below the poverty level. Within the married-couple family households, those with 5 or more children have the highest poverty rate, with 96 households (32.3%) falling below the poverty line. Among the single-parent households, those with 5 or more children have the highest poverty rate, with 134 household (73.2%) living below poverty.
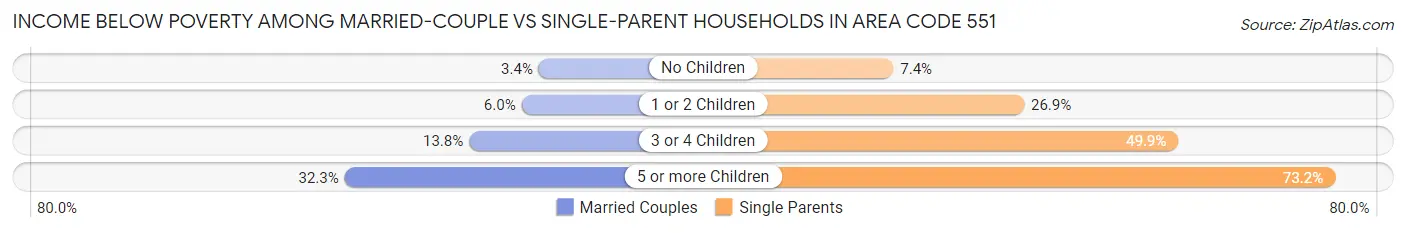
| Children | Married-Couple Families | Single-Parent Households |
| No Children | 1,982 (3.4%) | 1,722 (7.4%) |
| 1 or 2 Children | 2,437 (6.0%) | 5,662 (26.9%) |
| 3 or 4 Children | 971 (13.8%) | 1,332 (49.9%) |
| 5 or more Children | 96 (32.3%) | 134 (73.2%) |
| Total | 5,486 (5.1%) | 8,850 (18.8%) |
Race in Area Code 551
The most populous races in Area Code 551 are White / Caucasian (308,941 | 49.5%), Hispanic or Latino (217,457 | 34.8%), and Some other Race (84,493 | 13.5%).
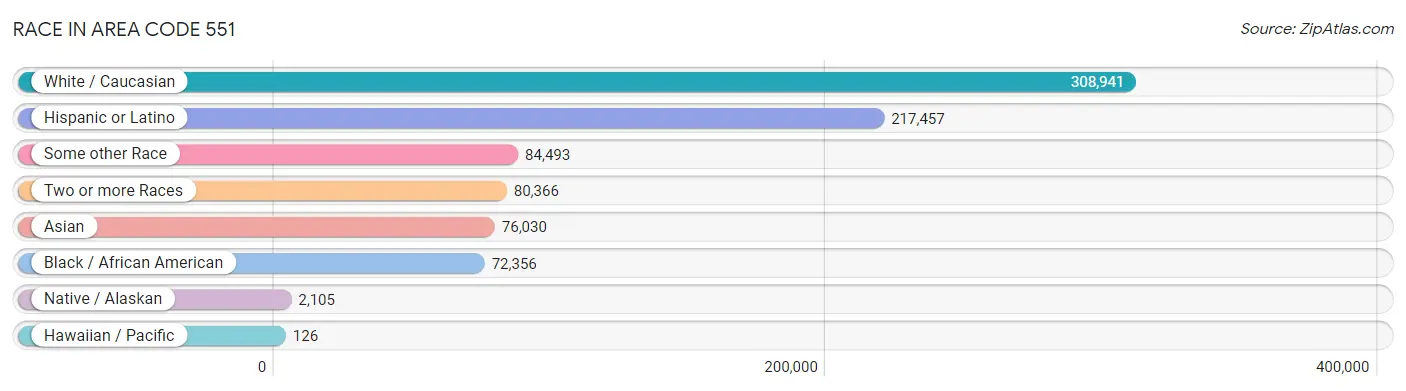
| Race | # Population | % Population |
| Asian | 76,030 | 12.2% |
| Black / African American | 72,356 | 11.6% |
| Hawaiian / Pacific | 126 | 0.0% |
| Hispanic or Latino | 217,457 | 34.8% |
| Native / Alaskan | 2,105 | 0.3% |
| White / Caucasian | 308,941 | 49.5% |
| Two or more Races | 80,366 | 12.9% |
| Some other Race | 84,493 | 13.5% |
| Total | 624,417 | 100.0% |
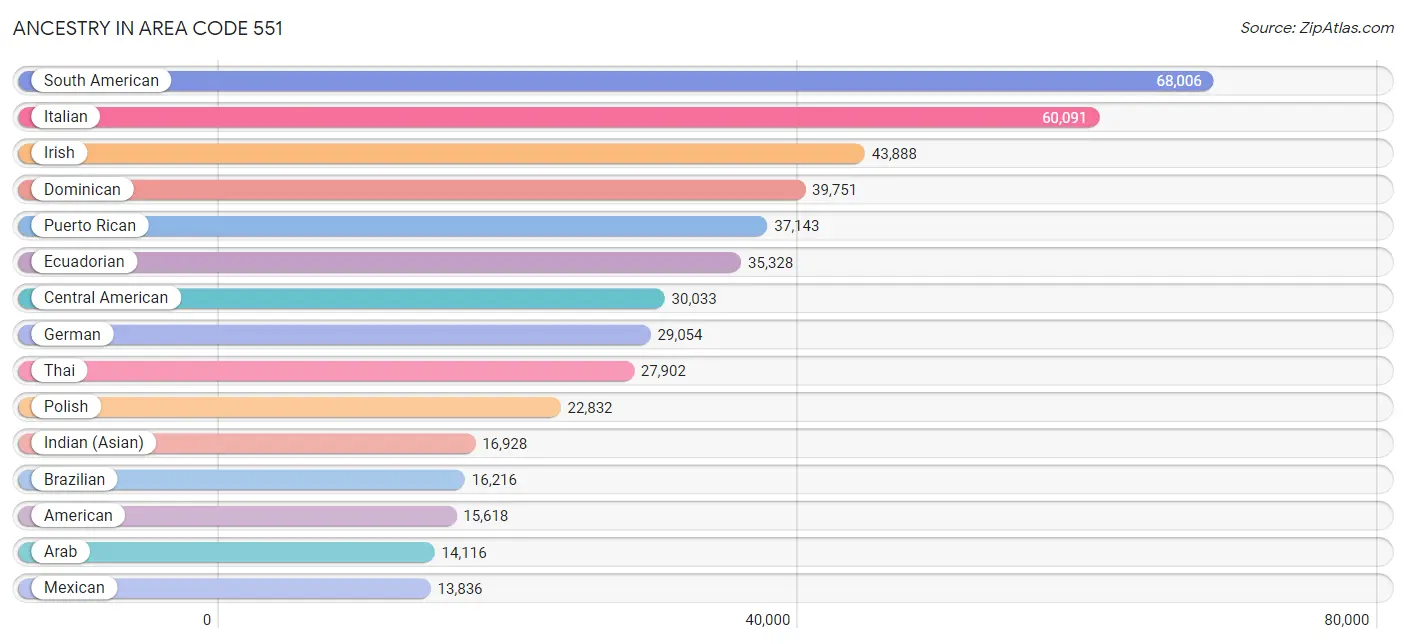
Ancestry in Area Code 551
The most populous ancestries reported in Area Code 551 are South American (68,006 | 10.9%), Italian (60,091 | 9.6%), Irish (43,888 | 7.0%), Dominican (39,751 | 6.4%), and Puerto Rican (37,143 | 5.9%), together accounting for 39.9% of all Area Code 551 residents.
| Ancestry | # Population | % Population |
| Afghan | 223 | 0.0% |
| African | 4,173 | 0.7% |
| Alaska Native | 25 | 0.0% |
| Alaskan Athabascan | 5 | 0.0% |
| Albanian | 1,451 | 0.2% |
| Alsatian | 35 | 0.0% |
| American | 15,618 | 2.5% |
| Arab | 14,116 | 2.3% |
| Argentinean | 1,821 | 0.3% |
| Armenian | 1,583 | 0.3% |
| Assyrian / Chaldean / Syriac | 131 | 0.0% |
| Australian | 353 | 0.1% |
| Austrian | 1,721 | 0.3% |
| Bahamian | 87 | 0.0% |
| Barbadian | 192 | 0.0% |
| Basque | 55 | 0.0% |
| Belgian | 191 | 0.0% |
| Belizean | 119 | 0.0% |
| Bermudan | 22 | 0.0% |
| Bhutanese | 3,317 | 0.5% |
| Blackfeet | 166 | 0.0% |
| Bolivian | 971 | 0.2% |
| Brazilian | 16,216 | 2.6% |
| British | 1,599 | 0.3% |
| British West Indian | 616 | 0.1% |
| Bulgarian | 418 | 0.1% |
| Burmese | 12,905 | 2.1% |
| Canadian | 1,083 | 0.2% |
| Cape Verdean | 122 | 0.0% |
| Carpatho Rusyn | 96 | 0.0% |
| Central American | 30,033 | 4.8% |
| Central American Indian | 1,755 | 0.3% |
| Cherokee | 197 | 0.0% |
| Cheyenne | 7 | 0.0% |
| Chilean | 1,360 | 0.2% |
| Chippewa | 17 | 0.0% |
| Choctaw | 9 | 0.0% |
| Colombian | 13,227 | 2.1% |
| Costa Rican | 1,205 | 0.2% |
| Croatian | 1,921 | 0.3% |
| Cuban | 13,791 | 2.2% |
| Cypriot | 127 | 0.0% |
| Czech | 721 | 0.1% |
| Czechoslovakian | 295 | 0.1% |
| Danish | 463 | 0.1% |
| Delaware | 50 | 0.0% |
| Dominican | 39,751 | 6.4% |
| Dutch | 3,475 | 0.6% |
| Dutch West Indian | 77 | 0.0% |
| Eastern European | 2,997 | 0.5% |
| Ecuadorian | 35,328 | 5.7% |
| Egyptian | 7,520 | 1.2% |
| English | 13,365 | 2.1% |
| Estonian | 145 | 0.0% |
| Ethiopian | 552 | 0.1% |
| European | 3,820 | 0.6% |
| Filipino | 667 | 0.1% |
| Finnish | 369 | 0.1% |
| French | 4,097 | 0.7% |
| French American Indian | 18 | 0.0% |
| French Canadian | 584 | 0.1% |
| German | 29,054 | 4.6% |
| Ghanaian | 1,082 | 0.2% |
| Greek | 3,586 | 0.6% |
| Guamanian / Chamorro | 67 | 0.0% |
| Guatemalan | 8,409 | 1.3% |
| Guyanese | 1,008 | 0.2% |
| Haitian | 2,262 | 0.4% |
| Hmong | 5 | 0.0% |
| Honduran | 5,133 | 0.8% |
| Hungarian | 2,889 | 0.5% |
| Icelander | 32 | 0.0% |
| Indian (Asian) | 16,928 | 2.7% |
| Indonesian | 164 | 0.0% |
| Iranian | 744 | 0.1% |
| Iraqi | 73 | 0.0% |
| Irish | 43,888 | 7.0% |
| Iroquois | 9 | 0.0% |
| Israeli | 1,214 | 0.2% |
| Italian | 60,091 | 9.6% |
| Jamaican | 4,248 | 0.7% |
| Japanese | 43 | 0.0% |
| Jordanian | 492 | 0.1% |
| Kenyan | 334 | 0.1% |
| Korean | 13,642 | 2.2% |
| Laotian | 196 | 0.0% |
| Latvian | 218 | 0.0% |
| Lebanese | 1,184 | 0.2% |
| Liberian | 160 | 0.0% |
| Lithuanian | 1,194 | 0.2% |
| Lumbee | 15 | 0.0% |
| Luxembourger | 23 | 0.0% |
| Macedonian | 986 | 0.2% |
| Malaysian | 25 | 0.0% |
| Maltese | 193 | 0.0% |
| Mexican | 13,836 | 2.2% |
| Mexican American Indian | 141 | 0.0% |
| Mongolian | 36 | 0.0% |
| Moroccan | 794 | 0.1% |
| Native Hawaiian | 119 | 0.0% |
| Navajo | 5 | 0.0% |
| New Zealander | 9 | 0.0% |
| Nicaraguan | 1,143 | 0.2% |
| Nigerian | 3,769 | 0.6% |
| Northern European | 150 | 0.0% |
| Norwegian | 1,420 | 0.2% |
| Okinawan | 81 | 0.0% |
| Pakistani | 791 | 0.1% |
| Palestinian | 1,370 | 0.2% |
| Panamanian | 955 | 0.2% |
| Paraguayan | 203 | 0.0% |
| Pennsylvania German | 48 | 0.0% |
| Peruvian | 11,165 | 1.8% |
| Polish | 22,832 | 3.7% |
| Portuguese | 12,109 | 1.9% |
| Puerto Rican | 37,143 | 5.9% |
| Romanian | 1,676 | 0.3% |
| Russian | 10,721 | 1.7% |
| Salvadoran | 13,102 | 2.1% |
| Scandinavian | 338 | 0.1% |
| Scotch-Irish | 786 | 0.1% |
| Scottish | 2,507 | 0.4% |
| Seminole | 10 | 0.0% |
| Senegalese | 189 | 0.0% |
| Serbian | 400 | 0.1% |
| Sierra Leonean | 15 | 0.0% |
| Sioux | 11 | 0.0% |
| Slavic | 356 | 0.1% |
| Slovak | 937 | 0.2% |
| Slovene | 25 | 0.0% |
| Somali | 19 | 0.0% |
| South African | 184 | 0.0% |
| South American | 68,006 | 10.9% |
| South American Indian | 773 | 0.1% |
| Soviet Union | 30 | 0.0% |
| Spaniard | 5,216 | 0.8% |
| Spanish | 1,149 | 0.2% |
| Spanish American Indian | 10 | 0.0% |
| Sri Lankan | 1,237 | 0.2% |
| Subsaharan African | 12,234 | 2.0% |
| Sudanese | 66 | 0.0% |
| Swedish | 1,453 | 0.2% |
| Swiss | 884 | 0.1% |
| Syrian | 1,230 | 0.2% |
| Thai | 27,902 | 4.5% |
| Tohono O'Odham | 9 | 0.0% |
| Tongan | 7 | 0.0% |
| Trinidadian and Tobagonian | 1,553 | 0.3% |
| Turkish | 1,626 | 0.3% |
| U.S. Virgin Islander | 32 | 0.0% |
| Ugandan | 272 | 0.0% |
| Ukrainian | 3,999 | 0.6% |
| Uruguayan | 1,232 | 0.2% |
| Venezuelan | 2,591 | 0.4% |
| Vietnamese | 678 | 0.1% |
| Welsh | 736 | 0.1% |
| West Indian | 858 | 0.1% |
| Yaqui | 10 | 0.0% |
| Yugoslavian | 236 | 0.0% |
| Zimbabwean | 36 | 0.0% | View All 160 Rows |
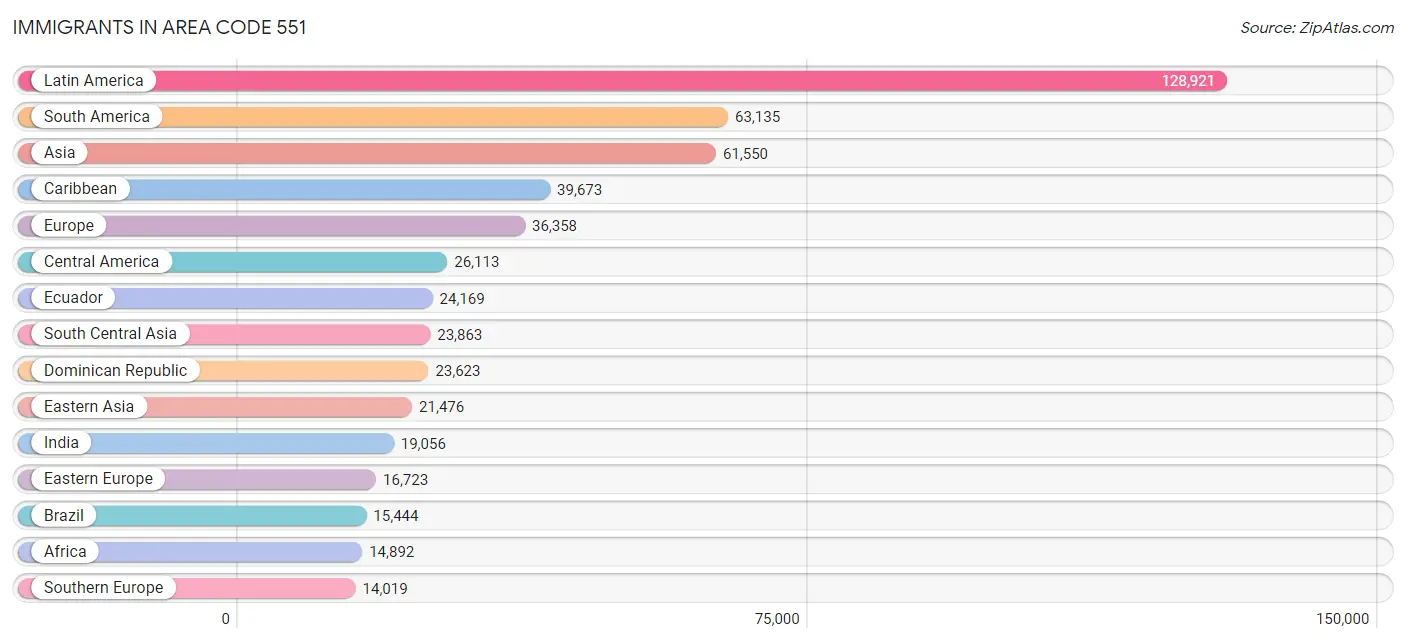
Immigrants in Area Code 551
The most numerous immigrant groups reported in Area Code 551 came from Latin America (128,921 | 20.6%), South America (63,135 | 10.1%), Asia (61,550 | 9.9%), Caribbean (39,673 | 6.4%), and Europe (36,358 | 5.8%), together accounting for 52.8% of all Area Code 551 residents.
| Immigration Origin | # Population | % Population |
| Afghanistan | 118 | 0.0% |
| Africa | 14,892 | 2.4% |
| Albania | 773 | 0.1% |
| Argentina | 1,117 | 0.2% |
| Armenia | 109 | 0.0% |
| Asia | 61,550 | 9.9% |
| Australia | 454 | 0.1% |
| Austria | 80 | 0.0% |
| Azores | 55 | 0.0% |
| Bahamas | 32 | 0.0% |
| Bangladesh | 628 | 0.1% |
| Barbados | 96 | 0.0% |
| Belarus | 788 | 0.1% |
| Belgium | 66 | 0.0% |
| Belize | 122 | 0.0% |
| Bolivia | 782 | 0.1% |
| Bosnia and Herzegovina | 38 | 0.0% |
| Brazil | 15,444 | 2.5% |
| Bulgaria | 299 | 0.1% |
| Cabo Verde | 44 | 0.0% |
| Cambodia | 27 | 0.0% |
| Cameroon | 238 | 0.0% |
| Canada | 1,580 | 0.3% |
| Caribbean | 39,673 | 6.4% |
| Central America | 26,113 | 4.2% |
| Chile | 967 | 0.2% |
| China | 11,544 | 1.8% |
| Colombia | 8,645 | 1.4% |
| Congo | 223 | 0.0% |
| Costa Rica | 626 | 0.1% |
| Croatia | 674 | 0.1% |
| Cuba | 9,430 | 1.5% |
| Czechoslovakia | 207 | 0.0% |
| Denmark | 79 | 0.0% |
| Dominica | 136 | 0.0% |
| Dominican Republic | 23,623 | 3.8% |
| Eastern Africa | 1,316 | 0.2% |
| Eastern Asia | 21,476 | 3.4% |
| Eastern Europe | 16,723 | 2.7% |
| Ecuador | 24,169 | 3.9% |
| Egypt | 5,252 | 0.8% |
| El Salvador | 7,773 | 1.2% |
| England | 531 | 0.1% |
| Ethiopia | 328 | 0.1% |
| Europe | 36,358 | 5.8% |
| France | 907 | 0.2% |
| Germany | 1,023 | 0.2% |
| Ghana | 1,196 | 0.2% |
| Greece | 495 | 0.1% |
| Grenada | 110 | 0.0% |
| Guatemala | 5,994 | 1.0% |
| Guyana | 930 | 0.2% |
| Haiti | 1,074 | 0.2% |
| Honduras | 3,353 | 0.5% |
| Hong Kong | 724 | 0.1% |
| Hungary | 434 | 0.1% |
| India | 19,056 | 3.0% |
| Indonesia | 212 | 0.0% |
| Iran | 626 | 0.1% |
| Iraq | 9 | 0.0% |
| Ireland | 1,131 | 0.2% |
| Israel | 1,242 | 0.2% |
| Italy | 2,892 | 0.5% |
| Jamaica | 2,918 | 0.5% |
| Japan | 1,704 | 0.3% |
| Jordan | 351 | 0.1% |
| Kazakhstan | 93 | 0.0% |
| Kenya | 400 | 0.1% |
| Korea | 8,228 | 1.3% |
| Kuwait | 297 | 0.1% |
| Laos | 55 | 0.0% |
| Latin America | 128,921 | 20.6% |
| Latvia | 246 | 0.0% |
| Lebanon | 431 | 0.1% |
| Liberia | 281 | 0.1% |
| Lithuania | 90 | 0.0% |
| Malaysia | 240 | 0.0% |
| Mexico | 6,994 | 1.1% |
| Middle Africa | 737 | 0.1% |
| Moldova | 241 | 0.0% |
| Morocco | 663 | 0.1% |
| Nepal | 397 | 0.1% |
| Netherlands | 182 | 0.0% |
| Nicaragua | 595 | 0.1% |
| Nigeria | 2,633 | 0.4% |
| North Macedonia | 488 | 0.1% |
| Northern Africa | 6,168 | 1.0% |
| Northern Europe | 3,147 | 0.5% |
| Norway | 38 | 0.0% |
| Oceania | 575 | 0.1% |
| Pakistan | 2,162 | 0.4% |
| Panama | 656 | 0.1% |
| Peru | 7,365 | 1.2% |
| Philippines | 8,381 | 1.3% |
| Poland | 4,010 | 0.6% |
| Portugal | 7,401 | 1.2% |
| Romania | 739 | 0.1% |
| Russia | 2,932 | 0.5% |
| Saudi Arabia | 191 | 0.0% |
| Scotland | 68 | 0.0% |
| Senegal | 233 | 0.0% |
| Serbia | 250 | 0.0% |
| Sierra Leone | 62 | 0.0% |
| Singapore | 160 | 0.0% |
| Somalia | 11 | 0.0% |
| South Africa | 474 | 0.1% |
| South America | 63,135 | 10.1% |
| South Central Asia | 23,863 | 3.8% |
| South Eastern Asia | 10,126 | 1.6% |
| Southern Europe | 14,019 | 2.2% |
| Spain | 3,184 | 0.5% |
| Sri Lanka | 287 | 0.1% |
| St. Vincent and the Grenadines | 82 | 0.0% |
| Sudan | 44 | 0.0% |
| Sweden | 37 | 0.0% |
| Switzerland | 143 | 0.0% |
| Syria | 797 | 0.1% |
| Taiwan | 940 | 0.2% |
| Thailand | 487 | 0.1% |
| Trinidad and Tobago | 1,678 | 0.3% |
| Turkey | 1,400 | 0.2% |
| Uganda | 249 | 0.0% |
| Ukraine | 2,996 | 0.5% |
| Uruguay | 865 | 0.1% |
| Uzbekistan | 309 | 0.1% |
| Venezuela | 2,366 | 0.4% |
| Vietnam | 400 | 0.1% |
| Western Africa | 5,382 | 0.9% |
| Western Asia | 5,722 | 0.9% |
| Western Europe | 2,401 | 0.4% |
| Yemen | 187 | 0.0% |
| Zaire | 23 | 0.0% |
| Zimbabwe | 121 | 0.0% | View All 133 Rows |
Sex and Age in Area Code 551
Sex and Age in Area Code 551
The most populous age groups in Area Code 551 are 30 to 34 Years (29,577 | 9.4%) for men and 30 to 34 Years (26,323 | 8.5%) for women.
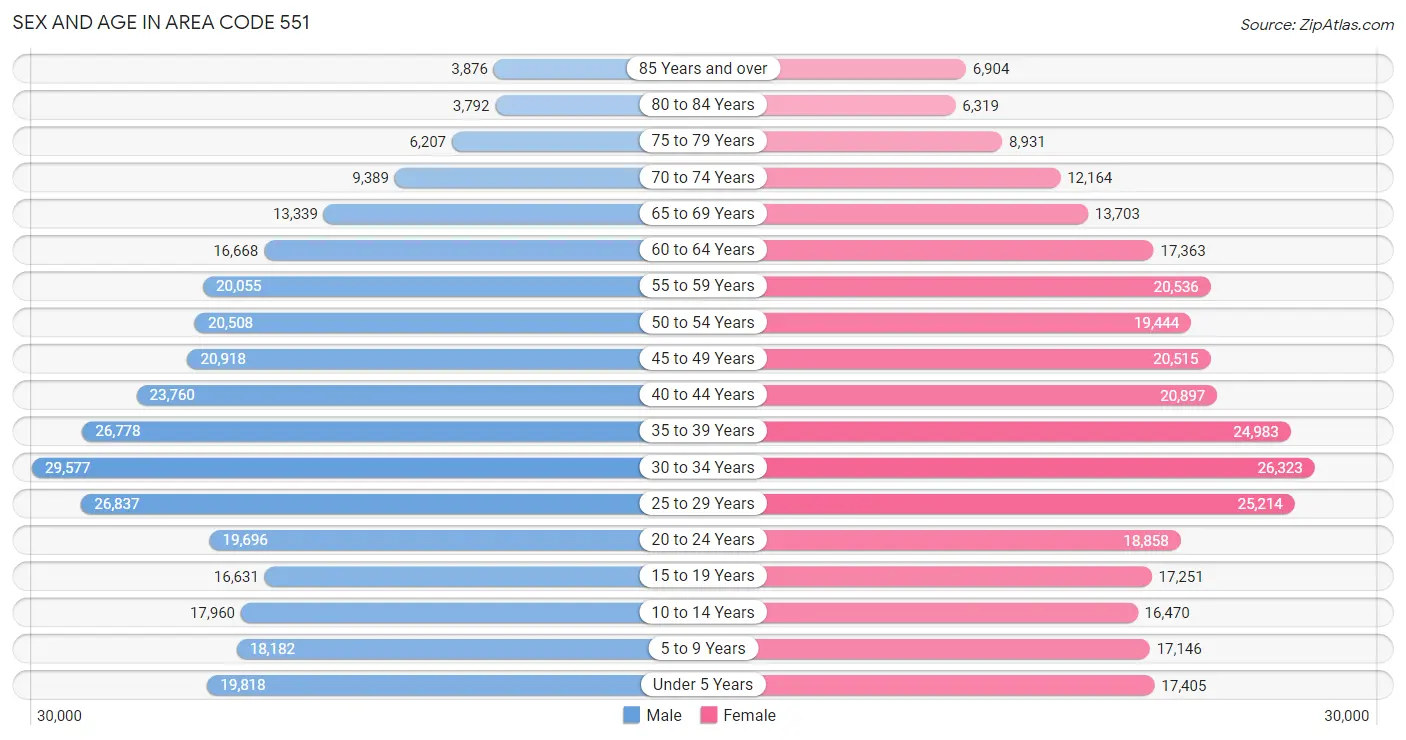
| Age Bracket | Male | Female |
| Under 5 Years | 19,818 (6.3%) | 17,405 (5.6%) |
| 5 to 9 Years | 18,182 (5.8%) | 17,146 (5.5%) |
| 10 to 14 Years | 17,960 (5.7%) | 16,470 (5.3%) |
| 15 to 19 Years | 16,631 (5.3%) | 17,251 (5.6%) |
| 20 to 24 Years | 19,696 (6.3%) | 18,858 (6.1%) |
| 25 to 29 Years | 26,837 (8.6%) | 25,214 (8.1%) |
| 30 to 34 Years | 29,577 (9.4%) | 26,323 (8.5%) |
| 35 to 39 Years | 26,778 (8.5%) | 24,983 (8.1%) |
| 40 to 44 Years | 23,760 (7.6%) | 20,897 (6.7%) |
| 45 to 49 Years | 20,918 (6.7%) | 20,515 (6.6%) |
| 50 to 54 Years | 20,508 (6.5%) | 19,444 (6.3%) |
| 55 to 59 Years | 20,055 (6.4%) | 20,536 (6.6%) |
| 60 to 64 Years | 16,668 (5.3%) | 17,363 (5.6%) |
| 65 to 69 Years | 13,339 (4.3%) | 13,703 (4.4%) |
| 70 to 74 Years | 9,389 (3.0%) | 12,164 (3.9%) |
| 75 to 79 Years | 6,207 (2.0%) | 8,931 (2.9%) |
| 80 to 84 Years | 3,792 (1.2%) | 6,319 (2.0%) |
| 85 Years and over | 3,876 (1.2%) | 6,904 (2.2%) |
| Total | 313,991 (100.0%) | 310,426 (100.0%) |
Families and Households in Area Code 551
Median Family Size in Area Code 551
The median family size in Area Code 551 is 3.07 persons per family, with married-couple families (106,667 | 69.3%) accounting for the largest median family size of 3.16681 persons per family. On the other hand, single male/father families (14,011 | 9.1%) represent the smallest median family size with 2.67 persons per family.
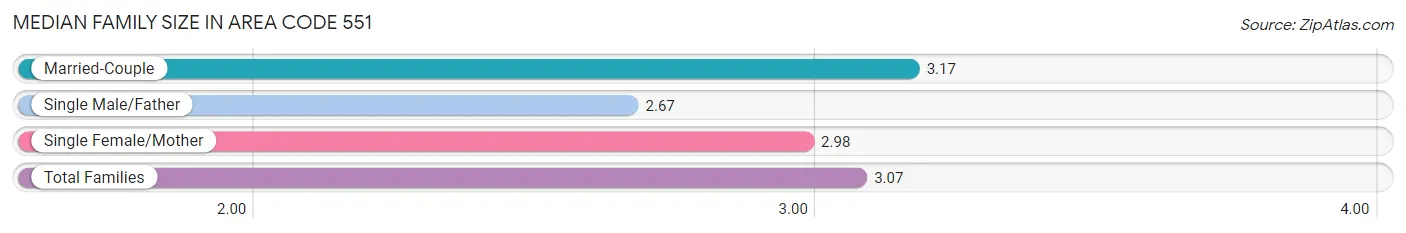
| Family Type | # Families | Family Size |
| Married-Couple | 106,667 (69.3%) | 3.17 |
| Single Male/Father | 14,011 (9.1%) | 2.67 |
| Single Female/Mother | 33,159 (21.5%) | 2.98 |
| Total Families | 153,837 (100.0%) | 3.07 |
Median Household Size in Area Code 551
The median household size in Area Code 551 is 2.47 persons per household, with married-couple households (106,667 | 43.3%) accounting for the largest median household size of 3.19318 persons per household. non-family households (92,288 | 37.5%) represent the smallest median household size with 1.22 persons per household.
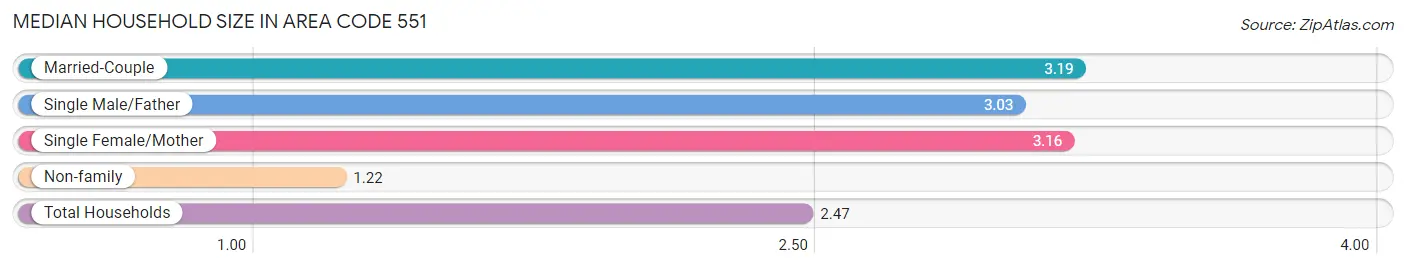
| Household Type | # Households | Household Size |
| Married-Couple | 106,667 (43.3%) | 3.19 |
| Single Male/Father | 14,011 (5.7%) | 3.03 |
| Single Female/Mother | 33,159 (13.5%) | 3.16 |
| Non-family | 92,288 (37.5%) | 1.22 |
| Total Households | 246,125 (100.0%) | 2.47 |
Household Size by Marriage Status in Area Code 551
Out of a total of 246,125 households in Area Code 551, 153,837 (62.5%) are family households, while 92,288 (37.5%) are nonfamily households. The most numerous type of family households are 2-person households, comprising 59,349, and the most common type of nonfamily households are 1-person households, comprising 73,296.
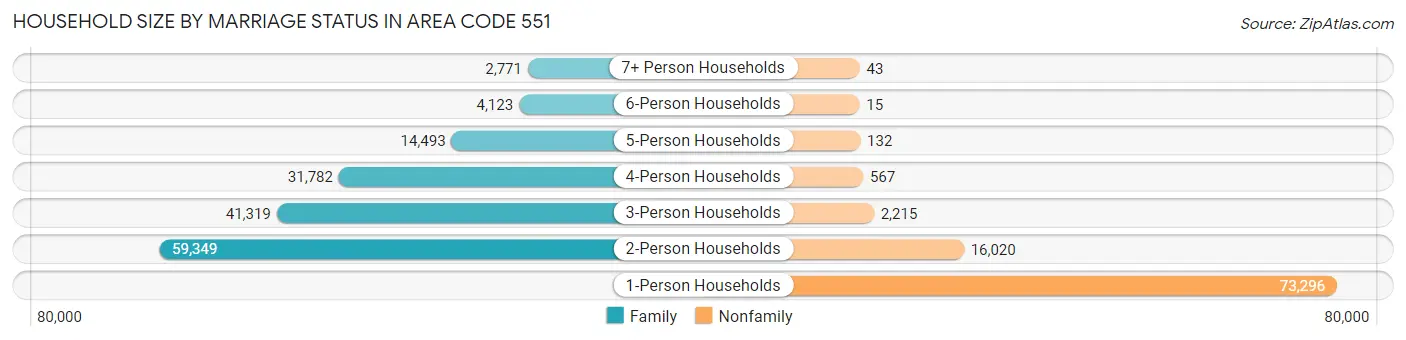
| Household Size | Family Households | Nonfamily Households |
| 1-Person Households | - | 73,296 (29.8%) |
| 2-Person Households | 59,349 (24.1%) | 16,020 (6.5%) |
| 3-Person Households | 41,319 (16.8%) | 2,215 (0.9%) |
| 4-Person Households | 31,782 (12.9%) | 567 (0.2%) |
| 5-Person Households | 14,493 (5.9%) | 132 (0.1%) |
| 6-Person Households | 4,123 (1.7%) | 15 (0.0%) |
| 7+ Person Households | 2,771 (1.1%) | 43 (0.0%) |
| Total | 153,837 (62.5%) | 92,288 (37.5%) |
Female Fertility in Area Code 551
Fertility by Age in Area Code 551
Average fertility rate in Area Code 551 is 48.8 births per 1,000 women. Women in the age bracket of 20 to 34 years have the highest fertility rate with 65.8 births per 1,000 women. Women in the age bracket of 20 to 34 years acount for 57.9% of all women with births.
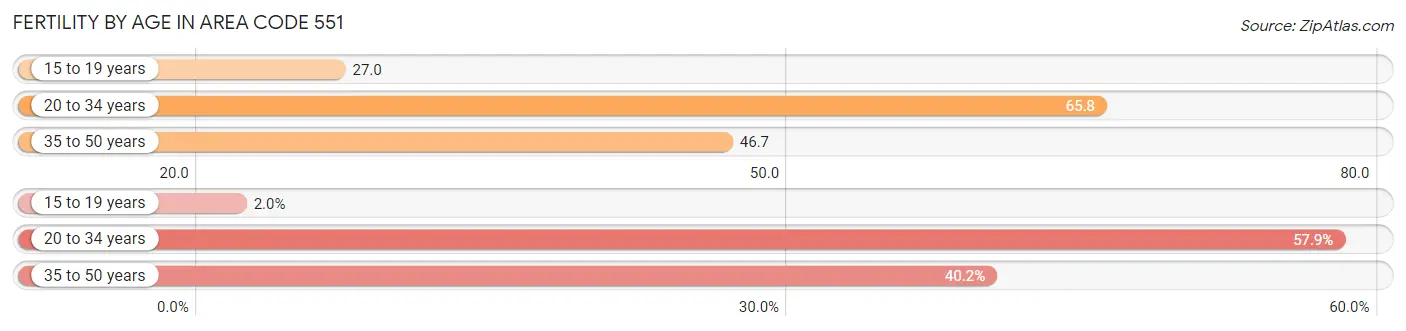
| Age Bracket | Women with Births | Births / 1,000 Women |
| 15 to 19 years | 164 (2.0%) | 27.0 |
| 20 to 34 years | 4,821 (57.9%) | 65.8 |
| 35 to 50 years | 3,345 (40.2%) | 46.7 |
| Total | 8,330 (100.0%) | 48.8 |
Fertility by Age by Marriage Status in Area Code 551
75.3% of women with births (8,330) in Area Code 551 are married. The highest percentage of unmarried women with births falls into 15 to 19 years age bracket with 100.0% of them unmarried at the time of birth, while the lowest percentage of unmarried women with births belong to 35 to 50 years age bracket with 30.4% of them unmarried.
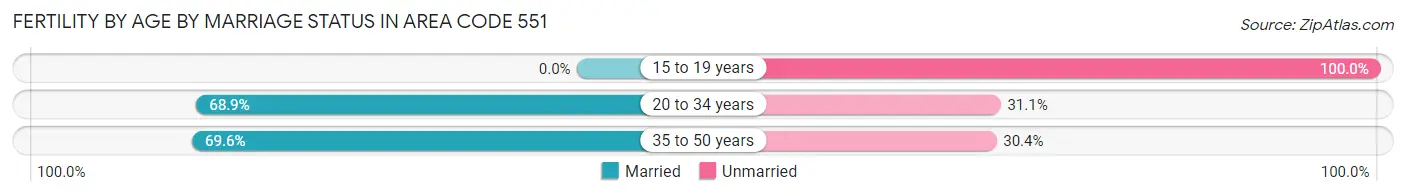
| Age Bracket | Married | Unmarried |
| 15 to 19 years | 0 (0.0%) | 164 (100.0%) |
| 20 to 34 years | 3,320 (68.9%) | 1,501 (31.1%) |
| 35 to 50 years | 2,329 (69.6%) | 1,016 (30.4%) |
| Total | 6,272 (75.3%) | 2,058 (24.7%) |
Fertility by Education in Area Code 551
Average fertility rate in Area Code 551 is 48.8 births per 1,000 women. Women with the education attainment of graduate degree have the highest fertility rate of 80.8 births per 1,000 women, while women with the education attainment of less than high school have the lowest fertility at 39.0 births per 1,000 women. Women with the education attainment of bachelor's degree represent 27.3% of all women with births.
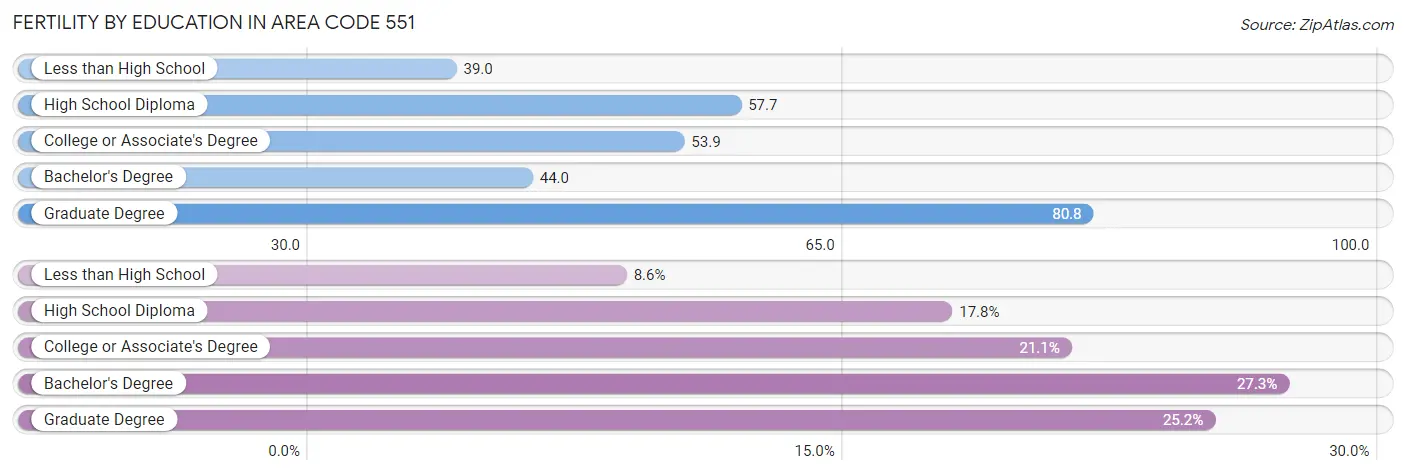
| Educational Attainment | Women with Births | Births / 1,000 Women |
| Less than High School | 720 (8.6%) | 39.0 |
| High School Diploma | 1,482 (17.8%) | 57.7 |
| College or Associate's Degree | 1,761 (21.1%) | 53.9 |
| Bachelor's Degree | 2,270 (27.3%) | 44.0 |
| Graduate Degree | 2,097 (25.2%) | 80.8 |
| Total | 8,330 (100.0%) | 48.8 |
Fertility by Education by Marriage Status in Area Code 551
24.7% of women with births in Area Code 551 are unmarried. Women with the educational attainment of graduate degree are most likely to be married with 71.7% of them married at childbirth, while women with the educational attainment of less than high school are least likely to be married with 75.0% of them unmarried at childbirth.
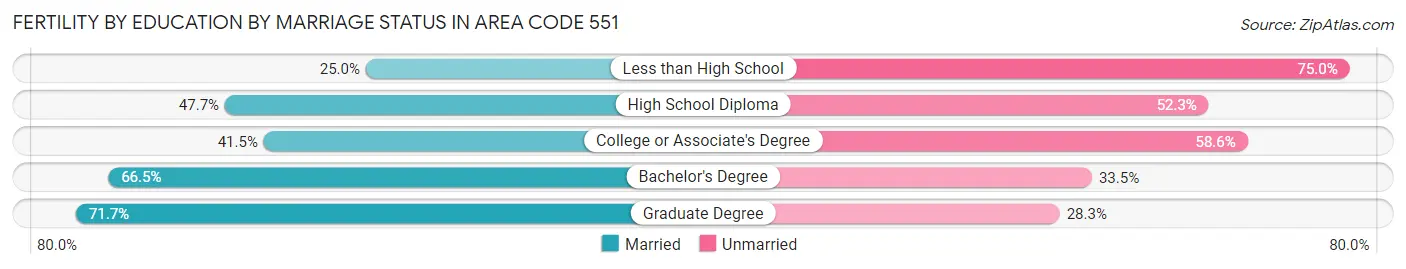
| Educational Attainment | Married | Unmarried |
| Less than High School | 180 (25.0%) | 540 (75.0%) |
| High School Diploma | 707 (47.7%) | 775 (52.3%) |
| College or Associate's Degree | 730 (41.4%) | 1,031 (58.6%) |
| Bachelor's Degree | 1,510 (66.5%) | 760 (33.5%) |
| Graduate Degree | 1,504 (71.7%) | 593 (28.3%) |
| Total | 6,272 (75.3%) | 2,058 (24.7%) |
Employment Characteristics in Area Code 551
Employment by Class of Employer in Area Code 551
Among the 322,733 employed individuals in Area Code 551, private company employees (238,086 | 73.8%), not-for-profit organizations (22,390 | 6.9%), and local government employees (22,048 | 6.8%) make up the most common classes of employment.
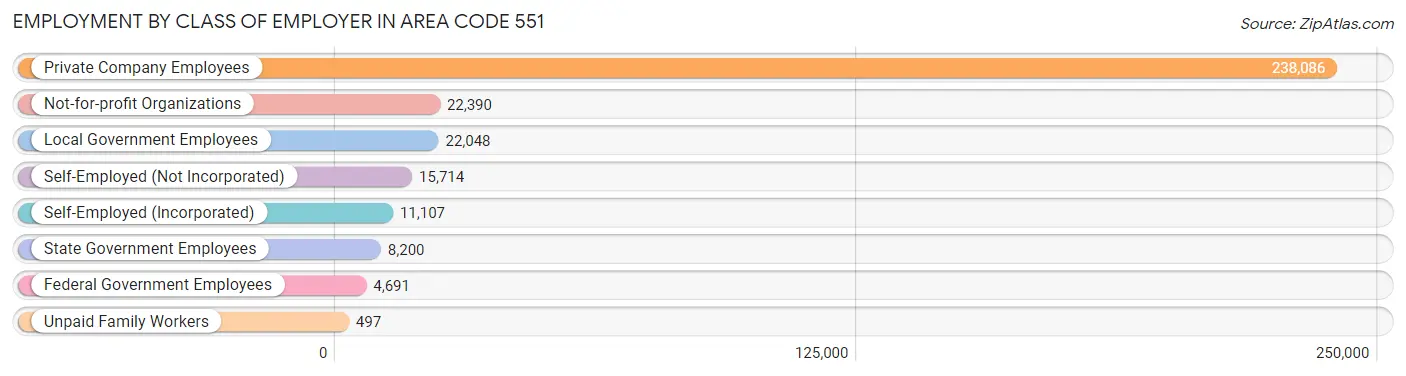
| Employer Class | # Employees | % Employees |
| Private Company Employees | 238,086 | 73.8% |
| Self-Employed (Incorporated) | 11,107 | 3.4% |
| Self-Employed (Not Incorporated) | 15,714 | 4.9% |
| Not-for-profit Organizations | 22,390 | 6.9% |
| Local Government Employees | 22,048 | 6.8% |
| State Government Employees | 8,200 | 2.5% |
| Federal Government Employees | 4,691 | 1.5% |
| Unpaid Family Workers | 497 | 0.2% |
| Total | 322,733 | 100.0% |
Employment Status by Age in Area Code 551
According to the labor force statistics for Area Code 551, out of the total population over 16 years of age (510,601), 69.1% or 352,876 individuals are in the labor force, with 5.4% or 19,196 of them unemployed. The age group with the highest labor force participation rate is 30 to 34 years, with 87.5% or 48,929 individuals in the labor force. Within the labor force, the 16 to 19 years age range has the highest percentage of unemployed individuals, with 313.0% or 23,121 of them being unemployed.
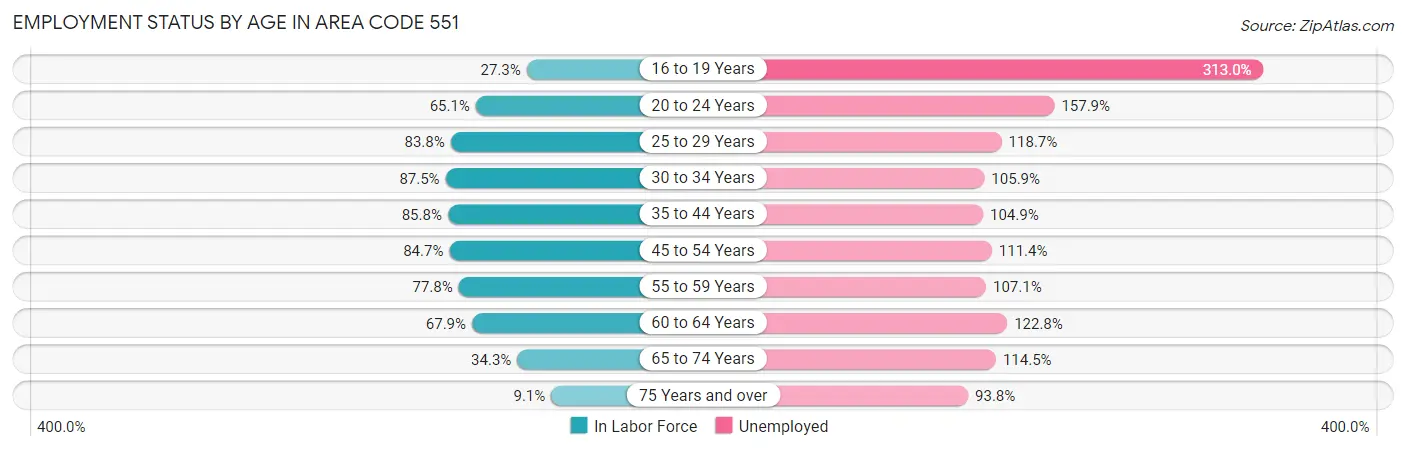
| Age Bracket | In Labor Force | Unemployed |
| 16 to 19 Years | 7,388 (27.3%) | 23,121 (313.0%) |
| 20 to 24 Years | 25,095 (65.1%) | 39,625 (157.9%) |
| 25 to 29 Years | 43,609 (83.8%) | 51,763 (118.7%) |
| 30 to 34 Years | 48,928 (87.5%) | 51,816 (105.9%) |
| 35 to 44 Years | 82,757 (85.8%) | 86,811 (104.9%) |
| 45 to 54 Years | 68,966 (84.7%) | 76,828 (111.4%) |
| 55 to 59 Years | 31,596 (77.8%) | 33,839 (107.1%) |
| 60 to 64 Years | 23,112 (67.9%) | 28,379 (122.8%) |
| 65 to 74 Years | 16,666 (34.3%) | 19,085 (114.5%) |
| 75 Years and over | 3,268 (9.1%) | 3,065 (93.8%) |
| Total | 352,895 (69.1%) | 19,200 (5.4%) |
Employment Status by Educational Attainment in Area Code 551
According to labor force statistics for Area Code 551, 82.9% of individuals (298,716) out of the total population between 25 and 64 years of age (360,376) are in the labor force, with 106.2% or 317,236 of them being unemployed. The group with the highest labor force participation rate are those with the educational attainment of bachelor's degree or higher, with 88.2% or 151,182 individuals in the labor force. Within the labor force, individuals with less than high school education have the highest percentage of unemployment, with 217.4% or 55,213 of them being unemployed.
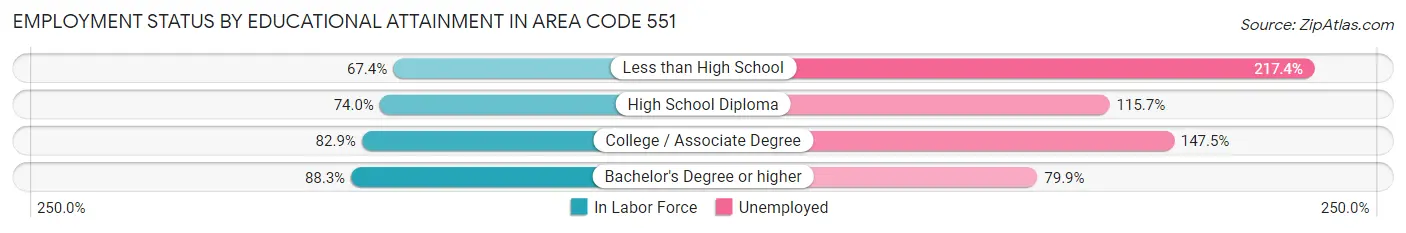
| Educational Attainment | In Labor Force | Unemployed |
| Less than High School | 25,399 (67.4%) | 81,968 (217.4%) |
| High School Diploma | 62,751 (74.0%) | 98,118 (115.7%) |
| College / Associate Degree | 55,194 (82.9%) | 98,172 (147.5%) |
| Bachelor's Degree or higher | 151,190 (88.2%) | 136,877 (79.9%) |
| Total | 298,719 (82.9%) | 382,719 (106.2%) |
Employment Occupations by Sex in Area Code 551
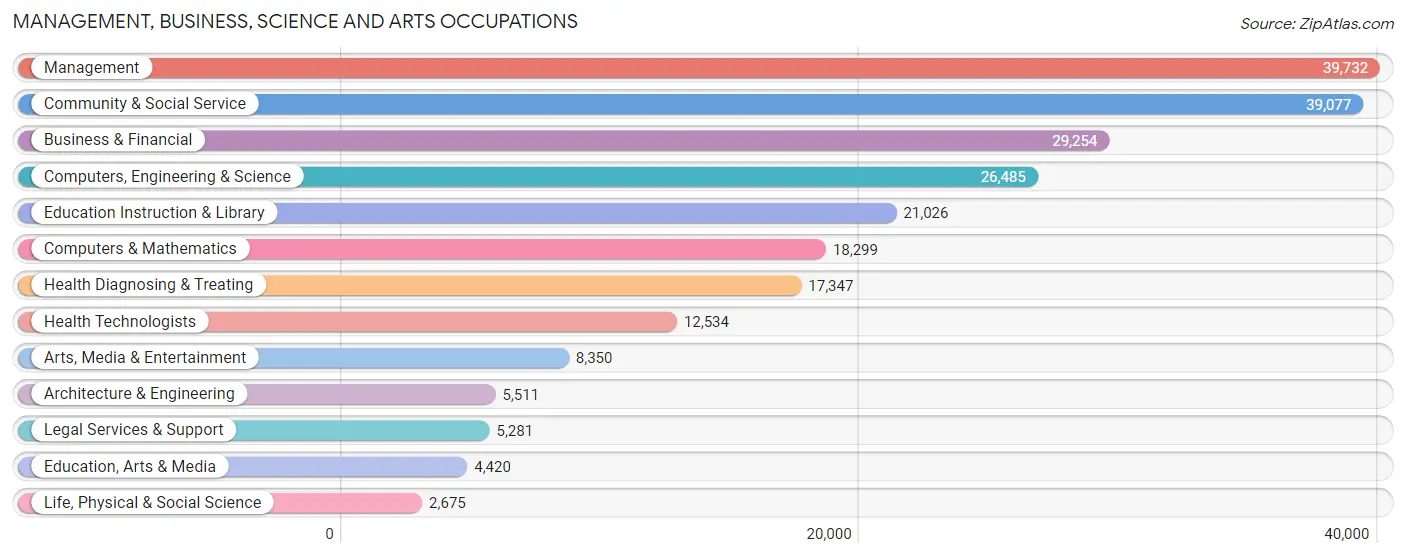
Management, Business, Science and Arts Occupations
The most common Management, Business, Science and Arts occupations in Area Code 551 are Management (39,732 | 12.0%), Community & Social Service (39,077 | 11.8%), Business & Financial (29,254 | 8.9%), Computers, Engineering & Science (26,485 | 8.0%), and Education Instruction & Library (21,026 | 6.4%).
Management, Business, Science and Arts Occupations by Sex
Within the Management, Business, Science and Arts occupations in Area Code 551, the most male-oriented occupations are Architecture & Engineering (79.3%), Computers & Mathematics (78.3%), and Computers, Engineering & Science (75.6%), while the most female-oriented occupations are Education Instruction & Library (74.7%), Health Technologists (70.6%), and Health Diagnosing & Treating (69.3%).
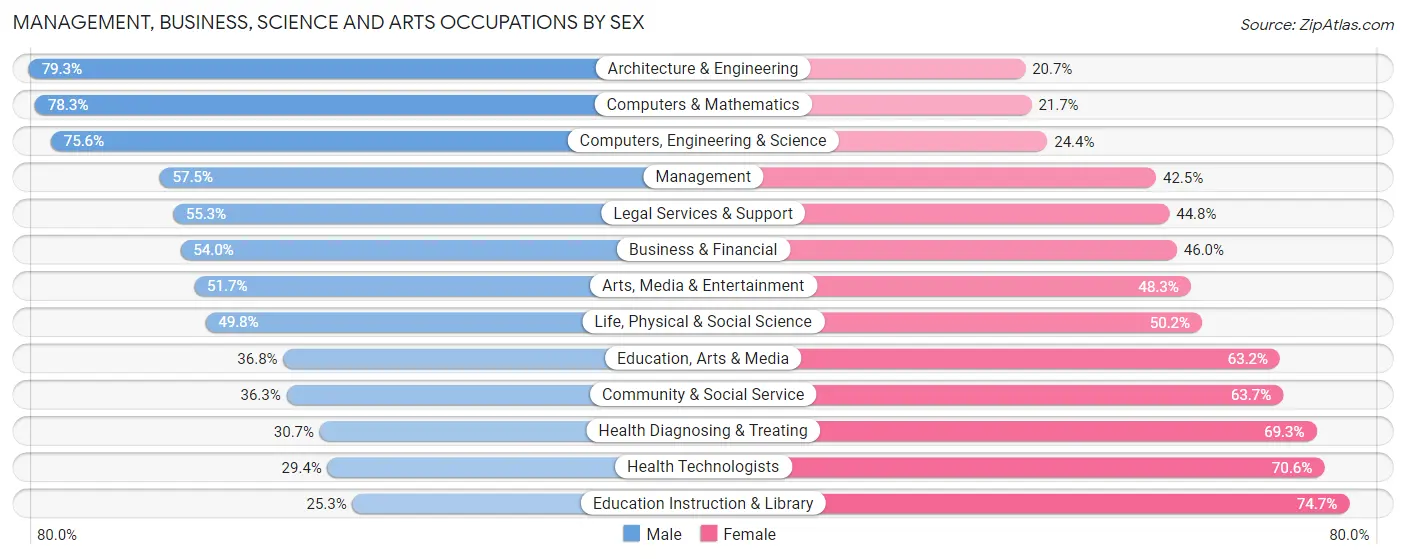
| Occupation | Male | Female |
| Management | 22,831 (57.5%) | 16,901 (42.5%) |
| Business & Financial | 15,794 (54.0%) | 13,460 (46.0%) |
| Computers, Engineering & Science | 20,024 (75.6%) | 6,461 (24.4%) |
| Computers & Mathematics | 14,321 (78.3%) | 3,978 (21.7%) |
| Architecture & Engineering | 4,370 (79.3%) | 1,141 (20.7%) |
| Life, Physical & Social Science | 1,333 (49.8%) | 1,342 (50.2%) |
| Community & Social Service | 14,176 (36.3%) | 24,901 (63.7%) |
| Education, Arts & Media | 1,627 (36.8%) | 2,793 (63.2%) |
| Legal Services & Support | 2,918 (55.2%) | 2,363 (44.8%) |
| Education Instruction & Library | 5,314 (25.3%) | 15,712 (74.7%) |
| Arts, Media & Entertainment | 4,317 (51.7%) | 4,033 (48.3%) |
| Health Diagnosing & Treating | 5,330 (30.7%) | 12,017 (69.3%) |
| Health Technologists | 3,687 (29.4%) | 8,847 (70.6%) |
| Total (Category) | 78,155 (51.4%) | 73,740 (48.5%) |
| Total (Overall) | 179,929 (54.6%) | 149,798 (45.4%) |
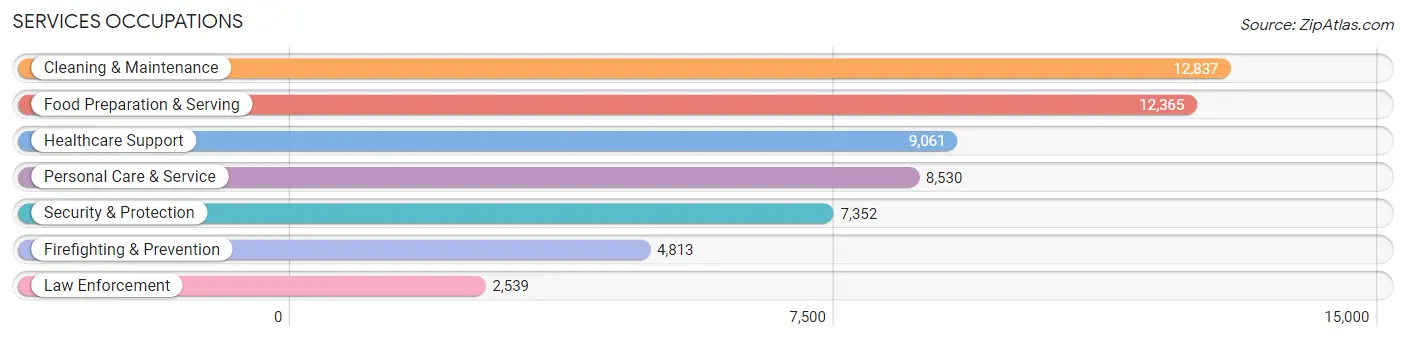
Services Occupations
The most common Services occupations in Area Code 551 are Cleaning & Maintenance (12,837 | 3.9%), Food Preparation & Serving (12,365 | 3.7%), Healthcare Support (9,061 | 2.8%), Personal Care & Service (8,530 | 2.6%), and Security & Protection (7,352 | 2.2%).
Services Occupations by Sex
Within the Services occupations in Area Code 551, the most male-oriented occupations are Law Enforcement (85.6%), Security & Protection (72.3%), and Firefighting & Prevention (65.3%), while the most female-oriented occupations are Healthcare Support (85.5%), Personal Care & Service (78.4%), and Cleaning & Maintenance (53.7%).
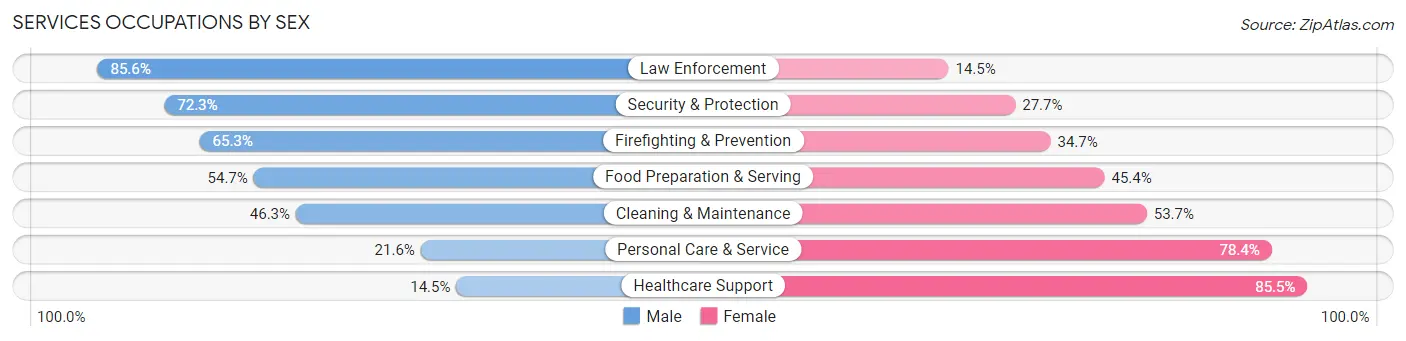
| Occupation | Male | Female |
| Healthcare Support | 1,315 (14.5%) | 7,746 (85.5%) |
| Security & Protection | 5,317 (72.3%) | 2,035 (27.7%) |
| Firefighting & Prevention | 3,145 (65.3%) | 1,668 (34.7%) |
| Law Enforcement | 2,172 (85.6%) | 367 (14.4%) |
| Food Preparation & Serving | 6,757 (54.6%) | 5,608 (45.4%) |
| Cleaning & Maintenance | 5,941 (46.3%) | 6,896 (53.7%) |
| Personal Care & Service | 1,840 (21.6%) | 6,690 (78.4%) |
| Total (Category) | 21,170 (42.2%) | 28,975 (57.8%) |
| Total (Overall) | 179,929 (54.6%) | 149,798 (45.4%) |
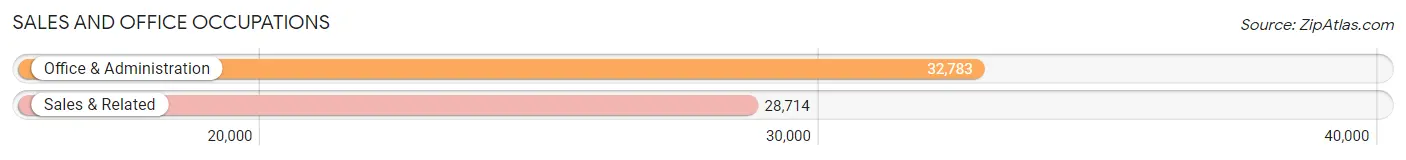
Sales and Office Occupations
The most common Sales and Office occupations in Area Code 551 are Office & Administration (32,783 | 9.9%), and Sales & Related (28,714 | 8.7%).
Sales and Office Occupations by Sex
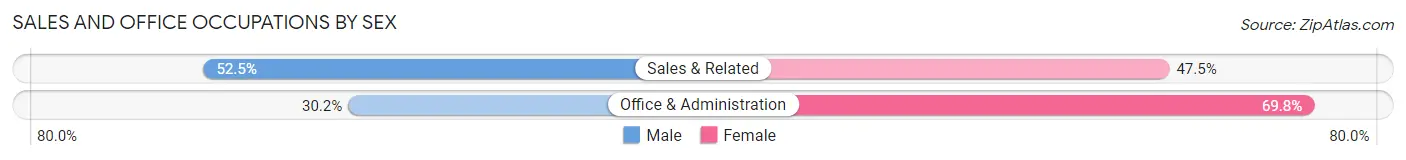
| Occupation | Male | Female |
| Sales & Related | 15,066 (52.5%) | 13,648 (47.5%) |
| Office & Administration | 9,912 (30.2%) | 22,871 (69.8%) |
| Total (Category) | 24,978 (40.6%) | 36,519 (59.4%) |
| Total (Overall) | 179,929 (54.6%) | 149,798 (45.4%) |
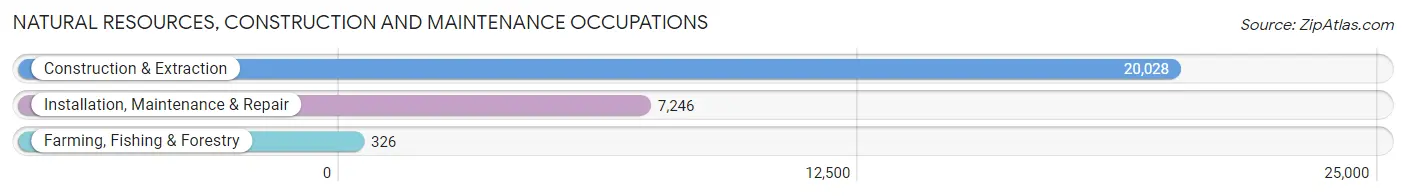
Natural Resources, Construction and Maintenance Occupations
The most common Natural Resources, Construction and Maintenance occupations in Area Code 551 are Construction & Extraction (20,028 | 6.1%), Installation, Maintenance & Repair (7,246 | 2.2%), and Farming, Fishing & Forestry (326 | 0.1%).
Natural Resources, Construction and Maintenance Occupations by Sex
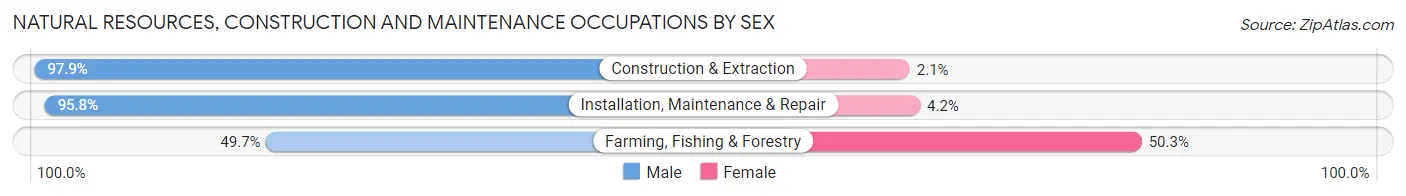
| Occupation | Male | Female |
| Farming, Fishing & Forestry | 162 (49.7%) | 164 (50.3%) |
| Construction & Extraction | 19,616 (97.9%) | 412 (2.1%) |
| Installation, Maintenance & Repair | 6,942 (95.8%) | 304 (4.2%) |
| Total (Category) | 26,720 (96.8%) | 880 (3.2%) |
| Total (Overall) | 179,929 (54.6%) | 149,798 (45.4%) |
Production, Transportation and Moving Occupations
The most common Production, Transportation and Moving occupations in Area Code 551 are Transportation (14,236 | 4.3%), Material Moving (12,405 | 3.8%), and Production (11,949 | 3.6%).
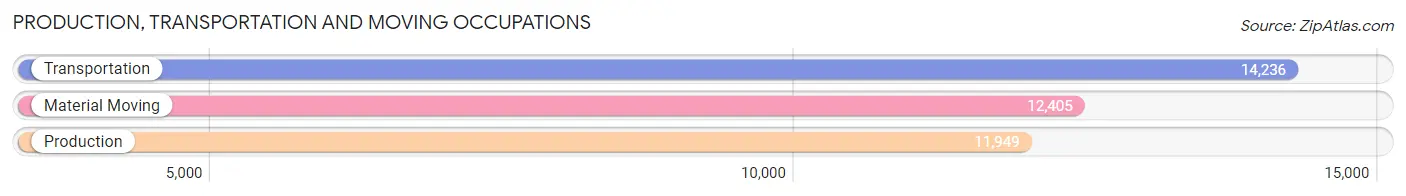
Production, Transportation and Moving Occupations by Sex
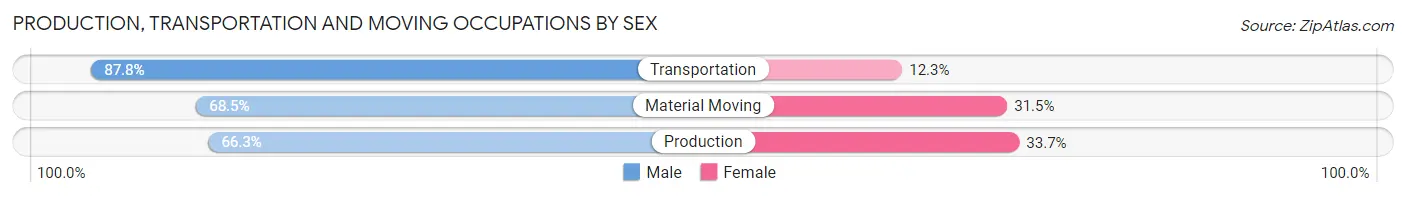
| Occupation | Male | Female |
| Production | 7,918 (66.3%) | 4,031 (33.7%) |
| Transportation | 12,492 (87.7%) | 1,744 (12.2%) |
| Material Moving | 8,496 (68.5%) | 3,909 (31.5%) |
| Total (Category) | 28,906 (74.9%) | 9,684 (25.1%) |
| Total (Overall) | 179,929 (54.6%) | 149,798 (45.4%) |
Employment Industries by Sex in Area Code 551
Employment Industries in Area Code 551
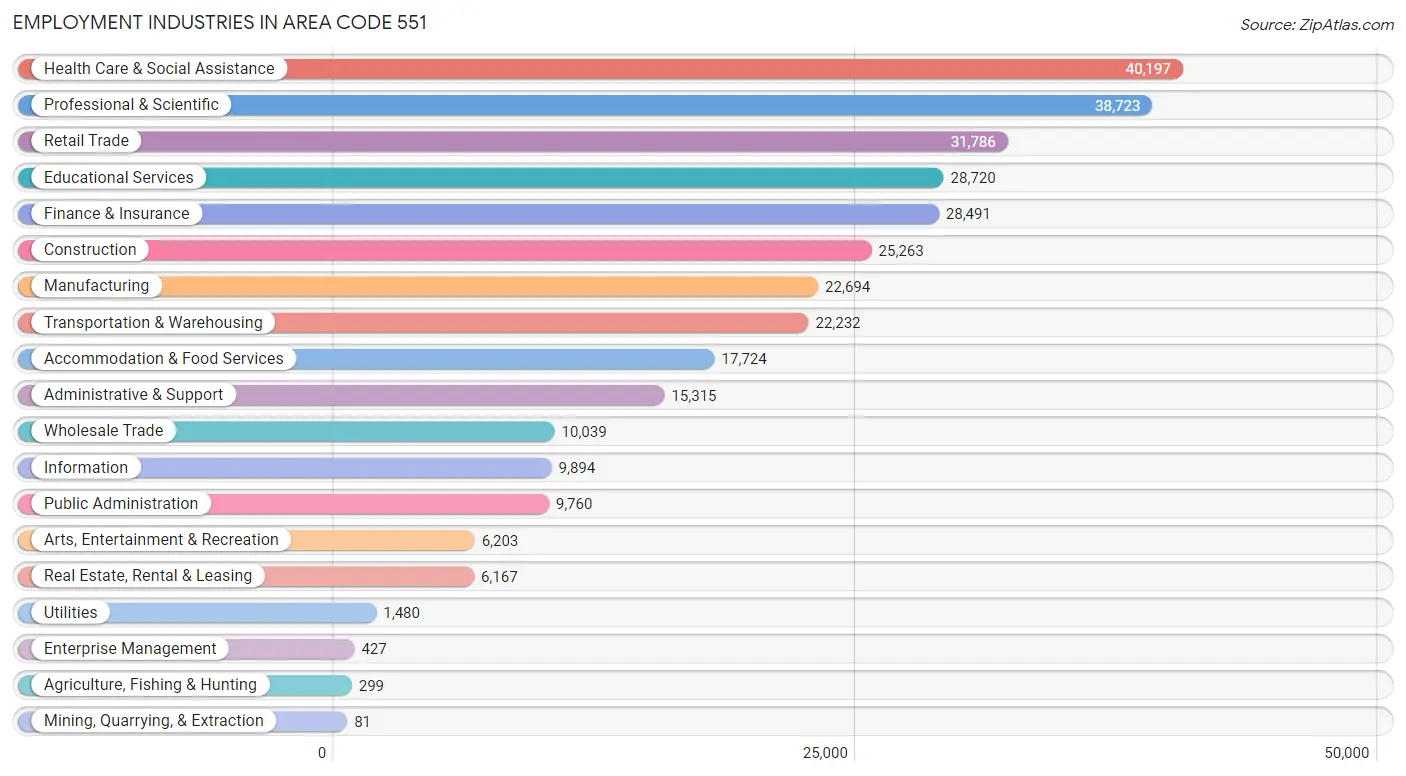
The major employment industries in Area Code 551 include Health Care & Social Assistance (40,197 | 12.2%), Professional & Scientific (38,723 | 11.7%), Retail Trade (31,786 | 9.6%), Educational Services (28,720 | 8.7%), and Finance & Insurance (28,491 | 8.6%).
Employment Industries by Sex in Area Code 551
The Area Code 551 industries that see more men than women are Construction (93.0%), Mining, Quarrying, & Extraction (81.5%), and Transportation & Warehousing (74.4%), whereas the industries that tend to have a higher number of women are Health Care & Social Assistance (74.6%), Educational Services (66.5%), and Administrative & Support (50.8%).
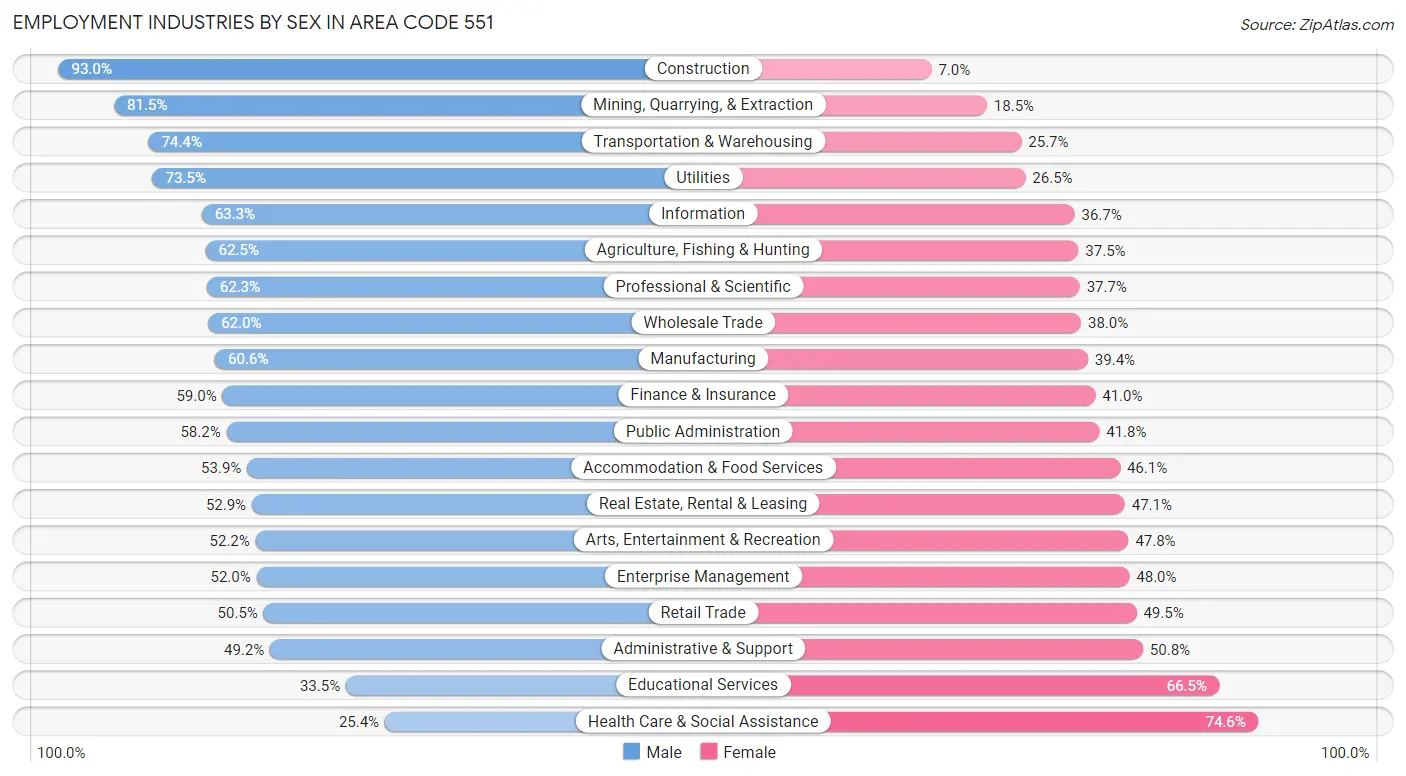
| Industry | Male | Female |
| Agriculture, Fishing & Hunting | 187 (62.5%) | 112 (37.5%) |
| Mining, Quarrying, & Extraction | 66 (81.5%) | 15 (18.5%) |
| Construction | 23,485 (93.0%) | 1,778 (7.0%) |
| Manufacturing | 13,745 (60.6%) | 8,949 (39.4%) |
| Wholesale Trade | 6,223 (62.0%) | 3,816 (38.0%) |
| Retail Trade | 16,059 (50.5%) | 15,727 (49.5%) |
| Transportation & Warehousing | 16,530 (74.4%) | 5,702 (25.7%) |
| Utilities | 1,088 (73.5%) | 392 (26.5%) |
| Information | 6,266 (63.3%) | 3,628 (36.7%) |
| Finance & Insurance | 16,821 (59.0%) | 11,670 (41.0%) |
| Real Estate, Rental & Leasing | 3,265 (52.9%) | 2,902 (47.1%) |
| Professional & Scientific | 24,112 (62.3%) | 14,611 (37.7%) |
| Enterprise Management | 222 (52.0%) | 205 (48.0%) |
| Administrative & Support | 7,534 (49.2%) | 7,781 (50.8%) |
| Educational Services | 9,615 (33.5%) | 19,105 (66.5%) |
| Health Care & Social Assistance | 10,215 (25.4%) | 29,982 (74.6%) |
| Arts, Entertainment & Recreation | 3,237 (52.2%) | 2,966 (47.8%) |
| Accommodation & Food Services | 9,558 (53.9%) | 8,166 (46.1%) |
| Public Administration | 5,681 (58.2%) | 4,079 (41.8%) |
| Total | 179,929 (54.6%) | 149,798 (45.4%) |
Education in Area Code 551
School Enrollment in Area Code 551
The most common levels of schooling among the 142,525 students in Area Code 551 are college / undergraduate (29,268 | 20.5%), middle school (28,912 | 20.3%), and elementary school (28,024 | 19.7%).
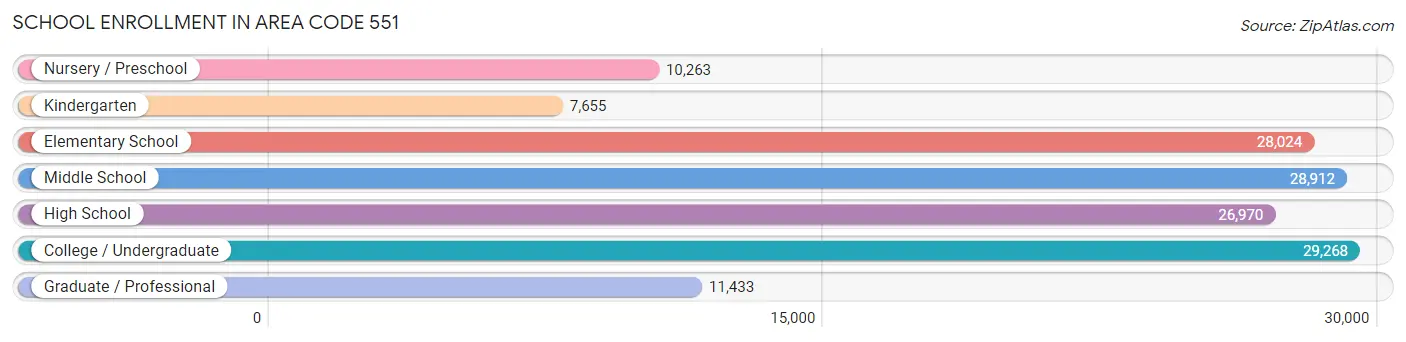
| School Level | # Students | % Students |
| Nursery / Preschool | 10,263 | 7.2% |
| Kindergarten | 7,655 | 5.4% |
| Elementary School | 28,024 | 19.7% |
| Middle School | 28,912 | 20.3% |
| High School | 26,970 | 18.9% |
| College / Undergraduate | 29,268 | 20.5% |
| Graduate / Professional | 11,433 | 8.0% |
| Total | 142,525 | 100.0% |
School Enrollment by Age by Funding Source in Area Code 551
Out of a total of 142,525 students who are enrolled in schools in Area Code 551, 26,289 (18.4%) attend a private institution, while the remaining 116,236 (81.6%) are enrolled in public schools. The age group of 35 years and over has the highest likelihood of being enrolled in private schools, with 3,616 (48.1% in the age bracket) enrolled. Conversely, the age group of 10 to 14 year olds has the lowest likelihood of being enrolled in a private school, with 30,872 (91.8% in the age bracket) attending a public institution.
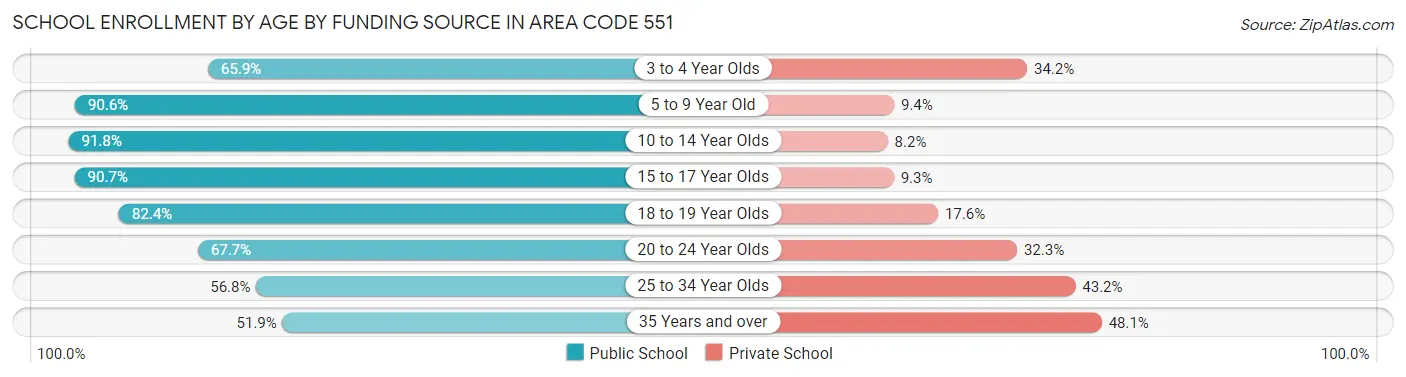
| Age Bracket | Public School | Private School |
| 3 to 4 Year Olds | 6,157 (65.8%) | 3,193 (34.2%) |
| 5 to 9 Year Old | 30,979 (90.6%) | 3,206 (9.4%) |
| 10 to 14 Year Olds | 30,872 (91.8%) | 2,753 (8.2%) |
| 15 to 17 Year Olds | 18,642 (90.7%) | 1,915 (9.3%) |
| 18 to 19 Year Olds | 8,653 (82.4%) | 1,845 (17.6%) |
| 20 to 24 Year Olds | 11,344 (67.7%) | 5,408 (32.3%) |
| 25 to 34 Year Olds | 5,703 (56.8%) | 4,331 (43.2%) |
| 35 Years and over | 3,908 (51.9%) | 3,616 (48.1%) |
| Total | 116,236 (81.6%) | 26,289 (18.4%) |
Educational Attainment by Field of Study in Area Code 551
Business (49,024 | 23.0%), engineering (19,574 | 9.2%), social sciences (19,355 | 9.1%), science & technology (17,294 | 8.1%), and education (16,381 | 7.7%) are the most common fields of study among 213,201 individuals in Area Code 551 who have obtained a bachelor's degree or higher.
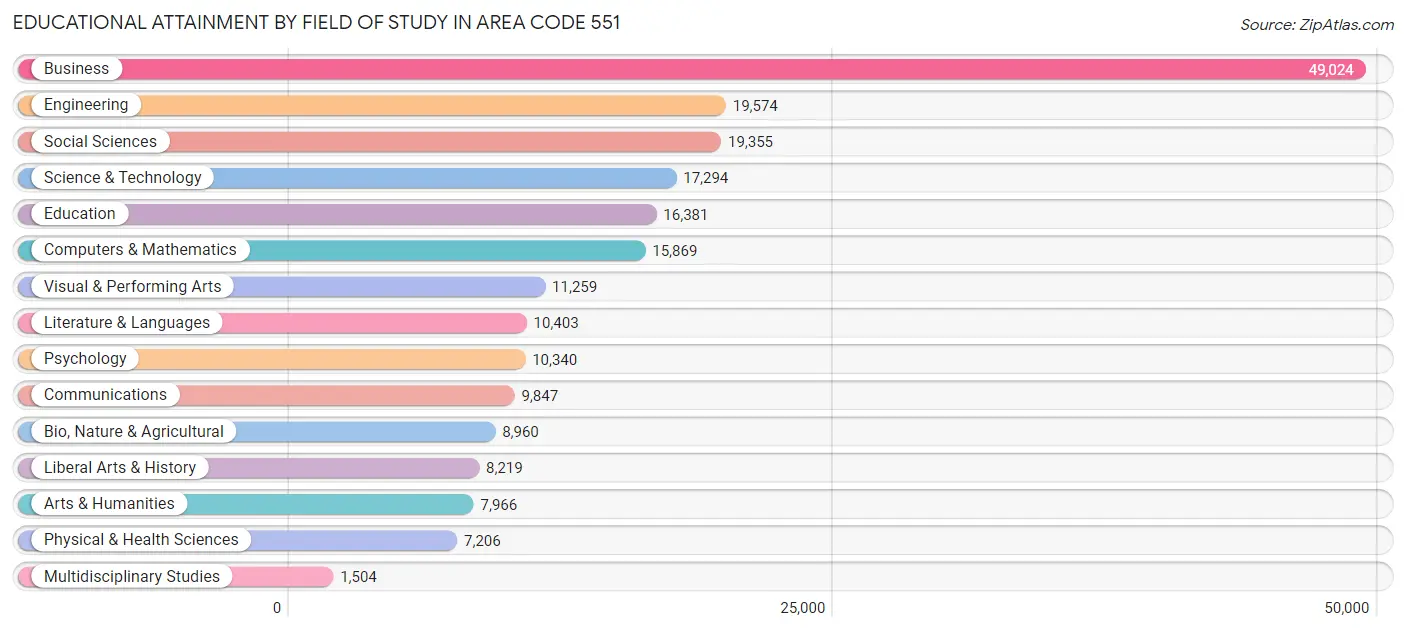
| Field of Study | # Graduates | % Graduates |
| Computers & Mathematics | 15,869 | 7.4% |
| Bio, Nature & Agricultural | 8,960 | 4.2% |
| Physical & Health Sciences | 7,206 | 3.4% |
| Psychology | 10,340 | 4.9% |
| Social Sciences | 19,355 | 9.1% |
| Engineering | 19,574 | 9.2% |
| Multidisciplinary Studies | 1,504 | 0.7% |
| Science & Technology | 17,294 | 8.1% |
| Business | 49,024 | 23.0% |
| Education | 16,381 | 7.7% |
| Literature & Languages | 10,403 | 4.9% |
| Liberal Arts & History | 8,219 | 3.9% |
| Visual & Performing Arts | 11,259 | 5.3% |
| Communications | 9,847 | 4.6% |
| Arts & Humanities | 7,966 | 3.7% |
| Total | 213,201 | 100.0% |
Transportation & Commute in Area Code 551
Vehicle Availability by Sex in Area Code 551
The most prevalent vehicle ownership categories in Area Code 551 are males with 1 vehicle (65,156, accounting for 36.9%) and females with 1 vehicle (54,100, making up 45.0%).
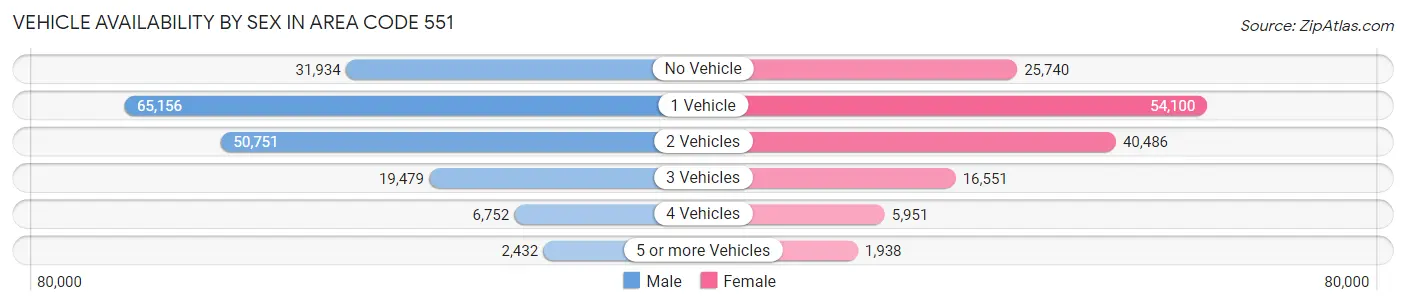
| Vehicles Available | Male | Female |
| No Vehicle | 31,934 (18.1%) | 25,740 (17.8%) |
| 1 Vehicle | 65,156 (36.9%) | 54,100 (37.4%) |
| 2 Vehicles | 50,751 (28.7%) | 40,486 (28.0%) |
| 3 Vehicles | 19,479 (11.0%) | 16,551 (11.4%) |
| 4 Vehicles | 6,752 (3.8%) | 5,951 (4.1%) |
| 5 or more Vehicles | 2,432 (1.4%) | 1,938 (1.3%) |
| Total | 176,504 (100.0%) | 144,766 (100.0%) |
Commute Time in Area Code 551
The most frequently occuring commute durations in Area Code 551 are 30 to 34 minutes (46,771 commuters, 16.7%), 20 to 24 minutes (39,190 commuters, 14.0%), and 45 to 59 minutes (34,603 commuters, 12.4%).
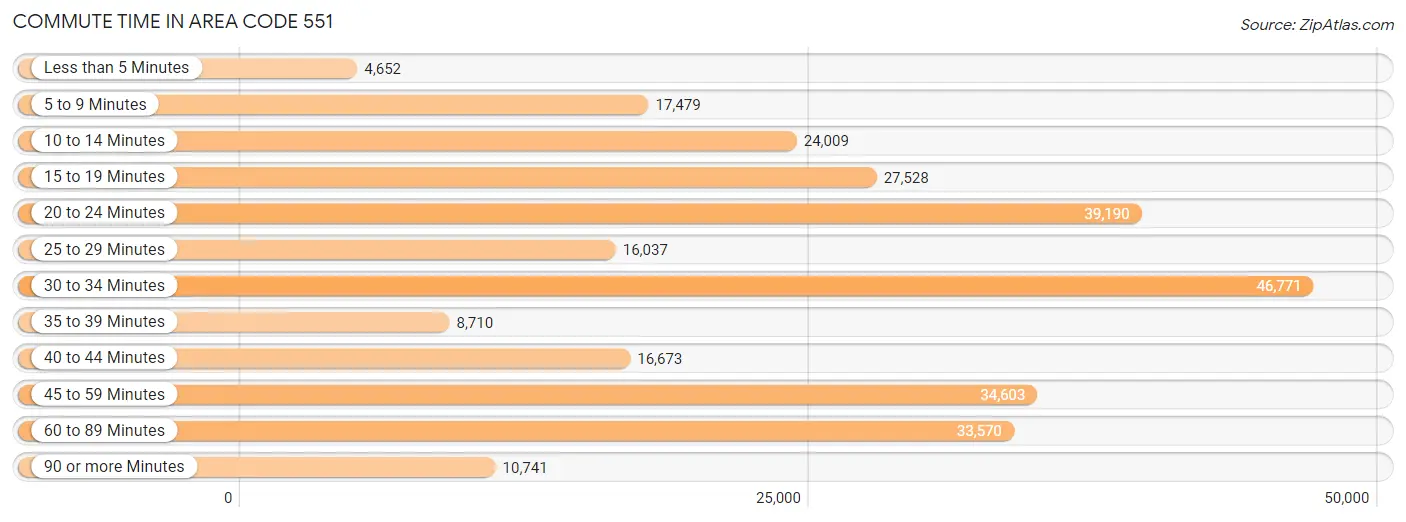
| Commute Time | # Commuters | % Commuters |
| Less than 5 Minutes | 4,652 | 1.7% |
| 5 to 9 Minutes | 17,479 | 6.2% |
| 10 to 14 Minutes | 24,009 | 8.6% |
| 15 to 19 Minutes | 27,528 | 9.8% |
| 20 to 24 Minutes | 39,190 | 14.0% |
| 25 to 29 Minutes | 16,037 | 5.7% |
| 30 to 34 Minutes | 46,771 | 16.7% |
| 35 to 39 Minutes | 8,710 | 3.1% |
| 40 to 44 Minutes | 16,673 | 6.0% |
| 45 to 59 Minutes | 34,603 | 12.4% |
| 60 to 89 Minutes | 33,570 | 12.0% |
| 90 or more Minutes | 10,741 | 3.8% |
Commute Time by Sex in Area Code 551
The most common commute times in Area Code 551 are 30 to 34 minutes (26,495 commuters, 17.1%) for males and 30 to 34 minutes (20,276 commuters, 16.2%) for females.
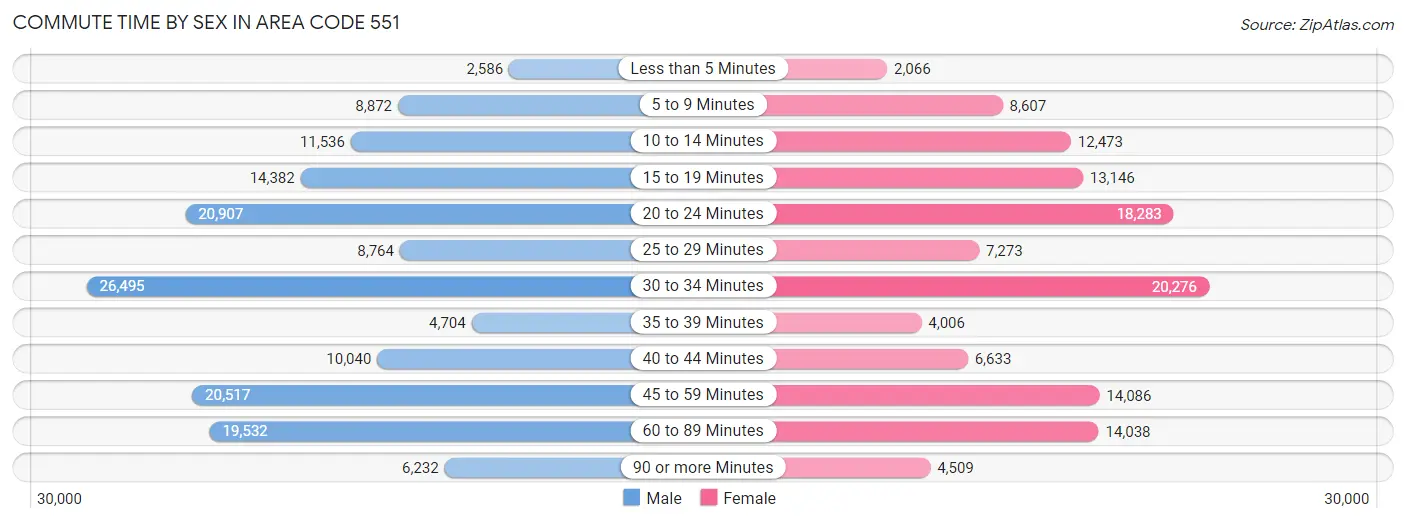
| Commute Time | Male | Female |
| Less than 5 Minutes | 2,586 (1.7%) | 2,066 (1.7%) |
| 5 to 9 Minutes | 8,872 (5.7%) | 8,607 (6.9%) |
| 10 to 14 Minutes | 11,536 (7.5%) | 12,473 (10.0%) |
| 15 to 19 Minutes | 14,382 (9.3%) | 13,146 (10.5%) |
| 20 to 24 Minutes | 20,907 (13.5%) | 18,283 (14.6%) |
| 25 to 29 Minutes | 8,764 (5.7%) | 7,273 (5.8%) |
| 30 to 34 Minutes | 26,495 (17.1%) | 20,276 (16.2%) |
| 35 to 39 Minutes | 4,704 (3.0%) | 4,006 (3.2%) |
| 40 to 44 Minutes | 10,040 (6.5%) | 6,633 (5.3%) |
| 45 to 59 Minutes | 20,517 (13.3%) | 14,086 (11.2%) |
| 60 to 89 Minutes | 19,532 (12.6%) | 14,038 (11.2%) |
| 90 or more Minutes | 6,232 (4.0%) | 4,509 (3.6%) |
Time of Departure to Work by Sex in Area Code 551
The most frequent times of departure to work in Area Code 551 are 8:00 AM to 8:29 AM (28,930, 18.7%) for males and 8:00 AM to 8:29 AM (27,044, 21.6%) for females.
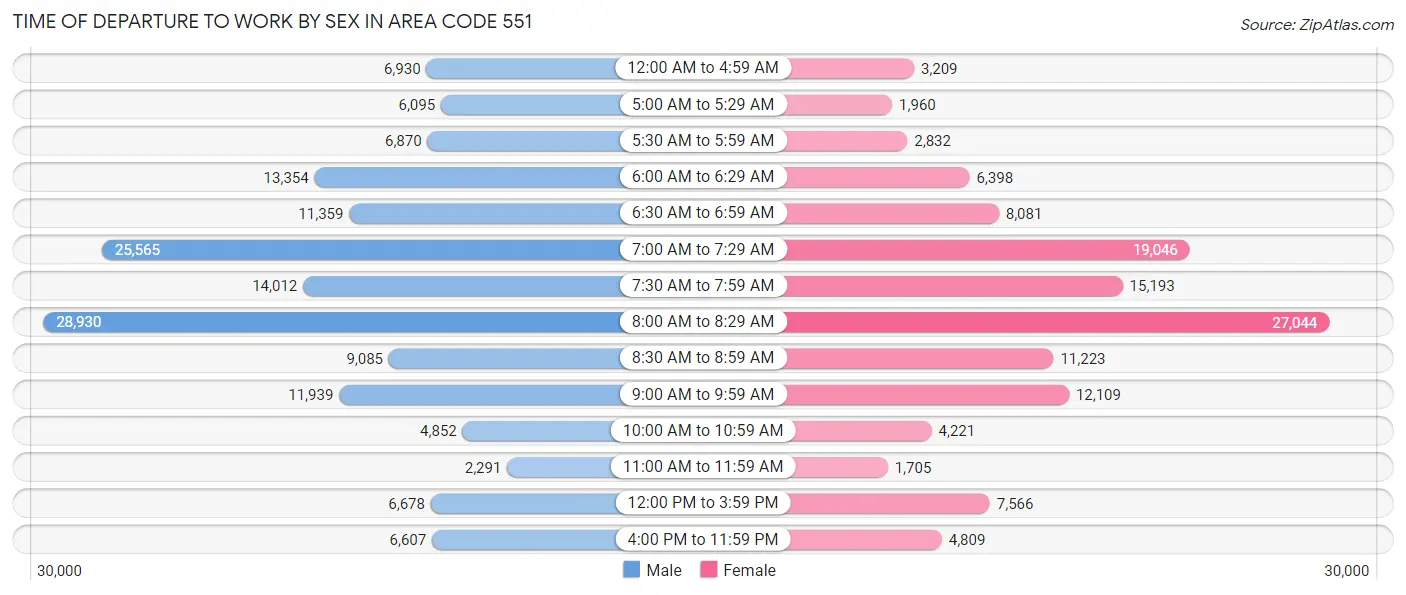
| Time of Departure | Male | Female |
| 12:00 AM to 4:59 AM | 6,930 (4.5%) | 3,209 (2.6%) |
| 5:00 AM to 5:29 AM | 6,095 (3.9%) | 1,960 (1.6%) |
| 5:30 AM to 5:59 AM | 6,870 (4.4%) | 2,832 (2.3%) |
| 6:00 AM to 6:29 AM | 13,354 (8.6%) | 6,398 (5.1%) |
| 6:30 AM to 6:59 AM | 11,359 (7.3%) | 8,081 (6.4%) |
| 7:00 AM to 7:29 AM | 25,565 (16.5%) | 19,046 (15.2%) |
| 7:30 AM to 7:59 AM | 14,012 (9.1%) | 15,193 (12.1%) |
| 8:00 AM to 8:29 AM | 28,930 (18.7%) | 27,044 (21.6%) |
| 8:30 AM to 8:59 AM | 9,085 (5.9%) | 11,223 (8.9%) |
| 9:00 AM to 9:59 AM | 11,939 (7.7%) | 12,109 (9.7%) |
| 10:00 AM to 10:59 AM | 4,852 (3.1%) | 4,221 (3.4%) |
| 11:00 AM to 11:59 AM | 2,291 (1.5%) | 1,705 (1.4%) |
| 12:00 PM to 3:59 PM | 6,678 (4.3%) | 7,566 (6.0%) |
| 4:00 PM to 11:59 PM | 6,607 (4.3%) | 4,809 (3.8%) |
| Total | 154,567 (100.0%) | 125,396 (100.0%) |
Housing Occupancy in Area Code 551
Occupancy by Ownership in Area Code 551
Of the total 246,125 dwellings in Area Code 551, owner-occupied units account for 97,579 (39.7%), while renter-occupied units make up 148,546 (60.4%).
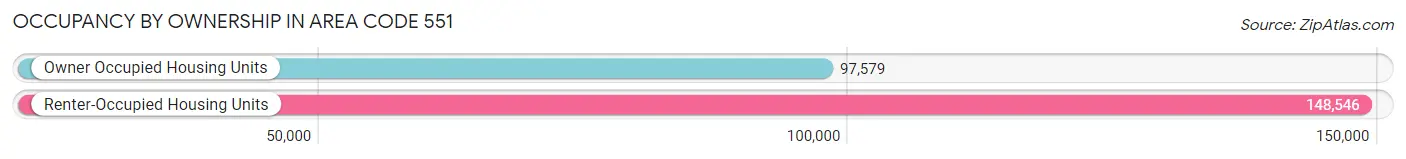
| Occupancy | # Housing Units | % Housing Units |
| Owner Occupied Housing Units | 97,579 | 39.7% |
| Renter-Occupied Housing Units | 148,546 | 60.4% |
| Total Occupied Housing Units | 246,125 | 100.0% |
Occupancy by Household Size in Area Code 551
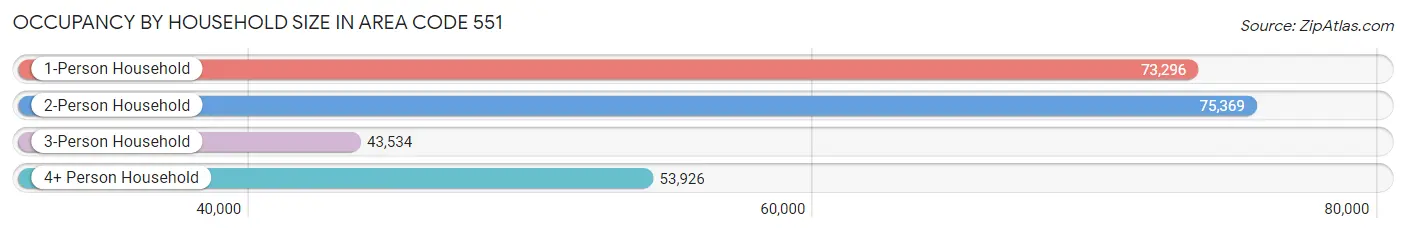
| Household Size | # Housing Units | % Housing Units |
| 1-Person Household | 73,296 | 29.8% |
| 2-Person Household | 75,369 | 30.6% |
| 3-Person Household | 43,534 | 17.7% |
| 4+ Person Household | 53,926 | 21.9% |
| Total Housing Units | 246,125 | 100.0% |
Occupancy by Ownership by Household Size in Area Code 551
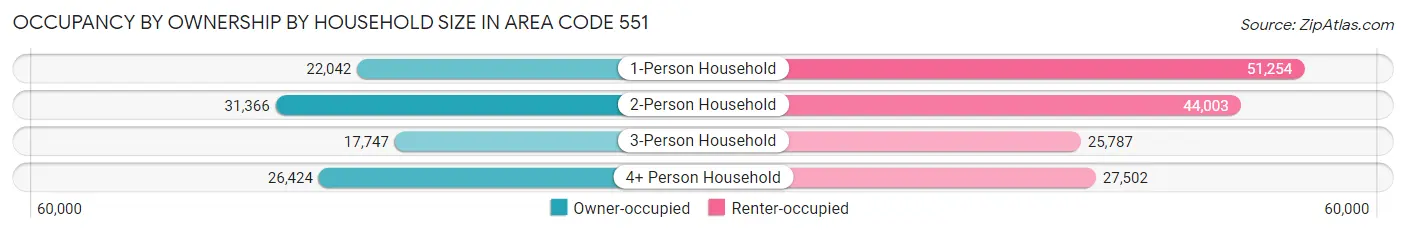
| Household Size | Owner-occupied | Renter-occupied |
| 1-Person Household | 22,042 (30.1%) | 51,254 (69.9%) |
| 2-Person Household | 31,366 (41.6%) | 44,003 (58.4%) |
| 3-Person Household | 17,747 (40.8%) | 25,787 (59.2%) |
| 4+ Person Household | 26,424 (49.0%) | 27,502 (51.0%) |
| Total Housing Units | 97,579 (39.7%) | 148,546 (60.4%) |
Occupancy by Educational Attainment in Area Code 551
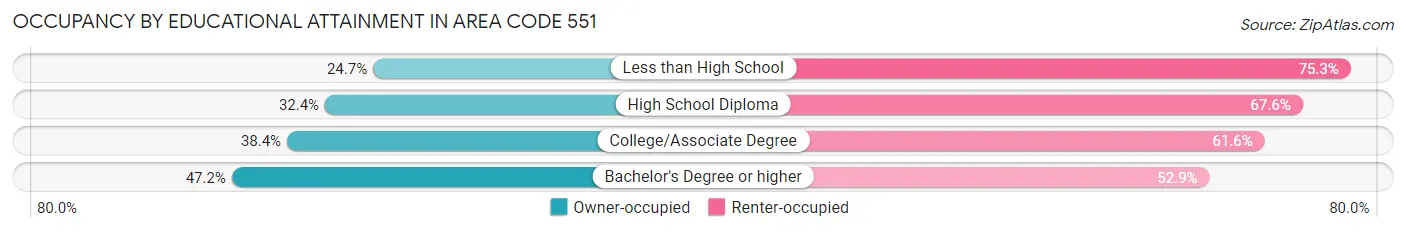
| Household Size | Owner-occupied | Renter-occupied |
| Less than High School | 6,845 (24.7%) | 20,827 (75.3%) |
| High School Diploma | 18,108 (32.4%) | 37,850 (67.6%) |
| College/Associate Degree | 17,499 (38.4%) | 28,078 (61.6%) |
| Bachelor's Degree or higher | 55,127 (47.1%) | 61,791 (52.8%) |
Occupancy by Age of Householder in Area Code 551
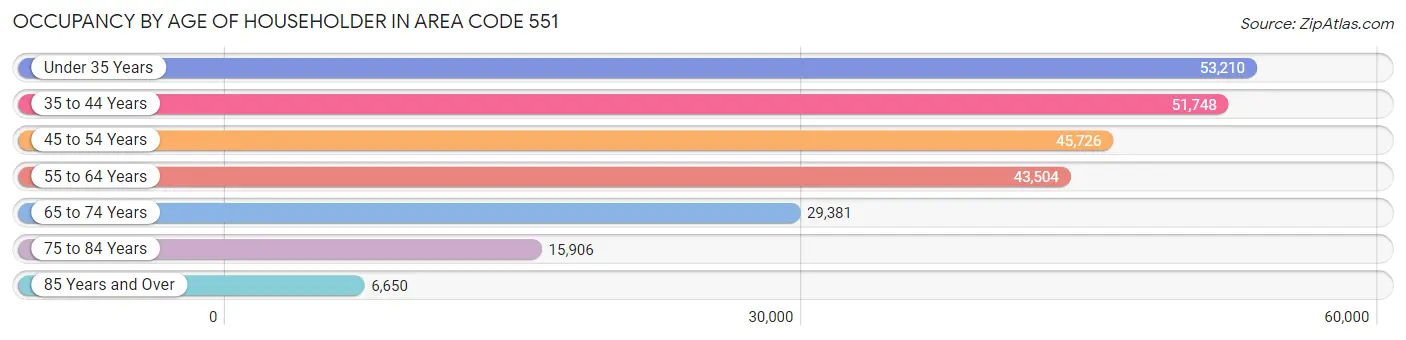
| Age Bracket | # Households | % Households |
| Under 35 Years | 53,210 | 21.6% |
| 35 to 44 Years | 51,748 | 21.0% |
| 45 to 54 Years | 45,726 | 18.6% |
| 55 to 64 Years | 43,504 | 17.7% |
| 65 to 74 Years | 29,381 | 11.9% |
| 75 to 84 Years | 15,906 | 6.5% |
| 85 Years and Over | 6,650 | 2.7% |
| Total | 246,125 | 100.0% |
Housing Finances in Area Code 551
Median Income by Occupancy in Area Code 551
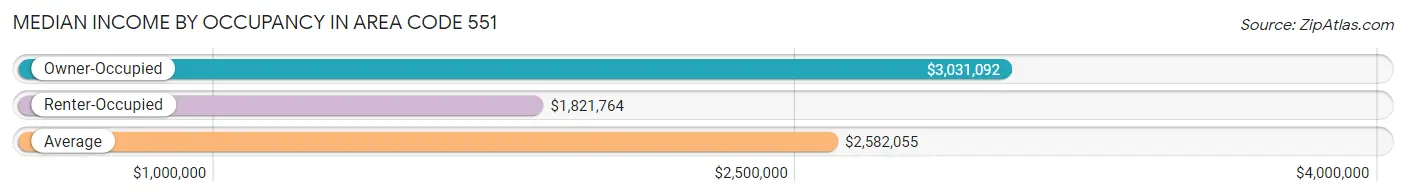
| Occupancy Type | # Households | Median Income |
| Owner-Occupied | 97,579 (39.7%) | $3,031,092 |
| Renter-Occupied | 148,546 (60.4%) | $1,821,764 |
| Average | 246,125 (100.0%) | $2,582,055 |
Occupancy by Householder Income Bracket in Area Code 551
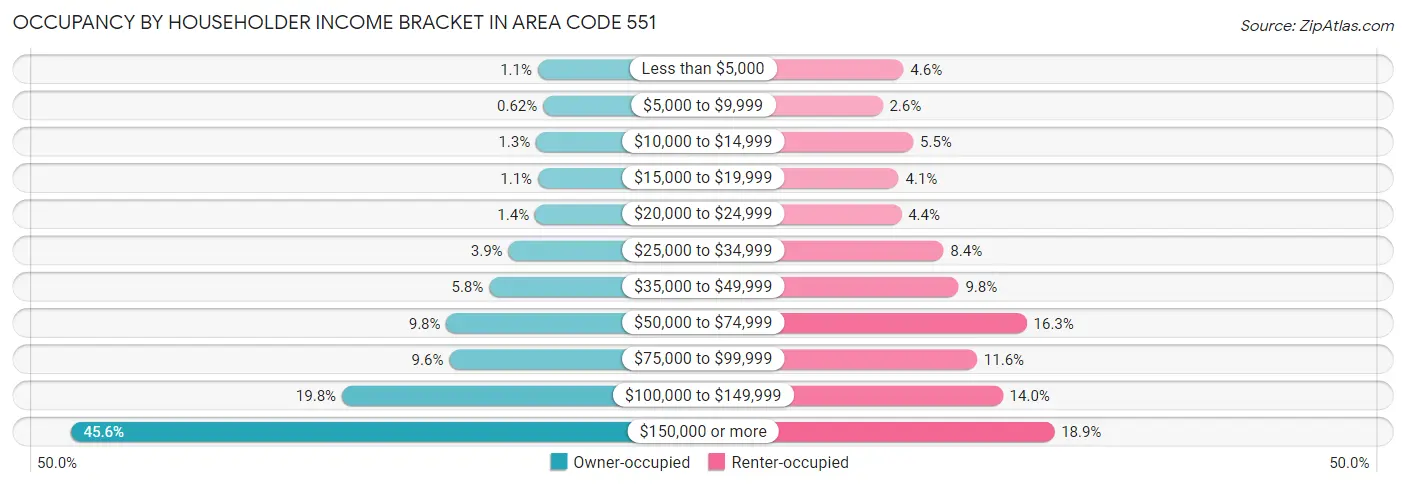
| Income Bracket | Owner-occupied | Renter-occupied |
| Less than $5,000 | 1,089 (1.1%) | 6,767 (4.6%) |
| $5,000 to $9,999 | 604 (0.6%) | 3,809 (2.6%) |
| $10,000 to $14,999 | 1,261 (1.3%) | 8,140 (5.5%) |
| $15,000 to $19,999 | 1,088 (1.1%) | 6,085 (4.1%) |
| $20,000 to $24,999 | 1,357 (1.4%) | 6,459 (4.3%) |
| $25,000 to $34,999 | 3,823 (3.9%) | 12,428 (8.4%) |
| $35,000 to $49,999 | 5,622 (5.8%) | 14,552 (9.8%) |
| $50,000 to $74,999 | 9,593 (9.8%) | 24,205 (16.3%) |
| $75,000 to $99,999 | 9,331 (9.6%) | 17,175 (11.6%) |
| $100,000 to $149,999 | 19,301 (19.8%) | 20,817 (14.0%) |
| $150,000 or more | 44,510 (45.6%) | 28,109 (18.9%) |
| Total | 97,579 (100.0%) | 148,546 (100.0%) |
Monthly Housing Cost Tiers in Area Code 551
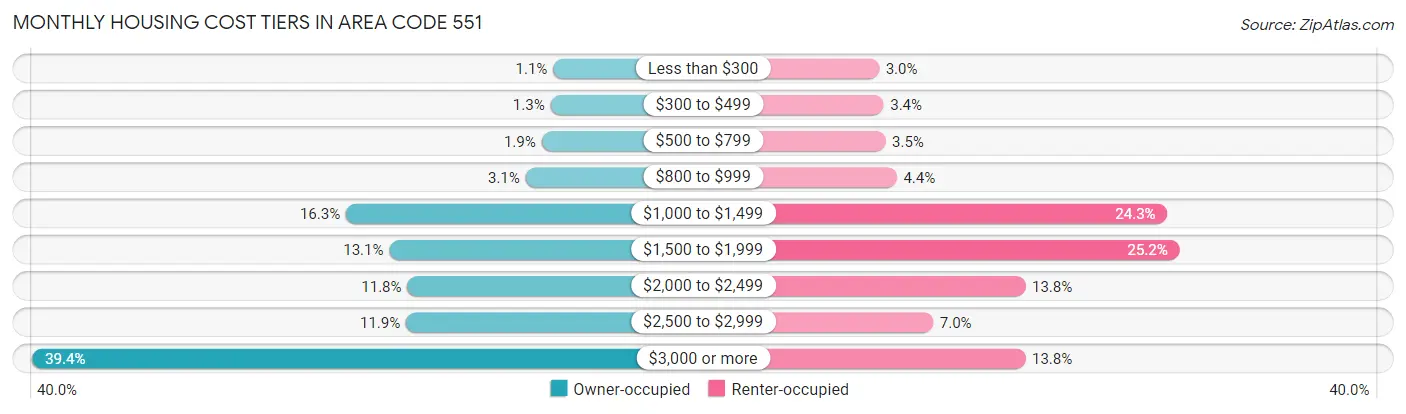
| Monthly Cost | Owner-occupied | Renter-occupied |
| Less than $300 | 1,045 (1.1%) | 4,520 (3.0%) |
| $300 to $499 | 1,239 (1.3%) | 5,025 (3.4%) |
| $500 to $799 | 1,885 (1.9%) | 5,220 (3.5%) |
| $800 to $999 | 3,022 (3.1%) | 6,460 (4.3%) |
| $1,000 to $1,499 | 15,930 (16.3%) | 36,094 (24.3%) |
| $1,500 to $1,999 | 12,824 (13.1%) | 37,440 (25.2%) |
| $2,000 to $2,499 | 11,521 (11.8%) | 20,532 (13.8%) |
| $2,500 to $2,999 | 11,623 (11.9%) | 10,441 (7.0%) |
| $3,000 or more | 38,490 (39.4%) | 20,528 (13.8%) |
| Total | 97,579 (100.0%) | 148,546 (100.0%) |
Physical Housing Characteristics in Area Code 551
Housing Structures in Area Code 551
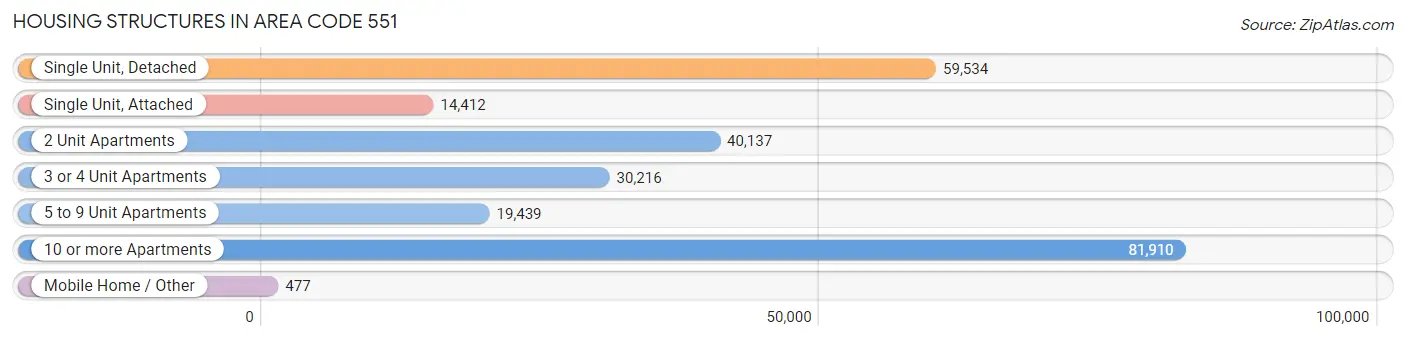
| Structure Type | # Housing Units | % Housing Units |
| Single Unit, Detached | 59,534 | 24.2% |
| Single Unit, Attached | 14,412 | 5.9% |
| 2 Unit Apartments | 40,137 | 16.3% |
| 3 or 4 Unit Apartments | 30,216 | 12.3% |
| 5 to 9 Unit Apartments | 19,439 | 7.9% |
| 10 or more Apartments | 81,910 | 33.3% |
| Mobile Home / Other | 477 | 0.2% |
| Total | 246,125 | 100.0% |
Housing Structures by Occupancy in Area Code 551
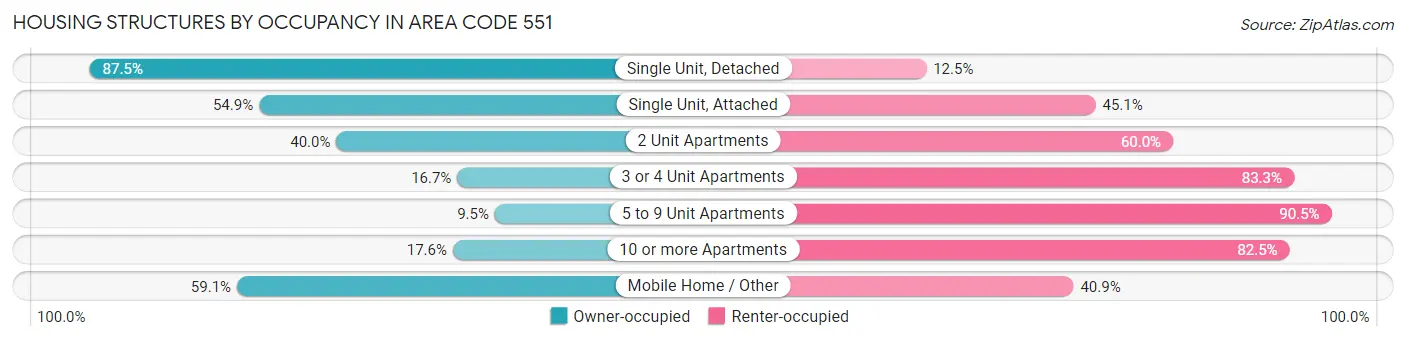
| Structure Type | Owner-occupied | Renter-occupied |
| Single Unit, Detached | 52,076 (87.5%) | 7,458 (12.5%) |
| Single Unit, Attached | 7,908 (54.9%) | 6,504 (45.1%) |
| 2 Unit Apartments | 16,047 (40.0%) | 24,090 (60.0%) |
| 3 or 4 Unit Apartments | 5,048 (16.7%) | 25,168 (83.3%) |
| 5 to 9 Unit Apartments | 1,840 (9.5%) | 17,599 (90.5%) |
| 10 or more Apartments | 14,378 (17.5%) | 67,532 (82.5%) |
| Mobile Home / Other | 282 (59.1%) | 195 (40.9%) |
| Total | 97,579 (39.7%) | 148,546 (60.4%) |
Housing Structures by Number of Rooms in Area Code 551
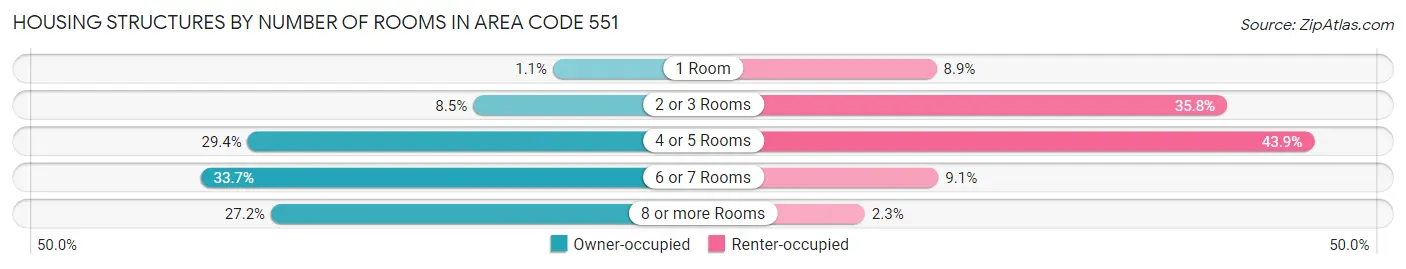
| Number of Rooms | Owner-occupied | Renter-occupied |
| 1 Room | 1,114 (1.1%) | 13,284 (8.9%) |
| 2 or 3 Rooms | 8,328 (8.5%) | 53,160 (35.8%) |
| 4 or 5 Rooms | 28,668 (29.4%) | 65,139 (43.9%) |
| 6 or 7 Rooms | 32,904 (33.7%) | 13,530 (9.1%) |
| 8 or more Rooms | 26,565 (27.2%) | 3,433 (2.3%) |
| Total | 97,579 (100.0%) | 148,546 (100.0%) |
Housing Structure by Heating Type in Area Code 551
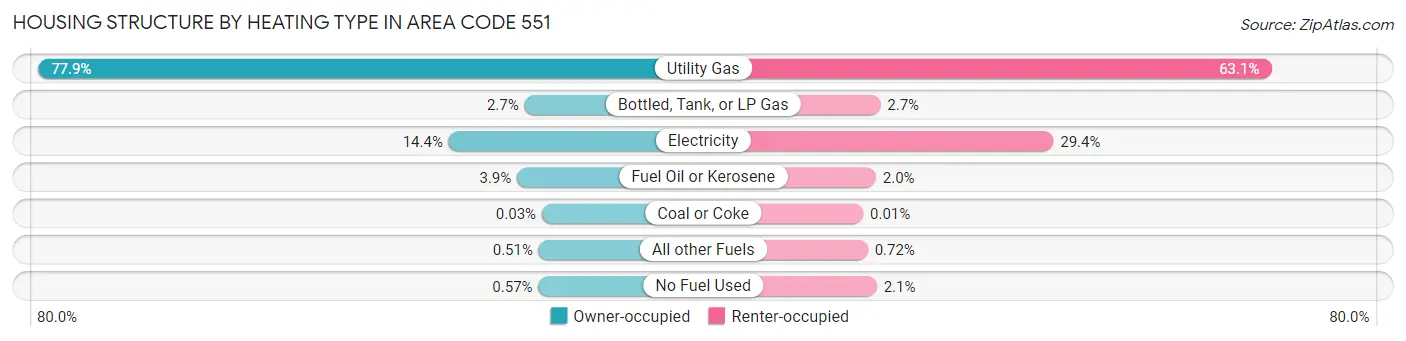
| Heating Type | Owner-occupied | Renter-occupied |
| Utility Gas | 76,008 (77.9%) | 93,738 (63.1%) |
| Bottled, Tank, or LP Gas | 2,645 (2.7%) | 3,972 (2.7%) |
| Electricity | 14,080 (14.4%) | 43,685 (29.4%) |
| Fuel Oil or Kerosene | 3,764 (3.9%) | 2,947 (2.0%) |
| Coal or Coke | 26 (0.0%) | 13 (0.0%) |
| All other Fuels | 501 (0.5%) | 1,063 (0.7%) |
| No Fuel Used | 555 (0.6%) | 3,128 (2.1%) |
| Total | 97,579 (100.0%) | 148,546 (100.0%) |
Household Vehicle Usage in Area Code 551
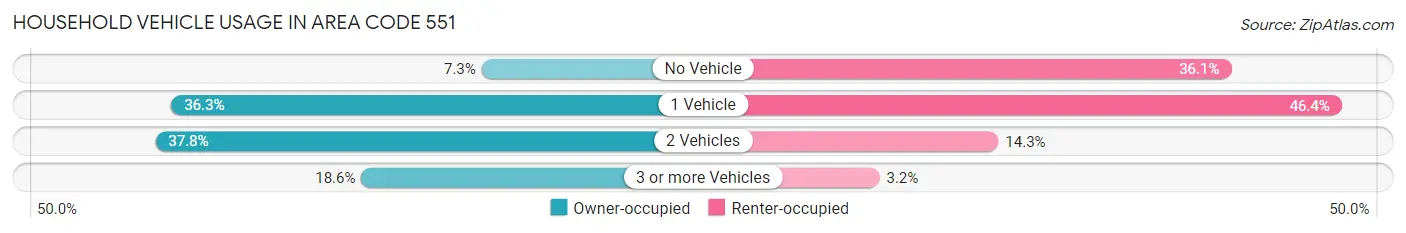
| Vehicles per Household | Owner-occupied | Renter-occupied |
| No Vehicle | 7,160 (7.3%) | 53,572 (36.1%) |
| 1 Vehicle | 35,430 (36.3%) | 68,883 (46.4%) |
| 2 Vehicles | 36,873 (37.8%) | 21,292 (14.3%) |
| 3 or more Vehicles | 18,116 (18.6%) | 4,799 (3.2%) |
| Total | 97,579 (100.0%) | 148,546 (100.0%) |
Real Estate & Mortgages in Area Code 551
Real Estate and Mortgage Overview in Area Code 551
| Characteristic | Without Mortgage | With Mortgage |
| Housing Units | 35,421 | 62,158 |
| Median Property Value | $10,870,700 | $12,091,200 |
| Median Household Income | $2,352,216 | $33,287 |
| Monthly Housing Costs | $28,103 | $37,117 |
| Real Estate Taxes | $197,754 | $1,027 |
Property Value by Mortgage Status in Area Code 551
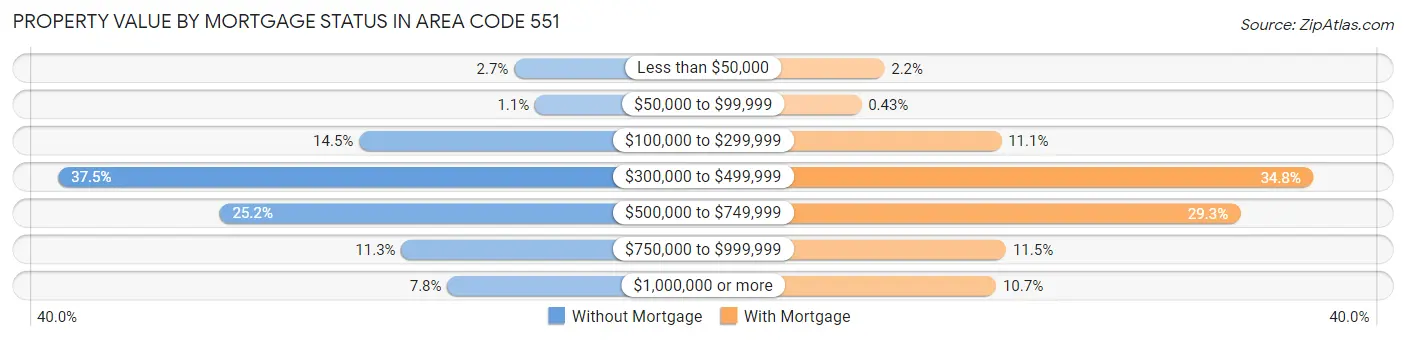
| Property Value | Without Mortgage | With Mortgage |
| Less than $50,000 | 957 (2.7%) | 1,363 (2.2%) |
| $50,000 to $99,999 | 394 (1.1%) | 266 (0.4%) |
| $100,000 to $299,999 | 5,139 (14.5%) | 6,899 (11.1%) |
| $300,000 to $499,999 | 13,265 (37.4%) | 21,652 (34.8%) |
| $500,000 to $749,999 | 8,908 (25.2%) | 18,208 (29.3%) |
| $750,000 to $999,999 | 4,000 (11.3%) | 7,121 (11.5%) |
| $1,000,000 or more | 2,758 (7.8%) | 6,649 (10.7%) |
| Total | 35,421 (100.0%) | 62,158 (100.0%) |
Household Income by Mortgage Status in Area Code 551
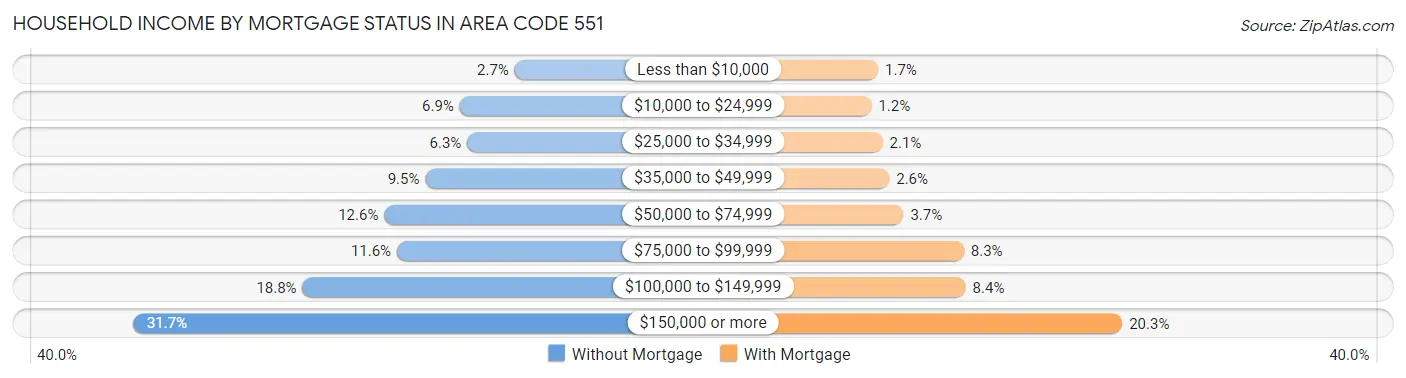
| Household Income | Without Mortgage | With Mortgage |
| Less than $10,000 | 943 (2.7%) | 1,068 (1.7%) |
| $10,000 to $24,999 | 2,427 (6.9%) | 750 (1.2%) |
| $25,000 to $34,999 | 2,223 (6.3%) | 1,279 (2.1%) |
| $35,000 to $49,999 | 3,354 (9.5%) | 1,600 (2.6%) |
| $50,000 to $74,999 | 4,464 (12.6%) | 2,268 (3.6%) |
| $75,000 to $99,999 | 4,118 (11.6%) | 5,129 (8.3%) |
| $100,000 to $149,999 | 6,669 (18.8%) | 5,213 (8.4%) |
| $150,000 or more | 11,223 (31.7%) | 12,632 (20.3%) |
| Total | 35,421 (100.0%) | 62,158 (100.0%) |
Property Value to Household Income Ratio in Area Code 551
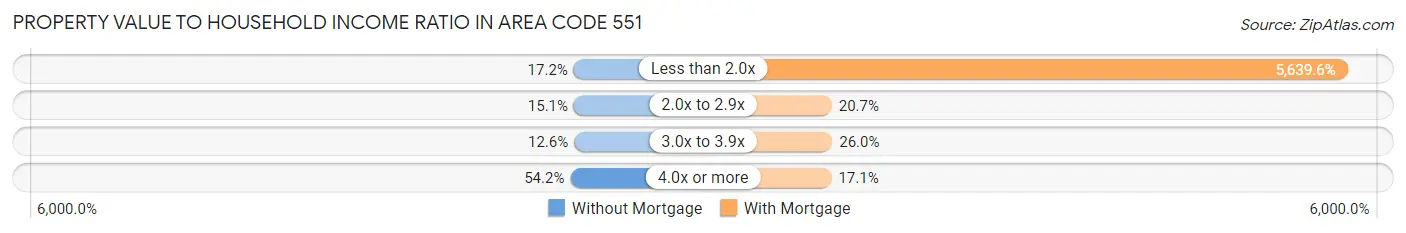
| Value-to-Income Ratio | Without Mortgage | With Mortgage |
| Less than 2.0x | 6,094 (17.2%) | 3,505,442 (5,639.6%) |
| 2.0x to 2.9x | 5,353 (15.1%) | 12,856 (20.7%) |
| 3.0x to 3.9x | 4,455 (12.6%) | 16,136 (26.0%) |
| 4.0x or more | 19,186 (54.2%) | 10,645 (17.1%) |
| Total | 35,421 (100.0%) | 62,158 (100.0%) |
Real Estate Taxes by Mortgage Status in Area Code 551
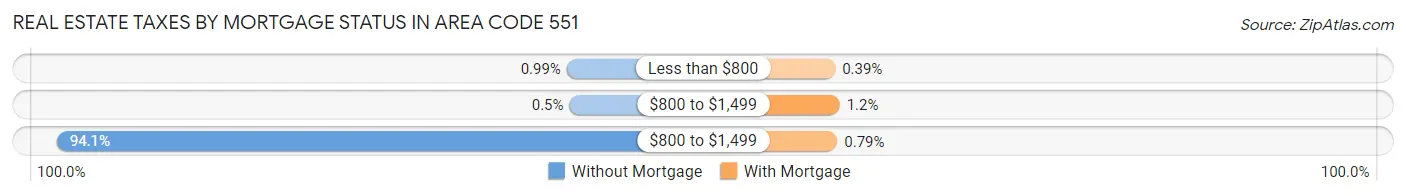
| Property Taxes | Without Mortgage | With Mortgage |
| Less than $800 | 352 (1.0%) | 245 (0.4%) |
| $800 to $1,499 | 178 (0.5%) | 757 (1.2%) |
| $800 to $1,499 | 33,337 (94.1%) | 494 (0.8%) |
| Total | 35,421 (100.0%) | 62,158 (100.0%) |
Health & Disability in Area Code 551
Health Insurance Coverage by Age in Area Code 551
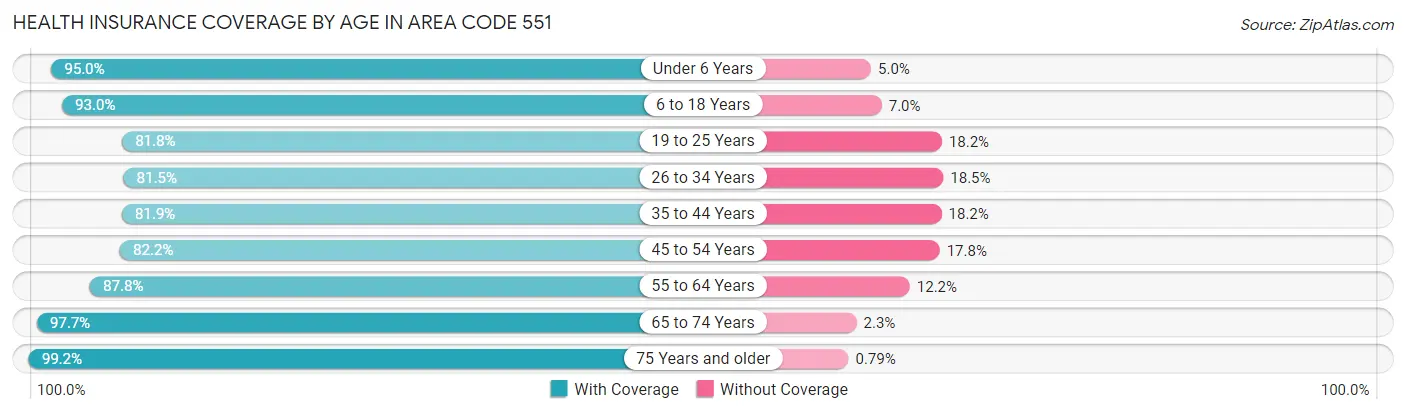
| Age Bracket | With Coverage | Without Coverage |
| Under 6 Years | 41,241 (95.0%) | 2,171 (5.0%) |
| 6 to 18 Years | 84,800 (93.0%) | 6,372 (7.0%) |
| 19 to 25 Years | 43,079 (81.8%) | 9,594 (18.2%) |
| 26 to 34 Years | 79,237 (81.5%) | 17,949 (18.5%) |
| 35 to 44 Years | 77,500 (81.9%) | 17,190 (18.1%) |
| 45 to 54 Years | 66,013 (82.2%) | 14,294 (17.8%) |
| 55 to 64 Years | 64,877 (87.8%) | 9,042 (12.2%) |
| 65 to 74 Years | 47,135 (97.7%) | 1,110 (2.3%) |
| 75 Years and older | 34,482 (99.2%) | 276 (0.8%) |
| Total | 538,364 (87.4%) | 77,998 (12.7%) |
Health Insurance Coverage by Citizenship Status in Area Code 551
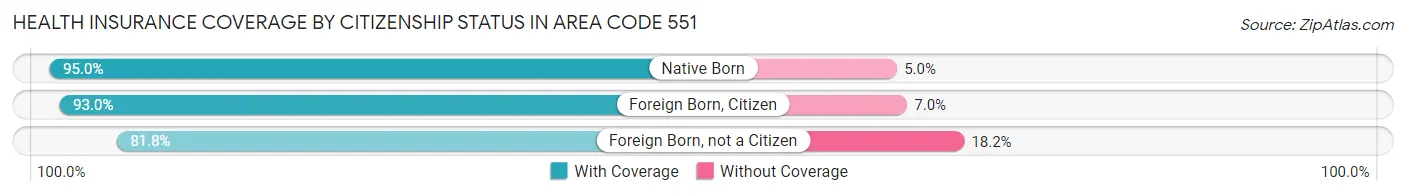
| Citizenship Status | With Coverage | Without Coverage |
| Native Born | 41,241 (95.0%) | 2,171 (5.0%) |
| Foreign Born, Citizen | 84,800 (93.0%) | 6,372 (7.0%) |
| Foreign Born, not a Citizen | 43,079 (81.8%) | 9,594 (18.2%) |
Health Insurance Coverage by Household Income in Area Code 551
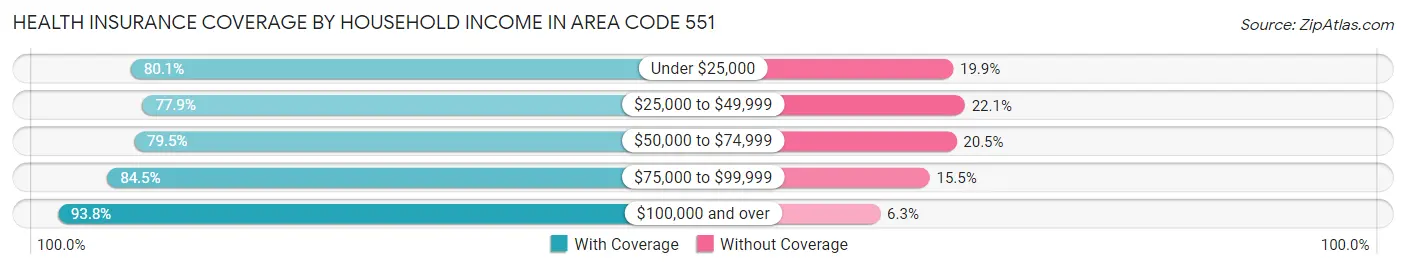
| Household Income | With Coverage | Without Coverage |
| Under $25,000 | 51,976 (80.1%) | 12,921 (19.9%) |
| $25,000 to $49,999 | 63,497 (77.9%) | 18,015 (22.1%) |
| $50,000 to $74,999 | 64,798 (79.5%) | 16,744 (20.5%) |
| $75,000 to $99,999 | 55,926 (84.5%) | 10,262 (15.5%) |
| $100,000 and over | 295,801 (93.8%) | 19,705 (6.2%) |
Public vs Private Health Insurance Coverage by Age in Area Code 551
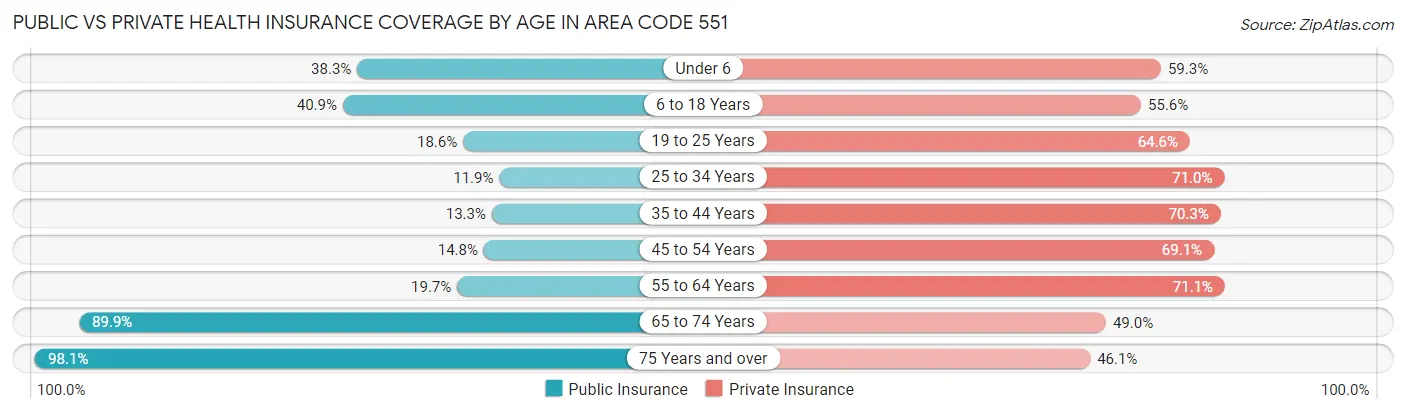
| Age Bracket | Public Insurance | Private Insurance |
| Under 6 | 16,614 (38.3%) | 25,723 (59.3%) |
| 6 to 18 Years | 37,322 (40.9%) | 50,657 (55.6%) |
| 19 to 25 Years | 9,806 (18.6%) | 34,029 (64.6%) |
| 25 to 34 Years | 11,554 (11.9%) | 68,988 (71.0%) |
| 35 to 44 Years | 12,579 (13.3%) | 66,597 (70.3%) |
| 45 to 54 Years | 11,859 (14.8%) | 55,461 (69.1%) |
| 55 to 64 Years | 14,575 (19.7%) | 52,558 (71.1%) |
| 65 to 74 Years | 43,379 (89.9%) | 23,659 (49.0%) |
| 75 Years and over | 34,082 (98.1%) | 16,026 (46.1%) |
| Total | 191,770 (31.1%) | 393,698 (63.9%) |
Disability Status by Sex by Age in Area Code 551
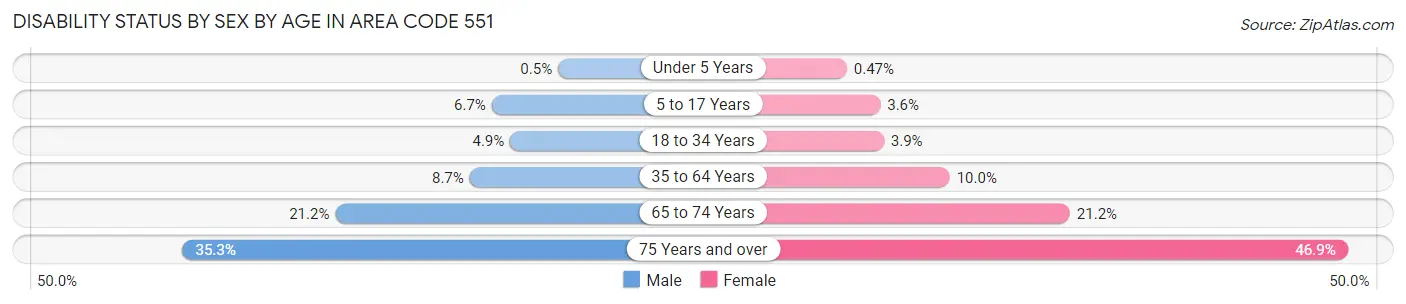
| Age Bracket | Male | Female |
| Under 5 Years | 100 (0.5%) | 81 (0.5%) |
| 5 to 17 Years | 3,092 (6.7%) | 1,577 (3.6%) |
| 18 to 34 Years | 3,936 (4.9%) | 3,001 (3.9%) |
| 35 to 64 Years | 10,921 (8.7%) | 12,359 (10.0%) |
| 65 to 74 Years | 4,773 (21.2%) | 5,440 (21.2%) |
| 75 Years and over | 4,792 (35.3%) | 9,949 (46.9%) |
Disability Class by Sex by Age in Area Code 551
Disability Class: Hearing Difficulty
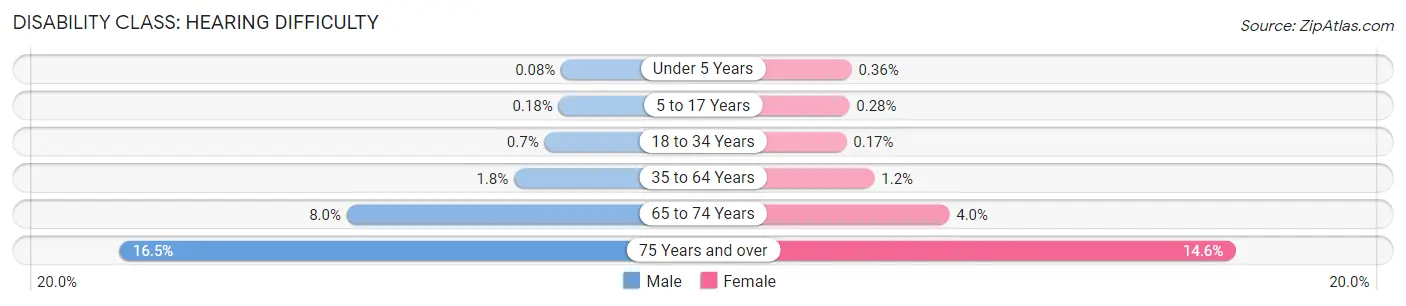
| Age Bracket | Male | Female |
| Under 5 Years | 15 (0.1%) | 62 (0.4%) |
| 5 to 17 Years | 82 (0.2%) | 122 (0.3%) |
| 18 to 34 Years | 561 (0.7%) | 134 (0.2%) |
| 35 to 64 Years | 2,297 (1.8%) | 1,497 (1.2%) |
| 65 to 74 Years | 1,812 (8.0%) | 1,026 (4.0%) |
| 75 Years and over | 2,231 (16.5%) | 3,095 (14.6%) |
Disability Class: Vision Difficulty
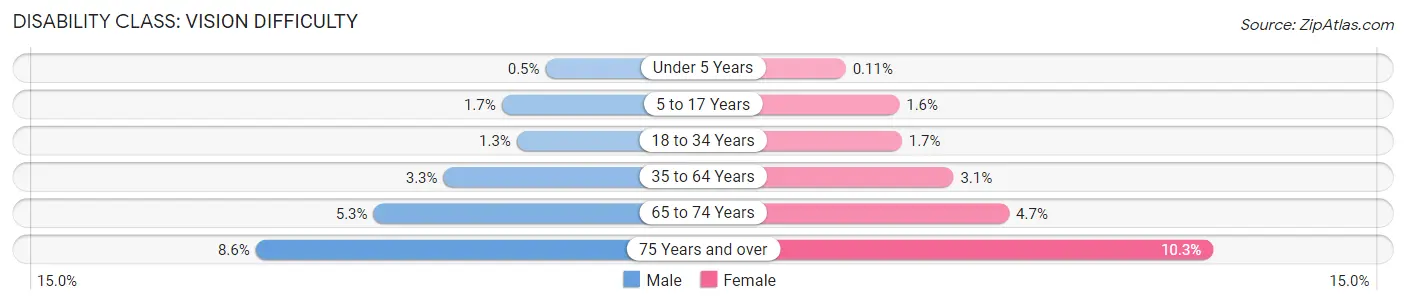
| Age Bracket | Male | Female |
| Under 5 Years | 100 (0.5%) | 19 (0.1%) |
| 5 to 17 Years | 798 (1.7%) | 709 (1.6%) |
| 18 to 34 Years | 1,036 (1.3%) | 1,282 (1.7%) |
| 35 to 64 Years | 4,199 (3.3%) | 3,836 (3.1%) |
| 65 to 74 Years | 1,194 (5.3%) | 1,198 (4.7%) |
| 75 Years and over | 1,162 (8.6%) | 2,192 (10.3%) |
Disability Class: Cognitive Difficulty
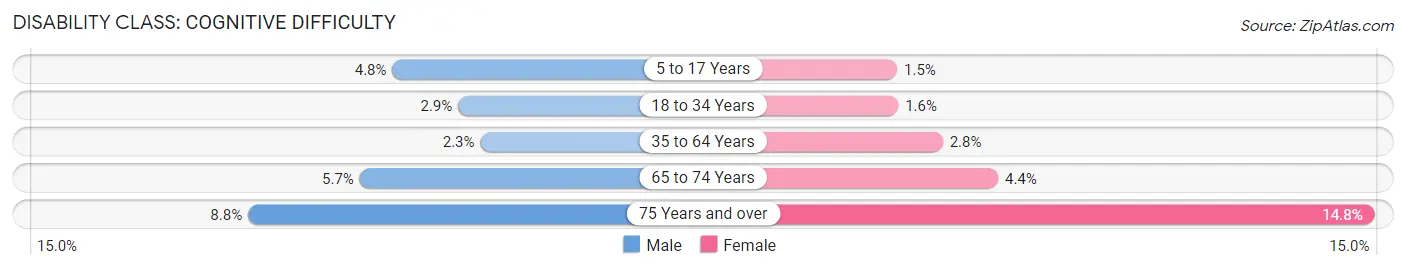
| Age Bracket | Male | Female |
| 5 to 17 Years | 2,214 (4.8%) | 682 (1.5%) |
| 18 to 34 Years | 2,332 (2.9%) | 1,209 (1.6%) |
| 35 to 64 Years | 2,904 (2.3%) | 3,465 (2.8%) |
| 65 to 74 Years | 1,278 (5.7%) | 1,117 (4.3%) |
| 75 Years and over | 1,191 (8.8%) | 3,143 (14.8%) |
Disability Class: Ambulatory Difficulty
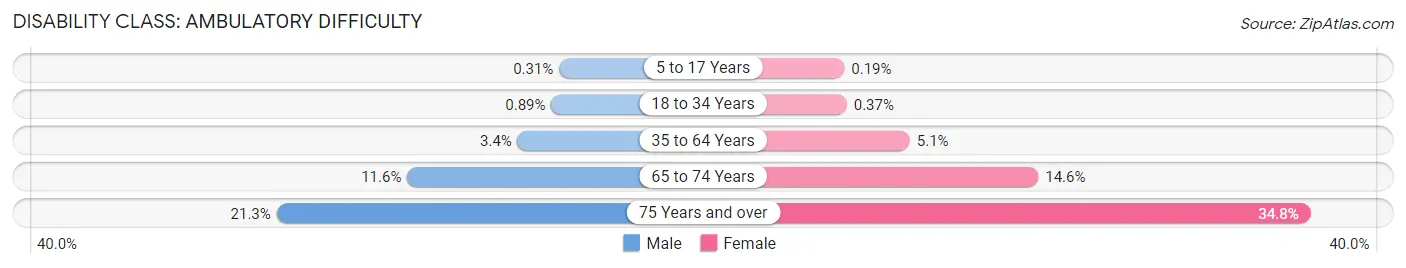
| Age Bracket | Male | Female |
| 5 to 17 Years | 144 (0.3%) | 86 (0.2%) |
| 18 to 34 Years | 710 (0.9%) | 281 (0.4%) |
| 35 to 64 Years | 4,262 (3.4%) | 6,225 (5.1%) |
| 65 to 74 Years | 2,613 (11.6%) | 3,748 (14.6%) |
| 75 Years and over | 2,886 (21.3%) | 7,378 (34.8%) |
Disability Class: Self-Care Difficulty
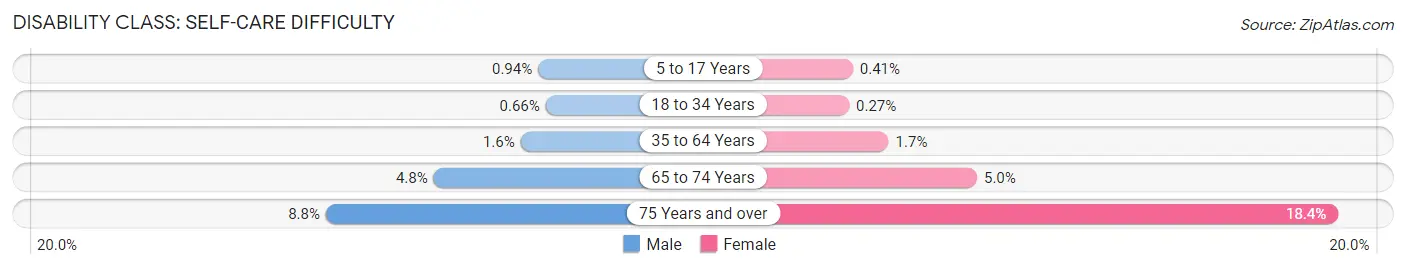
| Age Bracket | Male | Female |
| 5 to 17 Years | 438 (0.9%) | 182 (0.4%) |
| 18 to 34 Years | 526 (0.7%) | 204 (0.3%) |
| 35 to 64 Years | 2,000 (1.6%) | 2,148 (1.7%) |
| 65 to 74 Years | 1,087 (4.8%) | 1,291 (5.0%) |
| 75 Years and over | 1,196 (8.8%) | 3,906 (18.4%) |
Technology Access in Area Code 551
Computing Device Access in Area Code 551
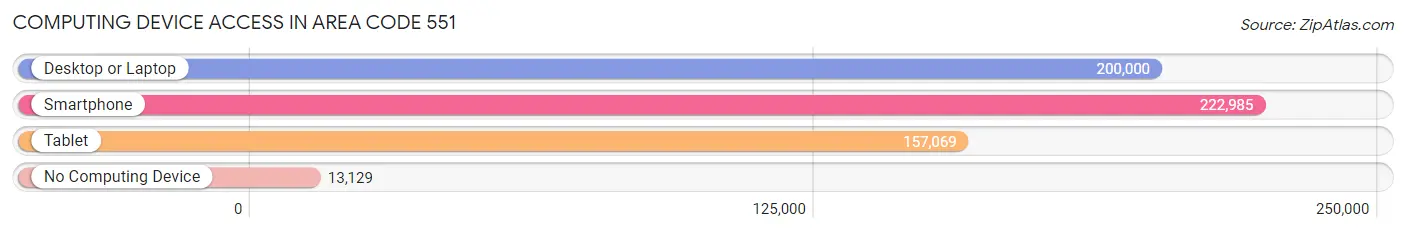
| Device Type | # Households | % Households |
| Desktop or Laptop | 200,000 | 81.3% |
| Smartphone | 222,985 | 90.6% |
| Tablet | 157,069 | 63.8% |
| No Computing Device | 13,129 | 5.3% |
| Total | 246,125 | 100.0% |
Internet Access in Area Code 551
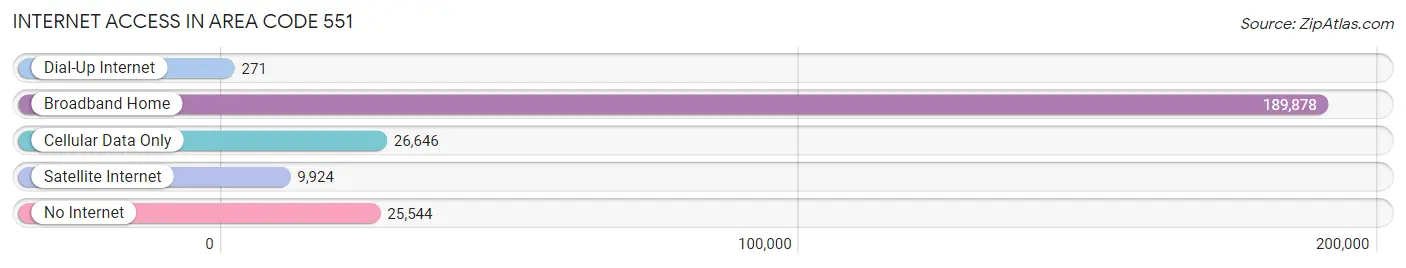
| Internet Type | # Households | % Households |
| Dial-Up Internet | 271 | 0.1% |
| Broadband Home | 189,878 | 77.1% |
| Cellular Data Only | 26,646 | 10.8% |
| Satellite Internet | 9,924 | 4.0% |
| No Internet | 25,544 | 10.4% |
| Total | 246,125 | 100.0% |
Area Code 551 Summary
Geography
Area code 551 is located in the state of New Jersey. It covers the northern part of the state, including the cities of Jersey City, Newark, and Paterson.
Social
Area code 551 is home to a diverse population of people from all walks of life. The area is known for its vibrant culture, with a variety of restaurants, bars, and entertainment venues.
Economics
Area code 551 is a major economic hub in New Jersey. It is home to many large corporations, including Prudential Financial, Panasonic, and Verizon. The area also has a thriving small business sector, with many local businesses providing goods and services to the community.
Demographics
Area code 551 is home to a diverse population, with a median age of 33. The population is predominantly African American, with a large Hispanic population as well. The area has a median household income of $50,000, and a poverty rate of 17%.
Common Questions
What is Per Capita Income in Area Code 551?
Per Capita income in Area Code 551 is $61,076.
What is the Median Family Income in Area Code 551?
Median Family Income in Area Code 551 is $140,542.
What is the Median Household income in Area Code 551?
Median Household Income in Area Code 551 is $117,366.
What is Income or Wage Gap in Area Code 551?
Income or Wage Gap in Area Code 551 is 28.3%.
Women in Area Code 551 earn 71.7 cents for every dollar earned by a man.
What is Family Income Deficit in Area Code 551?
Family Income Deficit in Area Code 551 is $10,641.
Families that are below poverty line in Area Code 551 earn $10,641 less on average than the poverty threshold level.
What is Inequality or Gini Index in Area Code 551?
Inequality or Gini Index in Area Code 551 is 9.62.
What is the Total Population of Area Code 551?
Total Population of Area Code 551 is 624,417.
What is the Total Male Population of Area Code 551?
Total Male Population of Area Code 551 is 313,991.
What is the Total Female Population of Area Code 551?
Total Female Population of Area Code 551 is 310,426.
What is the Ratio of Males per 100 Females in Area Code 551?
There are 101.15 Males per 100 Females in Area Code 551.
What is the Ratio of Females per 100 Males in Area Code 551?
There are 98.86 Females per 100 Males in Area Code 551.
What is the Median Population Age in Area Code 551?
Median Population Age in Area Code 551 is 38.4 Years.
What is the Average Family Size in Area Code 551
Average Family Size in Area Code 551 is 3.1 People.
What is the Average Household Size in Area Code 551
Average Household Size in Area Code 551 is 2.5 People.
How Large is the Labor Force in Area Code 551?
There are 352,895 People in the Labor Forcein in Area Code 551.
What is the Percentage of People in the Labor Force in Area Code 551?
69.1% of People are in the Labor Force in Area Code 551.
What is the Unemployment Rate in Area Code 551?
Unemployment Rate in Area Code 551 is 5.4%.