Area Code 201 Map & Demographics
Area Code 201 Map
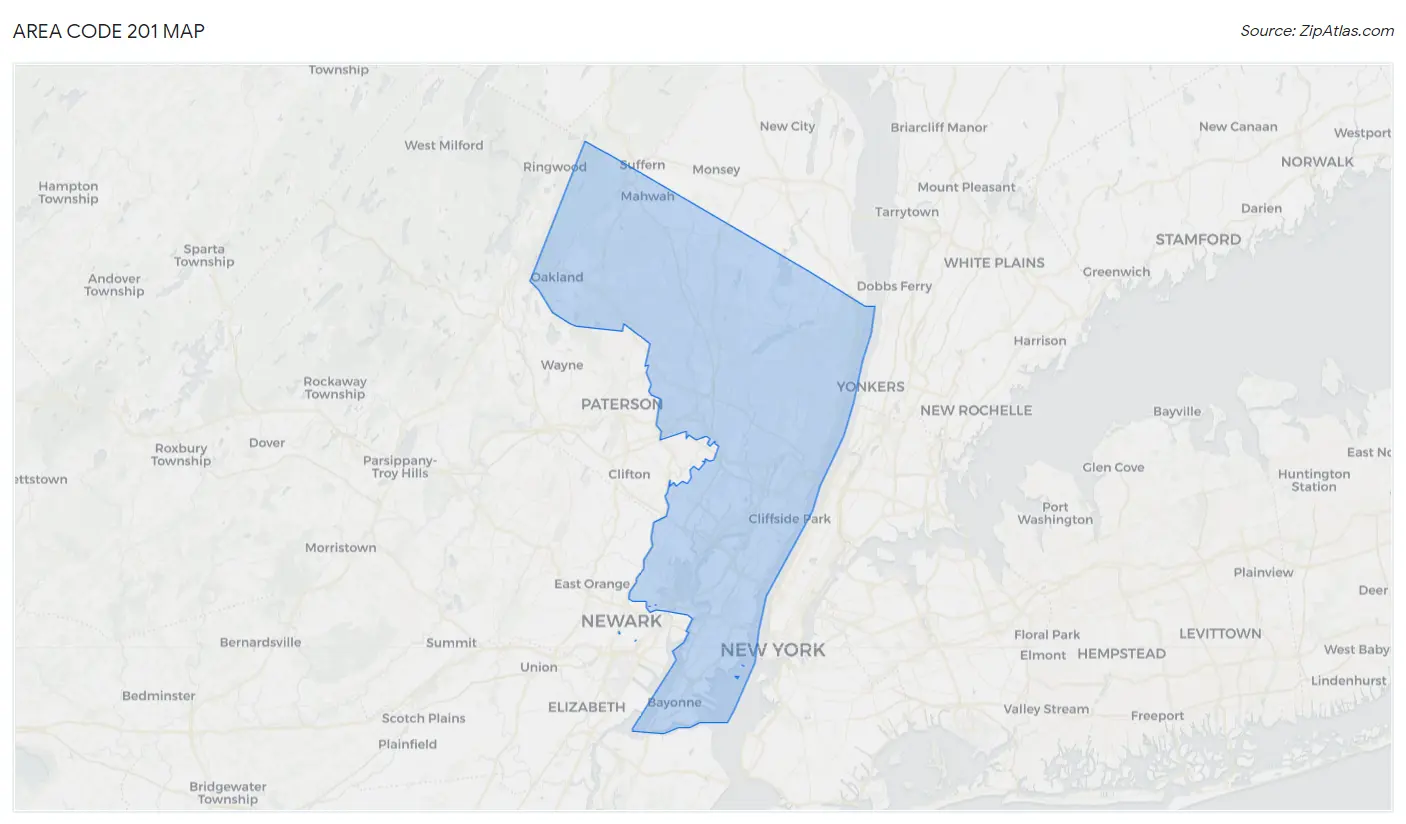
Area Code 201 Overview
$58,458
PER CAPITA INCOME
$142,609
AVG FAMILY INCOME
$121,397
AVG HOUSEHOLD INCOME
28.3%
WAGE / INCOME GAP [ % ]
71.7¢/ $1
WAGE / INCOME GAP [ $ ]
$10,791
FAMILY INCOME DEFICIT
22.52
INEQUALITY / GINI INDEX
1,345,917
TOTAL POPULATION
669,541
MALE POPULATION
676,376
FEMALE POPULATION
98.99
MALES / 100 FEMALES
101.02
FEMALES / 100 MALES
39.7
MEDIAN AGE
3.2
AVG FAMILY SIZE
2.6
AVG HOUSEHOLD SIZE
733,733
LABOR FORCE [ PEOPLE ]
67.6%
PERCENT IN LABOR FORCE
5.8%
UNEMPLOYMENT RATE
Income in Area Code 201
Income Overview in Area Code 201
Per Capita Income in Area Code 201 is $58,458, while median incomes of families and households are $142,609 and $121,397 respectively.
| Characteristic | Number | Measure |
| Per Capita Income | 1,345,917 | $58,458 |
| Median Family Income | 332,009 | $142,609 |
| Mean Family Income | 332,009 | $8,915,079 |
| Median Household Income | 508,318 | $121,397 |
| Mean Household Income | 508,318 | $7,783,832 |
| Income Deficit | 332,009 | $10,791 |
| Wage / Income Gap (%) | 1,345,917 | 28.32% |
| Wage / Income Gap ($) | 1,345,917 | 71.69¢ per $1 |
| Gini / Inequality Index | 1,345,917 | 22.52 |
Earnings by Sex in Area Code 201
Average Earnings in Area Code 201 are $64,270, $76,198 for men and $53,407 for women, a difference of 29.9%.
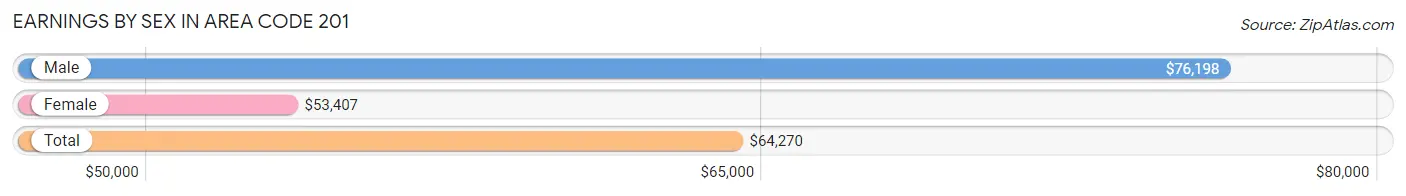
| Sex | Number | Average Earnings |
| Male | 401,744 (53.9%) | $76,198 |
| Female | 343,378 (46.1%) | $53,407 |
| Total | 745,122 (100.0%) | $64,270 |
Earnings by Sex by Income Bracket in Area Code 201
The most common earnings brackets in Area Code 201 are $100,000+ for men (121,377 | 30.2%) and $100,000+ for women (63,528 | 18.5%).
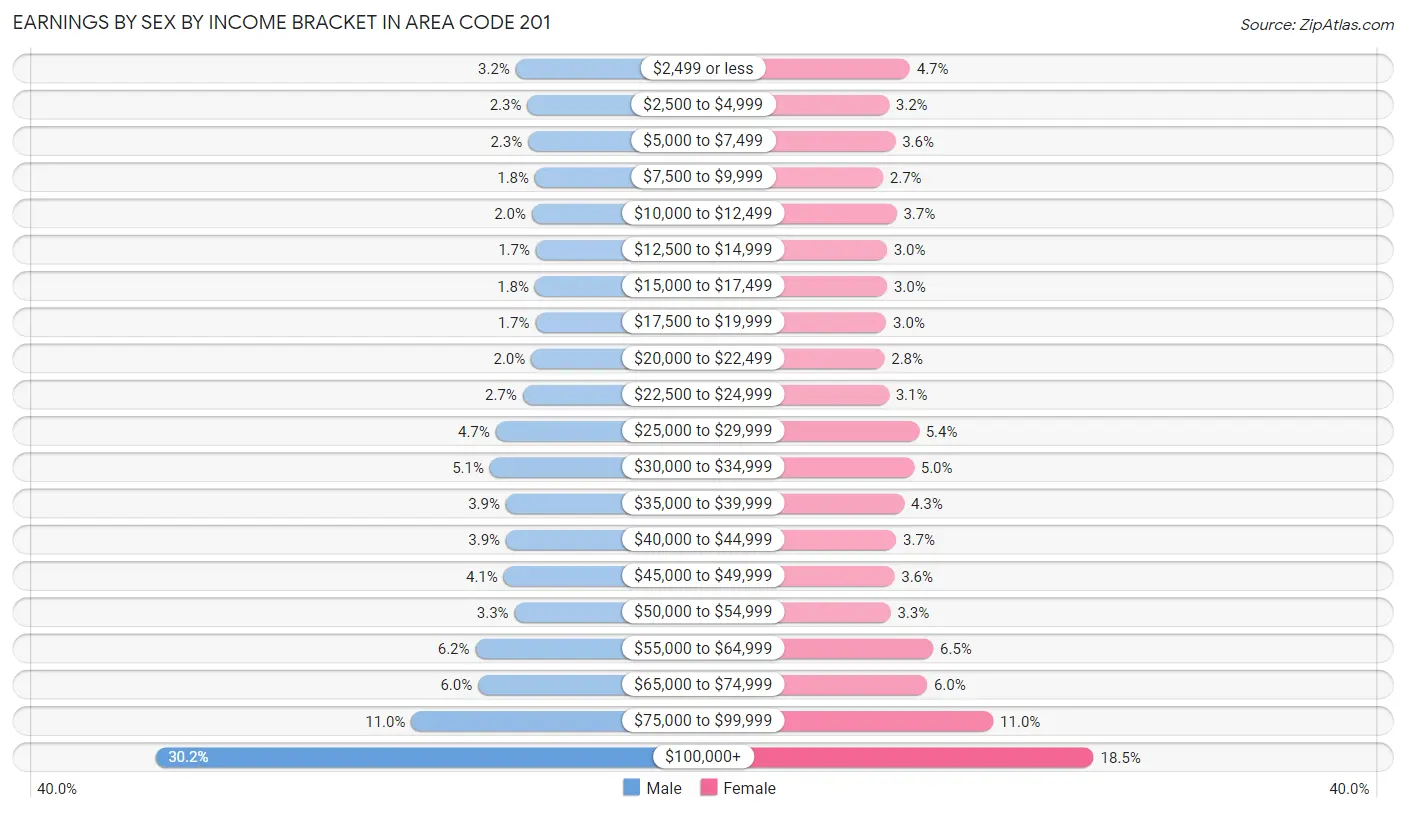
| Income | Male | Female |
| $2,499 or less | 12,867 (3.2%) | 16,208 (4.7%) |
| $2,500 to $4,999 | 9,363 (2.3%) | 10,816 (3.2%) |
| $5,000 to $7,499 | 9,136 (2.3%) | 12,462 (3.6%) |
| $7,500 to $9,999 | 7,064 (1.8%) | 9,267 (2.7%) |
| $10,000 to $12,499 | 7,994 (2.0%) | 12,790 (3.7%) |
| $12,500 to $14,999 | 6,795 (1.7%) | 10,280 (3.0%) |
| $15,000 to $17,499 | 7,063 (1.8%) | 10,347 (3.0%) |
| $17,500 to $19,999 | 6,936 (1.7%) | 10,116 (2.9%) |
| $20,000 to $22,499 | 8,198 (2.0%) | 9,635 (2.8%) |
| $22,500 to $24,999 | 10,742 (2.7%) | 10,789 (3.1%) |
| $25,000 to $29,999 | 18,873 (4.7%) | 18,502 (5.4%) |
| $30,000 to $34,999 | 20,637 (5.1%) | 17,228 (5.0%) |
| $35,000 to $39,999 | 15,812 (3.9%) | 14,715 (4.3%) |
| $40,000 to $44,999 | 15,779 (3.9%) | 12,695 (3.7%) |
| $45,000 to $49,999 | 16,491 (4.1%) | 12,239 (3.6%) |
| $50,000 to $54,999 | 13,203 (3.3%) | 11,241 (3.3%) |
| $55,000 to $64,999 | 24,971 (6.2%) | 22,231 (6.5%) |
| $65,000 to $74,999 | 24,180 (6.0%) | 20,637 (6.0%) |
| $75,000 to $99,999 | 44,263 (11.0%) | 37,652 (11.0%) |
| $100,000+ | 121,377 (30.2%) | 63,528 (18.5%) |
| Total | 401,744 (100.0%) | 343,378 (100.0%) |
Earnings by Sex by Educational Attainment in Area Code 201
Average earnings in Area Code 201 are $4,269,723 for men and $3,046,395 for women, a difference of 28.6%. Men with an educational attainment of graduate degree enjoy the highest average annual earnings of $6,382,556, while those with less than high school education earn the least with $1,679,230. Women with an educational attainment of graduate degree earn the most with the average annual earnings of $4,102,583, while those with less than high school education have the smallest earnings of $1,103,310.
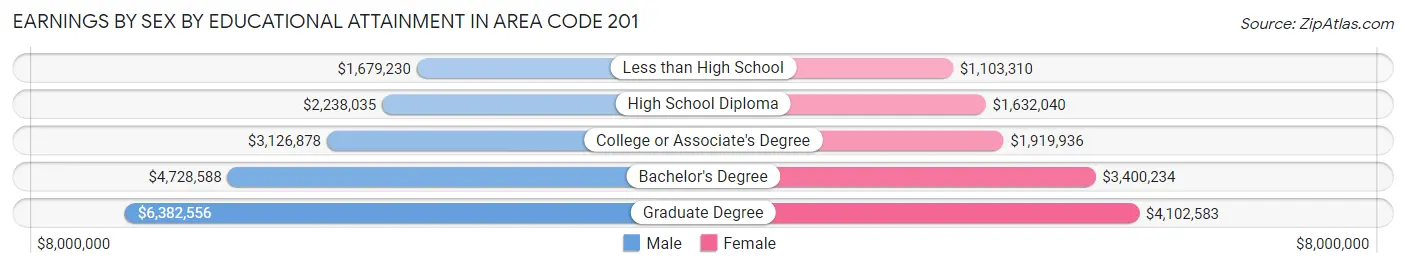
| Educational Attainment | Male Income | Female Income |
| Less than High School | $1,679,230 | $1,103,310 |
| High School Diploma | $2,238,035 | $1,632,040 |
| College or Associate's Degree | $3,126,878 | $1,919,936 |
| Bachelor's Degree | $4,728,588 | $3,400,234 |
| Graduate Degree | $6,382,556 | $4,102,583 |
| Total | $4,269,723 | $3,046,395 |
Family Income in Area Code 201
Family Income Brackets in Area Code 201
According to the Area Code 201 family income data, there are 5,219,181 families falling into the $200,000+ income range, which is the most common income bracket and makes up 1,572.0% of all families. Conversely, the $10,000 to $14,999 income bracket is the least frequent group with only 279,884 families (84.3%) belonging to this category.
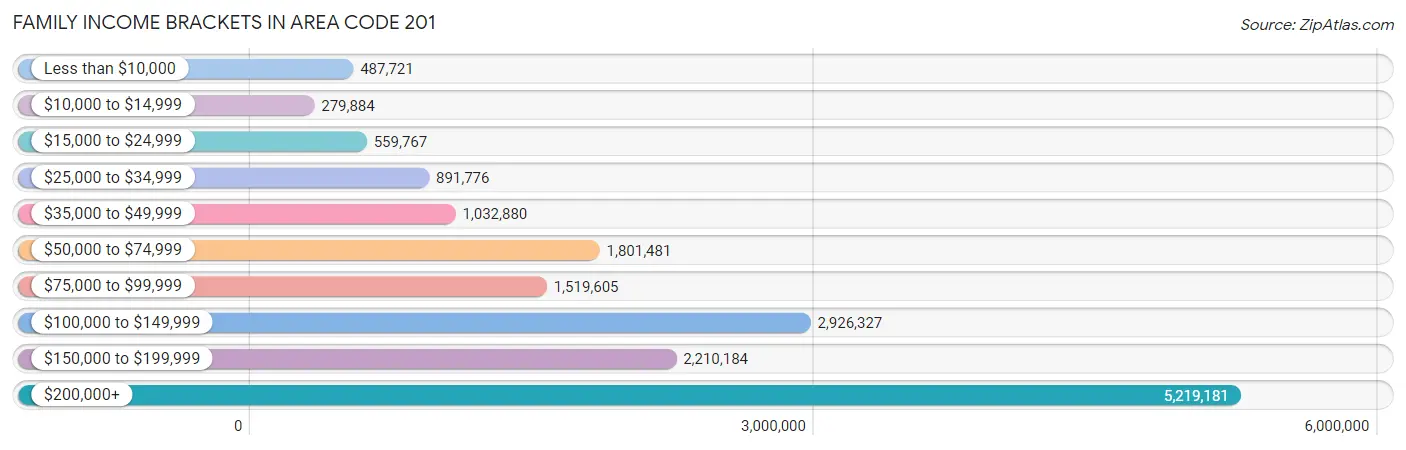
| Income Bracket | # Families | % Families |
| Less than $10,000 | 487,721 | 146.9% |
| $10,000 to $14,999 | 279,884 | 84.3% |
| $15,000 to $24,999 | 559,767 | 168.6% |
| $25,000 to $34,999 | 891,776 | 268.6% |
| $35,000 to $49,999 | 1,032,880 | 311.1% |
| $50,000 to $74,999 | 1,801,481 | 542.6% |
| $75,000 to $99,999 | 1,519,605 | 457.7% |
| $100,000 to $149,999 | 2,926,327 | 881.4% |
| $150,000 to $199,999 | 2,210,184 | 665.7% |
| $200,000+ | 5,219,181 | 1,572.0% |
Family Income by Famaliy Size in Area Code 201
7+ person families (5,827 | 1.8%) account for the highest median family income in Area Code 201 with $175,354 per family, while 2-person families (134,209 | 40.4%) have the highest median income of $58,979 per family member.
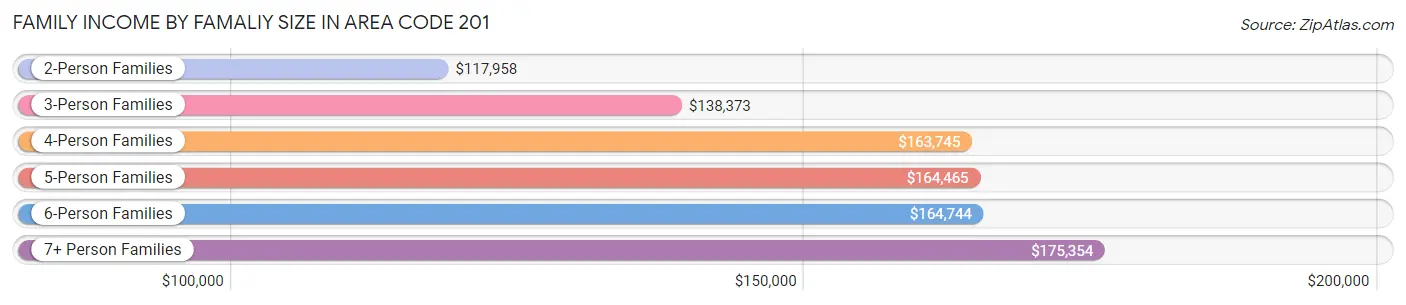
| Income Bracket | # Families | Median Income |
| 2-Person Families | 134,209 (40.4%) | $117,958 |
| 3-Person Families | 84,013 (25.3%) | $138,373 |
| 4-Person Families | 69,231 (20.8%) | $163,745 |
| 5-Person Families | 28,841 (8.7%) | $164,465 |
| 6-Person Families | 9,888 (3.0%) | $164,744 |
| 7+ Person Families | 5,827 (1.8%) | $175,354 |
| Total | 332,009 (100.0%) | $142,609 |
Family Income by Number of Earners in Area Code 201
The median family income in Area Code 201 is $142,609, with families comprising 3+ earners (47,818) having the highest median family income of $187,118, while families with no earners (33,497) have the lowest median family income of $52,735, accounting for 14.4% and 10.1% of families, respectively.
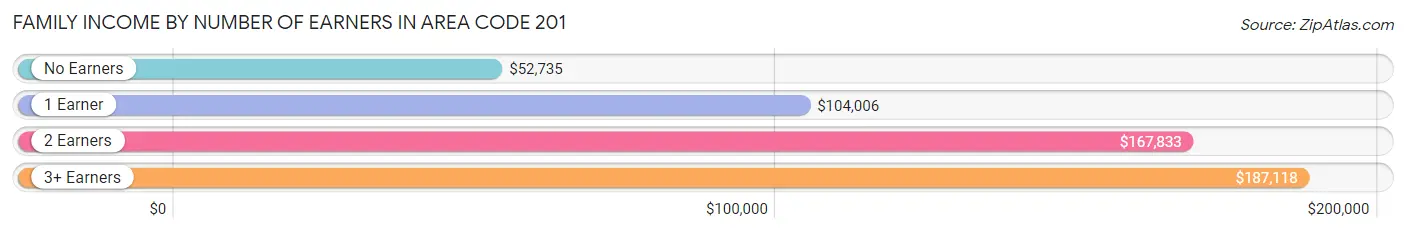
| Number of Earners | # Families | Median Income |
| No Earners | 33,497 (10.1%) | $52,735 |
| 1 Earner | 107,189 (32.3%) | $104,006 |
| 2 Earners | 143,505 (43.2%) | $167,833 |
| 3+ Earners | 47,818 (14.4%) | $187,118 |
| Total | 332,009 (100.0%) | $142,609 |
Household Income in Area Code 201
Household Income Brackets in Area Code 201
With 6,472,921 households falling in the category, the $200,000+ income range is the most frequent in Area Code 201, accounting for 1,273.4% of all households. In contrast, only 787,893 households (155.0%) fall into the $10,000 to $14,999 income bracket, making it the least populous group.
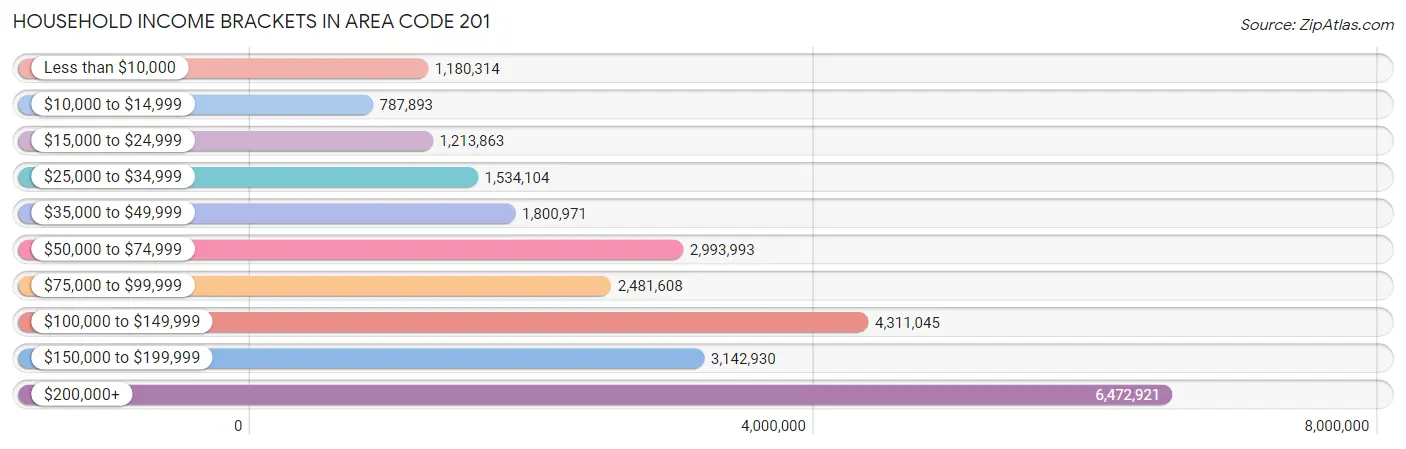
| Income Bracket | # Households | % Households |
| Less than $10,000 | 1,180,314 | 232.2% |
| $10,000 to $14,999 | 787,893 | 155.0% |
| $15,000 to $24,999 | 1,213,863 | 238.8% |
| $25,000 to $34,999 | 1,534,104 | 301.8% |
| $35,000 to $49,999 | 1,800,971 | 354.3% |
| $50,000 to $74,999 | 2,993,993 | 589.0% |
| $75,000 to $99,999 | 2,481,608 | 488.2% |
| $100,000 to $149,999 | 4,311,045 | 848.1% |
| $150,000 to $199,999 | 3,142,930 | 618.3% |
| $200,000+ | 6,472,921 | 1,273.4% |
Household Income by Householder Age in Area Code 201
The median household income in Area Code 201 is $121,397, with the highest median household income of $136,533 found in the 25 to 44 years age bracket for the primary householder. A total of 189,620 households (37.3%) fall into this category. Meanwhile, the 15 to 24 years age bracket for the primary householder has the lowest median household income of $65,394, with 11,216 households (2.2%) in this group.
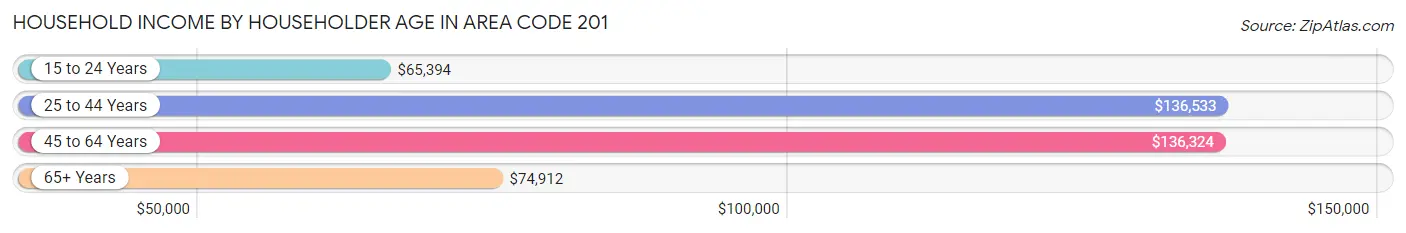
| Income Bracket | # Households | Median Income |
| 15 to 24 Years | 11,216 (2.2%) | $65,394 |
| 25 to 44 Years | 189,620 (37.3%) | $136,533 |
| 45 to 64 Years | 191,578 (37.7%) | $136,324 |
| 65+ Years | 115,904 (22.8%) | $74,912 |
| Total | 508,318 (100.0%) | $121,397 |
Poverty in Area Code 201
Income Below Poverty by Sex and Age in Area Code 201
With 10.9% poverty level for males and 14.0% for females among the residents of Area Code 201, 5 year old males and 5 year old females are the most vulnerable to poverty, with 1,552 males (21.2%) and 1,502 females (21.2%) in their respective age groups living below the poverty level.
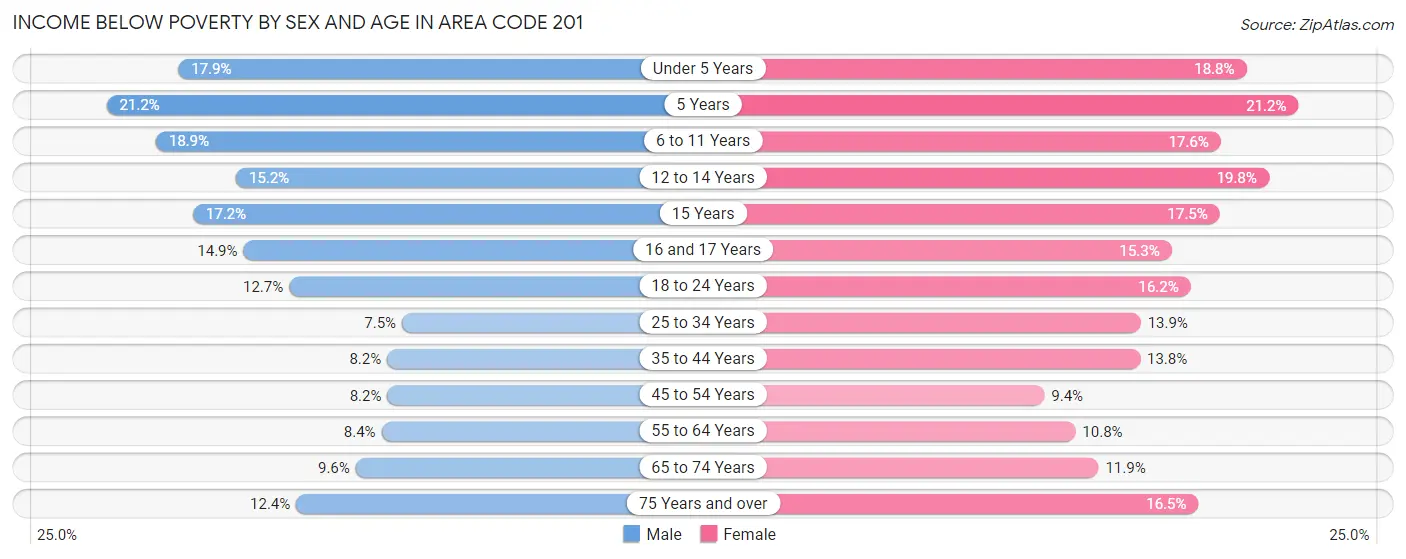
| Age Bracket | Male | Female |
| Under 5 Years | 7,425 (17.9%) | 7,233 (18.8%) |
| 5 Years | 1,552 (21.2%) | 1,502 (21.2%) |
| 6 to 11 Years | 9,338 (18.9%) | 8,010 (17.6%) |
| 12 to 14 Years | 3,833 (15.2%) | 5,162 (19.8%) |
| 15 Years | 1,491 (17.2%) | 1,404 (17.5%) |
| 16 and 17 Years | 2,603 (14.8%) | 2,493 (15.3%) |
| 18 to 24 Years | 6,806 (12.7%) | 8,572 (16.2%) |
| 25 to 34 Years | 8,063 (7.5%) | 13,905 (13.9%) |
| 35 to 44 Years | 7,885 (8.2%) | 13,064 (13.8%) |
| 45 to 54 Years | 7,079 (8.2%) | 8,229 (9.4%) |
| 55 to 64 Years | 6,751 (8.4%) | 9,042 (10.8%) |
| 65 to 74 Years | 4,950 (9.6%) | 7,007 (11.9%) |
| 75 Years and over | 3,763 (12.4%) | 7,743 (16.5%) |
| Total | 71,539 (10.9%) | 93,366 (14.0%) |
Income Above Poverty by Sex and Age in Area Code 201
According to the poverty statistics in Area Code 201, males aged 25 to 34 years and females aged 45 to 54 years are the age groups that are most secure financially, with 92.5% of males and 90.6% of females in these age groups living above the poverty line.
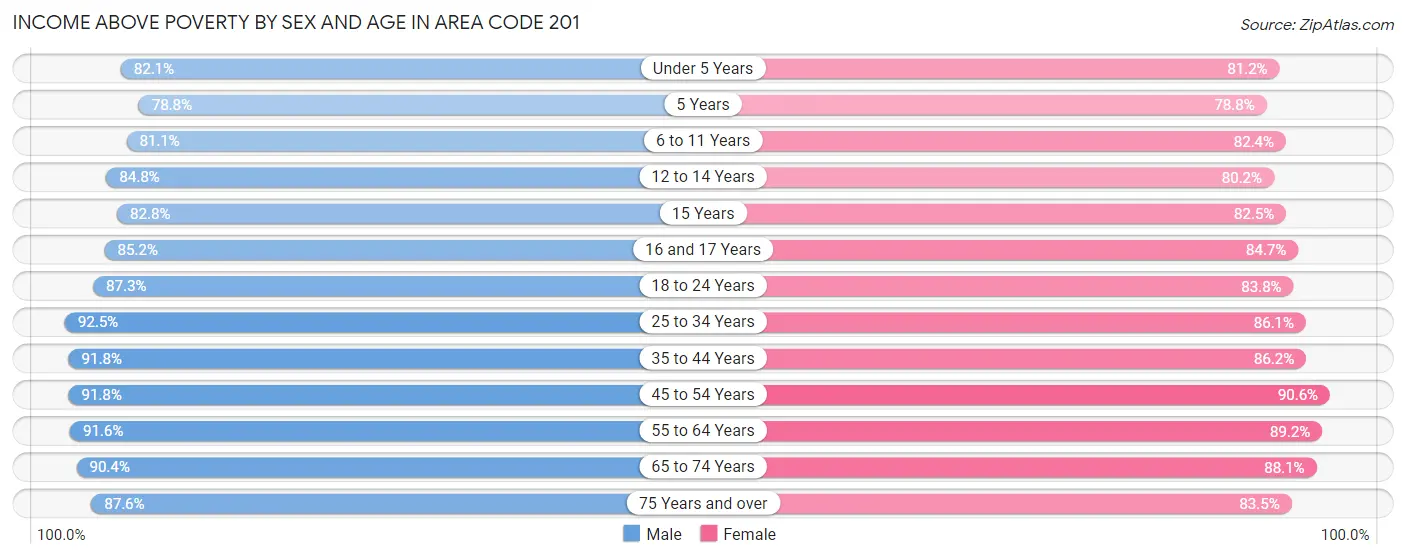
| Age Bracket | Male | Female |
| Under 5 Years | 34,114 (82.1%) | 31,303 (81.2%) |
| 5 Years | 5,769 (78.8%) | 5,588 (78.8%) |
| 6 to 11 Years | 40,033 (81.1%) | 37,549 (82.4%) |
| 12 to 14 Years | 21,399 (84.8%) | 20,889 (80.2%) |
| 15 Years | 7,183 (82.8%) | 6,604 (82.5%) |
| 16 and 17 Years | 14,921 (85.2%) | 13,803 (84.7%) |
| 18 to 24 Years | 46,679 (87.3%) | 44,392 (83.8%) |
| 25 to 34 Years | 99,641 (92.5%) | 86,339 (86.1%) |
| 35 to 44 Years | 88,452 (91.8%) | 81,347 (86.2%) |
| 45 to 54 Years | 79,560 (91.8%) | 79,298 (90.6%) |
| 55 to 64 Years | 73,190 (91.6%) | 74,336 (89.2%) |
| 65 to 74 Years | 46,394 (90.4%) | 51,835 (88.1%) |
| 75 Years and over | 26,579 (87.6%) | 39,074 (83.5%) |
| Total | 583,914 (89.1%) | 572,357 (86.0%) |
Income Below Poverty Among Married-Couple Families in Area Code 201
The poverty statistics for married-couple families in Area Code 201 show that 4.7% or 10,909 of the total 231,072 families live below the poverty line. Families with 5 or more children have the highest poverty rate of 21.9%, comprising of 272 families. On the other hand, families with no children have the lowest poverty rate of 3.4%, which includes 4,223 families.
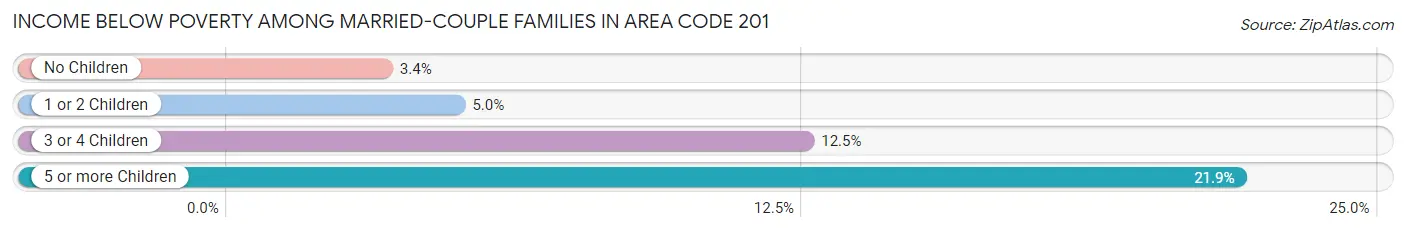
| Children | Above Poverty | Below Poverty |
| No Children | 121,031 (96.6%) | 4,223 (3.4%) |
| 1 or 2 Children | 83,861 (95.1%) | 4,363 (5.0%) |
| 3 or 4 Children | 14,303 (87.5%) | 2,051 (12.5%) |
| 5 or more Children | 968 (78.1%) | 272 (21.9%) |
| Total | 220,163 (95.3%) | 10,909 (4.7%) |
Income Below Poverty Among Single-Parent Households in Area Code 201
According to the poverty data in Area Code 201, 10.9% or 2,946 single-father households and 24.4% or 18,081 single-mother households are living below the poverty line. Among single-father households, those with 5 or more children have the highest poverty rate, with 38 households (43.7%) experiencing poverty. Likewise, among single-mother households, those with 5 or more children have the highest poverty rate, with 475 households (88.3%) falling below the poverty line.
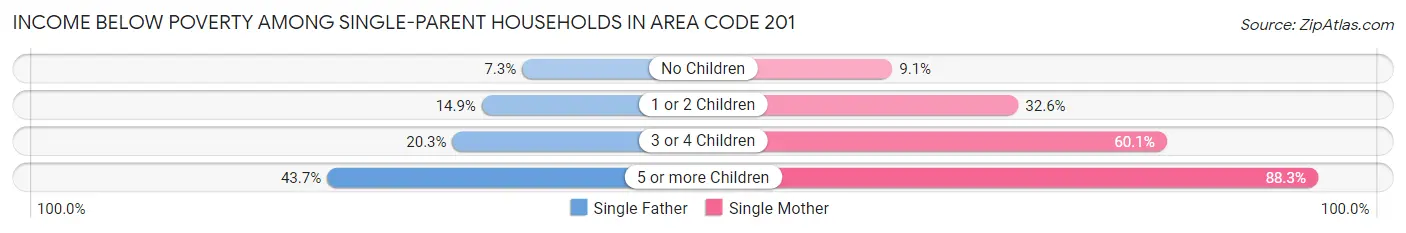
| Children | Single Father | Single Mother |
| No Children | 1,137 (7.3%) | 2,985 (9.1%) |
| 1 or 2 Children | 1,462 (14.9%) | 11,521 (32.6%) |
| 3 or 4 Children | 309 (20.3%) | 3,100 (60.1%) |
| 5 or more Children | 38 (43.7%) | 475 (88.3%) |
| Total | 2,946 (10.9%) | 18,081 (24.4%) |
Income Below Poverty Among Married-Couple vs Single-Parent Households in Area Code 201
The poverty data for Area Code 201 shows that 10,909 of the married-couple family households (4.7%) and 21,027 of the single-parent households (20.8%) are living below the poverty level. Within the married-couple family households, those with 5 or more children have the highest poverty rate, with 272 households (21.9%) falling below the poverty line. Among the single-parent households, those with 5 or more children have the highest poverty rate, with 513 household (82.1%) living below poverty.
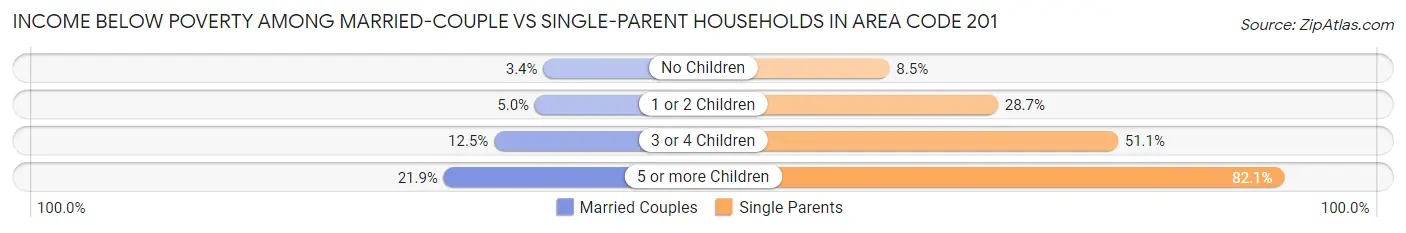
| Children | Married-Couple Families | Single-Parent Households |
| No Children | 4,223 (3.4%) | 4,122 (8.5%) |
| 1 or 2 Children | 4,363 (5.0%) | 12,983 (28.7%) |
| 3 or 4 Children | 2,051 (12.5%) | 3,409 (51.1%) |
| 5 or more Children | 272 (21.9%) | 513 (82.1%) |
| Total | 10,909 (4.7%) | 21,027 (20.8%) |
Race in Area Code 201
The most populous races in Area Code 201 are White / Caucasian (642,988 | 47.8%), Hispanic or Latino (424,723 | 31.6%), and Black / African American (189,757 | 14.1%).
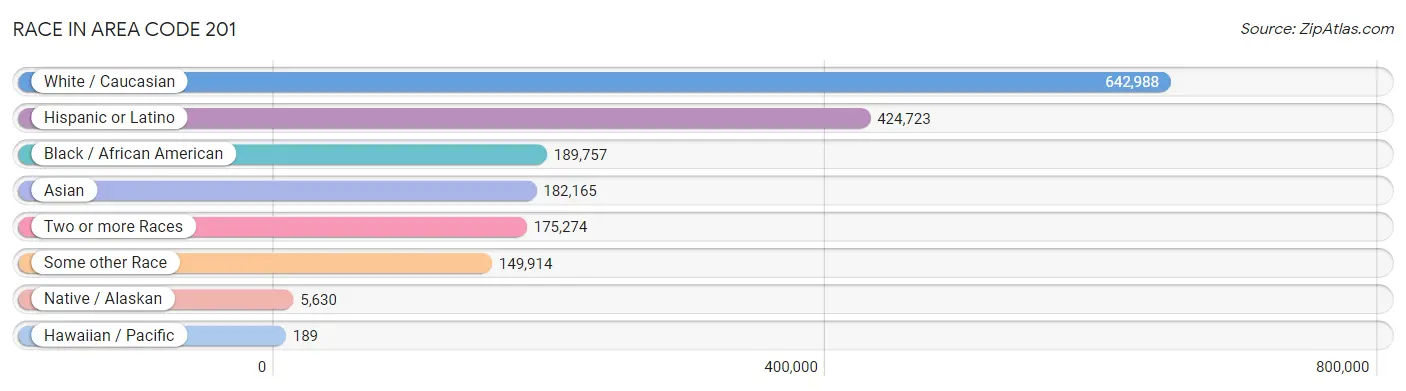
| Race | # Population | % Population |
| Asian | 182,165 | 13.5% |
| Black / African American | 189,757 | 14.1% |
| Hawaiian / Pacific | 189 | 0.0% |
| Hispanic or Latino | 424,723 | 31.6% |
| Native / Alaskan | 5,630 | 0.4% |
| White / Caucasian | 642,988 | 47.8% |
| Two or more Races | 175,274 | 13.0% |
| Some other Race | 149,914 | 11.1% |
| Total | 1,345,917 | 100.0% |
Ancestry in Area Code 201
The most populous ancestries reported in Area Code 201 are Italian (129,881 | 9.7%), South American (109,511 | 8.1%), Irish (99,986 | 7.4%), Dominican (94,624 | 7.0%), and Puerto Rican (82,884 | 6.2%), together accounting for 38.4% of all Area Code 201 residents.
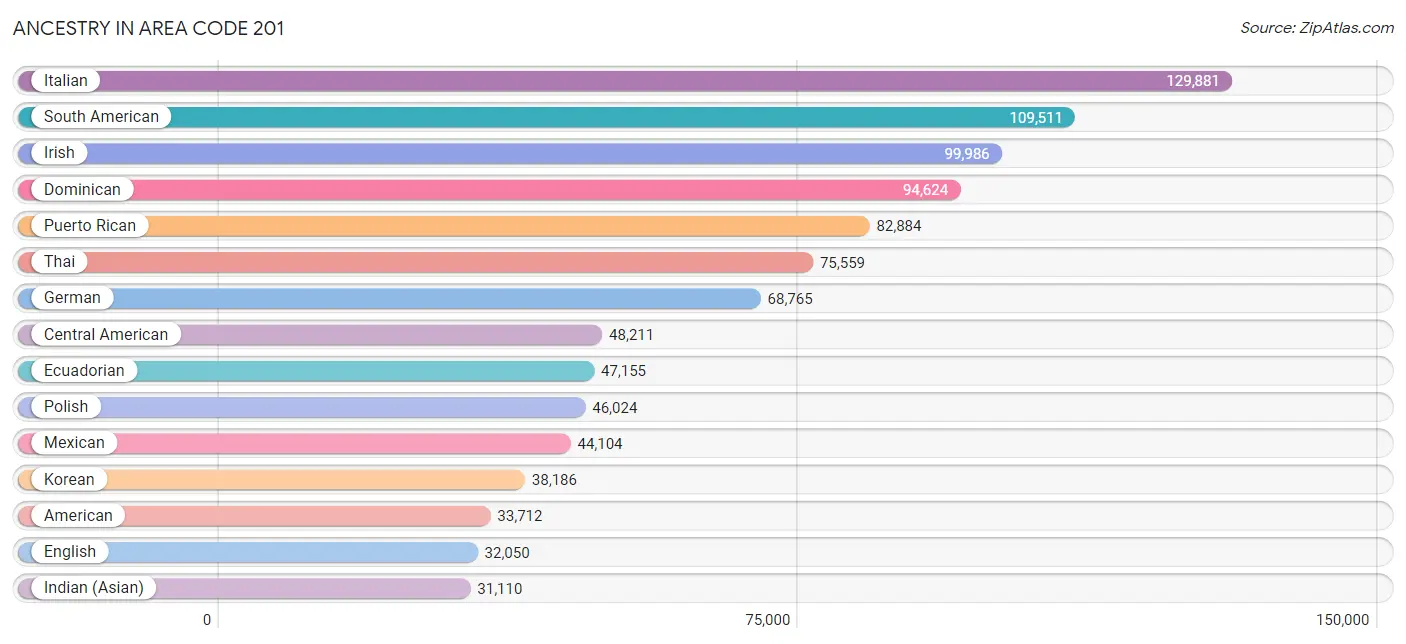
| Ancestry | # Population | % Population |
| Afghan | 388 | 0.0% |
| African | 10,117 | 0.7% |
| Alaska Native | 25 | 0.0% |
| Alaskan Athabascan | 5 | 0.0% |
| Albanian | 2,648 | 0.2% |
| Alsatian | 64 | 0.0% |
| American | 33,712 | 2.5% |
| Apache | 86 | 0.0% |
| Arab | 30,370 | 2.3% |
| Argentinean | 4,210 | 0.3% |
| Armenian | 3,246 | 0.2% |
| Assyrian / Chaldean / Syriac | 187 | 0.0% |
| Australian | 532 | 0.0% |
| Austrian | 4,346 | 0.3% |
| Bahamian | 215 | 0.0% |
| Bangladeshi | 7 | 0.0% |
| Barbadian | 467 | 0.0% |
| Basque | 86 | 0.0% |
| Belgian | 404 | 0.0% |
| Belizean | 119 | 0.0% |
| Bermudan | 140 | 0.0% |
| Bhutanese | 6,659 | 0.5% |
| Blackfeet | 290 | 0.0% |
| Bolivian | 1,828 | 0.1% |
| Brazilian | 18,165 | 1.3% |
| British | 3,373 | 0.3% |
| British West Indian | 1,380 | 0.1% |
| Bulgarian | 822 | 0.1% |
| Burmese | 28,553 | 2.1% |
| Cajun | 19 | 0.0% |
| Cambodian | 17 | 0.0% |
| Canadian | 2,258 | 0.2% |
| Cape Verdean | 200 | 0.0% |
| Carpatho Rusyn | 96 | 0.0% |
| Celtic | 9 | 0.0% |
| Central American | 48,211 | 3.6% |
| Central American Indian | 3,201 | 0.2% |
| Cherokee | 828 | 0.1% |
| Cheyenne | 48 | 0.0% |
| Chickasaw | 47 | 0.0% |
| Chilean | 2,953 | 0.2% |
| Chippewa | 60 | 0.0% |
| Choctaw | 97 | 0.0% |
| Colombian | 27,642 | 2.1% |
| Costa Rican | 2,555 | 0.2% |
| Creek | 279 | 0.0% |
| Croatian | 3,052 | 0.2% |
| Cuban | 20,748 | 1.5% |
| Cypriot | 396 | 0.0% |
| Czech | 1,735 | 0.1% |
| Czechoslovakian | 722 | 0.1% |
| Danish | 1,275 | 0.1% |
| Delaware | 226 | 0.0% |
| Dominican | 94,624 | 7.0% |
| Dutch | 7,395 | 0.5% |
| Dutch West Indian | 130 | 0.0% |
| Eastern European | 10,165 | 0.8% |
| Ecuadorian | 47,155 | 3.5% |
| Egyptian | 13,943 | 1.0% |
| English | 32,050 | 2.4% |
| Estonian | 196 | 0.0% |
| Ethiopian | 741 | 0.1% |
| European | 8,651 | 0.6% |
| Filipino | 1,326 | 0.1% |
| Finnish | 668 | 0.1% |
| French | 9,272 | 0.7% |
| French American Indian | 26 | 0.0% |
| French Canadian | 1,524 | 0.1% |
| German | 68,765 | 5.1% |
| German Russian | 322 | 0.0% |
| Ghanaian | 2,614 | 0.2% |
| Greek | 8,168 | 0.6% |
| Guamanian / Chamorro | 99 | 0.0% |
| Guatemalan | 12,804 | 0.9% |
| Guyanese | 5,922 | 0.4% |
| Haitian | 5,313 | 0.4% |
| Hmong | 5 | 0.0% |
| Honduran | 11,350 | 0.8% |
| Hungarian | 6,477 | 0.5% |
| Icelander | 70 | 0.0% |
| Indian (Asian) | 31,110 | 2.3% |
| Indonesian | 216 | 0.0% |
| Inupiat | 7 | 0.0% |
| Iranian | 1,676 | 0.1% |
| Iraqi | 297 | 0.0% |
| Irish | 99,986 | 7.4% |
| Iroquois | 209 | 0.0% |
| Israeli | 2,714 | 0.2% |
| Italian | 129,881 | 9.7% |
| Jamaican | 13,205 | 1.0% |
| Japanese | 116 | 0.0% |
| Jordanian | 845 | 0.1% |
| Kenyan | 1,636 | 0.1% |
| Korean | 38,186 | 2.8% |
| Laotian | 544 | 0.0% |
| Latvian | 502 | 0.0% |
| Lebanese | 2,825 | 0.2% |
| Liberian | 545 | 0.0% |
| Lithuanian | 2,476 | 0.2% |
| Lumbee | 15 | 0.0% |
| Luxembourger | 59 | 0.0% |
| Macedonian | 1,435 | 0.1% |
| Malaysian | 25 | 0.0% |
| Maltese | 246 | 0.0% |
| Mexican | 44,104 | 3.3% |
| Mexican American Indian | 1,179 | 0.1% |
| Mongolian | 86 | 0.0% |
| Moroccan | 3,044 | 0.2% |
| Native Hawaiian | 244 | 0.0% |
| Navajo | 27 | 0.0% |
| New Zealander | 78 | 0.0% |
| Nicaraguan | 1,638 | 0.1% |
| Nigerian | 5,814 | 0.4% |
| Northern European | 484 | 0.0% |
| Norwegian | 3,521 | 0.3% |
| Okinawan | 119 | 0.0% |
| Pakistani | 1,398 | 0.1% |
| Palestinian | 1,769 | 0.1% |
| Panamanian | 1,679 | 0.1% |
| Paraguayan | 226 | 0.0% |
| Pennsylvania German | 157 | 0.0% |
| Peruvian | 18,910 | 1.4% |
| Pima | 11 | 0.0% |
| Polish | 46,024 | 3.4% |
| Portuguese | 15,317 | 1.1% |
| Puerto Rican | 82,884 | 6.2% |
| Romanian | 3,409 | 0.3% |
| Russian | 21,672 | 1.6% |
| Salvadoran | 18,090 | 1.3% |
| Samoan | 24 | 0.0% |
| Scandinavian | 635 | 0.1% |
| Scotch-Irish | 1,933 | 0.1% |
| Scottish | 7,229 | 0.5% |
| Seminole | 10 | 0.0% |
| Senegalese | 260 | 0.0% |
| Serbian | 794 | 0.1% |
| Sierra Leonean | 208 | 0.0% |
| Sioux | 52 | 0.0% |
| Slavic | 773 | 0.1% |
| Slovak | 1,756 | 0.1% |
| Slovene | 80 | 0.0% |
| Somali | 19 | 0.0% |
| South African | 321 | 0.0% |
| South American | 109,511 | 8.1% |
| South American Indian | 1,196 | 0.1% |
| Soviet Union | 47 | 0.0% |
| Spaniard | 7,962 | 0.6% |
| Spanish | 1,927 | 0.1% |
| Spanish American Indian | 237 | 0.0% |
| Sri Lankan | 3,933 | 0.3% |
| Subsaharan African | 25,110 | 1.9% |
| Sudanese | 312 | 0.0% |
| Swedish | 3,739 | 0.3% |
| Swiss | 1,525 | 0.1% |
| Syrian | 2,345 | 0.2% |
| Thai | 75,559 | 5.6% |
| Tohono O'Odham | 9 | 0.0% |
| Tongan | 10 | 0.0% |
| Trinidadian and Tobagonian | 3,979 | 0.3% |
| Turkish | 3,116 | 0.2% |
| U.S. Virgin Islander | 105 | 0.0% |
| Ugandan | 344 | 0.0% |
| Ukrainian | 7,646 | 0.6% |
| Uruguayan | 1,738 | 0.1% |
| Venezuelan | 4,491 | 0.3% |
| Vietnamese | 1,093 | 0.1% |
| Welsh | 1,579 | 0.1% |
| West Indian | 1,987 | 0.2% |
| Yaqui | 10 | 0.0% |
| Yugoslavian | 400 | 0.0% |
| Zimbabwean | 78 | 0.0% | View All 171 Rows |
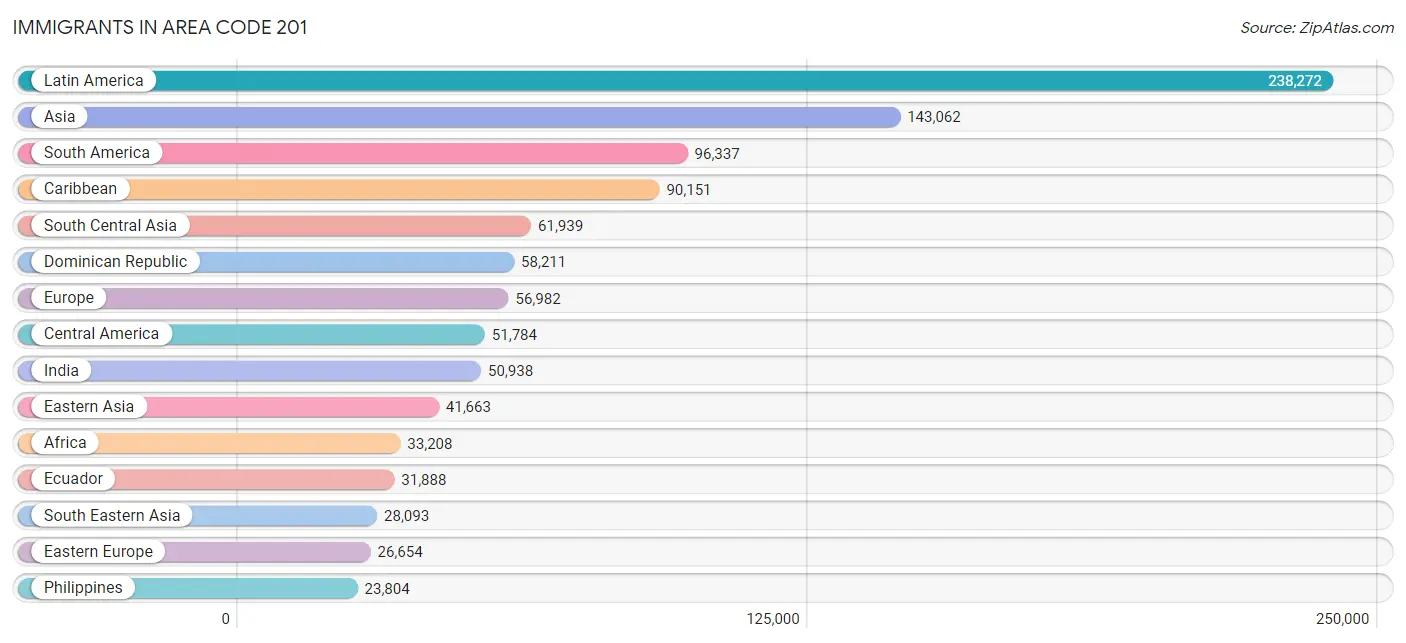
Immigrants in Area Code 201
The most numerous immigrant groups reported in Area Code 201 came from Latin America (238,272 | 17.7%), Asia (143,062 | 10.6%), South America (96,337 | 7.2%), Caribbean (90,151 | 6.7%), and South Central Asia (61,939 | 4.6%), together accounting for 46.8% of all Area Code 201 residents.
| Immigration Origin | # Population | % Population |
| Afghanistan | 300 | 0.0% |
| Africa | 33,208 | 2.5% |
| Albania | 1,397 | 0.1% |
| Argentina | 2,192 | 0.2% |
| Armenia | 206 | 0.0% |
| Asia | 143,062 | 10.6% |
| Australia | 661 | 0.1% |
| Austria | 410 | 0.0% |
| Azores | 55 | 0.0% |
| Bahamas | 68 | 0.0% |
| Bangladesh | 1,119 | 0.1% |
| Barbados | 239 | 0.0% |
| Belarus | 1,095 | 0.1% |
| Belgium | 147 | 0.0% |
| Belize | 186 | 0.0% |
| Bolivia | 1,467 | 0.1% |
| Bosnia and Herzegovina | 72 | 0.0% |
| Brazil | 17,329 | 1.3% |
| Bulgaria | 715 | 0.1% |
| Cabo Verde | 94 | 0.0% |
| Cambodia | 79 | 0.0% |
| Cameroon | 478 | 0.0% |
| Canada | 3,323 | 0.3% |
| Caribbean | 90,151 | 6.7% |
| Central America | 51,784 | 3.8% |
| Chile | 2,266 | 0.2% |
| China | 19,809 | 1.5% |
| Colombia | 17,849 | 1.3% |
| Congo | 238 | 0.0% |
| Costa Rica | 1,589 | 0.1% |
| Croatia | 775 | 0.1% |
| Cuba | 12,761 | 0.9% |
| Czechoslovakia | 510 | 0.0% |
| Denmark | 118 | 0.0% |
| Dominica | 724 | 0.1% |
| Dominican Republic | 58,211 | 4.3% |
| Eastern Africa | 3,558 | 0.3% |
| Eastern Asia | 41,663 | 3.1% |
| Eastern Europe | 26,654 | 2.0% |
| Ecuador | 31,888 | 2.4% |
| Egypt | 11,607 | 0.9% |
| El Salvador | 10,952 | 0.8% |
| England | 1,238 | 0.1% |
| Ethiopia | 588 | 0.0% |
| Europe | 56,982 | 4.2% |
| France | 1,723 | 0.1% |
| Germany | 2,263 | 0.2% |
| Ghana | 3,066 | 0.2% |
| Greece | 1,151 | 0.1% |
| Grenada | 226 | 0.0% |
| Guatemala | 8,629 | 0.6% |
| Guyana | 5,422 | 0.4% |
| Haiti | 3,465 | 0.3% |
| Honduras | 7,816 | 0.6% |
| Hong Kong | 1,853 | 0.1% |
| Hungary | 627 | 0.1% |
| India | 50,938 | 3.8% |
| Indonesia | 304 | 0.0% |
| Iran | 1,342 | 0.1% |
| Iraq | 111 | 0.0% |
| Ireland | 1,961 | 0.2% |
| Israel | 2,530 | 0.2% |
| Italy | 5,069 | 0.4% |
| Jamaica | 8,848 | 0.7% |
| Japan | 3,113 | 0.2% |
| Jordan | 688 | 0.1% |
| Kazakhstan | 142 | 0.0% |
| Kenya | 1,800 | 0.1% |
| Korea | 18,730 | 1.4% |
| Kuwait | 471 | 0.0% |
| Laos | 55 | 0.0% |
| Latin America | 238,272 | 17.7% |
| Latvia | 285 | 0.0% |
| Lebanon | 1,049 | 0.1% |
| Liberia | 571 | 0.0% |
| Lithuania | 104 | 0.0% |
| Malaysia | 399 | 0.0% |
| Mexico | 20,477 | 1.5% |
| Middle Africa | 1,221 | 0.1% |
| Moldova | 472 | 0.0% |
| Morocco | 2,542 | 0.2% |
| Nepal | 1,117 | 0.1% |
| Netherlands | 407 | 0.0% |
| Nicaragua | 895 | 0.1% |
| Nigeria | 4,939 | 0.4% |
| North Macedonia | 814 | 0.1% |
| Northern Africa | 15,289 | 1.1% |
| Northern Europe | 6,464 | 0.5% |
| Norway | 90 | 0.0% |
| Oceania | 804 | 0.1% |
| Pakistan | 5,888 | 0.4% |
| Panama | 1,235 | 0.1% |
| Peru | 12,524 | 0.9% |
| Philippines | 23,804 | 1.8% |
| Poland | 6,623 | 0.5% |
| Portugal | 8,315 | 0.6% |
| Romania | 1,328 | 0.1% |
| Russia | 4,755 | 0.4% |
| Saudi Arabia | 708 | 0.1% |
| Scotland | 326 | 0.0% |
| Senegal | 548 | 0.0% |
| Serbia | 314 | 0.0% |
| Sierra Leone | 163 | 0.0% |
| Singapore | 250 | 0.0% |
| Somalia | 11 | 0.0% |
| South Africa | 835 | 0.1% |
| South America | 96,337 | 7.2% |
| South Central Asia | 61,939 | 4.6% |
| South Eastern Asia | 28,093 | 2.1% |
| Southern Europe | 18,573 | 1.4% |
| Spain | 3,989 | 0.3% |
| Sri Lanka | 373 | 0.0% |
| St. Vincent and the Grenadines | 225 | 0.0% |
| Sudan | 123 | 0.0% |
| Sweden | 93 | 0.0% |
| Switzerland | 273 | 0.0% |
| Syria | 1,215 | 0.1% |
| Taiwan | 1,863 | 0.1% |
| Thailand | 703 | 0.1% |
| Trinidad and Tobago | 4,056 | 0.3% |
| Turkey | 2,629 | 0.2% |
| Uganda | 408 | 0.0% |
| Ukraine | 4,713 | 0.4% |
| Uruguay | 976 | 0.1% |
| Uzbekistan | 352 | 0.0% |
| Venezuela | 3,595 | 0.3% |
| Vietnam | 2,265 | 0.2% |
| West Indies | 109 | 0.0% |
| Western Africa | 11,244 | 0.8% |
| Western Asia | 10,888 | 0.8% |
| Western Europe | 5,223 | 0.4% |
| Yemen | 197 | 0.0% |
| Zaire | 30 | 0.0% |
| Zimbabwe | 209 | 0.0% | View All 134 Rows |
Sex and Age in Area Code 201
Sex and Age in Area Code 201
The most populous age groups in Area Code 201 are 30 to 34 Years (56,988 | 8.5%) for men and 30 to 34 Years (50,948 | 7.5%) for women.
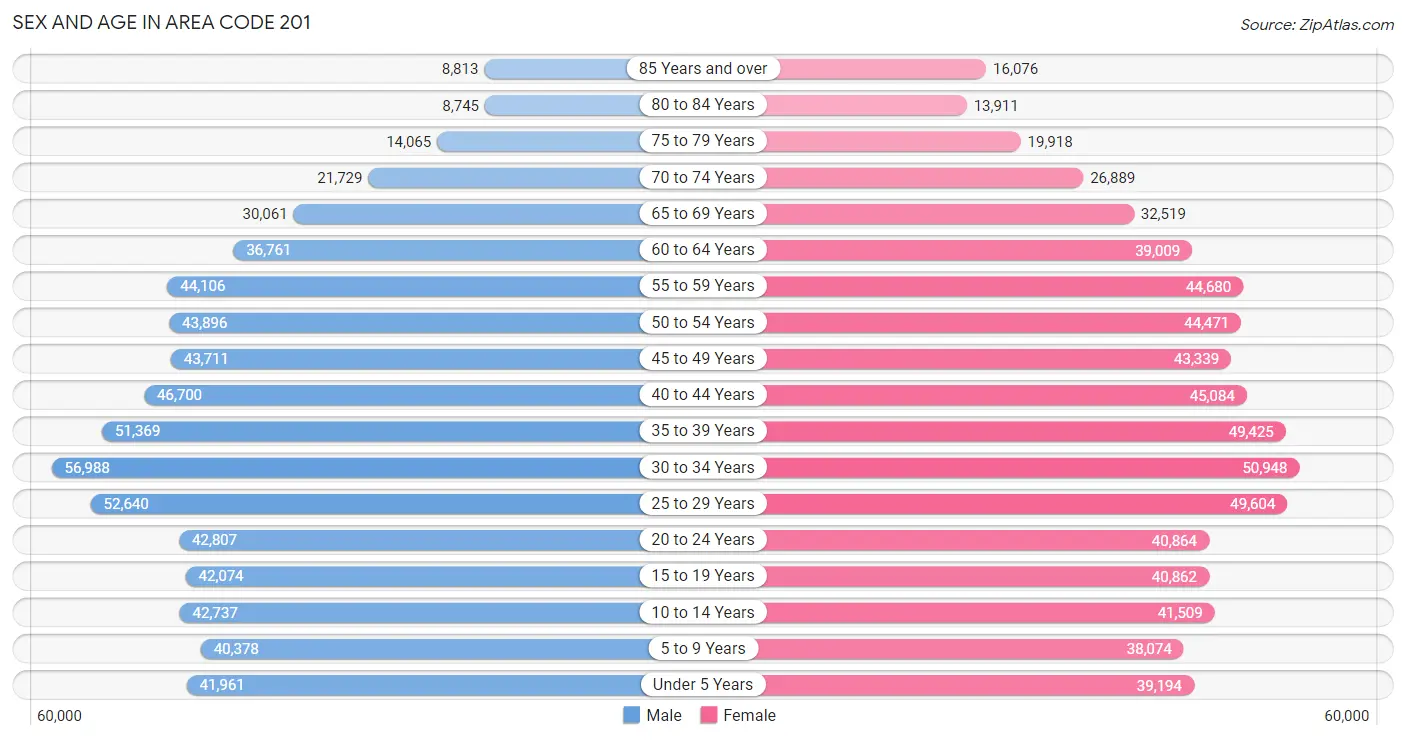
| Age Bracket | Male | Female |
| Under 5 Years | 41,961 (6.3%) | 39,194 (5.8%) |
| 5 to 9 Years | 40,378 (6.0%) | 38,074 (5.6%) |
| 10 to 14 Years | 42,737 (6.4%) | 41,509 (6.1%) |
| 15 to 19 Years | 42,074 (6.3%) | 40,862 (6.0%) |
| 20 to 24 Years | 42,807 (6.4%) | 40,864 (6.0%) |
| 25 to 29 Years | 52,640 (7.9%) | 49,604 (7.3%) |
| 30 to 34 Years | 56,988 (8.5%) | 50,948 (7.5%) |
| 35 to 39 Years | 51,369 (7.7%) | 49,425 (7.3%) |
| 40 to 44 Years | 46,700 (7.0%) | 45,084 (6.7%) |
| 45 to 49 Years | 43,711 (6.5%) | 43,339 (6.4%) |
| 50 to 54 Years | 43,896 (6.6%) | 44,471 (6.6%) |
| 55 to 59 Years | 44,106 (6.6%) | 44,680 (6.6%) |
| 60 to 64 Years | 36,761 (5.5%) | 39,009 (5.8%) |
| 65 to 69 Years | 30,061 (4.5%) | 32,519 (4.8%) |
| 70 to 74 Years | 21,729 (3.3%) | 26,889 (4.0%) |
| 75 to 79 Years | 14,065 (2.1%) | 19,918 (2.9%) |
| 80 to 84 Years | 8,745 (1.3%) | 13,911 (2.1%) |
| 85 Years and over | 8,813 (1.3%) | 16,076 (2.4%) |
| Total | 669,541 (100.0%) | 676,376 (100.0%) |
Families and Households in Area Code 201
Median Family Size in Area Code 201
The median family size in Area Code 201 is 3.19 persons per family, with married-couple families (231,072 | 69.6%) accounting for the largest median family size of 3.29078 persons per family. On the other hand, single male/father families (26,933 | 8.1%) represent the smallest median family size with 2.74 persons per family.
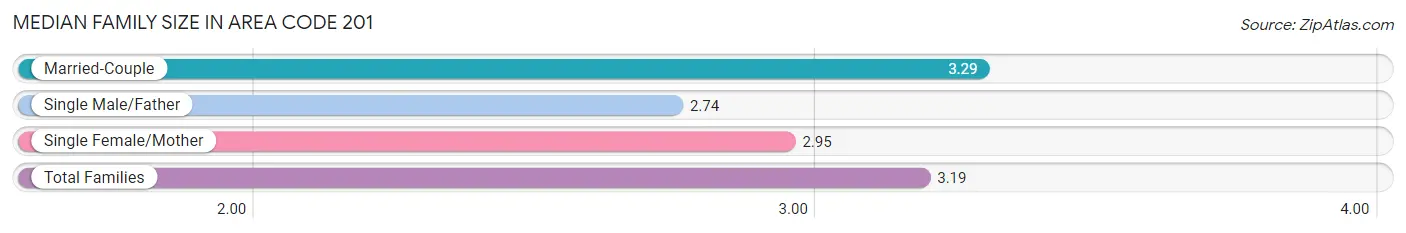
| Family Type | # Families | Family Size |
| Married-Couple | 231,072 (69.6%) | 3.29 |
| Single Male/Father | 26,933 (8.1%) | 2.74 |
| Single Female/Mother | 74,004 (22.3%) | 2.95 |
| Total Families | 332,009 (100.0%) | 3.19 |
Median Household Size in Area Code 201
The median household size in Area Code 201 is 2.63 persons per household, with married-couple households (231,072 | 45.5%) accounting for the largest median household size of 3.31666 persons per household. non-family households (176,309 | 34.7%) represent the smallest median household size with 1.22 persons per household.
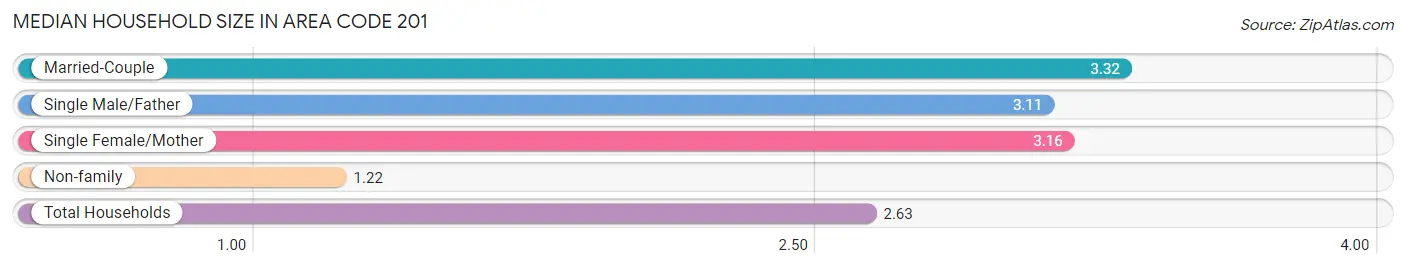
| Household Type | # Households | Household Size |
| Married-Couple | 231,072 (45.5%) | 3.32 |
| Single Male/Father | 26,933 (5.3%) | 3.11 |
| Single Female/Mother | 74,004 (14.6%) | 3.16 |
| Non-family | 176,309 (34.7%) | 1.22 |
| Total Households | 508,318 (100.0%) | 2.63 |
Household Size by Marriage Status in Area Code 201
Out of a total of 508,318 households in Area Code 201, 332,009 (65.3%) are family households, while 176,309 (34.7%) are nonfamily households. The most numerous type of family households are 2-person households, comprising 122,805, and the most common type of nonfamily households are 1-person households, comprising 142,002.
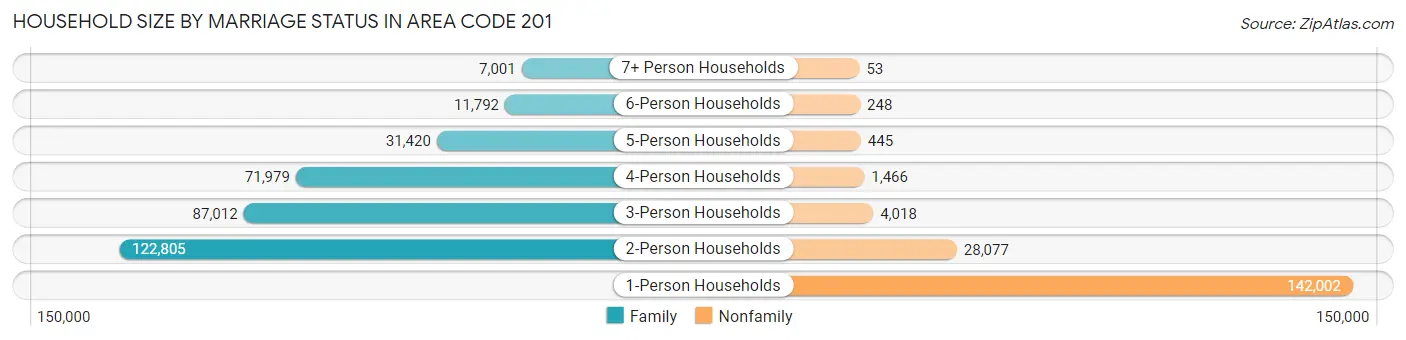
| Household Size | Family Households | Nonfamily Households |
| 1-Person Households | - | 142,002 (27.9%) |
| 2-Person Households | 122,805 (24.2%) | 28,077 (5.5%) |
| 3-Person Households | 87,012 (17.1%) | 4,018 (0.8%) |
| 4-Person Households | 71,979 (14.2%) | 1,466 (0.3%) |
| 5-Person Households | 31,420 (6.2%) | 445 (0.1%) |
| 6-Person Households | 11,792 (2.3%) | 248 (0.1%) |
| 7+ Person Households | 7,001 (1.4%) | 53 (0.0%) |
| Total | 332,009 (65.3%) | 176,309 (34.7%) |
Female Fertility in Area Code 201
Fertility by Age in Area Code 201
Average fertility rate in Area Code 201 is 47.6 births per 1,000 women. Women in the age bracket of 20 to 34 years have the highest fertility rate with 69.0 births per 1,000 women. Women in the age bracket of 20 to 34 years acount for 59.0% of all women with births.
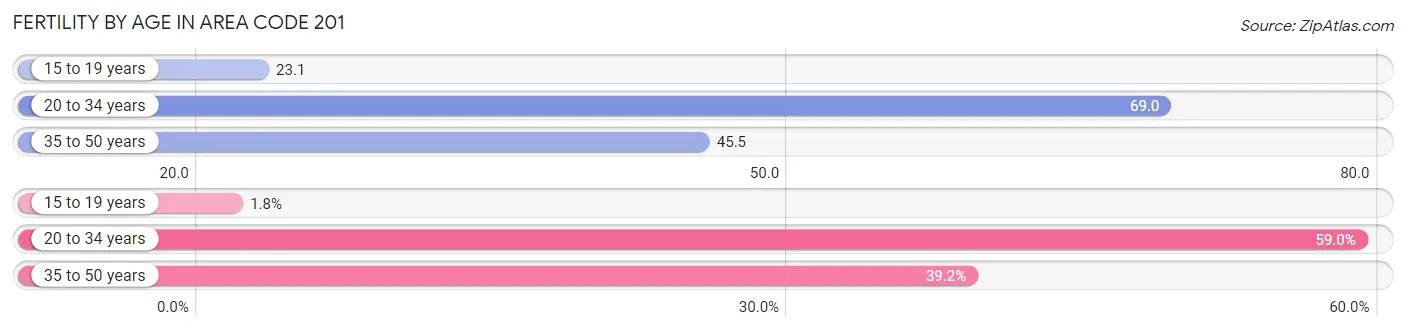
| Age Bracket | Women with Births | Births / 1,000 Women |
| 15 to 19 years | 302 (1.8%) | 23.1 |
| 20 to 34 years | 9,962 (59.0%) | 69.0 |
| 35 to 50 years | 6,615 (39.2%) | 45.5 |
| Total | 16,879 (100.0%) | 47.6 |
Fertility by Age by Marriage Status in Area Code 201
75.9% of women with births (16,879) in Area Code 201 are married. The highest percentage of unmarried women with births falls into 15 to 19 years age bracket with 99.0% of them unmarried at the time of birth, while the lowest percentage of unmarried women with births belong to 35 to 50 years age bracket with 28.6% of them unmarried.
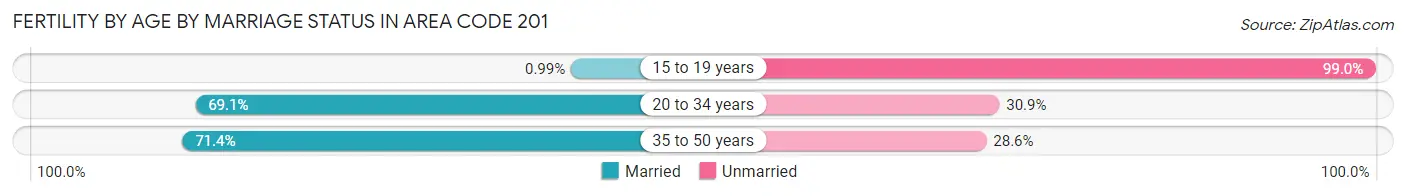
| Age Bracket | Married | Unmarried |
| 15 to 19 years | 3 (1.0%) | 299 (99.0%) |
| 20 to 34 years | 6,882 (69.1%) | 3,080 (30.9%) |
| 35 to 50 years | 4,725 (71.4%) | 1,890 (28.6%) |
| Total | 12,816 (75.9%) | 4,063 (24.1%) |
Fertility by Education in Area Code 201
Average fertility rate in Area Code 201 is 47.6 births per 1,000 women. Women with the education attainment of graduate degree have the highest fertility rate of 84.4 births per 1,000 women, while women with the education attainment of less than high school have the lowest fertility at 36.3 births per 1,000 women. Women with the education attainment of bachelor's degree represent 29.7% of all women with births.
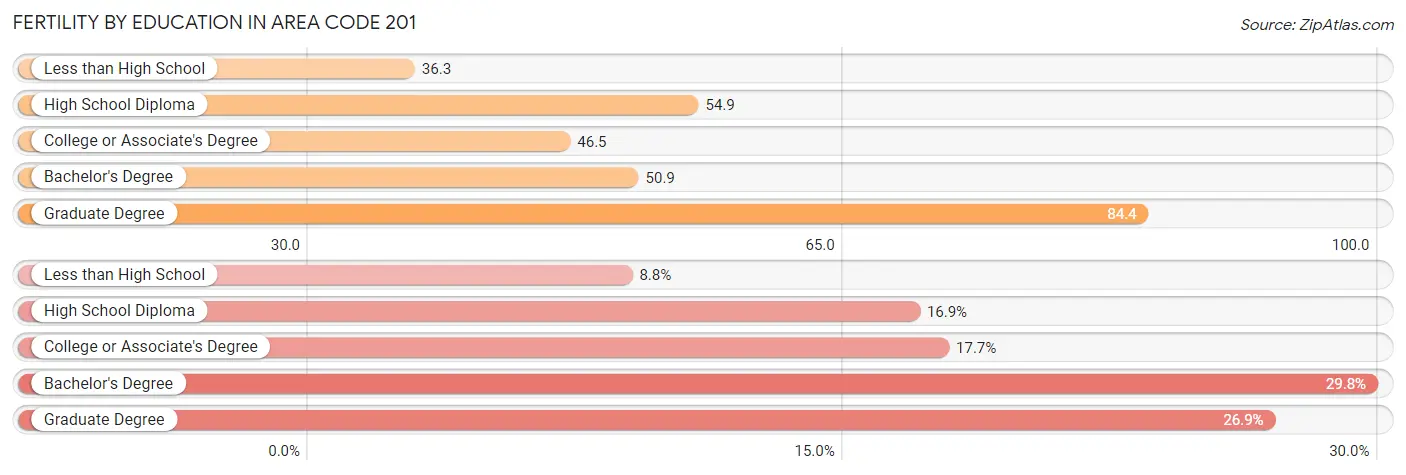
| Educational Attainment | Women with Births | Births / 1,000 Women |
| Less than High School | 1,486 (8.8%) | 36.3 |
| High School Diploma | 2,849 (16.9%) | 54.9 |
| College or Associate's Degree | 2,988 (17.7%) | 46.5 |
| Bachelor's Degree | 5,021 (29.7%) | 50.9 |
| Graduate Degree | 4,535 (26.9%) | 84.4 |
| Total | 16,879 (100.0%) | 47.6 |
Fertility by Education by Marriage Status in Area Code 201
24.1% of women with births in Area Code 201 are unmarried. Women with the educational attainment of graduate degree are most likely to be married with 71.6% of them married at childbirth, while women with the educational attainment of less than high school are least likely to be married with 75.5% of them unmarried at childbirth.
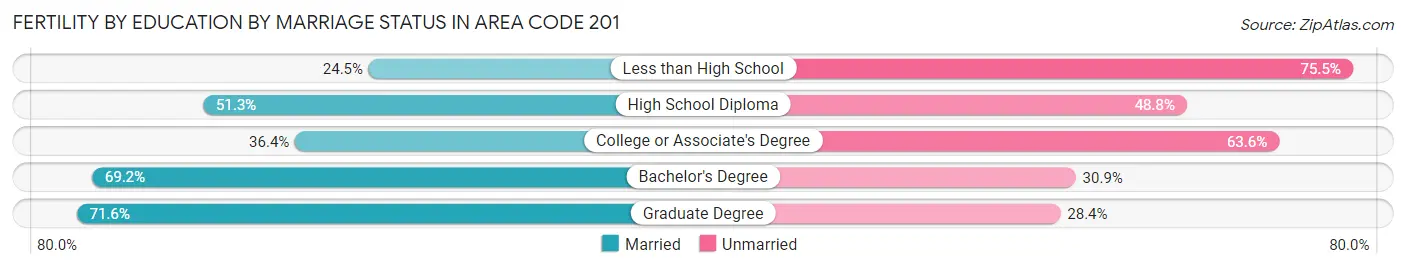
| Educational Attainment | Married | Unmarried |
| Less than High School | 364 (24.5%) | 1,122 (75.5%) |
| High School Diploma | 1,460 (51.2%) | 1,389 (48.7%) |
| College or Associate's Degree | 1,087 (36.4%) | 1,901 (63.6%) |
| Bachelor's Degree | 3,472 (69.2%) | 1,549 (30.8%) |
| Graduate Degree | 3,248 (71.6%) | 1,287 (28.4%) |
| Total | 12,816 (75.9%) | 4,063 (24.1%) |
Employment Characteristics in Area Code 201
Employment by Class of Employer in Area Code 201
Among the 670,106 employed individuals in Area Code 201, private company employees (483,828 | 72.2%), local government employees (47,925 | 7.1%), and not-for-profit organizations (47,816 | 7.1%) make up the most common classes of employment.
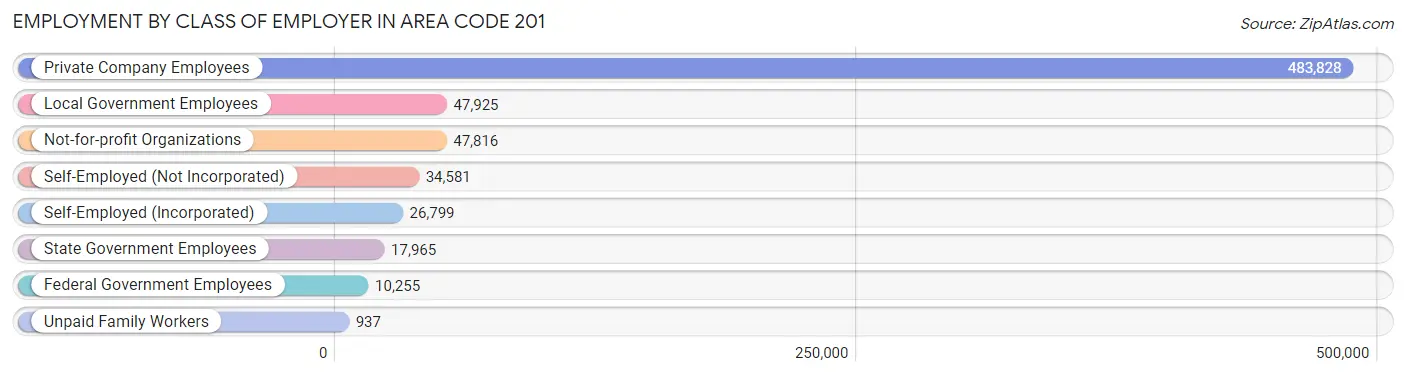
| Employer Class | # Employees | % Employees |
| Private Company Employees | 483,828 | 72.2% |
| Self-Employed (Incorporated) | 26,799 | 4.0% |
| Self-Employed (Not Incorporated) | 34,581 | 5.2% |
| Not-for-profit Organizations | 47,816 | 7.1% |
| Local Government Employees | 47,925 | 7.1% |
| State Government Employees | 17,965 | 2.7% |
| Federal Government Employees | 10,255 | 1.5% |
| Unpaid Family Workers | 937 | 0.1% |
| Total | 670,106 | 100.0% |
Employment Status by Age in Area Code 201
According to the labor force statistics for Area Code 201, out of the total population over 16 years of age (1,085,372), 67.6% or 733,711 individuals are in the labor force, with 5.8% or 42,775 of them unemployed. The age group with the highest labor force participation rate is 30 to 34 years, with 87.8% or 94,779 individuals in the labor force. Within the labor force, the 16 to 19 years age range has the highest percentage of unemployed individuals, with 787.4% or 141,354 of them being unemployed.
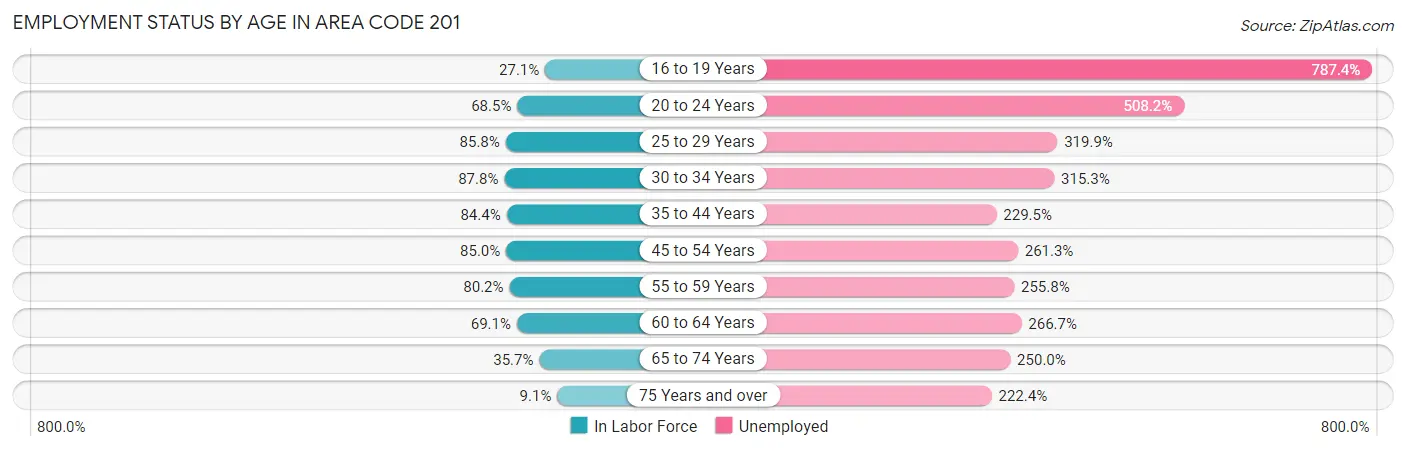
| Age Bracket | In Labor Force | Unemployed |
| 16 to 19 Years | 17,951 (27.1%) | 141,354 (787.4%) |
| 20 to 24 Years | 57,274 (68.4%) | 291,061 (508.2%) |
| 25 to 29 Years | 87,675 (85.8%) | 280,469 (319.9%) |
| 30 to 34 Years | 94,776 (87.8%) | 298,838 (315.3%) |
| 35 to 44 Years | 162,555 (84.4%) | 373,064 (229.5%) |
| 45 to 54 Years | 149,080 (85.0%) | 389,564 (261.3%) |
| 55 to 59 Years | 71,184 (80.2%) | 182,078 (255.8%) |
| 60 to 64 Years | 52,384 (69.1%) | 139,716 (266.7%) |
| 65 to 74 Years | 39,709 (35.7%) | 99,272 (250.0%) |
| 75 Years and over | 7,380 (9.0%) | 16,409 (222.4%) |
| Total | 733,733 (67.6%) | 42,742 (5.8%) |
Employment Status by Educational Attainment in Area Code 201
According to labor force statistics for Area Code 201, 83.0% of individuals (616,392) out of the total population between 25 and 64 years of age (742,731) are in the labor force, with 261.4% or 1,611,249 of them being unemployed. The group with the highest labor force participation rate are those with the educational attainment of bachelor's degree or higher, with 87.2% or 314,791 individuals in the labor force. Within the labor force, individuals with less than high school education have the highest percentage of unemployment, with 396.4% or 195,937 of them being unemployed.
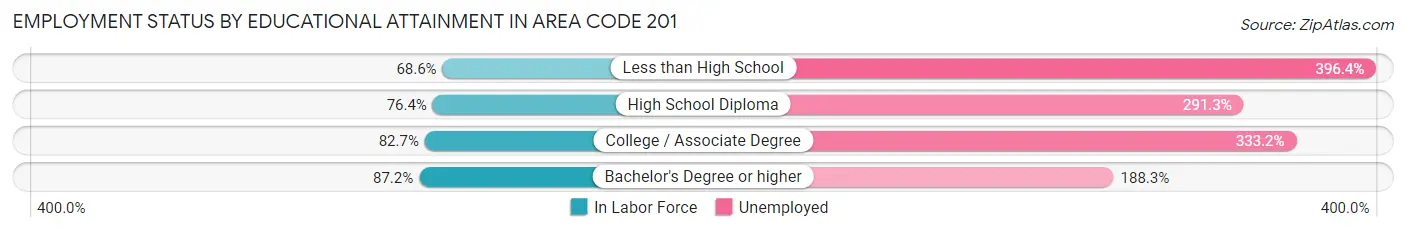
| Educational Attainment | In Labor Force | Unemployed |
| Less than High School | 49,429 (68.6%) | 285,582 (396.4%) |
| High School Diploma | 128,167 (76.3%) | 489,023 (291.3%) |
| College / Associate Degree | 117,083 (82.7%) | 471,964 (333.2%) |
| Bachelor's Degree or higher | 314,801 (87.2%) | 680,074 (188.3%) |
| Total | 616,408 (83.0%) | 1,941,499 (261.4%) |
Employment Occupations by Sex in Area Code 201
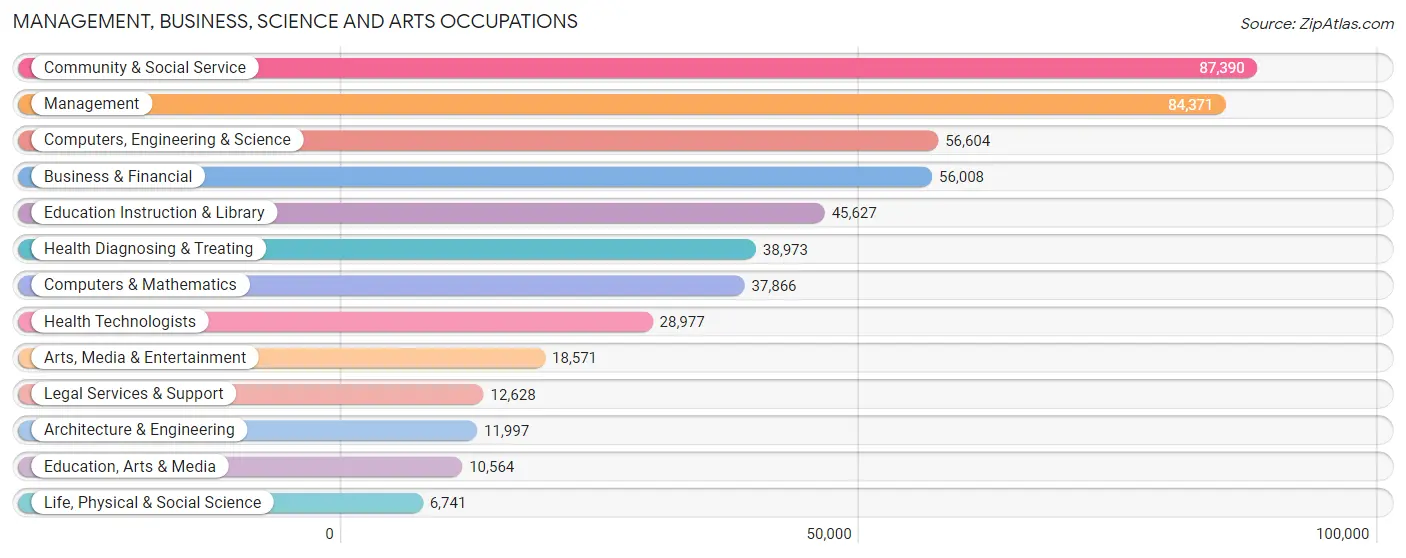
Management, Business, Science and Arts Occupations
The most common Management, Business, Science and Arts occupations in Area Code 201 are Community & Social Service (87,390 | 12.8%), Management (84,371 | 12.3%), Computers, Engineering & Science (56,604 | 8.3%), Business & Financial (56,008 | 8.2%), and Education Instruction & Library (45,627 | 6.7%).
Management, Business, Science and Arts Occupations by Sex
Within the Management, Business, Science and Arts occupations in Area Code 201, the most male-oriented occupations are Architecture & Engineering (84.1%), Computers & Mathematics (76.9%), and Computers, Engineering & Science (75.2%), while the most female-oriented occupations are Education Instruction & Library (73.6%), Health Diagnosing & Treating (67.9%), and Health Technologists (67.9%).
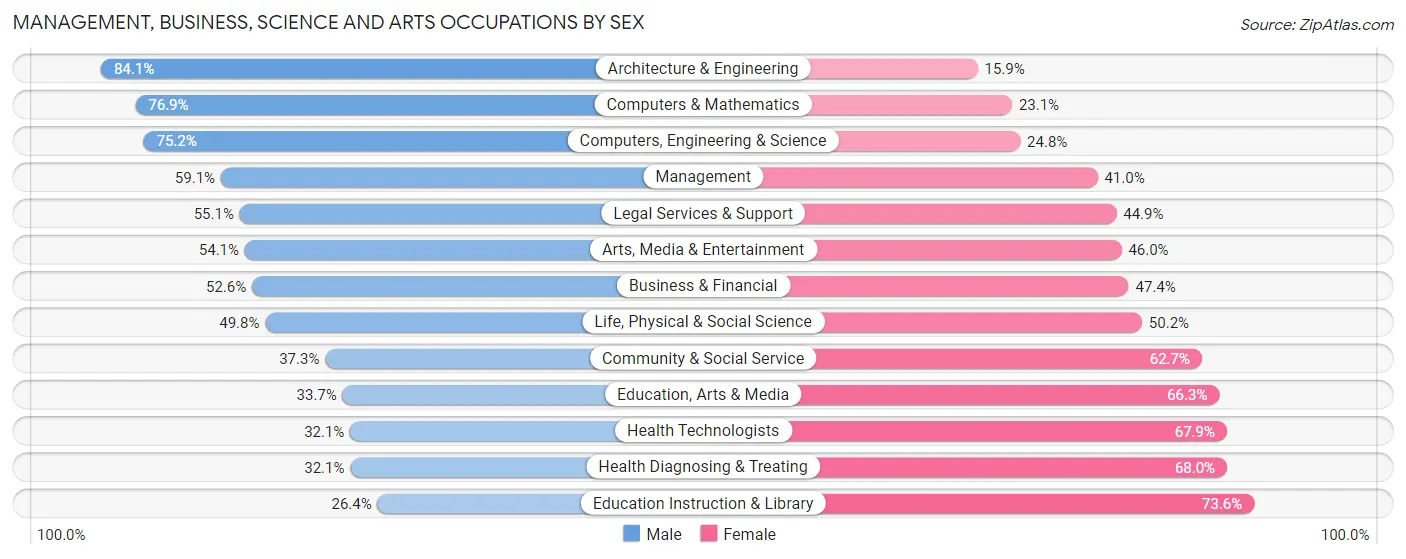
| Occupation | Male | Female |
| Management | 49,817 (59.1%) | 34,554 (40.9%) |
| Business & Financial | 29,438 (52.6%) | 26,570 (47.4%) |
| Computers, Engineering & Science | 42,556 (75.2%) | 14,048 (24.8%) |
| Computers & Mathematics | 29,115 (76.9%) | 8,751 (23.1%) |
| Architecture & Engineering | 10,085 (84.1%) | 1,912 (15.9%) |
| Life, Physical & Social Science | 3,356 (49.8%) | 3,385 (50.2%) |
| Community & Social Service | 32,588 (37.3%) | 54,802 (62.7%) |
| Education, Arts & Media | 3,556 (33.7%) | 7,008 (66.3%) |
| Legal Services & Support | 6,960 (55.1%) | 5,668 (44.9%) |
| Education Instruction & Library | 12,035 (26.4%) | 33,592 (73.6%) |
| Arts, Media & Entertainment | 10,037 (54.0%) | 8,534 (46.0%) |
| Health Diagnosing & Treating | 12,489 (32.1%) | 26,484 (67.9%) |
| Health Technologists | 9,297 (32.1%) | 19,680 (67.9%) |
| Total (Category) | 166,888 (51.6%) | 156,458 (48.4%) |
| Total (Overall) | 371,311 (54.2%) | 313,280 (45.8%) |
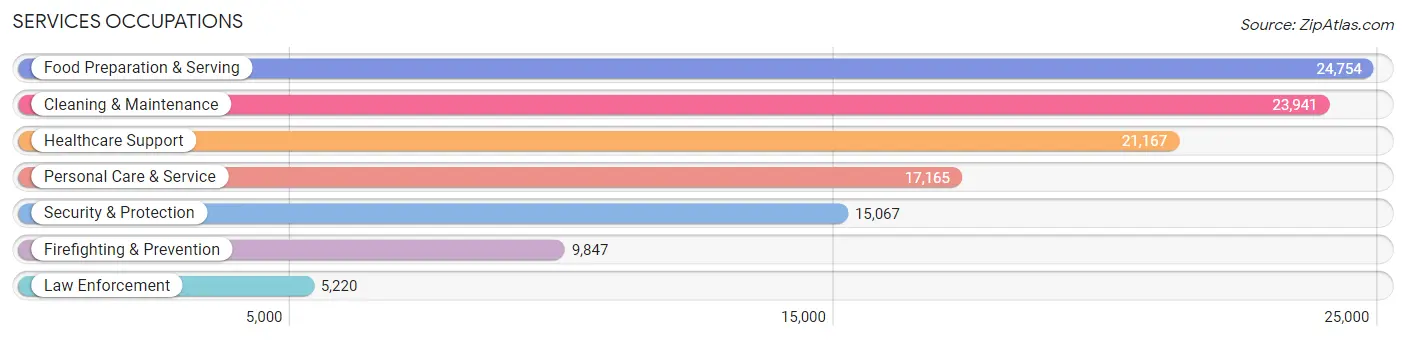
Services Occupations
The most common Services occupations in Area Code 201 are Food Preparation & Serving (24,754 | 3.6%), Cleaning & Maintenance (23,941 | 3.5%), Healthcare Support (21,167 | 3.1%), Personal Care & Service (17,165 | 2.5%), and Security & Protection (15,067 | 2.2%).
Services Occupations by Sex
Within the Services occupations in Area Code 201, the most male-oriented occupations are Law Enforcement (85.6%), Security & Protection (75.2%), and Firefighting & Prevention (69.7%), while the most female-oriented occupations are Healthcare Support (87.1%), Personal Care & Service (75.3%), and Cleaning & Maintenance (50.3%).
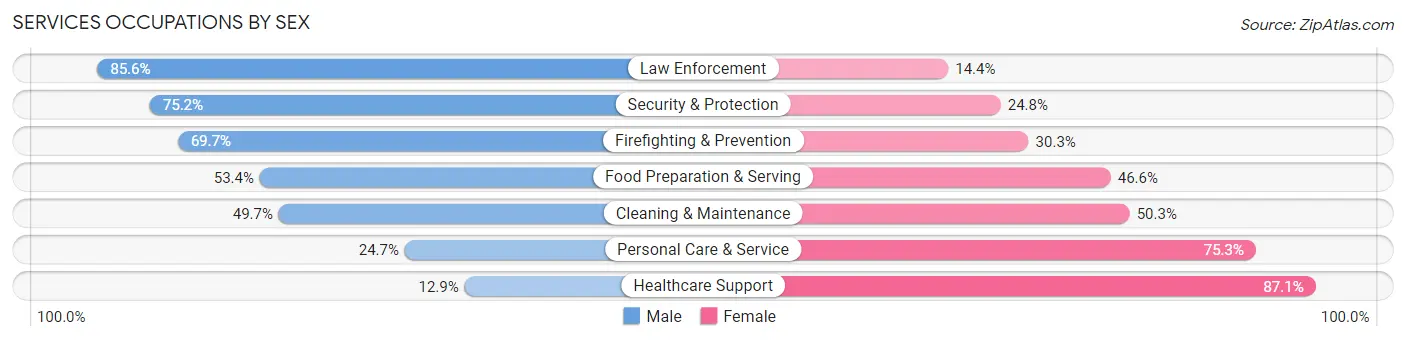
| Occupation | Male | Female |
| Healthcare Support | 2,728 (12.9%) | 18,439 (87.1%) |
| Security & Protection | 11,329 (75.2%) | 3,738 (24.8%) |
| Firefighting & Prevention | 6,861 (69.7%) | 2,986 (30.3%) |
| Law Enforcement | 4,468 (85.6%) | 752 (14.4%) |
| Food Preparation & Serving | 13,223 (53.4%) | 11,531 (46.6%) |
| Cleaning & Maintenance | 11,888 (49.7%) | 12,053 (50.3%) |
| Personal Care & Service | 4,242 (24.7%) | 12,923 (75.3%) |
| Total (Category) | 43,410 (42.5%) | 58,684 (57.5%) |
| Total (Overall) | 371,311 (54.2%) | 313,280 (45.8%) |
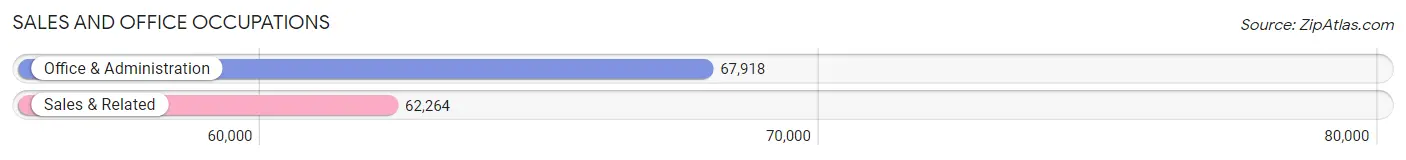
Sales and Office Occupations
The most common Sales and Office occupations in Area Code 201 are Office & Administration (67,918 | 9.9%), and Sales & Related (62,264 | 9.1%).
Sales and Office Occupations by Sex
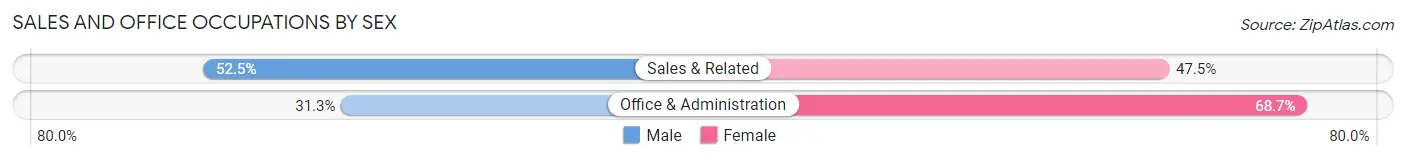
| Occupation | Male | Female |
| Sales & Related | 32,712 (52.5%) | 29,552 (47.5%) |
| Office & Administration | 21,245 (31.3%) | 46,673 (68.7%) |
| Total (Category) | 53,957 (41.4%) | 76,225 (58.6%) |
| Total (Overall) | 371,311 (54.2%) | 313,280 (45.8%) |
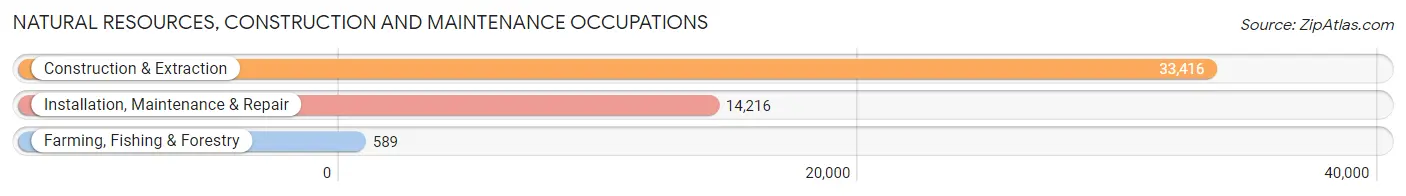
Natural Resources, Construction and Maintenance Occupations
The most common Natural Resources, Construction and Maintenance occupations in Area Code 201 are Construction & Extraction (33,416 | 4.9%), Installation, Maintenance & Repair (14,216 | 2.1%), and Farming, Fishing & Forestry (589 | 0.1%).
Natural Resources, Construction and Maintenance Occupations by Sex
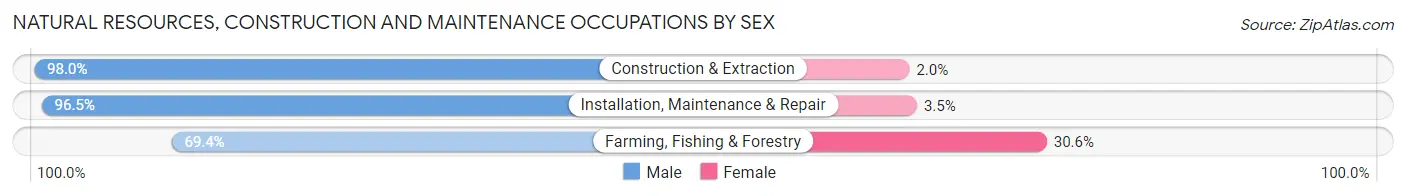
| Occupation | Male | Female |
| Farming, Fishing & Forestry | 409 (69.4%) | 180 (30.6%) |
| Construction & Extraction | 32,756 (98.0%) | 660 (2.0%) |
| Installation, Maintenance & Repair | 13,713 (96.5%) | 503 (3.5%) |
| Total (Category) | 46,878 (97.2%) | 1,343 (2.8%) |
| Total (Overall) | 371,311 (54.2%) | 313,280 (45.8%) |
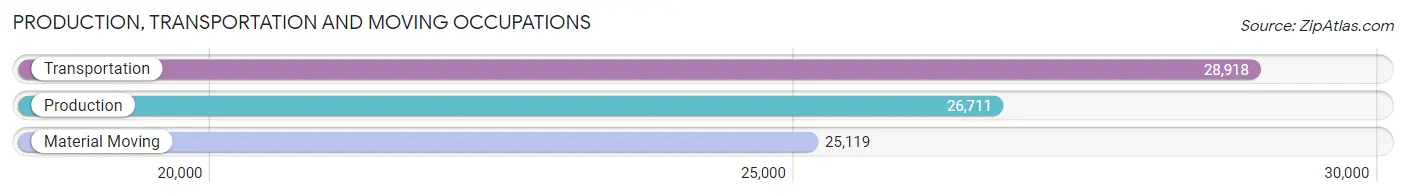
Production, Transportation and Moving Occupations
The most common Production, Transportation and Moving occupations in Area Code 201 are Transportation (28,918 | 4.2%), Production (26,711 | 3.9%), and Material Moving (25,119 | 3.7%).
Production, Transportation and Moving Occupations by Sex
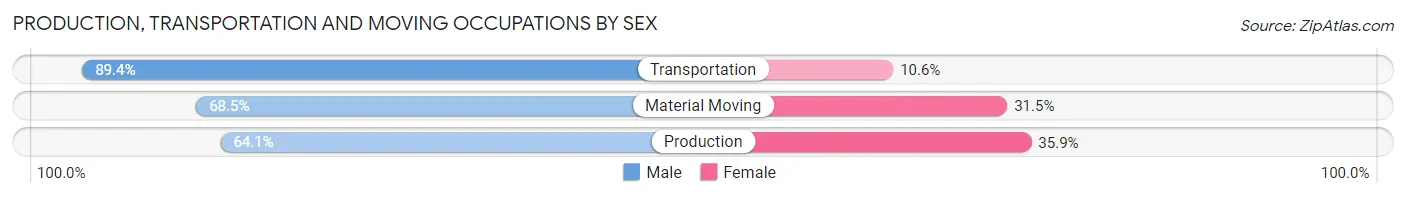
| Occupation | Male | Female |
| Production | 17,112 (64.1%) | 9,599 (35.9%) |
| Transportation | 25,859 (89.4%) | 3,059 (10.6%) |
| Material Moving | 17,207 (68.5%) | 7,912 (31.5%) |
| Total (Category) | 60,178 (74.5%) | 20,570 (25.5%) |
| Total (Overall) | 371,311 (54.2%) | 313,280 (45.8%) |
Employment Industries by Sex in Area Code 201
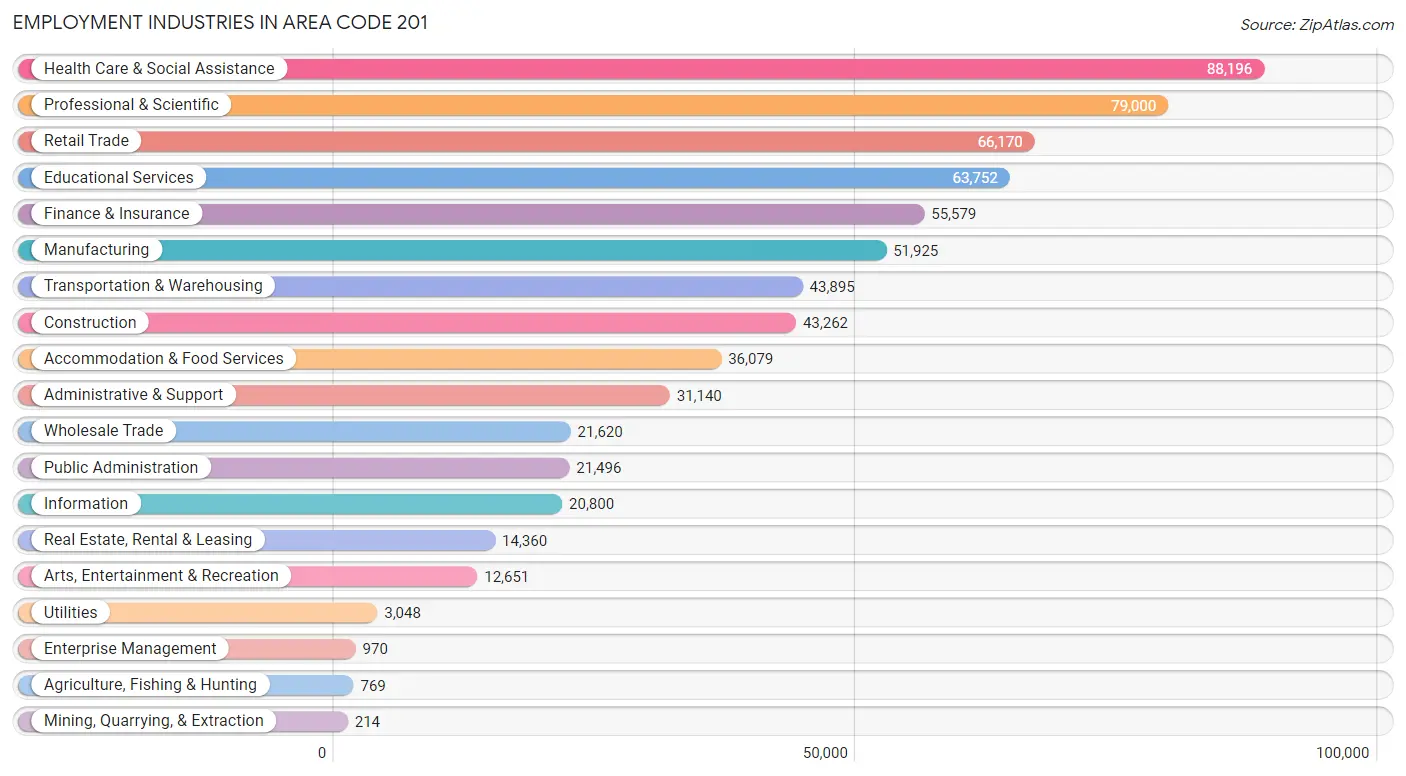
Employment Industries in Area Code 201
The major employment industries in Area Code 201 include Health Care & Social Assistance (88,196 | 12.9%), Professional & Scientific (79,000 | 11.5%), Retail Trade (66,170 | 9.7%), Educational Services (63,752 | 9.3%), and Finance & Insurance (55,579 | 8.1%).
Employment Industries by Sex in Area Code 201
The Area Code 201 industries that see more men than women are Construction (92.4%), Mining, Quarrying, & Extraction (84.6%), and Transportation & Warehousing (75.9%), whereas the industries that tend to have a higher number of women are Health Care & Social Assistance (74.8%), Educational Services (66.6%), and Enterprise Management (60.6%).
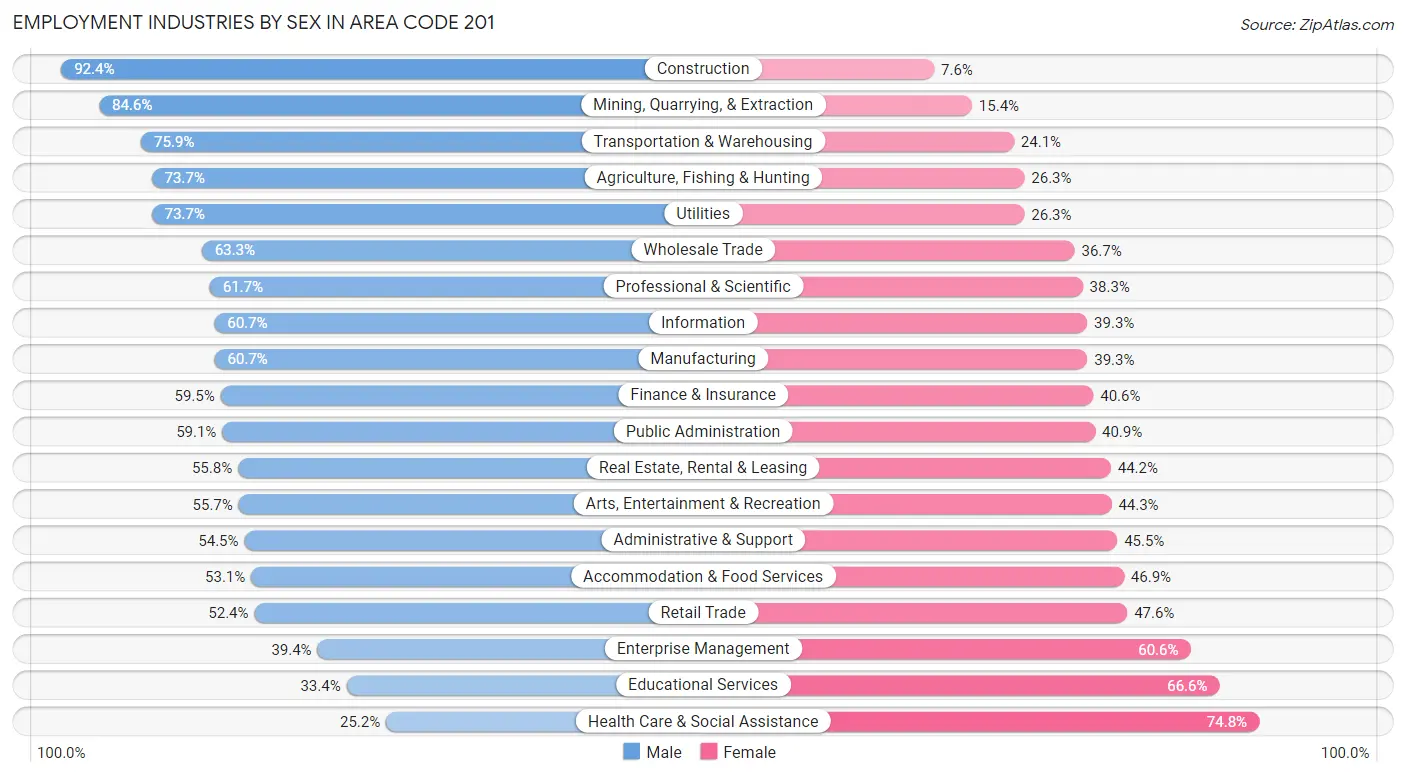
| Industry | Male | Female |
| Agriculture, Fishing & Hunting | 567 (73.7%) | 202 (26.3%) |
| Mining, Quarrying, & Extraction | 181 (84.6%) | 33 (15.4%) |
| Construction | 39,978 (92.4%) | 3,284 (7.6%) |
| Manufacturing | 31,519 (60.7%) | 20,406 (39.3%) |
| Wholesale Trade | 13,692 (63.3%) | 7,928 (36.7%) |
| Retail Trade | 34,697 (52.4%) | 31,473 (47.6%) |
| Transportation & Warehousing | 33,310 (75.9%) | 10,585 (24.1%) |
| Utilities | 2,247 (73.7%) | 801 (26.3%) |
| Information | 12,631 (60.7%) | 8,169 (39.3%) |
| Finance & Insurance | 33,040 (59.5%) | 22,539 (40.6%) |
| Real Estate, Rental & Leasing | 8,017 (55.8%) | 6,343 (44.2%) |
| Professional & Scientific | 48,709 (61.7%) | 30,291 (38.3%) |
| Enterprise Management | 382 (39.4%) | 588 (60.6%) |
| Administrative & Support | 16,974 (54.5%) | 14,166 (45.5%) |
| Educational Services | 21,283 (33.4%) | 42,469 (66.6%) |
| Health Care & Social Assistance | 22,219 (25.2%) | 65,977 (74.8%) |
| Arts, Entertainment & Recreation | 7,046 (55.7%) | 5,605 (44.3%) |
| Accommodation & Food Services | 19,165 (53.1%) | 16,914 (46.9%) |
| Public Administration | 12,705 (59.1%) | 8,791 (40.9%) |
| Total | 371,311 (54.2%) | 313,280 (45.8%) |
Education in Area Code 201
School Enrollment in Area Code 201
The most common levels of schooling among the 331,796 students in Area Code 201 are middle school (69,093 | 20.8%), high school (67,773 | 20.4%), and college / undergraduate (66,618 | 20.1%).
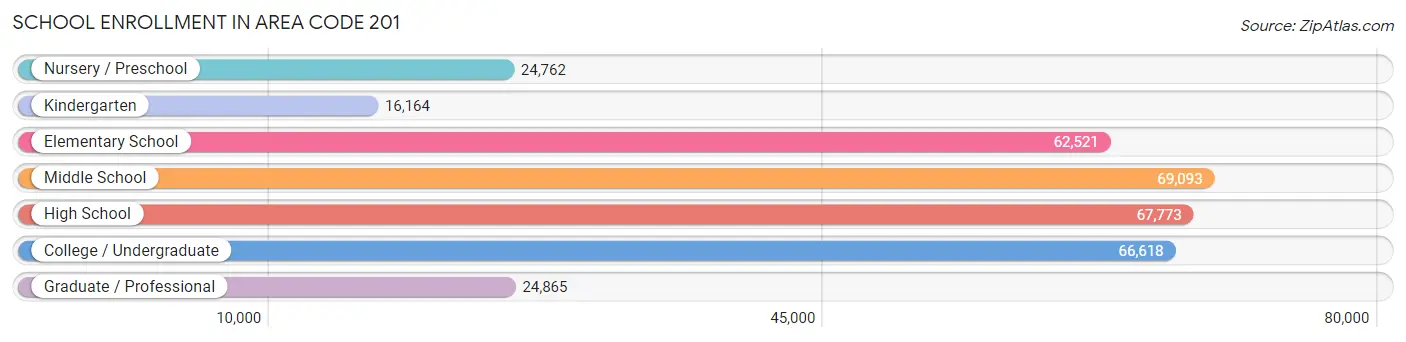
| School Level | # Students | % Students |
| Nursery / Preschool | 24,762 | 7.5% |
| Kindergarten | 16,164 | 4.9% |
| Elementary School | 62,521 | 18.8% |
| Middle School | 69,093 | 20.8% |
| High School | 67,773 | 20.4% |
| College / Undergraduate | 66,618 | 20.1% |
| Graduate / Professional | 24,865 | 7.5% |
| Total | 331,796 | 100.0% |
School Enrollment by Age by Funding Source in Area Code 201
Out of a total of 331,796 students who are enrolled in schools in Area Code 201, 66,098 (19.9%) attend a private institution, while the remaining 265,698 (80.1%) are enrolled in public schools. The age group of 35 years and over has the highest likelihood of being enrolled in private schools, with 7,025 (45.4% in the age bracket) enrolled. Conversely, the age group of 10 to 14 year olds has the lowest likelihood of being enrolled in a private school, with 74,117 (89.6% in the age bracket) attending a public institution.
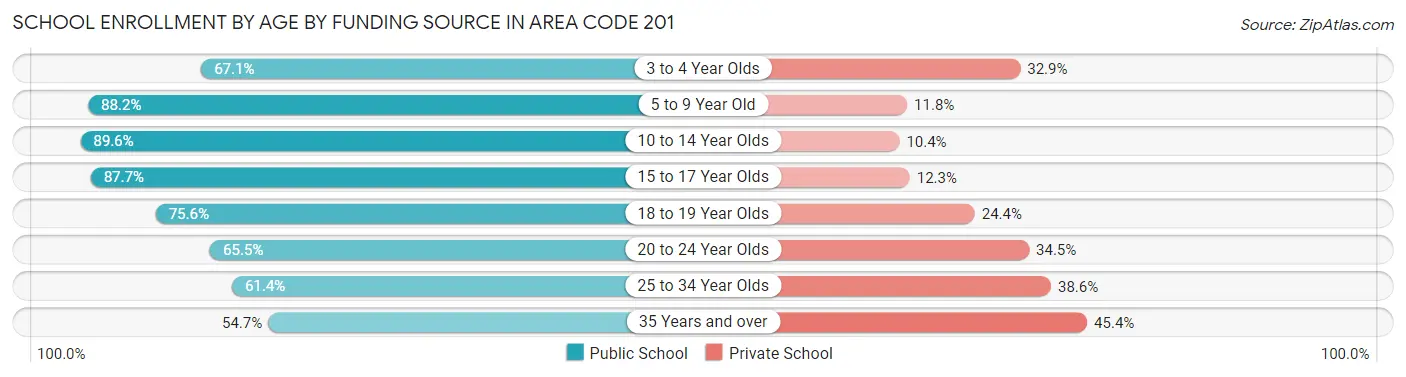
| Age Bracket | Public School | Private School |
| 3 to 4 Year Olds | 14,899 (67.1%) | 7,306 (32.9%) |
| 5 to 9 Year Old | 66,474 (88.2%) | 8,917 (11.8%) |
| 10 to 14 Year Olds | 74,117 (89.6%) | 8,596 (10.4%) |
| 15 to 17 Year Olds | 43,074 (87.7%) | 6,054 (12.3%) |
| 18 to 19 Year Olds | 20,318 (75.6%) | 6,568 (24.4%) |
| 20 to 24 Year Olds | 24,785 (65.5%) | 13,078 (34.5%) |
| 25 to 34 Year Olds | 13,574 (61.4%) | 8,545 (38.6%) |
| 35 Years and over | 8,466 (54.6%) | 7,025 (45.4%) |
| Total | 265,698 (80.1%) | 66,098 (19.9%) |
Educational Attainment by Field of Study in Area Code 201
Business (99,488 | 21.6%), social sciences (43,589 | 9.5%), engineering (40,890 | 8.9%), science & technology (38,053 | 8.3%), and education (36,339 | 7.9%) are the most common fields of study among 460,793 individuals in Area Code 201 who have obtained a bachelor's degree or higher.
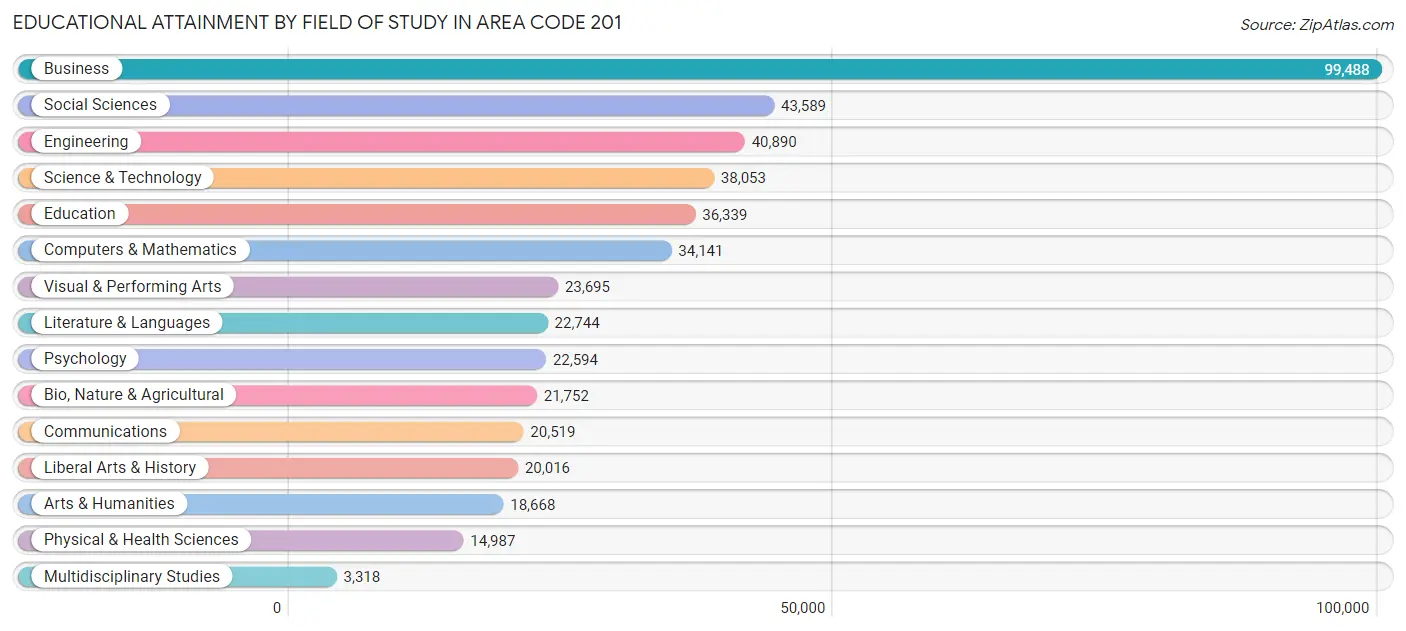
| Field of Study | # Graduates | % Graduates |
| Computers & Mathematics | 34,141 | 7.4% |
| Bio, Nature & Agricultural | 21,752 | 4.7% |
| Physical & Health Sciences | 14,987 | 3.3% |
| Psychology | 22,594 | 4.9% |
| Social Sciences | 43,589 | 9.5% |
| Engineering | 40,890 | 8.9% |
| Multidisciplinary Studies | 3,318 | 0.7% |
| Science & Technology | 38,053 | 8.3% |
| Business | 99,488 | 21.6% |
| Education | 36,339 | 7.9% |
| Literature & Languages | 22,744 | 4.9% |
| Liberal Arts & History | 20,016 | 4.3% |
| Visual & Performing Arts | 23,695 | 5.1% |
| Communications | 20,519 | 4.4% |
| Arts & Humanities | 18,668 | 4.1% |
| Total | 460,793 | 100.0% |
Transportation & Commute in Area Code 201
Vehicle Availability by Sex in Area Code 201
The most prevalent vehicle ownership categories in Area Code 201 are males with 1 vehicle (119,224, accounting for 32.8%) and females with 1 vehicle (102,802, making up 39.4%).
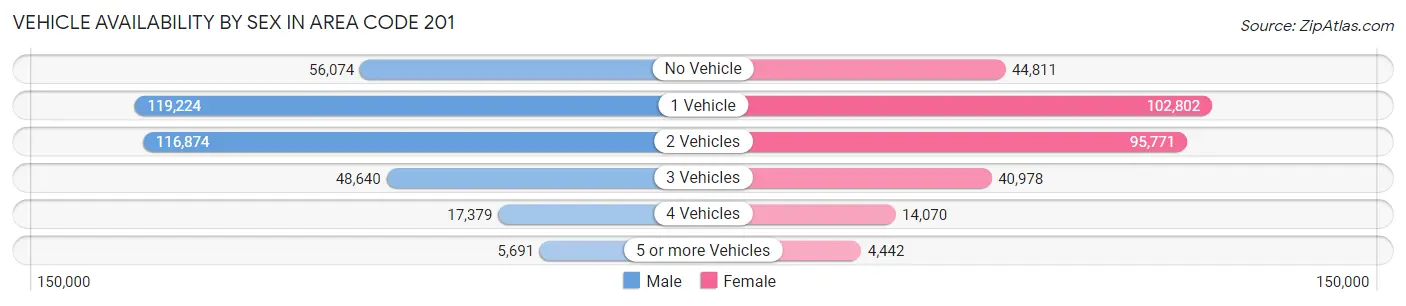
| Vehicles Available | Male | Female |
| No Vehicle | 56,074 (15.4%) | 44,811 (14.8%) |
| 1 Vehicle | 119,224 (32.8%) | 102,802 (33.9%) |
| 2 Vehicles | 116,874 (32.1%) | 95,771 (31.6%) |
| 3 Vehicles | 48,640 (13.4%) | 40,978 (13.5%) |
| 4 Vehicles | 17,379 (4.8%) | 14,070 (4.6%) |
| 5 or more Vehicles | 5,691 (1.6%) | 4,442 (1.5%) |
| Total | 363,882 (100.0%) | 302,874 (100.0%) |
Commute Time in Area Code 201
The most frequently occuring commute durations in Area Code 201 are 30 to 34 minutes (88,056 commuters, 15.3%), 20 to 24 minutes (74,989 commuters, 13.1%), and 60 to 89 minutes (70,931 commuters, 12.4%).
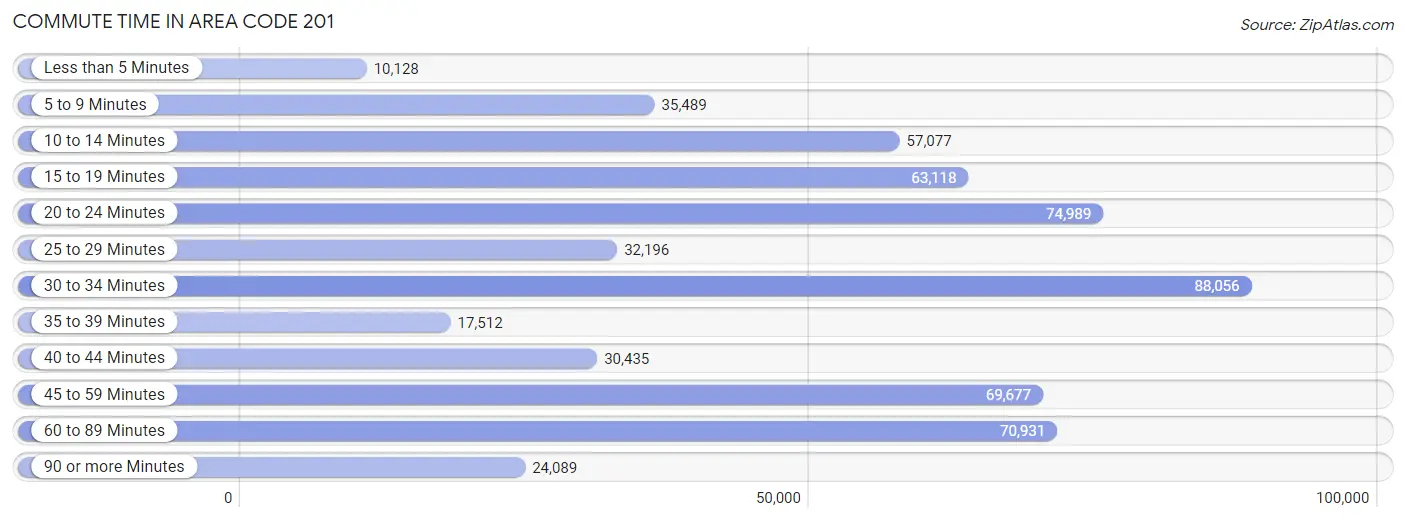
| Commute Time | # Commuters | % Commuters |
| Less than 5 Minutes | 10,128 | 1.8% |
| 5 to 9 Minutes | 35,489 | 6.2% |
| 10 to 14 Minutes | 57,077 | 10.0% |
| 15 to 19 Minutes | 63,118 | 11.0% |
| 20 to 24 Minutes | 74,989 | 13.1% |
| 25 to 29 Minutes | 32,196 | 5.6% |
| 30 to 34 Minutes | 88,056 | 15.3% |
| 35 to 39 Minutes | 17,512 | 3.0% |
| 40 to 44 Minutes | 30,435 | 5.3% |
| 45 to 59 Minutes | 69,677 | 12.1% |
| 60 to 89 Minutes | 70,931 | 12.4% |
| 90 or more Minutes | 24,089 | 4.2% |
Commute Time by Sex in Area Code 201
The most common commute times in Area Code 201 are 30 to 34 minutes (50,156 commuters, 15.9%) for males and 30 to 34 minutes (37,900 commuters, 14.7%) for females.
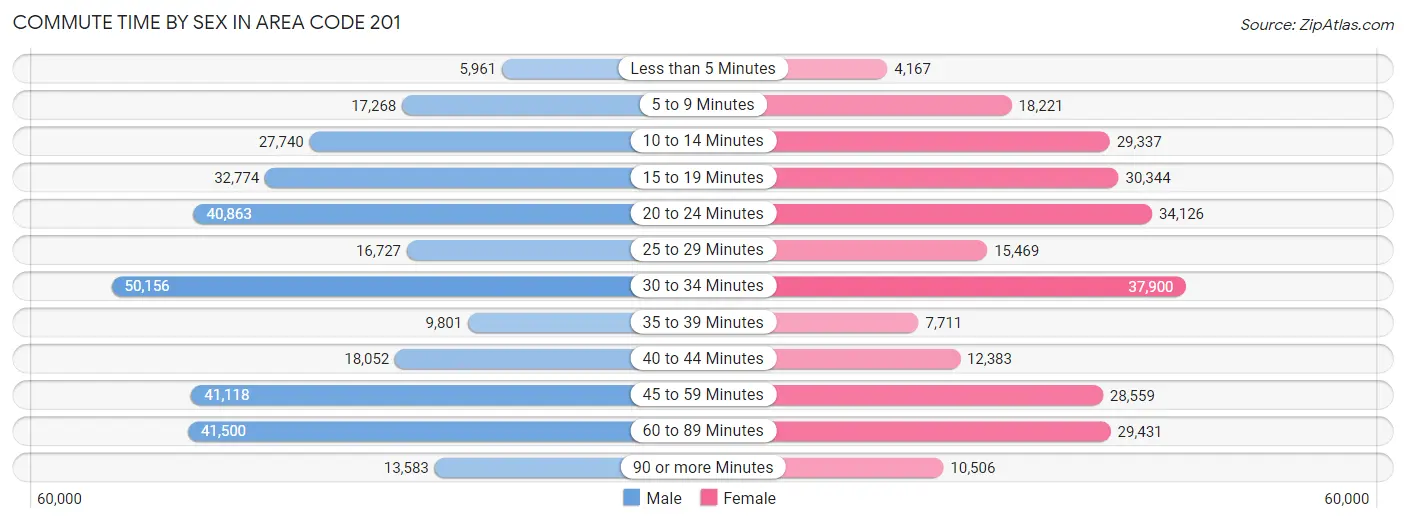
| Commute Time | Male | Female |
| Less than 5 Minutes | 5,961 (1.9%) | 4,167 (1.6%) |
| 5 to 9 Minutes | 17,268 (5.5%) | 18,221 (7.1%) |
| 10 to 14 Minutes | 27,740 (8.8%) | 29,337 (11.4%) |
| 15 to 19 Minutes | 32,774 (10.4%) | 30,344 (11.7%) |
| 20 to 24 Minutes | 40,863 (13.0%) | 34,126 (13.2%) |
| 25 to 29 Minutes | 16,727 (5.3%) | 15,469 (6.0%) |
| 30 to 34 Minutes | 50,156 (15.9%) | 37,900 (14.7%) |
| 35 to 39 Minutes | 9,801 (3.1%) | 7,711 (3.0%) |
| 40 to 44 Minutes | 18,052 (5.7%) | 12,383 (4.8%) |
| 45 to 59 Minutes | 41,118 (13.0%) | 28,559 (11.1%) |
| 60 to 89 Minutes | 41,500 (13.2%) | 29,431 (11.4%) |
| 90 or more Minutes | 13,583 (4.3%) | 10,506 (4.1%) |
Time of Departure to Work by Sex in Area Code 201
The most frequent times of departure to work in Area Code 201 are 8:00 AM to 8:29 AM (58,736, 18.6%) for males and 8:00 AM to 8:29 AM (54,638, 21.2%) for females.
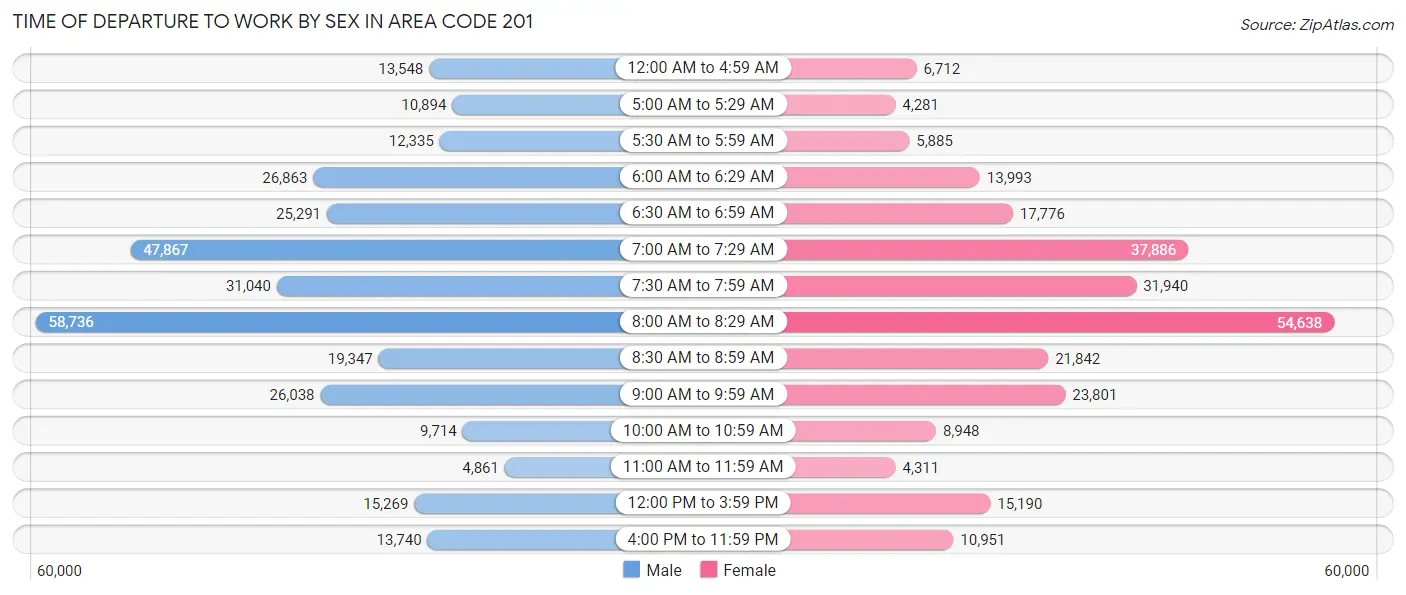
| Time of Departure | Male | Female |
| 12:00 AM to 4:59 AM | 13,548 (4.3%) | 6,712 (2.6%) |
| 5:00 AM to 5:29 AM | 10,894 (3.5%) | 4,281 (1.7%) |
| 5:30 AM to 5:59 AM | 12,335 (3.9%) | 5,885 (2.3%) |
| 6:00 AM to 6:29 AM | 26,863 (8.5%) | 13,993 (5.4%) |
| 6:30 AM to 6:59 AM | 25,291 (8.0%) | 17,776 (6.9%) |
| 7:00 AM to 7:29 AM | 47,867 (15.2%) | 37,886 (14.7%) |
| 7:30 AM to 7:59 AM | 31,040 (9.8%) | 31,940 (12.4%) |
| 8:00 AM to 8:29 AM | 58,736 (18.6%) | 54,638 (21.2%) |
| 8:30 AM to 8:59 AM | 19,347 (6.1%) | 21,842 (8.5%) |
| 9:00 AM to 9:59 AM | 26,038 (8.3%) | 23,801 (9.2%) |
| 10:00 AM to 10:59 AM | 9,714 (3.1%) | 8,948 (3.5%) |
| 11:00 AM to 11:59 AM | 4,861 (1.5%) | 4,311 (1.7%) |
| 12:00 PM to 3:59 PM | 15,269 (4.8%) | 15,190 (5.9%) |
| 4:00 PM to 11:59 PM | 13,740 (4.3%) | 10,951 (4.2%) |
| Total | 315,543 (100.0%) | 258,154 (100.0%) |
Housing Occupancy in Area Code 201
Occupancy by Ownership in Area Code 201
Of the total 508,318 dwellings in Area Code 201, owner-occupied units account for 230,470 (45.3%), while renter-occupied units make up 277,848 (54.7%).
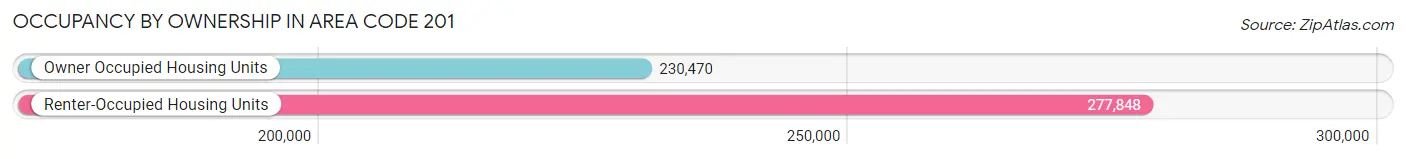
| Occupancy | # Housing Units | % Housing Units |
| Owner Occupied Housing Units | 230,470 | 45.3% |
| Renter-Occupied Housing Units | 277,848 | 54.7% |
| Total Occupied Housing Units | 508,318 | 100.0% |
Occupancy by Household Size in Area Code 201
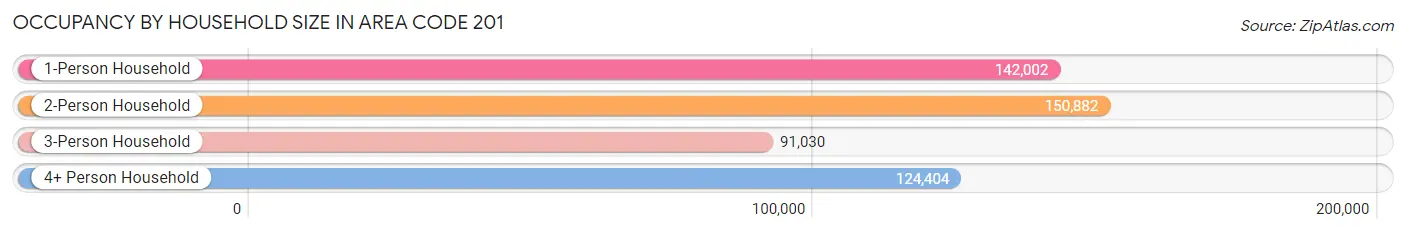
| Household Size | # Housing Units | % Housing Units |
| 1-Person Household | 142,002 | 27.9% |
| 2-Person Household | 150,882 | 29.7% |
| 3-Person Household | 91,030 | 17.9% |
| 4+ Person Household | 124,404 | 24.5% |
| Total Housing Units | 508,318 | 100.0% |
Occupancy by Ownership by Household Size in Area Code 201
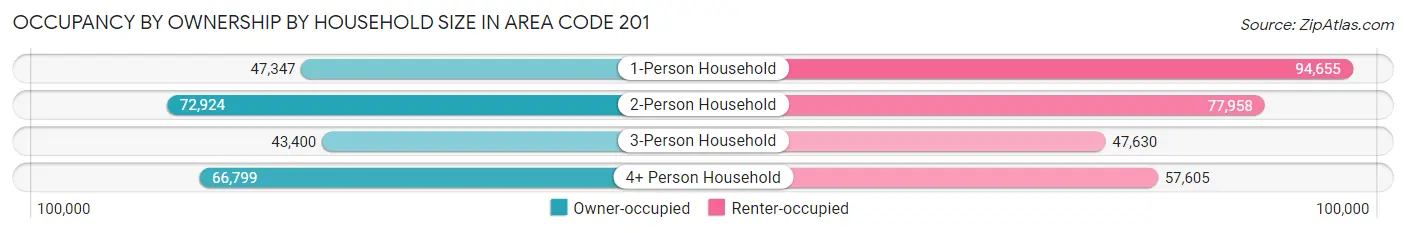
| Household Size | Owner-occupied | Renter-occupied |
| 1-Person Household | 47,347 (33.3%) | 94,655 (66.7%) |
| 2-Person Household | 72,924 (48.3%) | 77,958 (51.7%) |
| 3-Person Household | 43,400 (47.7%) | 47,630 (52.3%) |
| 4+ Person Household | 66,799 (53.7%) | 57,605 (46.3%) |
| Total Housing Units | 230,470 (45.3%) | 277,848 (54.7%) |
Occupancy by Educational Attainment in Area Code 201
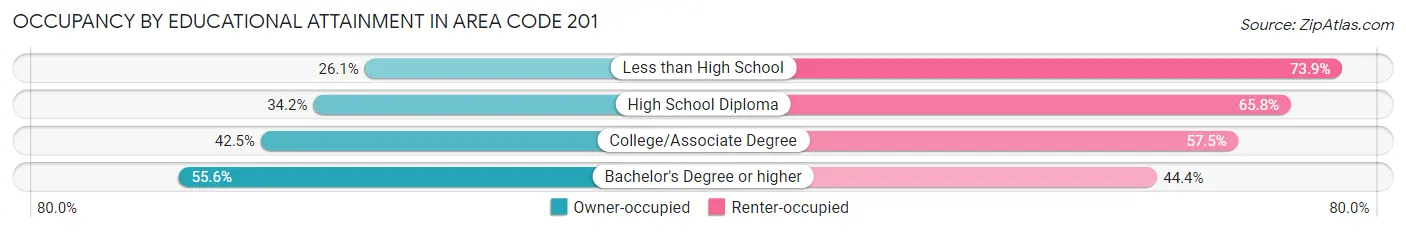
| Household Size | Owner-occupied | Renter-occupied |
| Less than High School | 13,828 (26.1%) | 39,188 (73.9%) |
| High School Diploma | 37,767 (34.2%) | 72,593 (65.8%) |
| College/Associate Degree | 41,683 (42.5%) | 56,335 (57.5%) |
| Bachelor's Degree or higher | 137,192 (55.6%) | 109,732 (44.4%) |
Occupancy by Age of Householder in Area Code 201
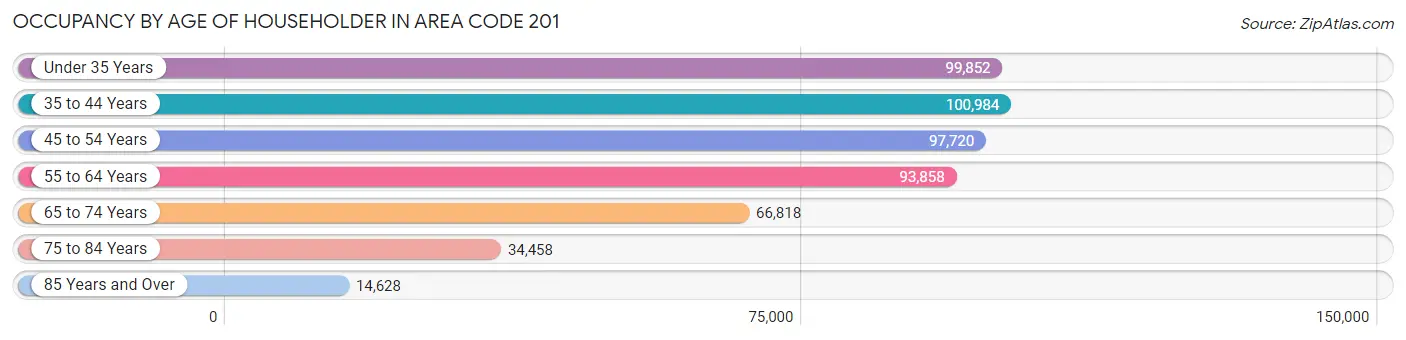
| Age Bracket | # Households | % Households |
| Under 35 Years | 99,852 | 19.6% |
| 35 to 44 Years | 100,984 | 19.9% |
| 45 to 54 Years | 97,720 | 19.2% |
| 55 to 64 Years | 93,858 | 18.5% |
| 65 to 74 Years | 66,818 | 13.1% |
| 75 to 84 Years | 34,458 | 6.8% |
| 85 Years and Over | 14,628 | 2.9% |
| Total | 508,318 | 100.0% |
Housing Finances in Area Code 201
Median Income by Occupancy in Area Code 201
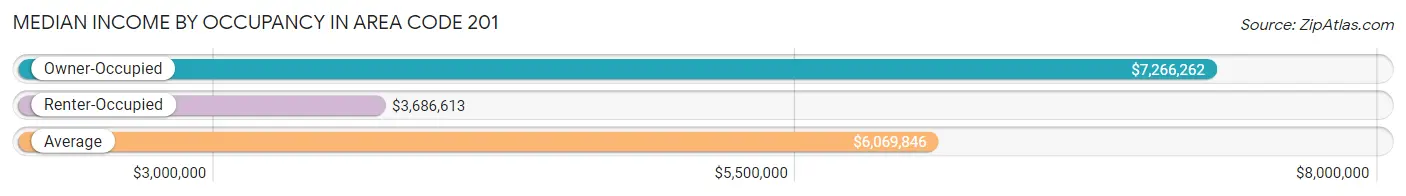
| Occupancy Type | # Households | Median Income |
| Owner-Occupied | 230,470 (45.3%) | $7,266,262 |
| Renter-Occupied | 277,848 (54.7%) | $3,686,613 |
| Average | 508,318 (100.0%) | $6,069,846 |
Occupancy by Householder Income Bracket in Area Code 201
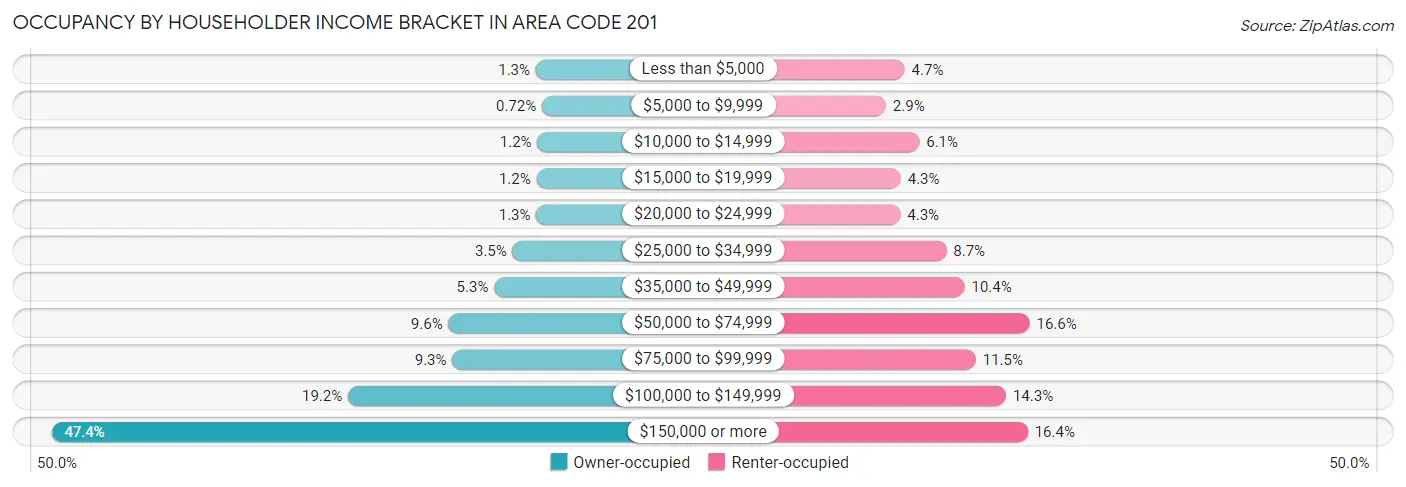
| Income Bracket | Owner-occupied | Renter-occupied |
| Less than $5,000 | 3,029 (1.3%) | 13,015 (4.7%) |
| $5,000 to $9,999 | 1,652 (0.7%) | 8,043 (2.9%) |
| $10,000 to $14,999 | 2,682 (1.2%) | 16,868 (6.1%) |
| $15,000 to $19,999 | 2,849 (1.2%) | 11,979 (4.3%) |
| $20,000 to $24,999 | 2,905 (1.3%) | 11,863 (4.3%) |
| $25,000 to $34,999 | 8,113 (3.5%) | 24,033 (8.6%) |
| $35,000 to $49,999 | 12,137 (5.3%) | 28,828 (10.4%) |
| $50,000 to $74,999 | 22,186 (9.6%) | 46,033 (16.6%) |
| $75,000 to $99,999 | 21,330 (9.3%) | 31,816 (11.5%) |
| $100,000 to $149,999 | 44,244 (19.2%) | 39,808 (14.3%) |
| $150,000 or more | 109,343 (47.4%) | 45,562 (16.4%) |
| Total | 230,470 (100.0%) | 277,848 (100.0%) |
Monthly Housing Cost Tiers in Area Code 201
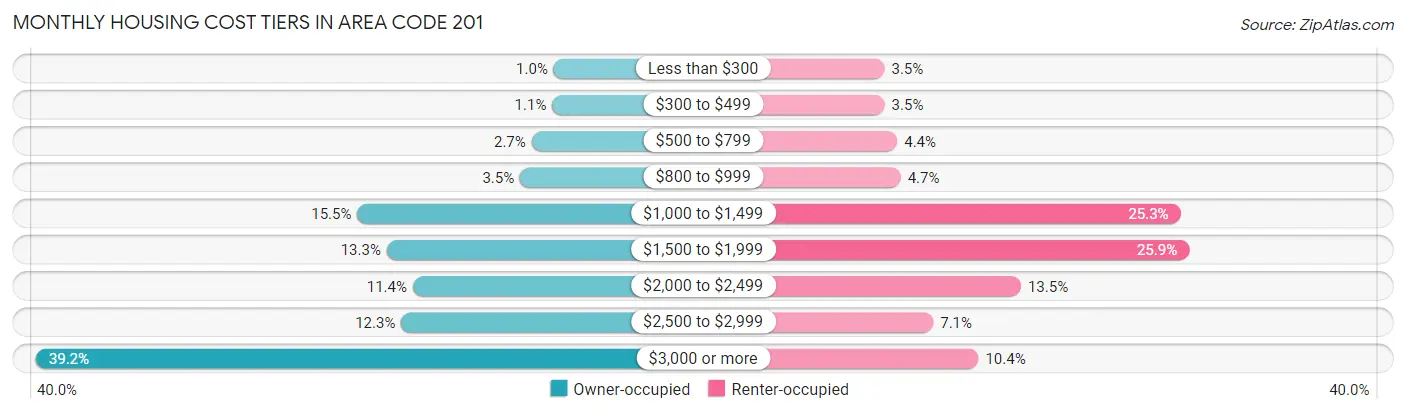
| Monthly Cost | Owner-occupied | Renter-occupied |
| Less than $300 | 2,368 (1.0%) | 9,651 (3.5%) |
| $300 to $499 | 2,625 (1.1%) | 9,674 (3.5%) |
| $500 to $799 | 6,123 (2.7%) | 12,246 (4.4%) |
| $800 to $999 | 8,087 (3.5%) | 12,940 (4.7%) |
| $1,000 to $1,499 | 35,732 (15.5%) | 70,193 (25.3%) |
| $1,500 to $1,999 | 30,712 (13.3%) | 71,939 (25.9%) |
| $2,000 to $2,499 | 26,304 (11.4%) | 37,577 (13.5%) |
| $2,500 to $2,999 | 28,248 (12.3%) | 19,617 (7.1%) |
| $3,000 or more | 90,271 (39.2%) | 28,871 (10.4%) |
| Total | 230,470 (100.0%) | 277,848 (100.0%) |
Physical Housing Characteristics in Area Code 201
Housing Structures in Area Code 201
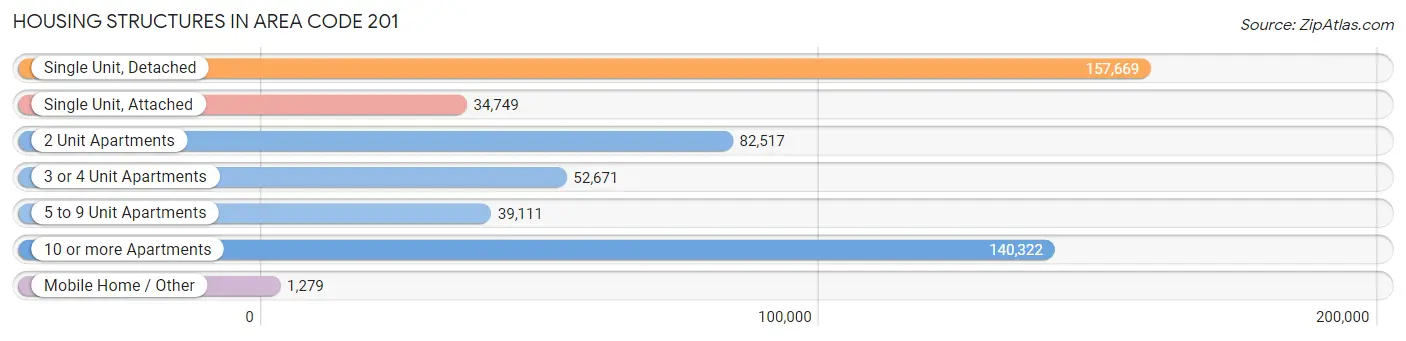
| Structure Type | # Housing Units | % Housing Units |
| Single Unit, Detached | 157,669 | 31.0% |
| Single Unit, Attached | 34,749 | 6.8% |
| 2 Unit Apartments | 82,517 | 16.2% |
| 3 or 4 Unit Apartments | 52,671 | 10.4% |
| 5 to 9 Unit Apartments | 39,111 | 7.7% |
| 10 or more Apartments | 140,322 | 27.6% |
| Mobile Home / Other | 1,279 | 0.3% |
| Total | 508,318 | 100.0% |
Housing Structures by Occupancy in Area Code 201
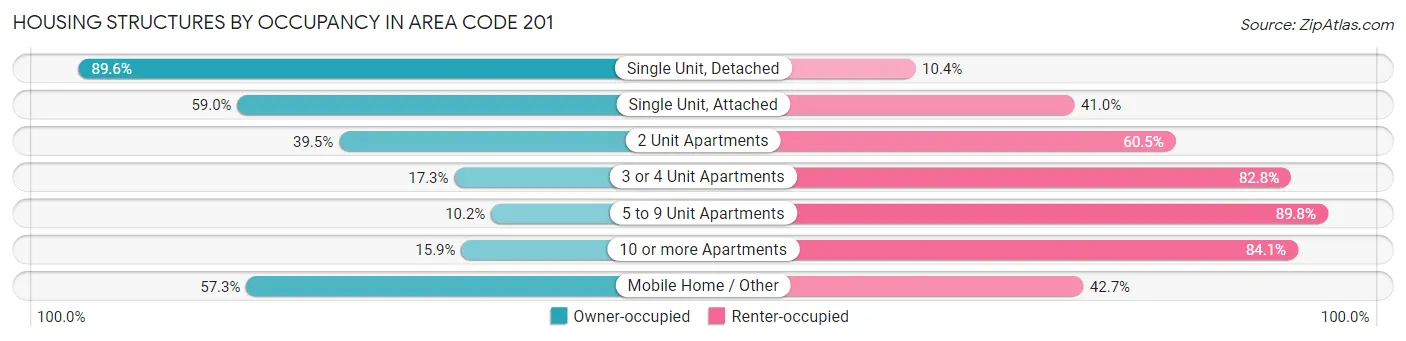
| Structure Type | Owner-occupied | Renter-occupied |
| Single Unit, Detached | 141,288 (89.6%) | 16,381 (10.4%) |
| Single Unit, Attached | 20,508 (59.0%) | 14,241 (41.0%) |
| 2 Unit Apartments | 32,559 (39.5%) | 49,958 (60.5%) |
| 3 or 4 Unit Apartments | 9,084 (17.2%) | 43,587 (82.8%) |
| 5 to 9 Unit Apartments | 3,973 (10.2%) | 35,138 (89.8%) |
| 10 or more Apartments | 22,325 (15.9%) | 117,997 (84.1%) |
| Mobile Home / Other | 733 (57.3%) | 546 (42.7%) |
| Total | 230,470 (45.3%) | 277,848 (54.7%) |
Housing Structures by Number of Rooms in Area Code 201
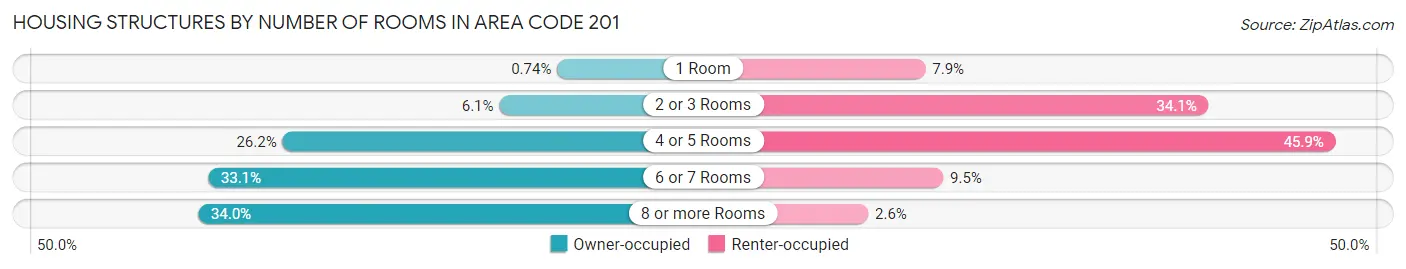
| Number of Rooms | Owner-occupied | Renter-occupied |
| 1 Room | 1,694 (0.7%) | 21,960 (7.9%) |
| 2 or 3 Rooms | 14,044 (6.1%) | 94,747 (34.1%) |
| 4 or 5 Rooms | 60,270 (26.2%) | 127,401 (45.9%) |
| 6 or 7 Rooms | 76,165 (33.1%) | 26,502 (9.5%) |
| 8 or more Rooms | 78,297 (34.0%) | 7,238 (2.6%) |
| Total | 230,470 (100.0%) | 277,848 (100.0%) |
Housing Structure by Heating Type in Area Code 201
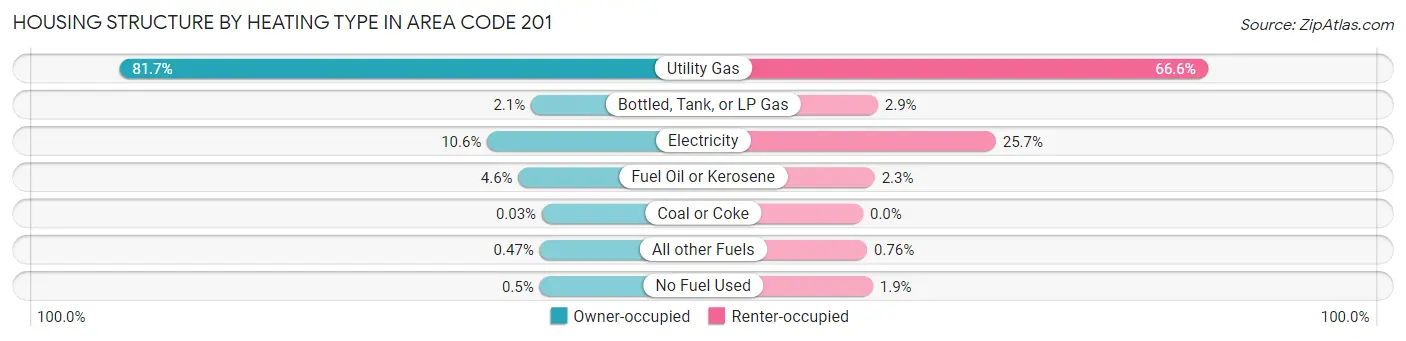
| Heating Type | Owner-occupied | Renter-occupied |
| Utility Gas | 188,290 (81.7%) | 184,927 (66.6%) |
| Bottled, Tank, or LP Gas | 4,902 (2.1%) | 7,945 (2.9%) |
| Electricity | 24,421 (10.6%) | 71,309 (25.7%) |
| Fuel Oil or Kerosene | 10,561 (4.6%) | 6,264 (2.2%) |
| Coal or Coke | 63 (0.0%) | 13 (0.0%) |
| All other Fuels | 1,076 (0.5%) | 2,112 (0.8%) |
| No Fuel Used | 1,157 (0.5%) | 5,278 (1.9%) |
| Total | 230,470 (100.0%) | 277,848 (100.0%) |
Household Vehicle Usage in Area Code 201
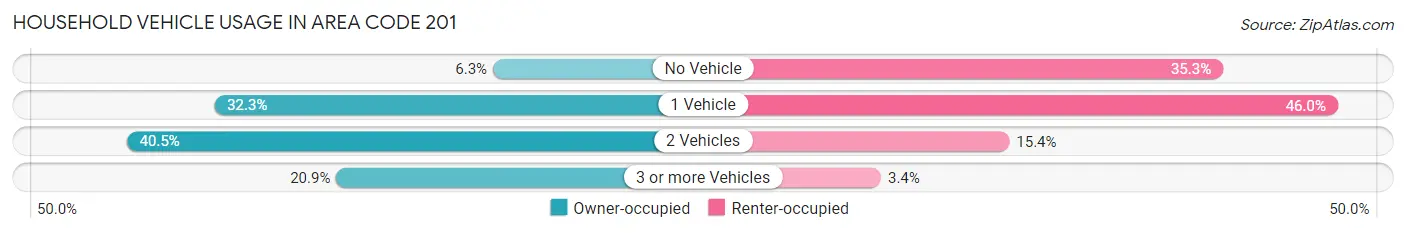
| Vehicles per Household | Owner-occupied | Renter-occupied |
| No Vehicle | 14,481 (6.3%) | 98,047 (35.3%) |
| 1 Vehicle | 74,488 (32.3%) | 127,804 (46.0%) |
| 2 Vehicles | 93,310 (40.5%) | 42,636 (15.3%) |
| 3 or more Vehicles | 48,191 (20.9%) | 9,361 (3.4%) |
| Total | 230,470 (100.0%) | 277,848 (100.0%) |
Real Estate & Mortgages in Area Code 201
Real Estate and Mortgage Overview in Area Code 201
| Characteristic | Without Mortgage | With Mortgage |
| Housing Units | 81,190 | 149,280 |
| Median Property Value | $26,057,800 | $28,430,000 |
| Median Household Income | $5,587,440 | $81,510 |
| Monthly Housing Costs | $65,104 | $87,288 |
| Real Estate Taxes | $453,645 | $2,386 |
Property Value by Mortgage Status in Area Code 201
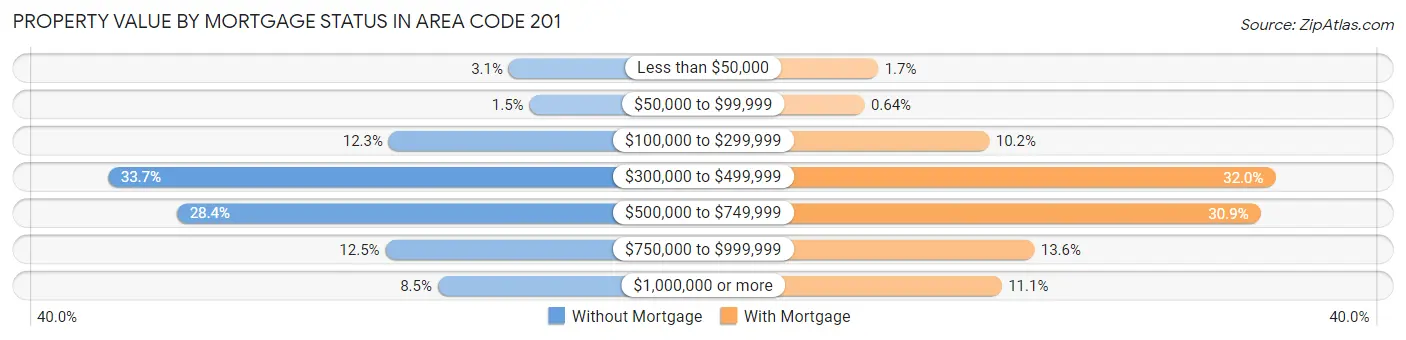
| Property Value | Without Mortgage | With Mortgage |
| Less than $50,000 | 2,522 (3.1%) | 2,529 (1.7%) |
| $50,000 to $99,999 | 1,252 (1.5%) | 960 (0.6%) |
| $100,000 to $299,999 | 9,947 (12.2%) | 15,153 (10.2%) |
| $300,000 to $499,999 | 27,327 (33.7%) | 47,743 (32.0%) |
| $500,000 to $749,999 | 23,069 (28.4%) | 46,058 (30.8%) |
| $750,000 to $999,999 | 10,159 (12.5%) | 20,272 (13.6%) |
| $1,000,000 or more | 6,914 (8.5%) | 16,565 (11.1%) |
| Total | 81,190 (100.0%) | 149,280 (100.0%) |
Household Income by Mortgage Status in Area Code 201
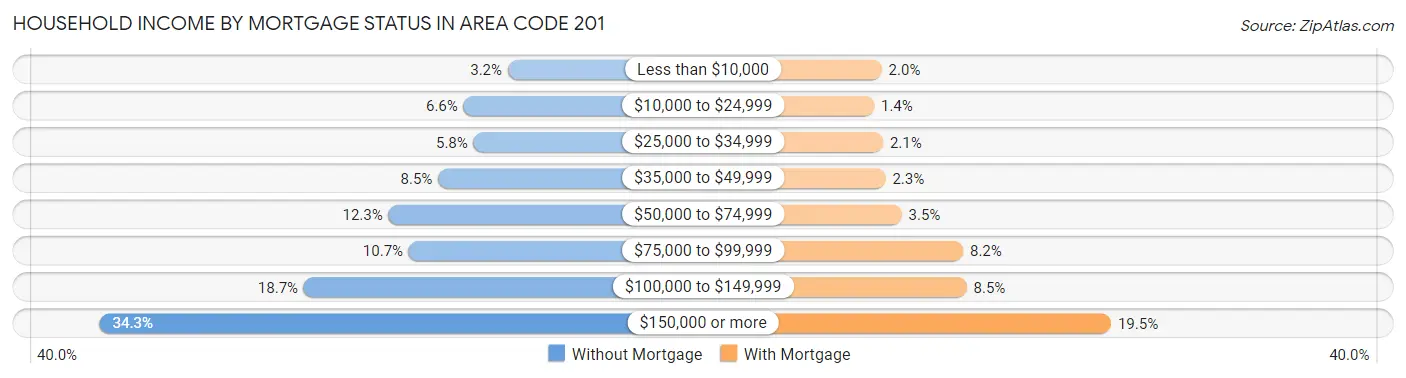
| Household Income | Without Mortgage | With Mortgage |
| Less than $10,000 | 2,580 (3.2%) | 2,975 (2.0%) |
| $10,000 to $24,999 | 5,317 (6.6%) | 2,101 (1.4%) |
| $25,000 to $34,999 | 4,703 (5.8%) | 3,119 (2.1%) |
| $35,000 to $49,999 | 6,897 (8.5%) | 3,410 (2.3%) |
| $50,000 to $74,999 | 9,962 (12.3%) | 5,240 (3.5%) |
| $75,000 to $99,999 | 8,701 (10.7%) | 12,224 (8.2%) |
| $100,000 to $149,999 | 15,197 (18.7%) | 12,629 (8.5%) |
| $150,000 or more | 27,833 (34.3%) | 29,047 (19.5%) |
| Total | 81,190 (100.0%) | 149,280 (100.0%) |
Property Value to Household Income Ratio in Area Code 201
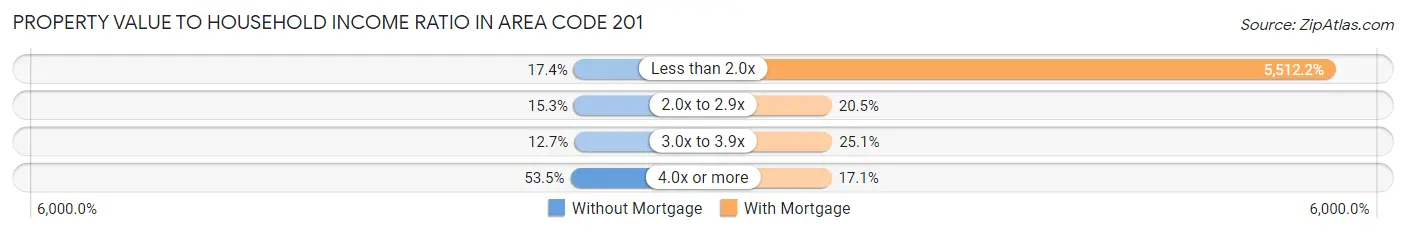
| Value-to-Income Ratio | Without Mortgage | With Mortgage |
| Less than 2.0x | 14,090 (17.3%) | 8,228,608 (5,512.2%) |
| 2.0x to 2.9x | 12,422 (15.3%) | 30,605 (20.5%) |
| 3.0x to 3.9x | 10,297 (12.7%) | 37,514 (25.1%) |
| 4.0x or more | 43,430 (53.5%) | 25,473 (17.1%) |
| Total | 81,190 (100.0%) | 149,280 (100.0%) |
Real Estate Taxes by Mortgage Status in Area Code 201
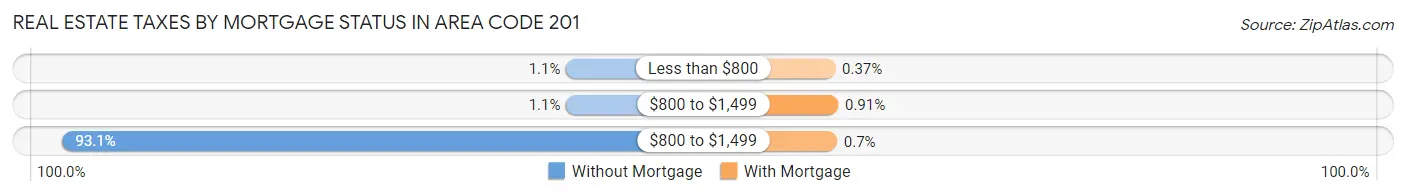
| Property Taxes | Without Mortgage | With Mortgage |
| Less than $800 | 859 (1.1%) | 551 (0.4%) |
| $800 to $1,499 | 860 (1.1%) | 1,352 (0.9%) |
| $800 to $1,499 | 75,578 (93.1%) | 1,039 (0.7%) |
| Total | 81,190 (100.0%) | 149,280 (100.0%) |
Health & Disability in Area Code 201
Health Insurance Coverage by Age in Area Code 201
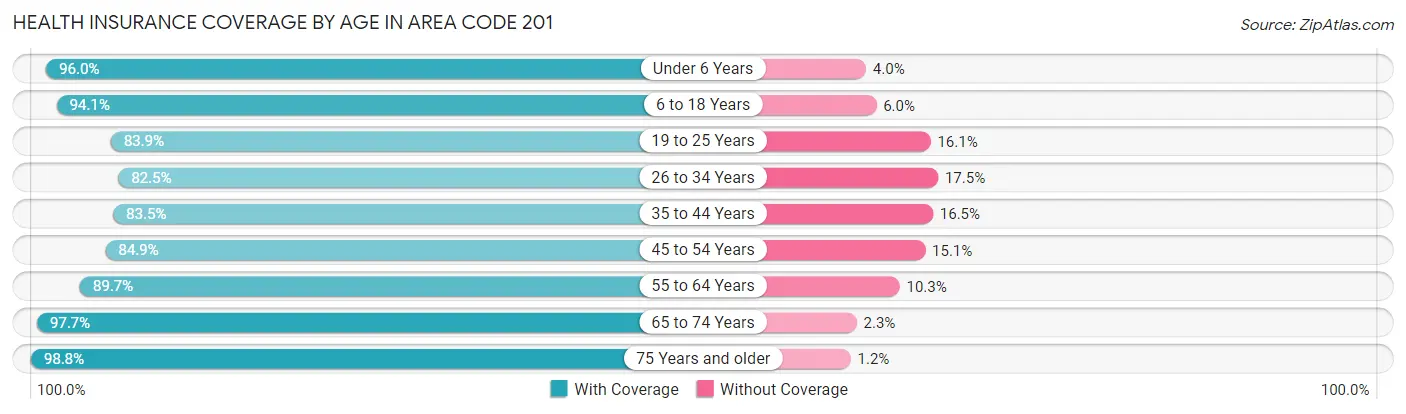
| Age Bracket | With Coverage | Without Coverage |
| Under 6 Years | 91,817 (96.0%) | 3,854 (4.0%) |
| 6 to 18 Years | 203,454 (94.1%) | 12,867 (5.9%) |
| 19 to 25 Years | 97,547 (83.9%) | 18,679 (16.1%) |
| 26 to 34 Years | 155,971 (82.5%) | 33,019 (17.5%) |
| 35 to 44 Years | 158,993 (83.5%) | 31,468 (16.5%) |
| 45 to 54 Years | 147,765 (84.9%) | 26,219 (15.1%) |
| 55 to 64 Years | 146,475 (89.7%) | 16,844 (10.3%) |
| 65 to 74 Years | 107,665 (97.7%) | 2,521 (2.3%) |
| 75 Years and older | 76,254 (98.8%) | 905 (1.2%) |
| Total | 1,185,941 (89.0%) | 146,376 (11.0%) |
Health Insurance Coverage by Citizenship Status in Area Code 201
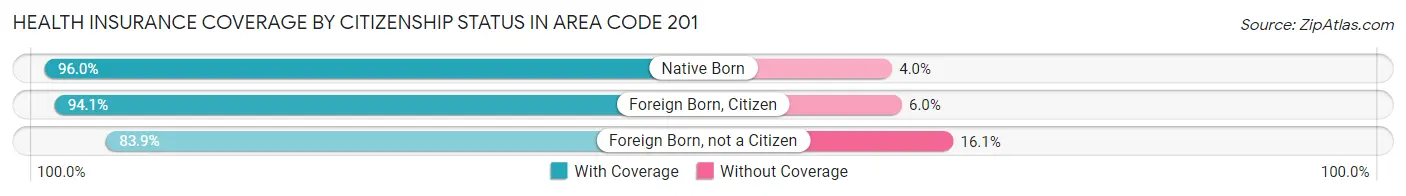
| Citizenship Status | With Coverage | Without Coverage |
| Native Born | 91,817 (96.0%) | 3,854 (4.0%) |
| Foreign Born, Citizen | 203,454 (94.1%) | 12,867 (5.9%) |
| Foreign Born, not a Citizen | 97,547 (83.9%) | 18,679 (16.1%) |
Health Insurance Coverage by Household Income in Area Code 201
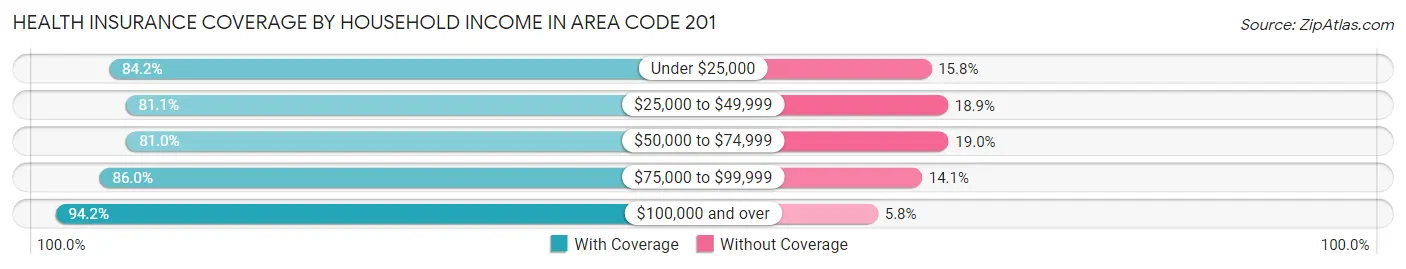
| Household Income | With Coverage | Without Coverage |
| Under $25,000 | 115,366 (84.2%) | 21,681 (15.8%) |
| $25,000 to $49,999 | 136,073 (81.1%) | 31,758 (18.9%) |
| $50,000 to $74,999 | 135,479 (81.0%) | 31,853 (19.0%) |
| $75,000 to $99,999 | 115,494 (86.0%) | 18,883 (14.1%) |
| $100,000 and over | 670,537 (94.2%) | 41,248 (5.8%) |
Public vs Private Health Insurance Coverage by Age in Area Code 201
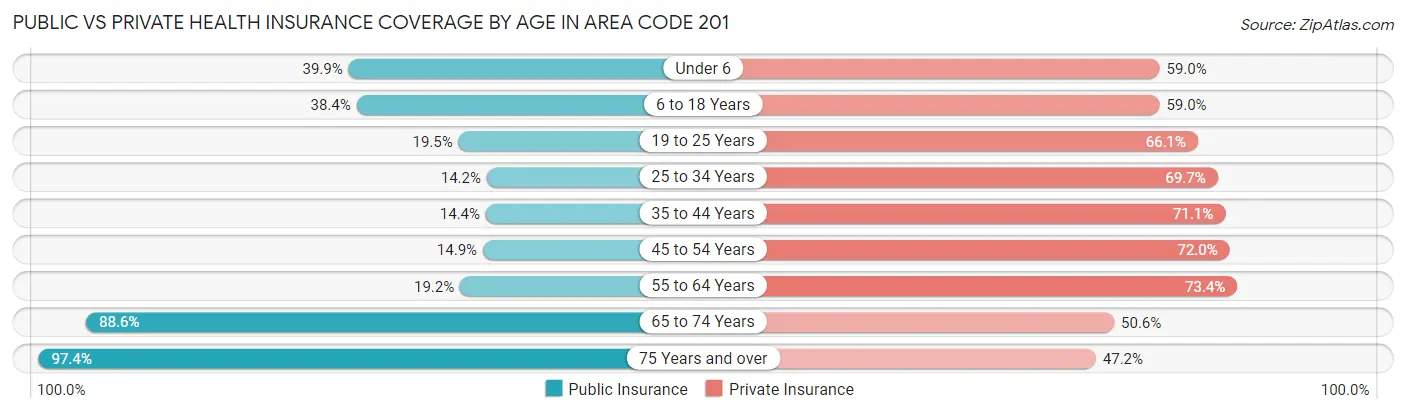
| Age Bracket | Public Insurance | Private Insurance |
| Under 6 | 38,141 (39.9%) | 56,429 (59.0%) |
| 6 to 18 Years | 83,053 (38.4%) | 127,537 (59.0%) |
| 19 to 25 Years | 22,622 (19.5%) | 76,797 (66.1%) |
| 25 to 34 Years | 26,855 (14.2%) | 131,795 (69.7%) |
| 35 to 44 Years | 27,383 (14.4%) | 135,499 (71.1%) |
| 45 to 54 Years | 25,972 (14.9%) | 125,240 (72.0%) |
| 55 to 64 Years | 31,325 (19.2%) | 119,856 (73.4%) |
| 65 to 74 Years | 97,606 (88.6%) | 55,696 (50.5%) |
| 75 Years and over | 75,151 (97.4%) | 36,387 (47.2%) |
| Total | 428,108 (32.1%) | 865,236 (64.9%) |
Disability Status by Sex by Age in Area Code 201
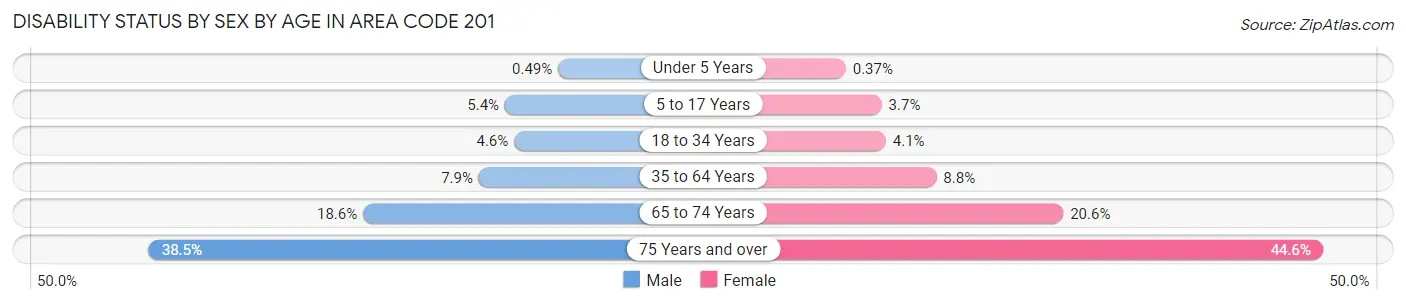
| Age Bracket | Male | Female |
| Under 5 Years | 206 (0.5%) | 146 (0.4%) |
| 5 to 17 Years | 5,920 (5.4%) | 3,851 (3.7%) |
| 18 to 34 Years | 7,545 (4.6%) | 6,448 (4.1%) |
| 35 to 64 Years | 20,607 (7.9%) | 23,292 (8.8%) |
| 65 to 74 Years | 9,546 (18.6%) | 12,093 (20.5%) |
| 75 Years and over | 11,672 (38.5%) | 20,893 (44.6%) |
Disability Class by Sex by Age in Area Code 201
Disability Class: Hearing Difficulty
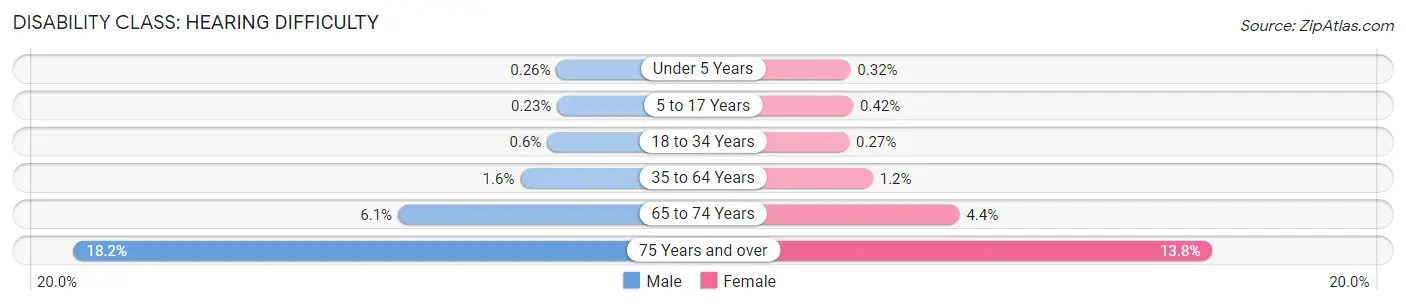
| Age Bracket | Male | Female |
| Under 5 Years | 108 (0.3%) | 127 (0.3%) |
| 5 to 17 Years | 248 (0.2%) | 441 (0.4%) |
| 18 to 34 Years | 999 (0.6%) | 433 (0.3%) |
| 35 to 64 Years | 4,195 (1.6%) | 3,041 (1.1%) |
| 65 to 74 Years | 3,150 (6.1%) | 2,572 (4.4%) |
| 75 Years and over | 5,517 (18.2%) | 6,437 (13.8%) |
Disability Class: Vision Difficulty
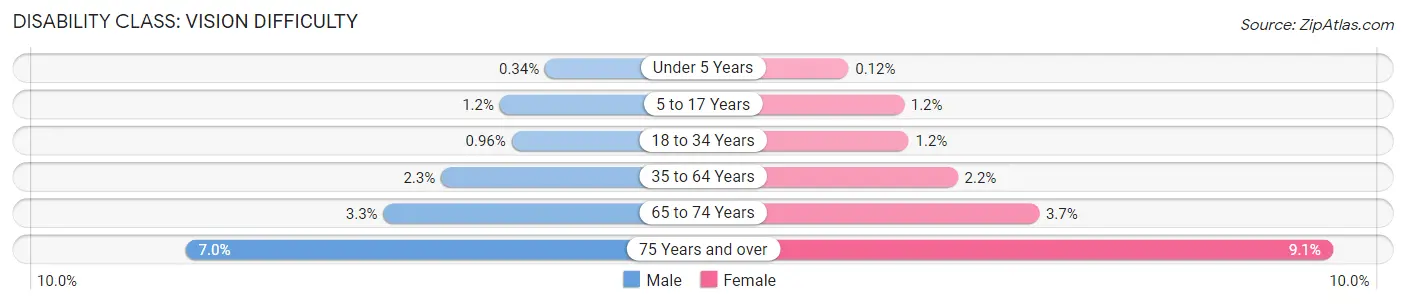
| Age Bracket | Male | Female |
| Under 5 Years | 141 (0.3%) | 48 (0.1%) |
| 5 to 17 Years | 1,287 (1.2%) | 1,198 (1.1%) |
| 18 to 34 Years | 1,594 (1.0%) | 1,959 (1.2%) |
| 35 to 64 Years | 5,957 (2.3%) | 5,691 (2.1%) |
| 65 to 74 Years | 1,716 (3.3%) | 2,154 (3.7%) |
| 75 Years and over | 2,128 (7.0%) | 4,266 (9.1%) |
Disability Class: Cognitive Difficulty
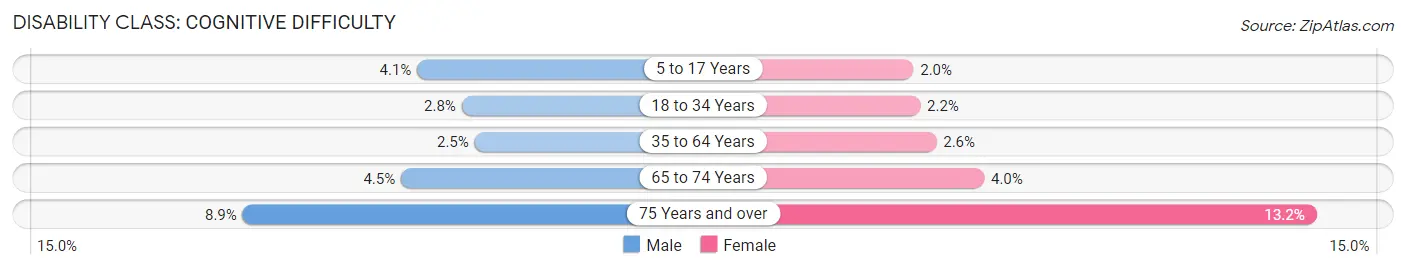
| Age Bracket | Male | Female |
| 5 to 17 Years | 4,444 (4.1%) | 2,065 (2.0%) |
| 18 to 34 Years | 4,668 (2.8%) | 3,439 (2.2%) |
| 35 to 64 Years | 6,488 (2.5%) | 6,984 (2.6%) |
| 65 to 74 Years | 2,319 (4.5%) | 2,328 (4.0%) |
| 75 Years and over | 2,709 (8.9%) | 6,191 (13.2%) |
Disability Class: Ambulatory Difficulty
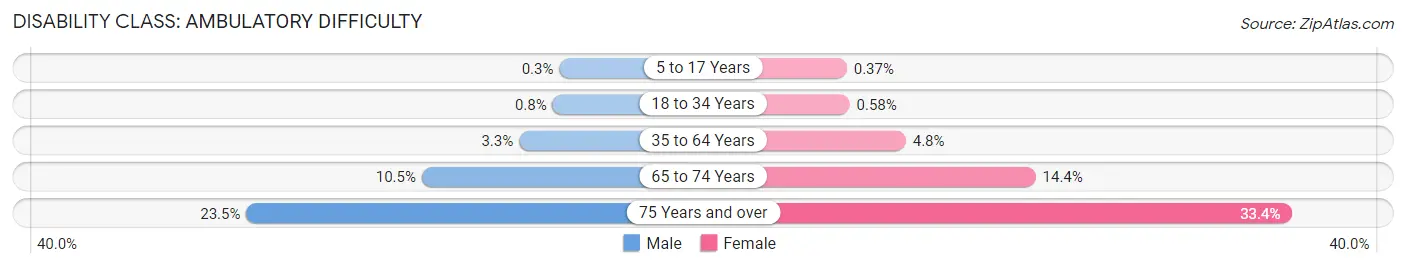
| Age Bracket | Male | Female |
| 5 to 17 Years | 330 (0.3%) | 386 (0.4%) |
| 18 to 34 Years | 1,320 (0.8%) | 920 (0.6%) |
| 35 to 64 Years | 8,627 (3.3%) | 12,612 (4.8%) |
| 65 to 74 Years | 5,396 (10.5%) | 8,469 (14.4%) |
| 75 Years and over | 7,142 (23.5%) | 15,656 (33.4%) |
Disability Class: Self-Care Difficulty
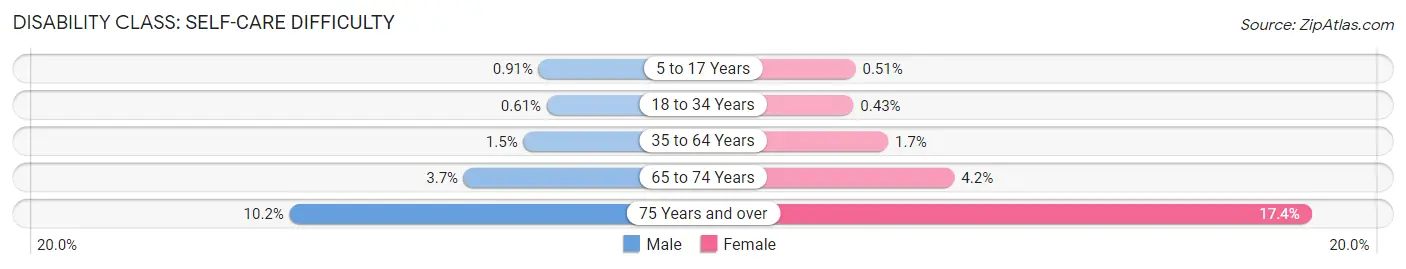
| Age Bracket | Male | Female |
| 5 to 17 Years | 990 (0.9%) | 534 (0.5%) |
| 18 to 34 Years | 1,001 (0.6%) | 670 (0.4%) |
| 35 to 64 Years | 3,894 (1.5%) | 4,563 (1.7%) |
| 65 to 74 Years | 1,897 (3.7%) | 2,457 (4.2%) |
| 75 Years and over | 3,083 (10.2%) | 8,167 (17.4%) |
Technology Access in Area Code 201
Computing Device Access in Area Code 201
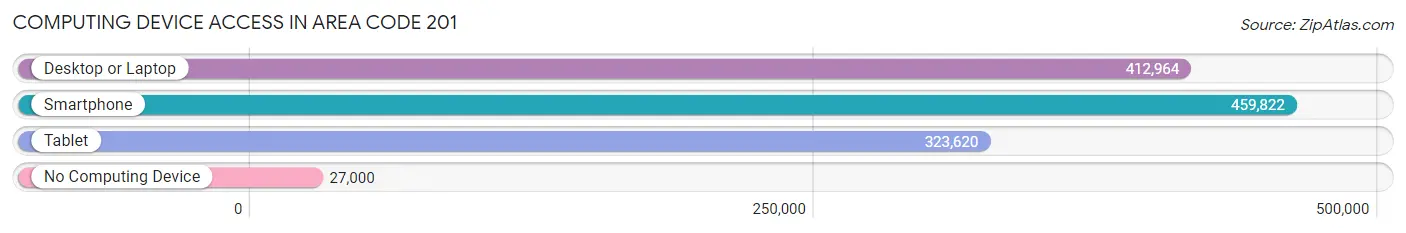
| Device Type | # Households | % Households |
| Desktop or Laptop | 412,964 | 81.2% |
| Smartphone | 459,822 | 90.5% |
| Tablet | 323,620 | 63.7% |
| No Computing Device | 27,000 | 5.3% |
| Total | 508,318 | 100.0% |
Internet Access in Area Code 201
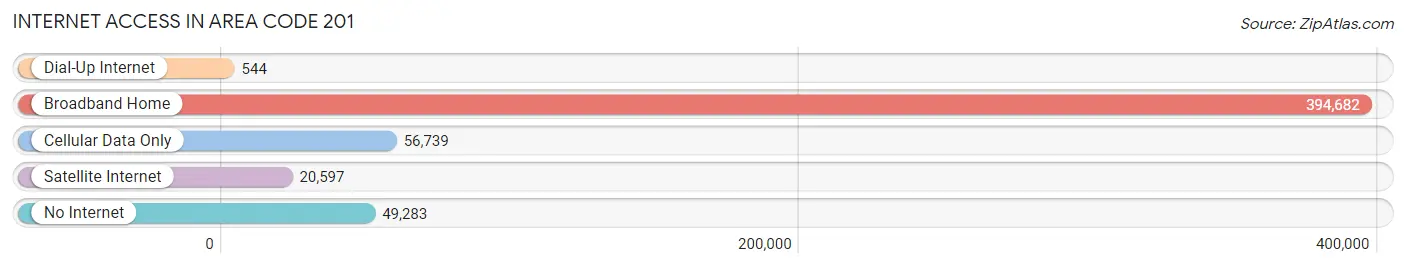
| Internet Type | # Households | % Households |
| Dial-Up Internet | 544 | 0.1% |
| Broadband Home | 394,682 | 77.6% |
| Cellular Data Only | 56,739 | 11.2% |
| Satellite Internet | 20,597 | 4.1% |
| No Internet | 49,283 | 9.7% |
| Total | 508,318 | 100.0% |
Area Code 201 Summary
Area code 201 is a telephone area code that serves the northeastern region of the state of New Jersey in the United States. The area code encompasses a diverse range of geographic, social, economic, and demographic characteristics.
Geographically, area code 201 includes portions of Bergen, Hudson, and Essex counties. The region is located in the northeastern part of New Jersey, which is bordered by the Hudson River to the east and the state of New York to the north. The region is known for its diverse landscape, including urban, suburban, and rural areas, as well as its proximity to New York City.
Socially, the region served by area code 201 is a diverse one, with a mix of ethnicities and cultures. The population is generally highly educated, with a large number of professionals and students. The region is home to several universities and colleges, including Fairleigh Dickinson University, New Jersey City University, and Stevens Institute of Technology. The area also has a vibrant arts and culture scene, with several theaters, museums, and galleries.
Economically, the region served by area code 201 is one of the most prosperous in New Jersey. The region is home to several large corporations, including Pfizer, Panasonic, and LG Electronics. The area is also known for its strong healthcare and financial services sectors. The region has a relatively high median household income of approximately $90,000.
Demographically, the region served by area code 201 is diverse, with a mix of ethnicities and cultures. The largest ethnic group is White, followed by Hispanic/Latino, Black/African American, and Asian/Pacific Islander. The region has a relatively high number of foreign-born residents, with immigrants making up approximately 33% of the population. The area is known for its diversity and acceptance of different cultures and religions.
In conclusion, area code 201 serves a diverse and prosperous region of northeastern New Jersey, with a mix of urban, suburban, and rural areas. The region is known for its highly educated population, strong economy, and diverse culture.
Common Questions
What is Per Capita Income in Area Code 201?
Per Capita income in Area Code 201 is $58,458.
What is the Median Family Income in Area Code 201?
Median Family Income in Area Code 201 is $142,609.
What is the Median Household income in Area Code 201?
Median Household Income in Area Code 201 is $121,397.
What is Income or Wage Gap in Area Code 201?
Income or Wage Gap in Area Code 201 is 28.3%.
Women in Area Code 201 earn 71.7 cents for every dollar earned by a man.
What is Family Income Deficit in Area Code 201?
Family Income Deficit in Area Code 201 is $10,791.
Families that are below poverty line in Area Code 201 earn $10,791 less on average than the poverty threshold level.
What is Inequality or Gini Index in Area Code 201?
Inequality or Gini Index in Area Code 201 is 22.52.
What is the Total Population of Area Code 201?
Total Population of Area Code 201 is 1,345,917.
What is the Total Male Population of Area Code 201?
Total Male Population of Area Code 201 is 669,541.
What is the Total Female Population of Area Code 201?
Total Female Population of Area Code 201 is 676,376.
What is the Ratio of Males per 100 Females in Area Code 201?
There are 98.99 Males per 100 Females in Area Code 201.
What is the Ratio of Females per 100 Males in Area Code 201?
There are 101.02 Females per 100 Males in Area Code 201.
What is the Median Population Age in Area Code 201?
Median Population Age in Area Code 201 is 39.7 Years.
What is the Average Family Size in Area Code 201
Average Family Size in Area Code 201 is 3.2 People.
What is the Average Household Size in Area Code 201
Average Household Size in Area Code 201 is 2.6 People.
How Large is the Labor Force in Area Code 201?
There are 733,733 People in the Labor Forcein in Area Code 201.
What is the Percentage of People in the Labor Force in Area Code 201?
67.6% of People are in the Labor Force in Area Code 201.
What is the Unemployment Rate in Area Code 201?
Unemployment Rate in Area Code 201 is 5.8%.