Cities with the Most Immigrants from Burma / Myanmar in Virginia
RELATED REPORTS & OPTIONS
Burma / Myanmar
Virginia
Compare Cities
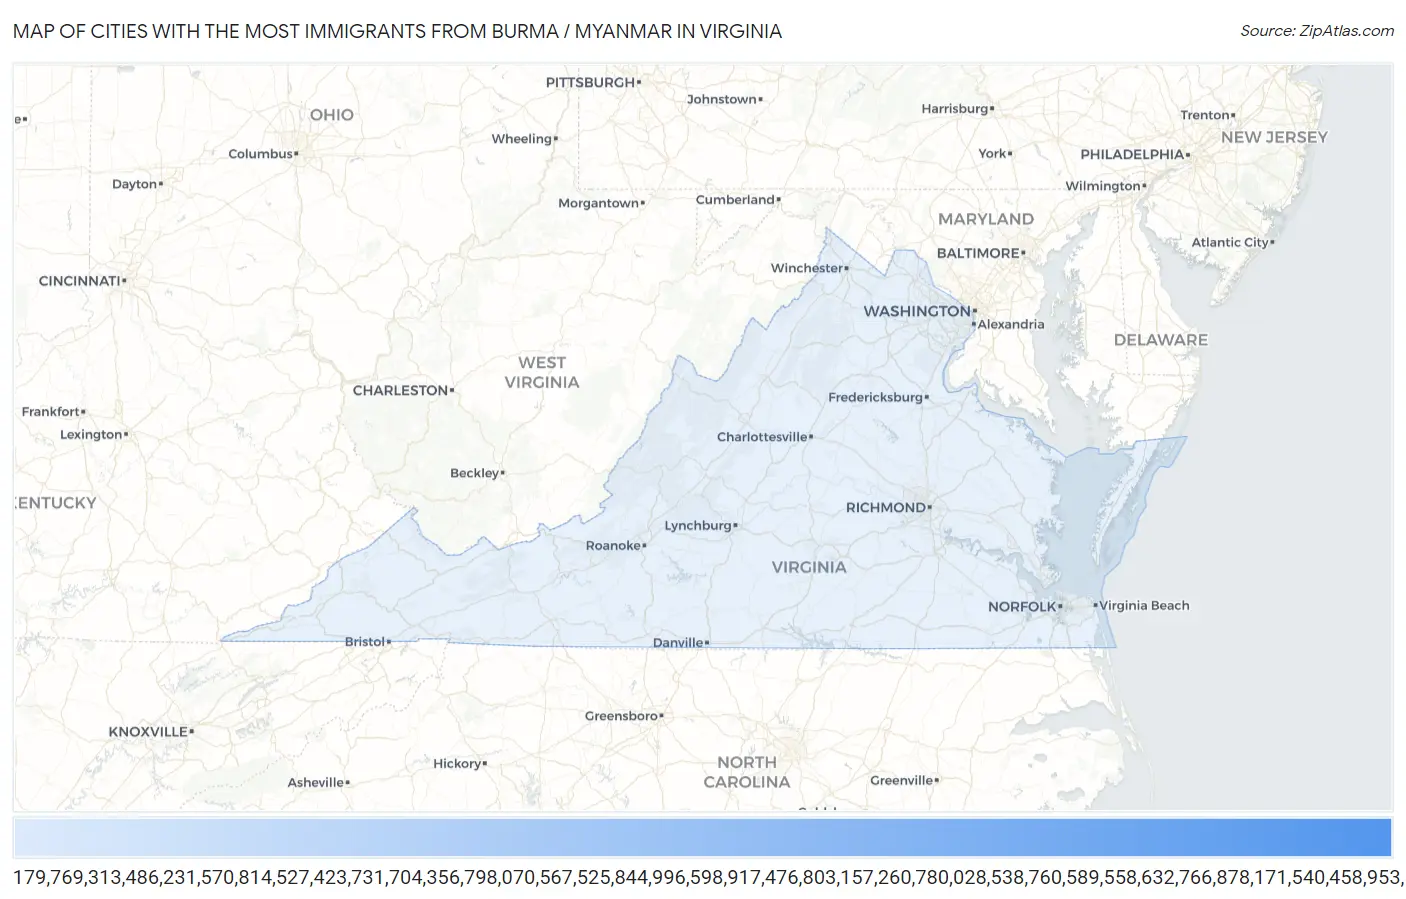
Map of Cities with the Most Immigrants from Burma / Myanmar in Virginia
0
250
Cities with the Most Immigrants from Burma / Myanmar in Virginia
| City | Burma / Myanmar | vs State | vs National | |
| 1. | Virginia Beach | 240 | 1,815(13.22%)#-1 | 157,000(0.15%)#0 |
| 2. | Arlington | 182 | 1,815(10.03%)#0 | 157,000(0.12%)#1 |
| 3. | Wyndham | 161 | 1,815(8.87%)#1 | 157,000(0.10%)#2 |
| 4. | Charlottesville | 123 | 1,815(6.78%)#2 | 157,000(0.08%)#3 |
| 5. | Merrifield | 67 | 1,815(3.69%)#3 | 157,000(0.04%)#4 |
| 6. | Mantua | 66 | 1,815(3.64%)#4 | 157,000(0.04%)#5 |
| 7. | Woodlawn Cdp Fairfax County | 62 | 1,815(3.42%)#5 | 157,000(0.04%)#6 |
| 8. | Harrisonburg | 61 | 1,815(3.36%)#6 | 157,000(0.04%)#7 |
| 9. | Ashburn | 56 | 1,815(3.09%)#7 | 157,000(0.04%)#8 |
| 10. | Reston | 49 | 1,815(2.70%)#8 | 157,000(0.03%)#9 |
| 11. | South Riding | 42 | 1,815(2.31%)#9 | 157,000(0.03%)#10 |
| 12. | Lowes Island | 42 | 1,815(2.31%)#10 | 157,000(0.03%)#11 |
| 13. | Broadlands | 38 | 1,815(2.09%)#11 | 157,000(0.02%)#12 |
| 14. | Sully Square | 35 | 1,815(1.93%)#12 | 157,000(0.02%)#13 |
| 15. | Countryside | 34 | 1,815(1.87%)#13 | 157,000(0.02%)#14 |
| 16. | Tuckahoe | 31 | 1,815(1.71%)#14 | 157,000(0.02%)#15 |
| 17. | Norfolk | 29 | 1,815(1.60%)#15 | 157,000(0.02%)#16 |
| 18. | Leesburg | 28 | 1,815(1.54%)#16 | 157,000(0.02%)#17 |
| 19. | Laurel | 28 | 1,815(1.54%)#17 | 157,000(0.02%)#18 |
| 20. | Innsbrook | 28 | 1,815(1.54%)#18 | 157,000(0.02%)#19 |
| 21. | Sterling | 26 | 1,815(1.43%)#19 | 157,000(0.02%)#20 |
| 22. | Dale City | 25 | 1,815(1.38%)#20 | 157,000(0.02%)#21 |
| 23. | Huntington | 25 | 1,815(1.38%)#21 | 157,000(0.02%)#22 |
| 24. | Alexandria | 22 | 1,815(1.21%)#22 | 157,000(0.01%)#23 |
| 25. | Navy | 19 | 1,815(1.05%)#23 | 157,000(0.01%)#24 |
| 26. | Richmond | 14 | 1,815(0.77%)#24 | 157,000(0.01%)#25 |
| 27. | Dulles Town Center | 14 | 1,815(0.77%)#25 | 157,000(0.01%)#26 |
| 28. | Centreville | 12 | 1,815(0.66%)#26 | 157,000(0.01%)#27 |
| 29. | Tysons | 12 | 1,815(0.66%)#27 | 157,000(0.01%)#28 |
| 30. | Franconia | 10 | 1,815(0.55%)#28 | 157,000(0.01%)#29 |
| 31. | Suffolk | 8 | 1,815(0.44%)#29 | 157,000(0.01%)#30 |
| 32. | Manassas | 8 | 1,815(0.44%)#30 | 157,000(0.01%)#31 |
| 33. | Oakton | 6 | 1,815(0.33%)#31 | 157,000(0.00%)#32 |
| 34. | Lake Barcroft | 6 | 1,815(0.33%)#32 | 157,000(0.00%)#33 |
| 35. | Annandale | 5 | 1,815(0.28%)#33 | 157,000(0.00%)#34 |
| 36. | Crosspointe | 5 | 1,815(0.28%)#34 | 157,000(0.00%)#35 |
| 37. | Woodburn | 4 | 1,815(0.22%)#35 | 157,000(0.00%)#36 |
| 38. | West Falls Church | 3 | 1,815(0.17%)#36 | 157,000(0.00%)#37 |
Common Questions
What are the Top 10 Cities with the Most Immigrants from Burma / Myanmar in Virginia?
Top 10 Cities with the Most Immigrants from Burma / Myanmar in Virginia are:
#1
240
#2
182
#3
161
#4
123
#5
67
#6
66
#7
61
#8
56
#9
49
#10
42
What city has the Most Immigrants from Burma / Myanmar in Virginia?
Virginia Beach has the Most Immigrants from Burma / Myanmar in Virginia with 240.
What is the Total Immigrants from Burma / Myanmar in the State of Virginia?
Total Immigrants from Burma / Myanmar in Virginia is 1,815.
What is the Total Immigrants from Burma / Myanmar in the United States?
Total Immigrants from Burma / Myanmar in the United States is 157,000.