Rankin borough, PA Map & Demographics
Rankin borough Overview
$23,483
PER CAPITA INCOME
$46,211
AVG FAMILY INCOME
$29,107
AVG HOUSEHOLD INCOME
9.7%
WAGE / INCOME GAP [ % ]
90.3¢/ $1
WAGE / INCOME GAP [ $ ]
0.52
INEQUALITY / GINI INDEX
1,837
TOTAL POPULATION
812
MALE POPULATION
1,025
FEMALE POPULATION
79.22
MALES / 100 FEMALES
126.23
FEMALES / 100 MALES
33.4
MEDIAN AGE
3.4
AVG FAMILY SIZE
2.3
AVG HOUSEHOLD SIZE
888
LABOR FORCE [ PEOPLE ]
62.5%
PERCENT IN LABOR FORCE
18.2%
UNEMPLOYMENT RATE
Income in Rankin borough
Income Overview in Rankin borough
Per Capita Income in Rankin borough is $23,483, while median incomes of families and households are $46,211 and $29,107 respectively.
| Characteristic | Number | Measure |
| Per Capita Income | 1,837 | $23,483 |
| Median Family Income | 423 | $46,211 |
| Mean Family Income | 423 | $61,909 |
| Median Household Income | 799 | $29,107 |
| Mean Household Income | 799 | $50,651 |
| Income Deficit | 423 | $0 |
| Wage / Income Gap (%) | 1,837 | 9.65% |
| Wage / Income Gap ($) | 1,837 | 90.35¢ per $1 |
| Gini / Inequality Index | 1,837 | 0.52 |
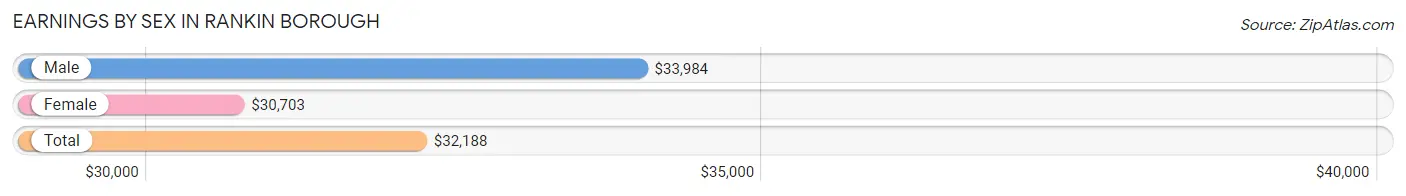
Earnings by Sex in Rankin borough
Average Earnings in Rankin borough are $32,188, $33,984 for men and $30,703 for women, a difference of 9.7%.
| Sex | Number | Average Earnings |
| Male | 449 (51.1%) | $33,984 |
| Female | 429 (48.9%) | $30,703 |
| Total | 878 (100.0%) | $32,188 |
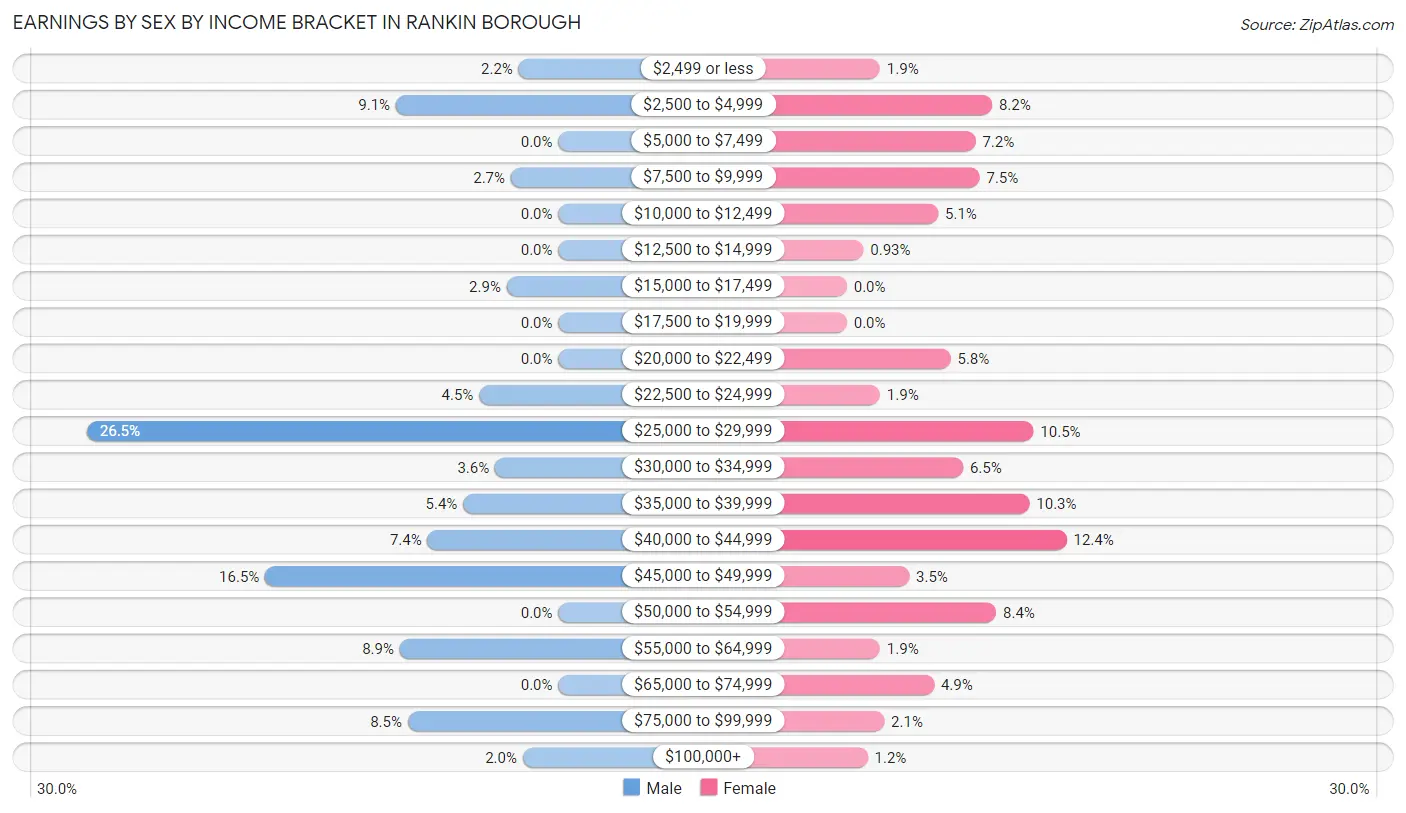
Earnings by Sex by Income Bracket in Rankin borough
The most common earnings brackets in Rankin borough are $25,000 to $29,999 for men (119 | 26.5%) and $40,000 to $44,999 for women (53 | 12.3%).
| Income | Male | Female |
| $2,499 or less | 10 (2.2%) | 8 (1.9%) |
| $2,500 to $4,999 | 41 (9.1%) | 35 (8.2%) |
| $5,000 to $7,499 | 0 (0.0%) | 31 (7.2%) |
| $7,500 to $9,999 | 12 (2.7%) | 32 (7.5%) |
| $10,000 to $12,499 | 0 (0.0%) | 22 (5.1%) |
| $12,500 to $14,999 | 0 (0.0%) | 4 (0.9%) |
| $15,000 to $17,499 | 13 (2.9%) | 0 (0.0%) |
| $17,500 to $19,999 | 0 (0.0%) | 0 (0.0%) |
| $20,000 to $22,499 | 0 (0.0%) | 25 (5.8%) |
| $22,500 to $24,999 | 20 (4.4%) | 8 (1.9%) |
| $25,000 to $29,999 | 119 (26.5%) | 45 (10.5%) |
| $30,000 to $34,999 | 16 (3.6%) | 28 (6.5%) |
| $35,000 to $39,999 | 24 (5.3%) | 44 (10.3%) |
| $40,000 to $44,999 | 33 (7.3%) | 53 (12.3%) |
| $45,000 to $49,999 | 74 (16.5%) | 15 (3.5%) |
| $50,000 to $54,999 | 0 (0.0%) | 36 (8.4%) |
| $55,000 to $64,999 | 40 (8.9%) | 8 (1.9%) |
| $65,000 to $74,999 | 0 (0.0%) | 21 (4.9%) |
| $75,000 to $99,999 | 38 (8.5%) | 9 (2.1%) |
| $100,000+ | 9 (2.0%) | 5 (1.2%) |
| Total | 449 (100.0%) | 429 (100.0%) |
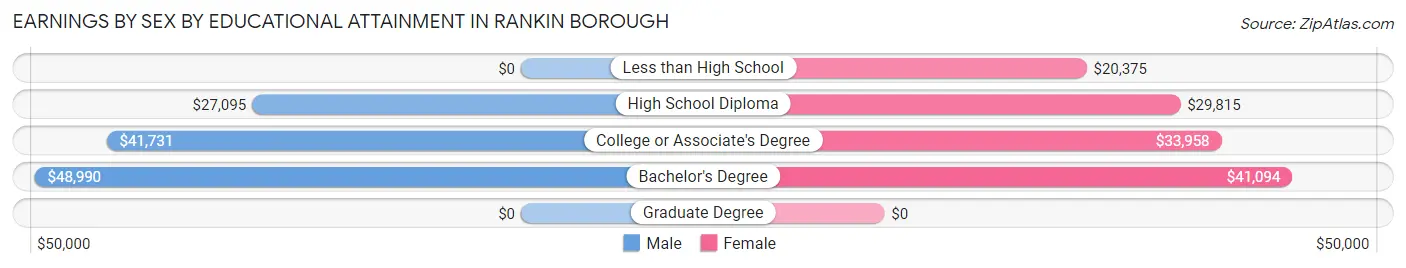
Earnings by Sex by Educational Attainment in Rankin borough
Average earnings in Rankin borough are $41,010 for men and $37,188 for women, a difference of 9.3%. Men with an educational attainment of bachelor's degree enjoy the highest average annual earnings of $48,990, while those with high school diploma education earn the least with $27,095. Women with an educational attainment of bachelor's degree earn the most with the average annual earnings of $41,094, while those with less than high school education have the smallest earnings of $20,375.
| Educational Attainment | Male Income | Female Income |
| Less than High School | - | - |
| High School Diploma | $27,095 | $29,815 |
| College or Associate's Degree | $41,731 | $33,958 |
| Bachelor's Degree | $48,990 | $41,094 |
| Graduate Degree | - | - |
| Total | $41,010 | $37,188 |
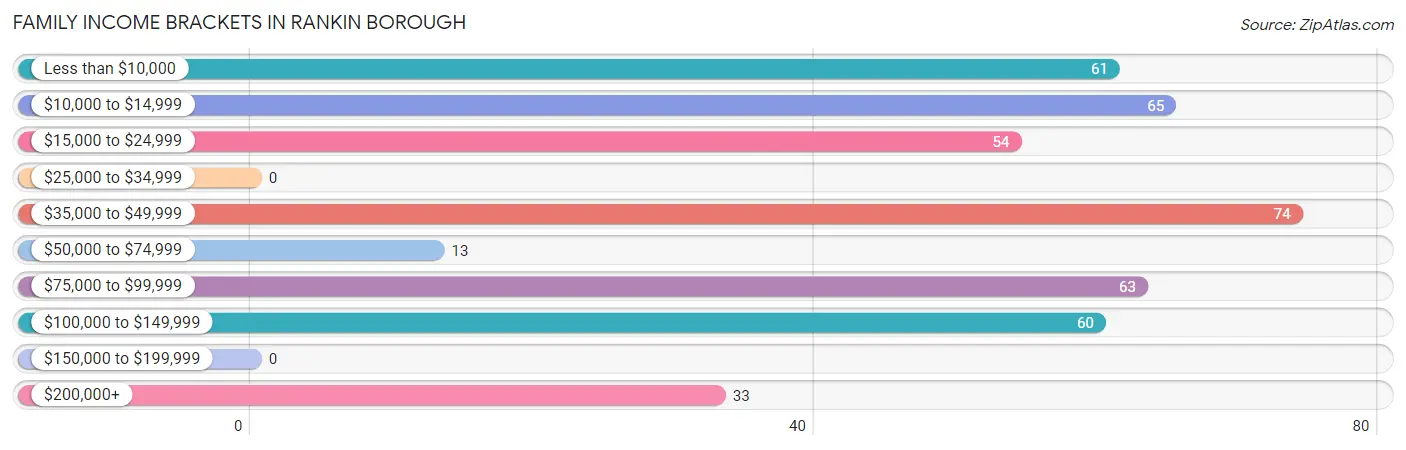
Family Income in Rankin borough
Family Income Brackets in Rankin borough
According to the Rankin borough family income data, there are 74 families falling into the $35,000 to $49,999 income range, which is the most common income bracket and makes up 17.5% of all families.
| Income Bracket | # Families | % Families |
| Less than $10,000 | 61 | 14.4% |
| $10,000 to $14,999 | 65 | 15.4% |
| $15,000 to $24,999 | 54 | 12.8% |
| $25,000 to $34,999 | 0 | 0.0% |
| $35,000 to $49,999 | 74 | 17.5% |
| $50,000 to $74,999 | 13 | 3.1% |
| $75,000 to $99,999 | 63 | 14.9% |
| $100,000 to $149,999 | 60 | 14.2% |
| $150,000 to $199,999 | 0 | 0.0% |
| $200,000+ | 33 | 7.8% |
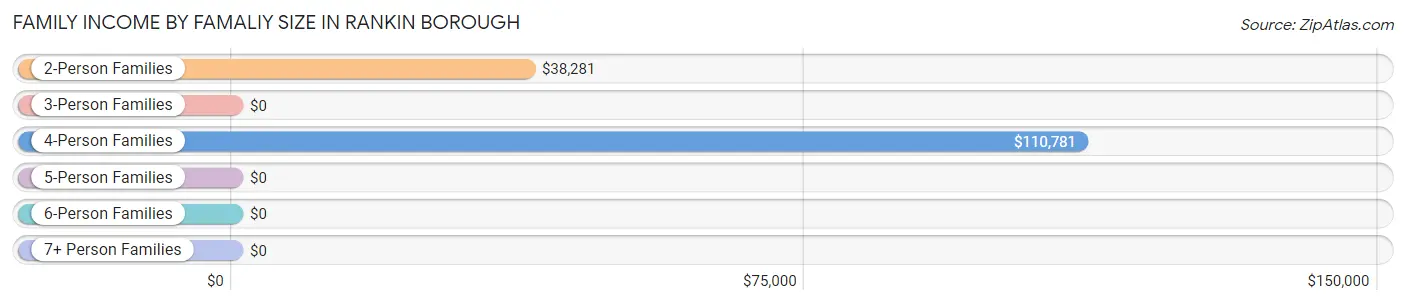
Family Income by Famaliy Size in Rankin borough
4-person families (66 | 15.6%) account for the highest median family income in Rankin borough with $110,781 per family, while 4-person families (66 | 15.6%) have the highest median income of $27,695 per family member.
| Income Bracket | # Families | Median Income |
| 2-Person Families | 267 (63.1%) | $38,281 |
| 3-Person Families | 69 (16.3%) | $0 |
| 4-Person Families | 66 (15.6%) | $110,781 |
| 5-Person Families | 0 (0.0%) | $0 |
| 6-Person Families | 0 (0.0%) | $0 |
| 7+ Person Families | 21 (5.0%) | $0 |
| Total | 423 (100.0%) | $46,211 |
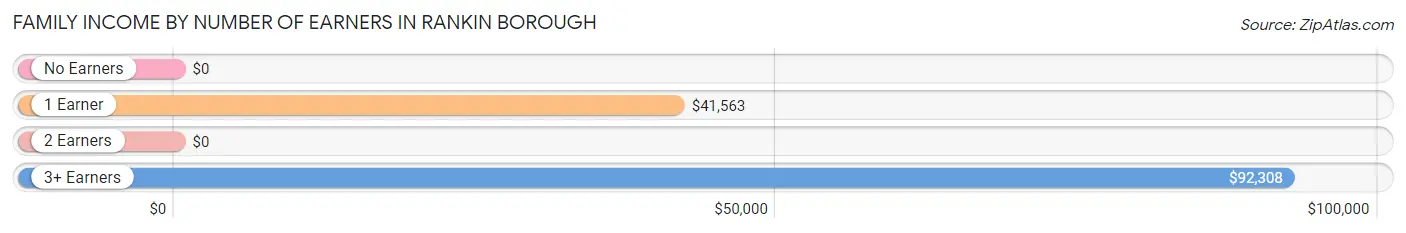
Family Income by Number of Earners in Rankin borough
| Number of Earners | # Families | Median Income |
| No Earners | 114 (27.0%) | $0 |
| 1 Earner | 158 (37.3%) | $41,563 |
| 2 Earners | 63 (14.9%) | $0 |
| 3+ Earners | 88 (20.8%) | $92,308 |
| Total | 423 (100.0%) | $46,211 |
Household Income in Rankin borough
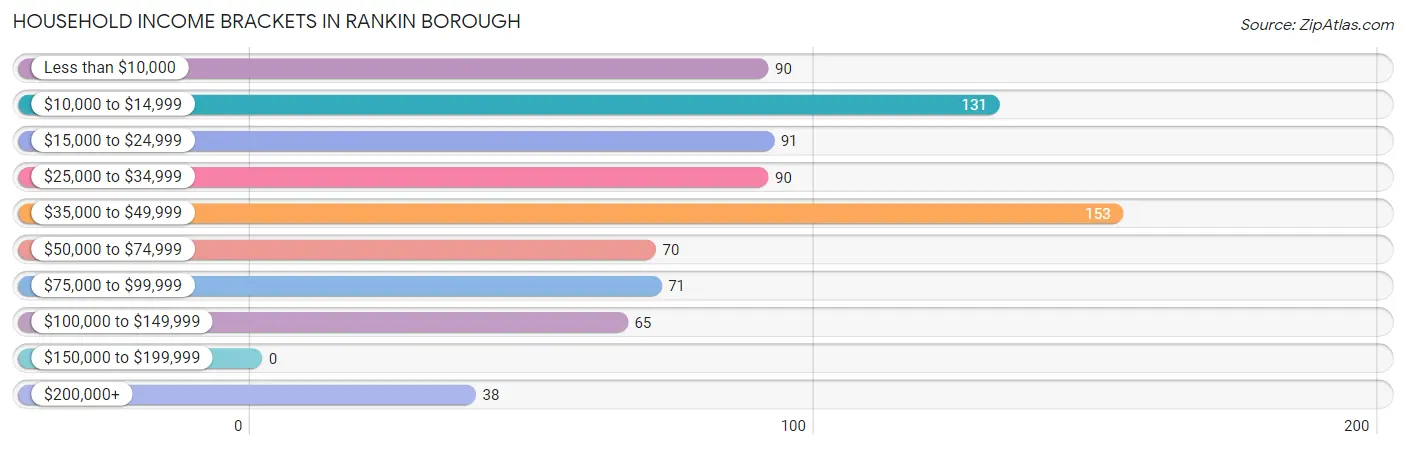
Household Income Brackets in Rankin borough
With 153 households falling in the category, the $35,000 to $49,999 income range is the most frequent in Rankin borough, accounting for 19.2% of all households.
| Income Bracket | # Households | % Households |
| Less than $10,000 | 90 | 11.3% |
| $10,000 to $14,999 | 131 | 16.4% |
| $15,000 to $24,999 | 91 | 11.4% |
| $25,000 to $34,999 | 90 | 11.3% |
| $35,000 to $49,999 | 153 | 19.1% |
| $50,000 to $74,999 | 70 | 8.8% |
| $75,000 to $99,999 | 71 | 8.9% |
| $100,000 to $149,999 | 65 | 8.1% |
| $150,000 to $199,999 | 0 | 0.0% |
| $200,000+ | 38 | 4.8% |
Household Income by Householder Age in Rankin borough
The median household income in Rankin borough is $29,107, with the highest median household income of $67,594 found in the 65+ years age bracket for the primary householder. A total of 163 households (20.4%) fall into this category. Meanwhile, the 15 to 24 years age bracket for the primary householder has the lowest median household income of $0, with 48 households (6.0%) in this group.

| Income Bracket | # Households | Median Income |
| 15 to 24 Years | 48 (6.0%) | $0 |
| 25 to 44 Years | 324 (40.6%) | $32,500 |
| 45 to 64 Years | 264 (33.0%) | $0 |
| 65+ Years | 163 (20.4%) | $67,594 |
| Total | 799 (100.0%) | $29,107 |
Poverty in Rankin borough
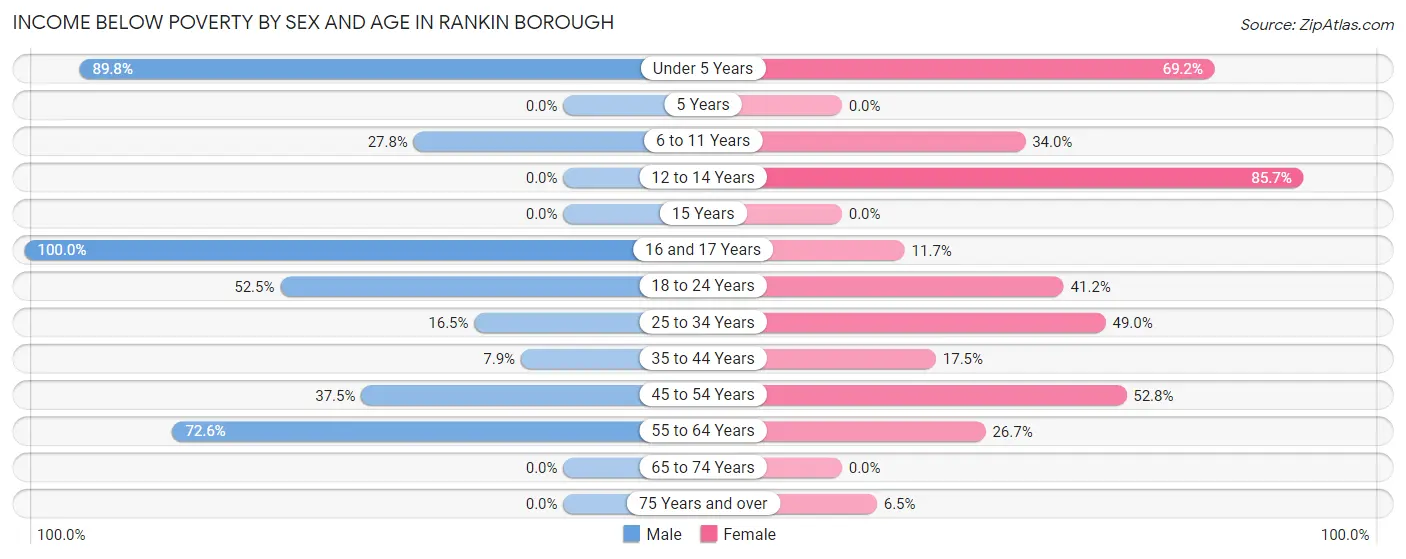
Income Below Poverty by Sex and Age in Rankin borough
With 36.8% poverty level for males and 34.5% for females among the residents of Rankin borough, 16 and 17 year old males and 12 to 14 year old females are the most vulnerable to poverty, with 6 males (100.0%) and 24 females (85.7%) in their respective age groups living below the poverty level.
| Age Bracket | Male | Female |
| Under 5 Years | 88 (89.8%) | 108 (69.2%) |
| 5 Years | 0 (0.0%) | 0 (0.0%) |
| 6 to 11 Years | 15 (27.8%) | 16 (34.0%) |
| 12 to 14 Years | 0 (0.0%) | 24 (85.7%) |
| 15 Years | 0 (0.0%) | 0 (0.0%) |
| 16 and 17 Years | 6 (100.0%) | 7 (11.7%) |
| 18 to 24 Years | 93 (52.5%) | 28 (41.2%) |
| 25 to 34 Years | 19 (16.5%) | 47 (49.0%) |
| 35 to 44 Years | 14 (7.9%) | 22 (17.5%) |
| 45 to 54 Years | 27 (37.5%) | 66 (52.8%) |
| 55 to 64 Years | 37 (72.6%) | 28 (26.7%) |
| 65 to 74 Years | 0 (0.0%) | 0 (0.0%) |
| 75 Years and over | 0 (0.0%) | 8 (6.5%) |
| Total | 299 (36.8%) | 354 (34.5%) |
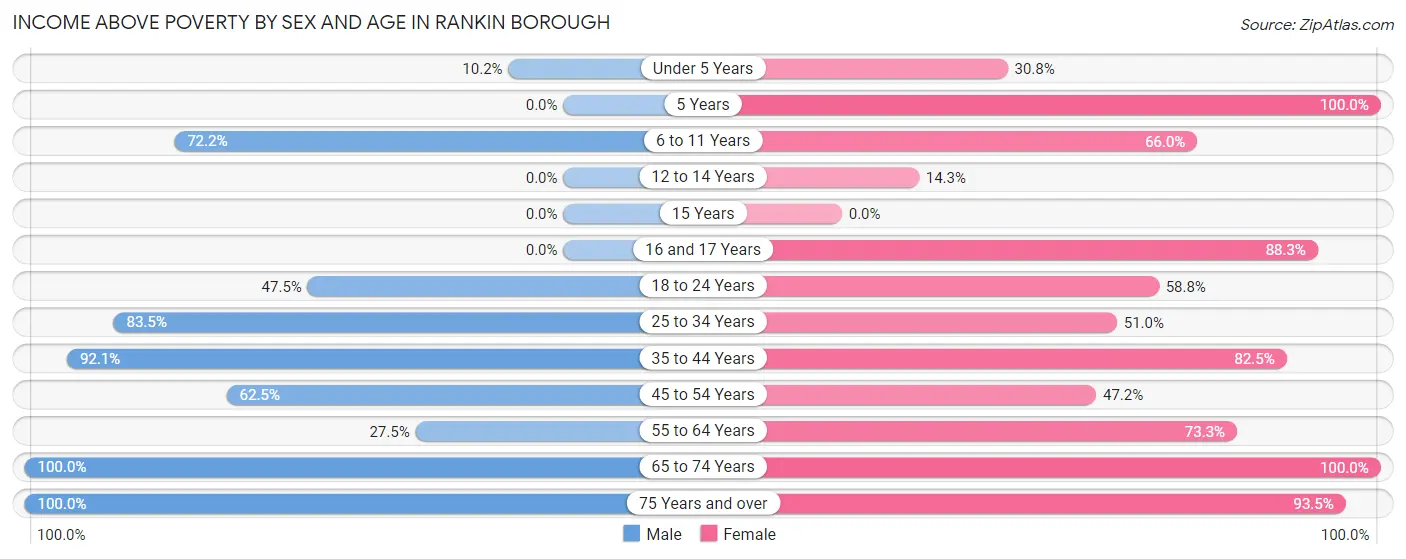
Income Above Poverty by Sex and Age in Rankin borough
According to the poverty statistics in Rankin borough, males aged 65 to 74 years and females aged 5 years are the age groups that are most secure financially, with 100.0% of males and 100.0% of females in these age groups living above the poverty line.
| Age Bracket | Male | Female |
| Under 5 Years | 10 (10.2%) | 48 (30.8%) |
| 5 Years | 0 (0.0%) | 34 (100.0%) |
| 6 to 11 Years | 39 (72.2%) | 31 (66.0%) |
| 12 to 14 Years | 0 (0.0%) | 4 (14.3%) |
| 15 Years | 0 (0.0%) | 0 (0.0%) |
| 16 and 17 Years | 0 (0.0%) | 53 (88.3%) |
| 18 to 24 Years | 84 (47.5%) | 40 (58.8%) |
| 25 to 34 Years | 96 (83.5%) | 49 (51.0%) |
| 35 to 44 Years | 164 (92.1%) | 104 (82.5%) |
| 45 to 54 Years | 45 (62.5%) | 59 (47.2%) |
| 55 to 64 Years | 14 (27.5%) | 77 (73.3%) |
| 65 to 74 Years | 46 (100.0%) | 57 (100.0%) |
| 75 Years and over | 15 (100.0%) | 115 (93.5%) |
| Total | 513 (63.2%) | 671 (65.5%) |
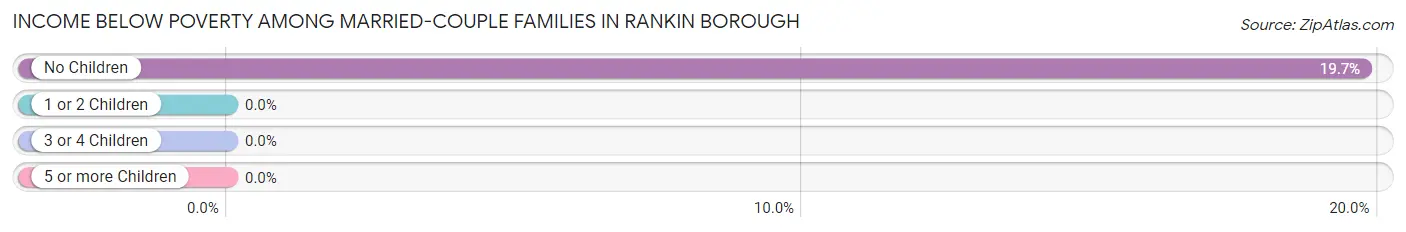
Income Below Poverty Among Married-Couple Families in Rankin borough
The poverty statistics for married-couple families in Rankin borough show that 15.5% or 15 of the total 97 families live below the poverty line. Families with no children have the highest poverty rate of 19.7%, comprising of 15 families. On the other hand, families with 3 or 4 children have the lowest poverty rate of 0.0%, which includes 0 families.
| Children | Above Poverty | Below Poverty |
| No Children | 61 (80.3%) | 15 (19.7%) |
| 1 or 2 Children | 0 (0.0%) | 0 (0.0%) |
| 3 or 4 Children | 21 (100.0%) | 0 (0.0%) |
| 5 or more Children | 0 (0.0%) | 0 (0.0%) |
| Total | 82 (84.5%) | 15 (15.5%) |
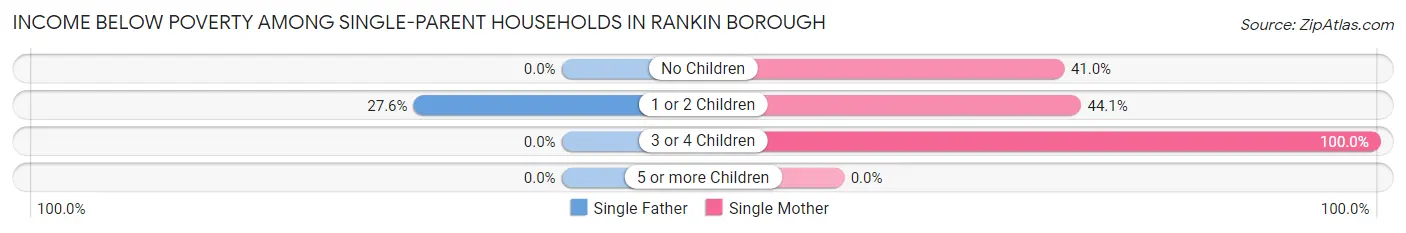
Income Below Poverty Among Single-Parent Households in Rankin borough
According to the poverty data in Rankin borough, 27.6% or 16 single-father households and 45.9% or 123 single-mother households are living below the poverty line. Among single-father households, those with 1 or 2 children have the highest poverty rate, with 16 households (27.6%) experiencing poverty. Likewise, among single-mother households, those with 3 or 4 children have the highest poverty rate, with 15 households (100.0%) falling below the poverty line.
| Children | Single Father | Single Mother |
| No Children | 0 (0.0%) | 48 (41.0%) |
| 1 or 2 Children | 16 (27.6%) | 60 (44.1%) |
| 3 or 4 Children | 0 (0.0%) | 15 (100.0%) |
| 5 or more Children | 0 (0.0%) | 0 (0.0%) |
| Total | 16 (27.6%) | 123 (45.9%) |
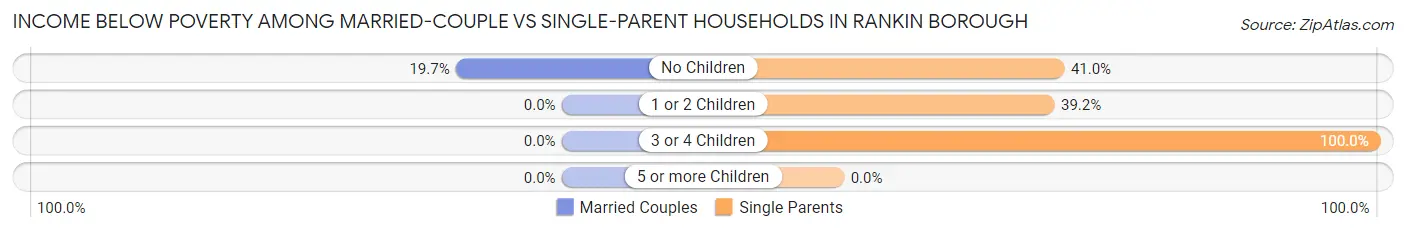
Income Below Poverty Among Married-Couple vs Single-Parent Households in Rankin borough
The poverty data for Rankin borough shows that 15 of the married-couple family households (15.5%) and 139 of the single-parent households (42.6%) are living below the poverty level. Within the married-couple family households, those with no children have the highest poverty rate, with 15 households (19.7%) falling below the poverty line. Among the single-parent households, those with 3 or 4 children have the highest poverty rate, with 15 household (100.0%) living below poverty.
| Children | Married-Couple Families | Single-Parent Households |
| No Children | 15 (19.7%) | 48 (41.0%) |
| 1 or 2 Children | 0 (0.0%) | 76 (39.2%) |
| 3 or 4 Children | 0 (0.0%) | 15 (100.0%) |
| 5 or more Children | 0 (0.0%) | 0 (0.0%) |
| Total | 15 (15.5%) | 139 (42.6%) |
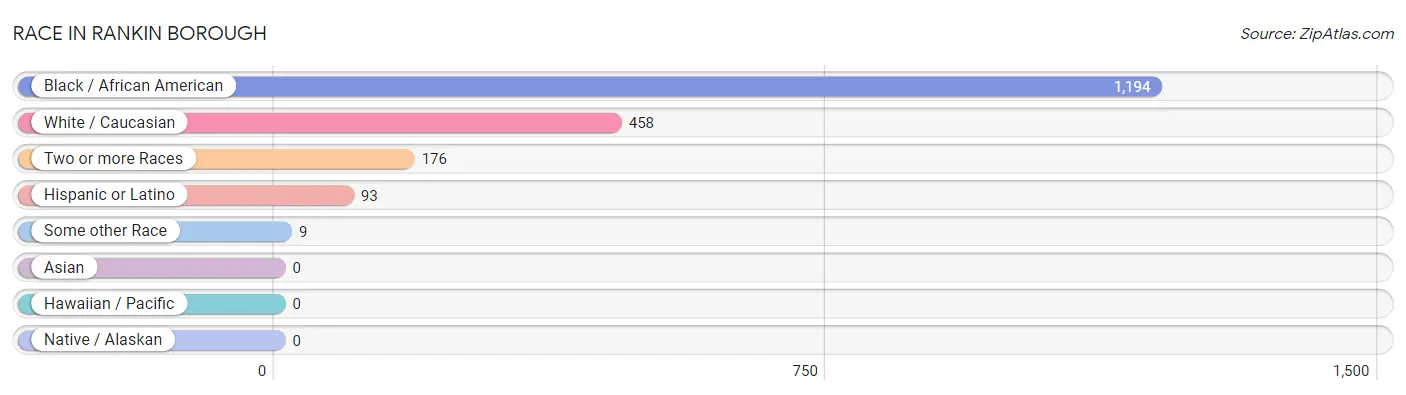
Race in Rankin borough
The most populous races in Rankin borough are Black / African American (1,194 | 65.0%), White / Caucasian (458 | 24.9%), and Two or more Races (176 | 9.6%).
| Race | # Population | % Population |
| Asian | 0 | 0.0% |
| Black / African American | 1,194 | 65.0% |
| Hawaiian / Pacific | 0 | 0.0% |
| Hispanic or Latino | 93 | 5.1% |
| Native / Alaskan | 0 | 0.0% |
| White / Caucasian | 458 | 24.9% |
| Two or more Races | 176 | 9.6% |
| Some other Race | 9 | 0.5% |
| Total | 1,837 | 100.0% |
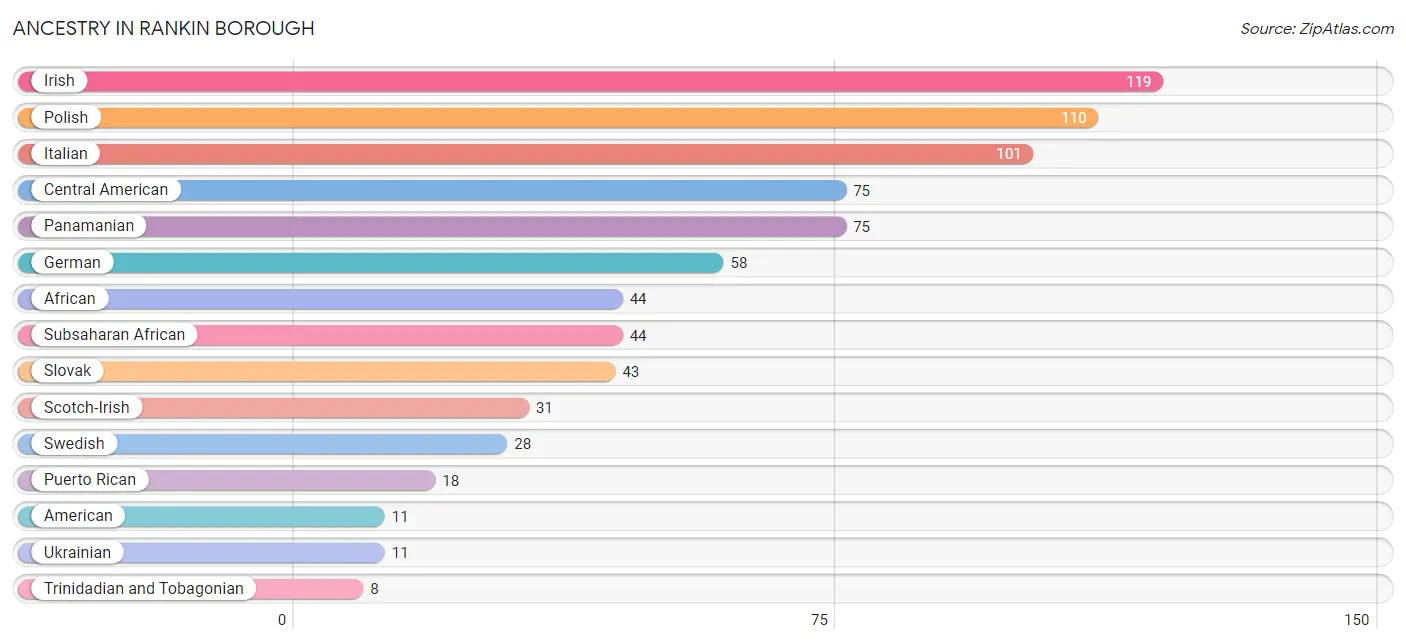
Ancestry in Rankin borough
The most populous ancestries reported in Rankin borough are Irish (119 | 6.5%), Polish (110 | 6.0%), Italian (101 | 5.5%), Central American (75 | 4.1%), and Panamanian (75 | 4.1%), together accounting for 26.1% of all Rankin borough residents.
| Ancestry | # Population | % Population |
| African | 44 | 2.4% |
| American | 11 | 0.6% |
| Carpatho Rusyn | 7 | 0.4% |
| Central American | 75 | 4.1% |
| Croatian | 6 | 0.3% |
| English | 4 | 0.2% |
| German | 58 | 3.2% |
| Greek | 4 | 0.2% |
| Hungarian | 5 | 0.3% |
| Irish | 119 | 6.5% |
| Italian | 101 | 5.5% |
| Panamanian | 75 | 4.1% |
| Polish | 110 | 6.0% |
| Puerto Rican | 18 | 1.0% |
| Russian | 3 | 0.2% |
| Scotch-Irish | 31 | 1.7% |
| Slovak | 43 | 2.3% |
| Subsaharan African | 44 | 2.4% |
| Swedish | 28 | 1.5% |
| Trinidadian and Tobagonian | 8 | 0.4% |
| Ukrainian | 11 | 0.6% | View All 21 Rows |
Immigrants in Rankin borough

| Immigration Origin | # Population | % Population | View All 0 Rows |
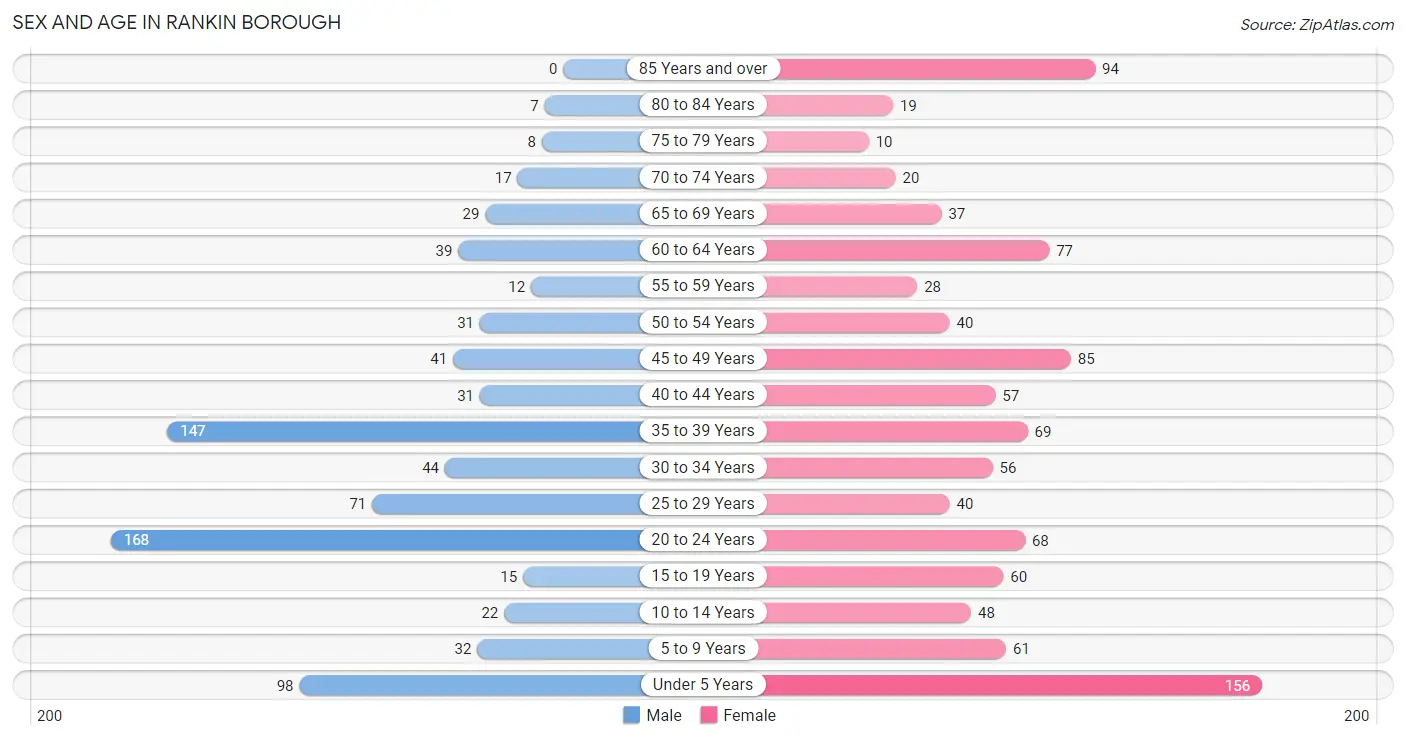
Sex and Age in Rankin borough
Sex and Age in Rankin borough
The most populous age groups in Rankin borough are 20 to 24 Years (168 | 20.7%) for men and Under 5 Years (156 | 15.2%) for women.
| Age Bracket | Male | Female |
| Under 5 Years | 98 (12.1%) | 156 (15.2%) |
| 5 to 9 Years | 32 (3.9%) | 61 (5.9%) |
| 10 to 14 Years | 22 (2.7%) | 48 (4.7%) |
| 15 to 19 Years | 15 (1.8%) | 60 (5.9%) |
| 20 to 24 Years | 168 (20.7%) | 68 (6.6%) |
| 25 to 29 Years | 71 (8.7%) | 40 (3.9%) |
| 30 to 34 Years | 44 (5.4%) | 56 (5.5%) |
| 35 to 39 Years | 147 (18.1%) | 69 (6.7%) |
| 40 to 44 Years | 31 (3.8%) | 57 (5.6%) |
| 45 to 49 Years | 41 (5.1%) | 85 (8.3%) |
| 50 to 54 Years | 31 (3.8%) | 40 (3.9%) |
| 55 to 59 Years | 12 (1.5%) | 28 (2.7%) |
| 60 to 64 Years | 39 (4.8%) | 77 (7.5%) |
| 65 to 69 Years | 29 (3.6%) | 37 (3.6%) |
| 70 to 74 Years | 17 (2.1%) | 20 (1.9%) |
| 75 to 79 Years | 8 (1.0%) | 10 (1.0%) |
| 80 to 84 Years | 7 (0.9%) | 19 (1.8%) |
| 85 Years and over | 0 (0.0%) | 94 (9.2%) |
| Total | 812 (100.0%) | 1,025 (100.0%) |
Families and Households in Rankin borough
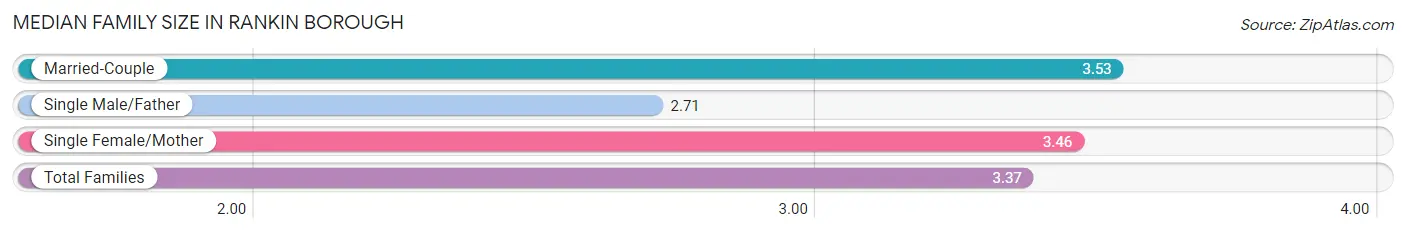
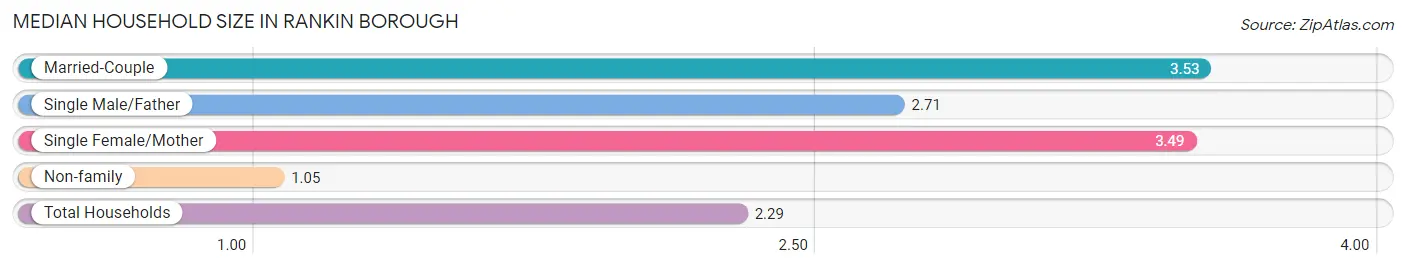
Median Family Size in Rankin borough
The median family size in Rankin borough is 3.37 persons per family, with married-couple families (97 | 22.9%) accounting for the largest median family size of 3.53 persons per family. On the other hand, single male/father families (58 | 13.7%) represent the smallest median family size with 2.71 persons per family.
| Family Type | # Families | Family Size |
| Married-Couple | 97 (22.9%) | 3.53 |
| Single Male/Father | 58 (13.7%) | 2.71 |
| Single Female/Mother | 268 (63.4%) | 3.46 |
| Total Families | 423 (100.0%) | 3.37 |
Median Household Size in Rankin borough
The median household size in Rankin borough is 2.29 persons per household, with married-couple households (97 | 12.1%) accounting for the largest median household size of 3.53 persons per household. non-family households (376 | 47.1%) represent the smallest median household size with 1.05 persons per household.
| Household Type | # Households | Household Size |
| Married-Couple | 97 (12.1%) | 3.53 |
| Single Male/Father | 58 (7.3%) | 2.71 |
| Single Female/Mother | 268 (33.5%) | 3.49 |
| Non-family | 376 (47.1%) | 1.05 |
| Total Households | 799 (100.0%) | 2.29 |
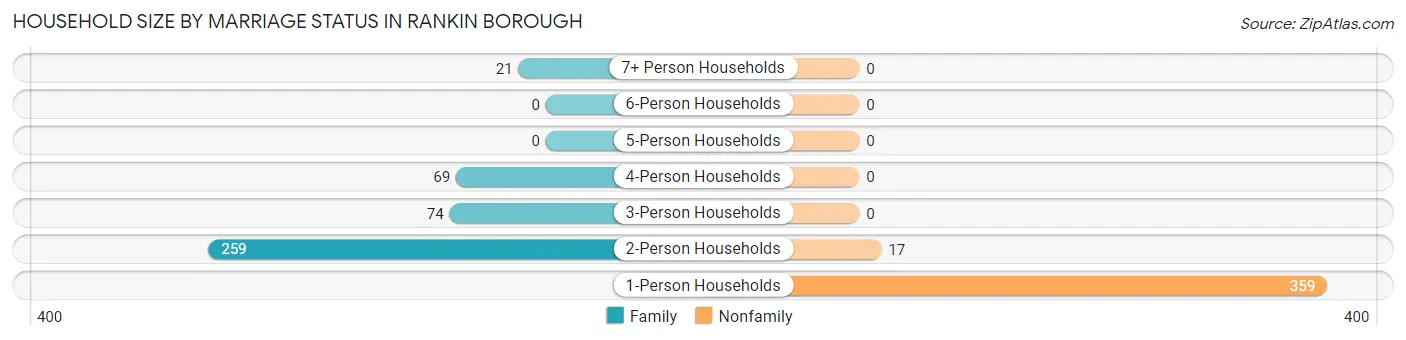
Household Size by Marriage Status in Rankin borough
Out of a total of 799 households in Rankin borough, 423 (52.9%) are family households, while 376 (47.1%) are nonfamily households. The most numerous type of family households are 2-person households, comprising 259, and the most common type of nonfamily households are 1-person households, comprising 359.
| Household Size | Family Households | Nonfamily Households |
| 1-Person Households | - | 359 (44.9%) |
| 2-Person Households | 259 (32.4%) | 17 (2.1%) |
| 3-Person Households | 74 (9.3%) | 0 (0.0%) |
| 4-Person Households | 69 (8.6%) | 0 (0.0%) |
| 5-Person Households | 0 (0.0%) | 0 (0.0%) |
| 6-Person Households | 0 (0.0%) | 0 (0.0%) |
| 7+ Person Households | 21 (2.6%) | 0 (0.0%) |
| Total | 423 (52.9%) | 376 (47.1%) |
Female Fertility in Rankin borough
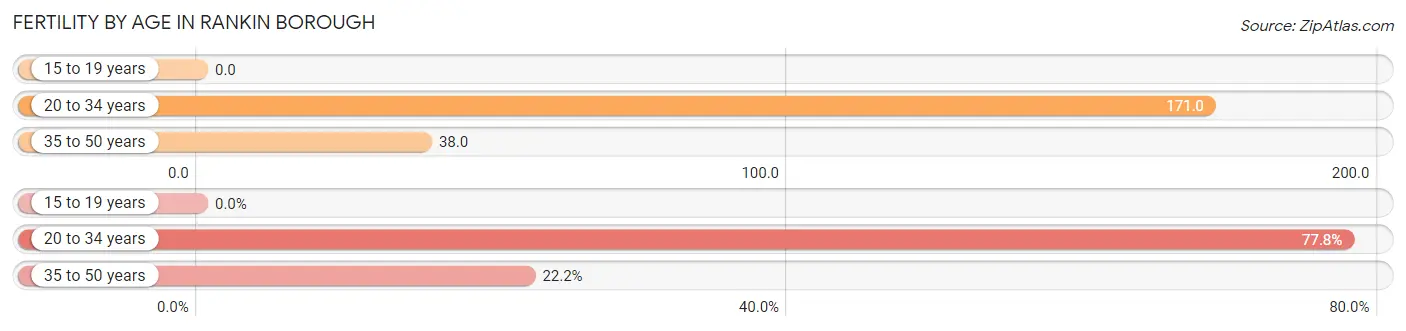
Fertility by Age in Rankin borough
Average fertility rate in Rankin borough is 83.0 births per 1,000 women. Women in the age bracket of 20 to 34 years have the highest fertility rate with 171.0 births per 1,000 women. Women in the age bracket of 20 to 34 years acount for 77.8% of all women with births.
| Age Bracket | Women with Births | Births / 1,000 Women |
| 15 to 19 years | 0 (0.0%) | 0.0 |
| 20 to 34 years | 28 (77.8%) | 171.0 |
| 35 to 50 years | 8 (22.2%) | 38.0 |
| Total | 36 (100.0%) | 83.0 |
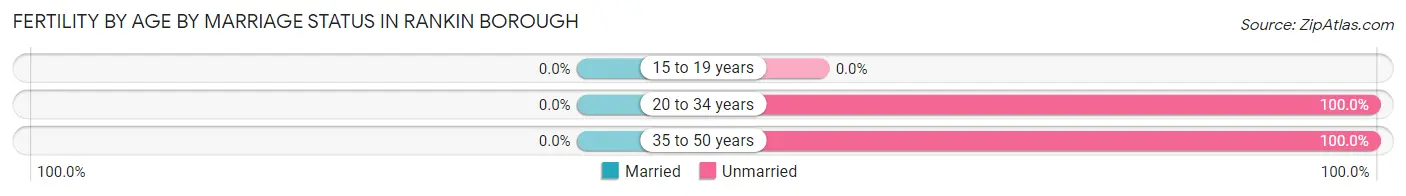
Fertility by Age by Marriage Status in Rankin borough
| Age Bracket | Married | Unmarried |
| 15 to 19 years | 0 (0.0%) | 0 (0.0%) |
| 20 to 34 years | 0 (0.0%) | 28 (100.0%) |
| 35 to 50 years | 0 (0.0%) | 8 (100.0%) |
| Total | 0 (0.0%) | 36 (100.0%) |
Fertility by Education in Rankin borough
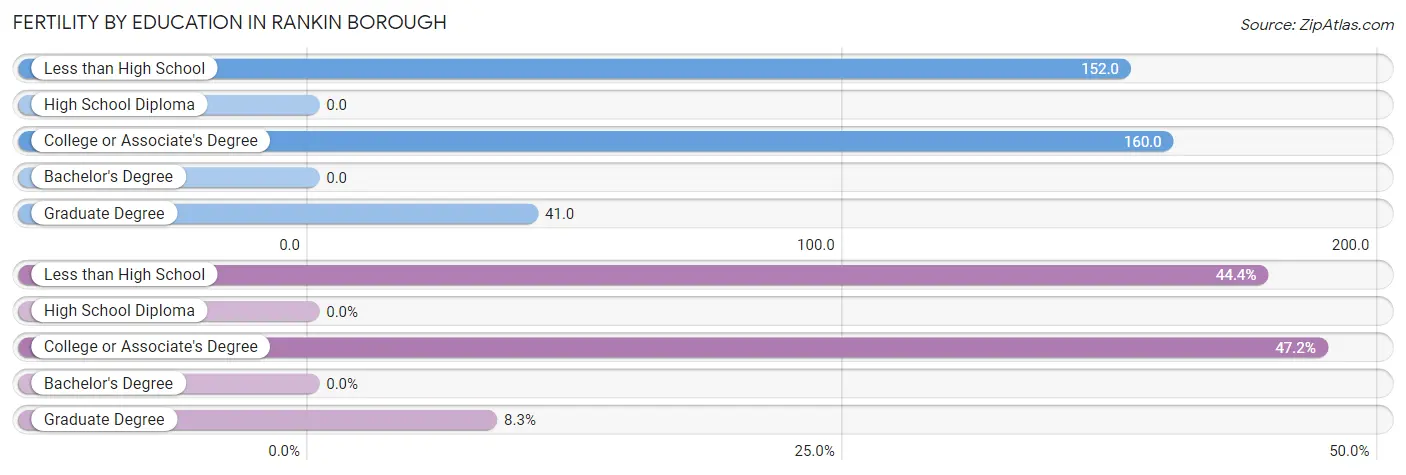
| Educational Attainment | Women with Births | Births / 1,000 Women |
| Less than High School | 16 (44.4%) | 152.0 |
| High School Diploma | 0 (0.0%) | 0.0 |
| College or Associate's Degree | 17 (47.2%) | 160.0 |
| Bachelor's Degree | 0 (0.0%) | 0.0 |
| Graduate Degree | 3 (8.3%) | 41.0 |
| Total | 36 (100.0%) | 83.0 |
Fertility by Education by Marriage Status in Rankin borough
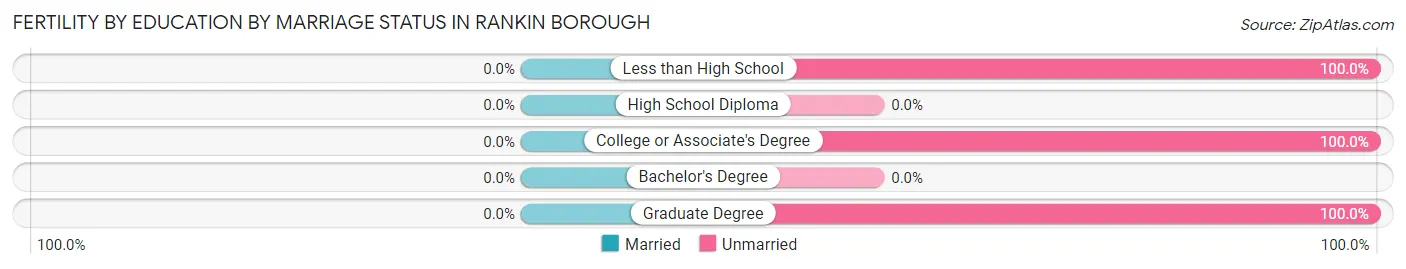
| Educational Attainment | Married | Unmarried |
| Less than High School | 0 (0.0%) | 16 (100.0%) |
| High School Diploma | 0 (0.0%) | 0 (0.0%) |
| College or Associate's Degree | 0 (0.0%) | 17 (100.0%) |
| Bachelor's Degree | 0 (0.0%) | 0 (0.0%) |
| Graduate Degree | 0 (0.0%) | 3 (100.0%) |
| Total | 0 (0.0%) | 36 (100.0%) |
Employment Characteristics in Rankin borough
Employment by Class of Employer in Rankin borough
Among the 721 employed individuals in Rankin borough, private company employees (478 | 66.3%), not-for-profit organizations (105 | 14.6%), and local government employees (87 | 12.1%) make up the most common classes of employment.
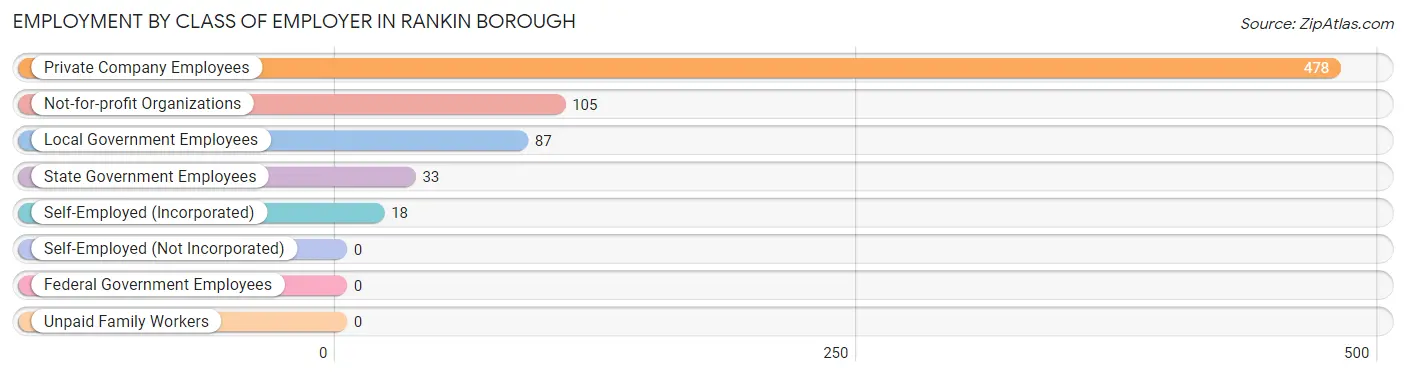
| Employer Class | # Employees | % Employees |
| Private Company Employees | 478 | 66.3% |
| Self-Employed (Incorporated) | 18 | 2.5% |
| Self-Employed (Not Incorporated) | 0 | 0.0% |
| Not-for-profit Organizations | 105 | 14.6% |
| Local Government Employees | 87 | 12.1% |
| State Government Employees | 33 | 4.6% |
| Federal Government Employees | 0 | 0.0% |
| Unpaid Family Workers | 0 | 0.0% |
| Total | 721 | 100.0% |
Employment Status by Age in Rankin borough
According to the labor force statistics for Rankin borough, out of the total population over 16 years of age (1,420), 62.5% or 888 individuals are in the labor force, with 18.2% or 162 of them unemployed. The age group with the highest labor force participation rate is 25 to 29 years, with 100.0% or 111 individuals in the labor force. Within the labor force, the 55 to 59 years age range has the highest percentage of unemployed individuals, with 60.0% or 12 of them being unemployed.
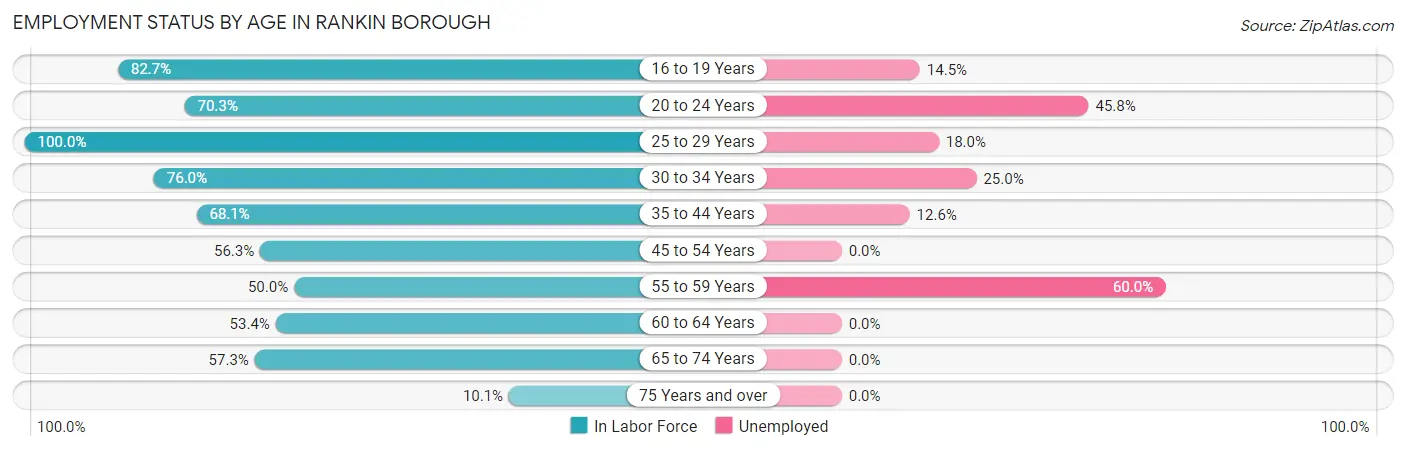
| Age Bracket | In Labor Force | Unemployed |
| 16 to 19 Years | 62 (82.7%) | 9 (14.5%) |
| 20 to 24 Years | 166 (70.3%) | 76 (45.8%) |
| 25 to 29 Years | 111 (100.0%) | 20 (18.0%) |
| 30 to 34 Years | 76 (76.0%) | 19 (25.0%) |
| 35 to 44 Years | 207 (68.1%) | 26 (12.6%) |
| 45 to 54 Years | 111 (56.3%) | 0 (0.0%) |
| 55 to 59 Years | 20 (50.0%) | 12 (60.0%) |
| 60 to 64 Years | 62 (53.4%) | 0 (0.0%) |
| 65 to 74 Years | 59 (57.3%) | 0 (0.0%) |
| 75 Years and over | 14 (10.1%) | 0 (0.0%) |
| Total | 888 (62.5%) | 162 (18.2%) |
Employment Status by Educational Attainment in Rankin borough
According to labor force statistics for Rankin borough, 67.6% of individuals (587) out of the total population between 25 and 64 years of age (868) are in the labor force, with 13.1% or 77 of them being unemployed. The group with the highest labor force participation rate are those with the educational attainment of bachelor's degree or higher, with 87.0% or 200 individuals in the labor force. Within the labor force, individuals with bachelor's degree or higher education have the highest percentage of unemployment, with 19.0% or 38 of them being unemployed.
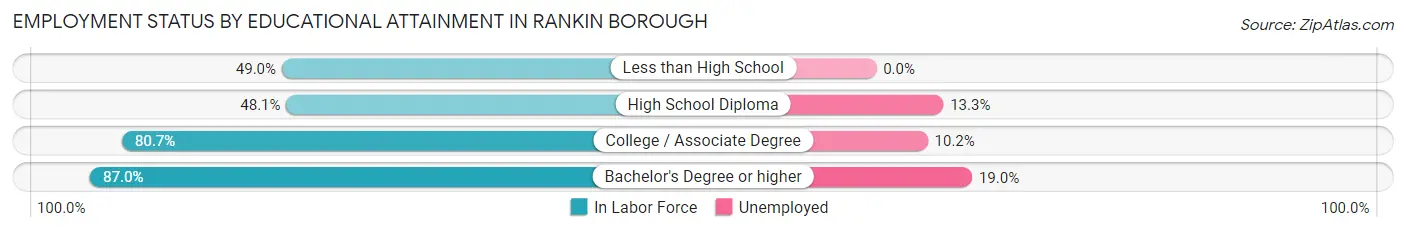
| Educational Attainment | In Labor Force | Unemployed |
| Less than High School | 48 (49.0%) | 0 (0.0%) |
| High School Diploma | 143 (48.1%) | 40 (13.3%) |
| College / Associate Degree | 196 (80.7%) | 25 (10.2%) |
| Bachelor's Degree or higher | 200 (87.0%) | 44 (19.0%) |
| Total | 587 (67.6%) | 114 (13.1%) |
Employment Occupations by Sex in Rankin borough
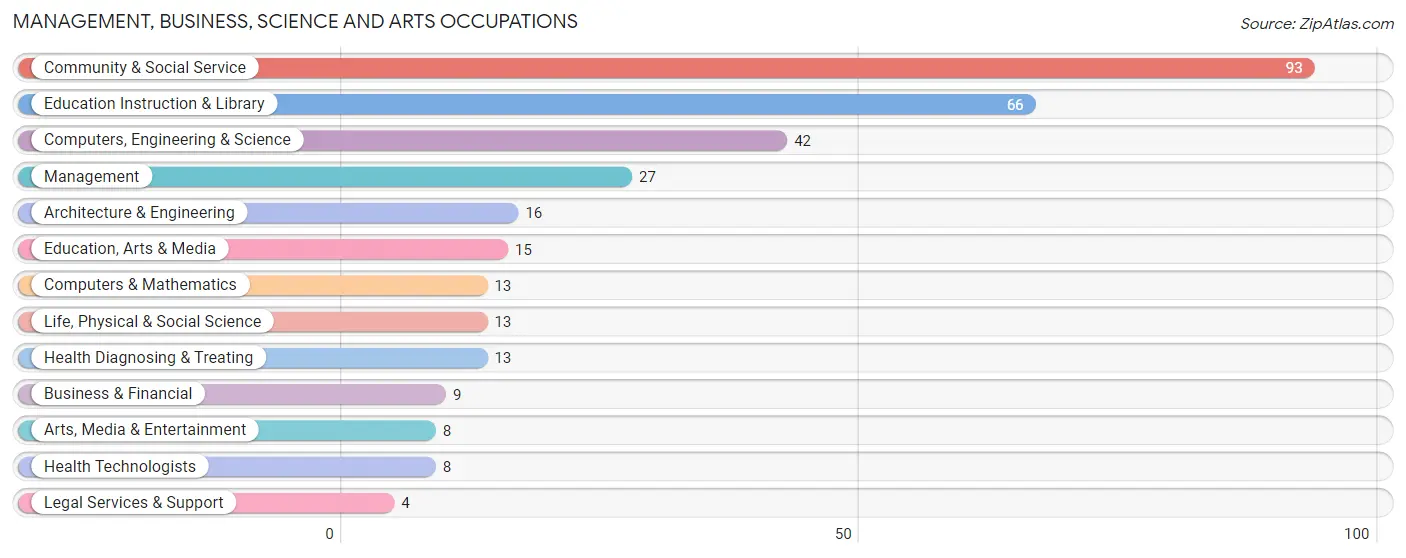
Management, Business, Science and Arts Occupations
The most common Management, Business, Science and Arts occupations in Rankin borough are Community & Social Service (93 | 12.8%), Education Instruction & Library (66 | 9.1%), Computers, Engineering & Science (42 | 5.8%), Management (27 | 3.7%), and Architecture & Engineering (16 | 2.2%).
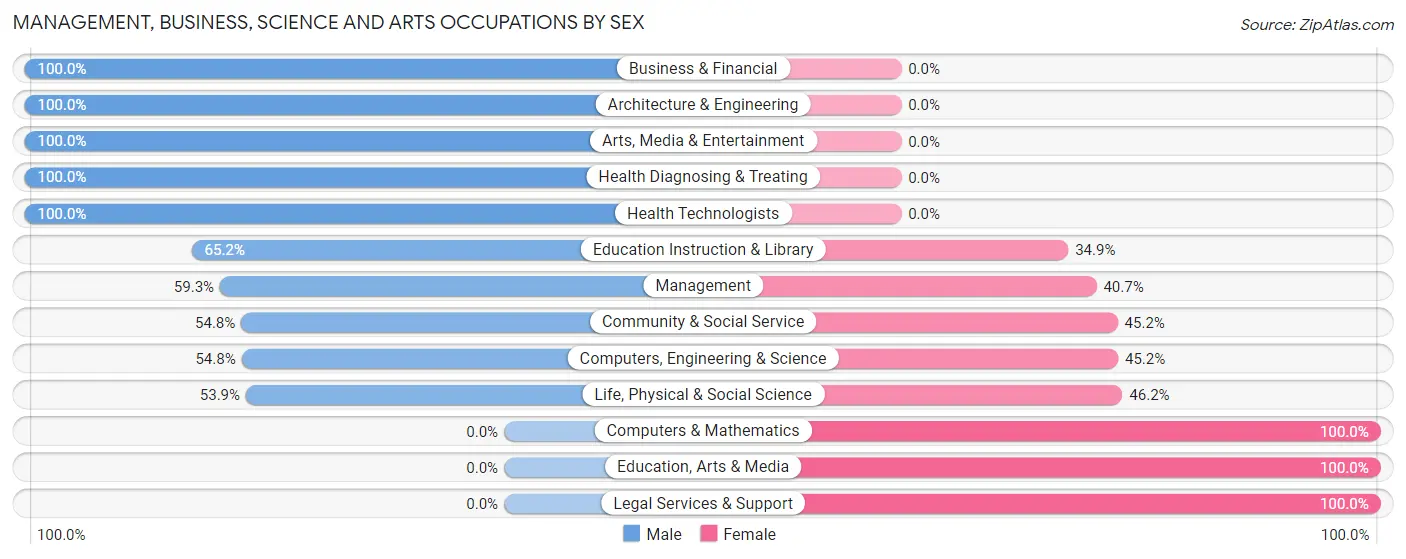
Management, Business, Science and Arts Occupations by Sex
Within the Management, Business, Science and Arts occupations in Rankin borough, the most male-oriented occupations are Business & Financial (100.0%), Architecture & Engineering (100.0%), and Arts, Media & Entertainment (100.0%), while the most female-oriented occupations are Computers & Mathematics (100.0%), Education, Arts & Media (100.0%), and Legal Services & Support (100.0%).
| Occupation | Male | Female |
| Management | 16 (59.3%) | 11 (40.7%) |
| Business & Financial | 9 (100.0%) | 0 (0.0%) |
| Computers, Engineering & Science | 23 (54.8%) | 19 (45.2%) |
| Computers & Mathematics | 0 (0.0%) | 13 (100.0%) |
| Architecture & Engineering | 16 (100.0%) | 0 (0.0%) |
| Life, Physical & Social Science | 7 (53.8%) | 6 (46.2%) |
| Community & Social Service | 51 (54.8%) | 42 (45.2%) |
| Education, Arts & Media | 0 (0.0%) | 15 (100.0%) |
| Legal Services & Support | 0 (0.0%) | 4 (100.0%) |
| Education Instruction & Library | 43 (65.1%) | 23 (34.8%) |
| Arts, Media & Entertainment | 8 (100.0%) | 0 (0.0%) |
| Health Diagnosing & Treating | 13 (100.0%) | 0 (0.0%) |
| Health Technologists | 8 (100.0%) | 0 (0.0%) |
| Total (Category) | 112 (60.9%) | 72 (39.1%) |
| Total (Overall) | 320 (44.1%) | 406 (55.9%) |
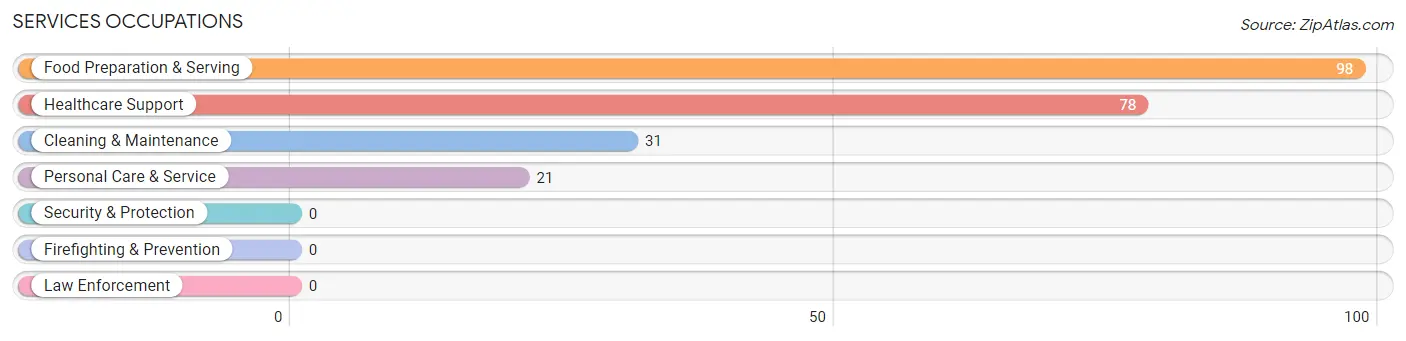
Services Occupations
The most common Services occupations in Rankin borough are Food Preparation & Serving (98 | 13.5%), Healthcare Support (78 | 10.7%), Cleaning & Maintenance (31 | 4.3%), and Personal Care & Service (21 | 2.9%).
Services Occupations by Sex
Within the Services occupations in Rankin borough, the most male-oriented occupations are Food Preparation & Serving (73.5%), and Cleaning & Maintenance (58.1%), while the most female-oriented occupations are Healthcare Support (100.0%), Personal Care & Service (100.0%), and Cleaning & Maintenance (41.9%).
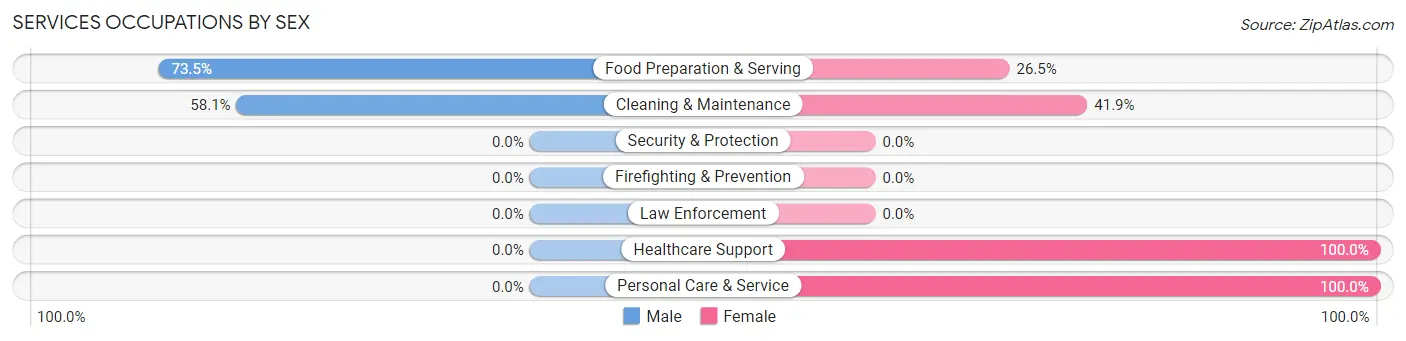
| Occupation | Male | Female |
| Healthcare Support | 0 (0.0%) | 78 (100.0%) |
| Security & Protection | 0 (0.0%) | 0 (0.0%) |
| Firefighting & Prevention | 0 (0.0%) | 0 (0.0%) |
| Law Enforcement | 0 (0.0%) | 0 (0.0%) |
| Food Preparation & Serving | 72 (73.5%) | 26 (26.5%) |
| Cleaning & Maintenance | 18 (58.1%) | 13 (41.9%) |
| Personal Care & Service | 0 (0.0%) | 21 (100.0%) |
| Total (Category) | 90 (39.5%) | 138 (60.5%) |
| Total (Overall) | 320 (44.1%) | 406 (55.9%) |
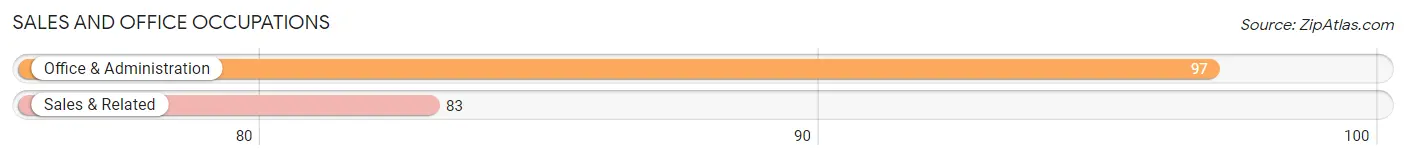
Sales and Office Occupations
The most common Sales and Office occupations in Rankin borough are Office & Administration (97 | 13.4%), and Sales & Related (83 | 11.4%).
Sales and Office Occupations by Sex
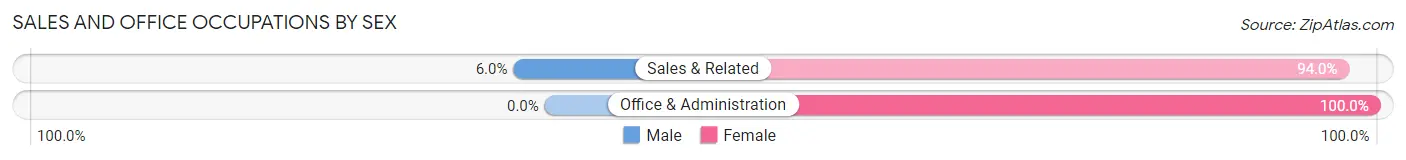
| Occupation | Male | Female |
| Sales & Related | 5 (6.0%) | 78 (94.0%) |
| Office & Administration | 0 (0.0%) | 97 (100.0%) |
| Total (Category) | 5 (2.8%) | 175 (97.2%) |
| Total (Overall) | 320 (44.1%) | 406 (55.9%) |
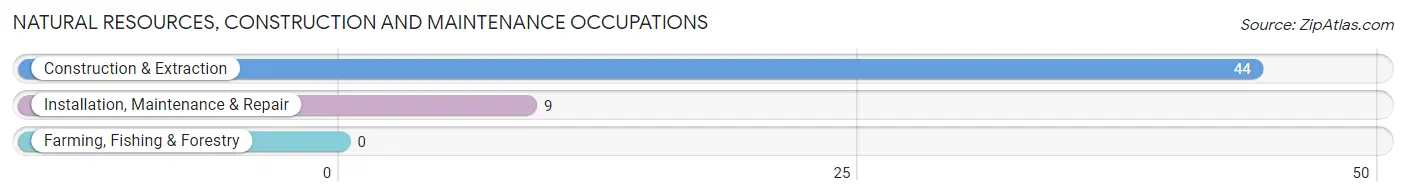
Natural Resources, Construction and Maintenance Occupations
The most common Natural Resources, Construction and Maintenance occupations in Rankin borough are Construction & Extraction (44 | 6.1%), and Installation, Maintenance & Repair (9 | 1.2%).
Natural Resources, Construction and Maintenance Occupations by Sex
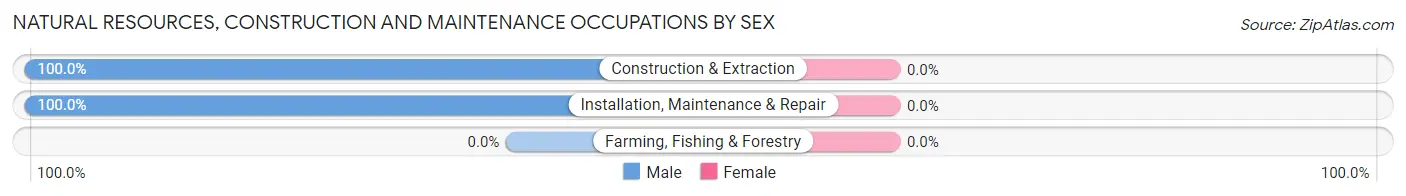
| Occupation | Male | Female |
| Farming, Fishing & Forestry | 0 (0.0%) | 0 (0.0%) |
| Construction & Extraction | 44 (100.0%) | 0 (0.0%) |
| Installation, Maintenance & Repair | 9 (100.0%) | 0 (0.0%) |
| Total (Category) | 53 (100.0%) | 0 (0.0%) |
| Total (Overall) | 320 (44.1%) | 406 (55.9%) |
Production, Transportation and Moving Occupations
The most common Production, Transportation and Moving occupations in Rankin borough are Material Moving (71 | 9.8%), and Production (10 | 1.4%).
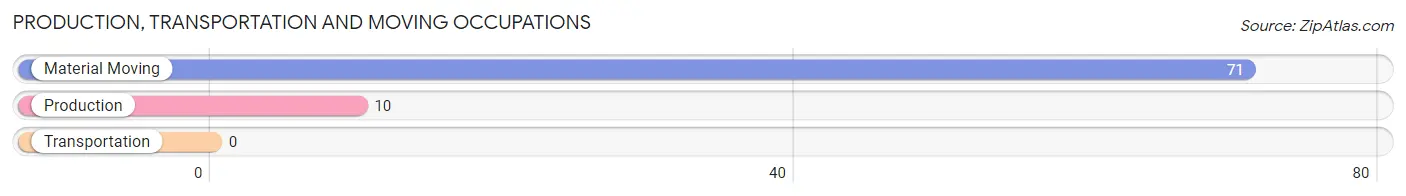
Production, Transportation and Moving Occupations by Sex
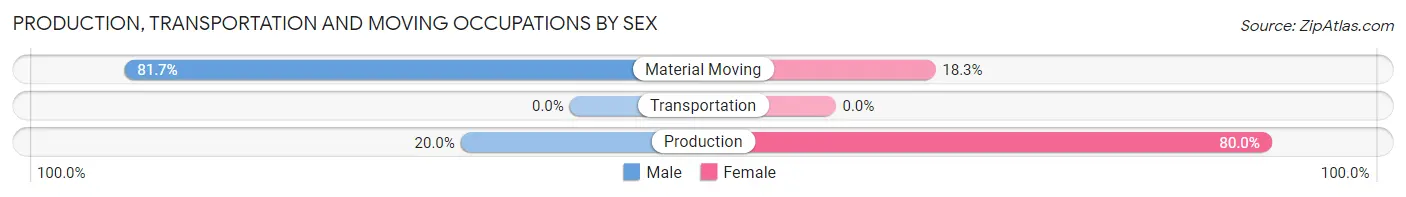
| Occupation | Male | Female |
| Production | 2 (20.0%) | 8 (80.0%) |
| Transportation | 0 (0.0%) | 0 (0.0%) |
| Material Moving | 58 (81.7%) | 13 (18.3%) |
| Total (Category) | 60 (74.1%) | 21 (25.9%) |
| Total (Overall) | 320 (44.1%) | 406 (55.9%) |
Employment Industries by Sex in Rankin borough
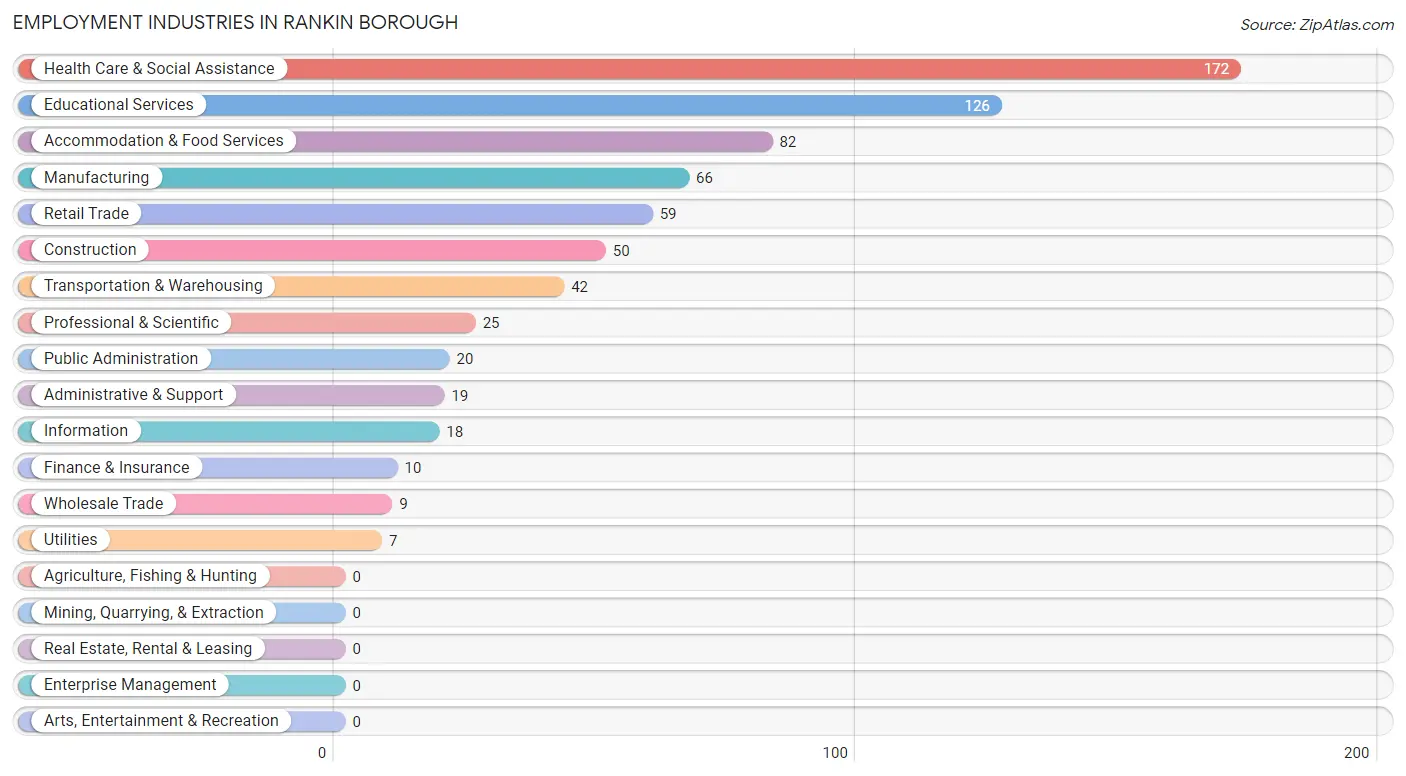
Employment Industries in Rankin borough
The major employment industries in Rankin borough include Health Care & Social Assistance (172 | 23.7%), Educational Services (126 | 17.4%), Accommodation & Food Services (82 | 11.3%), Manufacturing (66 | 9.1%), and Retail Trade (59 | 8.1%).
Employment Industries by Sex in Rankin borough
The Rankin borough industries that see more men than women are Construction (100.0%), Wholesale Trade (100.0%), and Utilities (100.0%), whereas the industries that tend to have a higher number of women are Retail Trade (100.0%), Information (100.0%), and Administrative & Support (100.0%).
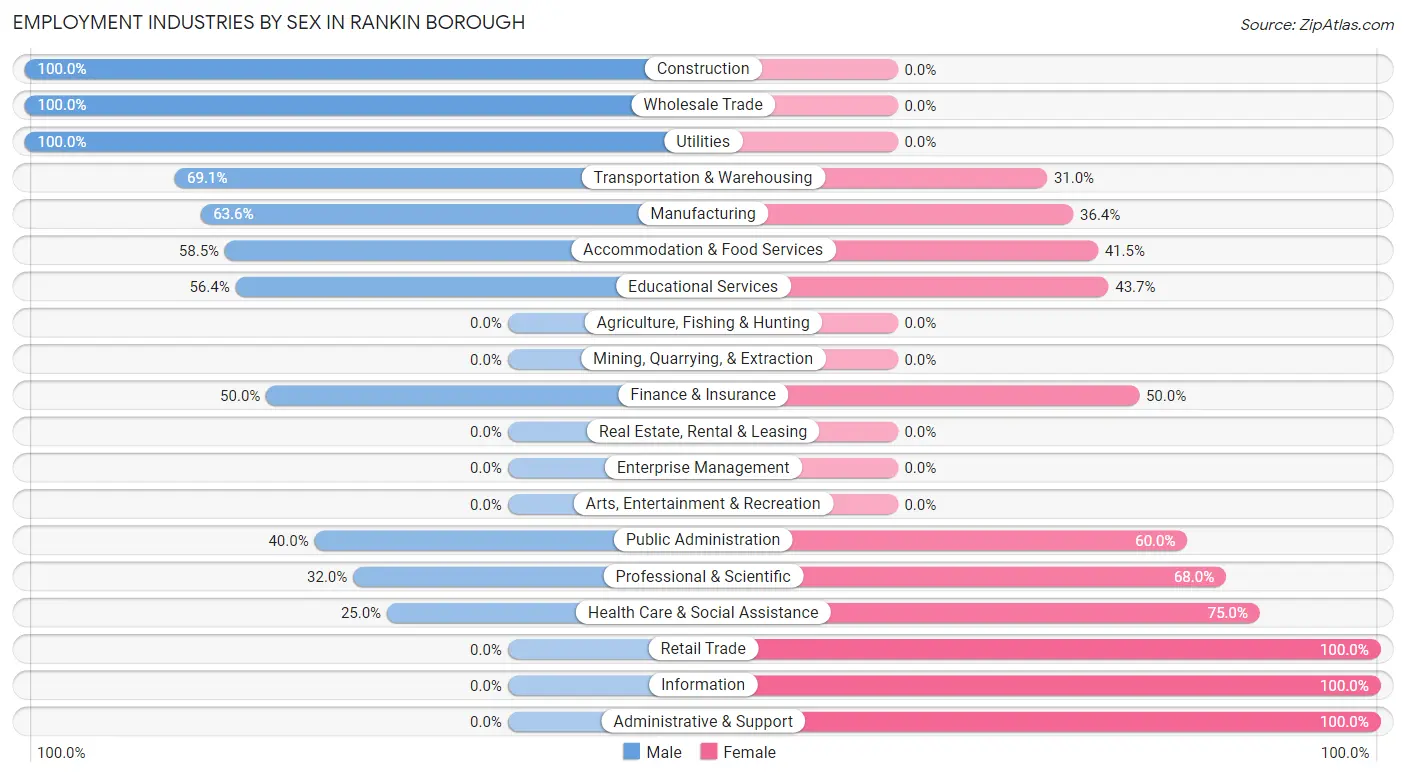
| Industry | Male | Female |
| Agriculture, Fishing & Hunting | 0 (0.0%) | 0 (0.0%) |
| Mining, Quarrying, & Extraction | 0 (0.0%) | 0 (0.0%) |
| Construction | 50 (100.0%) | 0 (0.0%) |
| Manufacturing | 42 (63.6%) | 24 (36.4%) |
| Wholesale Trade | 9 (100.0%) | 0 (0.0%) |
| Retail Trade | 0 (0.0%) | 59 (100.0%) |
| Transportation & Warehousing | 29 (69.1%) | 13 (30.9%) |
| Utilities | 7 (100.0%) | 0 (0.0%) |
| Information | 0 (0.0%) | 18 (100.0%) |
| Finance & Insurance | 5 (50.0%) | 5 (50.0%) |
| Real Estate, Rental & Leasing | 0 (0.0%) | 0 (0.0%) |
| Professional & Scientific | 8 (32.0%) | 17 (68.0%) |
| Enterprise Management | 0 (0.0%) | 0 (0.0%) |
| Administrative & Support | 0 (0.0%) | 19 (100.0%) |
| Educational Services | 71 (56.4%) | 55 (43.6%) |
| Health Care & Social Assistance | 43 (25.0%) | 129 (75.0%) |
| Arts, Entertainment & Recreation | 0 (0.0%) | 0 (0.0%) |
| Accommodation & Food Services | 48 (58.5%) | 34 (41.5%) |
| Public Administration | 8 (40.0%) | 12 (60.0%) |
| Total | 320 (44.1%) | 406 (55.9%) |
Education in Rankin borough
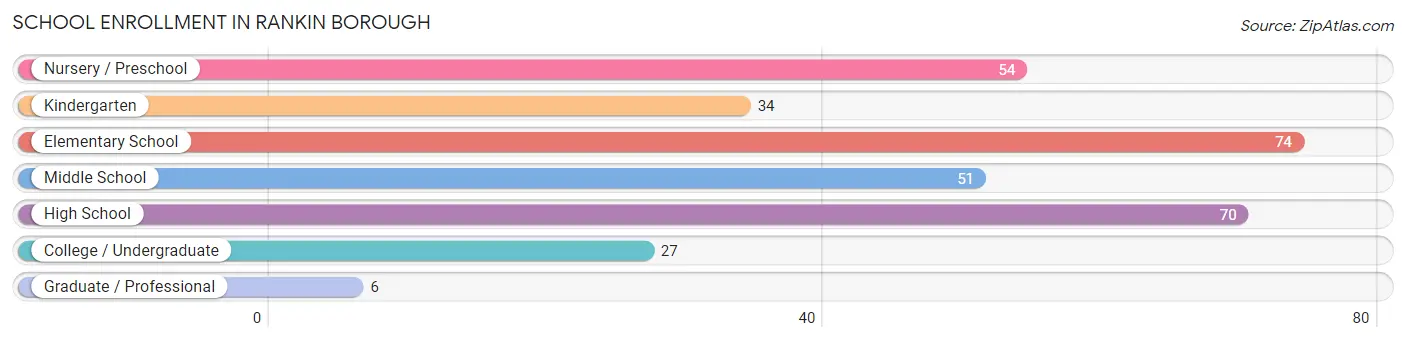
School Enrollment in Rankin borough
The most common levels of schooling among the 316 students in Rankin borough are elementary school (74 | 23.4%), high school (70 | 22.2%), and nursery / preschool (54 | 17.1%).
| School Level | # Students | % Students |
| Nursery / Preschool | 54 | 17.1% |
| Kindergarten | 34 | 10.8% |
| Elementary School | 74 | 23.4% |
| Middle School | 51 | 16.1% |
| High School | 70 | 22.2% |
| College / Undergraduate | 27 | 8.5% |
| Graduate / Professional | 6 | 1.9% |
| Total | 316 | 100.0% |
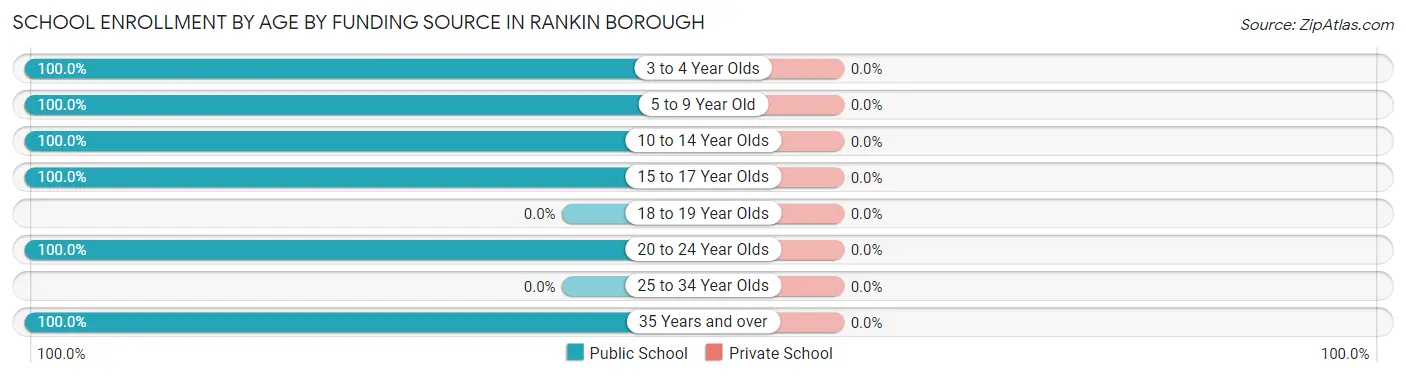
School Enrollment by Age by Funding Source in Rankin borough
| Age Bracket | Public School | Private School |
| 3 to 4 Year Olds | 54 (100.0%) | 0 (0.0%) |
| 5 to 9 Year Old | 93 (100.0%) | 0 (0.0%) |
| 10 to 14 Year Olds | 70 (100.0%) | 0 (0.0%) |
| 15 to 17 Year Olds | 66 (100.0%) | 0 (0.0%) |
| 18 to 19 Year Olds | 0 (0.0%) | 0 (0.0%) |
| 20 to 24 Year Olds | 27 (100.0%) | 0 (0.0%) |
| 25 to 34 Year Olds | 0 (0.0%) | 0 (0.0%) |
| 35 Years and over | 6 (100.0%) | 0 (0.0%) |
| Total | 316 (100.0%) | 0 (0.0%) |
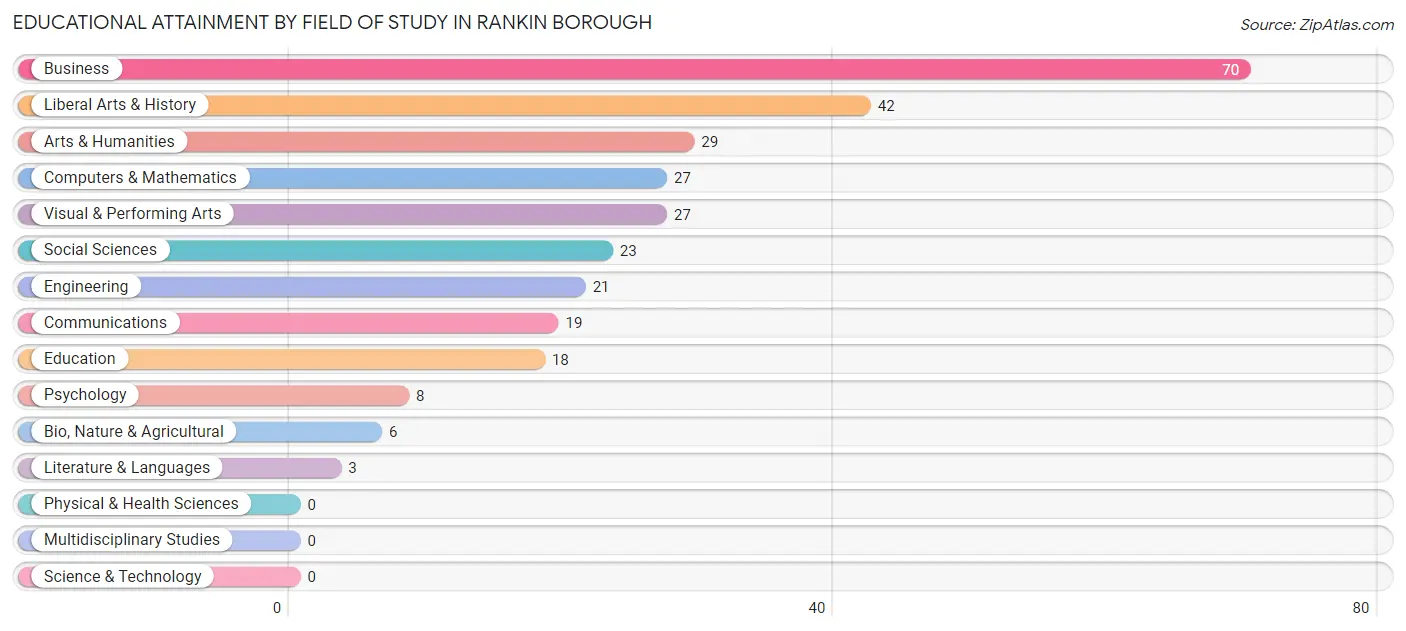
Educational Attainment by Field of Study in Rankin borough
Business (70 | 23.9%), liberal arts & history (42 | 14.3%), arts & humanities (29 | 9.9%), computers & mathematics (27 | 9.2%), and visual & performing arts (27 | 9.2%) are the most common fields of study among 293 individuals in Rankin borough who have obtained a bachelor's degree or higher.
| Field of Study | # Graduates | % Graduates |
| Computers & Mathematics | 27 | 9.2% |
| Bio, Nature & Agricultural | 6 | 2.1% |
| Physical & Health Sciences | 0 | 0.0% |
| Psychology | 8 | 2.7% |
| Social Sciences | 23 | 7.9% |
| Engineering | 21 | 7.2% |
| Multidisciplinary Studies | 0 | 0.0% |
| Science & Technology | 0 | 0.0% |
| Business | 70 | 23.9% |
| Education | 18 | 6.1% |
| Literature & Languages | 3 | 1.0% |
| Liberal Arts & History | 42 | 14.3% |
| Visual & Performing Arts | 27 | 9.2% |
| Communications | 19 | 6.5% |
| Arts & Humanities | 29 | 9.9% |
| Total | 293 | 100.0% |
Transportation & Commute in Rankin borough
Vehicle Availability by Sex in Rankin borough
The most prevalent vehicle ownership categories in Rankin borough are males with 1 vehicle (120, accounting for 38.0%) and females with 1 vehicle (186, making up 29.9%).
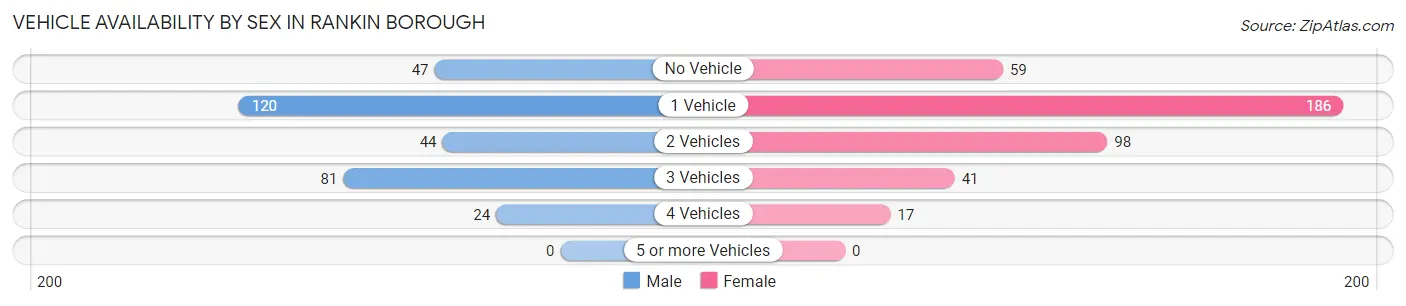
| Vehicles Available | Male | Female |
| No Vehicle | 47 (14.9%) | 59 (14.7%) |
| 1 Vehicle | 120 (38.0%) | 186 (46.4%) |
| 2 Vehicles | 44 (13.9%) | 98 (24.4%) |
| 3 Vehicles | 81 (25.6%) | 41 (10.2%) |
| 4 Vehicles | 24 (7.6%) | 17 (4.2%) |
| 5 or more Vehicles | 0 (0.0%) | 0 (0.0%) |
| Total | 316 (100.0%) | 401 (100.0%) |
Commute Time in Rankin borough
The most frequently occuring commute durations in Rankin borough are 15 to 19 minutes (139 commuters, 20.8%), 20 to 24 minutes (120 commuters, 18.0%), and 45 to 59 minutes (99 commuters, 14.8%).
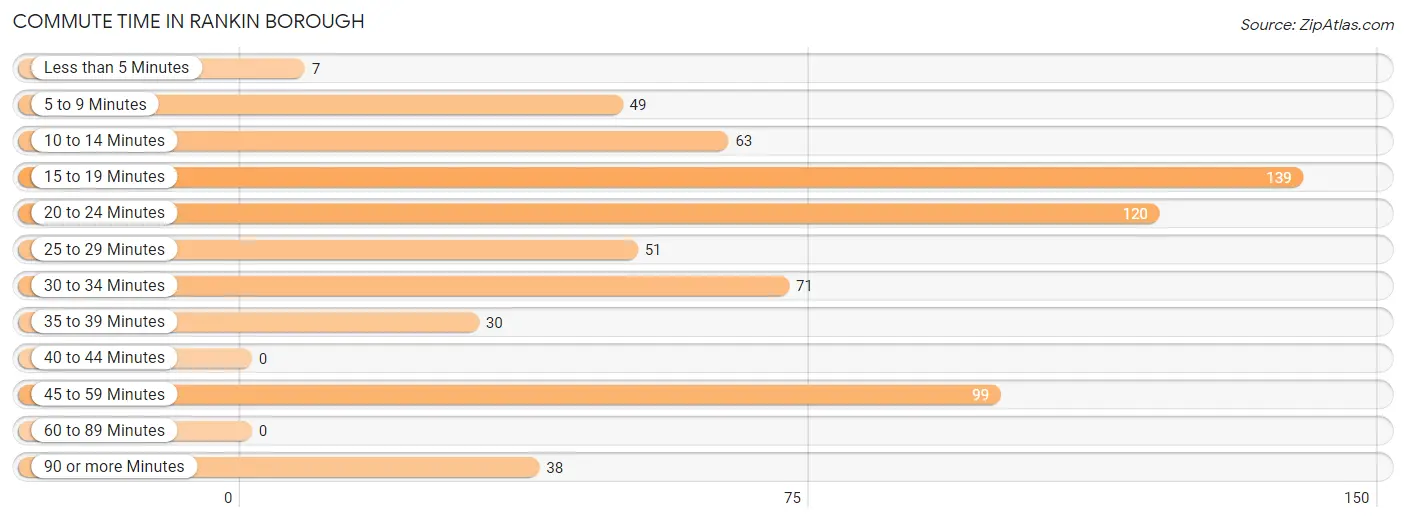
| Commute Time | # Commuters | % Commuters |
| Less than 5 Minutes | 7 | 1.1% |
| 5 to 9 Minutes | 49 | 7.3% |
| 10 to 14 Minutes | 63 | 9.5% |
| 15 to 19 Minutes | 139 | 20.8% |
| 20 to 24 Minutes | 120 | 18.0% |
| 25 to 29 Minutes | 51 | 7.6% |
| 30 to 34 Minutes | 71 | 10.6% |
| 35 to 39 Minutes | 30 | 4.5% |
| 40 to 44 Minutes | 0 | 0.0% |
| 45 to 59 Minutes | 99 | 14.8% |
| 60 to 89 Minutes | 0 | 0.0% |
| 90 or more Minutes | 38 | 5.7% |
Commute Time by Sex in Rankin borough
The most common commute times in Rankin borough are 20 to 24 minutes (76 commuters, 24.9%) for males and 15 to 19 minutes (74 commuters, 20.4%) for females.
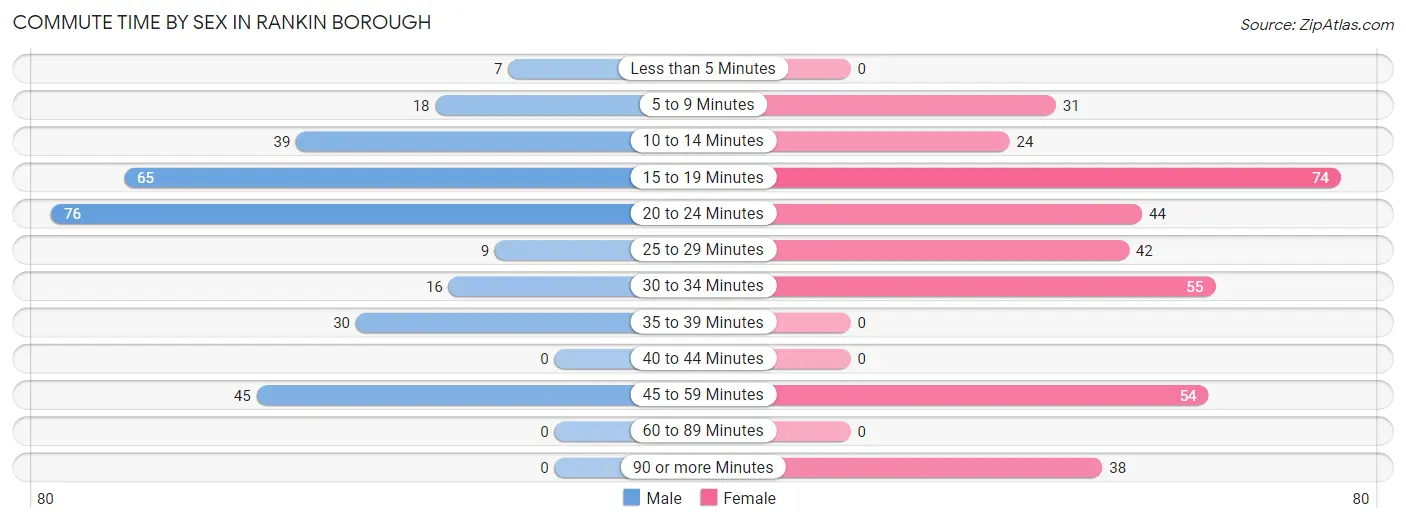
| Commute Time | Male | Female |
| Less than 5 Minutes | 7 (2.3%) | 0 (0.0%) |
| 5 to 9 Minutes | 18 (5.9%) | 31 (8.6%) |
| 10 to 14 Minutes | 39 (12.8%) | 24 (6.6%) |
| 15 to 19 Minutes | 65 (21.3%) | 74 (20.4%) |
| 20 to 24 Minutes | 76 (24.9%) | 44 (12.1%) |
| 25 to 29 Minutes | 9 (2.9%) | 42 (11.6%) |
| 30 to 34 Minutes | 16 (5.2%) | 55 (15.2%) |
| 35 to 39 Minutes | 30 (9.8%) | 0 (0.0%) |
| 40 to 44 Minutes | 0 (0.0%) | 0 (0.0%) |
| 45 to 59 Minutes | 45 (14.7%) | 54 (14.9%) |
| 60 to 89 Minutes | 0 (0.0%) | 0 (0.0%) |
| 90 or more Minutes | 0 (0.0%) | 38 (10.5%) |
Time of Departure to Work by Sex in Rankin borough
The most frequent times of departure to work in Rankin borough are 7:00 AM to 7:29 AM (96, 31.5%) for males and 8:00 AM to 8:29 AM (86, 23.8%) for females.
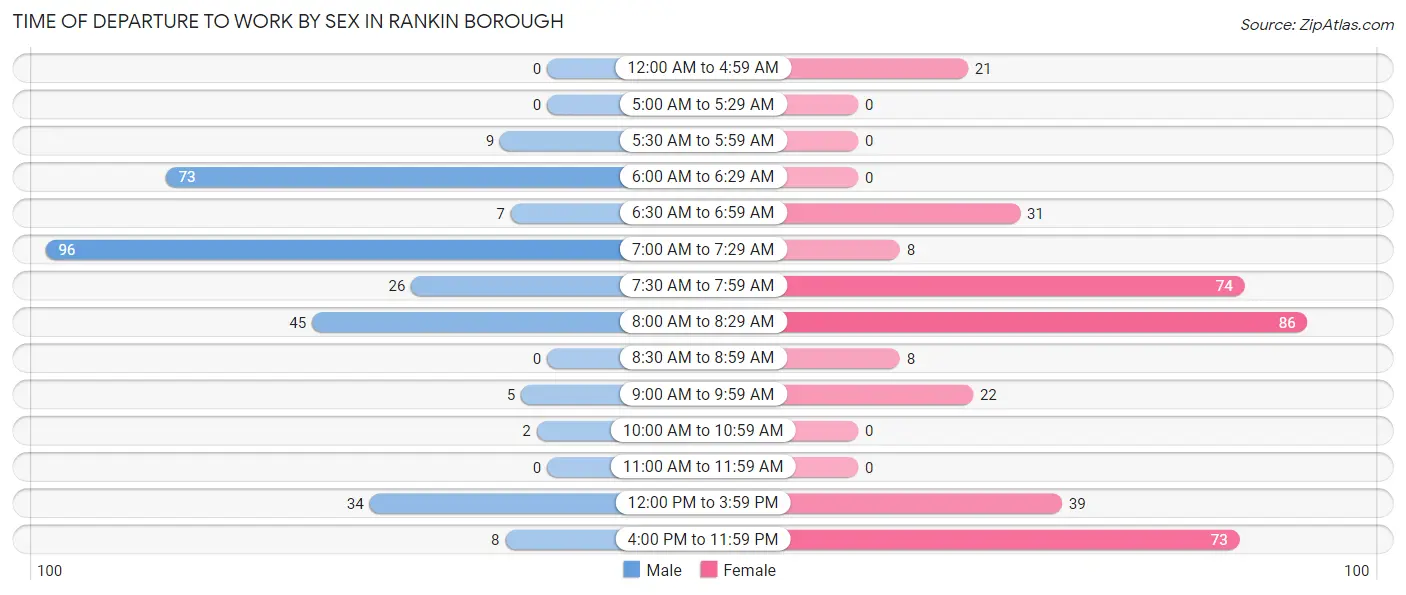
| Time of Departure | Male | Female |
| 12:00 AM to 4:59 AM | 0 (0.0%) | 21 (5.8%) |
| 5:00 AM to 5:29 AM | 0 (0.0%) | 0 (0.0%) |
| 5:30 AM to 5:59 AM | 9 (2.9%) | 0 (0.0%) |
| 6:00 AM to 6:29 AM | 73 (23.9%) | 0 (0.0%) |
| 6:30 AM to 6:59 AM | 7 (2.3%) | 31 (8.6%) |
| 7:00 AM to 7:29 AM | 96 (31.5%) | 8 (2.2%) |
| 7:30 AM to 7:59 AM | 26 (8.5%) | 74 (20.4%) |
| 8:00 AM to 8:29 AM | 45 (14.7%) | 86 (23.8%) |
| 8:30 AM to 8:59 AM | 0 (0.0%) | 8 (2.2%) |
| 9:00 AM to 9:59 AM | 5 (1.6%) | 22 (6.1%) |
| 10:00 AM to 10:59 AM | 2 (0.7%) | 0 (0.0%) |
| 11:00 AM to 11:59 AM | 0 (0.0%) | 0 (0.0%) |
| 12:00 PM to 3:59 PM | 34 (11.2%) | 39 (10.8%) |
| 4:00 PM to 11:59 PM | 8 (2.6%) | 73 (20.2%) |
| Total | 305 (100.0%) | 362 (100.0%) |
Housing Occupancy in Rankin borough
Occupancy by Ownership in Rankin borough
Of the total 799 dwellings in Rankin borough, owner-occupied units account for 279 (34.9%), while renter-occupied units make up 520 (65.1%).
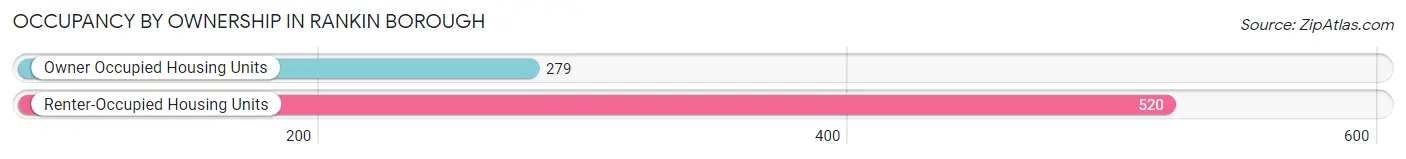
| Occupancy | # Housing Units | % Housing Units |
| Owner Occupied Housing Units | 279 | 34.9% |
| Renter-Occupied Housing Units | 520 | 65.1% |
| Total Occupied Housing Units | 799 | 100.0% |
Occupancy by Household Size in Rankin borough
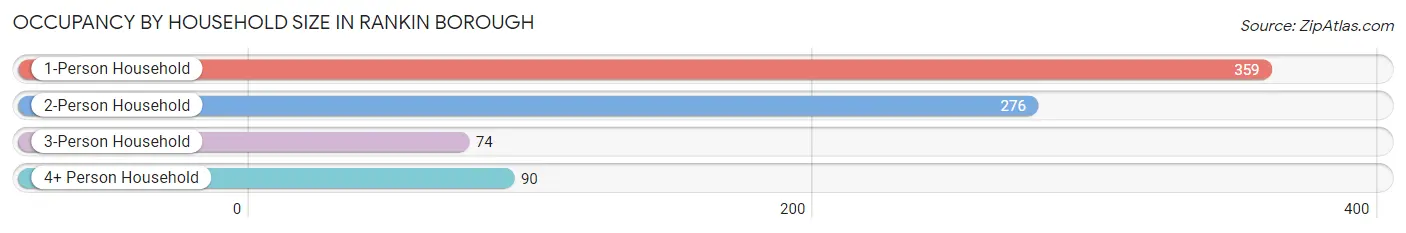
| Household Size | # Housing Units | % Housing Units |
| 1-Person Household | 359 | 44.9% |
| 2-Person Household | 276 | 34.5% |
| 3-Person Household | 74 | 9.3% |
| 4+ Person Household | 90 | 11.3% |
| Total Housing Units | 799 | 100.0% |
Occupancy by Ownership by Household Size in Rankin borough
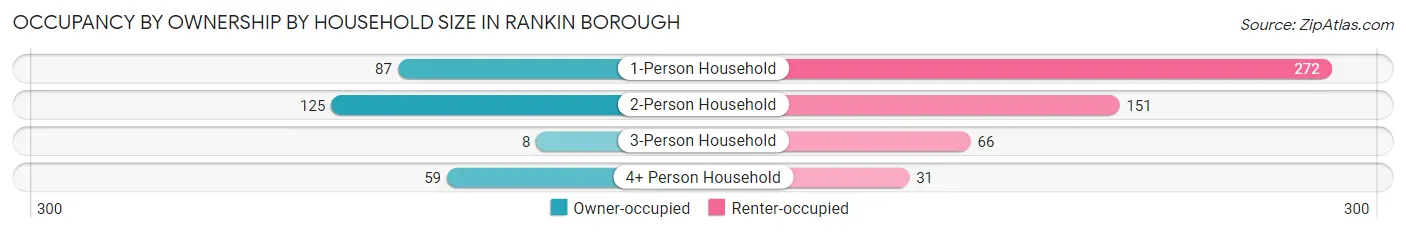
| Household Size | Owner-occupied | Renter-occupied |
| 1-Person Household | 87 (24.2%) | 272 (75.8%) |
| 2-Person Household | 125 (45.3%) | 151 (54.7%) |
| 3-Person Household | 8 (10.8%) | 66 (89.2%) |
| 4+ Person Household | 59 (65.6%) | 31 (34.4%) |
| Total Housing Units | 279 (34.9%) | 520 (65.1%) |
Occupancy by Educational Attainment in Rankin borough
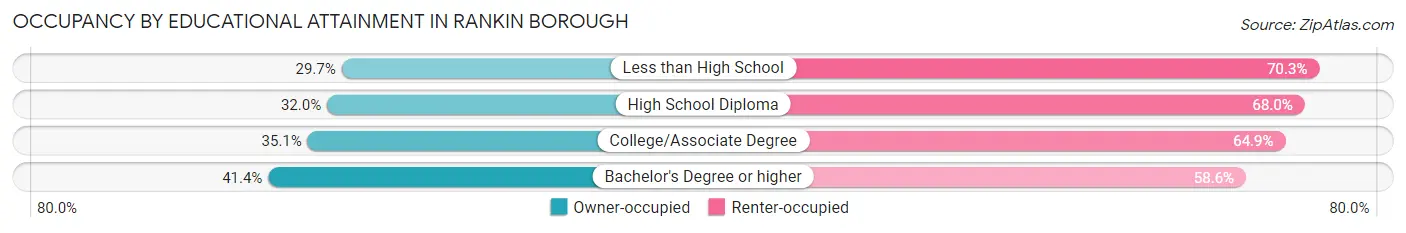
| Household Size | Owner-occupied | Renter-occupied |
| Less than High School | 22 (29.7%) | 52 (70.3%) |
| High School Diploma | 99 (32.0%) | 210 (68.0%) |
| College/Associate Degree | 79 (35.1%) | 146 (64.9%) |
| Bachelor's Degree or higher | 79 (41.4%) | 112 (58.6%) |
Occupancy by Age of Householder in Rankin borough
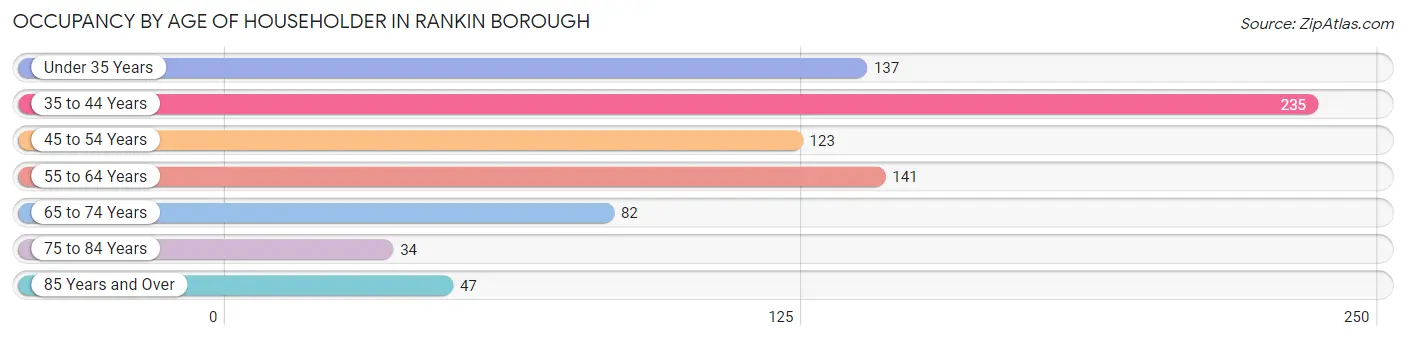
| Age Bracket | # Households | % Households |
| Under 35 Years | 137 | 17.2% |
| 35 to 44 Years | 235 | 29.4% |
| 45 to 54 Years | 123 | 15.4% |
| 55 to 64 Years | 141 | 17.6% |
| 65 to 74 Years | 82 | 10.3% |
| 75 to 84 Years | 34 | 4.3% |
| 85 Years and Over | 47 | 5.9% |
| Total | 799 | 100.0% |
Housing Finances in Rankin borough
Median Income by Occupancy in Rankin borough
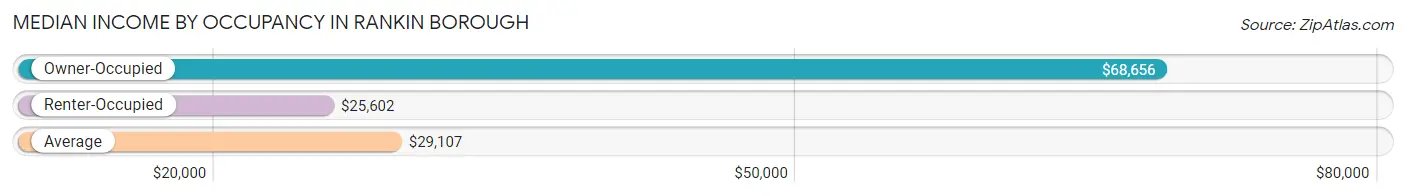
| Occupancy Type | # Households | Median Income |
| Owner-Occupied | 279 (34.9%) | $68,656 |
| Renter-Occupied | 520 (65.1%) | $25,602 |
| Average | 799 (100.0%) | $29,107 |
Occupancy by Householder Income Bracket in Rankin borough
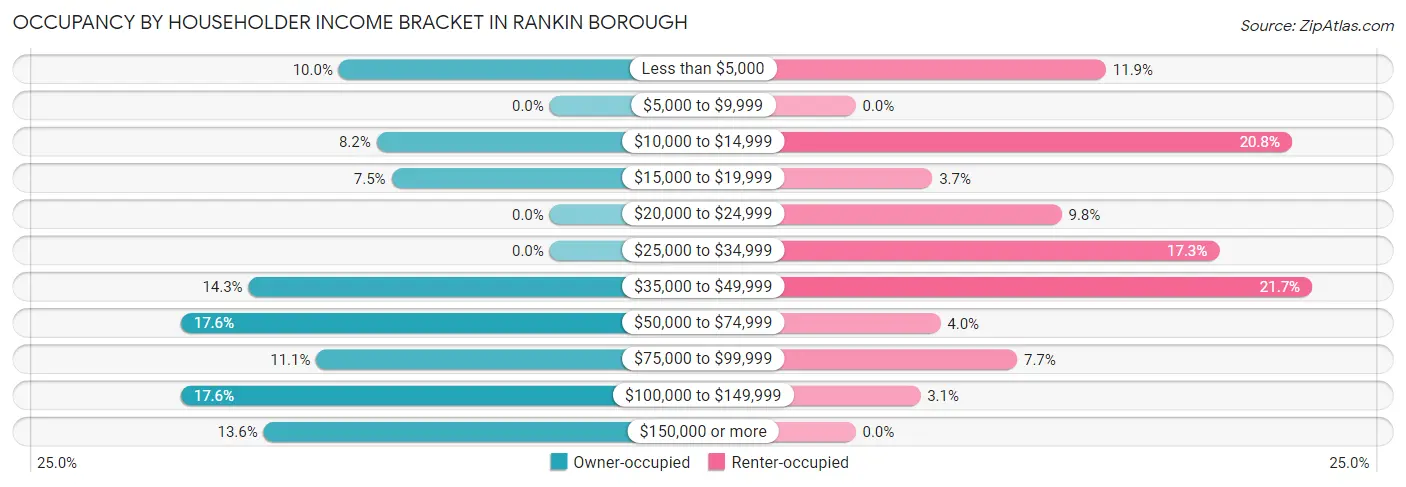
| Income Bracket | Owner-occupied | Renter-occupied |
| Less than $5,000 | 28 (10.0%) | 62 (11.9%) |
| $5,000 to $9,999 | 0 (0.0%) | 0 (0.0%) |
| $10,000 to $14,999 | 23 (8.2%) | 108 (20.8%) |
| $15,000 to $19,999 | 21 (7.5%) | 19 (3.6%) |
| $20,000 to $24,999 | 0 (0.0%) | 51 (9.8%) |
| $25,000 to $34,999 | 0 (0.0%) | 90 (17.3%) |
| $35,000 to $49,999 | 40 (14.3%) | 113 (21.7%) |
| $50,000 to $74,999 | 49 (17.6%) | 21 (4.0%) |
| $75,000 to $99,999 | 31 (11.1%) | 40 (7.7%) |
| $100,000 to $149,999 | 49 (17.6%) | 16 (3.1%) |
| $150,000 or more | 38 (13.6%) | 0 (0.0%) |
| Total | 279 (100.0%) | 520 (100.0%) |
Monthly Housing Cost Tiers in Rankin borough
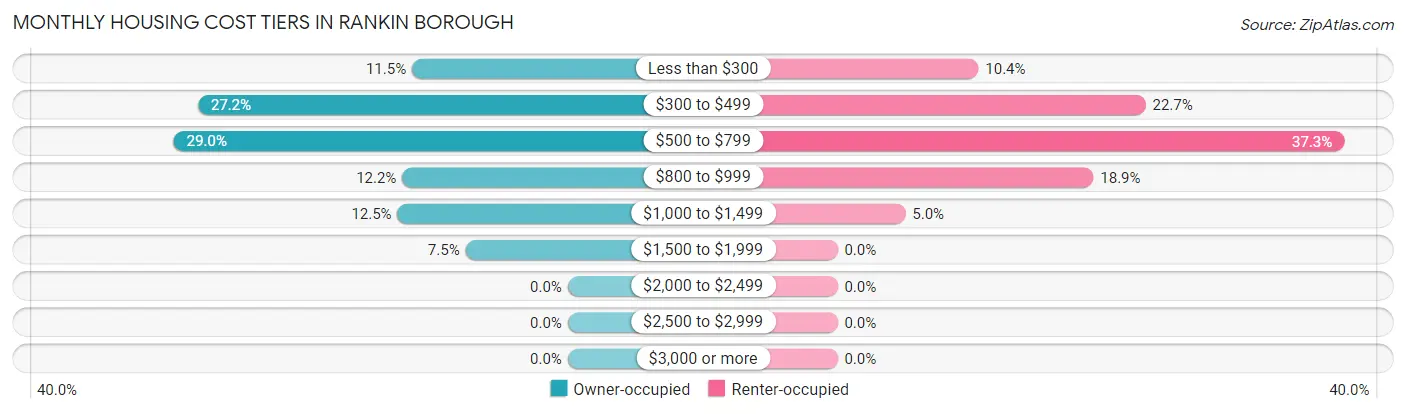
| Monthly Cost | Owner-occupied | Renter-occupied |
| Less than $300 | 32 (11.5%) | 54 (10.4%) |
| $300 to $499 | 76 (27.2%) | 118 (22.7%) |
| $500 to $799 | 81 (29.0%) | 194 (37.3%) |
| $800 to $999 | 34 (12.2%) | 98 (18.9%) |
| $1,000 to $1,499 | 35 (12.5%) | 26 (5.0%) |
| $1,500 to $1,999 | 21 (7.5%) | 0 (0.0%) |
| $2,000 to $2,499 | 0 (0.0%) | 0 (0.0%) |
| $2,500 to $2,999 | 0 (0.0%) | 0 (0.0%) |
| $3,000 or more | 0 (0.0%) | 0 (0.0%) |
| Total | 279 (100.0%) | 520 (100.0%) |
Physical Housing Characteristics in Rankin borough
Housing Structures in Rankin borough
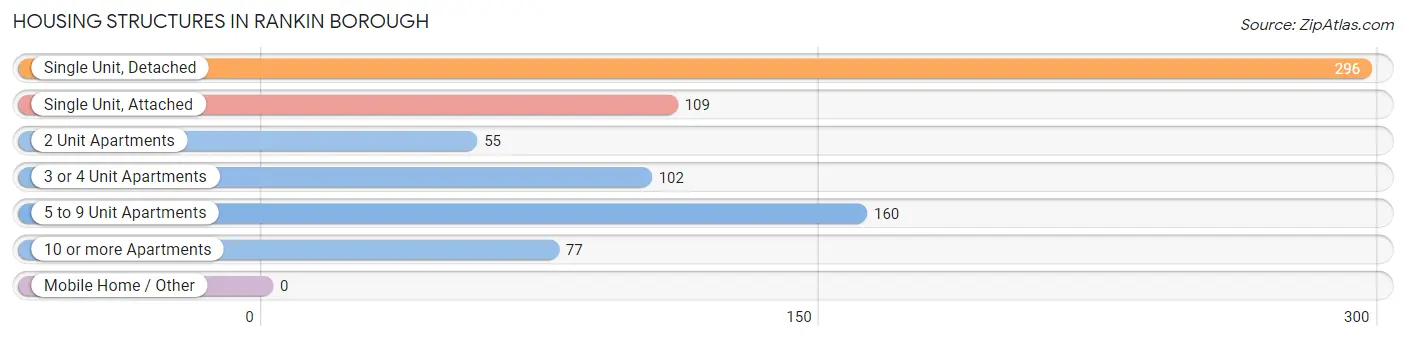
| Structure Type | # Housing Units | % Housing Units |
| Single Unit, Detached | 296 | 37.0% |
| Single Unit, Attached | 109 | 13.6% |
| 2 Unit Apartments | 55 | 6.9% |
| 3 or 4 Unit Apartments | 102 | 12.8% |
| 5 to 9 Unit Apartments | 160 | 20.0% |
| 10 or more Apartments | 77 | 9.6% |
| Mobile Home / Other | 0 | 0.0% |
| Total | 799 | 100.0% |
Housing Structures by Occupancy in Rankin borough
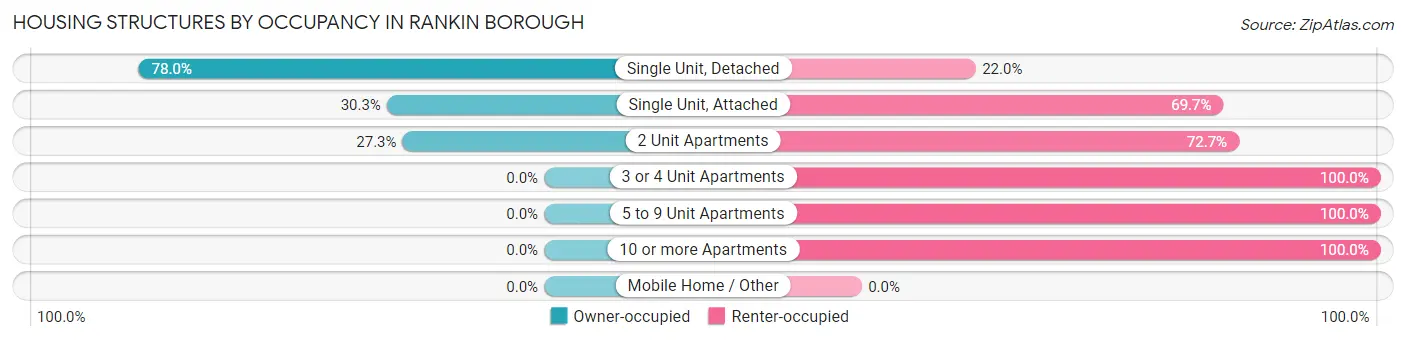
| Structure Type | Owner-occupied | Renter-occupied |
| Single Unit, Detached | 231 (78.0%) | 65 (22.0%) |
| Single Unit, Attached | 33 (30.3%) | 76 (69.7%) |
| 2 Unit Apartments | 15 (27.3%) | 40 (72.7%) |
| 3 or 4 Unit Apartments | 0 (0.0%) | 102 (100.0%) |
| 5 to 9 Unit Apartments | 0 (0.0%) | 160 (100.0%) |
| 10 or more Apartments | 0 (0.0%) | 77 (100.0%) |
| Mobile Home / Other | 0 (0.0%) | 0 (0.0%) |
| Total | 279 (34.9%) | 520 (65.1%) |
Housing Structures by Number of Rooms in Rankin borough
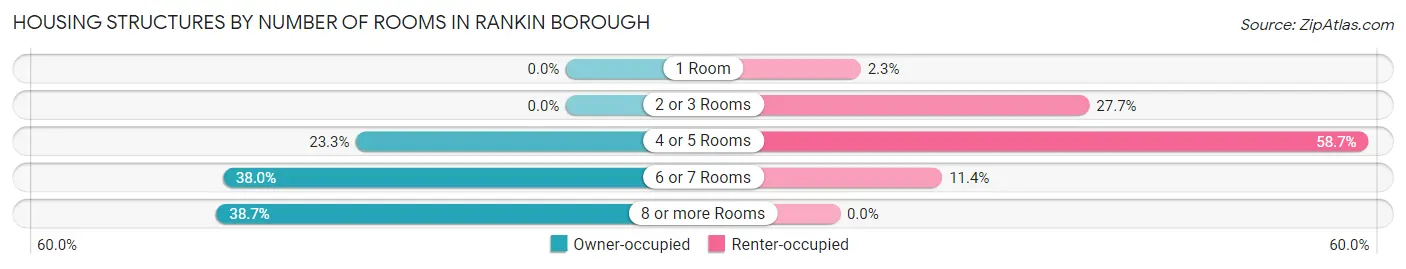
| Number of Rooms | Owner-occupied | Renter-occupied |
| 1 Room | 0 (0.0%) | 12 (2.3%) |
| 2 or 3 Rooms | 0 (0.0%) | 144 (27.7%) |
| 4 or 5 Rooms | 65 (23.3%) | 305 (58.7%) |
| 6 or 7 Rooms | 106 (38.0%) | 59 (11.4%) |
| 8 or more Rooms | 108 (38.7%) | 0 (0.0%) |
| Total | 279 (100.0%) | 520 (100.0%) |
Housing Structure by Heating Type in Rankin borough
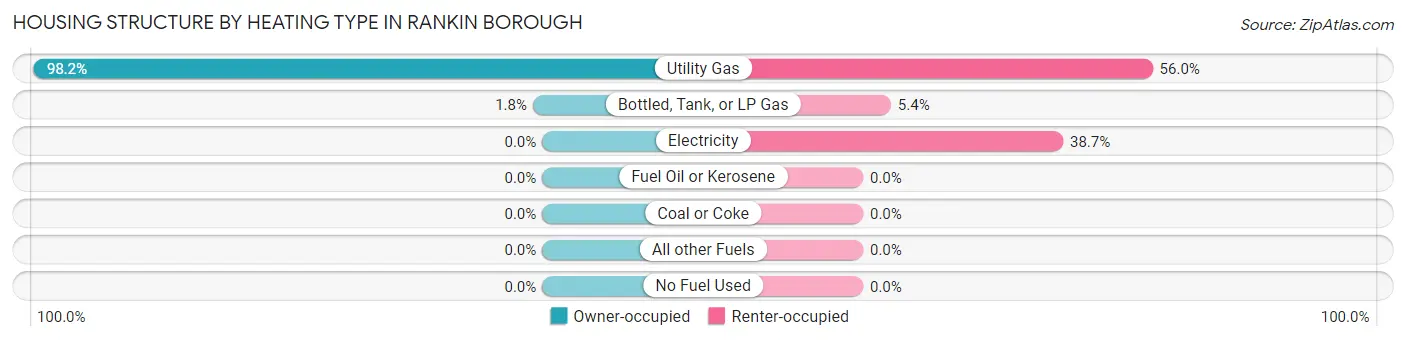
| Heating Type | Owner-occupied | Renter-occupied |
| Utility Gas | 274 (98.2%) | 291 (56.0%) |
| Bottled, Tank, or LP Gas | 5 (1.8%) | 28 (5.4%) |
| Electricity | 0 (0.0%) | 201 (38.7%) |
| Fuel Oil or Kerosene | 0 (0.0%) | 0 (0.0%) |
| Coal or Coke | 0 (0.0%) | 0 (0.0%) |
| All other Fuels | 0 (0.0%) | 0 (0.0%) |
| No Fuel Used | 0 (0.0%) | 0 (0.0%) |
| Total | 279 (100.0%) | 520 (100.0%) |
Household Vehicle Usage in Rankin borough
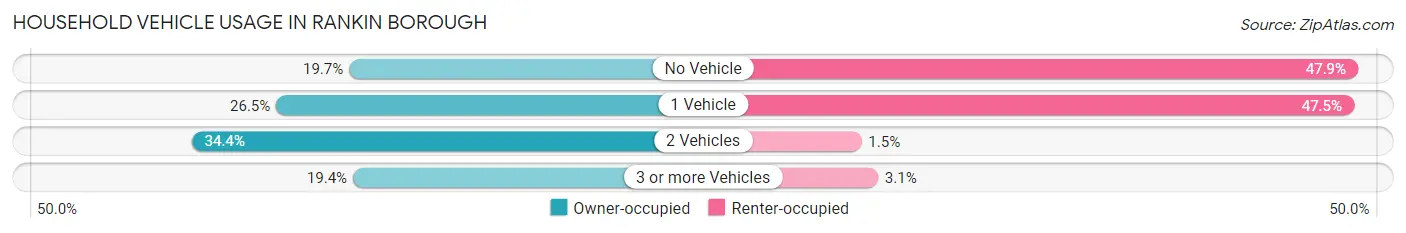
| Vehicles per Household | Owner-occupied | Renter-occupied |
| No Vehicle | 55 (19.7%) | 249 (47.9%) |
| 1 Vehicle | 74 (26.5%) | 247 (47.5%) |
| 2 Vehicles | 96 (34.4%) | 8 (1.5%) |
| 3 or more Vehicles | 54 (19.4%) | 16 (3.1%) |
| Total | 279 (100.0%) | 520 (100.0%) |
Real Estate & Mortgages in Rankin borough
Real Estate and Mortgage Overview in Rankin borough
| Characteristic | Without Mortgage | With Mortgage |
| Housing Units | 145 | 134 |
| Median Property Value | $63,100 | $83,700 |
| Median Household Income | - | - |
| Monthly Housing Costs | $456 | $0 |
| Real Estate Taxes | $1,113 | $0 |
Property Value by Mortgage Status in Rankin borough
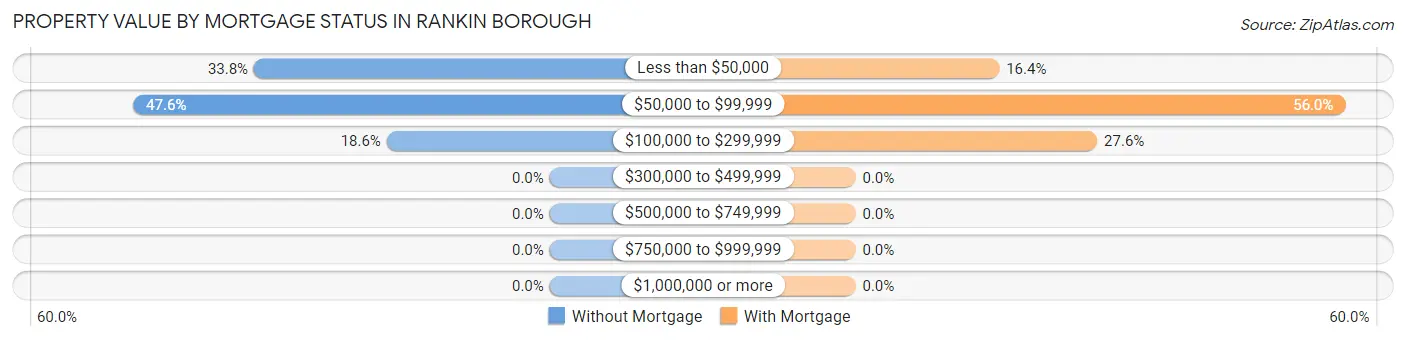
| Property Value | Without Mortgage | With Mortgage |
| Less than $50,000 | 49 (33.8%) | 22 (16.4%) |
| $50,000 to $99,999 | 69 (47.6%) | 75 (56.0%) |
| $100,000 to $299,999 | 27 (18.6%) | 37 (27.6%) |
| $300,000 to $499,999 | 0 (0.0%) | 0 (0.0%) |
| $500,000 to $749,999 | 0 (0.0%) | 0 (0.0%) |
| $750,000 to $999,999 | 0 (0.0%) | 0 (0.0%) |
| $1,000,000 or more | 0 (0.0%) | 0 (0.0%) |
| Total | 145 (100.0%) | 134 (100.0%) |
Household Income by Mortgage Status in Rankin borough
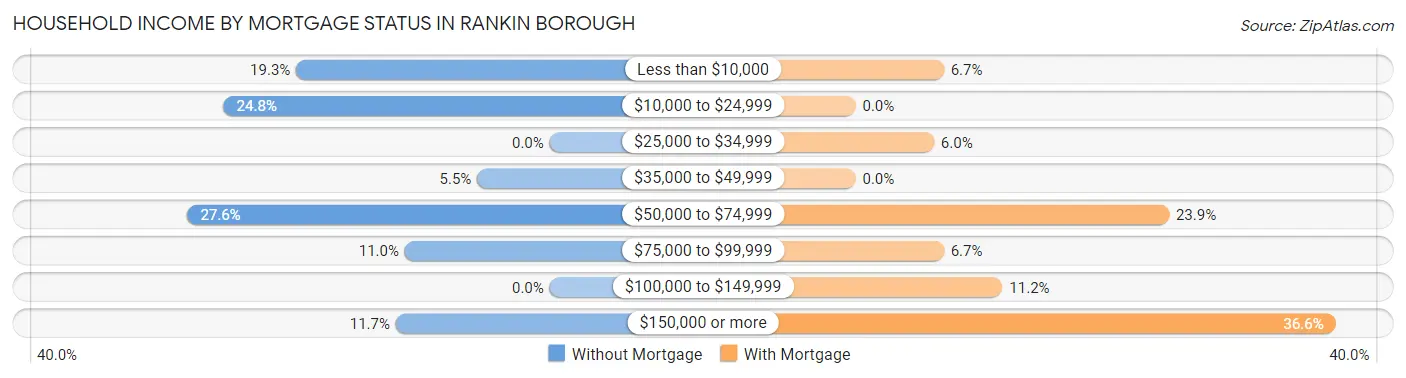
| Household Income | Without Mortgage | With Mortgage |
| Less than $10,000 | 28 (19.3%) | 9 (6.7%) |
| $10,000 to $24,999 | 36 (24.8%) | 0 (0.0%) |
| $25,000 to $34,999 | 0 (0.0%) | 8 (6.0%) |
| $35,000 to $49,999 | 8 (5.5%) | 0 (0.0%) |
| $50,000 to $74,999 | 40 (27.6%) | 32 (23.9%) |
| $75,000 to $99,999 | 16 (11.0%) | 9 (6.7%) |
| $100,000 to $149,999 | 0 (0.0%) | 15 (11.2%) |
| $150,000 or more | 17 (11.7%) | 49 (36.6%) |
| Total | 145 (100.0%) | 134 (100.0%) |
Property Value to Household Income Ratio in Rankin borough
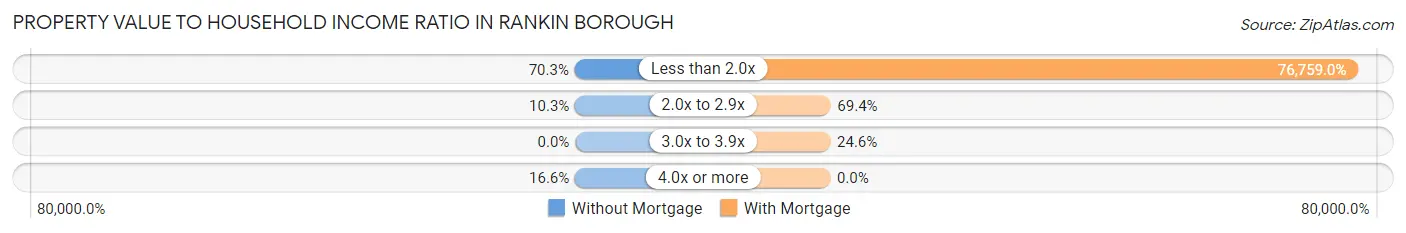
| Value-to-Income Ratio | Without Mortgage | With Mortgage |
| Less than 2.0x | 102 (70.3%) | 102,857 (76,759.0%) |
| 2.0x to 2.9x | 15 (10.3%) | 93 (69.4%) |
| 3.0x to 3.9x | 0 (0.0%) | 33 (24.6%) |
| 4.0x or more | 24 (16.6%) | 0 (0.0%) |
| Total | 145 (100.0%) | 134 (100.0%) |
Real Estate Taxes by Mortgage Status in Rankin borough
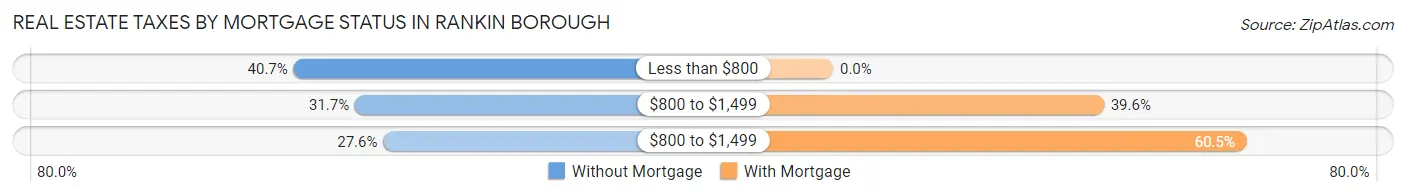
| Property Taxes | Without Mortgage | With Mortgage |
| Less than $800 | 59 (40.7%) | 0 (0.0%) |
| $800 to $1,499 | 46 (31.7%) | 53 (39.6%) |
| $800 to $1,499 | 40 (27.6%) | 81 (60.5%) |
| Total | 145 (100.0%) | 134 (100.0%) |
Health & Disability in Rankin borough
Health Insurance Coverage by Age in Rankin borough
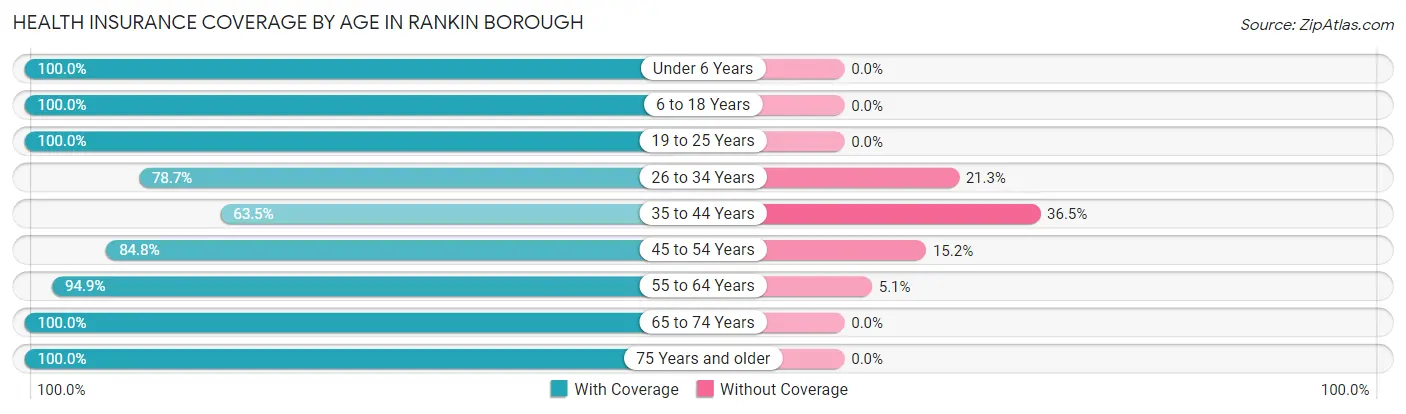
| Age Bracket | With Coverage | Without Coverage |
| Under 6 Years | 288 (100.0%) | 0 (0.0%) |
| 6 to 18 Years | 204 (100.0%) | 0 (0.0%) |
| 19 to 25 Years | 236 (100.0%) | 0 (0.0%) |
| 26 to 34 Years | 166 (78.7%) | 45 (21.3%) |
| 35 to 44 Years | 193 (63.5%) | 111 (36.5%) |
| 45 to 54 Years | 167 (84.8%) | 30 (15.2%) |
| 55 to 64 Years | 148 (94.9%) | 8 (5.1%) |
| 65 to 74 Years | 103 (100.0%) | 0 (0.0%) |
| 75 Years and older | 138 (100.0%) | 0 (0.0%) |
| Total | 1,643 (89.4%) | 194 (10.6%) |
Health Insurance Coverage by Citizenship Status in Rankin borough
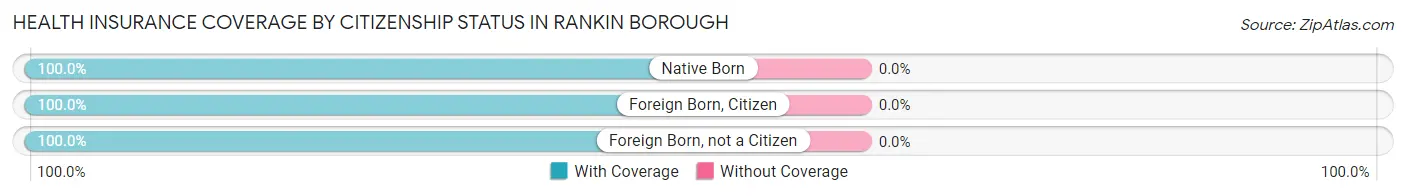
| Citizenship Status | With Coverage | Without Coverage |
| Native Born | 288 (100.0%) | 0 (0.0%) |
| Foreign Born, Citizen | 204 (100.0%) | 0 (0.0%) |
| Foreign Born, not a Citizen | 236 (100.0%) | 0 (0.0%) |
Health Insurance Coverage by Household Income in Rankin borough
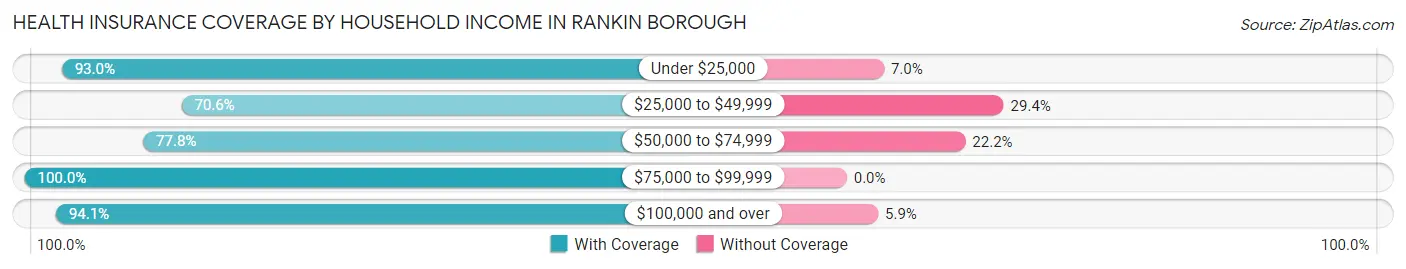
| Household Income | With Coverage | Without Coverage |
| Under $25,000 | 695 (93.0%) | 52 (7.0%) |
| $25,000 to $49,999 | 233 (70.6%) | 97 (29.4%) |
| $50,000 to $74,999 | 70 (77.8%) | 20 (22.2%) |
| $75,000 to $99,999 | 235 (100.0%) | 0 (0.0%) |
| $100,000 and over | 401 (94.1%) | 25 (5.9%) |
Public vs Private Health Insurance Coverage by Age in Rankin borough
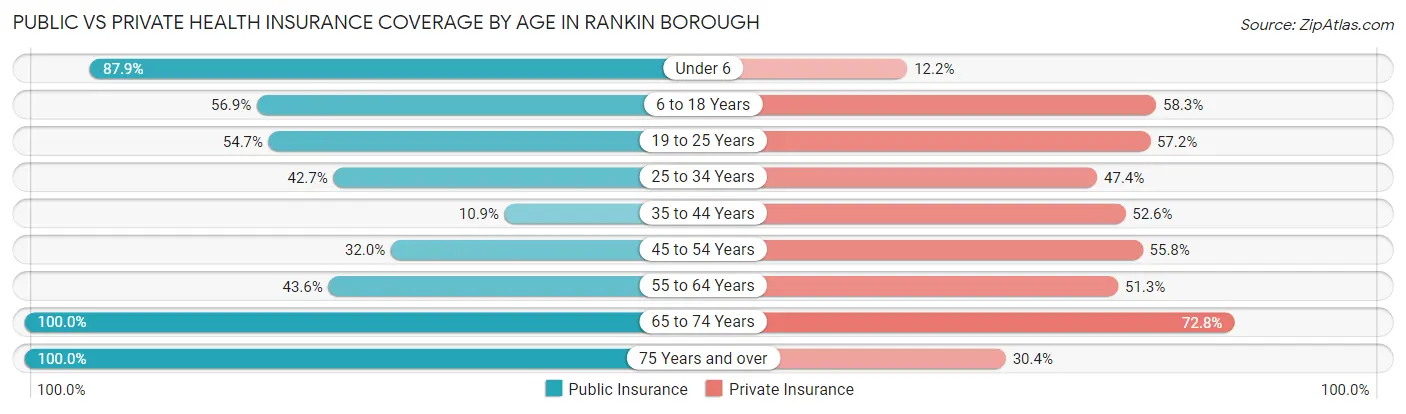
| Age Bracket | Public Insurance | Private Insurance |
| Under 6 | 253 (87.8%) | 35 (12.1%) |
| 6 to 18 Years | 116 (56.9%) | 119 (58.3%) |
| 19 to 25 Years | 129 (54.7%) | 135 (57.2%) |
| 25 to 34 Years | 90 (42.6%) | 100 (47.4%) |
| 35 to 44 Years | 33 (10.9%) | 160 (52.6%) |
| 45 to 54 Years | 63 (32.0%) | 110 (55.8%) |
| 55 to 64 Years | 68 (43.6%) | 80 (51.3%) |
| 65 to 74 Years | 103 (100.0%) | 75 (72.8%) |
| 75 Years and over | 138 (100.0%) | 42 (30.4%) |
| Total | 993 (54.1%) | 856 (46.6%) |
Disability Status by Sex by Age in Rankin borough
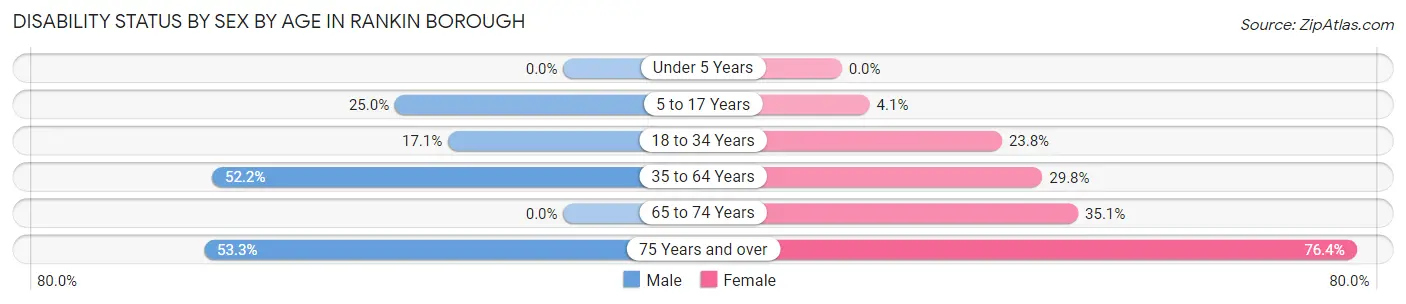
| Age Bracket | Male | Female |
| Under 5 Years | 0 (0.0%) | 0 (0.0%) |
| 5 to 17 Years | 15 (25.0%) | 7 (4.1%) |
| 18 to 34 Years | 50 (17.1%) | 39 (23.8%) |
| 35 to 64 Years | 157 (52.2%) | 106 (29.8%) |
| 65 to 74 Years | 0 (0.0%) | 20 (35.1%) |
| 75 Years and over | 8 (53.3%) | 94 (76.4%) |
Disability Class by Sex by Age in Rankin borough
Disability Class: Hearing Difficulty
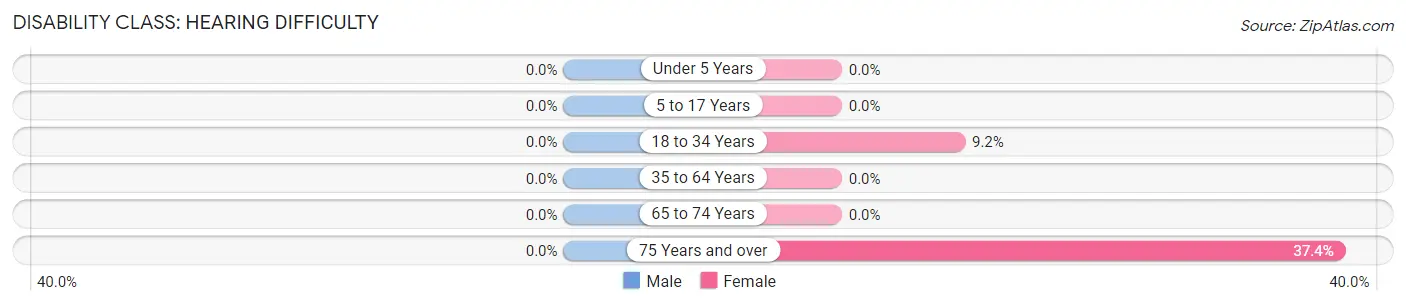
| Age Bracket | Male | Female |
| Under 5 Years | 0 (0.0%) | 0 (0.0%) |
| 5 to 17 Years | 0 (0.0%) | 0 (0.0%) |
| 18 to 34 Years | 0 (0.0%) | 15 (9.1%) |
| 35 to 64 Years | 0 (0.0%) | 0 (0.0%) |
| 65 to 74 Years | 0 (0.0%) | 0 (0.0%) |
| 75 Years and over | 0 (0.0%) | 46 (37.4%) |
Disability Class: Vision Difficulty
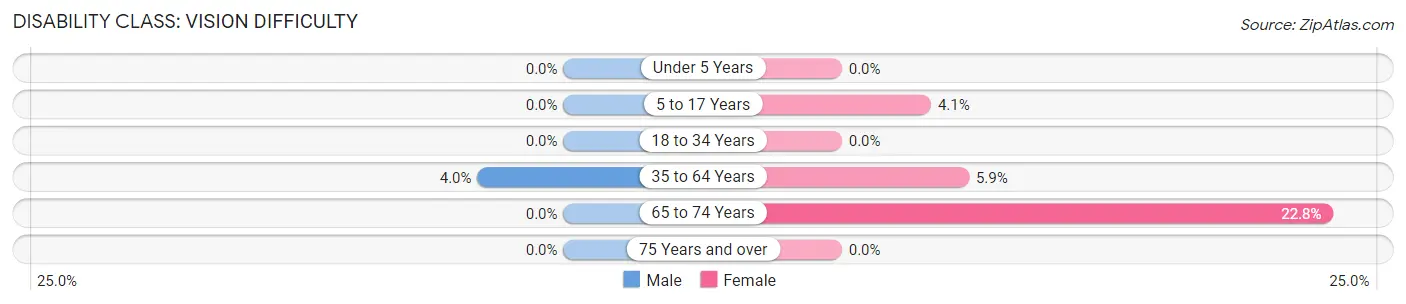
| Age Bracket | Male | Female |
| Under 5 Years | 0 (0.0%) | 0 (0.0%) |
| 5 to 17 Years | 0 (0.0%) | 7 (4.1%) |
| 18 to 34 Years | 0 (0.0%) | 0 (0.0%) |
| 35 to 64 Years | 12 (4.0%) | 21 (5.9%) |
| 65 to 74 Years | 0 (0.0%) | 13 (22.8%) |
| 75 Years and over | 0 (0.0%) | 0 (0.0%) |
Disability Class: Cognitive Difficulty
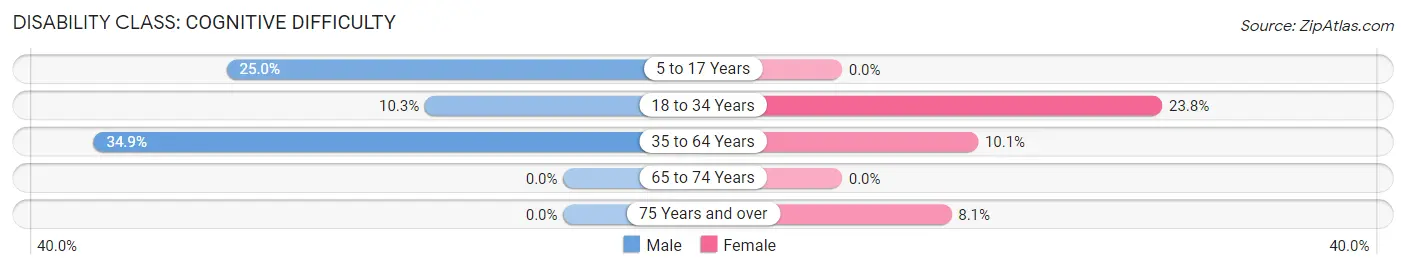
| Age Bracket | Male | Female |
| 5 to 17 Years | 15 (25.0%) | 0 (0.0%) |
| 18 to 34 Years | 30 (10.3%) | 39 (23.8%) |
| 35 to 64 Years | 105 (34.9%) | 36 (10.1%) |
| 65 to 74 Years | 0 (0.0%) | 0 (0.0%) |
| 75 Years and over | 0 (0.0%) | 10 (8.1%) |
Disability Class: Ambulatory Difficulty
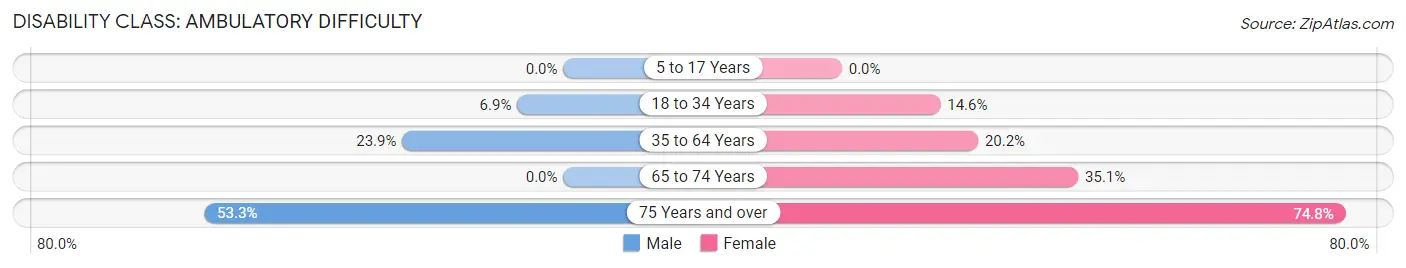
| Age Bracket | Male | Female |
| 5 to 17 Years | 0 (0.0%) | 0 (0.0%) |
| 18 to 34 Years | 20 (6.9%) | 24 (14.6%) |
| 35 to 64 Years | 72 (23.9%) | 72 (20.2%) |
| 65 to 74 Years | 0 (0.0%) | 20 (35.1%) |
| 75 Years and over | 8 (53.3%) | 92 (74.8%) |
Disability Class: Self-Care Difficulty
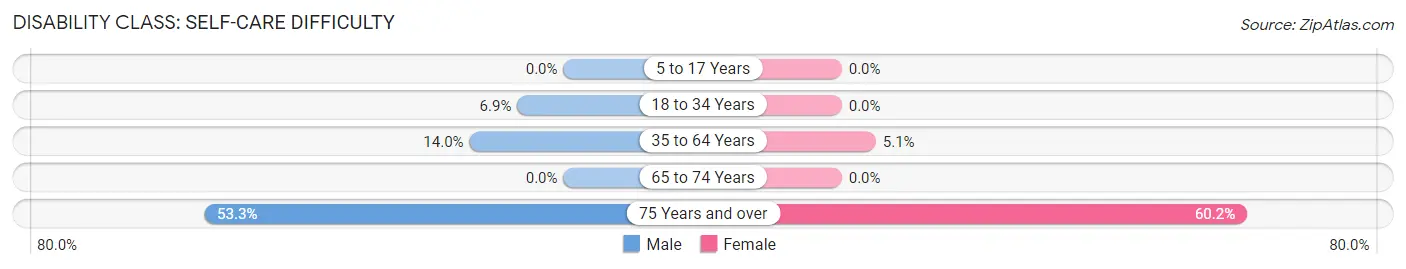
| Age Bracket | Male | Female |
| 5 to 17 Years | 0 (0.0%) | 0 (0.0%) |
| 18 to 34 Years | 20 (6.9%) | 0 (0.0%) |
| 35 to 64 Years | 42 (14.0%) | 18 (5.1%) |
| 65 to 74 Years | 0 (0.0%) | 0 (0.0%) |
| 75 Years and over | 8 (53.3%) | 74 (60.2%) |
Technology Access in Rankin borough
Computing Device Access in Rankin borough
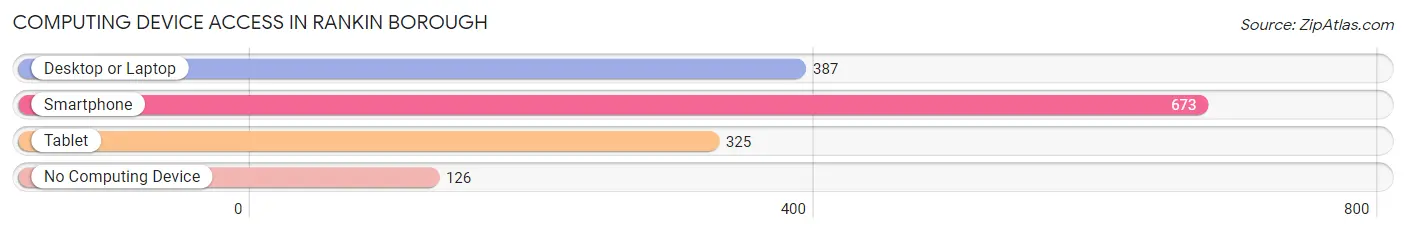
| Device Type | # Households | % Households |
| Desktop or Laptop | 387 | 48.4% |
| Smartphone | 673 | 84.2% |
| Tablet | 325 | 40.7% |
| No Computing Device | 126 | 15.8% |
| Total | 799 | 100.0% |
Internet Access in Rankin borough
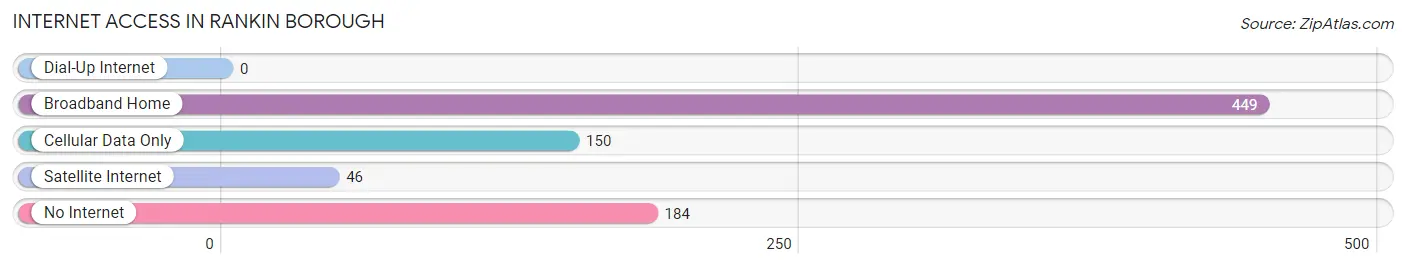
| Internet Type | # Households | % Households |
| Dial-Up Internet | 0 | 0.0% |
| Broadband Home | 449 | 56.2% |
| Cellular Data Only | 150 | 18.8% |
| Satellite Internet | 46 | 5.8% |
| No Internet | 184 | 23.0% |
| Total | 799 | 100.0% |
Rankin borough Summary
Rankin Borough is a small borough located in Allegheny County, Pennsylvania. It is situated along the Monongahela River, just south of the city of Pittsburgh. The borough was incorporated in 1891 and is home to a population of approximately 2,000 people.
History
The area that is now Rankin Borough was originally inhabited by the Lenape Native Americans. The first European settlers arrived in the area in the late 1700s and early 1800s. The area was originally part of the larger borough of Turtle Creek, which was incorporated in 1845. In 1891, the area that is now Rankin Borough was separated from Turtle Creek and incorporated as its own borough.
The borough was named after John Rankin, a local landowner and businessman who was instrumental in the development of the area. Rankin was a prominent figure in the local coal industry and was responsible for the construction of the Rankin Bridge, which connected Rankin Borough to the city of Pittsburgh.
Geography
Rankin Borough is located in Allegheny County, Pennsylvania. It is situated along the Monongahela River, just south of the city of Pittsburgh. The borough covers an area of 0.7 square miles and is bordered by Turtle Creek to the north, Wilkinsburg to the east, and Swissvale to the south.
The borough is mostly residential, with some commercial and industrial areas. The terrain is mostly flat, with some hills in the northern part of the borough. The climate is humid continental, with hot summers and cold winters.
Economy
Rankin Borough has a diverse economy. The borough is home to a variety of businesses, including retail stores, restaurants, and professional services. The borough is also home to several manufacturing companies, including a steel mill and a paper mill.
The borough is also home to several educational institutions, including the Rankin School District, which serves the borough and surrounding areas. The borough is also home to the Rankin Community Center, which provides a variety of services to the community, including a library, a senior center, and a youth center.
Demographics
As of the 2010 census, Rankin Borough had a population of 2,000 people. The racial makeup of the borough was 94.2% White, 2.7% African American, 0.3% Native American, 0.7% Asian, and 2.1% from other races. The median household income was $37,500, and the median family income was $45,000.
The borough is home to a variety of religious denominations, including Catholic, Protestant, and Jewish. The borough is also home to a variety of ethnicities, including Italian, Polish, and German.
Conclusion
Rankin Borough is a small borough located in Allegheny County, Pennsylvania. It is situated along the Monongahela River, just south of the city of Pittsburgh. The borough was incorporated in 1891 and is home to a population of approximately 2,000 people. The borough has a diverse economy and is home to a variety of businesses, educational institutions, and religious denominations. The borough is also home to a variety of ethnicities, including Italian, Polish, and German.
Common Questions
What is Per Capita Income in Rankin borough?
Per Capita income in Rankin borough is $23,483.
What is the Median Family Income in Rankin borough?
Median Family Income in Rankin borough is $46,211.
What is the Median Household income in Rankin borough?
Median Household Income in Rankin borough is $29,107.
What is Income or Wage Gap in Rankin borough?
Income or Wage Gap in Rankin borough is 9.7%.
Women in Rankin borough earn 90.3 cents for every dollar earned by a man.
What is Inequality or Gini Index in Rankin borough?
Inequality or Gini Index in Rankin borough is 0.52.
What is the Total Population of Rankin borough?
Total Population of Rankin borough is 1,837.
What is the Total Male Population of Rankin borough?
Total Male Population of Rankin borough is 812.
What is the Total Female Population of Rankin borough?
Total Female Population of Rankin borough is 1,025.
What is the Ratio of Males per 100 Females in Rankin borough?
There are 79.22 Males per 100 Females in Rankin borough.
What is the Ratio of Females per 100 Males in Rankin borough?
There are 126.23 Females per 100 Males in Rankin borough.
What is the Median Population Age in Rankin borough?
Median Population Age in Rankin borough is 33.4 Years.
What is the Average Family Size in Rankin borough
Average Family Size in Rankin borough is 3.4 People.
What is the Average Household Size in Rankin borough
Average Household Size in Rankin borough is 2.3 People.
How Large is the Labor Force in Rankin borough?
There are 888 People in the Labor Forcein in Rankin borough.
What is the Percentage of People in the Labor Force in Rankin borough?
62.5% of People are in the Labor Force in Rankin borough.
What is the Unemployment Rate in Rankin borough?
Unemployment Rate in Rankin borough is 18.2%.