Chalfant borough, PA Map & Demographics
Chalfant borough Overview
$38,487
PER CAPITA INCOME
$78,438
AVG FAMILY INCOME
$57,135
AVG HOUSEHOLD INCOME
42.4%
WAGE / INCOME GAP [ % ]
57.6¢/ $1
WAGE / INCOME GAP [ $ ]
0.36
INEQUALITY / GINI INDEX
649
TOTAL POPULATION
361
MALE POPULATION
288
FEMALE POPULATION
125.35
MALES / 100 FEMALES
79.78
FEMALES / 100 MALES
49.7
MEDIAN AGE
2.6
AVG FAMILY SIZE
1.8
AVG HOUSEHOLD SIZE
408
LABOR FORCE [ PEOPLE ]
70.7%
PERCENT IN LABOR FORCE
0.7%
UNEMPLOYMENT RATE
Income in Chalfant borough
Income Overview in Chalfant borough
Per Capita Income in Chalfant borough is $38,487, while median incomes of families and households are $78,438 and $57,135 respectively.
| Characteristic | Number | Measure |
| Per Capita Income | 649 | $38,487 |
| Median Family Income | 165 | $78,438 |
| Mean Family Income | 165 | $89,739 |
| Median Household Income | 363 | $57,135 |
| Mean Household Income | 363 | $67,959 |
| Income Deficit | 165 | $0 |
| Wage / Income Gap (%) | 649 | 42.36% |
| Wage / Income Gap ($) | 649 | 57.64¢ per $1 |
| Gini / Inequality Index | 649 | 0.36 |
Earnings by Sex in Chalfant borough
Average Earnings in Chalfant borough are $47,100, $55,455 for men and $31,964 for women, a difference of 42.4%.
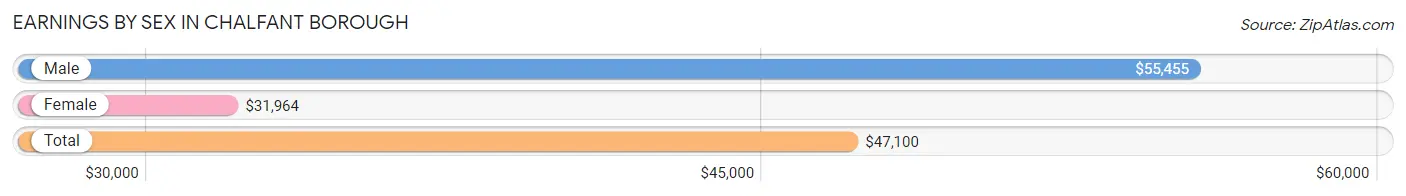
| Sex | Number | Average Earnings |
| Male | 248 (56.4%) | $55,455 |
| Female | 192 (43.6%) | $31,964 |
| Total | 440 (100.0%) | $47,100 |
Earnings by Sex by Income Bracket in Chalfant borough
The most common earnings brackets in Chalfant borough are $55,000 to $64,999 for men (91 | 36.7%) and $50,000 to $54,999 for women (21 | 10.9%).
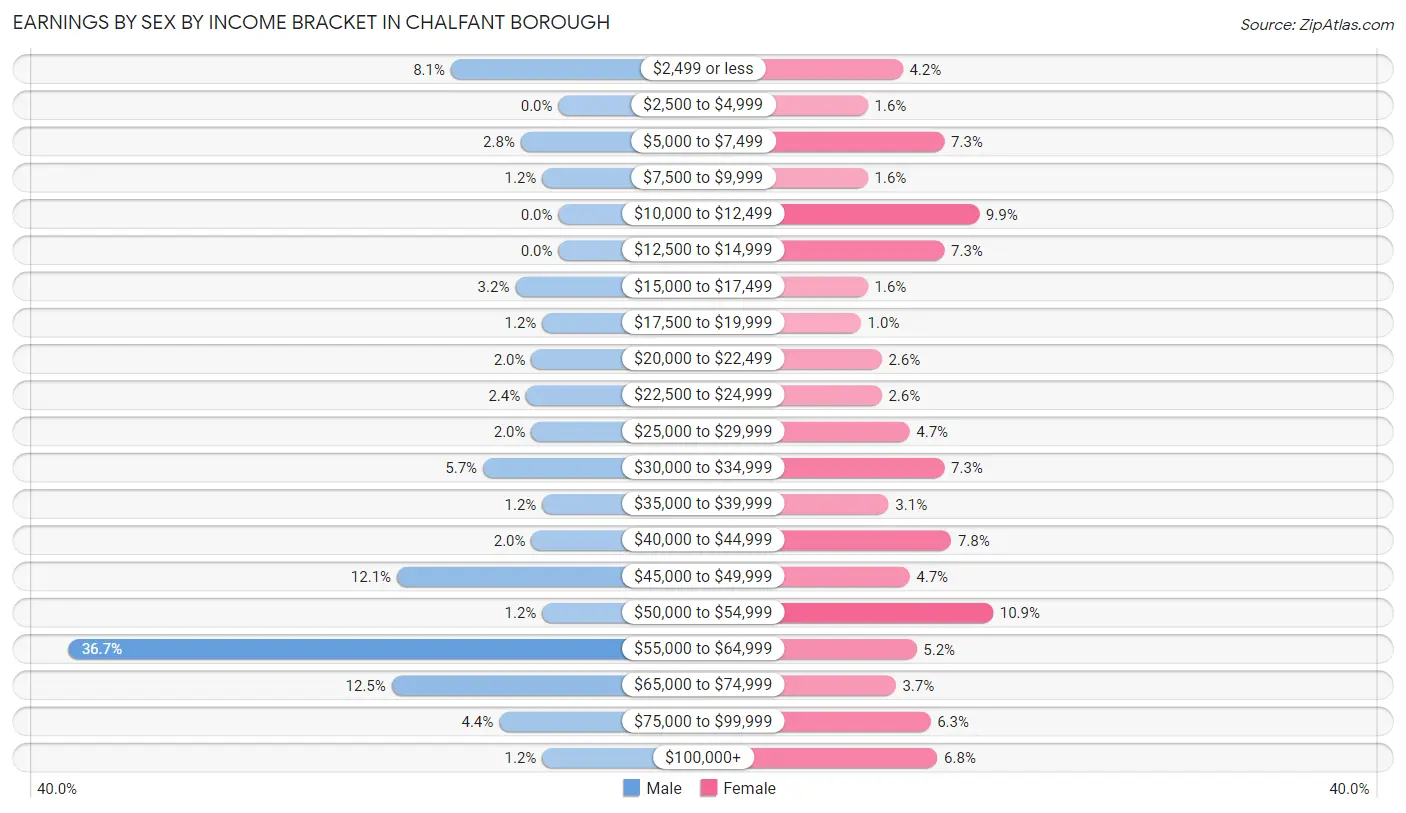
| Income | Male | Female |
| $2,499 or less | 20 (8.1%) | 8 (4.2%) |
| $2,500 to $4,999 | 0 (0.0%) | 3 (1.6%) |
| $5,000 to $7,499 | 7 (2.8%) | 14 (7.3%) |
| $7,500 to $9,999 | 3 (1.2%) | 3 (1.6%) |
| $10,000 to $12,499 | 0 (0.0%) | 19 (9.9%) |
| $12,500 to $14,999 | 0 (0.0%) | 14 (7.3%) |
| $15,000 to $17,499 | 8 (3.2%) | 3 (1.6%) |
| $17,500 to $19,999 | 3 (1.2%) | 2 (1.0%) |
| $20,000 to $22,499 | 5 (2.0%) | 5 (2.6%) |
| $22,500 to $24,999 | 6 (2.4%) | 5 (2.6%) |
| $25,000 to $29,999 | 5 (2.0%) | 9 (4.7%) |
| $30,000 to $34,999 | 14 (5.7%) | 14 (7.3%) |
| $35,000 to $39,999 | 3 (1.2%) | 6 (3.1%) |
| $40,000 to $44,999 | 5 (2.0%) | 15 (7.8%) |
| $45,000 to $49,999 | 30 (12.1%) | 9 (4.7%) |
| $50,000 to $54,999 | 3 (1.2%) | 21 (10.9%) |
| $55,000 to $64,999 | 91 (36.7%) | 10 (5.2%) |
| $65,000 to $74,999 | 31 (12.5%) | 7 (3.6%) |
| $75,000 to $99,999 | 11 (4.4%) | 12 (6.2%) |
| $100,000+ | 3 (1.2%) | 13 (6.8%) |
| Total | 248 (100.0%) | 192 (100.0%) |
Earnings by Sex by Educational Attainment in Chalfant borough
Average earnings in Chalfant borough are $55,777 for men and $39,375 for women, a difference of 29.4%. Men with an educational attainment of high school diploma enjoy the highest average annual earnings of $56,068, while those with college or associate's degree education earn the least with $48,750. Women with an educational attainment of graduate degree earn the most with the average annual earnings of $54,107, while those with college or associate's degree education have the smallest earnings of $30,521.
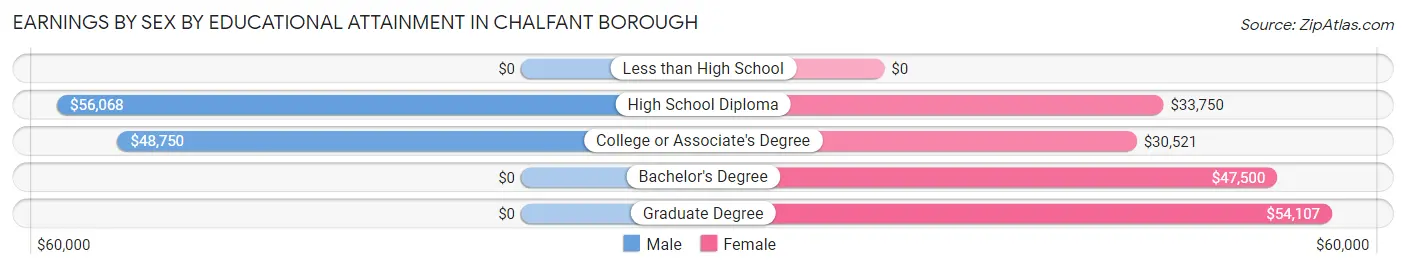
| Educational Attainment | Male Income | Female Income |
| Less than High School | - | - |
| High School Diploma | $56,068 | $33,750 |
| College or Associate's Degree | $48,750 | $30,521 |
| Bachelor's Degree | - | - |
| Graduate Degree | - | - |
| Total | $55,777 | $39,375 |
Family Income in Chalfant borough
Family Income Brackets in Chalfant borough
According to the Chalfant borough family income data, there are 38 families falling into the $75,000 to $99,999 income range, which is the most common income bracket and makes up 23.0% of all families.
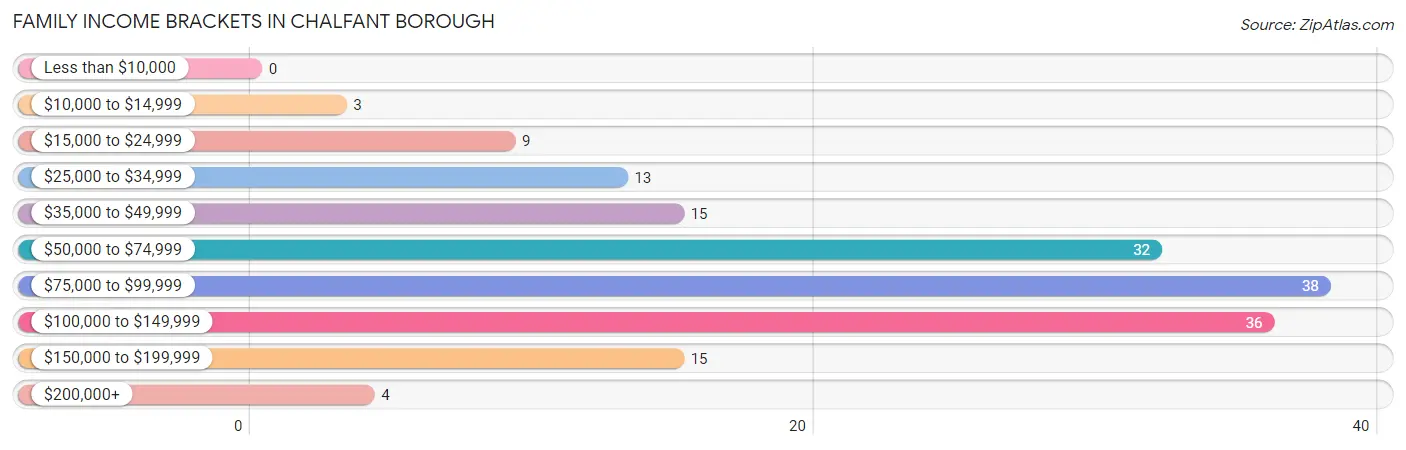
| Income Bracket | # Families | % Families |
| Less than $10,000 | 0 | 0.0% |
| $10,000 to $14,999 | 3 | 1.8% |
| $15,000 to $24,999 | 9 | 5.5% |
| $25,000 to $34,999 | 13 | 7.9% |
| $35,000 to $49,999 | 15 | 9.1% |
| $50,000 to $74,999 | 32 | 19.4% |
| $75,000 to $99,999 | 38 | 23.0% |
| $100,000 to $149,999 | 36 | 21.8% |
| $150,000 to $199,999 | 15 | 9.1% |
| $200,000+ | 4 | 2.4% |
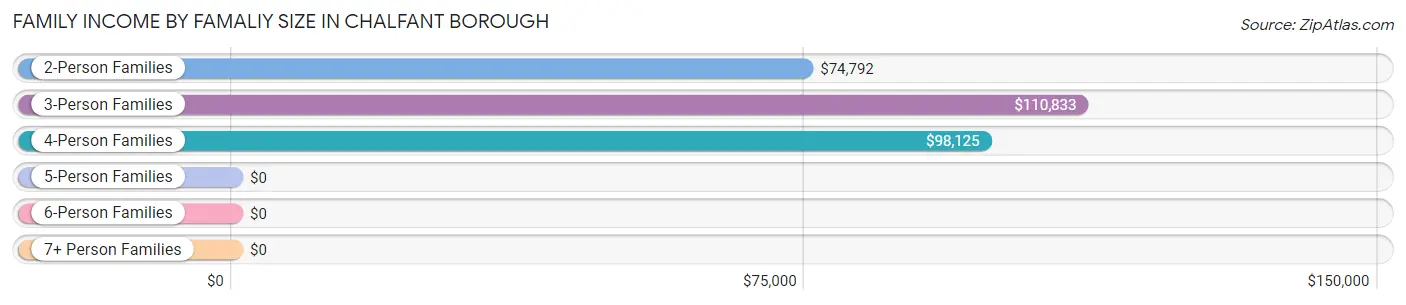
Family Income by Famaliy Size in Chalfant borough
3-person families (48 | 29.1%) account for the highest median family income in Chalfant borough with $110,833 per family, while 2-person families (100 | 60.6%) have the highest median income of $37,396 per family member.
| Income Bracket | # Families | Median Income |
| 2-Person Families | 100 (60.6%) | $74,792 |
| 3-Person Families | 48 (29.1%) | $110,833 |
| 4-Person Families | 17 (10.3%) | $98,125 |
| 5-Person Families | 0 (0.0%) | $0 |
| 6-Person Families | 0 (0.0%) | $0 |
| 7+ Person Families | 0 (0.0%) | $0 |
| Total | 165 (100.0%) | $78,438 |
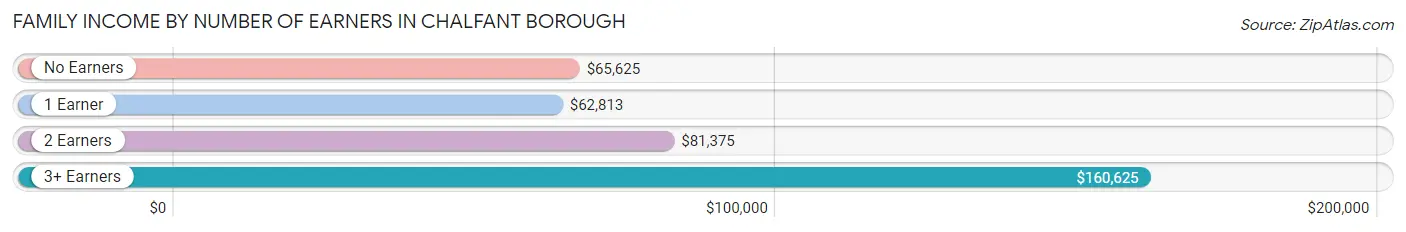
Family Income by Number of Earners in Chalfant borough
The median family income in Chalfant borough is $78,438, with families comprising 3+ earners (16) having the highest median family income of $160,625, while families with 1 earner (55) have the lowest median family income of $62,813, accounting for 9.7% and 33.3% of families, respectively.
| Number of Earners | # Families | Median Income |
| No Earners | 17 (10.3%) | $65,625 |
| 1 Earner | 55 (33.3%) | $62,813 |
| 2 Earners | 77 (46.7%) | $81,375 |
| 3+ Earners | 16 (9.7%) | $160,625 |
| Total | 165 (100.0%) | $78,438 |
Household Income in Chalfant borough
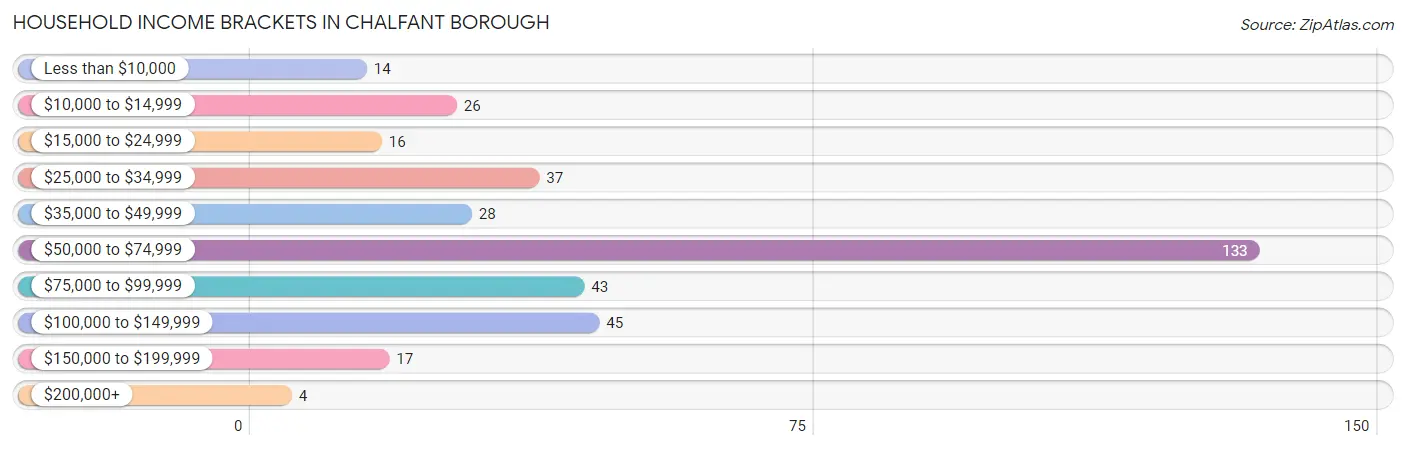
Household Income Brackets in Chalfant borough
With 133 households falling in the category, the $50,000 to $74,999 income range is the most frequent in Chalfant borough, accounting for 36.6% of all households. In contrast, only 4 households (1.1%) fall into the $200,000+ income bracket, making it the least populous group.
| Income Bracket | # Households | % Households |
| Less than $10,000 | 14 | 3.9% |
| $10,000 to $14,999 | 26 | 7.2% |
| $15,000 to $24,999 | 16 | 4.4% |
| $25,000 to $34,999 | 37 | 10.2% |
| $35,000 to $49,999 | 28 | 7.7% |
| $50,000 to $74,999 | 133 | 36.6% |
| $75,000 to $99,999 | 43 | 11.8% |
| $100,000 to $149,999 | 45 | 12.4% |
| $150,000 to $199,999 | 17 | 4.7% |
| $200,000+ | 4 | 1.1% |
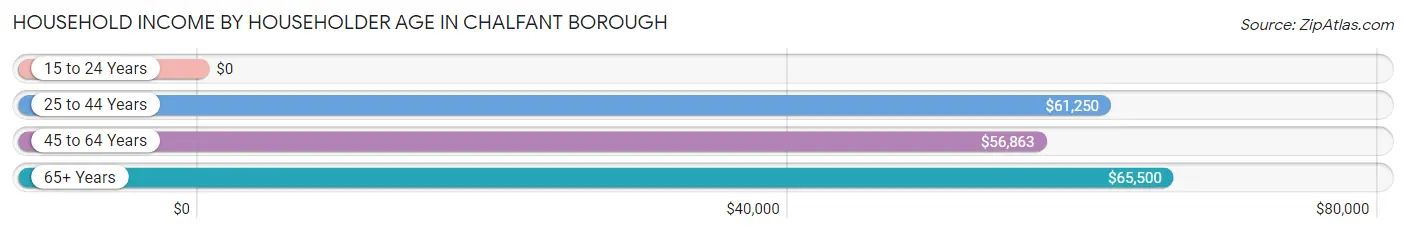
Household Income by Householder Age in Chalfant borough
The median household income in Chalfant borough is $57,135, with the highest median household income of $65,500 found in the 65+ years age bracket for the primary householder. A total of 90 households (24.8%) fall into this category. Meanwhile, the 15 to 24 years age bracket for the primary householder has the lowest median household income of $0, with 5 households (1.4%) in this group.
| Income Bracket | # Households | Median Income |
| 15 to 24 Years | 5 (1.4%) | $0 |
| 25 to 44 Years | 114 (31.4%) | $61,250 |
| 45 to 64 Years | 154 (42.4%) | $56,863 |
| 65+ Years | 90 (24.8%) | $65,500 |
| Total | 363 (100.0%) | $57,135 |
Poverty in Chalfant borough
Income Below Poverty by Sex and Age in Chalfant borough
With 4.7% poverty level for males and 10.1% for females among the residents of Chalfant borough, 65 to 74 year old males and 55 to 64 year old females are the most vulnerable to poverty, with 7 males (30.4%) and 15 females (36.6%) in their respective age groups living below the poverty level.
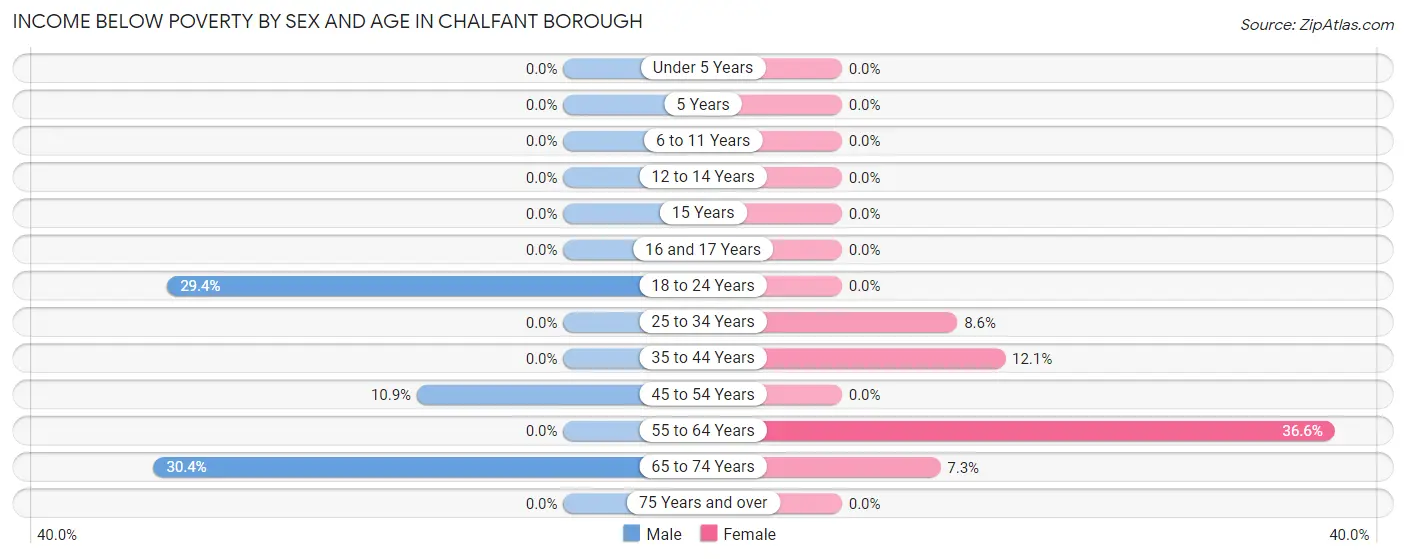
| Age Bracket | Male | Female |
| Under 5 Years | 0 (0.0%) | 0 (0.0%) |
| 5 Years | 0 (0.0%) | 0 (0.0%) |
| 6 to 11 Years | 0 (0.0%) | 0 (0.0%) |
| 12 to 14 Years | 0 (0.0%) | 0 (0.0%) |
| 15 Years | 0 (0.0%) | 0 (0.0%) |
| 16 and 17 Years | 0 (0.0%) | 0 (0.0%) |
| 18 to 24 Years | 5 (29.4%) | 0 (0.0%) |
| 25 to 34 Years | 0 (0.0%) | 3 (8.6%) |
| 35 to 44 Years | 0 (0.0%) | 8 (12.1%) |
| 45 to 54 Years | 5 (10.9%) | 0 (0.0%) |
| 55 to 64 Years | 0 (0.0%) | 15 (36.6%) |
| 65 to 74 Years | 7 (30.4%) | 3 (7.3%) |
| 75 Years and over | 0 (0.0%) | 0 (0.0%) |
| Total | 17 (4.7%) | 29 (10.1%) |
Income Above Poverty by Sex and Age in Chalfant borough
According to the poverty statistics in Chalfant borough, males aged under 5 years and females aged under 5 years are the age groups that are most secure financially, with 100.0% of males and 100.0% of females in these age groups living above the poverty line.
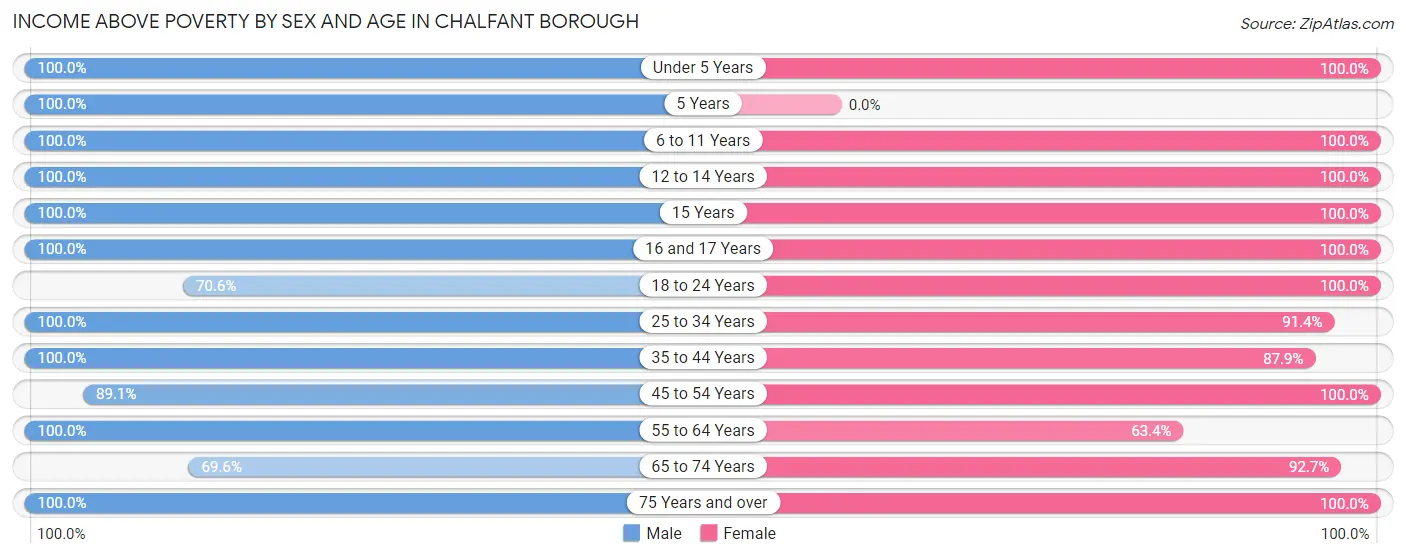
| Age Bracket | Male | Female |
| Under 5 Years | 17 (100.0%) | 3 (100.0%) |
| 5 Years | 2 (100.0%) | 0 (0.0%) |
| 6 to 11 Years | 22 (100.0%) | 6 (100.0%) |
| 12 to 14 Years | 3 (100.0%) | 11 (100.0%) |
| 15 Years | 6 (100.0%) | 2 (100.0%) |
| 16 and 17 Years | 3 (100.0%) | 9 (100.0%) |
| 18 to 24 Years | 12 (70.6%) | 17 (100.0%) |
| 25 to 34 Years | 46 (100.0%) | 32 (91.4%) |
| 35 to 44 Years | 30 (100.0%) | 58 (87.9%) |
| 45 to 54 Years | 41 (89.1%) | 42 (100.0%) |
| 55 to 64 Years | 103 (100.0%) | 26 (63.4%) |
| 65 to 74 Years | 16 (69.6%) | 38 (92.7%) |
| 75 Years and over | 43 (100.0%) | 15 (100.0%) |
| Total | 344 (95.3%) | 259 (89.9%) |
Income Below Poverty Among Married-Couple Families in Chalfant borough
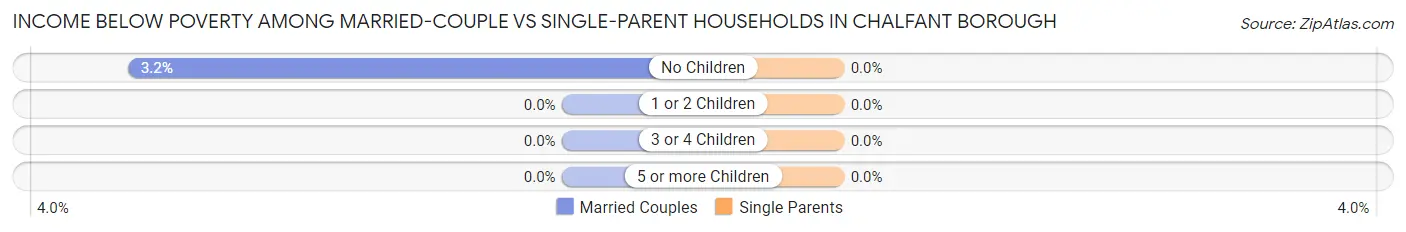
The poverty statistics for married-couple families in Chalfant borough show that 2.5% or 3 of the total 122 families live below the poverty line. Families with no children have the highest poverty rate of 3.2%, comprising of 3 families. On the other hand, families with 1 or 2 children have the lowest poverty rate of 0.0%, which includes 0 families.
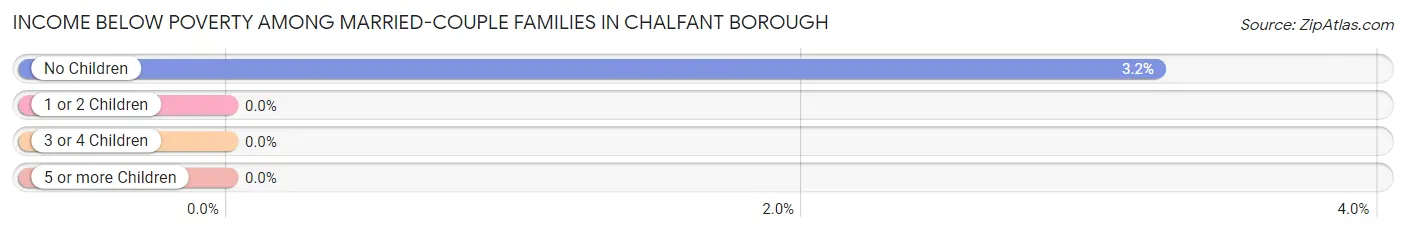
| Children | Above Poverty | Below Poverty |
| No Children | 90 (96.8%) | 3 (3.2%) |
| 1 or 2 Children | 29 (100.0%) | 0 (0.0%) |
| 3 or 4 Children | 0 (0.0%) | 0 (0.0%) |
| 5 or more Children | 0 (0.0%) | 0 (0.0%) |
| Total | 119 (97.5%) | 3 (2.5%) |
Income Below Poverty Among Single-Parent Households in Chalfant borough
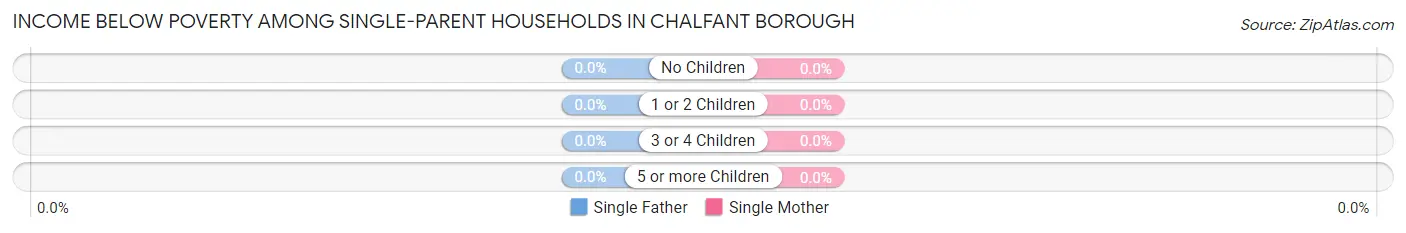
| Children | Single Father | Single Mother |
| No Children | 0 (0.0%) | 0 (0.0%) |
| 1 or 2 Children | 0 (0.0%) | 0 (0.0%) |
| 3 or 4 Children | 0 (0.0%) | 0 (0.0%) |
| 5 or more Children | 0 (0.0%) | 0 (0.0%) |
| Total | 0 (0.0%) | 0 (0.0%) |
Income Below Poverty Among Married-Couple vs Single-Parent Households in Chalfant borough
| Children | Married-Couple Families | Single-Parent Households |
| No Children | 3 (3.2%) | 0 (0.0%) |
| 1 or 2 Children | 0 (0.0%) | 0 (0.0%) |
| 3 or 4 Children | 0 (0.0%) | 0 (0.0%) |
| 5 or more Children | 0 (0.0%) | 0 (0.0%) |
| Total | 3 (2.5%) | 0 (0.0%) |
Race in Chalfant borough
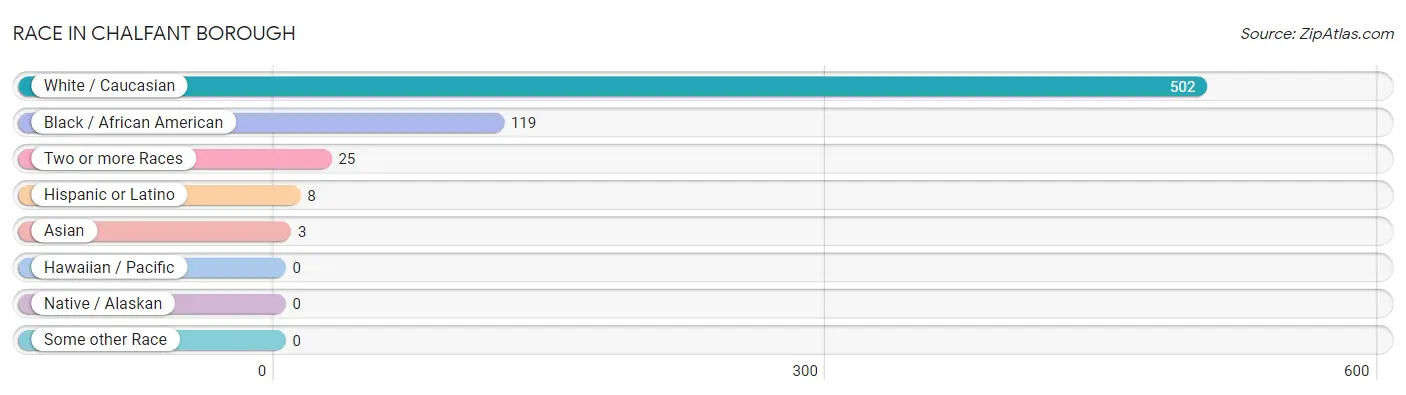
The most populous races in Chalfant borough are White / Caucasian (502 | 77.3%), Black / African American (119 | 18.3%), and Two or more Races (25 | 3.8%).
| Race | # Population | % Population |
| Asian | 3 | 0.5% |
| Black / African American | 119 | 18.3% |
| Hawaiian / Pacific | 0 | 0.0% |
| Hispanic or Latino | 8 | 1.2% |
| Native / Alaskan | 0 | 0.0% |
| White / Caucasian | 502 | 77.3% |
| Two or more Races | 25 | 3.8% |
| Some other Race | 0 | 0.0% |
| Total | 649 | 100.0% |
Ancestry in Chalfant borough
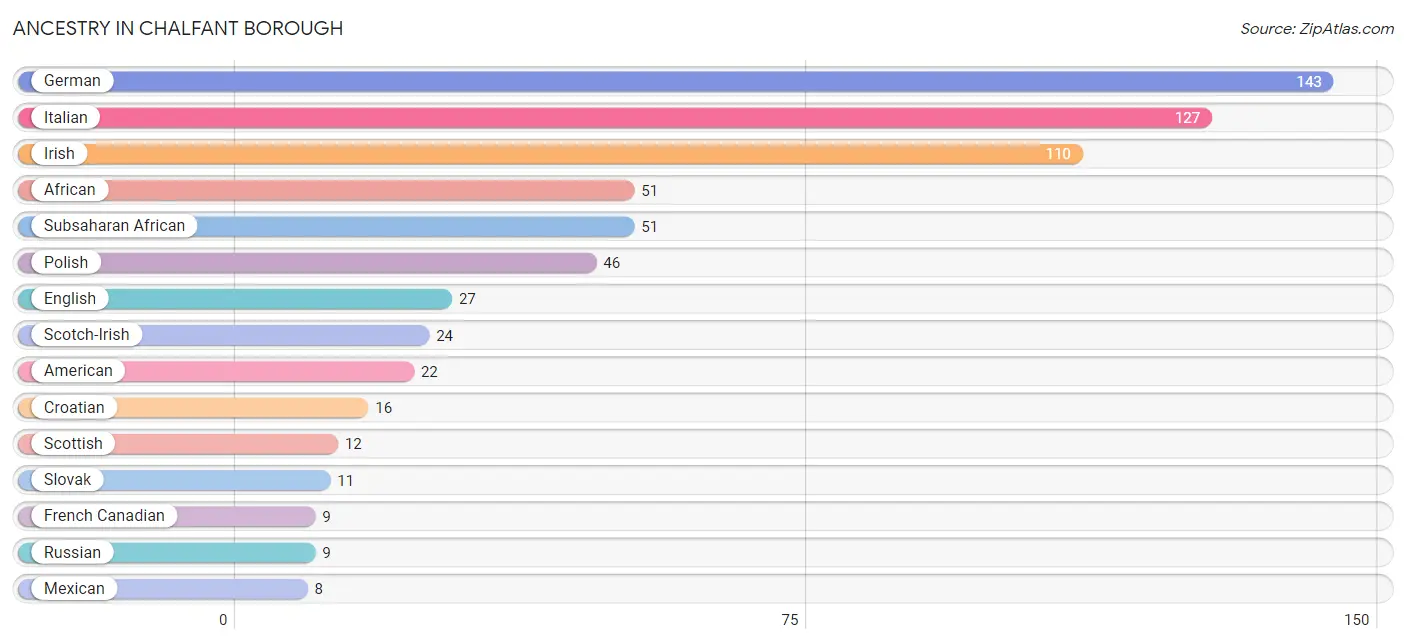
The most populous ancestries reported in Chalfant borough are German (143 | 22.0%), Italian (127 | 19.6%), Irish (110 | 17.0%), African (51 | 7.9%), and Subsaharan African (51 | 7.9%), together accounting for 74.3% of all Chalfant borough residents.
| Ancestry | # Population | % Population |
| African | 51 | 7.9% |
| Alsatian | 2 | 0.3% |
| American | 22 | 3.4% |
| Austrian | 3 | 0.5% |
| Bhutanese | 2 | 0.3% |
| Carpatho Rusyn | 1 | 0.2% |
| Croatian | 16 | 2.5% |
| Czech | 3 | 0.5% |
| Dutch | 3 | 0.5% |
| English | 27 | 4.2% |
| European | 5 | 0.8% |
| French Canadian | 9 | 1.4% |
| German | 143 | 22.0% |
| Greek | 4 | 0.6% |
| Hungarian | 2 | 0.3% |
| Irish | 110 | 17.0% |
| Italian | 127 | 19.6% |
| Lithuanian | 4 | 0.6% |
| Mexican | 8 | 1.2% |
| Pakistani | 5 | 0.8% |
| Polish | 46 | 7.1% |
| Portuguese | 3 | 0.5% |
| Russian | 9 | 1.4% |
| Scotch-Irish | 24 | 3.7% |
| Scottish | 12 | 1.8% |
| Serbian | 3 | 0.5% |
| Slovak | 11 | 1.7% |
| Slovene | 8 | 1.2% |
| Subsaharan African | 51 | 7.9% |
| Swedish | 3 | 0.5% |
| Ukrainian | 7 | 1.1% |
| Welsh | 5 | 0.8% | View All 32 Rows |
Immigrants in Chalfant borough
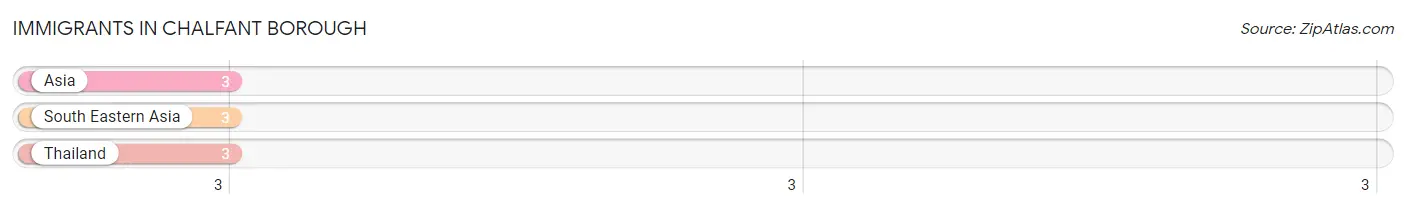
The most numerous immigrant groups reported in Chalfant borough came from Asia (3 | 0.5%), South Eastern Asia (3 | 0.5%), and Thailand (3 | 0.5%), together accounting for 1.4% of all Chalfant borough residents.
| Immigration Origin | # Population | % Population |
| Asia | 3 | 0.5% |
| South Eastern Asia | 3 | 0.5% |
| Thailand | 3 | 0.5% | View All 3 Rows |
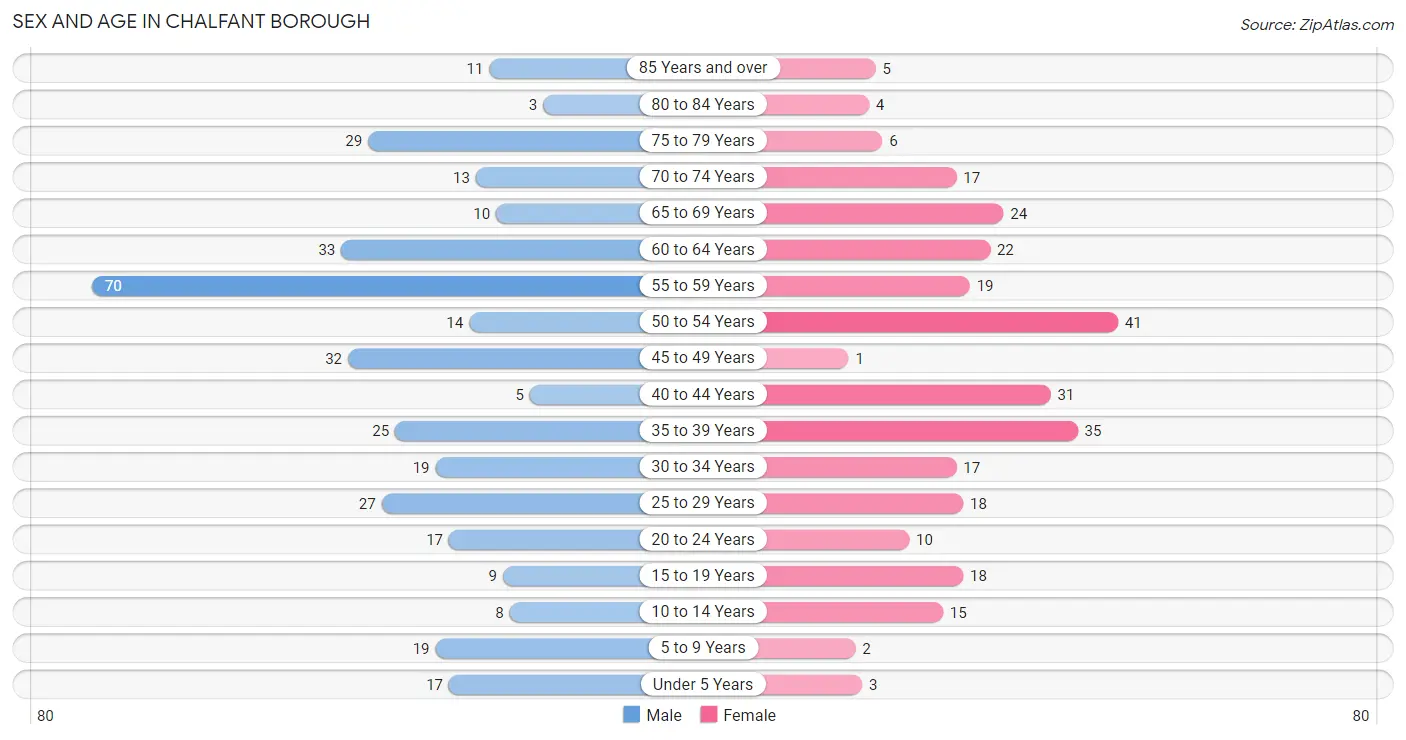
Sex and Age in Chalfant borough
Sex and Age in Chalfant borough
The most populous age groups in Chalfant borough are 55 to 59 Years (70 | 19.4%) for men and 50 to 54 Years (41 | 14.2%) for women.
| Age Bracket | Male | Female |
| Under 5 Years | 17 (4.7%) | 3 (1.0%) |
| 5 to 9 Years | 19 (5.3%) | 2 (0.7%) |
| 10 to 14 Years | 8 (2.2%) | 15 (5.2%) |
| 15 to 19 Years | 9 (2.5%) | 18 (6.2%) |
| 20 to 24 Years | 17 (4.7%) | 10 (3.5%) |
| 25 to 29 Years | 27 (7.5%) | 18 (6.2%) |
| 30 to 34 Years | 19 (5.3%) | 17 (5.9%) |
| 35 to 39 Years | 25 (6.9%) | 35 (12.1%) |
| 40 to 44 Years | 5 (1.4%) | 31 (10.8%) |
| 45 to 49 Years | 32 (8.9%) | 1 (0.4%) |
| 50 to 54 Years | 14 (3.9%) | 41 (14.2%) |
| 55 to 59 Years | 70 (19.4%) | 19 (6.6%) |
| 60 to 64 Years | 33 (9.1%) | 22 (7.6%) |
| 65 to 69 Years | 10 (2.8%) | 24 (8.3%) |
| 70 to 74 Years | 13 (3.6%) | 17 (5.9%) |
| 75 to 79 Years | 29 (8.0%) | 6 (2.1%) |
| 80 to 84 Years | 3 (0.8%) | 4 (1.4%) |
| 85 Years and over | 11 (3.0%) | 5 (1.7%) |
| Total | 361 (100.0%) | 288 (100.0%) |
Families and Households in Chalfant borough
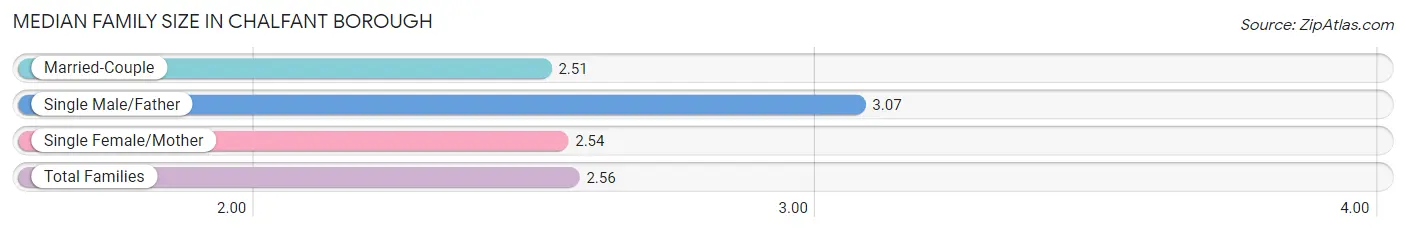
Median Family Size in Chalfant borough
The median family size in Chalfant borough is 2.56 persons per family, with single male/father families (15 | 9.1%) accounting for the largest median family size of 3.07 persons per family. On the other hand, married-couple families (122 | 73.9%) represent the smallest median family size with 2.51 persons per family.
| Family Type | # Families | Family Size |
| Married-Couple | 122 (73.9%) | 2.51 |
| Single Male/Father | 15 (9.1%) | 3.07 |
| Single Female/Mother | 28 (17.0%) | 2.54 |
| Total Families | 165 (100.0%) | 2.56 |
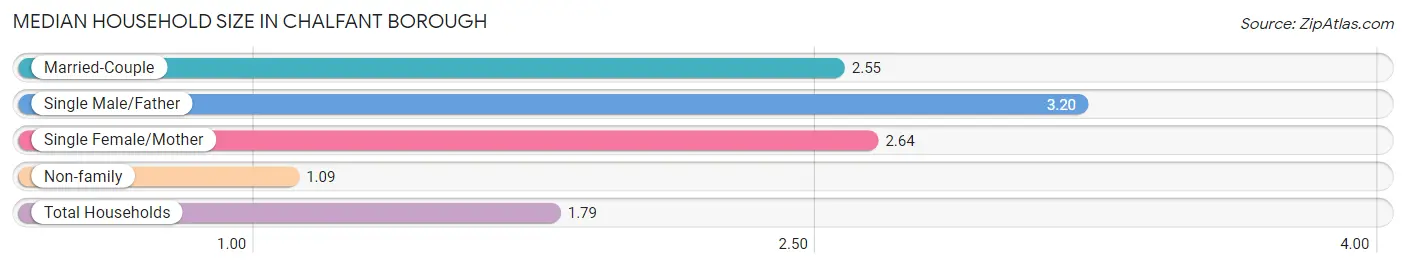
Median Household Size in Chalfant borough
The median household size in Chalfant borough is 1.79 persons per household, with single male/father households (15 | 4.1%) accounting for the largest median household size of 3.2 persons per household. non-family households (198 | 54.5%) represent the smallest median household size with 1.09 persons per household.
| Household Type | # Households | Household Size |
| Married-Couple | 122 (33.6%) | 2.55 |
| Single Male/Father | 15 (4.1%) | 3.20 |
| Single Female/Mother | 28 (7.7%) | 2.64 |
| Non-family | 198 (54.5%) | 1.09 |
| Total Households | 363 (100.0%) | 1.79 |
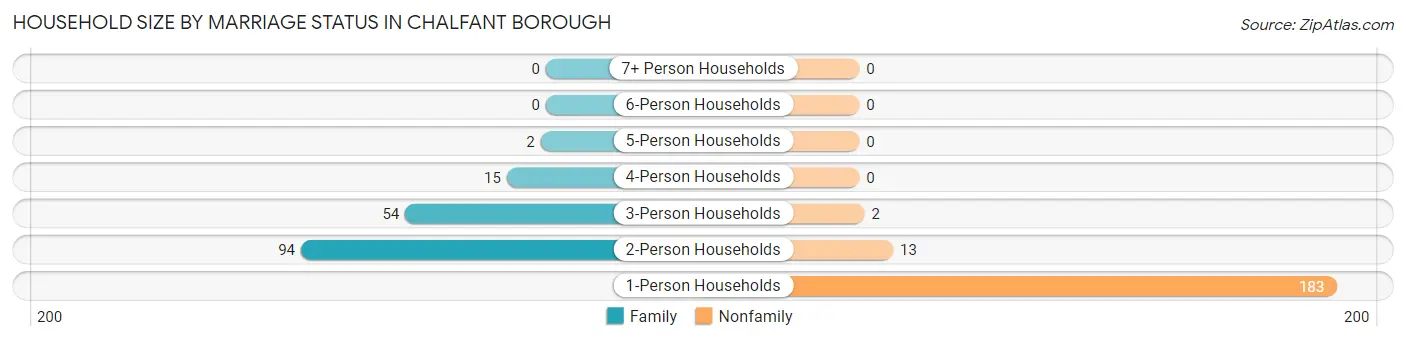
Household Size by Marriage Status in Chalfant borough
Out of a total of 363 households in Chalfant borough, 165 (45.5%) are family households, while 198 (54.5%) are nonfamily households. The most numerous type of family households are 2-person households, comprising 94, and the most common type of nonfamily households are 1-person households, comprising 183.
| Household Size | Family Households | Nonfamily Households |
| 1-Person Households | - | 183 (50.4%) |
| 2-Person Households | 94 (25.9%) | 13 (3.6%) |
| 3-Person Households | 54 (14.9%) | 2 (0.5%) |
| 4-Person Households | 15 (4.1%) | 0 (0.0%) |
| 5-Person Households | 2 (0.5%) | 0 (0.0%) |
| 6-Person Households | 0 (0.0%) | 0 (0.0%) |
| 7+ Person Households | 0 (0.0%) | 0 (0.0%) |
| Total | 165 (45.5%) | 198 (54.5%) |
Female Fertility in Chalfant borough
Fertility by Age in Chalfant borough
Average fertility rate in Chalfant borough is 15.0 births per 1,000 women. Women in the age bracket of 20 to 34 years have the highest fertility rate with 44.0 births per 1,000 women. Women in the age bracket of 20 to 34 years acount for 100.0% of all women with births.
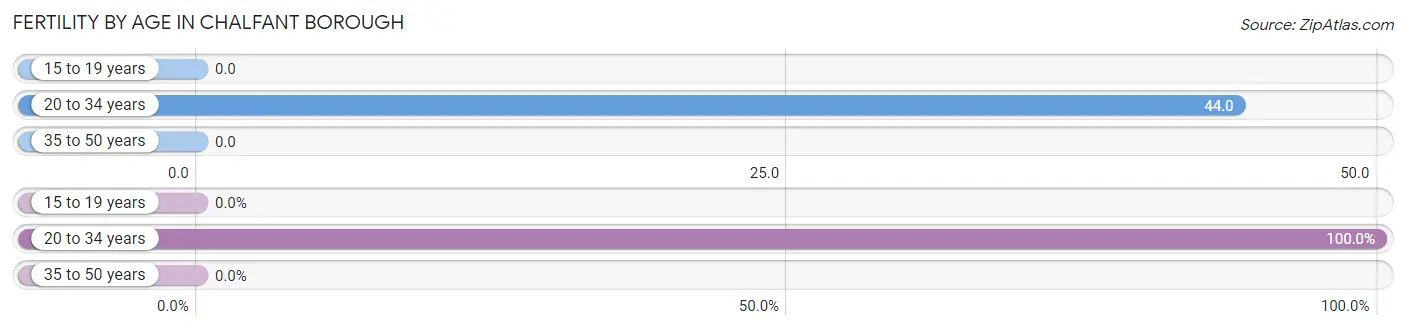
| Age Bracket | Women with Births | Births / 1,000 Women |
| 15 to 19 years | 0 (0.0%) | 0.0 |
| 20 to 34 years | 2 (100.0%) | 44.0 |
| 35 to 50 years | 0 (0.0%) | 0.0 |
| Total | 2 (100.0%) | 15.0 |
Fertility by Age by Marriage Status in Chalfant borough
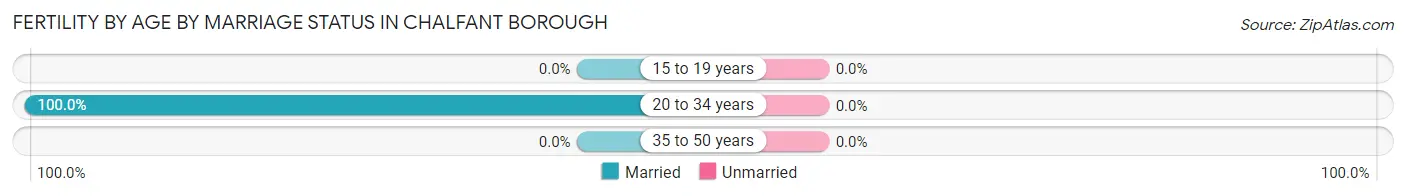
| Age Bracket | Married | Unmarried |
| 15 to 19 years | 0 (0.0%) | 0 (0.0%) |
| 20 to 34 years | 2 (100.0%) | 0 (0.0%) |
| 35 to 50 years | 0 (0.0%) | 0 (0.0%) |
| Total | 2 (100.0%) | 0 (0.0%) |
Fertility by Education in Chalfant borough
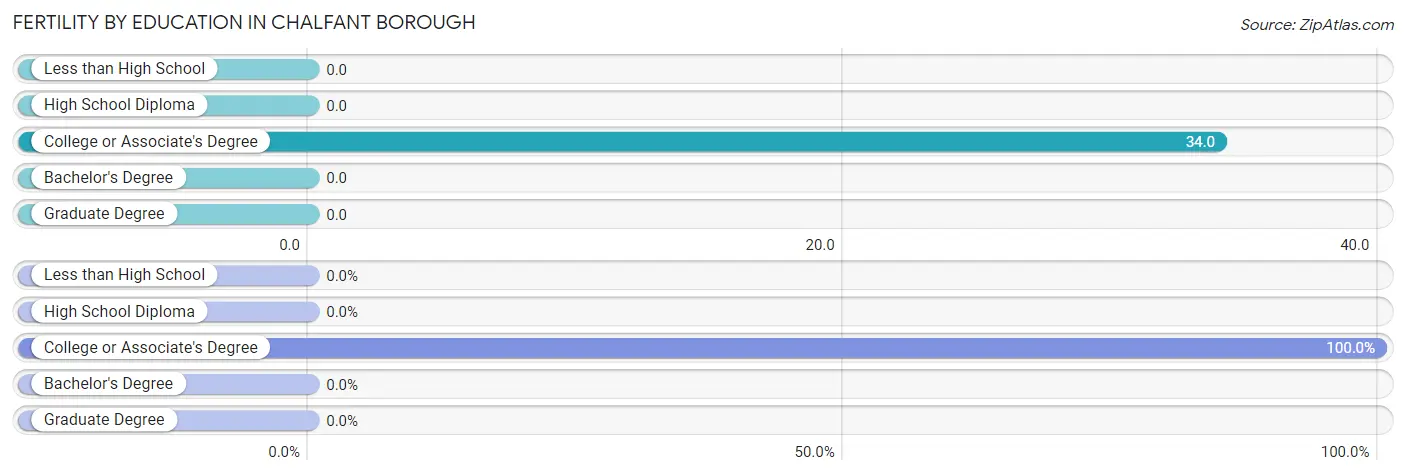
| Educational Attainment | Women with Births | Births / 1,000 Women |
| Less than High School | 0 (0.0%) | 0.0 |
| High School Diploma | 0 (0.0%) | 0.0 |
| College or Associate's Degree | 2 (100.0%) | 34.0 |
| Bachelor's Degree | 0 (0.0%) | 0.0 |
| Graduate Degree | 0 (0.0%) | 0.0 |
| Total | 2 (100.0%) | 15.0 |
Fertility by Education by Marriage Status in Chalfant borough
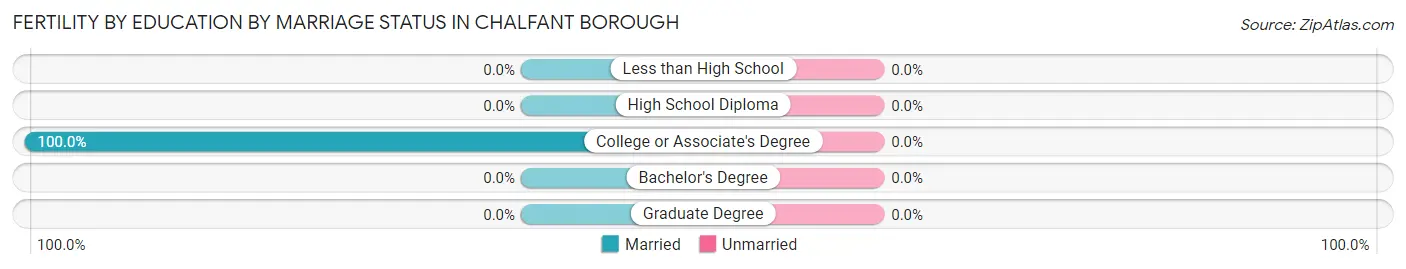
| Educational Attainment | Married | Unmarried |
| Less than High School | 0 (0.0%) | 0 (0.0%) |
| High School Diploma | 0 (0.0%) | 0 (0.0%) |
| College or Associate's Degree | 2 (100.0%) | 0 (0.0%) |
| Bachelor's Degree | 0 (0.0%) | 0 (0.0%) |
| Graduate Degree | 0 (0.0%) | 0 (0.0%) |
| Total | 2 (100.0%) | 0 (0.0%) |
Employment Characteristics in Chalfant borough
Employment by Class of Employer in Chalfant borough
Among the 405 employed individuals in Chalfant borough, private company employees (260 | 64.2%), not-for-profit organizations (82 | 20.3%), and self-employed (not incorporated) (34 | 8.4%) make up the most common classes of employment.
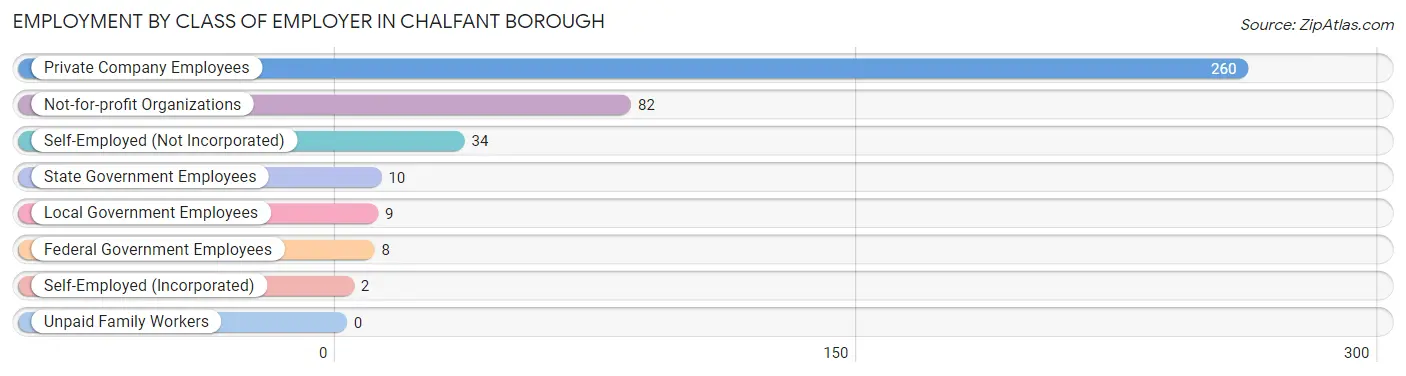
| Employer Class | # Employees | % Employees |
| Private Company Employees | 260 | 64.2% |
| Self-Employed (Incorporated) | 2 | 0.5% |
| Self-Employed (Not Incorporated) | 34 | 8.4% |
| Not-for-profit Organizations | 82 | 20.3% |
| Local Government Employees | 9 | 2.2% |
| State Government Employees | 10 | 2.5% |
| Federal Government Employees | 8 | 2.0% |
| Unpaid Family Workers | 0 | 0.0% |
| Total | 405 | 100.0% |
Employment Status by Age in Chalfant borough
According to the labor force statistics for Chalfant borough, out of the total population over 16 years of age (577), 70.7% or 408 individuals are in the labor force, with 0.7% or 3 of them unemployed. The age group with the highest labor force participation rate is 25 to 29 years, with 100.0% or 45 individuals in the labor force. Within the labor force, the 25 to 29 years age range has the highest percentage of unemployed individuals, with 6.7% or 3 of them being unemployed.
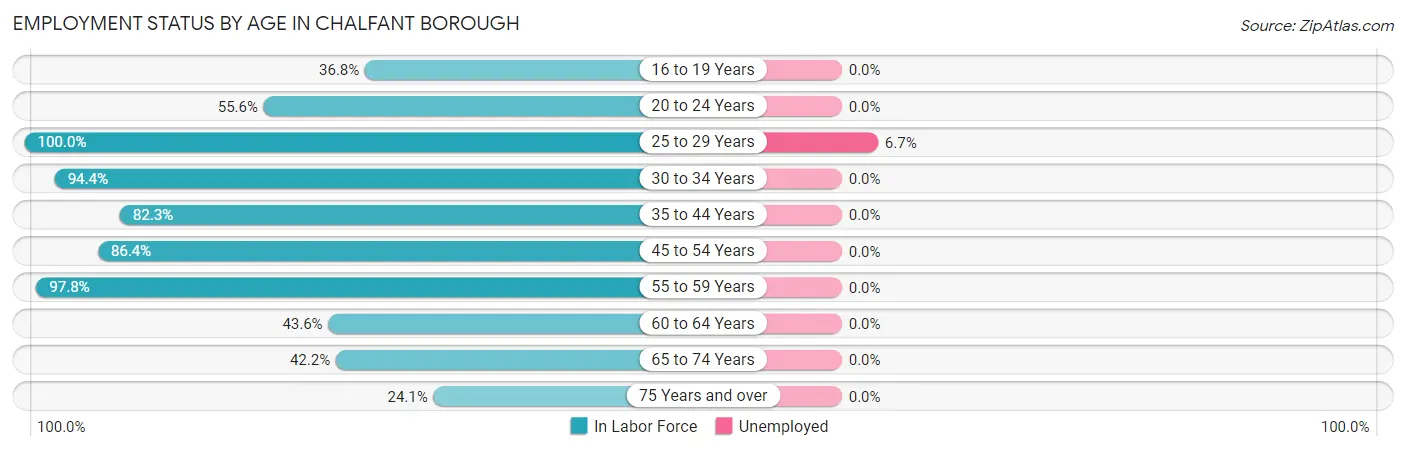
| Age Bracket | In Labor Force | Unemployed |
| 16 to 19 Years | 7 (36.8%) | 0 (0.0%) |
| 20 to 24 Years | 15 (55.6%) | 0 (0.0%) |
| 25 to 29 Years | 45 (100.0%) | 3 (6.7%) |
| 30 to 34 Years | 34 (94.4%) | 0 (0.0%) |
| 35 to 44 Years | 79 (82.3%) | 0 (0.0%) |
| 45 to 54 Years | 76 (86.4%) | 0 (0.0%) |
| 55 to 59 Years | 87 (97.8%) | 0 (0.0%) |
| 60 to 64 Years | 24 (43.6%) | 0 (0.0%) |
| 65 to 74 Years | 27 (42.2%) | 0 (0.0%) |
| 75 Years and over | 14 (24.1%) | 0 (0.0%) |
| Total | 408 (70.7%) | 3 (0.7%) |
Employment Status by Educational Attainment in Chalfant borough
According to labor force statistics for Chalfant borough, 84.4% of individuals (345) out of the total population between 25 and 64 years of age (409) are in the labor force, with 0.9% or 3 of them being unemployed. The group with the highest labor force participation rate are those with the educational attainment of less than high school, with 100.0% or 6 individuals in the labor force. Within the labor force, individuals with bachelor's degree or higher education have the highest percentage of unemployment, with 3.7% or 3 of them being unemployed.
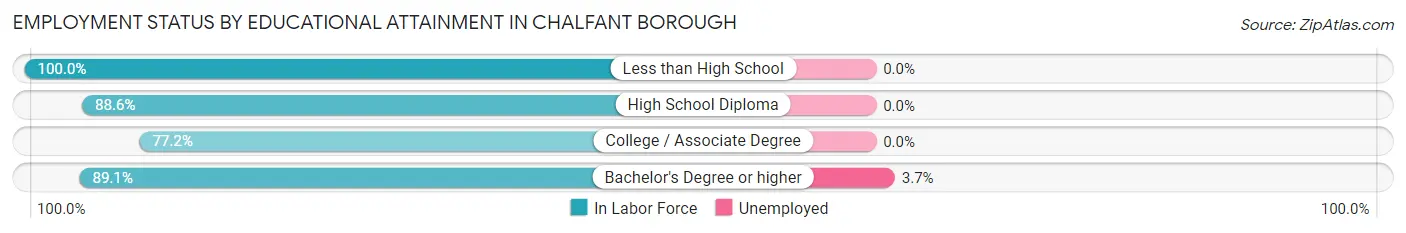
| Educational Attainment | In Labor Force | Unemployed |
| Less than High School | 6 (100.0%) | 0 (0.0%) |
| High School Diploma | 132 (88.6%) | 0 (0.0%) |
| College / Associate Degree | 125 (77.2%) | 0 (0.0%) |
| Bachelor's Degree or higher | 82 (89.1%) | 3 (3.7%) |
| Total | 345 (84.4%) | 4 (0.9%) |
Employment Occupations by Sex in Chalfant borough
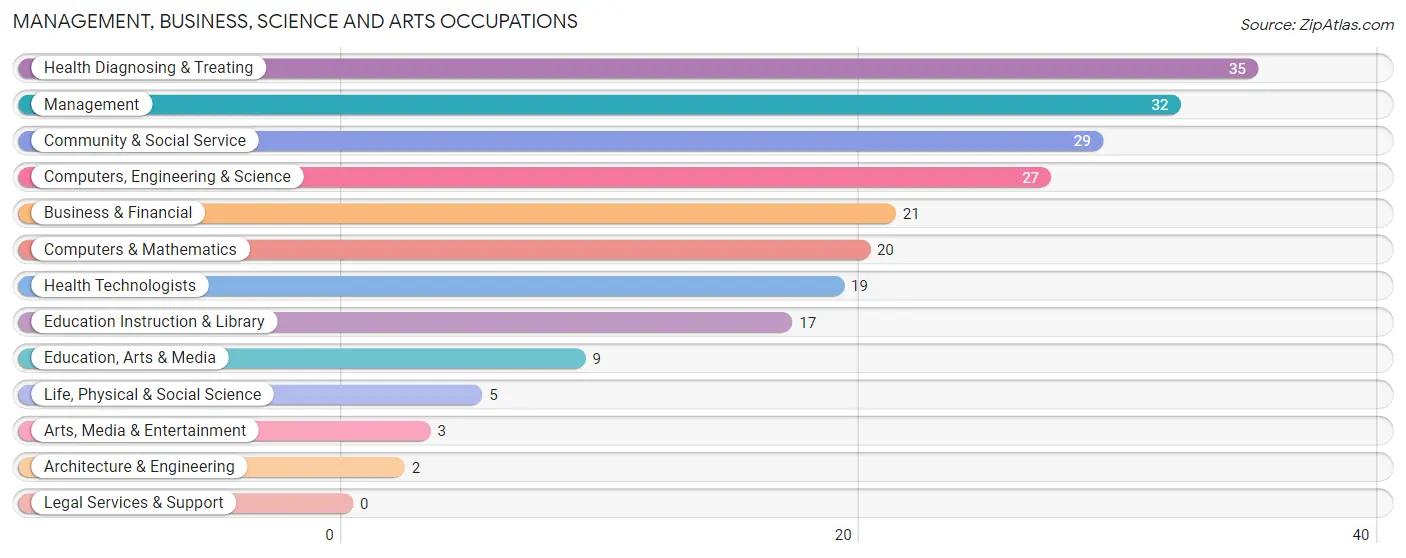
Management, Business, Science and Arts Occupations
The most common Management, Business, Science and Arts occupations in Chalfant borough are Health Diagnosing & Treating (35 | 8.6%), Management (32 | 7.9%), Community & Social Service (29 | 7.2%), Computers, Engineering & Science (27 | 6.7%), and Business & Financial (21 | 5.2%).
Management, Business, Science and Arts Occupations by Sex
Within the Management, Business, Science and Arts occupations in Chalfant borough, the most male-oriented occupations are Architecture & Engineering (100.0%), Life, Physical & Social Science (100.0%), and Arts, Media & Entertainment (100.0%), while the most female-oriented occupations are Education, Arts & Media (100.0%), Health Diagnosing & Treating (82.9%), and Education Instruction & Library (82.4%).
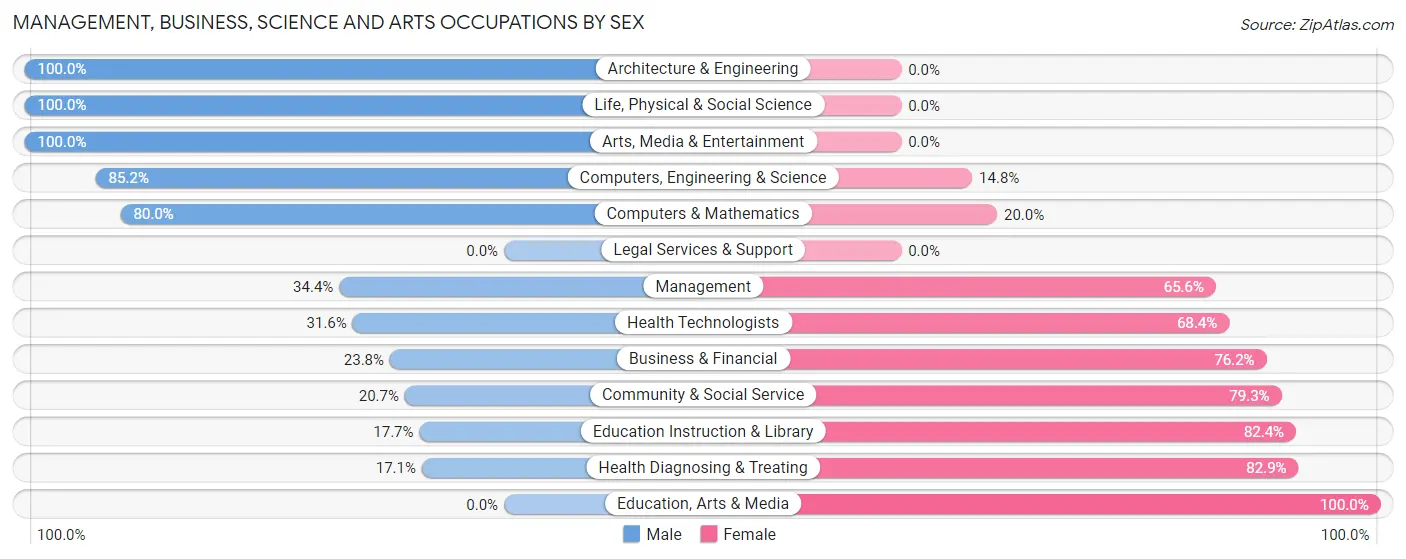
| Occupation | Male | Female |
| Management | 11 (34.4%) | 21 (65.6%) |
| Business & Financial | 5 (23.8%) | 16 (76.2%) |
| Computers, Engineering & Science | 23 (85.2%) | 4 (14.8%) |
| Computers & Mathematics | 16 (80.0%) | 4 (20.0%) |
| Architecture & Engineering | 2 (100.0%) | 0 (0.0%) |
| Life, Physical & Social Science | 5 (100.0%) | 0 (0.0%) |
| Community & Social Service | 6 (20.7%) | 23 (79.3%) |
| Education, Arts & Media | 0 (0.0%) | 9 (100.0%) |
| Legal Services & Support | 0 (0.0%) | 0 (0.0%) |
| Education Instruction & Library | 3 (17.6%) | 14 (82.4%) |
| Arts, Media & Entertainment | 3 (100.0%) | 0 (0.0%) |
| Health Diagnosing & Treating | 6 (17.1%) | 29 (82.9%) |
| Health Technologists | 6 (31.6%) | 13 (68.4%) |
| Total (Category) | 51 (35.4%) | 93 (64.6%) |
| Total (Overall) | 227 (56.0%) | 178 (44.0%) |
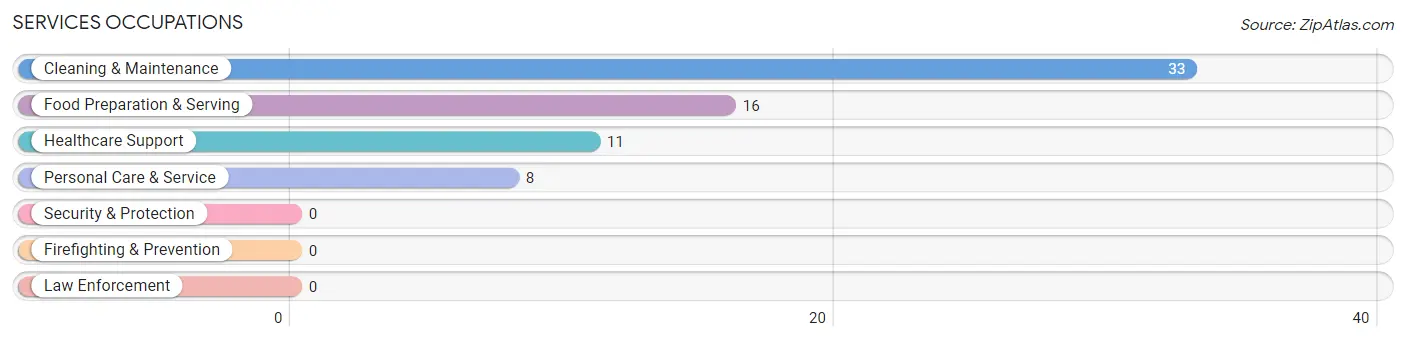
Services Occupations
The most common Services occupations in Chalfant borough are Cleaning & Maintenance (33 | 8.2%), Food Preparation & Serving (16 | 4.0%), Healthcare Support (11 | 2.7%), and Personal Care & Service (8 | 2.0%).
Services Occupations by Sex
Within the Services occupations in Chalfant borough, the most male-oriented occupations are Cleaning & Maintenance (84.9%), and Food Preparation & Serving (56.2%), while the most female-oriented occupations are Healthcare Support (100.0%), Personal Care & Service (100.0%), and Food Preparation & Serving (43.8%).
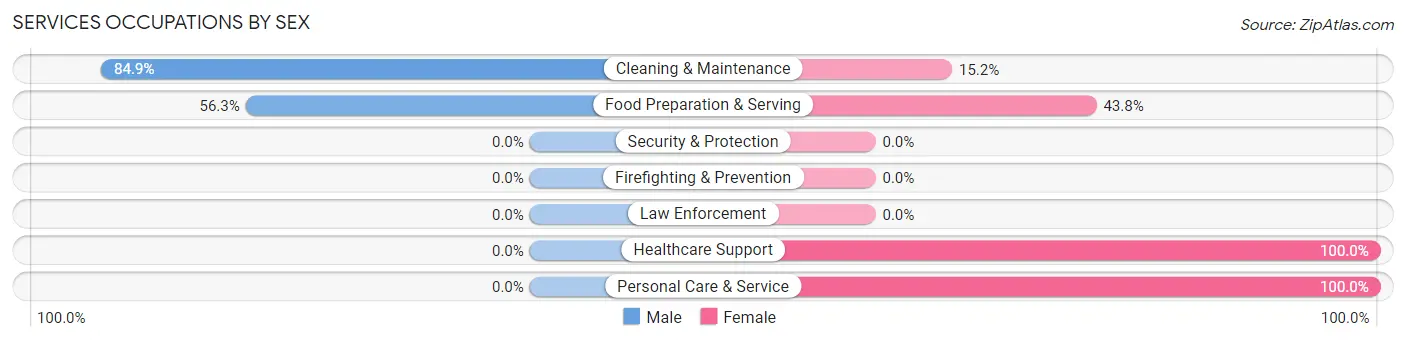
| Occupation | Male | Female |
| Healthcare Support | 0 (0.0%) | 11 (100.0%) |
| Security & Protection | 0 (0.0%) | 0 (0.0%) |
| Firefighting & Prevention | 0 (0.0%) | 0 (0.0%) |
| Law Enforcement | 0 (0.0%) | 0 (0.0%) |
| Food Preparation & Serving | 9 (56.2%) | 7 (43.8%) |
| Cleaning & Maintenance | 28 (84.9%) | 5 (15.1%) |
| Personal Care & Service | 0 (0.0%) | 8 (100.0%) |
| Total (Category) | 37 (54.4%) | 31 (45.6%) |
| Total (Overall) | 227 (56.0%) | 178 (44.0%) |
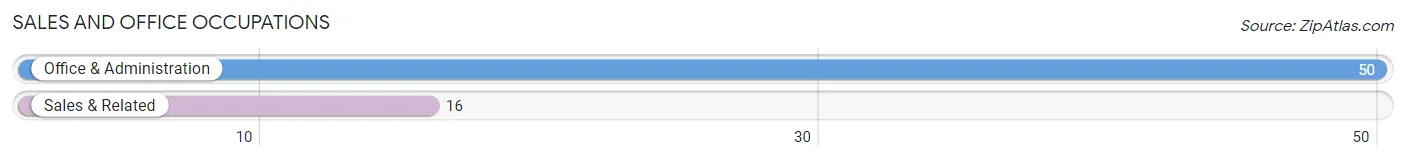
Sales and Office Occupations
The most common Sales and Office occupations in Chalfant borough are Office & Administration (50 | 12.3%), and Sales & Related (16 | 4.0%).
Sales and Office Occupations by Sex

| Occupation | Male | Female |
| Sales & Related | 3 (18.8%) | 13 (81.2%) |
| Office & Administration | 16 (32.0%) | 34 (68.0%) |
| Total (Category) | 19 (28.8%) | 47 (71.2%) |
| Total (Overall) | 227 (56.0%) | 178 (44.0%) |
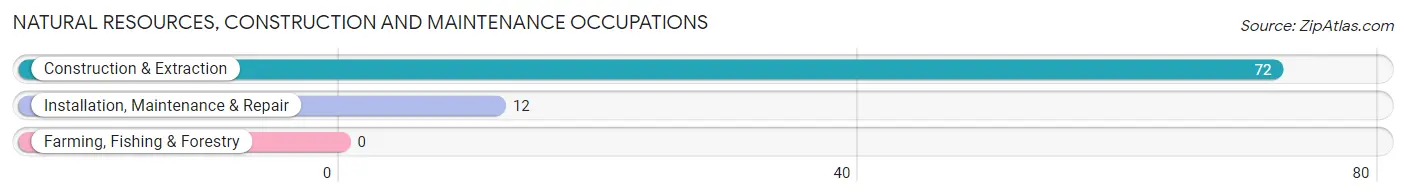
Natural Resources, Construction and Maintenance Occupations
The most common Natural Resources, Construction and Maintenance occupations in Chalfant borough are Construction & Extraction (72 | 17.8%), and Installation, Maintenance & Repair (12 | 3.0%).
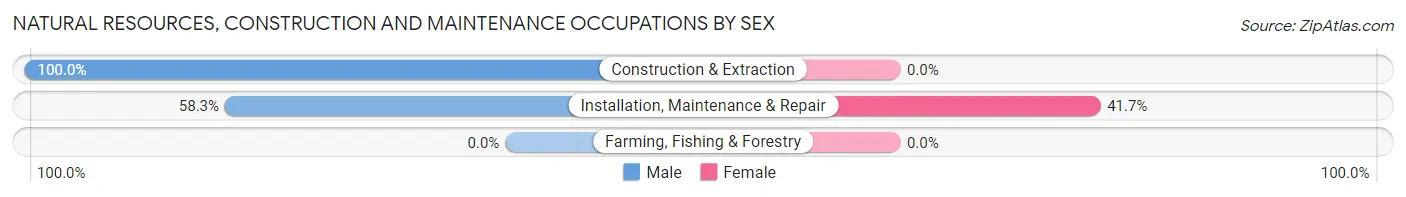
Natural Resources, Construction and Maintenance Occupations by Sex
| Occupation | Male | Female |
| Farming, Fishing & Forestry | 0 (0.0%) | 0 (0.0%) |
| Construction & Extraction | 72 (100.0%) | 0 (0.0%) |
| Installation, Maintenance & Repair | 7 (58.3%) | 5 (41.7%) |
| Total (Category) | 79 (94.1%) | 5 (5.9%) |
| Total (Overall) | 227 (56.0%) | 178 (44.0%) |
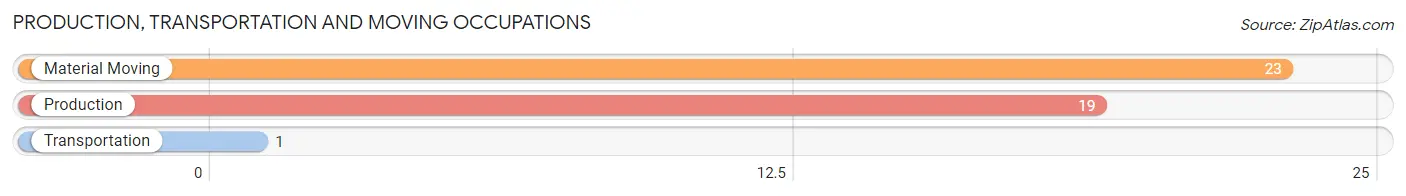
Production, Transportation and Moving Occupations
The most common Production, Transportation and Moving occupations in Chalfant borough are Material Moving (23 | 5.7%), Production (19 | 4.7%), and Transportation (1 | 0.3%).
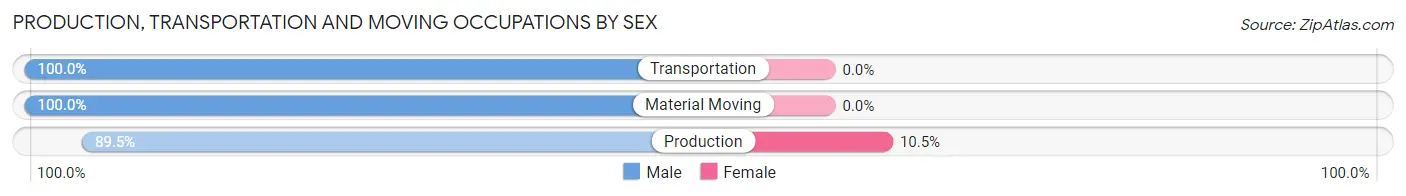
Production, Transportation and Moving Occupations by Sex
| Occupation | Male | Female |
| Production | 17 (89.5%) | 2 (10.5%) |
| Transportation | 1 (100.0%) | 0 (0.0%) |
| Material Moving | 23 (100.0%) | 0 (0.0%) |
| Total (Category) | 41 (95.4%) | 2 (4.6%) |
| Total (Overall) | 227 (56.0%) | 178 (44.0%) |
Employment Industries by Sex in Chalfant borough
Employment Industries in Chalfant borough
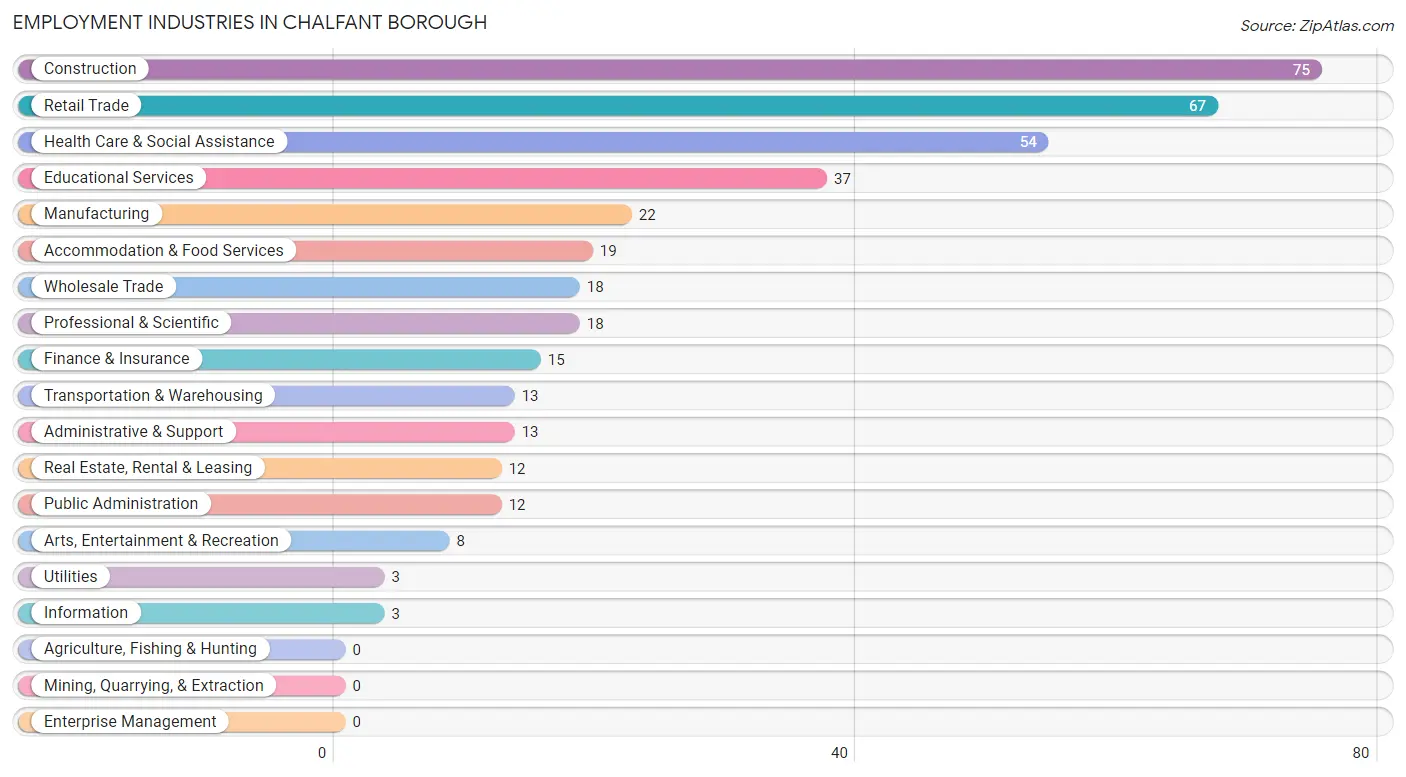
The major employment industries in Chalfant borough include Construction (75 | 18.5%), Retail Trade (67 | 16.5%), Health Care & Social Assistance (54 | 13.3%), Educational Services (37 | 9.1%), and Manufacturing (22 | 5.4%).
Employment Industries by Sex in Chalfant borough
The Chalfant borough industries that see more men than women are Construction (100.0%), Transportation & Warehousing (100.0%), and Utilities (100.0%), whereas the industries that tend to have a higher number of women are Professional & Scientific (88.9%), Health Care & Social Assistance (79.6%), and Real Estate, Rental & Leasing (75.0%).
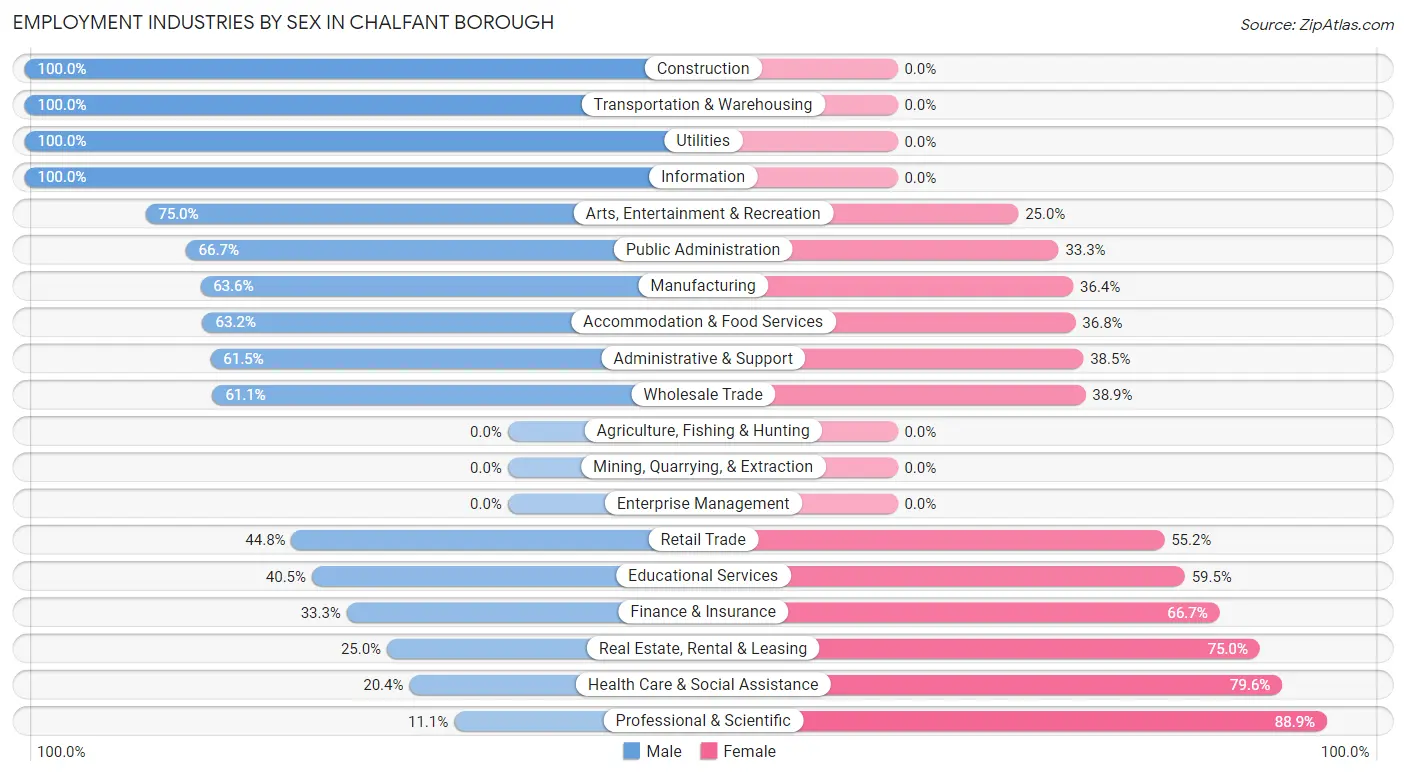
| Industry | Male | Female |
| Agriculture, Fishing & Hunting | 0 (0.0%) | 0 (0.0%) |
| Mining, Quarrying, & Extraction | 0 (0.0%) | 0 (0.0%) |
| Construction | 75 (100.0%) | 0 (0.0%) |
| Manufacturing | 14 (63.6%) | 8 (36.4%) |
| Wholesale Trade | 11 (61.1%) | 7 (38.9%) |
| Retail Trade | 30 (44.8%) | 37 (55.2%) |
| Transportation & Warehousing | 13 (100.0%) | 0 (0.0%) |
| Utilities | 3 (100.0%) | 0 (0.0%) |
| Information | 3 (100.0%) | 0 (0.0%) |
| Finance & Insurance | 5 (33.3%) | 10 (66.7%) |
| Real Estate, Rental & Leasing | 3 (25.0%) | 9 (75.0%) |
| Professional & Scientific | 2 (11.1%) | 16 (88.9%) |
| Enterprise Management | 0 (0.0%) | 0 (0.0%) |
| Administrative & Support | 8 (61.5%) | 5 (38.5%) |
| Educational Services | 15 (40.5%) | 22 (59.5%) |
| Health Care & Social Assistance | 11 (20.4%) | 43 (79.6%) |
| Arts, Entertainment & Recreation | 6 (75.0%) | 2 (25.0%) |
| Accommodation & Food Services | 12 (63.2%) | 7 (36.8%) |
| Public Administration | 8 (66.7%) | 4 (33.3%) |
| Total | 227 (56.0%) | 178 (44.0%) |
Education in Chalfant borough
School Enrollment in Chalfant borough
The most common levels of schooling among the 92 students in Chalfant borough are high school (34 | 37.0%), elementary school (17 | 18.5%), and college / undergraduate (17 | 18.5%).
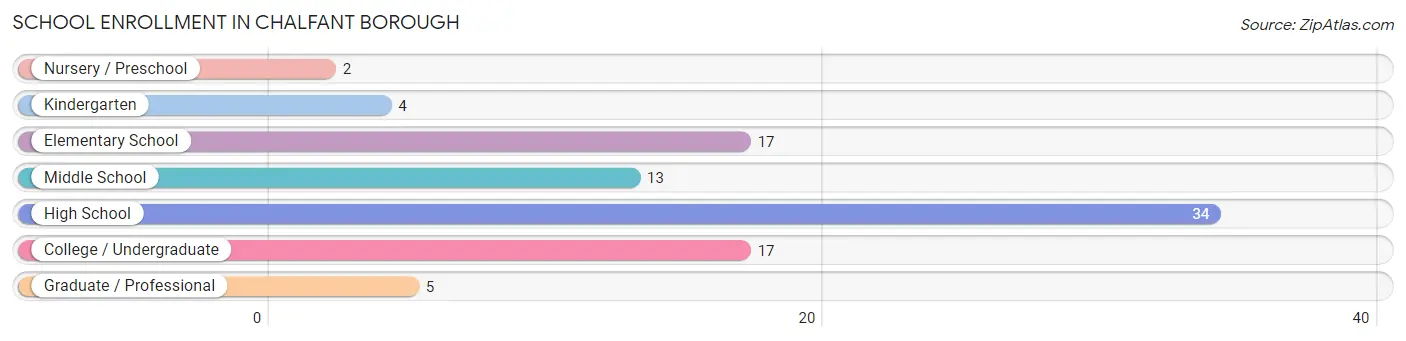
| School Level | # Students | % Students |
| Nursery / Preschool | 2 | 2.2% |
| Kindergarten | 4 | 4.3% |
| Elementary School | 17 | 18.5% |
| Middle School | 13 | 14.1% |
| High School | 34 | 37.0% |
| College / Undergraduate | 17 | 18.5% |
| Graduate / Professional | 5 | 5.4% |
| Total | 92 | 100.0% |
School Enrollment by Age by Funding Source in Chalfant borough
Out of a total of 92 students who are enrolled in schools in Chalfant borough, 28 (30.4%) attend a private institution, while the remaining 64 (69.6%) are enrolled in public schools. The age group of 3 to 4 year olds has the highest likelihood of being enrolled in private schools, with 2 (100.0% in the age bracket) enrolled. Conversely, the age group of 15 to 17 year olds has the lowest likelihood of being enrolled in a private school, with 20 (100.0% in the age bracket) attending a public institution.
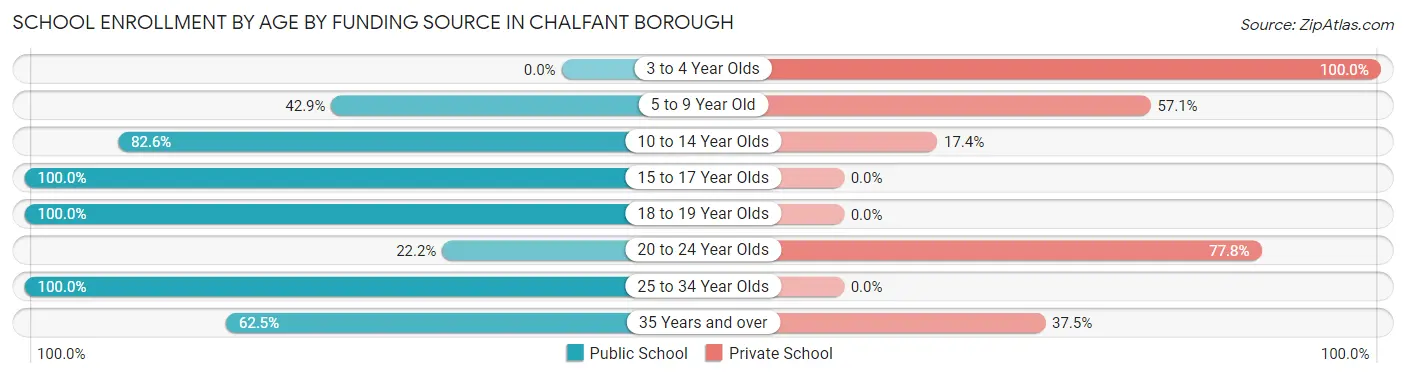
| Age Bracket | Public School | Private School |
| 3 to 4 Year Olds | 0 (0.0%) | 2 (100.0%) |
| 5 to 9 Year Old | 9 (42.9%) | 12 (57.1%) |
| 10 to 14 Year Olds | 19 (82.6%) | 4 (17.4%) |
| 15 to 17 Year Olds | 20 (100.0%) | 0 (0.0%) |
| 18 to 19 Year Olds | 7 (100.0%) | 0 (0.0%) |
| 20 to 24 Year Olds | 2 (22.2%) | 7 (77.8%) |
| 25 to 34 Year Olds | 2 (100.0%) | 0 (0.0%) |
| 35 Years and over | 5 (62.5%) | 3 (37.5%) |
| Total | 64 (69.6%) | 28 (30.4%) |
Educational Attainment by Field of Study in Chalfant borough
Business (27 | 23.5%), psychology (25 | 21.7%), visual & performing arts (13 | 11.3%), science & technology (10 | 8.7%), and social sciences (9 | 7.8%) are the most common fields of study among 115 individuals in Chalfant borough who have obtained a bachelor's degree or higher.
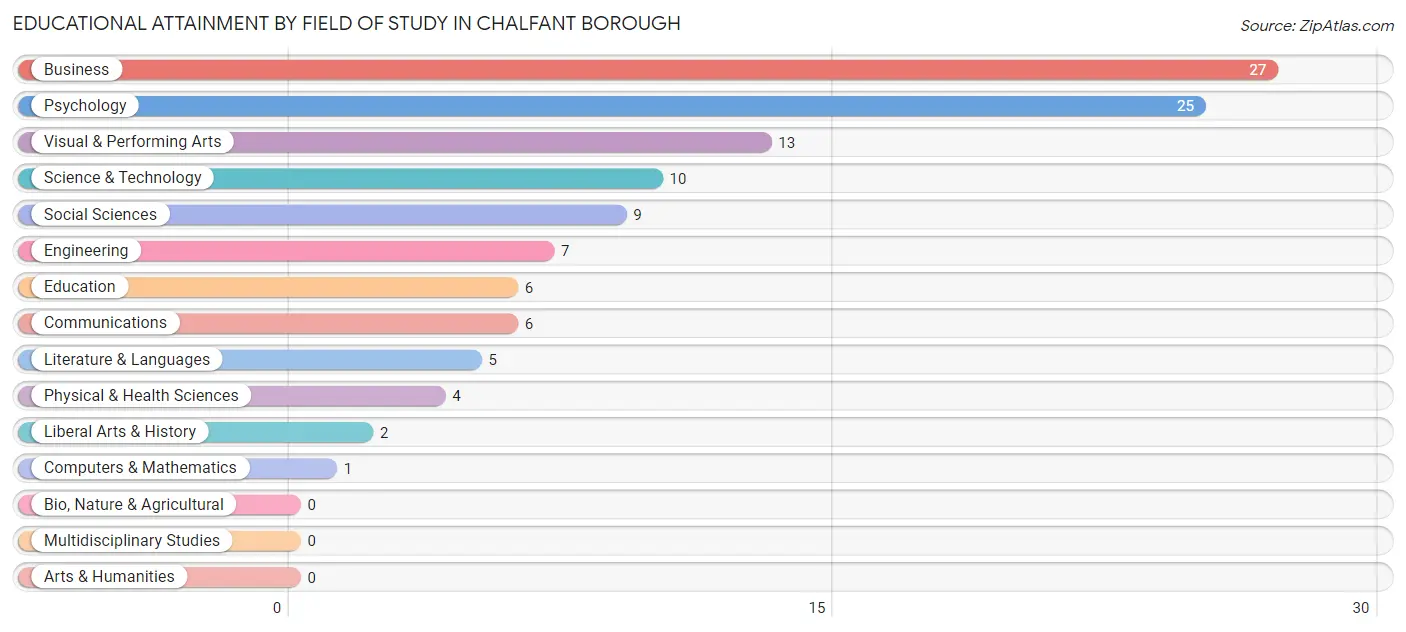
| Field of Study | # Graduates | % Graduates |
| Computers & Mathematics | 1 | 0.9% |
| Bio, Nature & Agricultural | 0 | 0.0% |
| Physical & Health Sciences | 4 | 3.5% |
| Psychology | 25 | 21.7% |
| Social Sciences | 9 | 7.8% |
| Engineering | 7 | 6.1% |
| Multidisciplinary Studies | 0 | 0.0% |
| Science & Technology | 10 | 8.7% |
| Business | 27 | 23.5% |
| Education | 6 | 5.2% |
| Literature & Languages | 5 | 4.3% |
| Liberal Arts & History | 2 | 1.7% |
| Visual & Performing Arts | 13 | 11.3% |
| Communications | 6 | 5.2% |
| Arts & Humanities | 0 | 0.0% |
| Total | 115 | 100.0% |
Transportation & Commute in Chalfant borough
Vehicle Availability by Sex in Chalfant borough
The most prevalent vehicle ownership categories in Chalfant borough are males with 1 vehicle (118, accounting for 52.0%) and females with 1 vehicle (77, making up 66.3%).
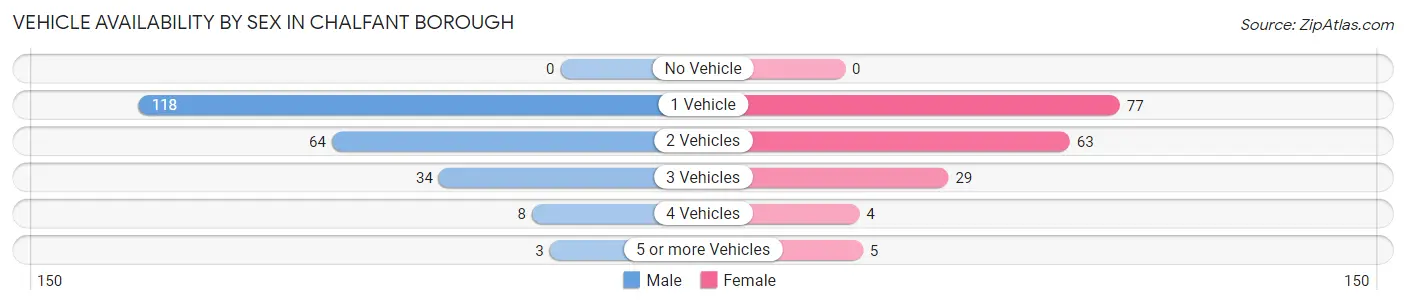
| Vehicles Available | Male | Female |
| No Vehicle | 0 (0.0%) | 0 (0.0%) |
| 1 Vehicle | 118 (52.0%) | 77 (43.3%) |
| 2 Vehicles | 64 (28.2%) | 63 (35.4%) |
| 3 Vehicles | 34 (15.0%) | 29 (16.3%) |
| 4 Vehicles | 8 (3.5%) | 4 (2.2%) |
| 5 or more Vehicles | 3 (1.3%) | 5 (2.8%) |
| Total | 227 (100.0%) | 178 (100.0%) |
Commute Time in Chalfant borough
The most frequently occuring commute durations in Chalfant borough are 15 to 19 minutes (114 commuters, 31.2%), 10 to 14 minutes (48 commuters, 13.2%), and 30 to 34 minutes (40 commuters, 11.0%).
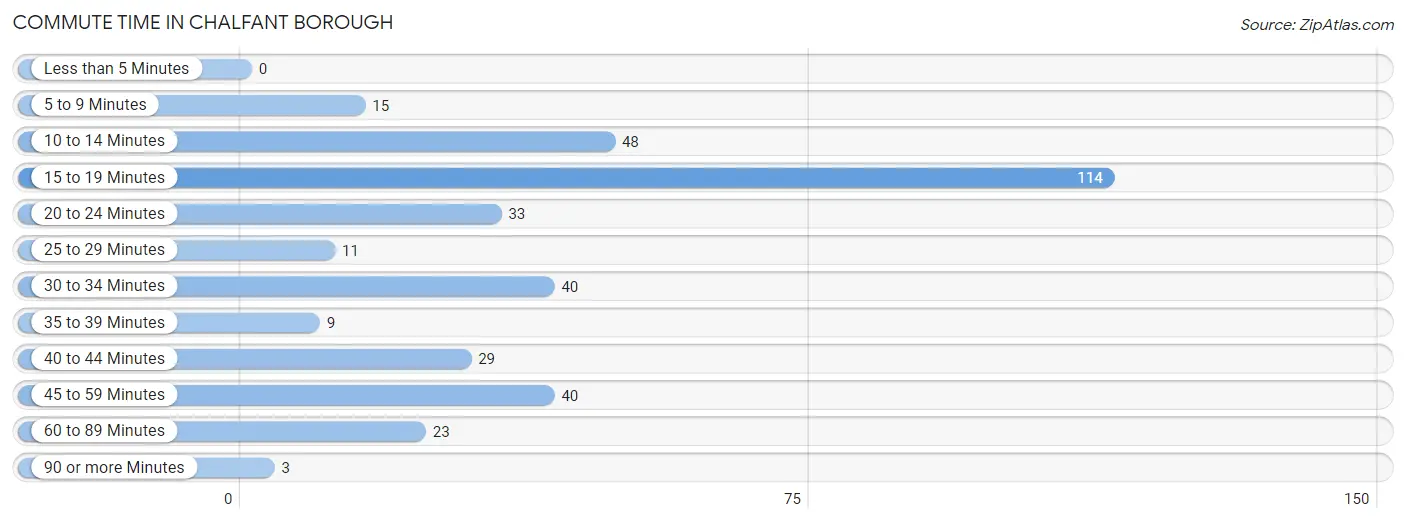
| Commute Time | # Commuters | % Commuters |
| Less than 5 Minutes | 0 | 0.0% |
| 5 to 9 Minutes | 15 | 4.1% |
| 10 to 14 Minutes | 48 | 13.2% |
| 15 to 19 Minutes | 114 | 31.2% |
| 20 to 24 Minutes | 33 | 9.0% |
| 25 to 29 Minutes | 11 | 3.0% |
| 30 to 34 Minutes | 40 | 11.0% |
| 35 to 39 Minutes | 9 | 2.5% |
| 40 to 44 Minutes | 29 | 8.0% |
| 45 to 59 Minutes | 40 | 11.0% |
| 60 to 89 Minutes | 23 | 6.3% |
| 90 or more Minutes | 3 | 0.8% |
Commute Time by Sex in Chalfant borough
The most common commute times in Chalfant borough are 15 to 19 minutes (92 commuters, 43.0%) for males and 10 to 14 minutes (31 commuters, 20.5%) for females.
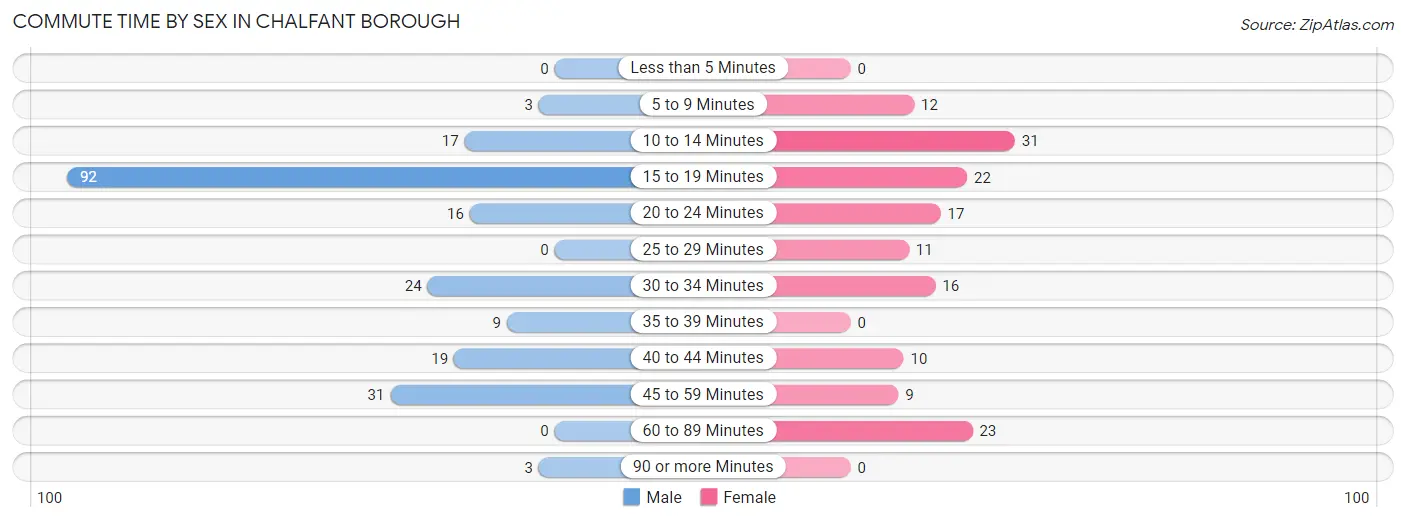
| Commute Time | Male | Female |
| Less than 5 Minutes | 0 (0.0%) | 0 (0.0%) |
| 5 to 9 Minutes | 3 (1.4%) | 12 (8.0%) |
| 10 to 14 Minutes | 17 (7.9%) | 31 (20.5%) |
| 15 to 19 Minutes | 92 (43.0%) | 22 (14.6%) |
| 20 to 24 Minutes | 16 (7.5%) | 17 (11.3%) |
| 25 to 29 Minutes | 0 (0.0%) | 11 (7.3%) |
| 30 to 34 Minutes | 24 (11.2%) | 16 (10.6%) |
| 35 to 39 Minutes | 9 (4.2%) | 0 (0.0%) |
| 40 to 44 Minutes | 19 (8.9%) | 10 (6.6%) |
| 45 to 59 Minutes | 31 (14.5%) | 9 (6.0%) |
| 60 to 89 Minutes | 0 (0.0%) | 23 (15.2%) |
| 90 or more Minutes | 3 (1.4%) | 0 (0.0%) |
Time of Departure to Work by Sex in Chalfant borough
The most frequent times of departure to work in Chalfant borough are 12:00 AM to 4:59 AM (59, 27.6%) for males and 8:30 AM to 8:59 AM (34, 22.5%) for females.
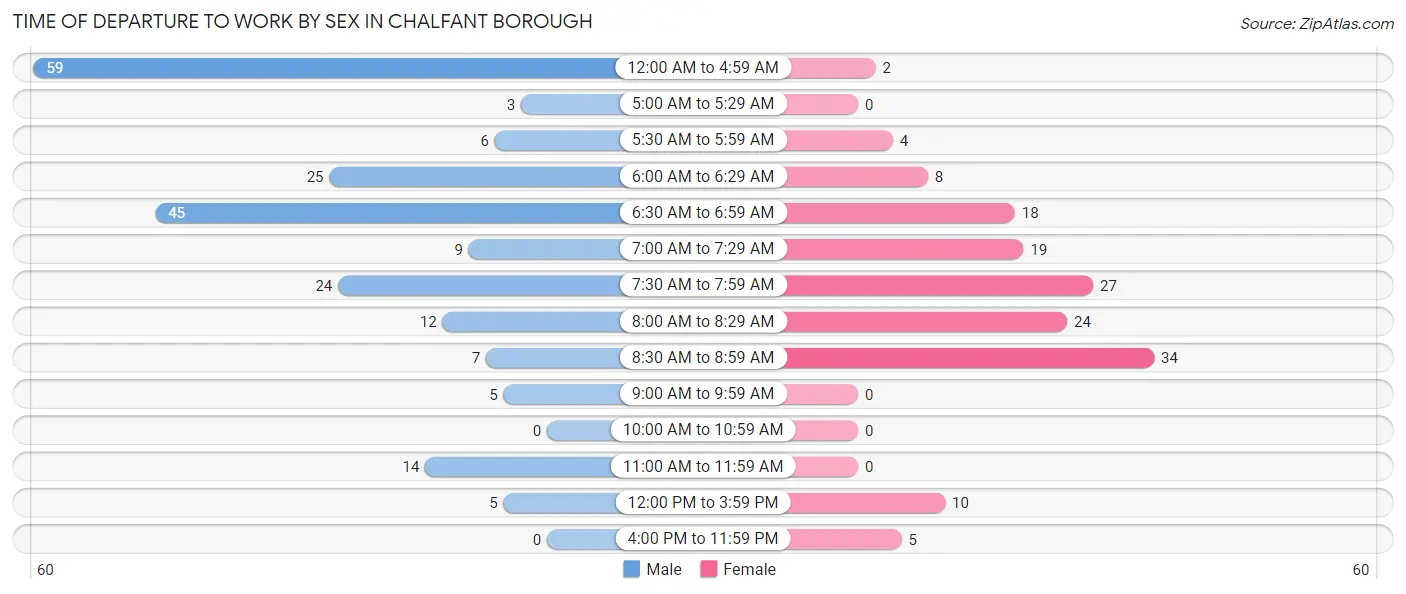
| Time of Departure | Male | Female |
| 12:00 AM to 4:59 AM | 59 (27.6%) | 2 (1.3%) |
| 5:00 AM to 5:29 AM | 3 (1.4%) | 0 (0.0%) |
| 5:30 AM to 5:59 AM | 6 (2.8%) | 4 (2.6%) |
| 6:00 AM to 6:29 AM | 25 (11.7%) | 8 (5.3%) |
| 6:30 AM to 6:59 AM | 45 (21.0%) | 18 (11.9%) |
| 7:00 AM to 7:29 AM | 9 (4.2%) | 19 (12.6%) |
| 7:30 AM to 7:59 AM | 24 (11.2%) | 27 (17.9%) |
| 8:00 AM to 8:29 AM | 12 (5.6%) | 24 (15.9%) |
| 8:30 AM to 8:59 AM | 7 (3.3%) | 34 (22.5%) |
| 9:00 AM to 9:59 AM | 5 (2.3%) | 0 (0.0%) |
| 10:00 AM to 10:59 AM | 0 (0.0%) | 0 (0.0%) |
| 11:00 AM to 11:59 AM | 14 (6.5%) | 0 (0.0%) |
| 12:00 PM to 3:59 PM | 5 (2.3%) | 10 (6.6%) |
| 4:00 PM to 11:59 PM | 0 (0.0%) | 5 (3.3%) |
| Total | 214 (100.0%) | 151 (100.0%) |
Housing Occupancy in Chalfant borough
Occupancy by Ownership in Chalfant borough
Of the total 363 dwellings in Chalfant borough, owner-occupied units account for 212 (58.4%), while renter-occupied units make up 151 (41.6%).
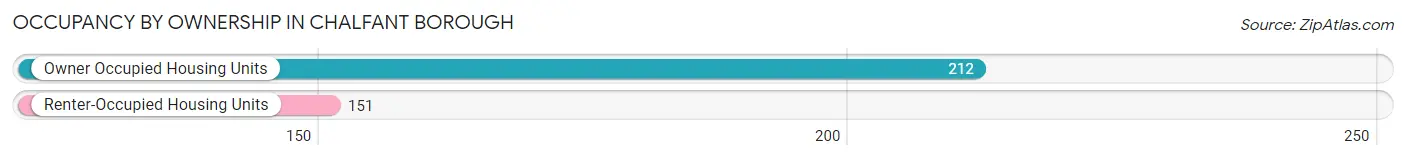
| Occupancy | # Housing Units | % Housing Units |
| Owner Occupied Housing Units | 212 | 58.4% |
| Renter-Occupied Housing Units | 151 | 41.6% |
| Total Occupied Housing Units | 363 | 100.0% |
Occupancy by Household Size in Chalfant borough
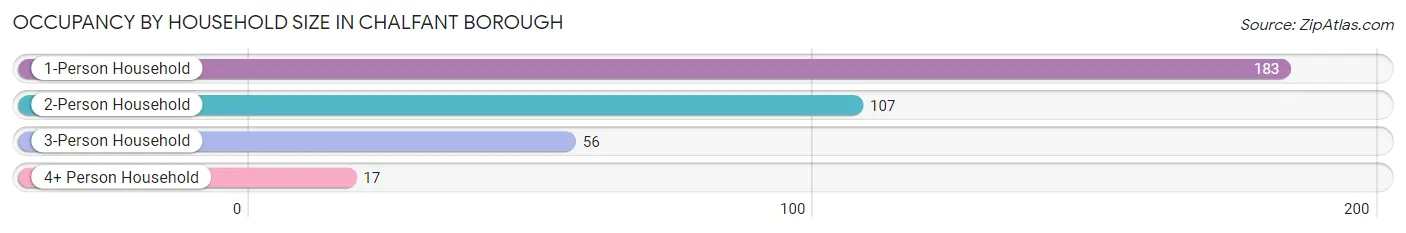
| Household Size | # Housing Units | % Housing Units |
| 1-Person Household | 183 | 50.4% |
| 2-Person Household | 107 | 29.5% |
| 3-Person Household | 56 | 15.4% |
| 4+ Person Household | 17 | 4.7% |
| Total Housing Units | 363 | 100.0% |
Occupancy by Ownership by Household Size in Chalfant borough
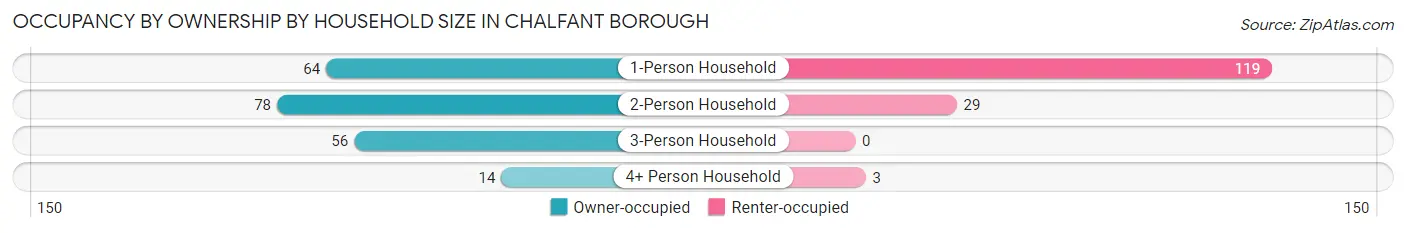
| Household Size | Owner-occupied | Renter-occupied |
| 1-Person Household | 64 (35.0%) | 119 (65.0%) |
| 2-Person Household | 78 (72.9%) | 29 (27.1%) |
| 3-Person Household | 56 (100.0%) | 0 (0.0%) |
| 4+ Person Household | 14 (82.4%) | 3 (17.6%) |
| Total Housing Units | 212 (58.4%) | 151 (41.6%) |
Occupancy by Educational Attainment in Chalfant borough
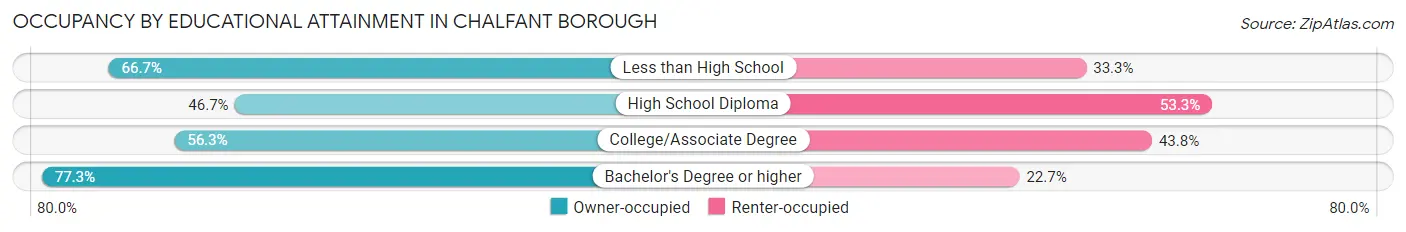
| Household Size | Owner-occupied | Renter-occupied |
| Less than High School | 6 (66.7%) | 3 (33.3%) |
| High School Diploma | 57 (46.7%) | 65 (53.3%) |
| College/Associate Degree | 81 (56.2%) | 63 (43.8%) |
| Bachelor's Degree or higher | 68 (77.3%) | 20 (22.7%) |
Occupancy by Age of Householder in Chalfant borough
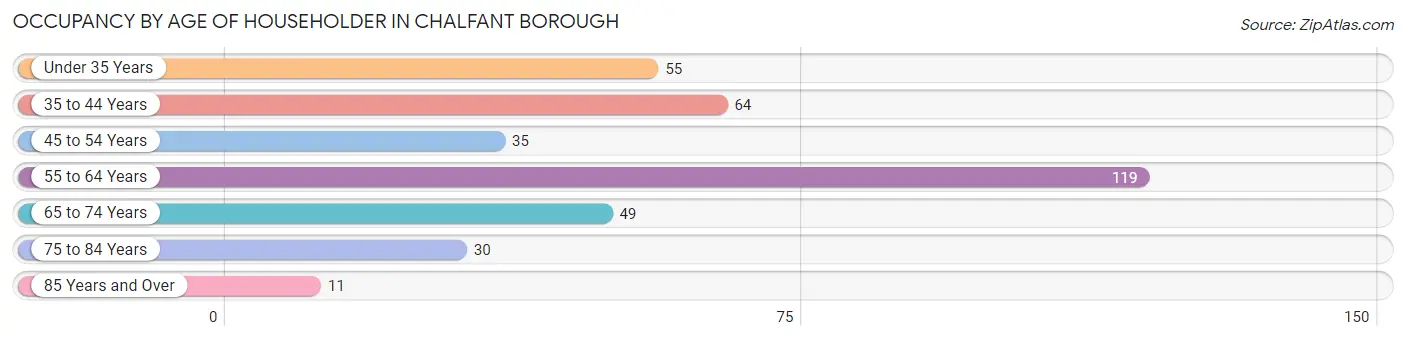
| Age Bracket | # Households | % Households |
| Under 35 Years | 55 | 15.1% |
| 35 to 44 Years | 64 | 17.6% |
| 45 to 54 Years | 35 | 9.6% |
| 55 to 64 Years | 119 | 32.8% |
| 65 to 74 Years | 49 | 13.5% |
| 75 to 84 Years | 30 | 8.3% |
| 85 Years and Over | 11 | 3.0% |
| Total | 363 | 100.0% |
Housing Finances in Chalfant borough
Median Income by Occupancy in Chalfant borough
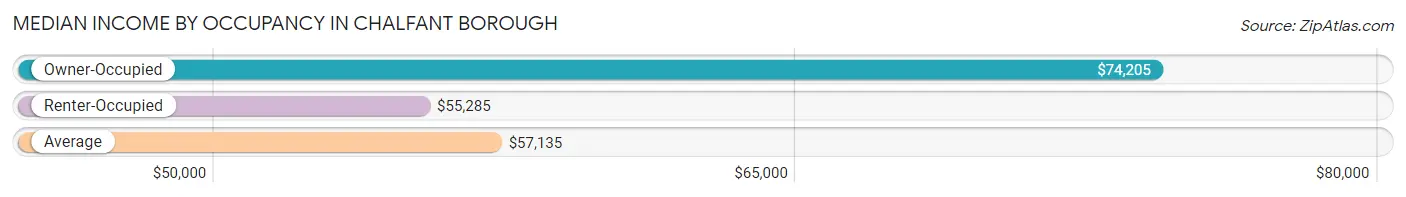
| Occupancy Type | # Households | Median Income |
| Owner-Occupied | 212 (58.4%) | $74,205 |
| Renter-Occupied | 151 (41.6%) | $55,285 |
| Average | 363 (100.0%) | $57,135 |
Occupancy by Householder Income Bracket in Chalfant borough
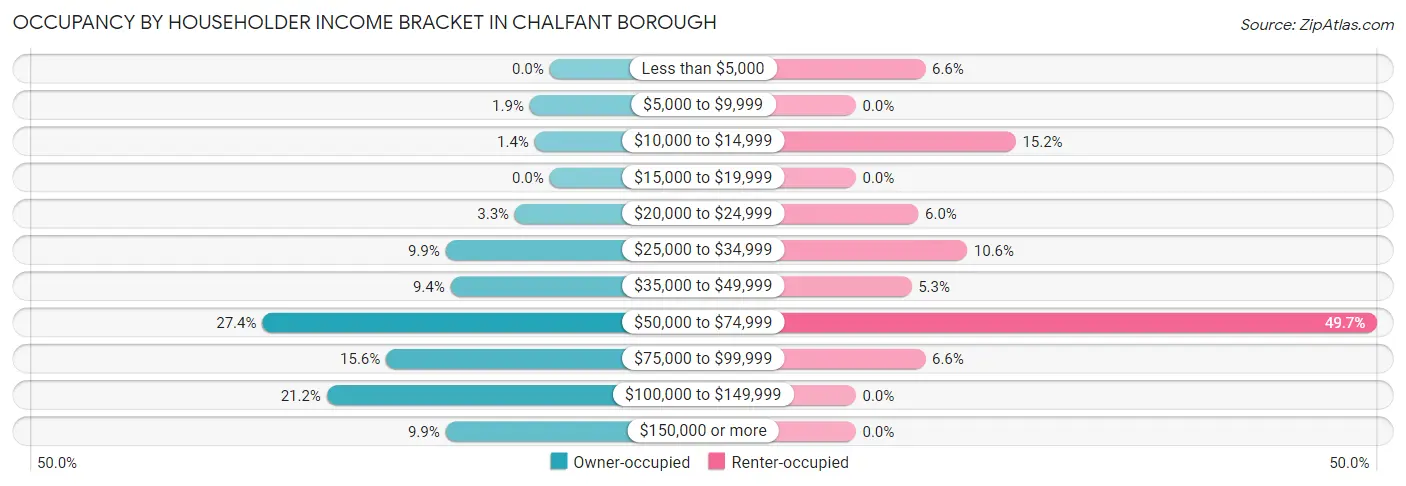
| Income Bracket | Owner-occupied | Renter-occupied |
| Less than $5,000 | 0 (0.0%) | 10 (6.6%) |
| $5,000 to $9,999 | 4 (1.9%) | 0 (0.0%) |
| $10,000 to $14,999 | 3 (1.4%) | 23 (15.2%) |
| $15,000 to $19,999 | 0 (0.0%) | 0 (0.0%) |
| $20,000 to $24,999 | 7 (3.3%) | 9 (6.0%) |
| $25,000 to $34,999 | 21 (9.9%) | 16 (10.6%) |
| $35,000 to $49,999 | 20 (9.4%) | 8 (5.3%) |
| $50,000 to $74,999 | 58 (27.4%) | 75 (49.7%) |
| $75,000 to $99,999 | 33 (15.6%) | 10 (6.6%) |
| $100,000 to $149,999 | 45 (21.2%) | 0 (0.0%) |
| $150,000 or more | 21 (9.9%) | 0 (0.0%) |
| Total | 212 (100.0%) | 151 (100.0%) |
Monthly Housing Cost Tiers in Chalfant borough
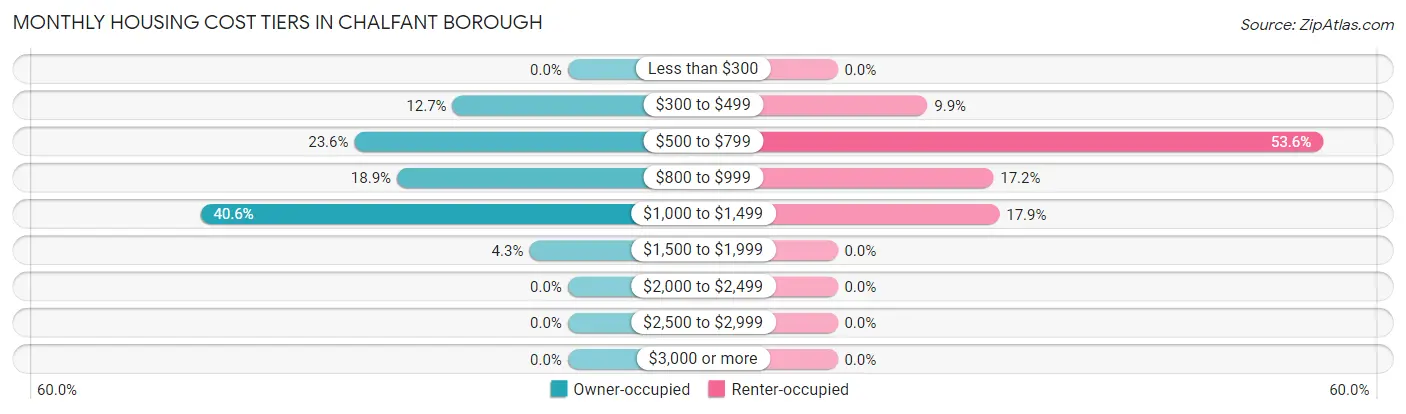
| Monthly Cost | Owner-occupied | Renter-occupied |
| Less than $300 | 0 (0.0%) | 0 (0.0%) |
| $300 to $499 | 27 (12.7%) | 15 (9.9%) |
| $500 to $799 | 50 (23.6%) | 81 (53.6%) |
| $800 to $999 | 40 (18.9%) | 26 (17.2%) |
| $1,000 to $1,499 | 86 (40.6%) | 27 (17.9%) |
| $1,500 to $1,999 | 9 (4.3%) | 0 (0.0%) |
| $2,000 to $2,499 | 0 (0.0%) | 0 (0.0%) |
| $2,500 to $2,999 | 0 (0.0%) | 0 (0.0%) |
| $3,000 or more | 0 (0.0%) | 0 (0.0%) |
| Total | 212 (100.0%) | 151 (100.0%) |
Physical Housing Characteristics in Chalfant borough
Housing Structures in Chalfant borough
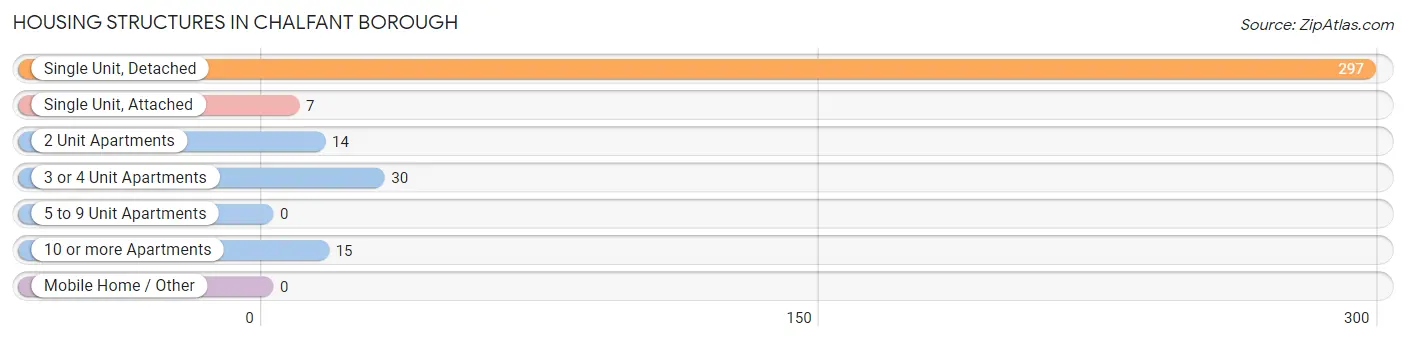
| Structure Type | # Housing Units | % Housing Units |
| Single Unit, Detached | 297 | 81.8% |
| Single Unit, Attached | 7 | 1.9% |
| 2 Unit Apartments | 14 | 3.9% |
| 3 or 4 Unit Apartments | 30 | 8.3% |
| 5 to 9 Unit Apartments | 0 | 0.0% |
| 10 or more Apartments | 15 | 4.1% |
| Mobile Home / Other | 0 | 0.0% |
| Total | 363 | 100.0% |
Housing Structures by Occupancy in Chalfant borough
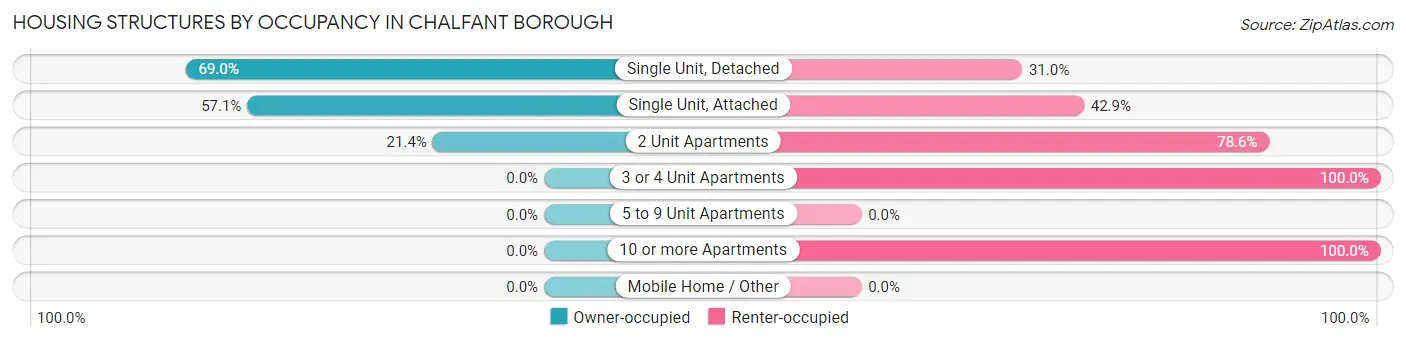
| Structure Type | Owner-occupied | Renter-occupied |
| Single Unit, Detached | 205 (69.0%) | 92 (31.0%) |
| Single Unit, Attached | 4 (57.1%) | 3 (42.9%) |
| 2 Unit Apartments | 3 (21.4%) | 11 (78.6%) |
| 3 or 4 Unit Apartments | 0 (0.0%) | 30 (100.0%) |
| 5 to 9 Unit Apartments | 0 (0.0%) | 0 (0.0%) |
| 10 or more Apartments | 0 (0.0%) | 15 (100.0%) |
| Mobile Home / Other | 0 (0.0%) | 0 (0.0%) |
| Total | 212 (58.4%) | 151 (41.6%) |
Housing Structures by Number of Rooms in Chalfant borough
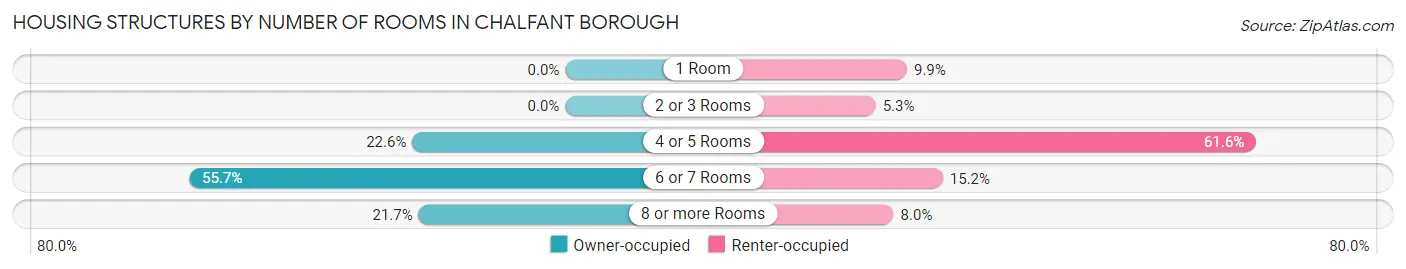
| Number of Rooms | Owner-occupied | Renter-occupied |
| 1 Room | 0 (0.0%) | 15 (9.9%) |
| 2 or 3 Rooms | 0 (0.0%) | 8 (5.3%) |
| 4 or 5 Rooms | 48 (22.6%) | 93 (61.6%) |
| 6 or 7 Rooms | 118 (55.7%) | 23 (15.2%) |
| 8 or more Rooms | 46 (21.7%) | 12 (8.0%) |
| Total | 212 (100.0%) | 151 (100.0%) |
Housing Structure by Heating Type in Chalfant borough
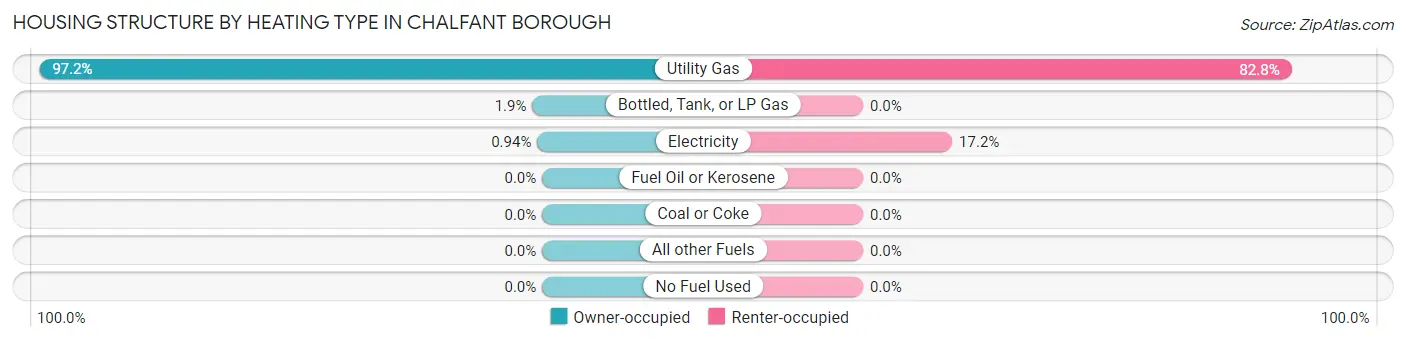
| Heating Type | Owner-occupied | Renter-occupied |
| Utility Gas | 206 (97.2%) | 125 (82.8%) |
| Bottled, Tank, or LP Gas | 4 (1.9%) | 0 (0.0%) |
| Electricity | 2 (0.9%) | 26 (17.2%) |
| Fuel Oil or Kerosene | 0 (0.0%) | 0 (0.0%) |
| Coal or Coke | 0 (0.0%) | 0 (0.0%) |
| All other Fuels | 0 (0.0%) | 0 (0.0%) |
| No Fuel Used | 0 (0.0%) | 0 (0.0%) |
| Total | 212 (100.0%) | 151 (100.0%) |
Household Vehicle Usage in Chalfant borough
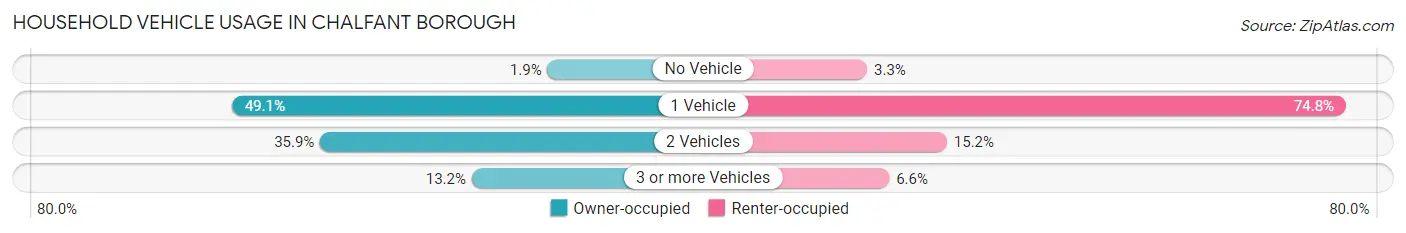
| Vehicles per Household | Owner-occupied | Renter-occupied |
| No Vehicle | 4 (1.9%) | 5 (3.3%) |
| 1 Vehicle | 104 (49.1%) | 113 (74.8%) |
| 2 Vehicles | 76 (35.8%) | 23 (15.2%) |
| 3 or more Vehicles | 28 (13.2%) | 10 (6.6%) |
| Total | 212 (100.0%) | 151 (100.0%) |
Real Estate & Mortgages in Chalfant borough
Real Estate and Mortgage Overview in Chalfant borough
| Characteristic | Without Mortgage | With Mortgage |
| Housing Units | 87 | 125 |
| Median Property Value | $87,200 | $98,000 |
| Median Household Income | $73,882 | $16 |
| Monthly Housing Costs | $619 | $0 |
| Real Estate Taxes | $3,108 | $6 |
Property Value by Mortgage Status in Chalfant borough
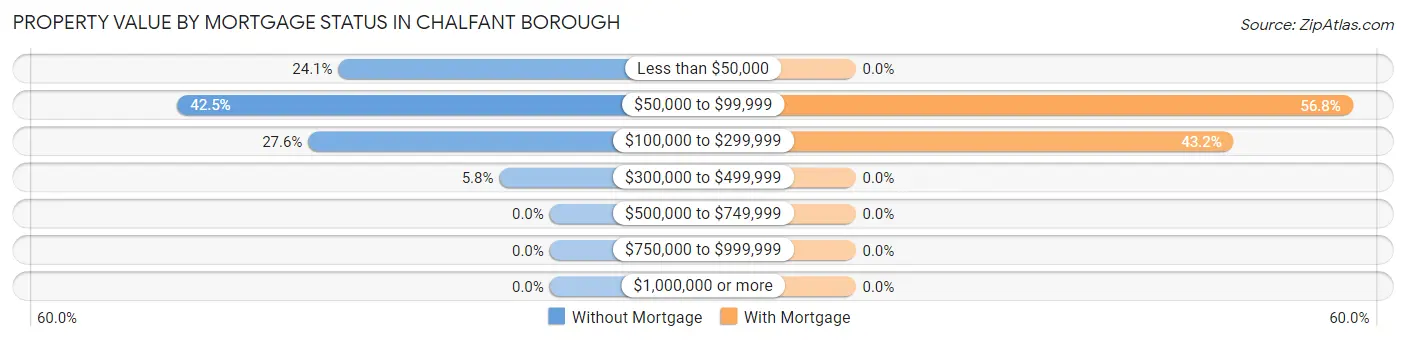
| Property Value | Without Mortgage | With Mortgage |
| Less than $50,000 | 21 (24.1%) | 0 (0.0%) |
| $50,000 to $99,999 | 37 (42.5%) | 71 (56.8%) |
| $100,000 to $299,999 | 24 (27.6%) | 54 (43.2%) |
| $300,000 to $499,999 | 5 (5.8%) | 0 (0.0%) |
| $500,000 to $749,999 | 0 (0.0%) | 0 (0.0%) |
| $750,000 to $999,999 | 0 (0.0%) | 0 (0.0%) |
| $1,000,000 or more | 0 (0.0%) | 0 (0.0%) |
| Total | 87 (100.0%) | 125 (100.0%) |
Household Income by Mortgage Status in Chalfant borough
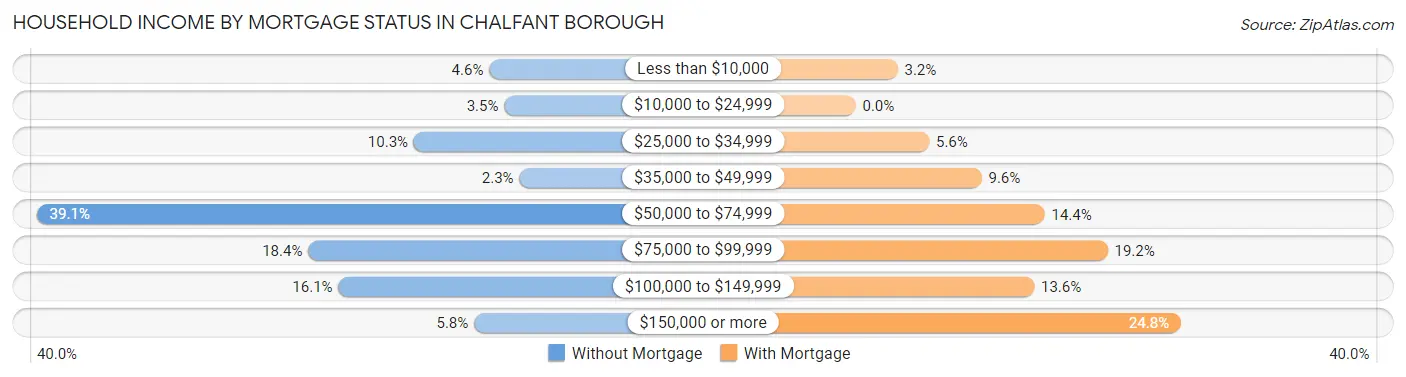
| Household Income | Without Mortgage | With Mortgage |
| Less than $10,000 | 4 (4.6%) | 4 (3.2%) |
| $10,000 to $24,999 | 3 (3.5%) | 0 (0.0%) |
| $25,000 to $34,999 | 9 (10.3%) | 7 (5.6%) |
| $35,000 to $49,999 | 2 (2.3%) | 12 (9.6%) |
| $50,000 to $74,999 | 34 (39.1%) | 18 (14.4%) |
| $75,000 to $99,999 | 16 (18.4%) | 24 (19.2%) |
| $100,000 to $149,999 | 14 (16.1%) | 17 (13.6%) |
| $150,000 or more | 5 (5.8%) | 31 (24.8%) |
| Total | 87 (100.0%) | 125 (100.0%) |
Property Value to Household Income Ratio in Chalfant borough
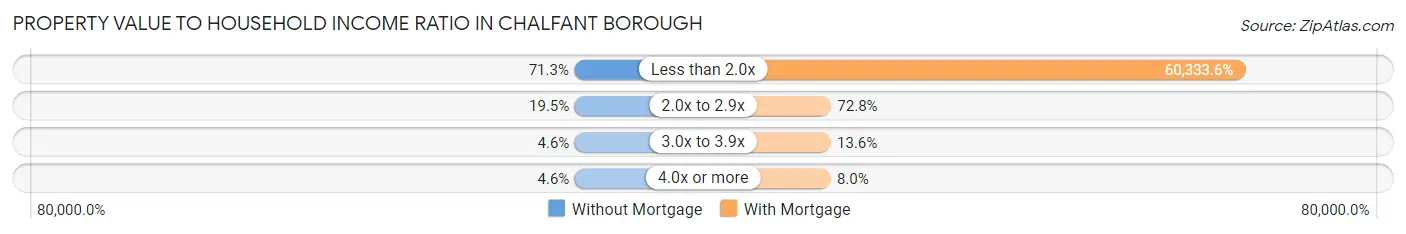
| Value-to-Income Ratio | Without Mortgage | With Mortgage |
| Less than 2.0x | 62 (71.3%) | 75,417 (60,333.6%) |
| 2.0x to 2.9x | 17 (19.5%) | 91 (72.8%) |
| 3.0x to 3.9x | 4 (4.6%) | 17 (13.6%) |
| 4.0x or more | 4 (4.6%) | 10 (8.0%) |
| Total | 87 (100.0%) | 125 (100.0%) |
Real Estate Taxes by Mortgage Status in Chalfant borough
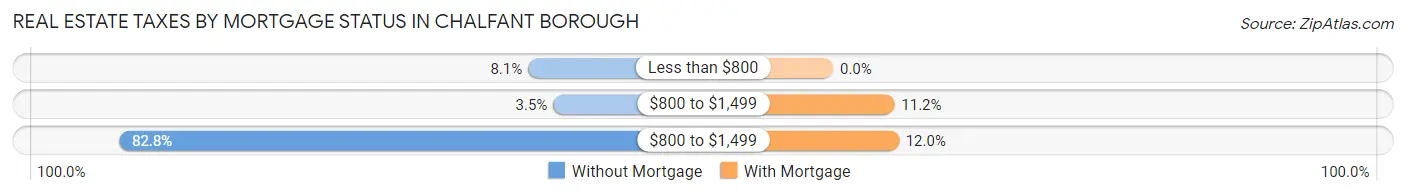
| Property Taxes | Without Mortgage | With Mortgage |
| Less than $800 | 7 (8.1%) | 0 (0.0%) |
| $800 to $1,499 | 3 (3.5%) | 14 (11.2%) |
| $800 to $1,499 | 72 (82.8%) | 15 (12.0%) |
| Total | 87 (100.0%) | 125 (100.0%) |
Health & Disability in Chalfant borough
Health Insurance Coverage by Age in Chalfant borough
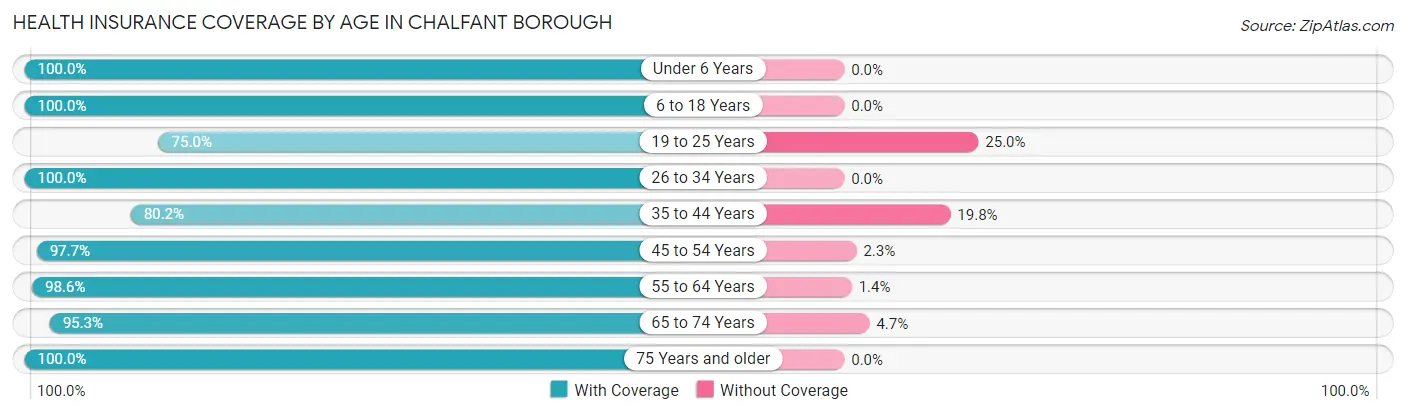
| Age Bracket | With Coverage | Without Coverage |
| Under 6 Years | 22 (100.0%) | 0 (0.0%) |
| 6 to 18 Years | 66 (100.0%) | 0 (0.0%) |
| 19 to 25 Years | 27 (75.0%) | 9 (25.0%) |
| 26 to 34 Years | 75 (100.0%) | 0 (0.0%) |
| 35 to 44 Years | 77 (80.2%) | 19 (19.8%) |
| 45 to 54 Years | 86 (97.7%) | 2 (2.3%) |
| 55 to 64 Years | 142 (98.6%) | 2 (1.4%) |
| 65 to 74 Years | 61 (95.3%) | 3 (4.7%) |
| 75 Years and older | 58 (100.0%) | 0 (0.0%) |
| Total | 614 (94.6%) | 35 (5.4%) |
Health Insurance Coverage by Citizenship Status in Chalfant borough
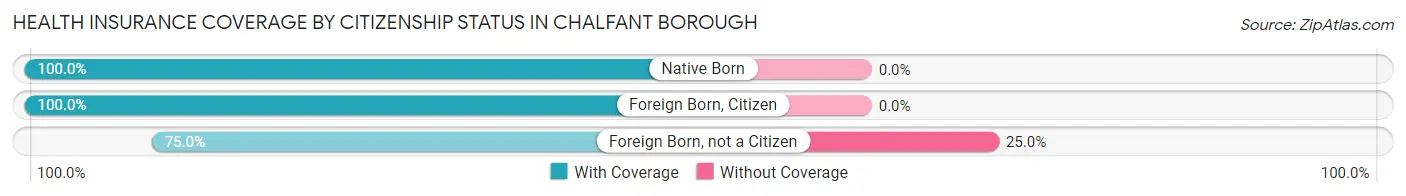
| Citizenship Status | With Coverage | Without Coverage |
| Native Born | 22 (100.0%) | 0 (0.0%) |
| Foreign Born, Citizen | 66 (100.0%) | 0 (0.0%) |
| Foreign Born, not a Citizen | 27 (75.0%) | 9 (25.0%) |
Health Insurance Coverage by Household Income in Chalfant borough
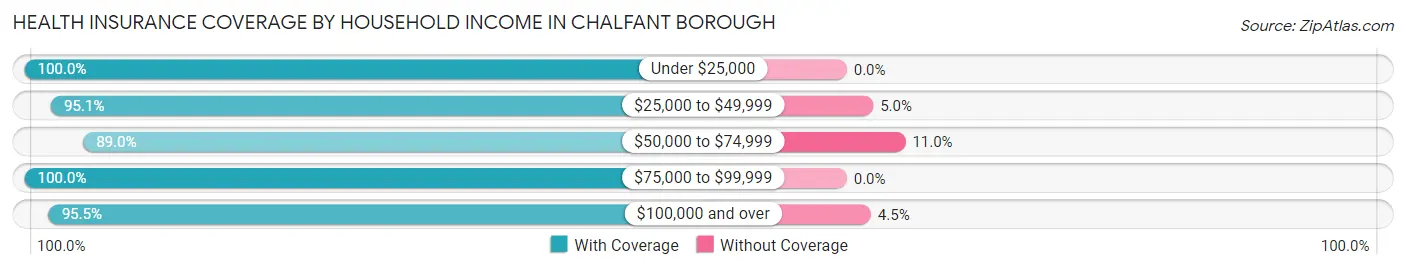
| Household Income | With Coverage | Without Coverage |
| Under $25,000 | 69 (100.0%) | 0 (0.0%) |
| $25,000 to $49,999 | 96 (95.1%) | 5 (5.0%) |
| $50,000 to $74,999 | 170 (89.0%) | 21 (11.0%) |
| $75,000 to $99,999 | 89 (100.0%) | 0 (0.0%) |
| $100,000 and over | 190 (95.5%) | 9 (4.5%) |
Public vs Private Health Insurance Coverage by Age in Chalfant borough
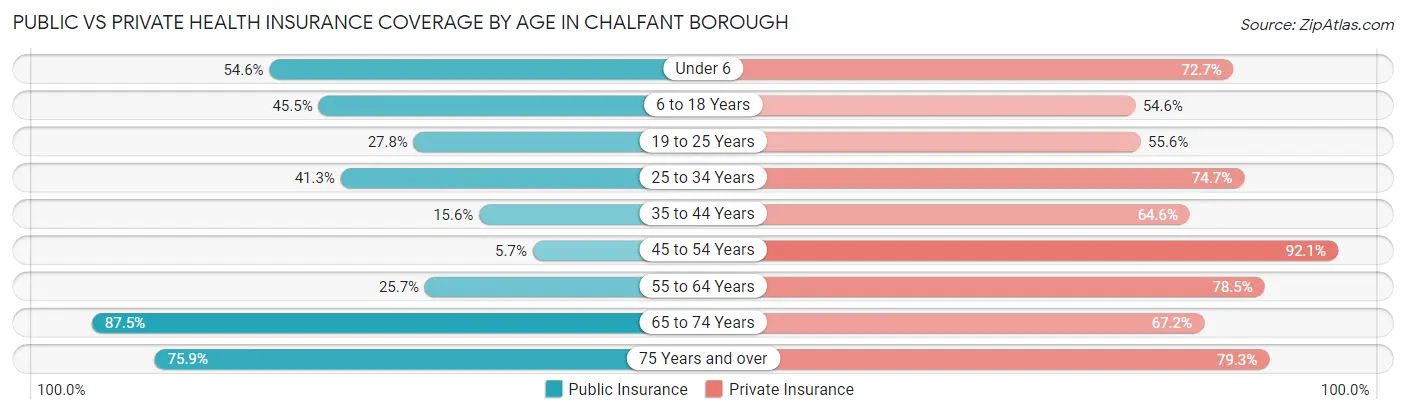
| Age Bracket | Public Insurance | Private Insurance |
| Under 6 | 12 (54.5%) | 16 (72.7%) |
| 6 to 18 Years | 30 (45.5%) | 36 (54.5%) |
| 19 to 25 Years | 10 (27.8%) | 20 (55.6%) |
| 25 to 34 Years | 31 (41.3%) | 56 (74.7%) |
| 35 to 44 Years | 15 (15.6%) | 62 (64.6%) |
| 45 to 54 Years | 5 (5.7%) | 81 (92.0%) |
| 55 to 64 Years | 37 (25.7%) | 113 (78.5%) |
| 65 to 74 Years | 56 (87.5%) | 43 (67.2%) |
| 75 Years and over | 44 (75.9%) | 46 (79.3%) |
| Total | 240 (37.0%) | 473 (72.9%) |
Disability Status by Sex by Age in Chalfant borough
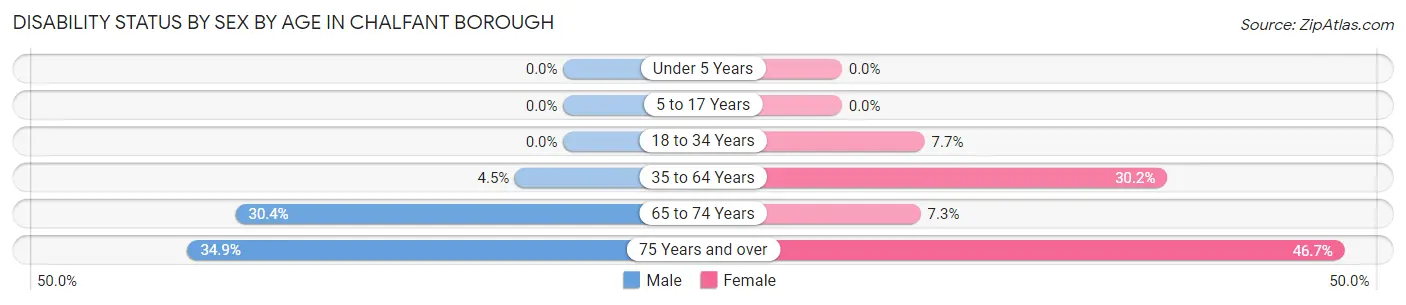
| Age Bracket | Male | Female |
| Under 5 Years | 0 (0.0%) | 0 (0.0%) |
| 5 to 17 Years | 0 (0.0%) | 0 (0.0%) |
| 18 to 34 Years | 0 (0.0%) | 4 (7.7%) |
| 35 to 64 Years | 8 (4.5%) | 45 (30.2%) |
| 65 to 74 Years | 7 (30.4%) | 3 (7.3%) |
| 75 Years and over | 15 (34.9%) | 7 (46.7%) |
Disability Class by Sex by Age in Chalfant borough
Disability Class: Hearing Difficulty
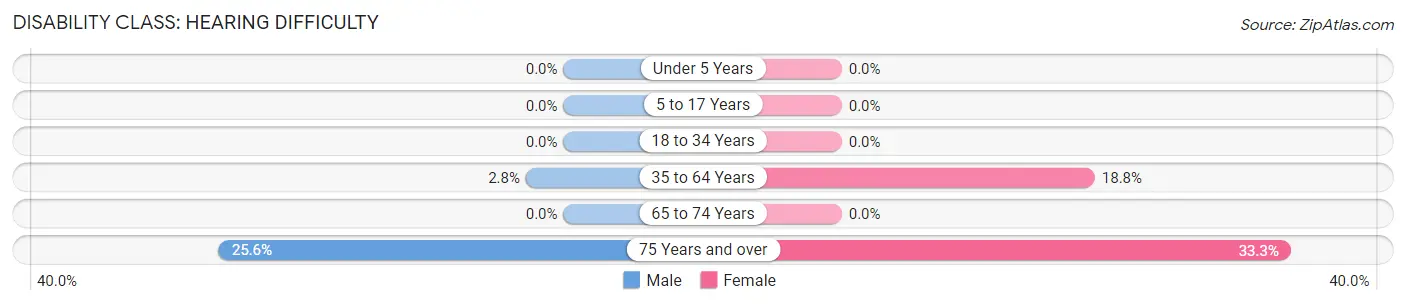
| Age Bracket | Male | Female |
| Under 5 Years | 0 (0.0%) | 0 (0.0%) |
| 5 to 17 Years | 0 (0.0%) | 0 (0.0%) |
| 18 to 34 Years | 0 (0.0%) | 0 (0.0%) |
| 35 to 64 Years | 5 (2.8%) | 28 (18.8%) |
| 65 to 74 Years | 0 (0.0%) | 0 (0.0%) |
| 75 Years and over | 11 (25.6%) | 5 (33.3%) |
Disability Class: Vision Difficulty
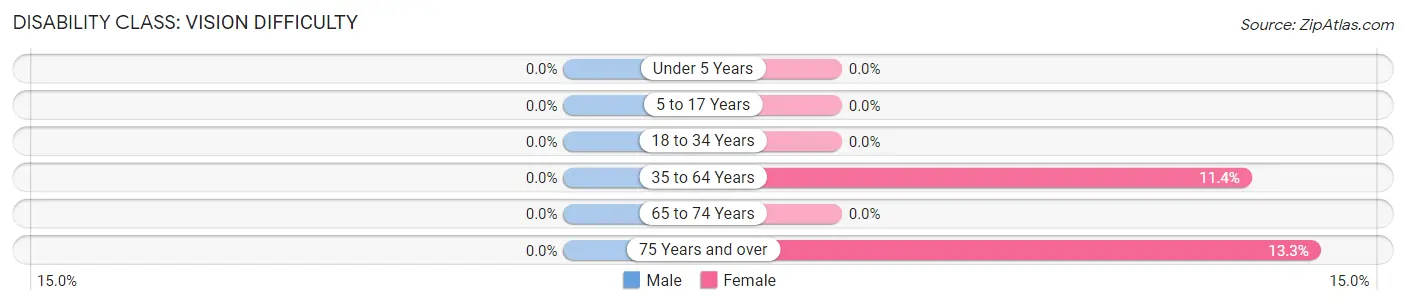
| Age Bracket | Male | Female |
| Under 5 Years | 0 (0.0%) | 0 (0.0%) |
| 5 to 17 Years | 0 (0.0%) | 0 (0.0%) |
| 18 to 34 Years | 0 (0.0%) | 0 (0.0%) |
| 35 to 64 Years | 0 (0.0%) | 17 (11.4%) |
| 65 to 74 Years | 0 (0.0%) | 0 (0.0%) |
| 75 Years and over | 0 (0.0%) | 2 (13.3%) |
Disability Class: Cognitive Difficulty
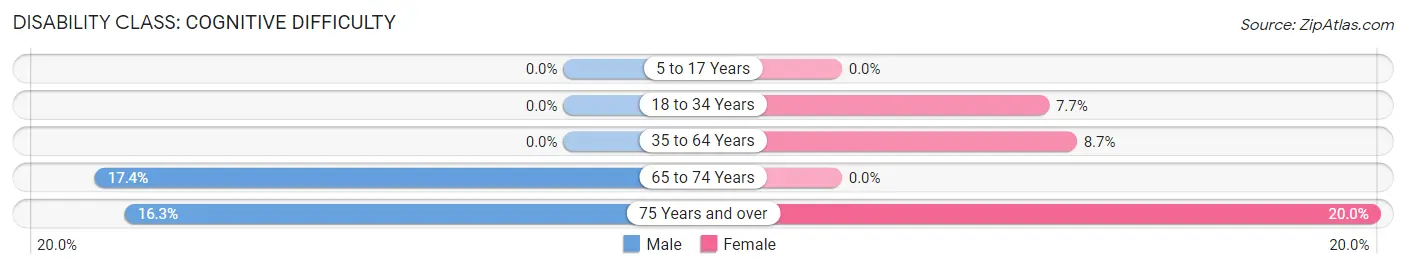
| Age Bracket | Male | Female |
| 5 to 17 Years | 0 (0.0%) | 0 (0.0%) |
| 18 to 34 Years | 0 (0.0%) | 4 (7.7%) |
| 35 to 64 Years | 0 (0.0%) | 13 (8.7%) |
| 65 to 74 Years | 4 (17.4%) | 0 (0.0%) |
| 75 Years and over | 7 (16.3%) | 3 (20.0%) |
Disability Class: Ambulatory Difficulty
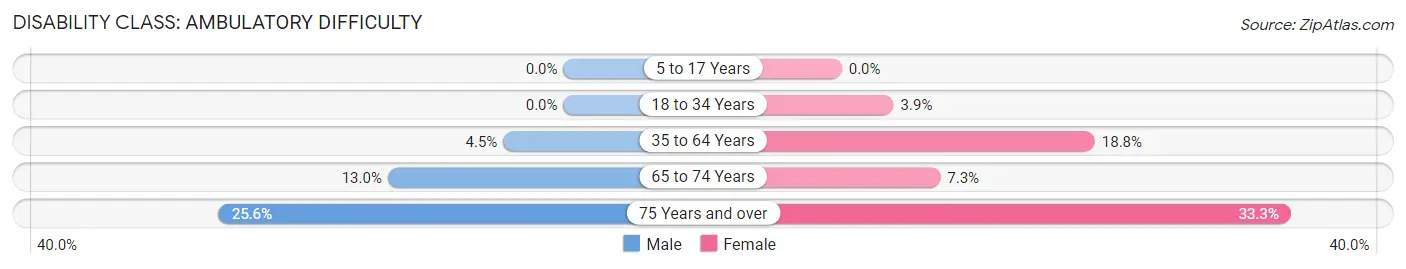
| Age Bracket | Male | Female |
| 5 to 17 Years | 0 (0.0%) | 0 (0.0%) |
| 18 to 34 Years | 0 (0.0%) | 2 (3.8%) |
| 35 to 64 Years | 8 (4.5%) | 28 (18.8%) |
| 65 to 74 Years | 3 (13.0%) | 3 (7.3%) |
| 75 Years and over | 11 (25.6%) | 5 (33.3%) |
Disability Class: Self-Care Difficulty
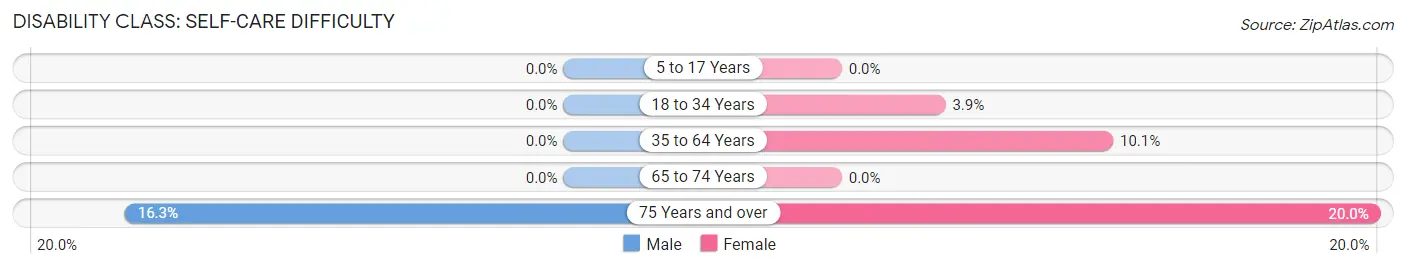
| Age Bracket | Male | Female |
| 5 to 17 Years | 0 (0.0%) | 0 (0.0%) |
| 18 to 34 Years | 0 (0.0%) | 2 (3.8%) |
| 35 to 64 Years | 0 (0.0%) | 15 (10.1%) |
| 65 to 74 Years | 0 (0.0%) | 0 (0.0%) |
| 75 Years and over | 7 (16.3%) | 3 (20.0%) |
Technology Access in Chalfant borough
Computing Device Access in Chalfant borough
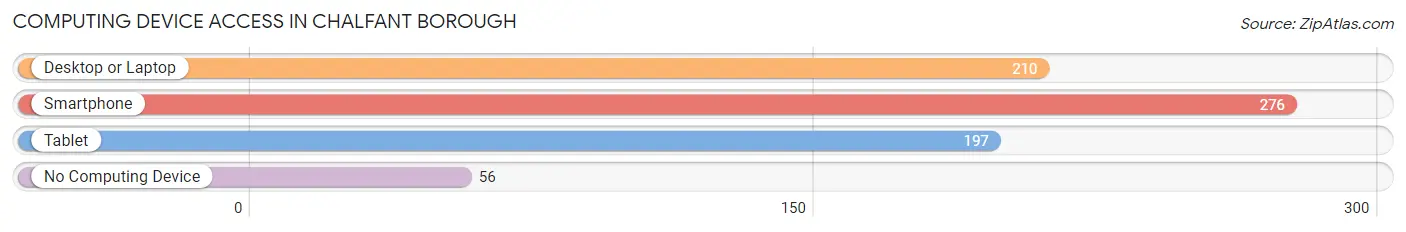
| Device Type | # Households | % Households |
| Desktop or Laptop | 210 | 57.9% |
| Smartphone | 276 | 76.0% |
| Tablet | 197 | 54.3% |
| No Computing Device | 56 | 15.4% |
| Total | 363 | 100.0% |
Internet Access in Chalfant borough
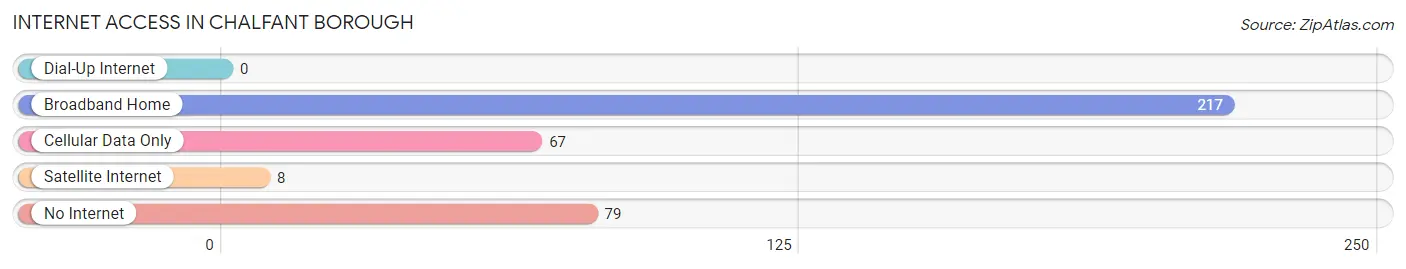
| Internet Type | # Households | % Households |
| Dial-Up Internet | 0 | 0.0% |
| Broadband Home | 217 | 59.8% |
| Cellular Data Only | 67 | 18.5% |
| Satellite Internet | 8 | 2.2% |
| No Internet | 79 | 21.8% |
| Total | 363 | 100.0% |
Chalfant borough Summary
Chalfant Borough is a small borough located in Allegheny County, Pennsylvania. It is situated in the eastern part of the county, just south of the city of Pittsburgh. The borough was incorporated in 1891 and has a population of approximately 1,400 people.
Geography
Chalfant Borough is located in the eastern part of Allegheny County, Pennsylvania. It is situated just south of the city of Pittsburgh and is bordered by the boroughs of Wilkinsburg, Braddock, and Rankin. The borough is situated on a hillside and is surrounded by a number of small creeks and streams. The borough is approximately 1.5 square miles in size and is located at an elevation of approximately 1,000 feet.
Climate
Chalfant Borough has a humid continental climate, with hot summers and cold winters. The average annual temperature is around 50 degrees Fahrenheit, with temperatures ranging from the low 30s in the winter to the mid-80s in the summer. The average annual precipitation is around 40 inches, with most of the precipitation occurring in the spring and summer months.
Demographics
As of the 2010 census, the population of Chalfant Borough was 1,400 people. The racial makeup of the borough was 94.3% White, 2.9% African American, 0.3% Native American, 0.7% Asian, and 1.7% from other races. The median household income was $37,917, and the median family income was $45,625. The per capita income was $19,945.
Economy
Chalfant Borough has a small, but diverse economy. The borough is home to a number of small businesses, including restaurants, retail stores, and professional services. The borough is also home to a number of manufacturing and industrial businesses, including a steel mill and a paper mill. The borough is also home to a number of educational institutions, including a community college and a technical school.
History
Chalfant Borough was first settled in the late 1700s by a group of German immigrants. The borough was officially incorporated in 1891 and was named after the Chalfant family, who were among the first settlers in the area. The borough was primarily an agricultural community until the late 19th century, when the steel and paper industries began to move into the area. The borough experienced a period of growth and prosperity in the early 20th century, but the population began to decline in the 1950s and 1960s as the steel and paper industries began to decline. The borough has since experienced a resurgence in population and economic activity, and is now home to a number of small businesses and educational institutions.
Common Questions
What is Per Capita Income in Chalfant borough?
Per Capita income in Chalfant borough is $38,487.
What is the Median Family Income in Chalfant borough?
Median Family Income in Chalfant borough is $78,438.
What is the Median Household income in Chalfant borough?
Median Household Income in Chalfant borough is $57,135.
What is Income or Wage Gap in Chalfant borough?
Income or Wage Gap in Chalfant borough is 42.4%.
Women in Chalfant borough earn 57.6 cents for every dollar earned by a man.
What is Inequality or Gini Index in Chalfant borough?
Inequality or Gini Index in Chalfant borough is 0.36.
What is the Total Population of Chalfant borough?
Total Population of Chalfant borough is 649.
What is the Total Male Population of Chalfant borough?
Total Male Population of Chalfant borough is 361.
What is the Total Female Population of Chalfant borough?
Total Female Population of Chalfant borough is 288.
What is the Ratio of Males per 100 Females in Chalfant borough?
There are 125.35 Males per 100 Females in Chalfant borough.
What is the Ratio of Females per 100 Males in Chalfant borough?
There are 79.78 Females per 100 Males in Chalfant borough.
What is the Median Population Age in Chalfant borough?
Median Population Age in Chalfant borough is 49.7 Years.
What is the Average Family Size in Chalfant borough
Average Family Size in Chalfant borough is 2.6 People.
What is the Average Household Size in Chalfant borough
Average Household Size in Chalfant borough is 1.8 People.
How Large is the Labor Force in Chalfant borough?
There are 408 People in the Labor Forcein in Chalfant borough.
What is the Percentage of People in the Labor Force in Chalfant borough?
70.7% of People are in the Labor Force in Chalfant borough.
What is the Unemployment Rate in Chalfant borough?
Unemployment Rate in Chalfant borough is 0.7%.