Langhorne Manor borough, PA Map & Demographics
Langhorne Manor borough Overview
$29,594
PER CAPITA INCOME
$154,750
AVG FAMILY INCOME
$124,375
AVG HOUSEHOLD INCOME
58.1%
WAGE / INCOME GAP [ % ]
41.9¢/ $1
WAGE / INCOME GAP [ $ ]
0.38
INEQUALITY / GINI INDEX
1,563
TOTAL POPULATION
790
MALE POPULATION
773
FEMALE POPULATION
102.20
MALES / 100 FEMALES
97.85
FEMALES / 100 MALES
28.4
MEDIAN AGE
3.2
AVG FAMILY SIZE
2.6
AVG HOUSEHOLD SIZE
664
LABOR FORCE [ PEOPLE ]
46.8%
PERCENT IN LABOR FORCE
9.0%
UNEMPLOYMENT RATE
Income in Langhorne Manor borough
Income Overview in Langhorne Manor borough
Per Capita Income in Langhorne Manor borough is $29,594, while median incomes of families and households are $154,750 and $124,375 respectively.
| Characteristic | Number | Measure |
| Per Capita Income | 1,563 | $29,594 |
| Median Family Income | 188 | $154,750 |
| Mean Family Income | 188 | $179,880 |
| Median Household Income | 289 | $124,375 |
| Mean Household Income | 289 | $141,917 |
| Income Deficit | 188 | $0 |
| Wage / Income Gap (%) | 1,563 | 58.05% |
| Wage / Income Gap ($) | 1,563 | 41.95¢ per $1 |
| Gini / Inequality Index | 1,563 | 0.38 |
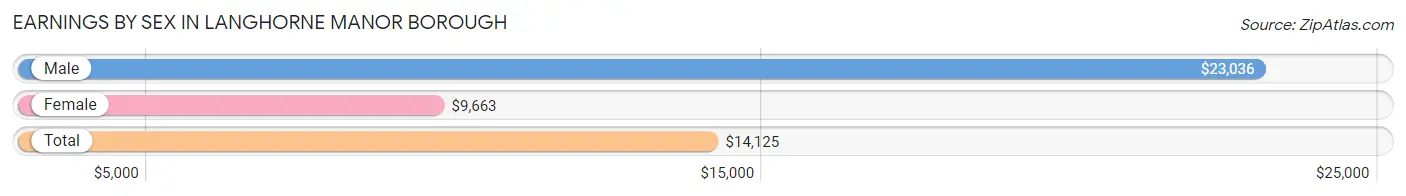
Earnings by Sex in Langhorne Manor borough
Average Earnings in Langhorne Manor borough are $14,125, $23,036 for men and $9,663 for women, a difference of 58.1%.
| Sex | Number | Average Earnings |
| Male | 461 (55.9%) | $23,036 |
| Female | 363 (44.1%) | $9,663 |
| Total | 824 (100.0%) | $14,125 |
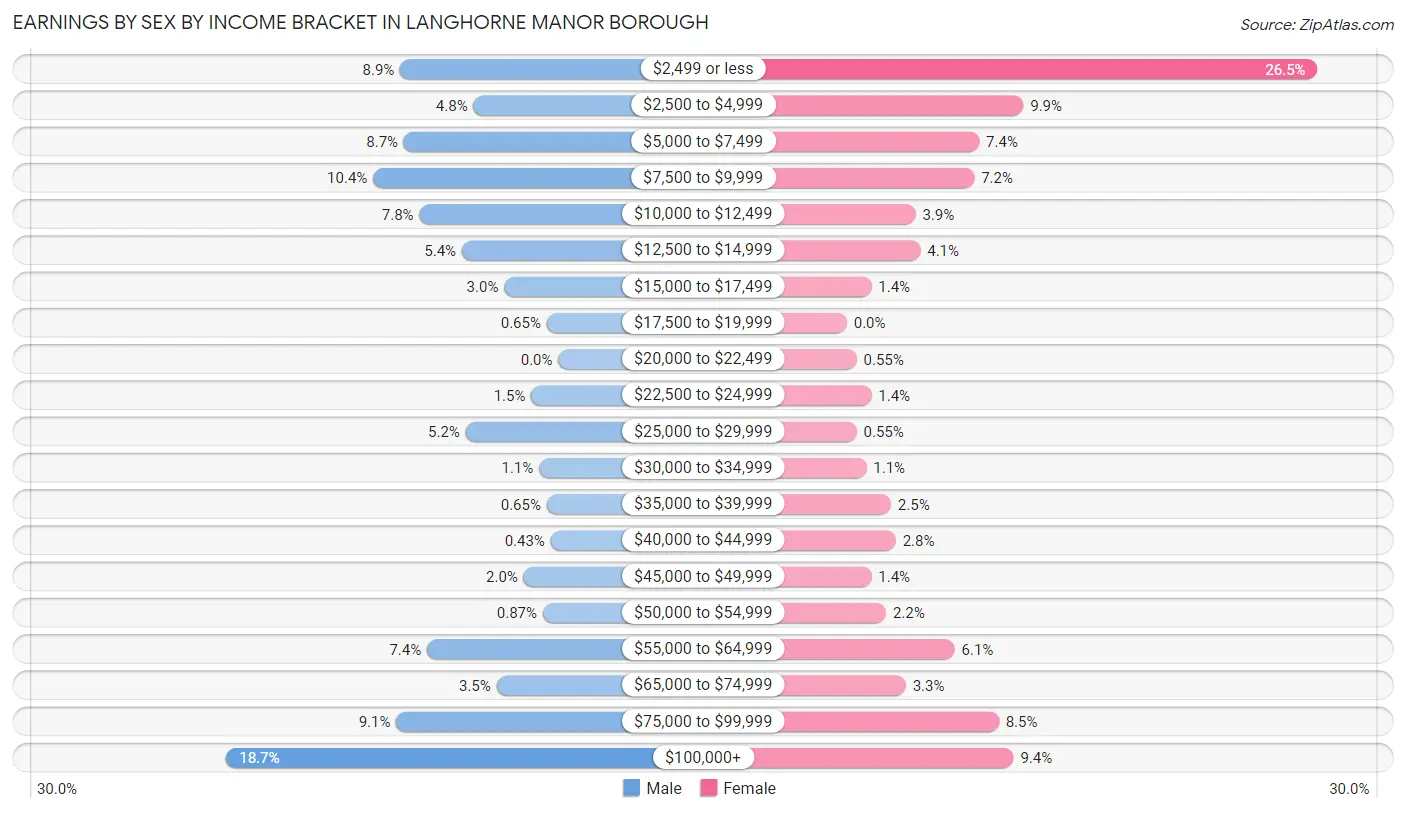
Earnings by Sex by Income Bracket in Langhorne Manor borough
The most common earnings brackets in Langhorne Manor borough are $100,000+ for men (86 | 18.7%) and $2,499 or less for women (96 | 26.5%).
| Income | Male | Female |
| $2,499 or less | 41 (8.9%) | 96 (26.5%) |
| $2,500 to $4,999 | 22 (4.8%) | 36 (9.9%) |
| $5,000 to $7,499 | 40 (8.7%) | 27 (7.4%) |
| $7,500 to $9,999 | 48 (10.4%) | 26 (7.2%) |
| $10,000 to $12,499 | 36 (7.8%) | 14 (3.9%) |
| $12,500 to $14,999 | 25 (5.4%) | 15 (4.1%) |
| $15,000 to $17,499 | 14 (3.0%) | 5 (1.4%) |
| $17,500 to $19,999 | 3 (0.6%) | 0 (0.0%) |
| $20,000 to $22,499 | 0 (0.0%) | 2 (0.5%) |
| $22,500 to $24,999 | 7 (1.5%) | 5 (1.4%) |
| $25,000 to $29,999 | 24 (5.2%) | 2 (0.5%) |
| $30,000 to $34,999 | 5 (1.1%) | 4 (1.1%) |
| $35,000 to $39,999 | 3 (0.6%) | 9 (2.5%) |
| $40,000 to $44,999 | 2 (0.4%) | 10 (2.8%) |
| $45,000 to $49,999 | 9 (1.9%) | 5 (1.4%) |
| $50,000 to $54,999 | 4 (0.9%) | 8 (2.2%) |
| $55,000 to $64,999 | 34 (7.4%) | 22 (6.1%) |
| $65,000 to $74,999 | 16 (3.5%) | 12 (3.3%) |
| $75,000 to $99,999 | 42 (9.1%) | 31 (8.5%) |
| $100,000+ | 86 (18.7%) | 34 (9.4%) |
| Total | 461 (100.0%) | 363 (100.0%) |
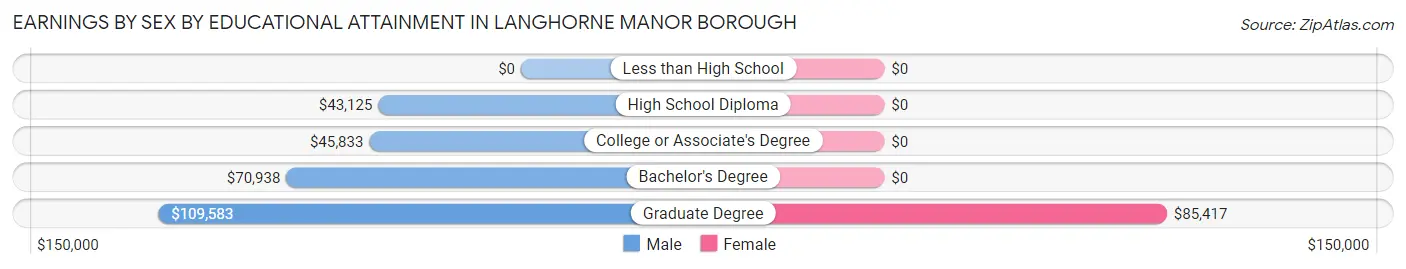
Earnings by Sex by Educational Attainment in Langhorne Manor borough
Average earnings in Langhorne Manor borough are $72,396 for men and $47,000 for women, a difference of 35.1%. Men with an educational attainment of graduate degree enjoy the highest average annual earnings of $109,583, while those with high school diploma education earn the least with $43,125. Women with an educational attainment of graduate degree earn the most with the average annual earnings of $85,417, while those with graduate degree education have the smallest earnings of $85,417.
| Educational Attainment | Male Income | Female Income |
| Less than High School | - | - |
| High School Diploma | $43,125 | $0 |
| College or Associate's Degree | $45,833 | $0 |
| Bachelor's Degree | $70,938 | $0 |
| Graduate Degree | $109,583 | $85,417 |
| Total | $72,396 | $47,000 |
Family Income in Langhorne Manor borough
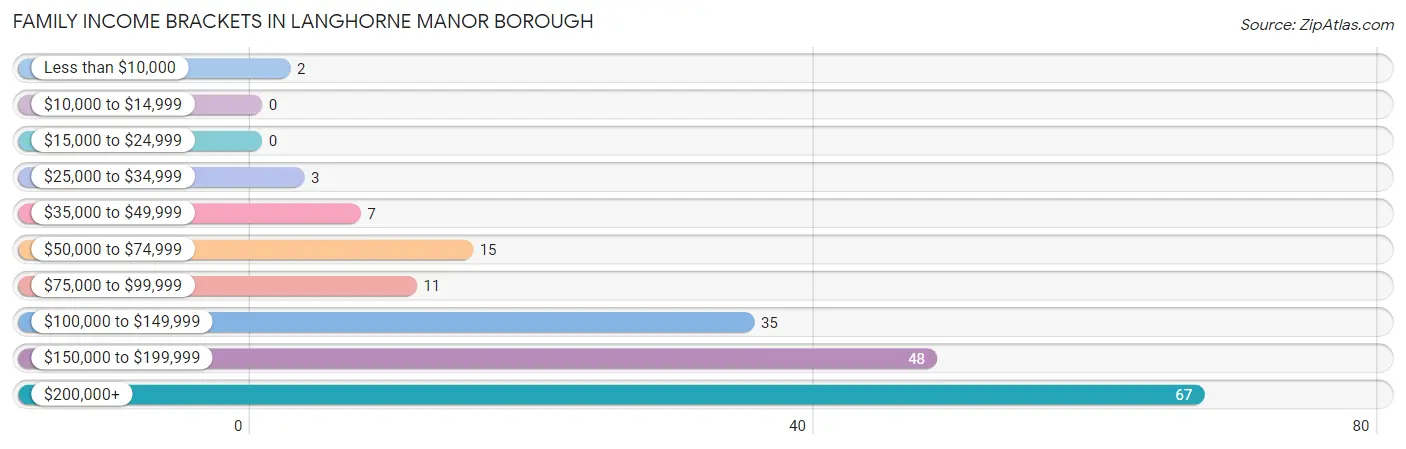
Family Income Brackets in Langhorne Manor borough
According to the Langhorne Manor borough family income data, there are 67 families falling into the $200,000+ income range, which is the most common income bracket and makes up 35.6% of all families.
| Income Bracket | # Families | % Families |
| Less than $10,000 | 2 | 1.1% |
| $10,000 to $14,999 | 0 | 0.0% |
| $15,000 to $24,999 | 0 | 0.0% |
| $25,000 to $34,999 | 3 | 1.6% |
| $35,000 to $49,999 | 7 | 3.7% |
| $50,000 to $74,999 | 15 | 8.0% |
| $75,000 to $99,999 | 11 | 5.9% |
| $100,000 to $149,999 | 35 | 18.6% |
| $150,000 to $199,999 | 48 | 25.5% |
| $200,000+ | 67 | 35.6% |
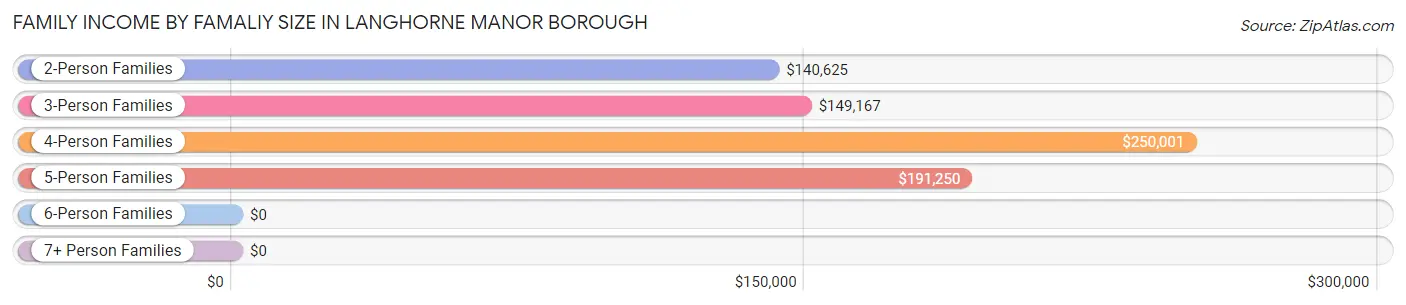
Family Income by Famaliy Size in Langhorne Manor borough
4-person families (36 | 19.2%) account for the highest median family income in Langhorne Manor borough with $250,001 per family, while 2-person families (83 | 44.2%) have the highest median income of $70,312 per family member.
| Income Bracket | # Families | Median Income |
| 2-Person Families | 83 (44.2%) | $140,625 |
| 3-Person Families | 34 (18.1%) | $149,167 |
| 4-Person Families | 36 (19.2%) | $250,001 |
| 5-Person Families | 16 (8.5%) | $191,250 |
| 6-Person Families | 7 (3.7%) | $0 |
| 7+ Person Families | 12 (6.4%) | $0 |
| Total | 188 (100.0%) | $154,750 |
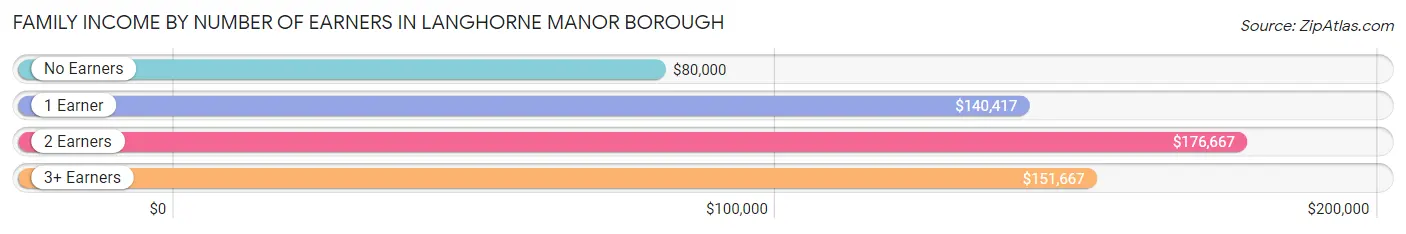
Family Income by Number of Earners in Langhorne Manor borough
The median family income in Langhorne Manor borough is $154,750, with families comprising 2 earners (96) having the highest median family income of $176,667, while families with no earners (16) have the lowest median family income of $80,000, accounting for 51.1% and 8.5% of families, respectively.
| Number of Earners | # Families | Median Income |
| No Earners | 16 (8.5%) | $80,000 |
| 1 Earner | 40 (21.3%) | $140,417 |
| 2 Earners | 96 (51.1%) | $176,667 |
| 3+ Earners | 36 (19.2%) | $151,667 |
| Total | 188 (100.0%) | $154,750 |
Household Income in Langhorne Manor borough
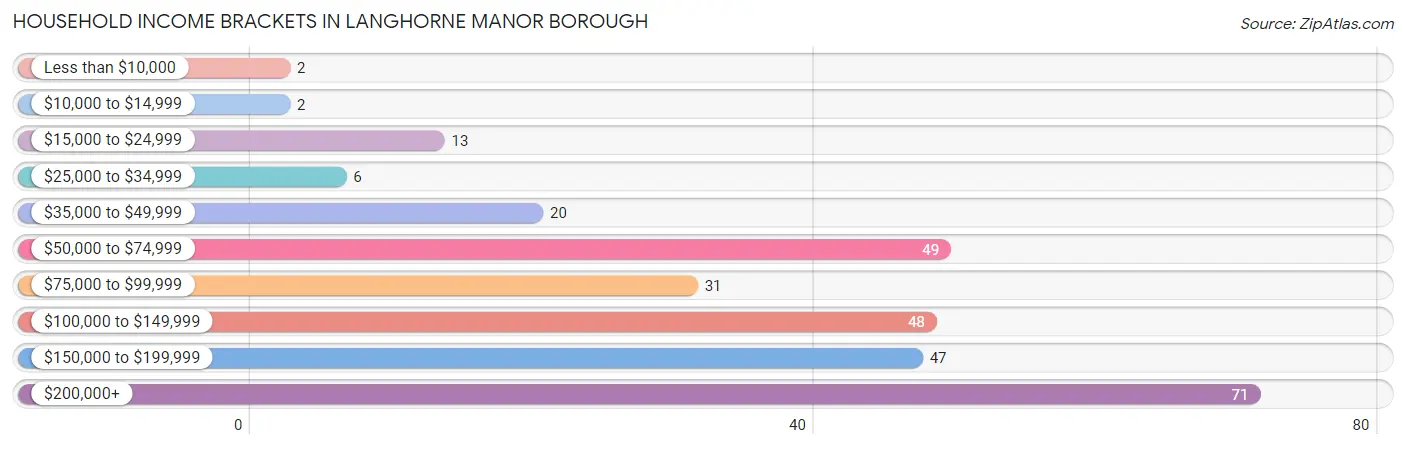
Household Income Brackets in Langhorne Manor borough
With 71 households falling in the category, the $200,000+ income range is the most frequent in Langhorne Manor borough, accounting for 24.6% of all households. In contrast, only 2 households (0.7%) fall into the less than $10,000 income bracket, making it the least populous group.
| Income Bracket | # Households | % Households |
| Less than $10,000 | 2 | 0.7% |
| $10,000 to $14,999 | 2 | 0.7% |
| $15,000 to $24,999 | 13 | 4.5% |
| $25,000 to $34,999 | 6 | 2.1% |
| $35,000 to $49,999 | 20 | 6.9% |
| $50,000 to $74,999 | 49 | 17.0% |
| $75,000 to $99,999 | 31 | 10.7% |
| $100,000 to $149,999 | 48 | 16.6% |
| $150,000 to $199,999 | 47 | 16.3% |
| $200,000+ | 71 | 24.6% |
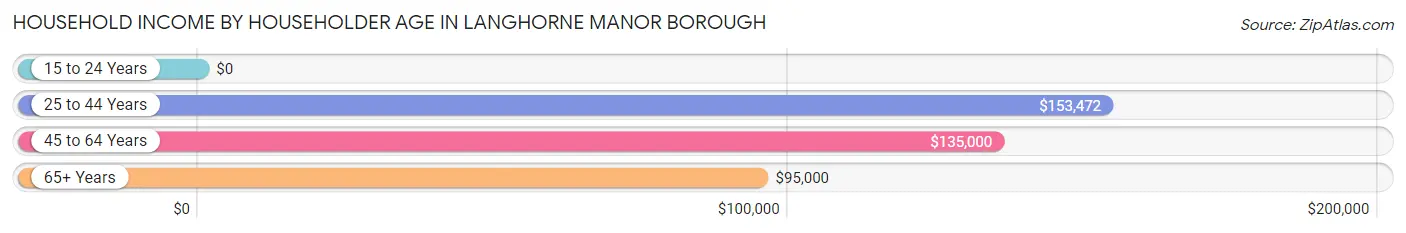
Household Income by Householder Age in Langhorne Manor borough
The median household income in Langhorne Manor borough is $124,375, with the highest median household income of $153,472 found in the 25 to 44 years age bracket for the primary householder. A total of 69 households (23.9%) fall into this category. Meanwhile, the 15 to 24 years age bracket for the primary householder has the lowest median household income of $0, with 8 households (2.8%) in this group.
| Income Bracket | # Households | Median Income |
| 15 to 24 Years | 8 (2.8%) | $0 |
| 25 to 44 Years | 69 (23.9%) | $153,472 |
| 45 to 64 Years | 152 (52.6%) | $135,000 |
| 65+ Years | 60 (20.8%) | $95,000 |
| Total | 289 (100.0%) | $124,375 |
Poverty in Langhorne Manor borough
Income Below Poverty by Sex and Age in Langhorne Manor borough
With 8.9% poverty level for males and 13.2% for females among the residents of Langhorne Manor borough, 25 to 34 year old males and 45 to 54 year old females are the most vulnerable to poverty, with 22 males (41.5%) and 21 females (31.8%) in their respective age groups living below the poverty level.
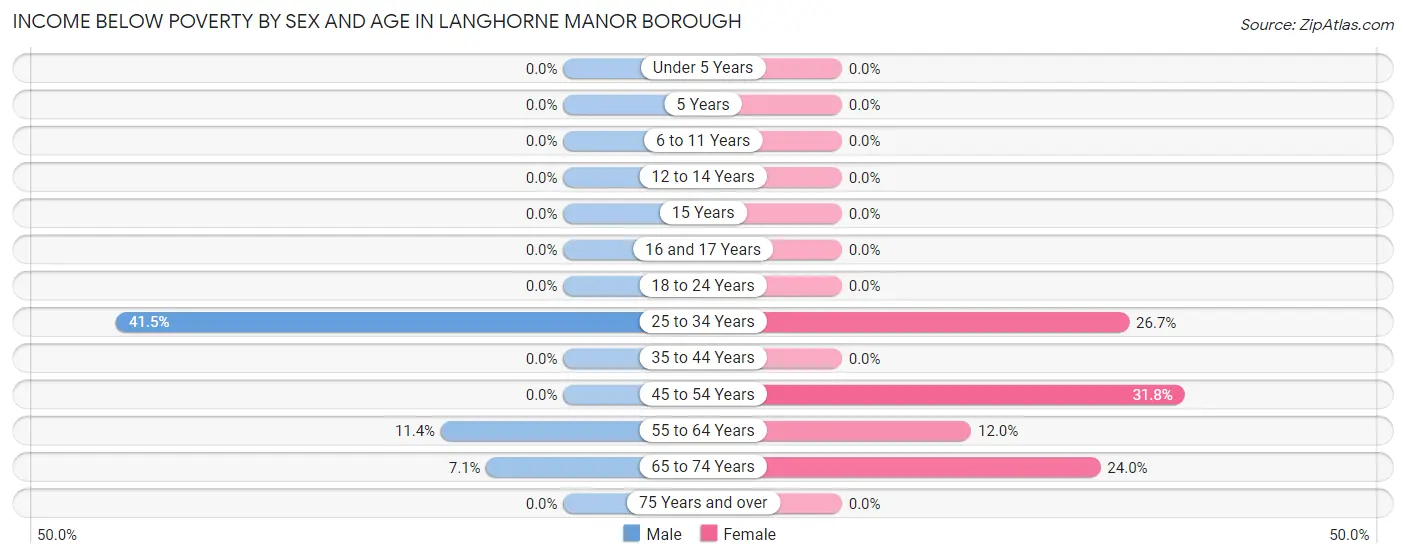
| Age Bracket | Male | Female |
| Under 5 Years | 0 (0.0%) | 0 (0.0%) |
| 5 Years | 0 (0.0%) | 0 (0.0%) |
| 6 to 11 Years | 0 (0.0%) | 0 (0.0%) |
| 12 to 14 Years | 0 (0.0%) | 0 (0.0%) |
| 15 Years | 0 (0.0%) | 0 (0.0%) |
| 16 and 17 Years | 0 (0.0%) | 0 (0.0%) |
| 18 to 24 Years | 0 (0.0%) | 0 (0.0%) |
| 25 to 34 Years | 22 (41.5%) | 16 (26.7%) |
| 35 to 44 Years | 0 (0.0%) | 0 (0.0%) |
| 45 to 54 Years | 0 (0.0%) | 21 (31.8%) |
| 55 to 64 Years | 10 (11.4%) | 9 (12.0%) |
| 65 to 74 Years | 2 (7.1%) | 12 (24.0%) |
| 75 Years and over | 0 (0.0%) | 0 (0.0%) |
| Total | 34 (8.9%) | 58 (13.2%) |
Income Above Poverty by Sex and Age in Langhorne Manor borough
According to the poverty statistics in Langhorne Manor borough, males aged under 5 years and females aged under 5 years are the age groups that are most secure financially, with 100.0% of males and 100.0% of females in these age groups living above the poverty line.
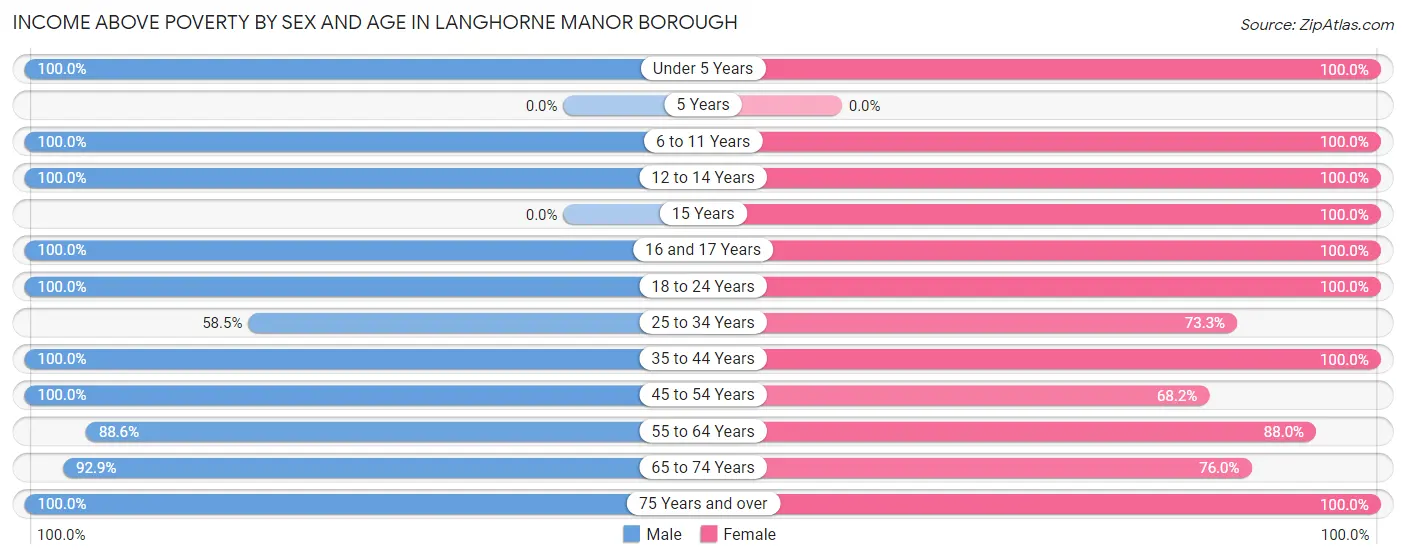
| Age Bracket | Male | Female |
| Under 5 Years | 20 (100.0%) | 16 (100.0%) |
| 5 Years | 0 (0.0%) | 0 (0.0%) |
| 6 to 11 Years | 12 (100.0%) | 44 (100.0%) |
| 12 to 14 Years | 22 (100.0%) | 30 (100.0%) |
| 15 Years | 0 (0.0%) | 1 (100.0%) |
| 16 and 17 Years | 2 (100.0%) | 33 (100.0%) |
| 18 to 24 Years | 14 (100.0%) | 6 (100.0%) |
| 25 to 34 Years | 31 (58.5%) | 44 (73.3%) |
| 35 to 44 Years | 47 (100.0%) | 38 (100.0%) |
| 45 to 54 Years | 79 (100.0%) | 45 (68.2%) |
| 55 to 64 Years | 78 (88.6%) | 66 (88.0%) |
| 65 to 74 Years | 26 (92.9%) | 38 (76.0%) |
| 75 Years and over | 16 (100.0%) | 19 (100.0%) |
| Total | 347 (91.1%) | 380 (86.8%) |
Income Below Poverty Among Married-Couple Families in Langhorne Manor borough
The poverty statistics for married-couple families in Langhorne Manor borough show that 1.2% or 2 of the total 168 families live below the poverty line. Families with no children have the highest poverty rate of 2.1%, comprising of 2 families. On the other hand, families with 1 or 2 children have the lowest poverty rate of 0.0%, which includes 0 families.
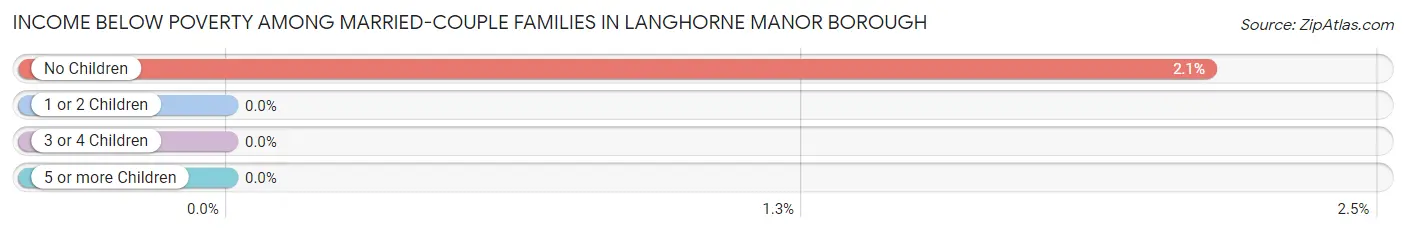
| Children | Above Poverty | Below Poverty |
| No Children | 92 (97.9%) | 2 (2.1%) |
| 1 or 2 Children | 53 (100.0%) | 0 (0.0%) |
| 3 or 4 Children | 9 (100.0%) | 0 (0.0%) |
| 5 or more Children | 12 (100.0%) | 0 (0.0%) |
| Total | 166 (98.8%) | 2 (1.2%) |
Income Below Poverty Among Single-Parent Households in Langhorne Manor borough
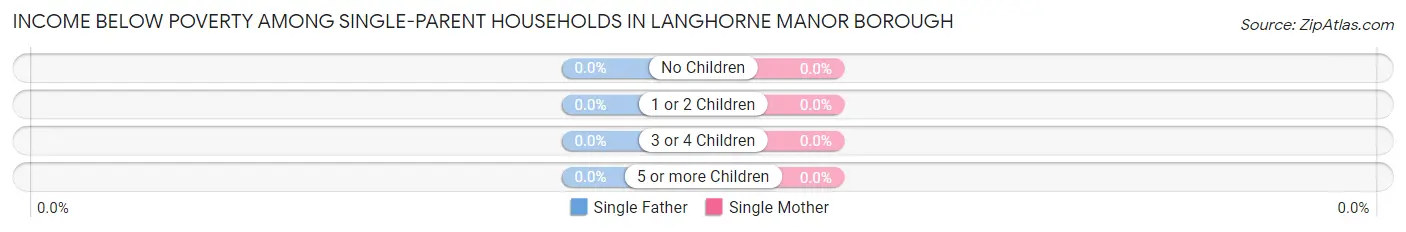
| Children | Single Father | Single Mother |
| No Children | 0 (0.0%) | 0 (0.0%) |
| 1 or 2 Children | 0 (0.0%) | 0 (0.0%) |
| 3 or 4 Children | 0 (0.0%) | 0 (0.0%) |
| 5 or more Children | 0 (0.0%) | 0 (0.0%) |
| Total | 0 (0.0%) | 0 (0.0%) |
Income Below Poverty Among Married-Couple vs Single-Parent Households in Langhorne Manor borough
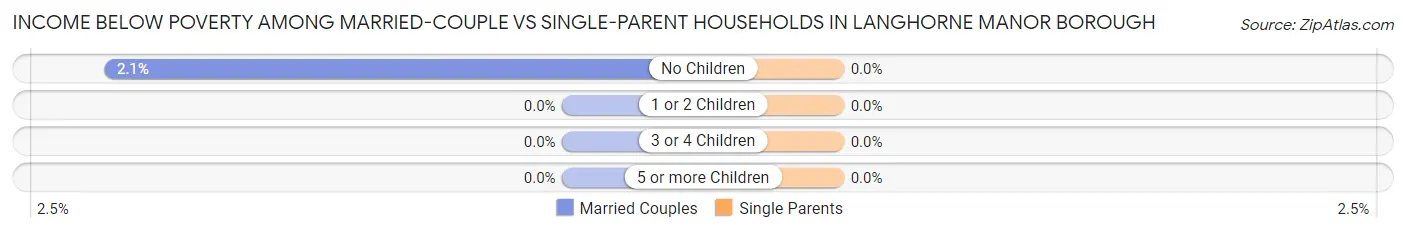
| Children | Married-Couple Families | Single-Parent Households |
| No Children | 2 (2.1%) | 0 (0.0%) |
| 1 or 2 Children | 0 (0.0%) | 0 (0.0%) |
| 3 or 4 Children | 0 (0.0%) | 0 (0.0%) |
| 5 or more Children | 0 (0.0%) | 0 (0.0%) |
| Total | 2 (1.2%) | 0 (0.0%) |
Race in Langhorne Manor borough
The most populous races in Langhorne Manor borough are White / Caucasian (1,312 | 83.9%), Black / African American (104 | 6.7%), and Hispanic or Latino (93 | 5.9%).
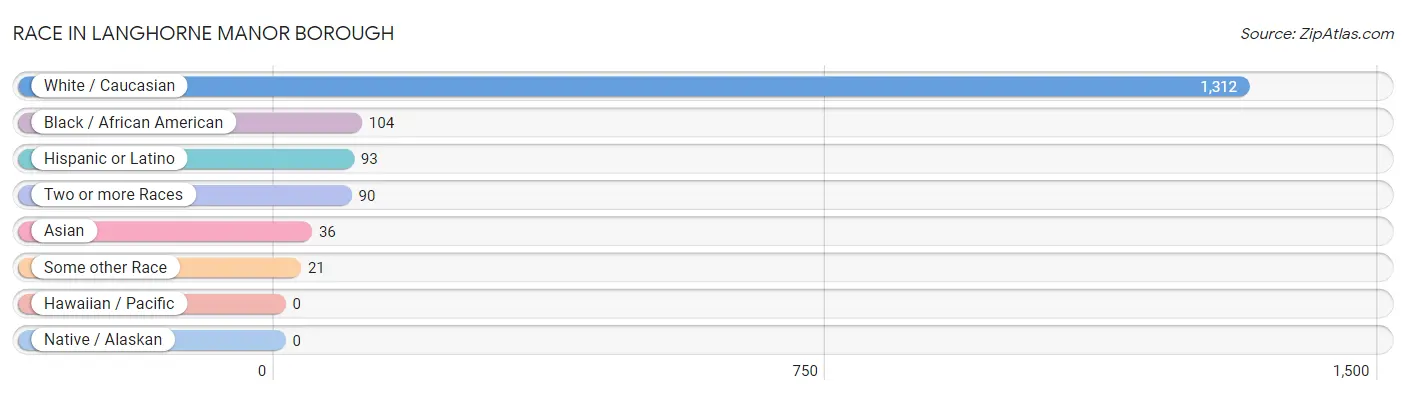
| Race | # Population | % Population |
| Asian | 36 | 2.3% |
| Black / African American | 104 | 6.7% |
| Hawaiian / Pacific | 0 | 0.0% |
| Hispanic or Latino | 93 | 5.9% |
| Native / Alaskan | 0 | 0.0% |
| White / Caucasian | 1,312 | 83.9% |
| Two or more Races | 90 | 5.8% |
| Some other Race | 21 | 1.3% |
| Total | 1,563 | 100.0% |
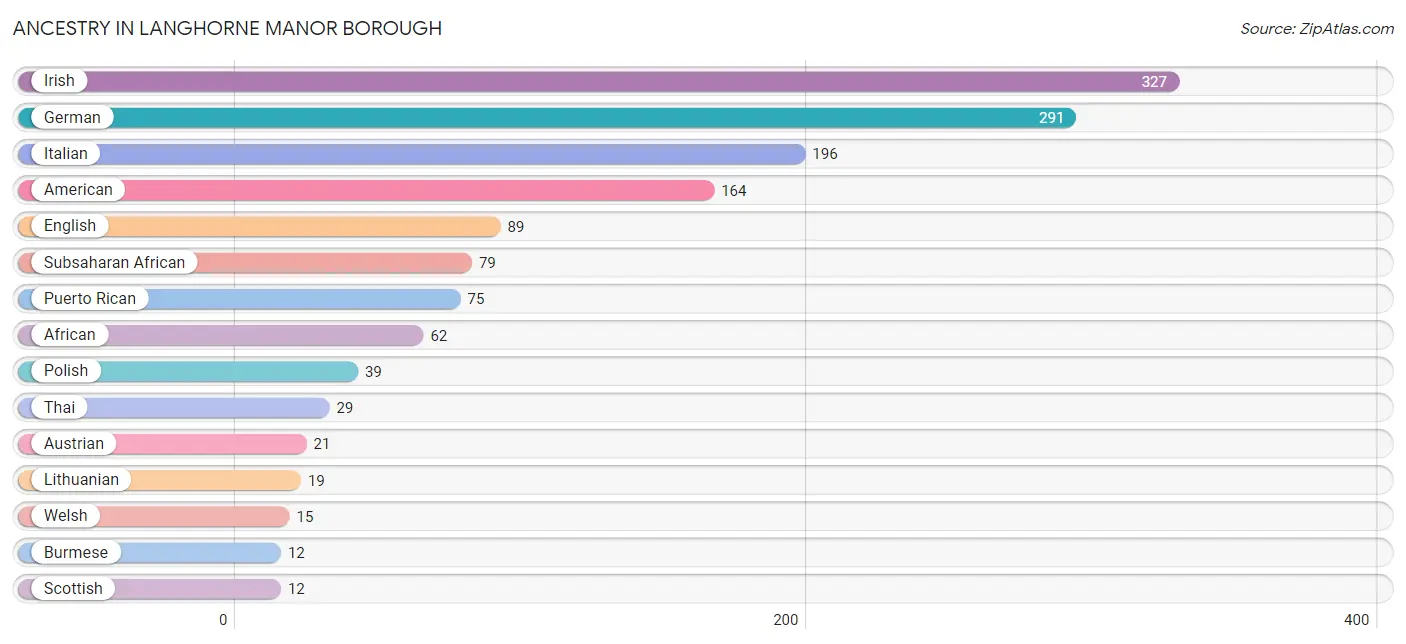
Ancestry in Langhorne Manor borough
The most populous ancestries reported in Langhorne Manor borough are Irish (327 | 20.9%), German (291 | 18.6%), Italian (196 | 12.5%), American (164 | 10.5%), and English (89 | 5.7%), together accounting for 68.3% of all Langhorne Manor borough residents.
| Ancestry | # Population | % Population |
| African | 62 | 4.0% |
| Albanian | 9 | 0.6% |
| American | 164 | 10.5% |
| Austrian | 21 | 1.3% |
| Belgian | 2 | 0.1% |
| Bhutanese | 1 | 0.1% |
| British | 4 | 0.3% |
| Burmese | 12 | 0.8% |
| Croatian | 2 | 0.1% |
| Danish | 2 | 0.1% |
| Dutch | 2 | 0.1% |
| English | 89 | 5.7% |
| European | 5 | 0.3% |
| French | 10 | 0.6% |
| German | 291 | 18.6% |
| Hungarian | 7 | 0.4% |
| Indian (Asian) | 1 | 0.1% |
| Irish | 327 | 20.9% |
| Italian | 196 | 12.5% |
| Kenyan | 11 | 0.7% |
| Lithuanian | 19 | 1.2% |
| Nigerian | 7 | 0.4% |
| Norwegian | 2 | 0.1% |
| Pennsylvania German | 5 | 0.3% |
| Polish | 39 | 2.5% |
| Puerto Rican | 75 | 4.8% |
| Russian | 3 | 0.2% |
| Scandinavian | 2 | 0.1% |
| Scotch-Irish | 4 | 0.3% |
| Scottish | 12 | 0.8% |
| Slavic | 2 | 0.1% |
| Slovak | 5 | 0.3% |
| Subsaharan African | 79 | 5.1% |
| Thai | 29 | 1.9% |
| Ukrainian | 9 | 0.6% |
| Welsh | 15 | 1.0% | View All 36 Rows |
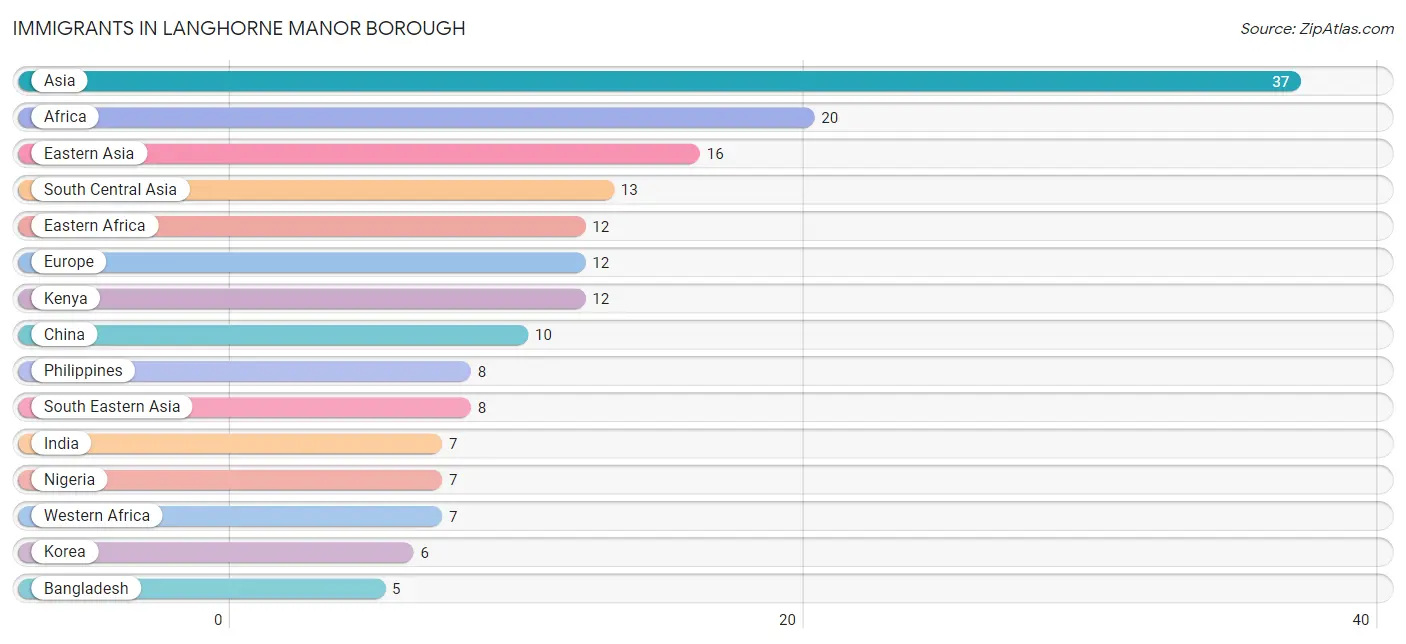
Immigrants in Langhorne Manor borough
The most numerous immigrant groups reported in Langhorne Manor borough came from Asia (37 | 2.4%), Africa (20 | 1.3%), Eastern Asia (16 | 1.0%), South Central Asia (13 | 0.8%), and Eastern Africa (12 | 0.8%), together accounting for 6.3% of all Langhorne Manor borough residents.
| Immigration Origin | # Population | % Population |
| Africa | 20 | 1.3% |
| Asia | 37 | 2.4% |
| Bangladesh | 5 | 0.3% |
| China | 10 | 0.6% |
| Eastern Africa | 12 | 0.8% |
| Eastern Asia | 16 | 1.0% |
| Eastern Europe | 3 | 0.2% |
| England | 1 | 0.1% |
| Europe | 12 | 0.8% |
| Greece | 4 | 0.3% |
| India | 7 | 0.4% |
| Kenya | 12 | 0.8% |
| Korea | 6 | 0.4% |
| Nigeria | 7 | 0.4% |
| Northern Europe | 5 | 0.3% |
| Pakistan | 1 | 0.1% |
| Philippines | 8 | 0.5% |
| Russia | 3 | 0.2% |
| South Central Asia | 13 | 0.8% |
| South Eastern Asia | 8 | 0.5% |
| Southern Europe | 4 | 0.3% |
| Western Africa | 7 | 0.4% | View All 22 Rows |
Sex and Age in Langhorne Manor borough
Sex and Age in Langhorne Manor borough
The most populous age groups in Langhorne Manor borough are 20 to 24 Years (197 | 24.9%) for men and 20 to 24 Years (147 | 19.0%) for women.
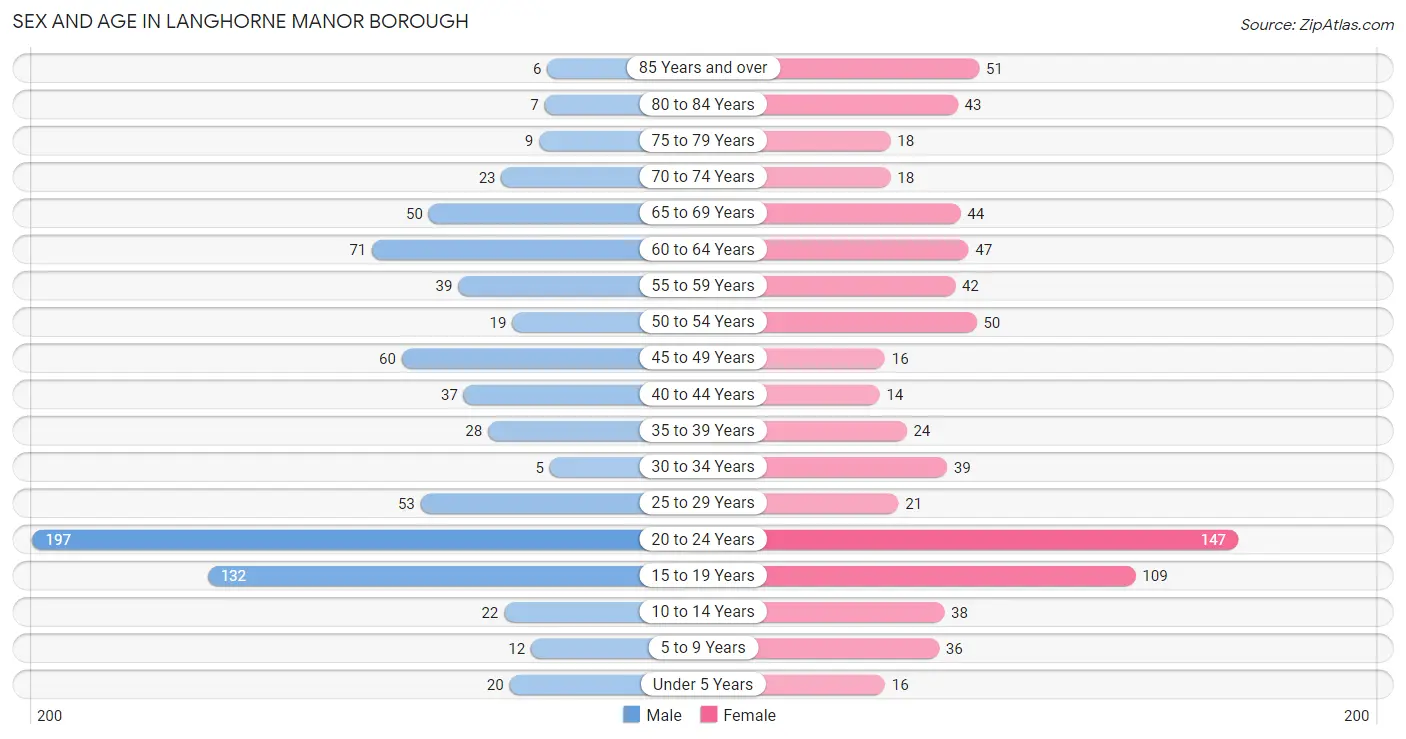
| Age Bracket | Male | Female |
| Under 5 Years | 20 (2.5%) | 16 (2.1%) |
| 5 to 9 Years | 12 (1.5%) | 36 (4.7%) |
| 10 to 14 Years | 22 (2.8%) | 38 (4.9%) |
| 15 to 19 Years | 132 (16.7%) | 109 (14.1%) |
| 20 to 24 Years | 197 (24.9%) | 147 (19.0%) |
| 25 to 29 Years | 53 (6.7%) | 21 (2.7%) |
| 30 to 34 Years | 5 (0.6%) | 39 (5.1%) |
| 35 to 39 Years | 28 (3.5%) | 24 (3.1%) |
| 40 to 44 Years | 37 (4.7%) | 14 (1.8%) |
| 45 to 49 Years | 60 (7.6%) | 16 (2.1%) |
| 50 to 54 Years | 19 (2.4%) | 50 (6.5%) |
| 55 to 59 Years | 39 (4.9%) | 42 (5.4%) |
| 60 to 64 Years | 71 (9.0%) | 47 (6.1%) |
| 65 to 69 Years | 50 (6.3%) | 44 (5.7%) |
| 70 to 74 Years | 23 (2.9%) | 18 (2.3%) |
| 75 to 79 Years | 9 (1.1%) | 18 (2.3%) |
| 80 to 84 Years | 7 (0.9%) | 43 (5.6%) |
| 85 Years and over | 6 (0.8%) | 51 (6.6%) |
| Total | 790 (100.0%) | 773 (100.0%) |
Families and Households in Langhorne Manor borough
Median Family Size in Langhorne Manor borough
The median family size in Langhorne Manor borough is 3.21 persons per family, with married-couple families (168 | 89.4%) accounting for the largest median family size of 3.25 persons per family. On the other hand, single male/father families (2 | 1.1%) represent the smallest median family size with 2.50 persons per family.
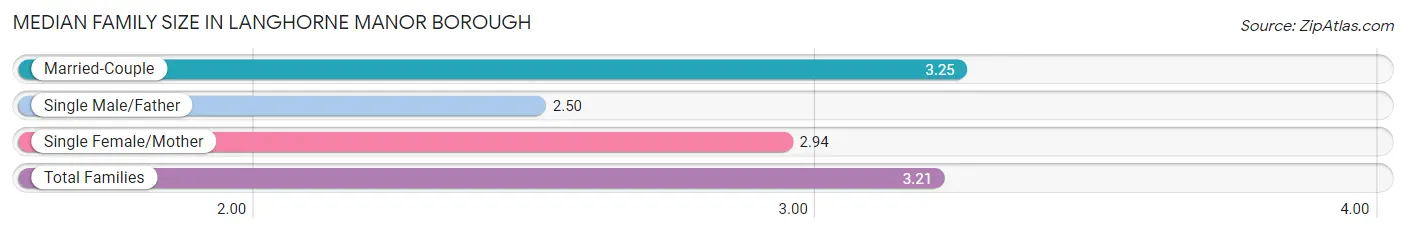
| Family Type | # Families | Family Size |
| Married-Couple | 168 (89.4%) | 3.25 |
| Single Male/Father | 2 (1.1%) | 2.50 |
| Single Female/Mother | 18 (9.6%) | 2.94 |
| Total Families | 188 (100.0%) | 3.21 |
Median Household Size in Langhorne Manor borough
The median household size in Langhorne Manor borough is 2.57 persons per household, with single female/mother households (18 | 6.2%) accounting for the largest median household size of 3.72 persons per household. non-family households (101 | 34.9%) represent the smallest median household size with 1.18 persons per household.
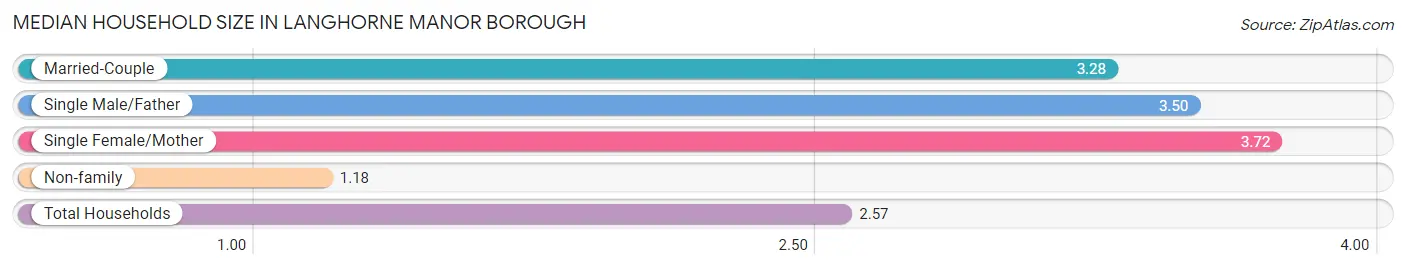
| Household Type | # Households | Household Size |
| Married-Couple | 168 (58.1%) | 3.28 |
| Single Male/Father | 2 (0.7%) | 3.50 |
| Single Female/Mother | 18 (6.2%) | 3.72 |
| Non-family | 101 (34.9%) | 1.18 |
| Total Households | 289 (100.0%) | 2.57 |
Household Size by Marriage Status in Langhorne Manor borough
Out of a total of 289 households in Langhorne Manor borough, 188 (65.0%) are family households, while 101 (34.9%) are nonfamily households. The most numerous type of family households are 2-person households, comprising 76, and the most common type of nonfamily households are 1-person households, comprising 84.
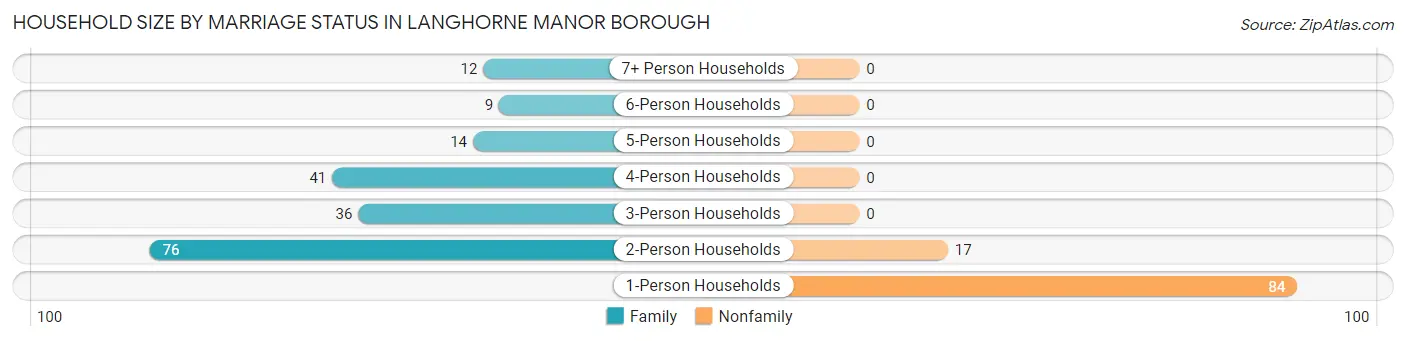
| Household Size | Family Households | Nonfamily Households |
| 1-Person Households | - | 84 (29.1%) |
| 2-Person Households | 76 (26.3%) | 17 (5.9%) |
| 3-Person Households | 36 (12.5%) | 0 (0.0%) |
| 4-Person Households | 41 (14.2%) | 0 (0.0%) |
| 5-Person Households | 14 (4.8%) | 0 (0.0%) |
| 6-Person Households | 9 (3.1%) | 0 (0.0%) |
| 7+ Person Households | 12 (4.2%) | 0 (0.0%) |
| Total | 188 (65.0%) | 101 (34.9%) |
Female Fertility in Langhorne Manor borough
Fertility by Age in Langhorne Manor borough
Average fertility rate in Langhorne Manor borough is 23.0 births per 1,000 women. Women in the age bracket of 35 to 50 years have the highest fertility rate with 134.0 births per 1,000 women. Women in the age bracket of 35 to 50 years acount for 100.0% of all women with births.
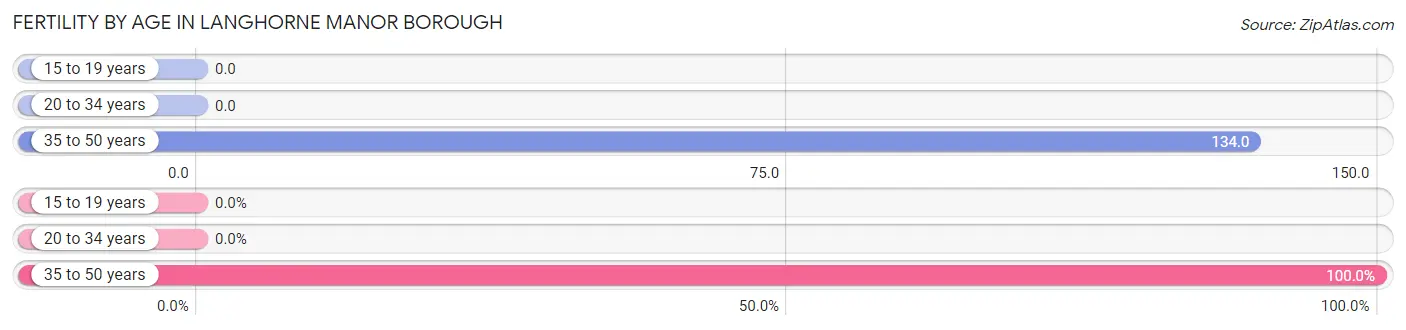
| Age Bracket | Women with Births | Births / 1,000 Women |
| 15 to 19 years | 0 (0.0%) | 0.0 |
| 20 to 34 years | 0 (0.0%) | 0.0 |
| 35 to 50 years | 9 (100.0%) | 134.0 |
| Total | 9 (100.0%) | 23.0 |
Fertility by Age by Marriage Status in Langhorne Manor borough
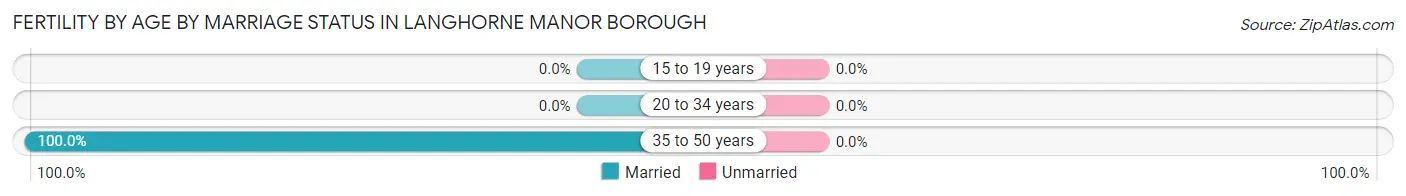
| Age Bracket | Married | Unmarried |
| 15 to 19 years | 0 (0.0%) | 0 (0.0%) |
| 20 to 34 years | 0 (0.0%) | 0 (0.0%) |
| 35 to 50 years | 9 (100.0%) | 0 (0.0%) |
| Total | 9 (100.0%) | 0 (0.0%) |
Fertility by Education in Langhorne Manor borough
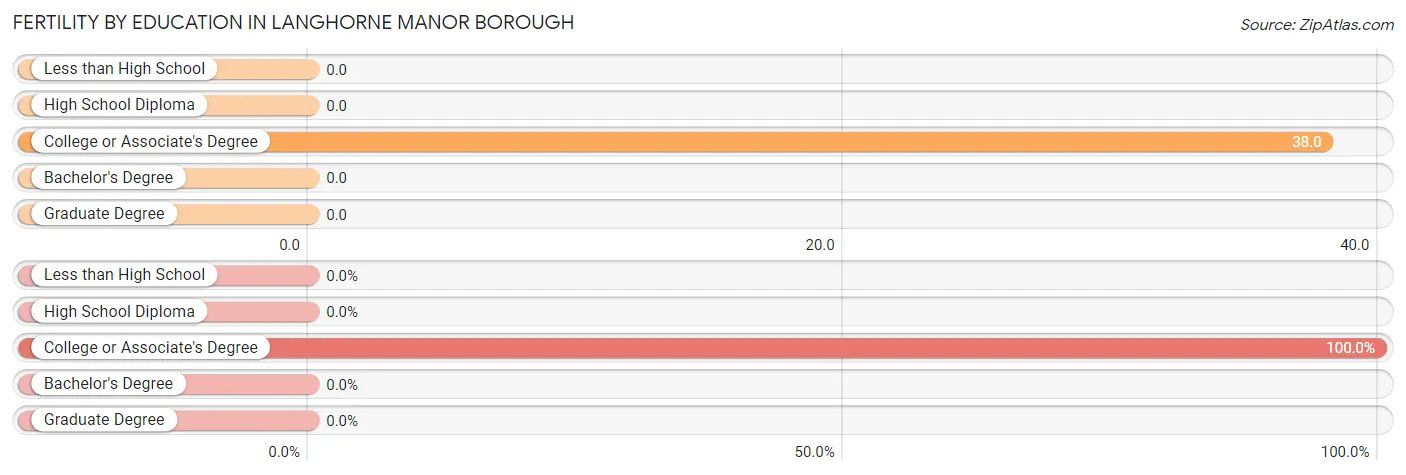
| Educational Attainment | Women with Births | Births / 1,000 Women |
| Less than High School | 0 (0.0%) | 0.0 |
| High School Diploma | 0 (0.0%) | 0.0 |
| College or Associate's Degree | 9 (100.0%) | 38.0 |
| Bachelor's Degree | 0 (0.0%) | 0.0 |
| Graduate Degree | 0 (0.0%) | 0.0 |
| Total | 9 (100.0%) | 23.0 |
Fertility by Education by Marriage Status in Langhorne Manor borough
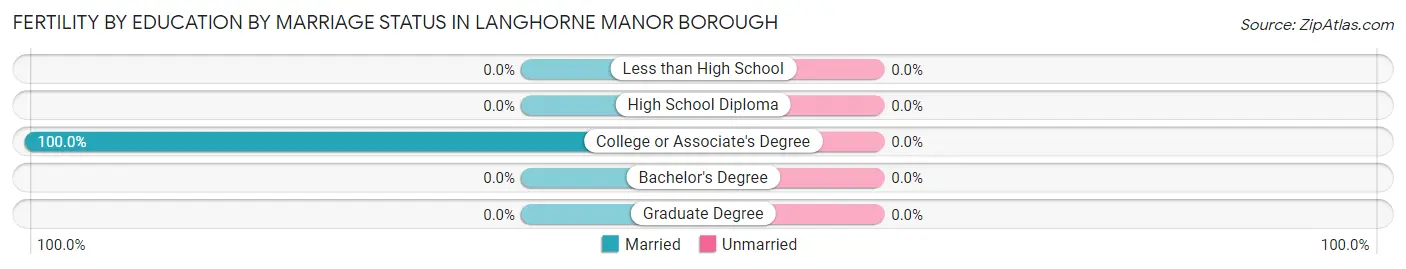
| Educational Attainment | Married | Unmarried |
| Less than High School | 0 (0.0%) | 0 (0.0%) |
| High School Diploma | 0 (0.0%) | 0 (0.0%) |
| College or Associate's Degree | 9 (100.0%) | 0 (0.0%) |
| Bachelor's Degree | 0 (0.0%) | 0 (0.0%) |
| Graduate Degree | 0 (0.0%) | 0 (0.0%) |
| Total | 9 (100.0%) | 0 (0.0%) |
Employment Characteristics in Langhorne Manor borough
Employment by Class of Employer in Langhorne Manor borough
Among the 527 employed individuals in Langhorne Manor borough, private company employees (320 | 60.7%), not-for-profit organizations (62 | 11.8%), and local government employees (42 | 8.0%) make up the most common classes of employment.
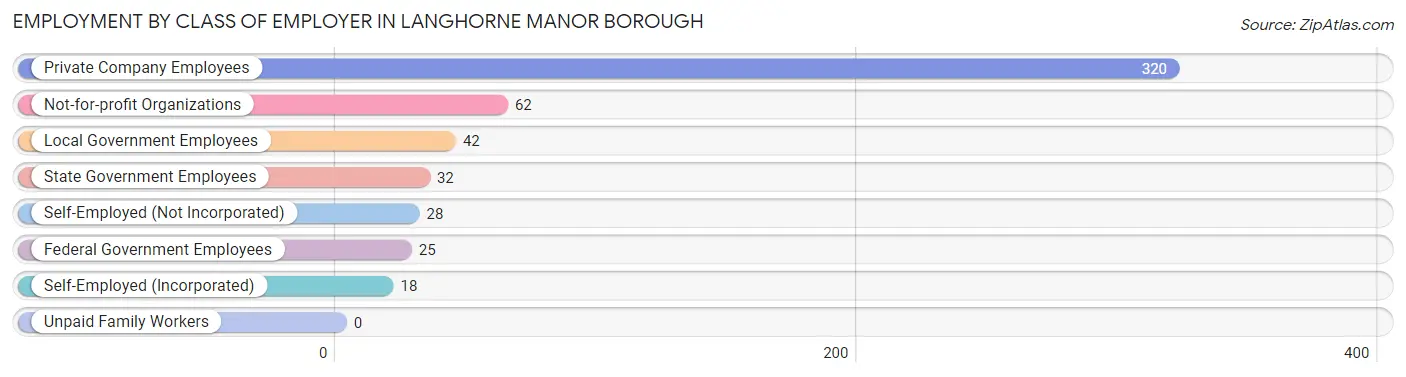
| Employer Class | # Employees | % Employees |
| Private Company Employees | 320 | 60.7% |
| Self-Employed (Incorporated) | 18 | 3.4% |
| Self-Employed (Not Incorporated) | 28 | 5.3% |
| Not-for-profit Organizations | 62 | 11.8% |
| Local Government Employees | 42 | 8.0% |
| State Government Employees | 32 | 6.1% |
| Federal Government Employees | 25 | 4.7% |
| Unpaid Family Workers | 0 | 0.0% |
| Total | 527 | 100.0% |
Employment Status by Age in Langhorne Manor borough
According to the labor force statistics for Langhorne Manor borough, out of the total population over 16 years of age (1,418), 46.8% or 664 individuals are in the labor force, with 9.0% or 60 of them unemployed. The age group with the highest labor force participation rate is 25 to 29 years, with 95.9% or 71 individuals in the labor force. Within the labor force, the 16 to 19 years age range has the highest percentage of unemployed individuals, with 31.6% or 18 of them being unemployed.
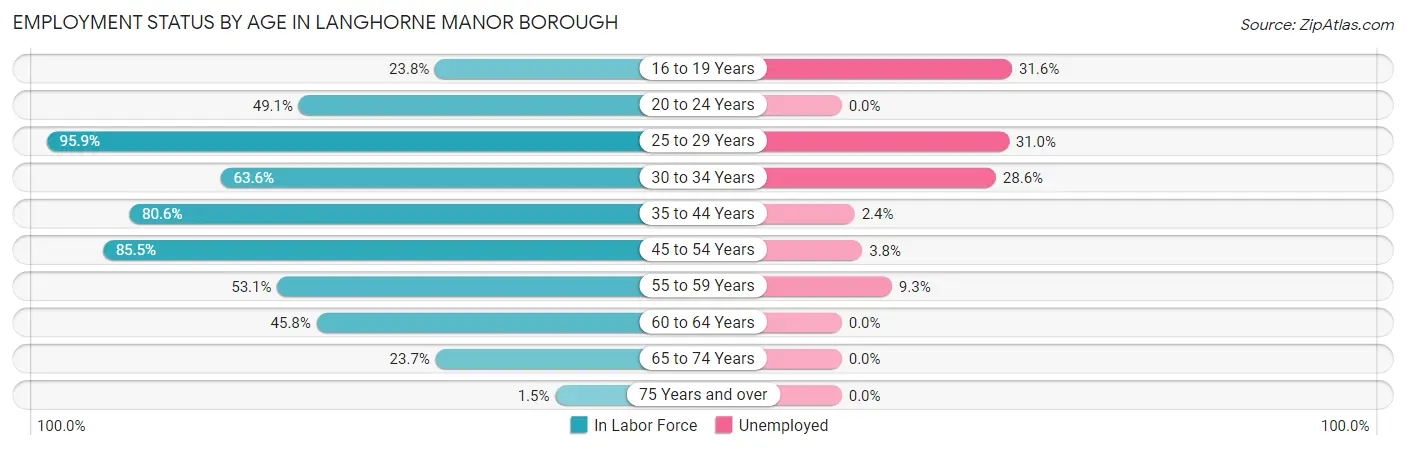
| Age Bracket | In Labor Force | Unemployed |
| 16 to 19 Years | 57 (23.8%) | 18 (31.6%) |
| 20 to 24 Years | 169 (49.1%) | 0 (0.0%) |
| 25 to 29 Years | 71 (95.9%) | 22 (31.0%) |
| 30 to 34 Years | 28 (63.6%) | 8 (28.6%) |
| 35 to 44 Years | 83 (80.6%) | 2 (2.4%) |
| 45 to 54 Years | 124 (85.5%) | 5 (3.8%) |
| 55 to 59 Years | 43 (53.1%) | 4 (9.3%) |
| 60 to 64 Years | 54 (45.8%) | 0 (0.0%) |
| 65 to 74 Years | 32 (23.7%) | 0 (0.0%) |
| 75 Years and over | 2 (1.5%) | 0 (0.0%) |
| Total | 664 (46.8%) | 60 (9.0%) |
Employment Status by Educational Attainment in Langhorne Manor borough
According to labor force statistics for Langhorne Manor borough, 71.3% of individuals (403) out of the total population between 25 and 64 years of age (565) are in the labor force, with 10.4% or 42 of them being unemployed. The group with the highest labor force participation rate are those with the educational attainment of bachelor's degree or higher, with 90.3% or 214 individuals in the labor force. Within the labor force, individuals with high school diploma education have the highest percentage of unemployment, with 34.8% or 24 of them being unemployed.
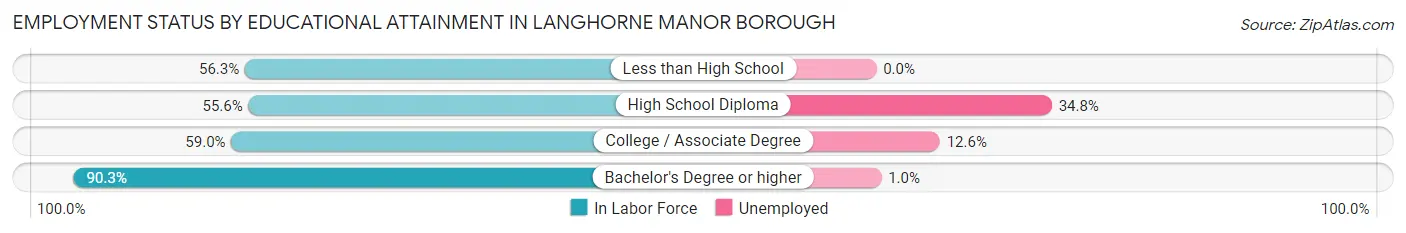
| Educational Attainment | In Labor Force | Unemployed |
| Less than High School | 9 (56.3%) | 0 (0.0%) |
| High School Diploma | 69 (55.6%) | 43 (34.8%) |
| College / Associate Degree | 111 (59.0%) | 24 (12.6%) |
| Bachelor's Degree or higher | 214 (90.3%) | 2 (1.0%) |
| Total | 403 (71.3%) | 59 (10.4%) |
Employment Occupations by Sex in Langhorne Manor borough
Management, Business, Science and Arts Occupations
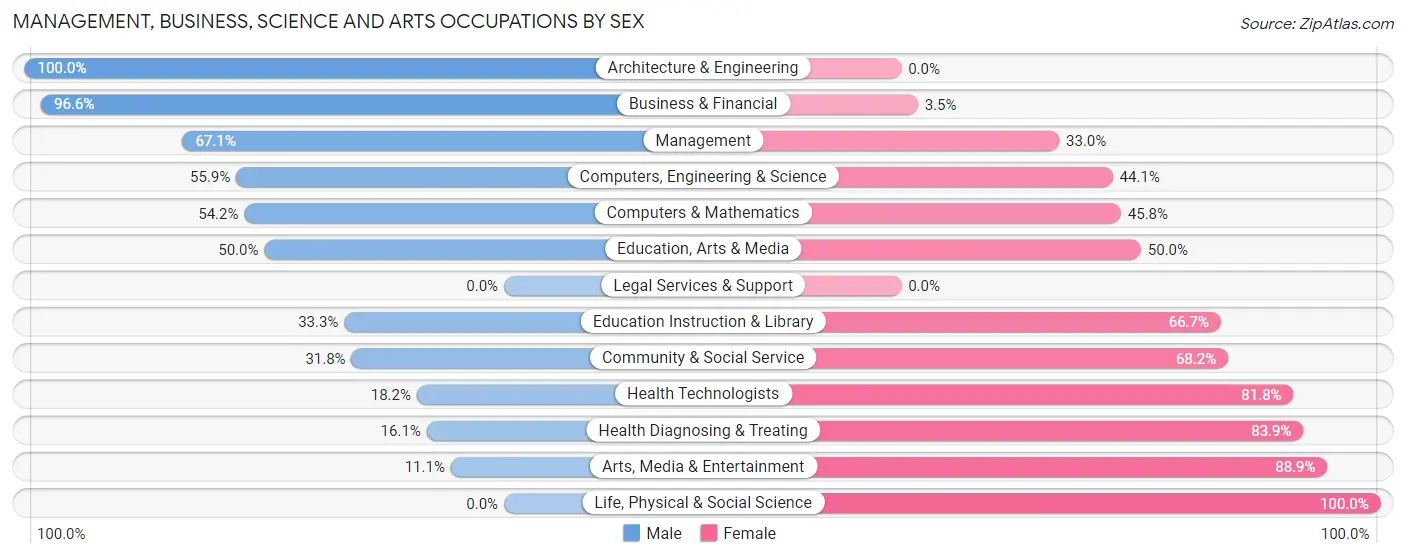
The most common Management, Business, Science and Arts occupations in Langhorne Manor borough are Management (88 | 15.0%), Community & Social Service (66 | 11.2%), Education Instruction & Library (51 | 8.7%), Computers, Engineering & Science (34 | 5.8%), and Health Diagnosing & Treating (31 | 5.3%).
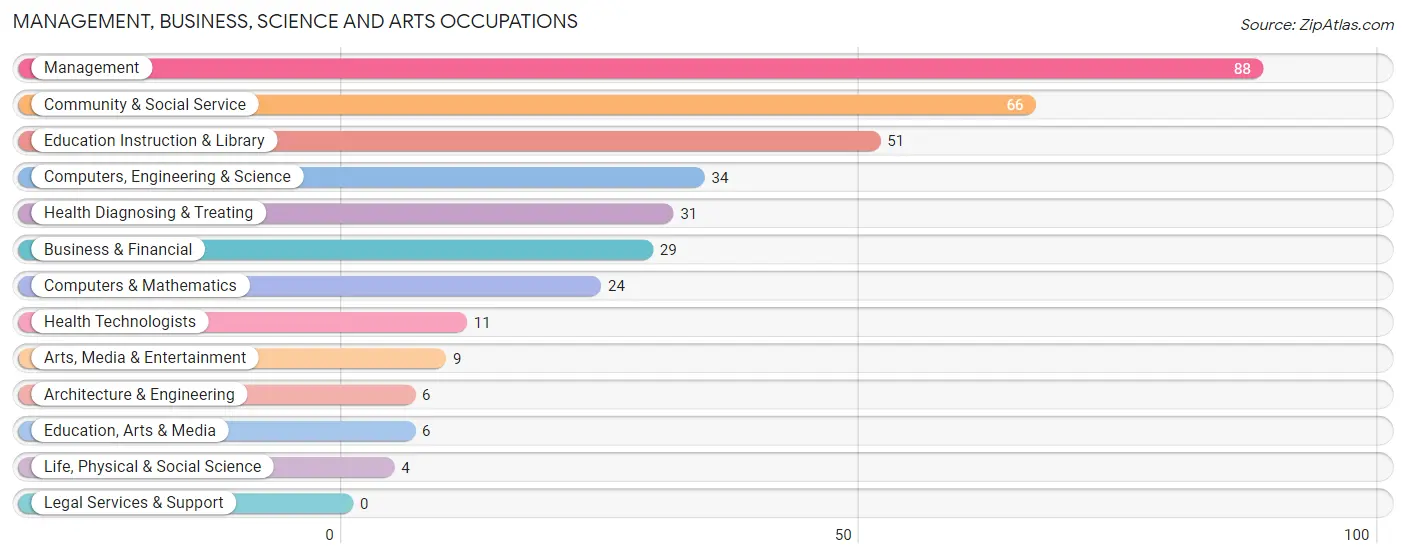
Management, Business, Science and Arts Occupations by Sex
Within the Management, Business, Science and Arts occupations in Langhorne Manor borough, the most male-oriented occupations are Architecture & Engineering (100.0%), Business & Financial (96.6%), and Management (67.0%), while the most female-oriented occupations are Life, Physical & Social Science (100.0%), Arts, Media & Entertainment (88.9%), and Health Diagnosing & Treating (83.9%).
| Occupation | Male | Female |
| Management | 59 (67.0%) | 29 (33.0%) |
| Business & Financial | 28 (96.6%) | 1 (3.5%) |
| Computers, Engineering & Science | 19 (55.9%) | 15 (44.1%) |
| Computers & Mathematics | 13 (54.2%) | 11 (45.8%) |
| Architecture & Engineering | 6 (100.0%) | 0 (0.0%) |
| Life, Physical & Social Science | 0 (0.0%) | 4 (100.0%) |
| Community & Social Service | 21 (31.8%) | 45 (68.2%) |
| Education, Arts & Media | 3 (50.0%) | 3 (50.0%) |
| Legal Services & Support | 0 (0.0%) | 0 (0.0%) |
| Education Instruction & Library | 17 (33.3%) | 34 (66.7%) |
| Arts, Media & Entertainment | 1 (11.1%) | 8 (88.9%) |
| Health Diagnosing & Treating | 5 (16.1%) | 26 (83.9%) |
| Health Technologists | 2 (18.2%) | 9 (81.8%) |
| Total (Category) | 132 (53.2%) | 116 (46.8%) |
| Total (Overall) | 349 (59.5%) | 238 (40.6%) |
Services Occupations
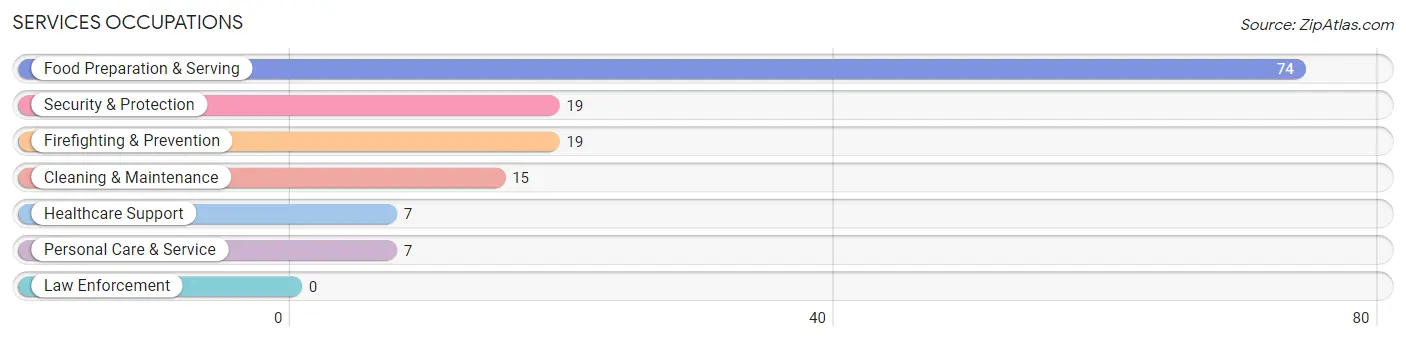
The most common Services occupations in Langhorne Manor borough are Food Preparation & Serving (74 | 12.6%), Security & Protection (19 | 3.2%), Firefighting & Prevention (19 | 3.2%), Cleaning & Maintenance (15 | 2.6%), and Healthcare Support (7 | 1.2%).
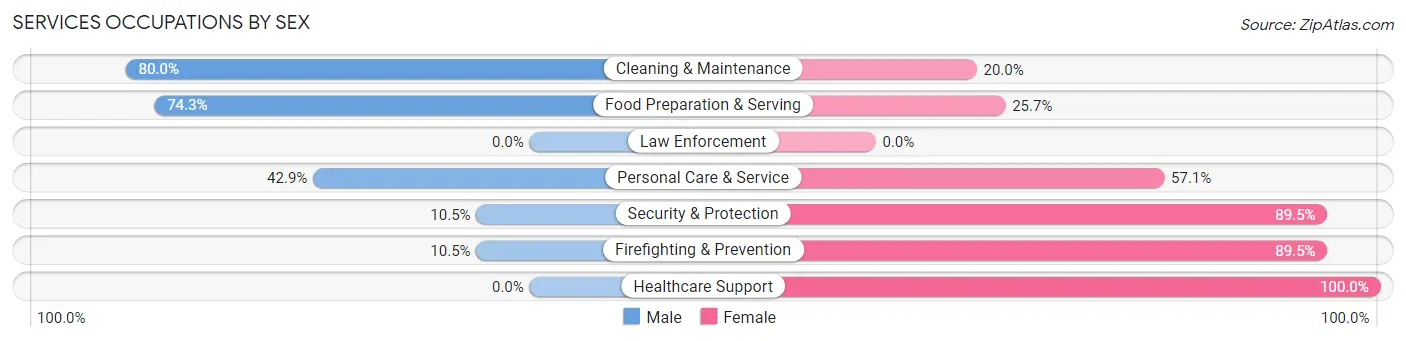
Services Occupations by Sex
Within the Services occupations in Langhorne Manor borough, the most male-oriented occupations are Cleaning & Maintenance (80.0%), Food Preparation & Serving (74.3%), and Personal Care & Service (42.9%), while the most female-oriented occupations are Healthcare Support (100.0%), Security & Protection (89.5%), and Firefighting & Prevention (89.5%).
| Occupation | Male | Female |
| Healthcare Support | 0 (0.0%) | 7 (100.0%) |
| Security & Protection | 2 (10.5%) | 17 (89.5%) |
| Firefighting & Prevention | 2 (10.5%) | 17 (89.5%) |
| Law Enforcement | 0 (0.0%) | 0 (0.0%) |
| Food Preparation & Serving | 55 (74.3%) | 19 (25.7%) |
| Cleaning & Maintenance | 12 (80.0%) | 3 (20.0%) |
| Personal Care & Service | 3 (42.9%) | 4 (57.1%) |
| Total (Category) | 72 (59.0%) | 50 (41.0%) |
| Total (Overall) | 349 (59.5%) | 238 (40.6%) |
Sales and Office Occupations
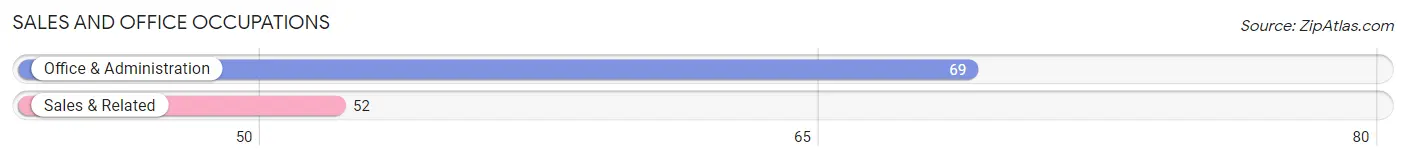
The most common Sales and Office occupations in Langhorne Manor borough are Office & Administration (69 | 11.7%), and Sales & Related (52 | 8.9%).
Sales and Office Occupations by Sex

| Occupation | Male | Female |
| Sales & Related | 19 (36.5%) | 33 (63.5%) |
| Office & Administration | 36 (52.2%) | 33 (47.8%) |
| Total (Category) | 55 (45.5%) | 66 (54.5%) |
| Total (Overall) | 349 (59.5%) | 238 (40.6%) |
Natural Resources, Construction and Maintenance Occupations
The most common Natural Resources, Construction and Maintenance occupations in Langhorne Manor borough are Construction & Extraction (52 | 8.9%), and Installation, Maintenance & Repair (26 | 4.4%).
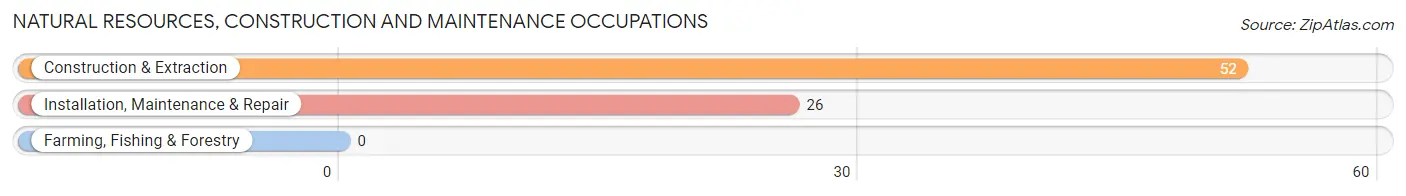
Natural Resources, Construction and Maintenance Occupations by Sex

| Occupation | Male | Female |
| Farming, Fishing & Forestry | 0 (0.0%) | 0 (0.0%) |
| Construction & Extraction | 52 (100.0%) | 0 (0.0%) |
| Installation, Maintenance & Repair | 26 (100.0%) | 0 (0.0%) |
| Total (Category) | 78 (100.0%) | 0 (0.0%) |
| Total (Overall) | 349 (59.5%) | 238 (40.6%) |
Production, Transportation and Moving Occupations
The most common Production, Transportation and Moving occupations in Langhorne Manor borough are Material Moving (10 | 1.7%), Production (5 | 0.9%), and Transportation (3 | 0.5%).
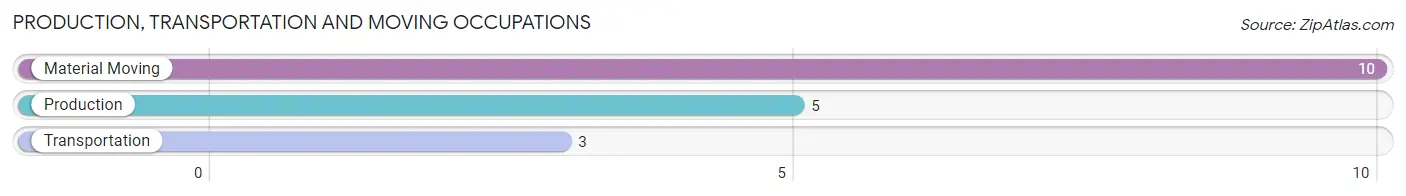
Production, Transportation and Moving Occupations by Sex
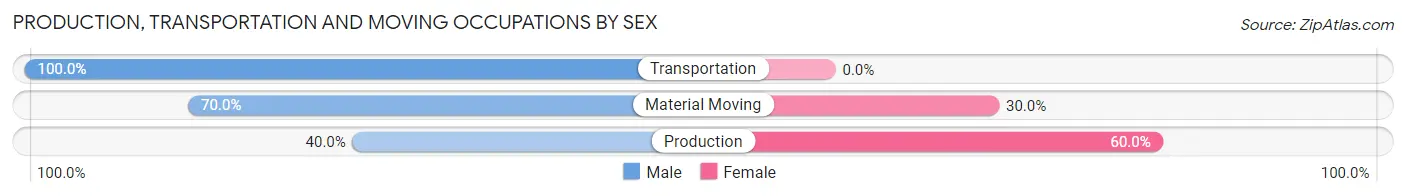
| Occupation | Male | Female |
| Production | 2 (40.0%) | 3 (60.0%) |
| Transportation | 3 (100.0%) | 0 (0.0%) |
| Material Moving | 7 (70.0%) | 3 (30.0%) |
| Total (Category) | 12 (66.7%) | 6 (33.3%) |
| Total (Overall) | 349 (59.5%) | 238 (40.6%) |
Employment Industries by Sex in Langhorne Manor borough
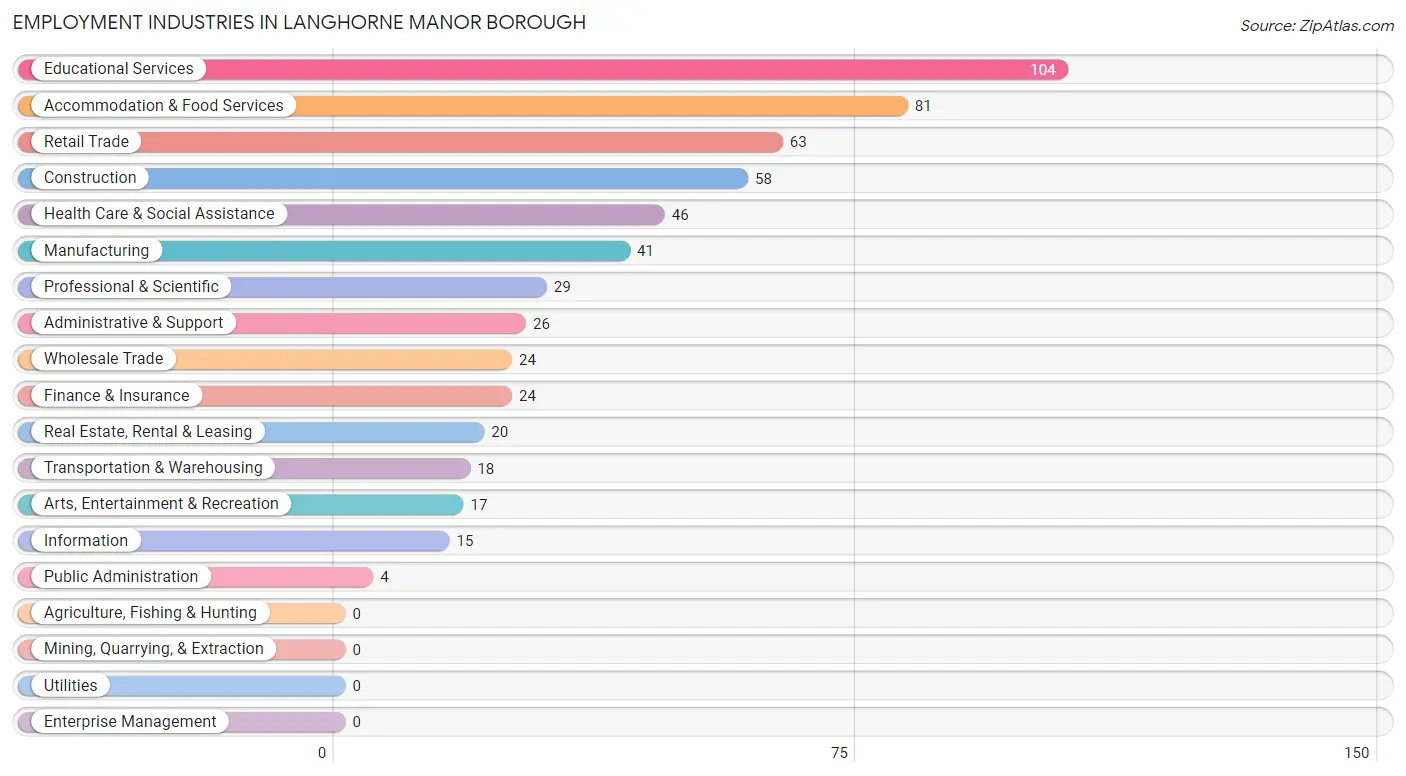
Employment Industries in Langhorne Manor borough
The major employment industries in Langhorne Manor borough include Educational Services (104 | 17.7%), Accommodation & Food Services (81 | 13.8%), Retail Trade (63 | 10.7%), Construction (58 | 9.9%), and Health Care & Social Assistance (46 | 7.8%).
Employment Industries by Sex in Langhorne Manor borough
The Langhorne Manor borough industries that see more men than women are Construction (100.0%), Transportation & Warehousing (100.0%), and Public Administration (100.0%), whereas the industries that tend to have a higher number of women are Arts, Entertainment & Recreation (100.0%), Health Care & Social Assistance (76.1%), and Retail Trade (63.5%).
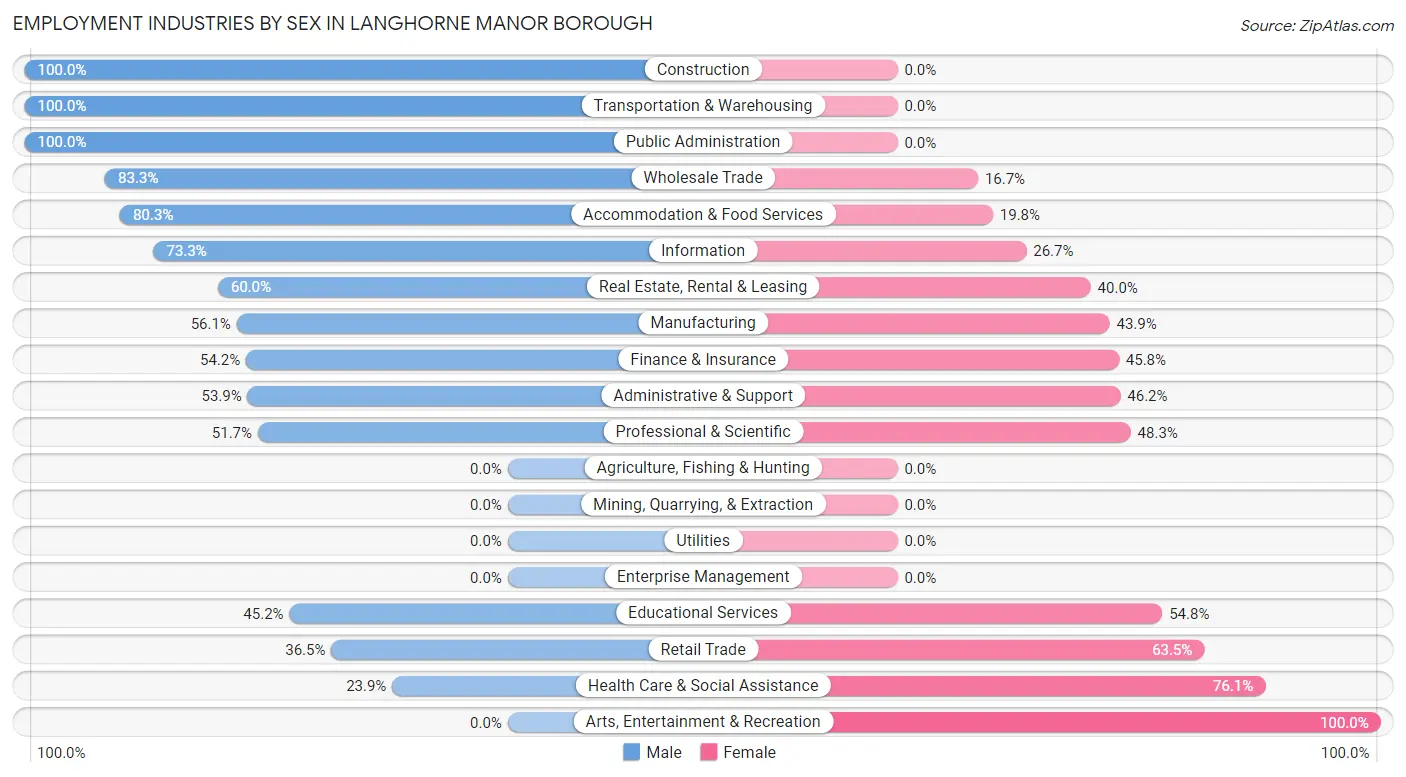
| Industry | Male | Female |
| Agriculture, Fishing & Hunting | 0 (0.0%) | 0 (0.0%) |
| Mining, Quarrying, & Extraction | 0 (0.0%) | 0 (0.0%) |
| Construction | 58 (100.0%) | 0 (0.0%) |
| Manufacturing | 23 (56.1%) | 18 (43.9%) |
| Wholesale Trade | 20 (83.3%) | 4 (16.7%) |
| Retail Trade | 23 (36.5%) | 40 (63.5%) |
| Transportation & Warehousing | 18 (100.0%) | 0 (0.0%) |
| Utilities | 0 (0.0%) | 0 (0.0%) |
| Information | 11 (73.3%) | 4 (26.7%) |
| Finance & Insurance | 13 (54.2%) | 11 (45.8%) |
| Real Estate, Rental & Leasing | 12 (60.0%) | 8 (40.0%) |
| Professional & Scientific | 15 (51.7%) | 14 (48.3%) |
| Enterprise Management | 0 (0.0%) | 0 (0.0%) |
| Administrative & Support | 14 (53.8%) | 12 (46.2%) |
| Educational Services | 47 (45.2%) | 57 (54.8%) |
| Health Care & Social Assistance | 11 (23.9%) | 35 (76.1%) |
| Arts, Entertainment & Recreation | 0 (0.0%) | 17 (100.0%) |
| Accommodation & Food Services | 65 (80.2%) | 16 (19.8%) |
| Public Administration | 4 (100.0%) | 0 (0.0%) |
| Total | 349 (59.5%) | 238 (40.6%) |
Education in Langhorne Manor borough
School Enrollment in Langhorne Manor borough
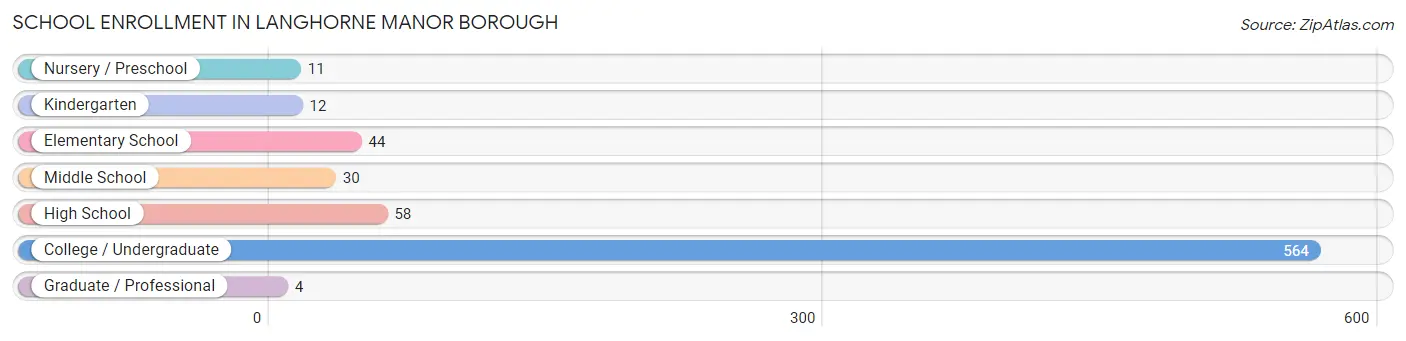
The most common levels of schooling among the 723 students in Langhorne Manor borough are college / undergraduate (564 | 78.0%), high school (58 | 8.0%), and elementary school (44 | 6.1%).
| School Level | # Students | % Students |
| Nursery / Preschool | 11 | 1.5% |
| Kindergarten | 12 | 1.7% |
| Elementary School | 44 | 6.1% |
| Middle School | 30 | 4.2% |
| High School | 58 | 8.0% |
| College / Undergraduate | 564 | 78.0% |
| Graduate / Professional | 4 | 0.5% |
| Total | 723 | 100.0% |
School Enrollment by Age by Funding Source in Langhorne Manor borough
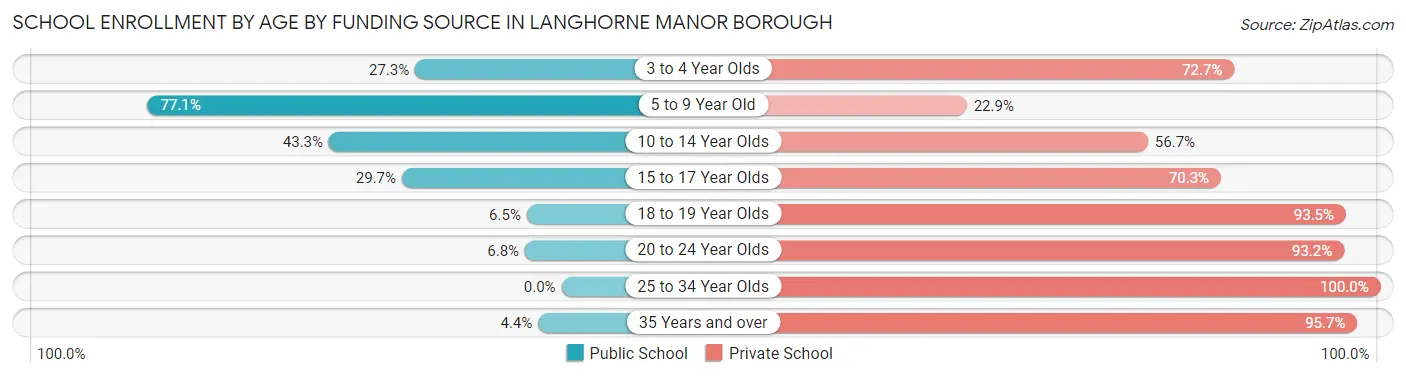
Out of a total of 723 students who are enrolled in schools in Langhorne Manor borough, 609 (84.2%) attend a private institution, while the remaining 114 (15.8%) are enrolled in public schools. The age group of 25 to 34 year olds has the highest likelihood of being enrolled in private schools, with 5 (100.0% in the age bracket) enrolled. Conversely, the age group of 5 to 9 year old has the lowest likelihood of being enrolled in a private school, with 37 (77.1% in the age bracket) attending a public institution.
| Age Bracket | Public School | Private School |
| 3 to 4 Year Olds | 3 (27.3%) | 8 (72.7%) |
| 5 to 9 Year Old | 37 (77.1%) | 11 (22.9%) |
| 10 to 14 Year Olds | 26 (43.3%) | 34 (56.7%) |
| 15 to 17 Year Olds | 11 (29.7%) | 26 (70.3%) |
| 18 to 19 Year Olds | 13 (6.5%) | 188 (93.5%) |
| 20 to 24 Year Olds | 23 (6.8%) | 315 (93.2%) |
| 25 to 34 Year Olds | 0 (0.0%) | 5 (100.0%) |
| 35 Years and over | 1 (4.3%) | 22 (95.7%) |
| Total | 114 (15.8%) | 609 (84.2%) |
Educational Attainment by Field of Study in Langhorne Manor borough
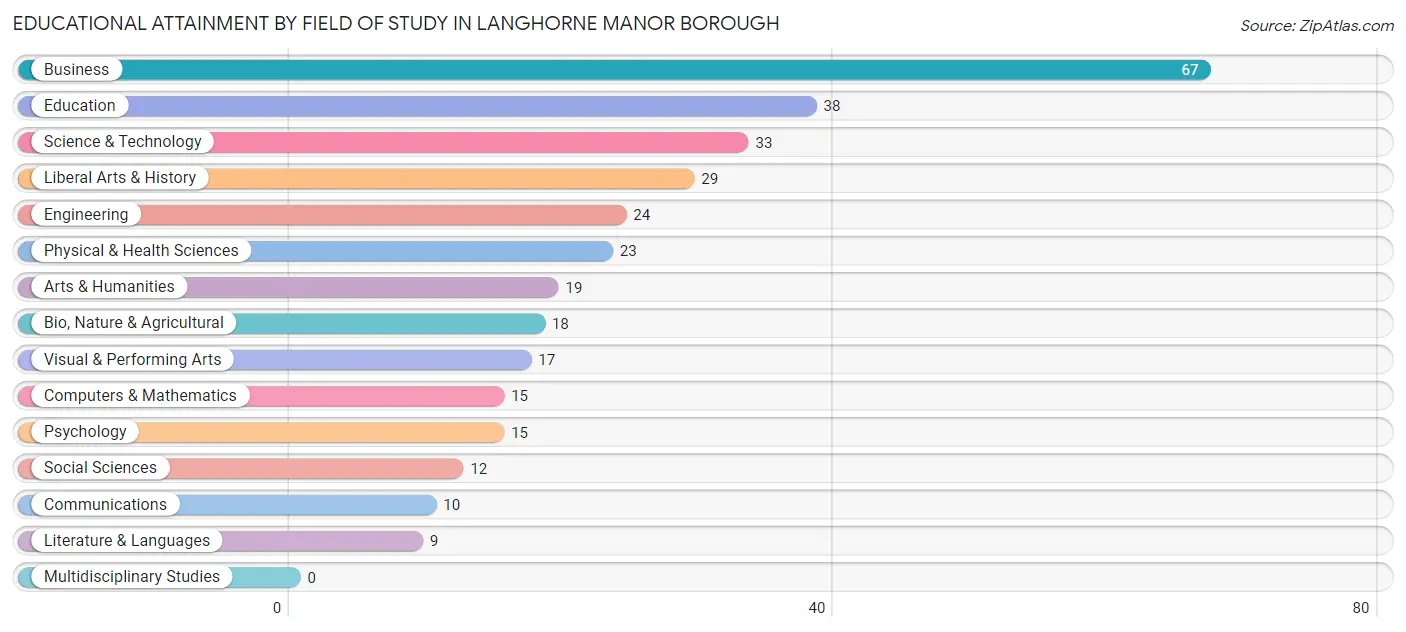
Business (67 | 20.4%), education (38 | 11.6%), science & technology (33 | 10.0%), liberal arts & history (29 | 8.8%), and engineering (24 | 7.3%) are the most common fields of study among 329 individuals in Langhorne Manor borough who have obtained a bachelor's degree or higher.
| Field of Study | # Graduates | % Graduates |
| Computers & Mathematics | 15 | 4.6% |
| Bio, Nature & Agricultural | 18 | 5.5% |
| Physical & Health Sciences | 23 | 7.0% |
| Psychology | 15 | 4.6% |
| Social Sciences | 12 | 3.6% |
| Engineering | 24 | 7.3% |
| Multidisciplinary Studies | 0 | 0.0% |
| Science & Technology | 33 | 10.0% |
| Business | 67 | 20.4% |
| Education | 38 | 11.6% |
| Literature & Languages | 9 | 2.7% |
| Liberal Arts & History | 29 | 8.8% |
| Visual & Performing Arts | 17 | 5.2% |
| Communications | 10 | 3.0% |
| Arts & Humanities | 19 | 5.8% |
| Total | 329 | 100.0% |
Transportation & Commute in Langhorne Manor borough
Vehicle Availability by Sex in Langhorne Manor borough
The most prevalent vehicle ownership categories in Langhorne Manor borough are males with 2 vehicles (89, accounting for 36.6%) and females with 2 vehicles (53, making up 52.0%).
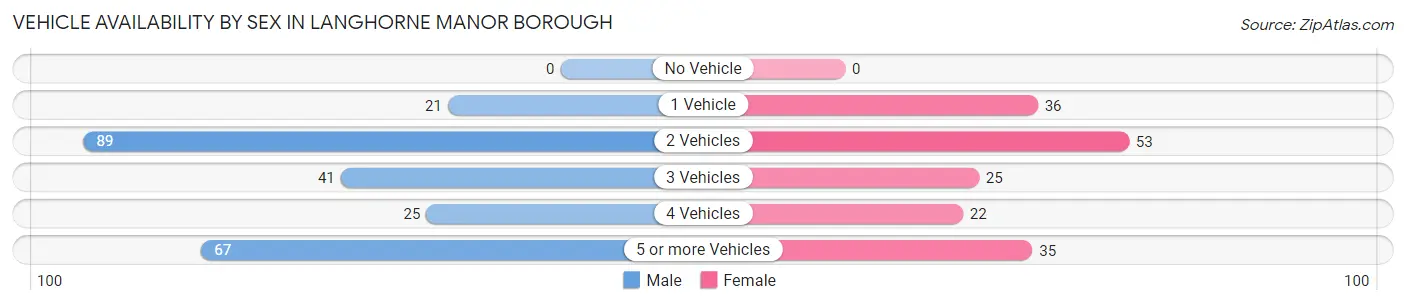
| Vehicles Available | Male | Female |
| No Vehicle | 0 (0.0%) | 0 (0.0%) |
| 1 Vehicle | 21 (8.6%) | 36 (21.0%) |
| 2 Vehicles | 89 (36.6%) | 53 (31.0%) |
| 3 Vehicles | 41 (16.9%) | 25 (14.6%) |
| 4 Vehicles | 25 (10.3%) | 22 (12.9%) |
| 5 or more Vehicles | 67 (27.6%) | 35 (20.5%) |
| Total | 243 (100.0%) | 171 (100.0%) |
Commute Time in Langhorne Manor borough
The most frequently occuring commute durations in Langhorne Manor borough are 15 to 19 minutes (78 commuters, 18.6%), 10 to 14 minutes (74 commuters, 17.7%), and 5 to 9 minutes (51 commuters, 12.2%).
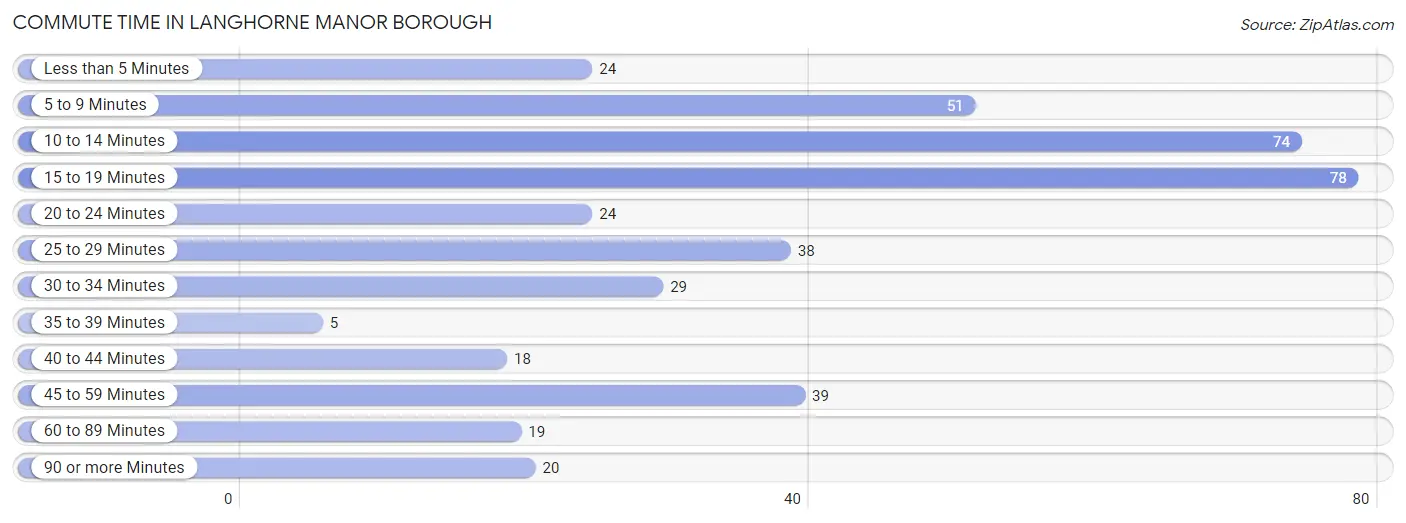
| Commute Time | # Commuters | % Commuters |
| Less than 5 Minutes | 24 | 5.7% |
| 5 to 9 Minutes | 51 | 12.2% |
| 10 to 14 Minutes | 74 | 17.7% |
| 15 to 19 Minutes | 78 | 18.6% |
| 20 to 24 Minutes | 24 | 5.7% |
| 25 to 29 Minutes | 38 | 9.1% |
| 30 to 34 Minutes | 29 | 6.9% |
| 35 to 39 Minutes | 5 | 1.2% |
| 40 to 44 Minutes | 18 | 4.3% |
| 45 to 59 Minutes | 39 | 9.3% |
| 60 to 89 Minutes | 19 | 4.5% |
| 90 or more Minutes | 20 | 4.8% |
Commute Time by Sex in Langhorne Manor borough
The most common commute times in Langhorne Manor borough are 10 to 14 minutes (44 commuters, 18.0%) for males and 15 to 19 minutes (41 commuters, 23.4%) for females.
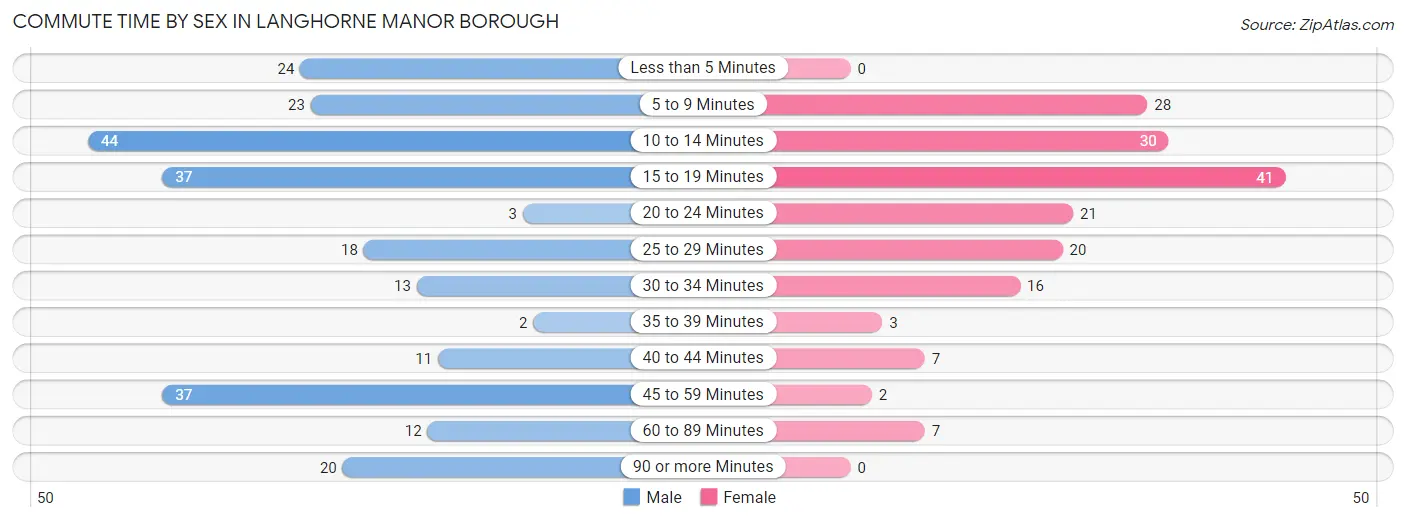
| Commute Time | Male | Female |
| Less than 5 Minutes | 24 (9.8%) | 0 (0.0%) |
| 5 to 9 Minutes | 23 (9.4%) | 28 (16.0%) |
| 10 to 14 Minutes | 44 (18.0%) | 30 (17.1%) |
| 15 to 19 Minutes | 37 (15.2%) | 41 (23.4%) |
| 20 to 24 Minutes | 3 (1.2%) | 21 (12.0%) |
| 25 to 29 Minutes | 18 (7.4%) | 20 (11.4%) |
| 30 to 34 Minutes | 13 (5.3%) | 16 (9.1%) |
| 35 to 39 Minutes | 2 (0.8%) | 3 (1.7%) |
| 40 to 44 Minutes | 11 (4.5%) | 7 (4.0%) |
| 45 to 59 Minutes | 37 (15.2%) | 2 (1.1%) |
| 60 to 89 Minutes | 12 (4.9%) | 7 (4.0%) |
| 90 or more Minutes | 20 (8.2%) | 0 (0.0%) |
Time of Departure to Work by Sex in Langhorne Manor borough
The most frequent times of departure to work in Langhorne Manor borough are 6:00 AM to 6:29 AM (45, 18.4%) for males and 6:30 AM to 6:59 AM (49, 28.0%) for females.
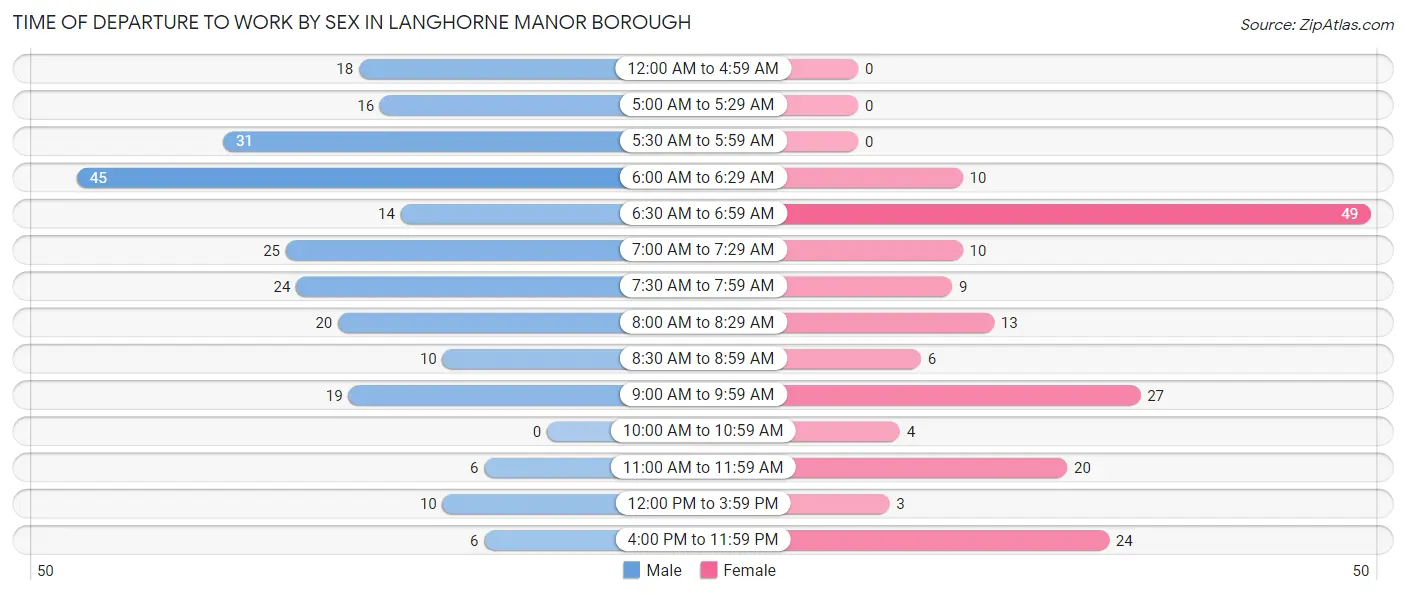
| Time of Departure | Male | Female |
| 12:00 AM to 4:59 AM | 18 (7.4%) | 0 (0.0%) |
| 5:00 AM to 5:29 AM | 16 (6.6%) | 0 (0.0%) |
| 5:30 AM to 5:59 AM | 31 (12.7%) | 0 (0.0%) |
| 6:00 AM to 6:29 AM | 45 (18.4%) | 10 (5.7%) |
| 6:30 AM to 6:59 AM | 14 (5.7%) | 49 (28.0%) |
| 7:00 AM to 7:29 AM | 25 (10.2%) | 10 (5.7%) |
| 7:30 AM to 7:59 AM | 24 (9.8%) | 9 (5.1%) |
| 8:00 AM to 8:29 AM | 20 (8.2%) | 13 (7.4%) |
| 8:30 AM to 8:59 AM | 10 (4.1%) | 6 (3.4%) |
| 9:00 AM to 9:59 AM | 19 (7.8%) | 27 (15.4%) |
| 10:00 AM to 10:59 AM | 0 (0.0%) | 4 (2.3%) |
| 11:00 AM to 11:59 AM | 6 (2.5%) | 20 (11.4%) |
| 12:00 PM to 3:59 PM | 10 (4.1%) | 3 (1.7%) |
| 4:00 PM to 11:59 PM | 6 (2.5%) | 24 (13.7%) |
| Total | 244 (100.0%) | 175 (100.0%) |
Housing Occupancy in Langhorne Manor borough
Occupancy by Ownership in Langhorne Manor borough
Of the total 289 dwellings in Langhorne Manor borough, owner-occupied units account for 234 (81.0%), while renter-occupied units make up 55 (19.0%).
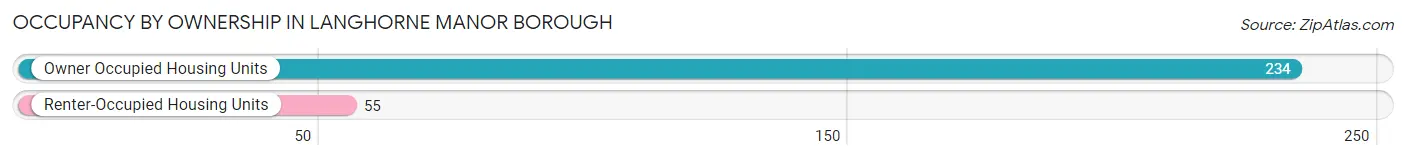
| Occupancy | # Housing Units | % Housing Units |
| Owner Occupied Housing Units | 234 | 81.0% |
| Renter-Occupied Housing Units | 55 | 19.0% |
| Total Occupied Housing Units | 289 | 100.0% |
Occupancy by Household Size in Langhorne Manor borough
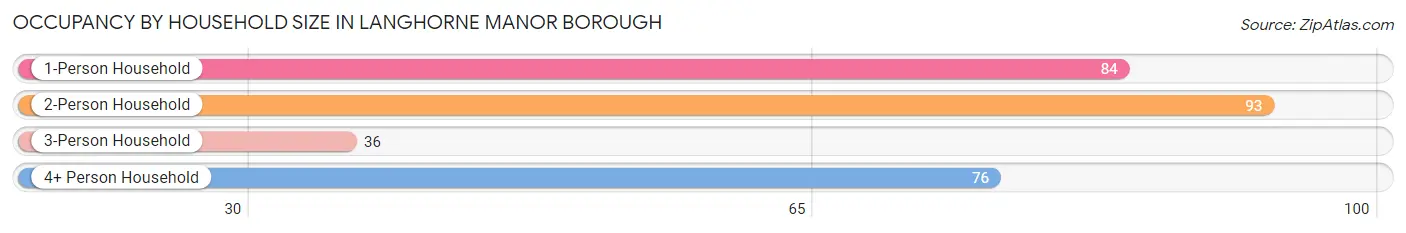
| Household Size | # Housing Units | % Housing Units |
| 1-Person Household | 84 | 29.1% |
| 2-Person Household | 93 | 32.2% |
| 3-Person Household | 36 | 12.5% |
| 4+ Person Household | 76 | 26.3% |
| Total Housing Units | 289 | 100.0% |
Occupancy by Ownership by Household Size in Langhorne Manor borough
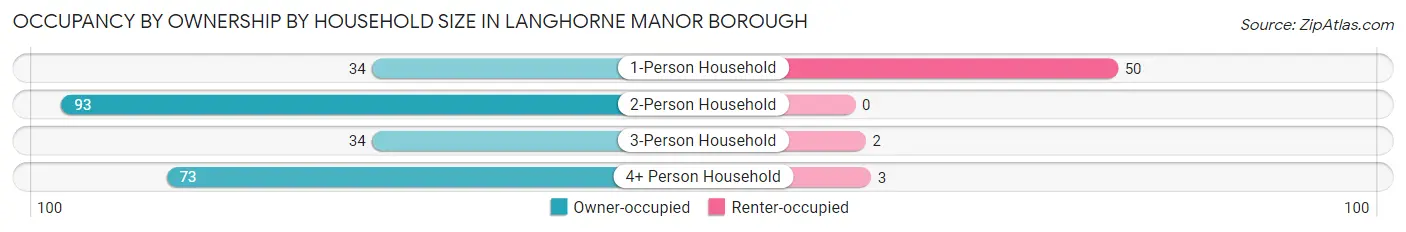
| Household Size | Owner-occupied | Renter-occupied |
| 1-Person Household | 34 (40.5%) | 50 (59.5%) |
| 2-Person Household | 93 (100.0%) | 0 (0.0%) |
| 3-Person Household | 34 (94.4%) | 2 (5.6%) |
| 4+ Person Household | 73 (96.1%) | 3 (4.0%) |
| Total Housing Units | 234 (81.0%) | 55 (19.0%) |
Occupancy by Educational Attainment in Langhorne Manor borough
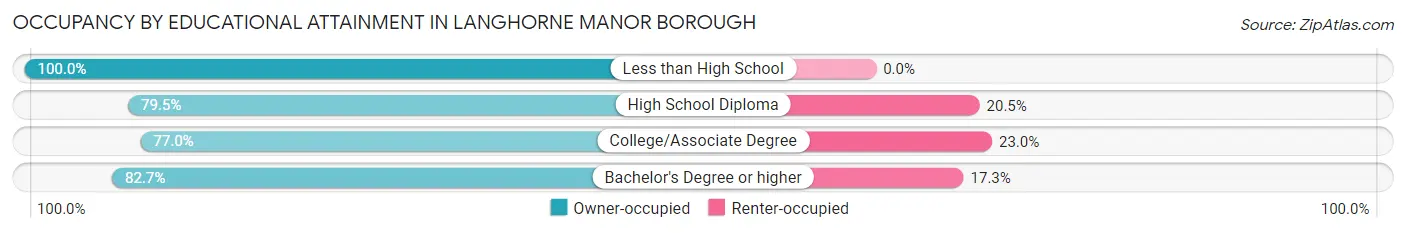
| Household Size | Owner-occupied | Renter-occupied |
| Less than High School | 3 (100.0%) | 0 (0.0%) |
| High School Diploma | 31 (79.5%) | 8 (20.5%) |
| College/Associate Degree | 57 (77.0%) | 17 (23.0%) |
| Bachelor's Degree or higher | 143 (82.7%) | 30 (17.3%) |
Occupancy by Age of Householder in Langhorne Manor borough
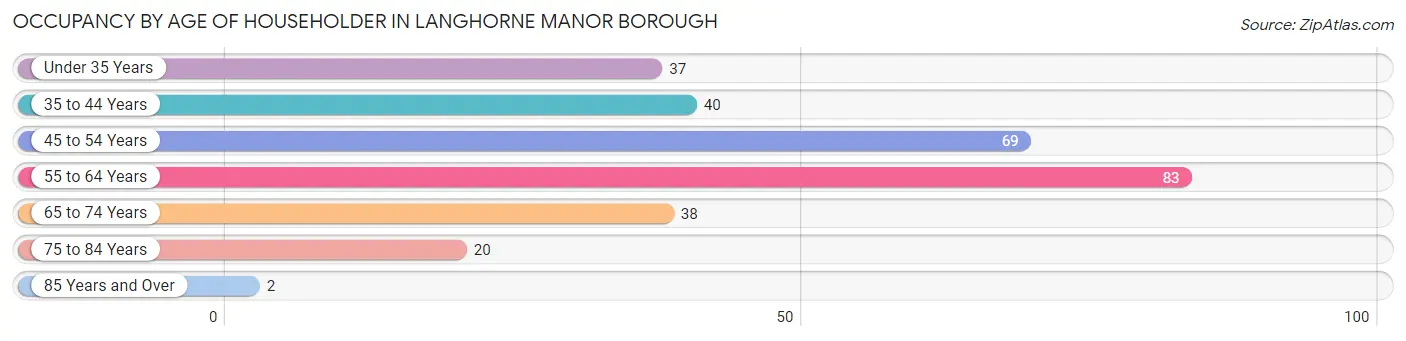
| Age Bracket | # Households | % Households |
| Under 35 Years | 37 | 12.8% |
| 35 to 44 Years | 40 | 13.8% |
| 45 to 54 Years | 69 | 23.9% |
| 55 to 64 Years | 83 | 28.7% |
| 65 to 74 Years | 38 | 13.2% |
| 75 to 84 Years | 20 | 6.9% |
| 85 Years and Over | 2 | 0.7% |
| Total | 289 | 100.0% |
Housing Finances in Langhorne Manor borough
Median Income by Occupancy in Langhorne Manor borough
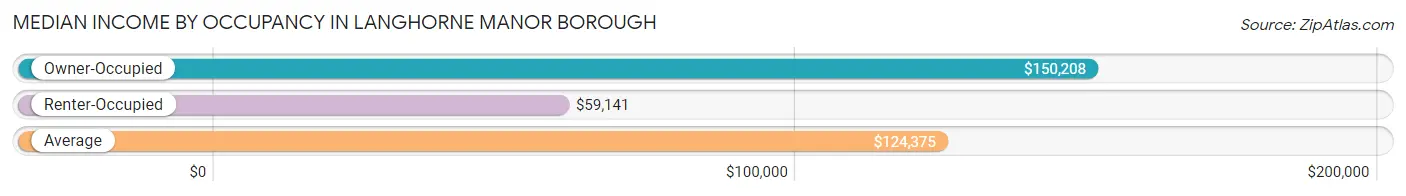
| Occupancy Type | # Households | Median Income |
| Owner-Occupied | 234 (81.0%) | $150,208 |
| Renter-Occupied | 55 (19.0%) | $59,141 |
| Average | 289 (100.0%) | $124,375 |
Occupancy by Householder Income Bracket in Langhorne Manor borough
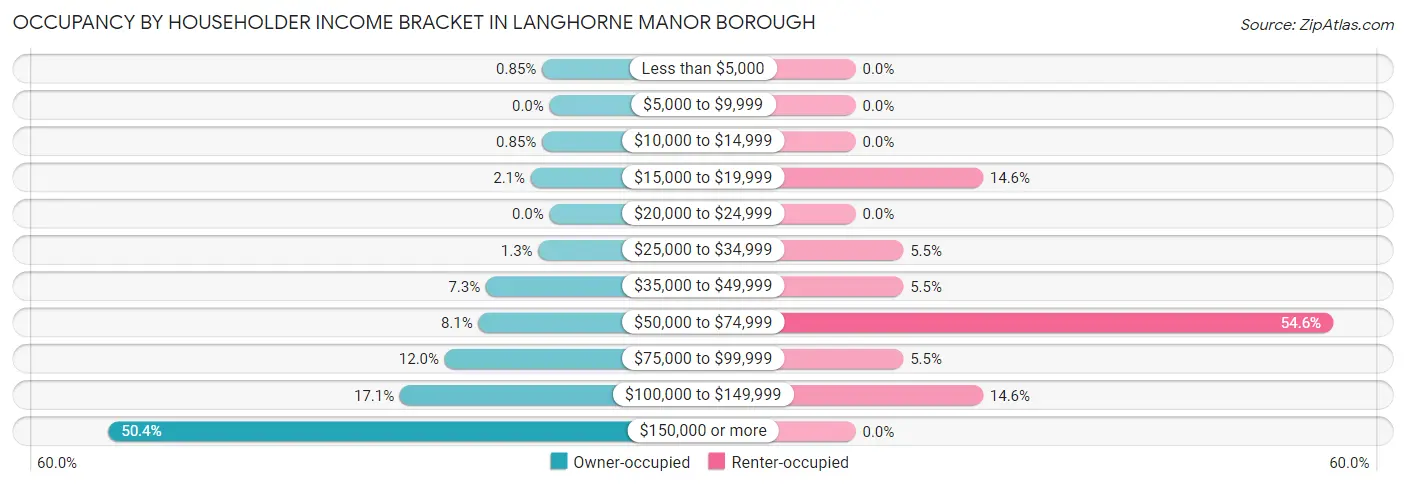
| Income Bracket | Owner-occupied | Renter-occupied |
| Less than $5,000 | 2 (0.9%) | 0 (0.0%) |
| $5,000 to $9,999 | 0 (0.0%) | 0 (0.0%) |
| $10,000 to $14,999 | 2 (0.9%) | 0 (0.0%) |
| $15,000 to $19,999 | 5 (2.1%) | 8 (14.5%) |
| $20,000 to $24,999 | 0 (0.0%) | 0 (0.0%) |
| $25,000 to $34,999 | 3 (1.3%) | 3 (5.4%) |
| $35,000 to $49,999 | 17 (7.3%) | 3 (5.4%) |
| $50,000 to $74,999 | 19 (8.1%) | 30 (54.5%) |
| $75,000 to $99,999 | 28 (12.0%) | 3 (5.4%) |
| $100,000 to $149,999 | 40 (17.1%) | 8 (14.5%) |
| $150,000 or more | 118 (50.4%) | 0 (0.0%) |
| Total | 234 (100.0%) | 55 (100.0%) |
Monthly Housing Cost Tiers in Langhorne Manor borough
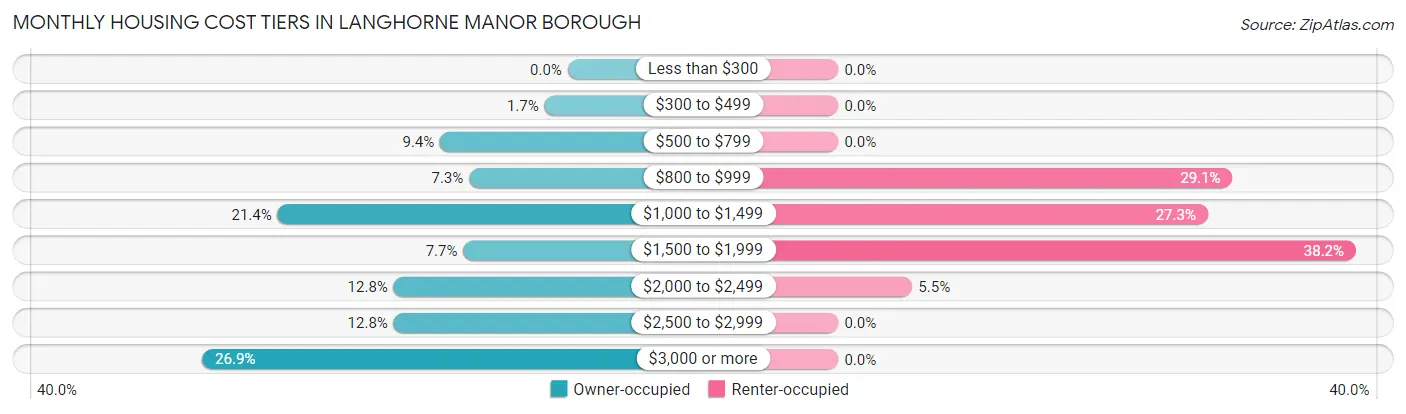
| Monthly Cost | Owner-occupied | Renter-occupied |
| Less than $300 | 0 (0.0%) | 0 (0.0%) |
| $300 to $499 | 4 (1.7%) | 0 (0.0%) |
| $500 to $799 | 22 (9.4%) | 0 (0.0%) |
| $800 to $999 | 17 (7.3%) | 16 (29.1%) |
| $1,000 to $1,499 | 50 (21.4%) | 15 (27.3%) |
| $1,500 to $1,999 | 18 (7.7%) | 21 (38.2%) |
| $2,000 to $2,499 | 30 (12.8%) | 3 (5.4%) |
| $2,500 to $2,999 | 30 (12.8%) | 0 (0.0%) |
| $3,000 or more | 63 (26.9%) | 0 (0.0%) |
| Total | 234 (100.0%) | 55 (100.0%) |
Physical Housing Characteristics in Langhorne Manor borough
Housing Structures in Langhorne Manor borough
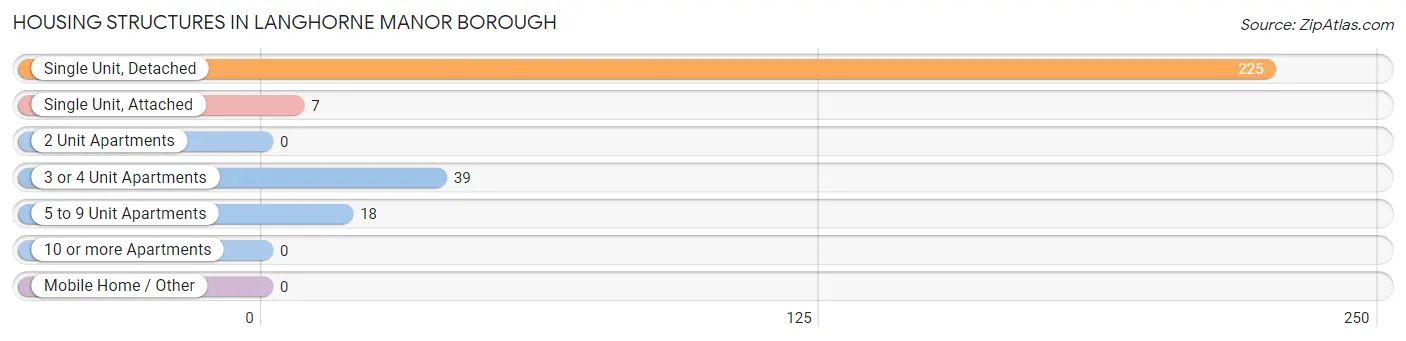
| Structure Type | # Housing Units | % Housing Units |
| Single Unit, Detached | 225 | 77.8% |
| Single Unit, Attached | 7 | 2.4% |
| 2 Unit Apartments | 0 | 0.0% |
| 3 or 4 Unit Apartments | 39 | 13.5% |
| 5 to 9 Unit Apartments | 18 | 6.2% |
| 10 or more Apartments | 0 | 0.0% |
| Mobile Home / Other | 0 | 0.0% |
| Total | 289 | 100.0% |
Housing Structures by Occupancy in Langhorne Manor borough
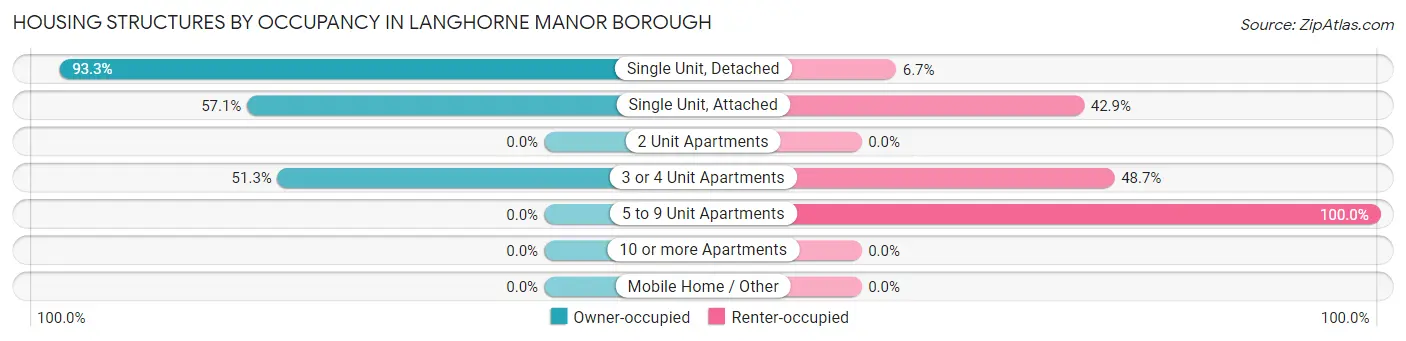
| Structure Type | Owner-occupied | Renter-occupied |
| Single Unit, Detached | 210 (93.3%) | 15 (6.7%) |
| Single Unit, Attached | 4 (57.1%) | 3 (42.9%) |
| 2 Unit Apartments | 0 (0.0%) | 0 (0.0%) |
| 3 or 4 Unit Apartments | 20 (51.3%) | 19 (48.7%) |
| 5 to 9 Unit Apartments | 0 (0.0%) | 18 (100.0%) |
| 10 or more Apartments | 0 (0.0%) | 0 (0.0%) |
| Mobile Home / Other | 0 (0.0%) | 0 (0.0%) |
| Total | 234 (81.0%) | 55 (19.0%) |
Housing Structures by Number of Rooms in Langhorne Manor borough
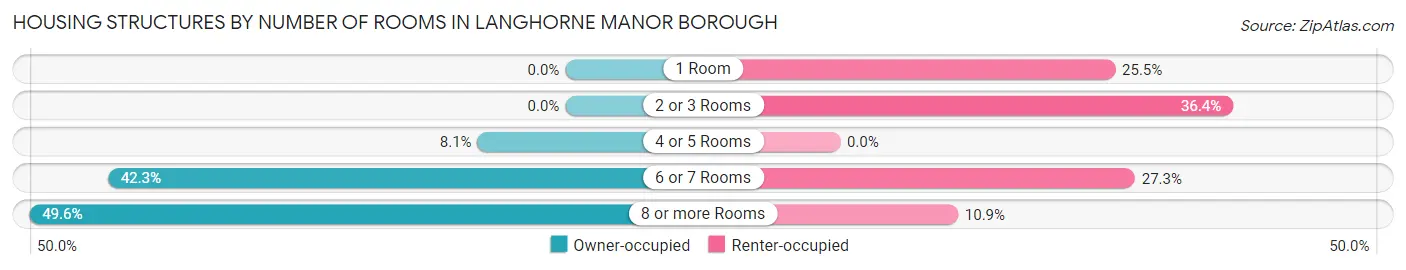
| Number of Rooms | Owner-occupied | Renter-occupied |
| 1 Room | 0 (0.0%) | 14 (25.5%) |
| 2 or 3 Rooms | 0 (0.0%) | 20 (36.4%) |
| 4 or 5 Rooms | 19 (8.1%) | 0 (0.0%) |
| 6 or 7 Rooms | 99 (42.3%) | 15 (27.3%) |
| 8 or more Rooms | 116 (49.6%) | 6 (10.9%) |
| Total | 234 (100.0%) | 55 (100.0%) |
Housing Structure by Heating Type in Langhorne Manor borough
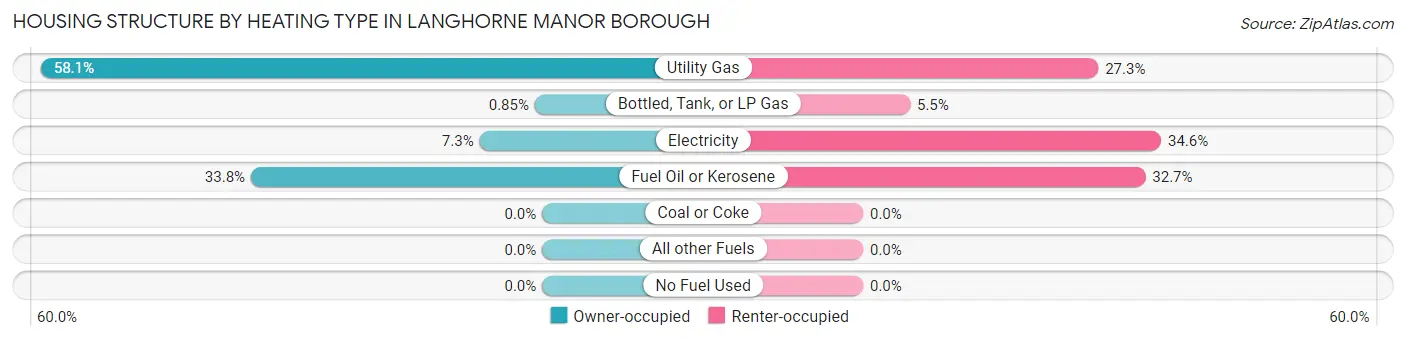
| Heating Type | Owner-occupied | Renter-occupied |
| Utility Gas | 136 (58.1%) | 15 (27.3%) |
| Bottled, Tank, or LP Gas | 2 (0.9%) | 3 (5.4%) |
| Electricity | 17 (7.3%) | 19 (34.5%) |
| Fuel Oil or Kerosene | 79 (33.8%) | 18 (32.7%) |
| Coal or Coke | 0 (0.0%) | 0 (0.0%) |
| All other Fuels | 0 (0.0%) | 0 (0.0%) |
| No Fuel Used | 0 (0.0%) | 0 (0.0%) |
| Total | 234 (100.0%) | 55 (100.0%) |
Household Vehicle Usage in Langhorne Manor borough
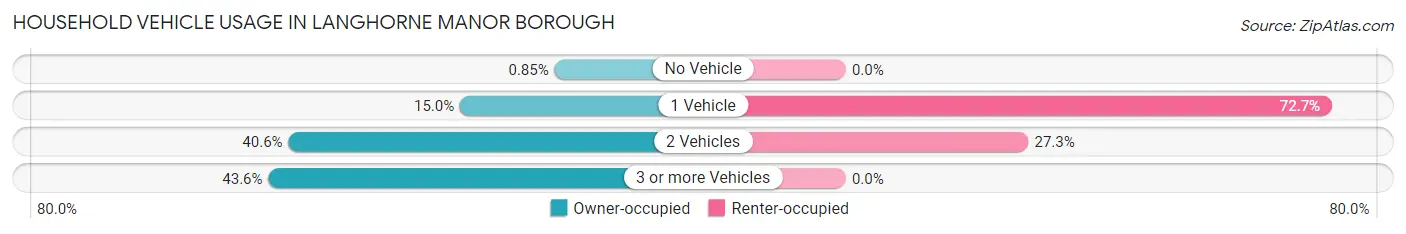
| Vehicles per Household | Owner-occupied | Renter-occupied |
| No Vehicle | 2 (0.9%) | 0 (0.0%) |
| 1 Vehicle | 35 (15.0%) | 40 (72.7%) |
| 2 Vehicles | 95 (40.6%) | 15 (27.3%) |
| 3 or more Vehicles | 102 (43.6%) | 0 (0.0%) |
| Total | 234 (100.0%) | 55 (100.0%) |
Real Estate & Mortgages in Langhorne Manor borough
Real Estate and Mortgage Overview in Langhorne Manor borough
| Characteristic | Without Mortgage | With Mortgage |
| Housing Units | 90 | 144 |
| Median Property Value | $472,000 | $476,600 |
| Median Household Income | $102,500 | $90 |
| Monthly Housing Costs | $1,009 | $63 |
| Real Estate Taxes | $6,532 | $0 |
Property Value by Mortgage Status in Langhorne Manor borough
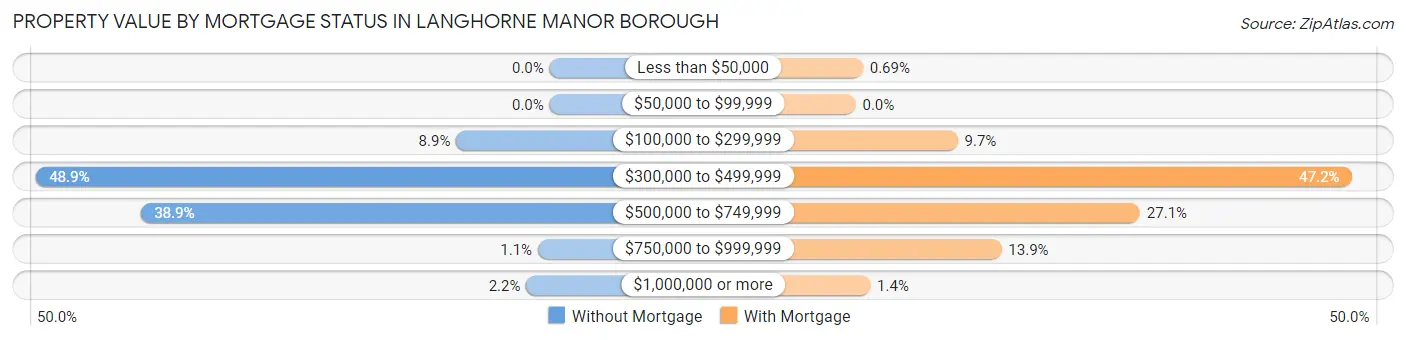
| Property Value | Without Mortgage | With Mortgage |
| Less than $50,000 | 0 (0.0%) | 1 (0.7%) |
| $50,000 to $99,999 | 0 (0.0%) | 0 (0.0%) |
| $100,000 to $299,999 | 8 (8.9%) | 14 (9.7%) |
| $300,000 to $499,999 | 44 (48.9%) | 68 (47.2%) |
| $500,000 to $749,999 | 35 (38.9%) | 39 (27.1%) |
| $750,000 to $999,999 | 1 (1.1%) | 20 (13.9%) |
| $1,000,000 or more | 2 (2.2%) | 2 (1.4%) |
| Total | 90 (100.0%) | 144 (100.0%) |
Household Income by Mortgage Status in Langhorne Manor borough
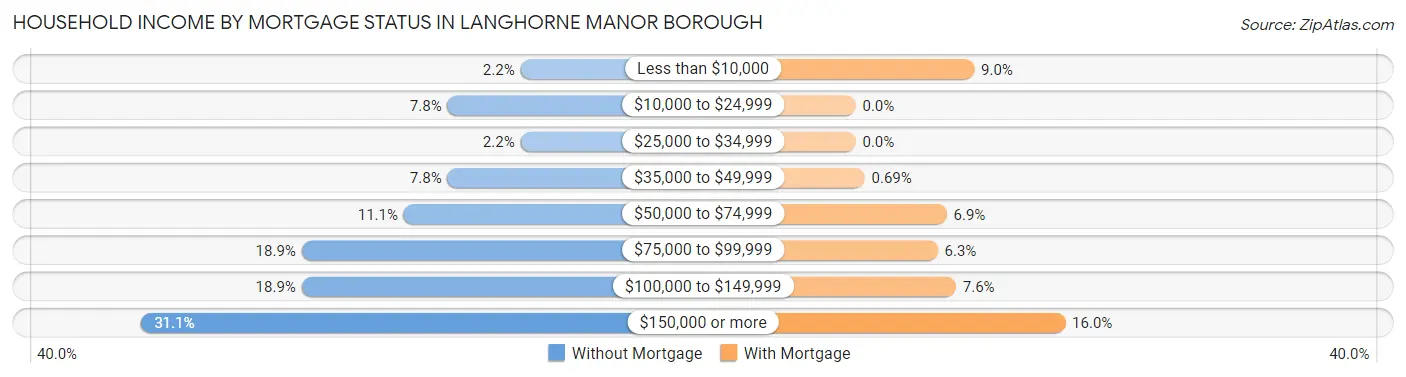
| Household Income | Without Mortgage | With Mortgage |
| Less than $10,000 | 2 (2.2%) | 13 (9.0%) |
| $10,000 to $24,999 | 7 (7.8%) | 0 (0.0%) |
| $25,000 to $34,999 | 2 (2.2%) | 0 (0.0%) |
| $35,000 to $49,999 | 7 (7.8%) | 1 (0.7%) |
| $50,000 to $74,999 | 10 (11.1%) | 10 (6.9%) |
| $75,000 to $99,999 | 17 (18.9%) | 9 (6.2%) |
| $100,000 to $149,999 | 17 (18.9%) | 11 (7.6%) |
| $150,000 or more | 28 (31.1%) | 23 (16.0%) |
| Total | 90 (100.0%) | 144 (100.0%) |
Property Value to Household Income Ratio in Langhorne Manor borough
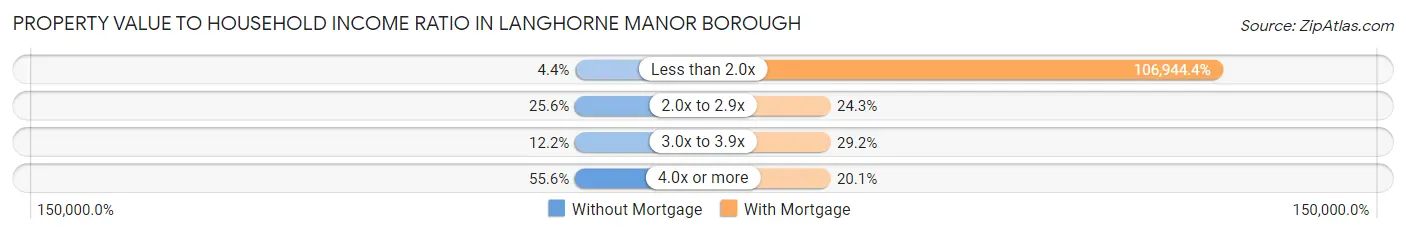
| Value-to-Income Ratio | Without Mortgage | With Mortgage |
| Less than 2.0x | 4 (4.4%) | 154,000 (106,944.4%) |
| 2.0x to 2.9x | 23 (25.6%) | 35 (24.3%) |
| 3.0x to 3.9x | 11 (12.2%) | 42 (29.2%) |
| 4.0x or more | 50 (55.6%) | 29 (20.1%) |
| Total | 90 (100.0%) | 144 (100.0%) |
Real Estate Taxes by Mortgage Status in Langhorne Manor borough
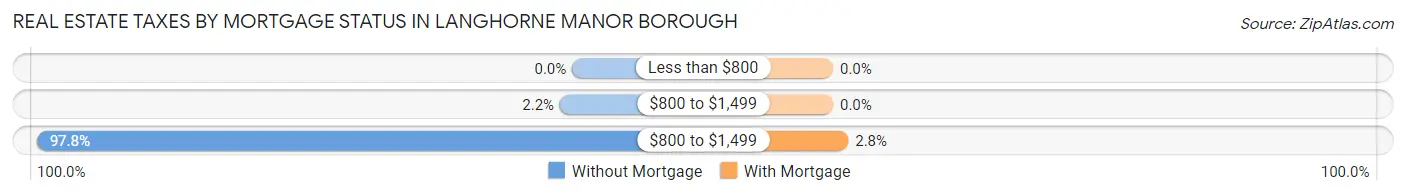
| Property Taxes | Without Mortgage | With Mortgage |
| Less than $800 | 0 (0.0%) | 0 (0.0%) |
| $800 to $1,499 | 2 (2.2%) | 0 (0.0%) |
| $800 to $1,499 | 88 (97.8%) | 4 (2.8%) |
| Total | 90 (100.0%) | 144 (100.0%) |
Health & Disability in Langhorne Manor borough
Health Insurance Coverage by Age in Langhorne Manor borough
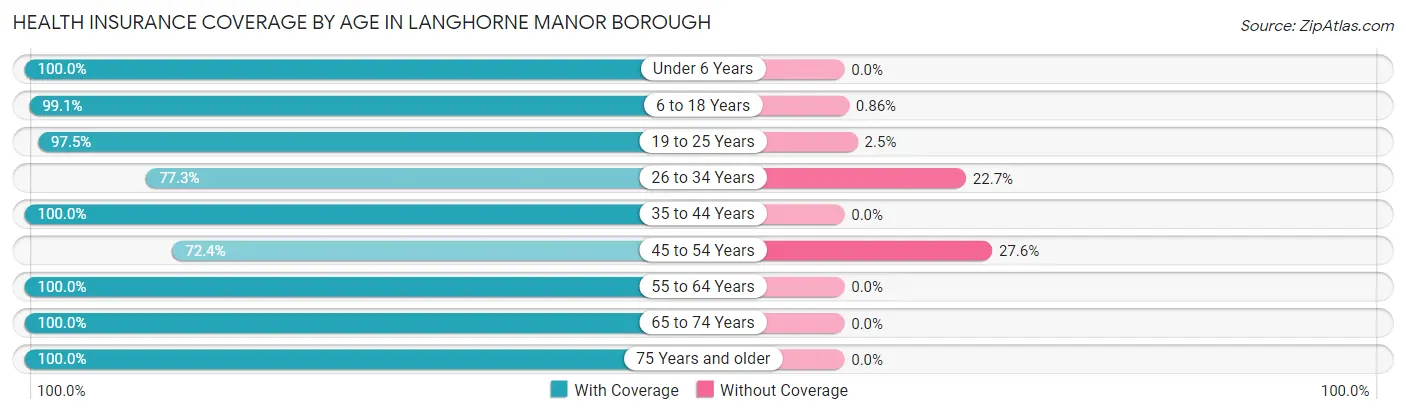
| Age Bracket | With Coverage | Without Coverage |
| Under 6 Years | 36 (100.0%) | 0 (0.0%) |
| 6 to 18 Years | 231 (99.1%) | 2 (0.9%) |
| 19 to 25 Years | 469 (97.5%) | 12 (2.5%) |
| 26 to 34 Years | 75 (77.3%) | 22 (22.7%) |
| 35 to 44 Years | 103 (100.0%) | 0 (0.0%) |
| 45 to 54 Years | 92 (72.4%) | 35 (27.6%) |
| 55 to 64 Years | 163 (100.0%) | 0 (0.0%) |
| 65 to 74 Years | 78 (100.0%) | 0 (0.0%) |
| 75 Years and older | 35 (100.0%) | 0 (0.0%) |
| Total | 1,282 (94.8%) | 71 (5.2%) |
Health Insurance Coverage by Citizenship Status in Langhorne Manor borough
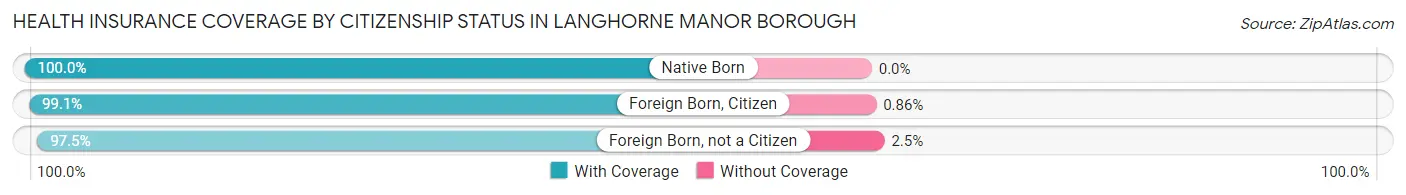
| Citizenship Status | With Coverage | Without Coverage |
| Native Born | 36 (100.0%) | 0 (0.0%) |
| Foreign Born, Citizen | 231 (99.1%) | 2 (0.9%) |
| Foreign Born, not a Citizen | 469 (97.5%) | 12 (2.5%) |
Health Insurance Coverage by Household Income in Langhorne Manor borough
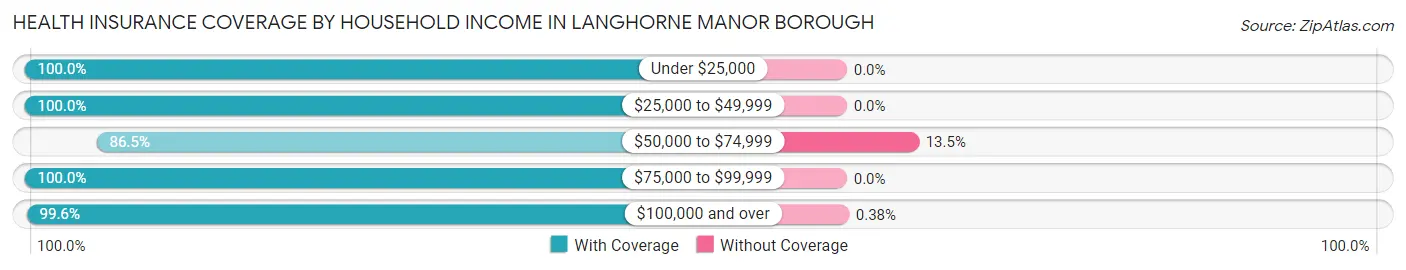
| Household Income | With Coverage | Without Coverage |
| Under $25,000 | 19 (100.0%) | 0 (0.0%) |
| $25,000 to $49,999 | 38 (100.0%) | 0 (0.0%) |
| $50,000 to $74,999 | 77 (86.5%) | 12 (13.5%) |
| $75,000 to $99,999 | 48 (100.0%) | 0 (0.0%) |
| $100,000 and over | 530 (99.6%) | 2 (0.4%) |
Public vs Private Health Insurance Coverage by Age in Langhorne Manor borough
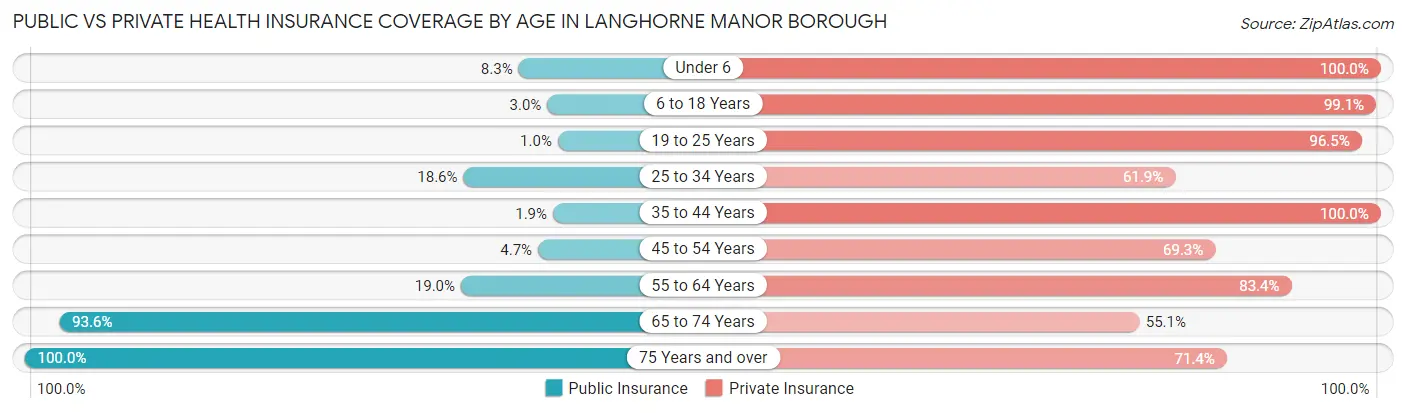
| Age Bracket | Public Insurance | Private Insurance |
| Under 6 | 3 (8.3%) | 36 (100.0%) |
| 6 to 18 Years | 7 (3.0%) | 231 (99.1%) |
| 19 to 25 Years | 5 (1.0%) | 464 (96.5%) |
| 25 to 34 Years | 18 (18.6%) | 60 (61.9%) |
| 35 to 44 Years | 2 (1.9%) | 103 (100.0%) |
| 45 to 54 Years | 6 (4.7%) | 88 (69.3%) |
| 55 to 64 Years | 31 (19.0%) | 136 (83.4%) |
| 65 to 74 Years | 73 (93.6%) | 43 (55.1%) |
| 75 Years and over | 35 (100.0%) | 25 (71.4%) |
| Total | 180 (13.3%) | 1,186 (87.7%) |
Disability Status by Sex by Age in Langhorne Manor borough
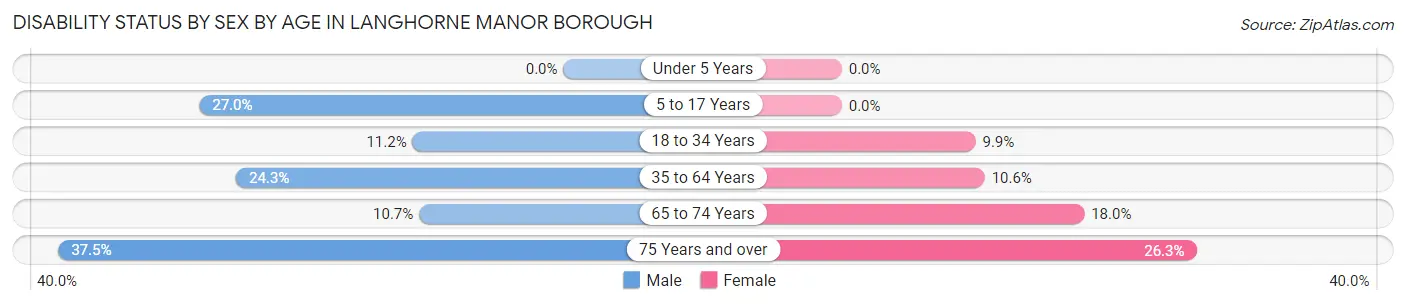
| Age Bracket | Male | Female |
| Under 5 Years | 0 (0.0%) | 0 (0.0%) |
| 5 to 17 Years | 10 (27.0%) | 0 (0.0%) |
| 18 to 34 Years | 43 (11.2%) | 28 (9.9%) |
| 35 to 64 Years | 52 (24.3%) | 19 (10.6%) |
| 65 to 74 Years | 3 (10.7%) | 9 (18.0%) |
| 75 Years and over | 6 (37.5%) | 5 (26.3%) |
Disability Class by Sex by Age in Langhorne Manor borough
Disability Class: Hearing Difficulty
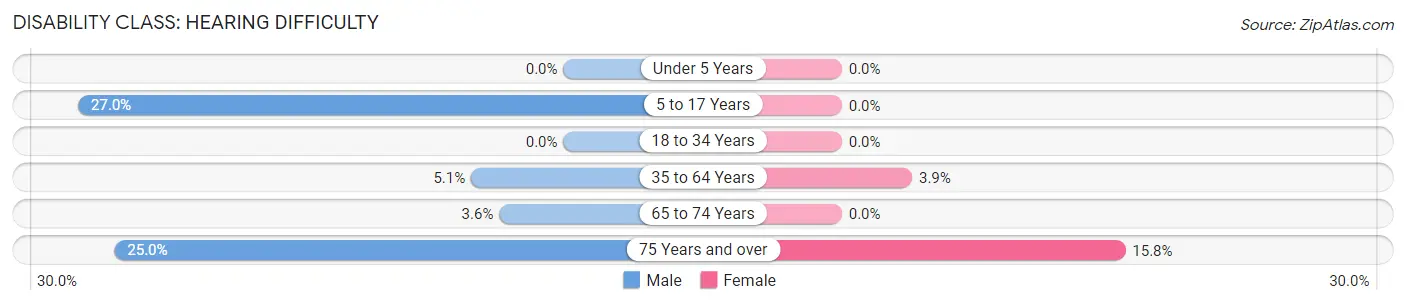
| Age Bracket | Male | Female |
| Under 5 Years | 0 (0.0%) | 0 (0.0%) |
| 5 to 17 Years | 10 (27.0%) | 0 (0.0%) |
| 18 to 34 Years | 0 (0.0%) | 0 (0.0%) |
| 35 to 64 Years | 11 (5.1%) | 7 (3.9%) |
| 65 to 74 Years | 1 (3.6%) | 0 (0.0%) |
| 75 Years and over | 4 (25.0%) | 3 (15.8%) |
Disability Class: Vision Difficulty
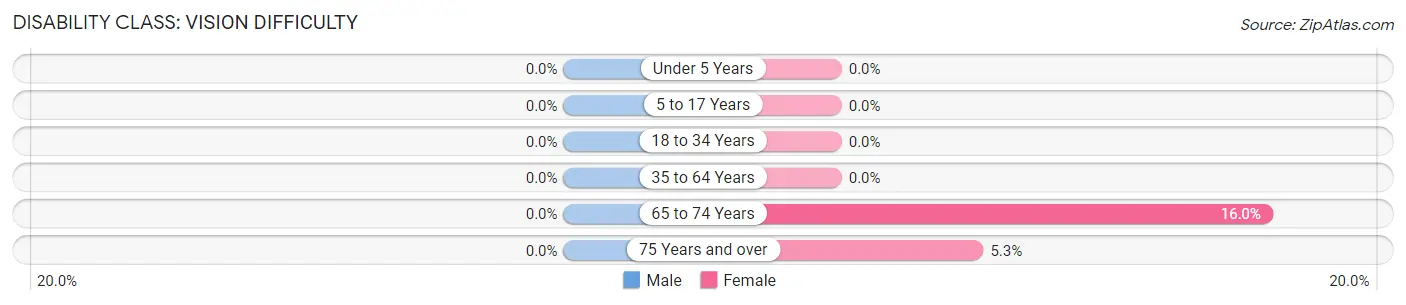
| Age Bracket | Male | Female |
| Under 5 Years | 0 (0.0%) | 0 (0.0%) |
| 5 to 17 Years | 0 (0.0%) | 0 (0.0%) |
| 18 to 34 Years | 0 (0.0%) | 0 (0.0%) |
| 35 to 64 Years | 0 (0.0%) | 0 (0.0%) |
| 65 to 74 Years | 0 (0.0%) | 8 (16.0%) |
| 75 Years and over | 0 (0.0%) | 1 (5.3%) |
Disability Class: Cognitive Difficulty
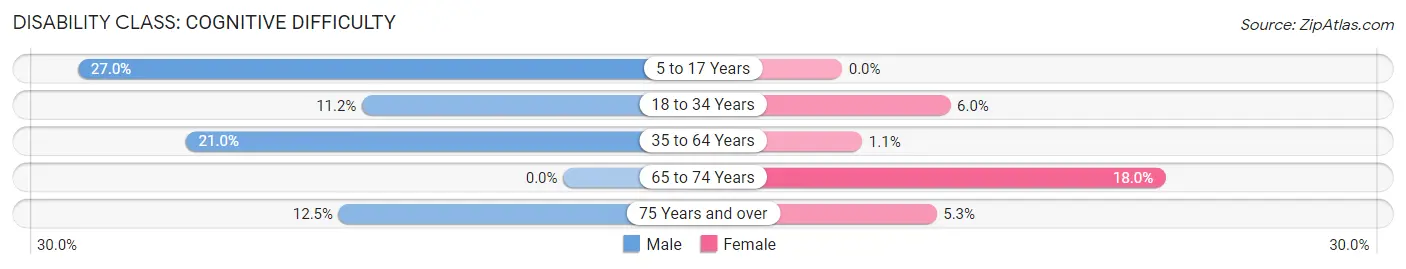
| Age Bracket | Male | Female |
| 5 to 17 Years | 10 (27.0%) | 0 (0.0%) |
| 18 to 34 Years | 43 (11.2%) | 17 (6.0%) |
| 35 to 64 Years | 45 (21.0%) | 2 (1.1%) |
| 65 to 74 Years | 0 (0.0%) | 9 (18.0%) |
| 75 Years and over | 2 (12.5%) | 1 (5.3%) |
Disability Class: Ambulatory Difficulty
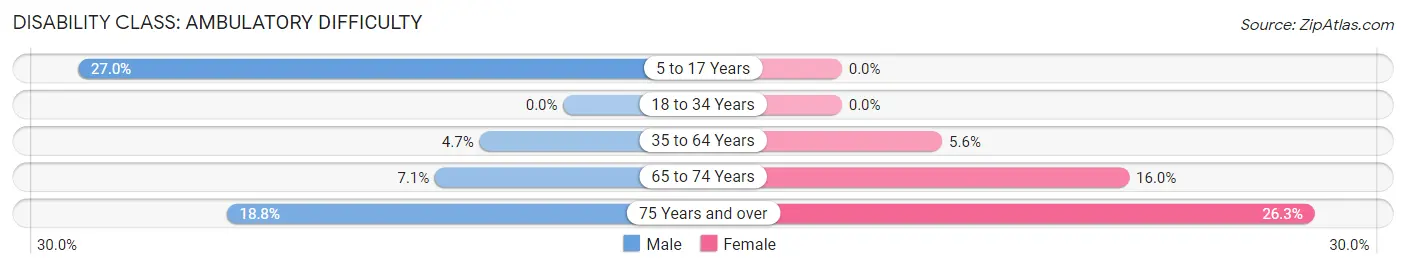
| Age Bracket | Male | Female |
| 5 to 17 Years | 10 (27.0%) | 0 (0.0%) |
| 18 to 34 Years | 0 (0.0%) | 0 (0.0%) |
| 35 to 64 Years | 10 (4.7%) | 10 (5.6%) |
| 65 to 74 Years | 2 (7.1%) | 8 (16.0%) |
| 75 Years and over | 3 (18.8%) | 5 (26.3%) |
Disability Class: Self-Care Difficulty
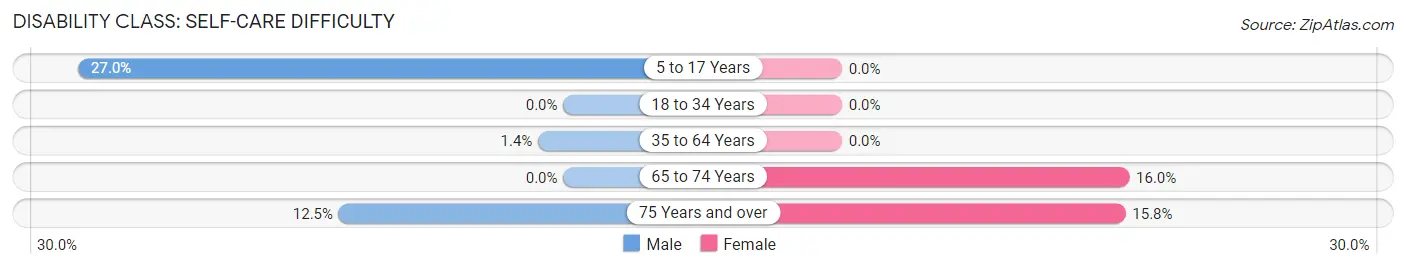
| Age Bracket | Male | Female |
| 5 to 17 Years | 10 (27.0%) | 0 (0.0%) |
| 18 to 34 Years | 0 (0.0%) | 0 (0.0%) |
| 35 to 64 Years | 3 (1.4%) | 0 (0.0%) |
| 65 to 74 Years | 0 (0.0%) | 8 (16.0%) |
| 75 Years and over | 2 (12.5%) | 3 (15.8%) |
Technology Access in Langhorne Manor borough
Computing Device Access in Langhorne Manor borough
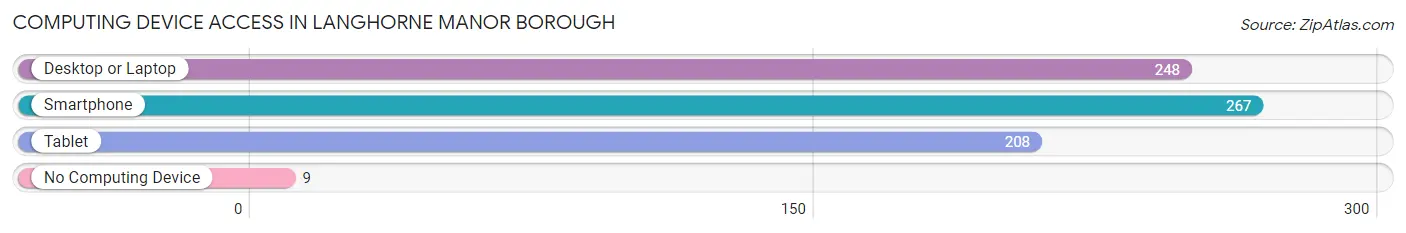
| Device Type | # Households | % Households |
| Desktop or Laptop | 248 | 85.8% |
| Smartphone | 267 | 92.4% |
| Tablet | 208 | 72.0% |
| No Computing Device | 9 | 3.1% |
| Total | 289 | 100.0% |
Internet Access in Langhorne Manor borough
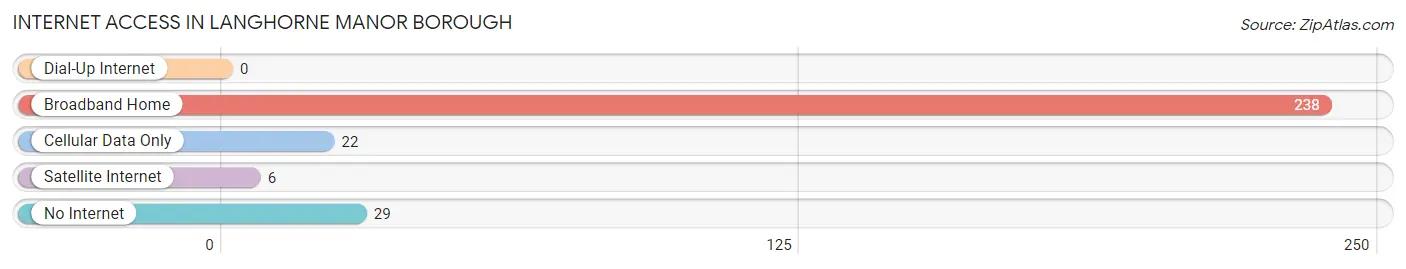
| Internet Type | # Households | % Households |
| Dial-Up Internet | 0 | 0.0% |
| Broadband Home | 238 | 82.4% |
| Cellular Data Only | 22 | 7.6% |
| Satellite Internet | 6 | 2.1% |
| No Internet | 29 | 10.0% |
| Total | 289 | 100.0% |
Langhorne Manor borough Summary
Langhorne Manor Borough is a small borough located in Bucks County, Pennsylvania. It is situated in the northeast corner of the county, just south of the city of Philadelphia. The borough is bordered by Middletown Township to the north, Lower Southampton Township to the east, and Bristol Township to the south and west. The population of Langhorne Manor Borough was 2,845 at the 2010 census.
History
Langhorne Manor Borough was originally part of Middletown Township, which was established in 1692. The area was first settled in the early 1700s by Quakers from England. The first recorded deed in the area was in 1717, when William Biles purchased land from William Penn. The area was known as Bilesburg until the early 1800s, when it was renamed Langhorne Manor after the Langhorne family, who had purchased the land in 1790.
The Langhorne Manor Borough was officially incorporated in 1927. The borough was created in order to provide better services to the residents of the area, such as water, sewer, and police protection. The borough was also created to prevent the area from being annexed by the city of Philadelphia.
Geography
Langhorne Manor Borough is located at 40°10'45" North, 74°54'45" West (40.179167, -74.912500). According to the United States Census Bureau, the borough has a total area of 0.7 square miles (1.8 km2), all of it land.
The borough is located in the northeast corner of Bucks County, just south of the city of Philadelphia. It is bordered by Middletown Township to the north, Lower Southampton Township to the east, and Bristol Township to the south and west.
Economy
The economy of Langhorne Manor Borough is largely based on retail and services. The borough is home to several small businesses, including restaurants, convenience stores, and auto repair shops. The borough also has a few larger employers, such as the Langhorne Manor Shopping Center and the Langhorne Manor Industrial Park.
Demographics
As of the 2010 census, there were 2,845 people, 1,093 households, and 745 families residing in the borough. The population density was 4,093.3 people per square mile (1,579.2/km2). There were 1,164 housing units at an average density of 1,664.3 per square mile (642.2/km2). The racial makeup of the borough was 92.2% White, 3.2% African American, 0.2% Native American, 1.3% Asian, 0.1% Pacific Islander, 1.2% from other races, and 2.0% from two or more races. Hispanic or Latino of any race were 3.7% of the population.
There were 1,093 households, out of which 28.2% had children under the age of 18 living with them, 51.2% were married couples living together, 11.2% had a female householder with no husband present, and 32.7% were non-families. 27.2% of all households were made up of individuals, and 11.2% had someone living alone who was 65 years of age or older. The average household size was 2.60 and the average family size was 3.17.
In the borough, the population was spread out, with 22.7% under the age of 18, 7.2% from 18 to 24, 28.2% from 25 to 44, 25.7% from 45 to 64, and 16.2% who were 65 years of age or older. The median age was 40 years. For every 100 females, there were 94.2 males. For every 100 females age 18 and over, there were 91.2 males.
The median income for a household in the borough was $50,938, and the median income for a family was $60,000. Males had a median income of $41,250 versus $30,938 for females. The per capita income for the borough was $23,945. About 4.2% of families and 5.7% of the population were below the poverty line, including 6.3% of those under age 18 and 5.2% of those age 65 or over.
Common Questions
What is Per Capita Income in Langhorne Manor borough?
Per Capita income in Langhorne Manor borough is $29,594.
What is the Median Family Income in Langhorne Manor borough?
Median Family Income in Langhorne Manor borough is $154,750.
What is the Median Household income in Langhorne Manor borough?
Median Household Income in Langhorne Manor borough is $124,375.
What is Income or Wage Gap in Langhorne Manor borough?
Income or Wage Gap in Langhorne Manor borough is 58.1%.
Women in Langhorne Manor borough earn 41.9 cents for every dollar earned by a man.
What is Inequality or Gini Index in Langhorne Manor borough?
Inequality or Gini Index in Langhorne Manor borough is 0.38.
What is the Total Population of Langhorne Manor borough?
Total Population of Langhorne Manor borough is 1,563.
What is the Total Male Population of Langhorne Manor borough?
Total Male Population of Langhorne Manor borough is 790.
What is the Total Female Population of Langhorne Manor borough?
Total Female Population of Langhorne Manor borough is 773.
What is the Ratio of Males per 100 Females in Langhorne Manor borough?
There are 102.20 Males per 100 Females in Langhorne Manor borough.
What is the Ratio of Females per 100 Males in Langhorne Manor borough?
There are 97.85 Females per 100 Males in Langhorne Manor borough.
What is the Median Population Age in Langhorne Manor borough?
Median Population Age in Langhorne Manor borough is 28.4 Years.
What is the Average Family Size in Langhorne Manor borough
Average Family Size in Langhorne Manor borough is 3.2 People.
What is the Average Household Size in Langhorne Manor borough
Average Household Size in Langhorne Manor borough is 2.6 People.
How Large is the Labor Force in Langhorne Manor borough?
There are 664 People in the Labor Forcein in Langhorne Manor borough.
What is the Percentage of People in the Labor Force in Langhorne Manor borough?
46.8% of People are in the Labor Force in Langhorne Manor borough.
What is the Unemployment Rate in Langhorne Manor borough?
Unemployment Rate in Langhorne Manor borough is 9.0%.