East Lansdowne borough, PA Map & Demographics
East Lansdowne borough Overview
$32,312
PER CAPITA INCOME
$74,150
AVG FAMILY INCOME
$57,778
AVG HOUSEHOLD INCOME
36.0%
WAGE / INCOME GAP [ % ]
64.0¢/ $1
WAGE / INCOME GAP [ $ ]
0.47
INEQUALITY / GINI INDEX
2,703
TOTAL POPULATION
1,251
MALE POPULATION
1,452
FEMALE POPULATION
86.16
MALES / 100 FEMALES
116.07
FEMALES / 100 MALES
35.1
MEDIAN AGE
3.4
AVG FAMILY SIZE
2.3
AVG HOUSEHOLD SIZE
1,687
LABOR FORCE [ PEOPLE ]
74.9%
PERCENT IN LABOR FORCE
10.1%
UNEMPLOYMENT RATE
Income in East Lansdowne borough
Income Overview in East Lansdowne borough
Per Capita Income in East Lansdowne borough is $32,312, while median incomes of families and households are $74,150 and $57,778 respectively.
| Characteristic | Number | Measure |
| Per Capita Income | 2,703 | $32,312 |
| Median Family Income | 549 | $74,150 |
| Mean Family Income | 549 | $91,267 |
| Median Household Income | 1,188 | $57,778 |
| Mean Household Income | 1,188 | $69,279 |
| Income Deficit | 549 | $0 |
| Wage / Income Gap (%) | 2,703 | 35.96% |
| Wage / Income Gap ($) | 2,703 | 64.04¢ per $1 |
| Gini / Inequality Index | 2,703 | 0.47 |
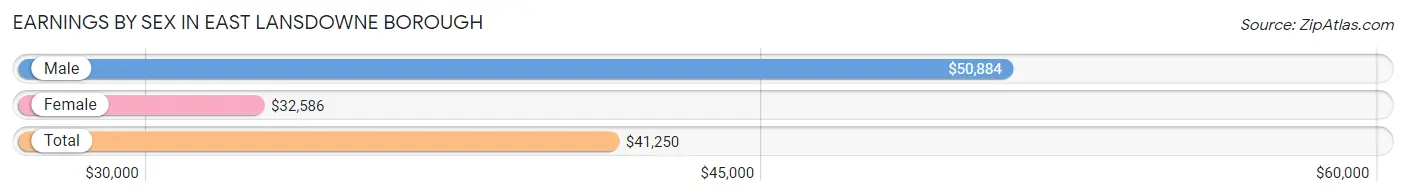
Earnings by Sex in East Lansdowne borough
Average Earnings in East Lansdowne borough are $41,250, $50,884 for men and $32,586 for women, a difference of 36.0%.
| Sex | Number | Average Earnings |
| Male | 673 (43.1%) | $50,884 |
| Female | 888 (56.9%) | $32,586 |
| Total | 1,561 (100.0%) | $41,250 |
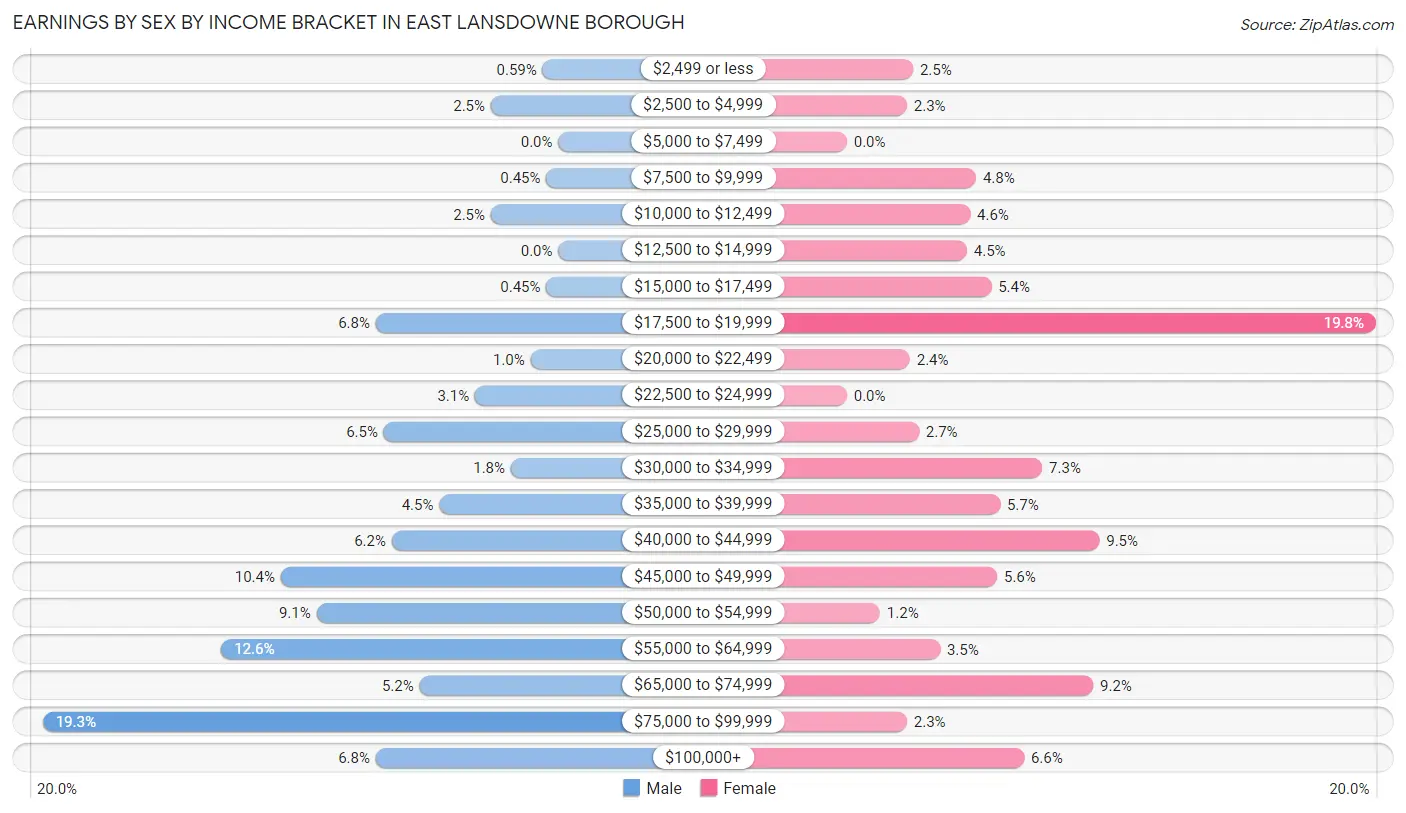
Earnings by Sex by Income Bracket in East Lansdowne borough
The most common earnings brackets in East Lansdowne borough are $75,000 to $99,999 for men (130 | 19.3%) and $17,500 to $19,999 for women (176 | 19.8%).
| Income | Male | Female |
| $2,499 or less | 4 (0.6%) | 22 (2.5%) |
| $2,500 to $4,999 | 17 (2.5%) | 20 (2.2%) |
| $5,000 to $7,499 | 0 (0.0%) | 0 (0.0%) |
| $7,500 to $9,999 | 3 (0.4%) | 43 (4.8%) |
| $10,000 to $12,499 | 17 (2.5%) | 41 (4.6%) |
| $12,500 to $14,999 | 0 (0.0%) | 40 (4.5%) |
| $15,000 to $17,499 | 3 (0.4%) | 48 (5.4%) |
| $17,500 to $19,999 | 46 (6.8%) | 176 (19.8%) |
| $20,000 to $22,499 | 7 (1.0%) | 21 (2.4%) |
| $22,500 to $24,999 | 21 (3.1%) | 0 (0.0%) |
| $25,000 to $29,999 | 44 (6.5%) | 24 (2.7%) |
| $30,000 to $34,999 | 12 (1.8%) | 65 (7.3%) |
| $35,000 to $39,999 | 30 (4.5%) | 51 (5.7%) |
| $40,000 to $44,999 | 42 (6.2%) | 84 (9.5%) |
| $45,000 to $49,999 | 70 (10.4%) | 50 (5.6%) |
| $50,000 to $54,999 | 61 (9.1%) | 11 (1.2%) |
| $55,000 to $64,999 | 85 (12.6%) | 31 (3.5%) |
| $65,000 to $74,999 | 35 (5.2%) | 82 (9.2%) |
| $75,000 to $99,999 | 130 (19.3%) | 20 (2.2%) |
| $100,000+ | 46 (6.8%) | 59 (6.6%) |
| Total | 673 (100.0%) | 888 (100.0%) |
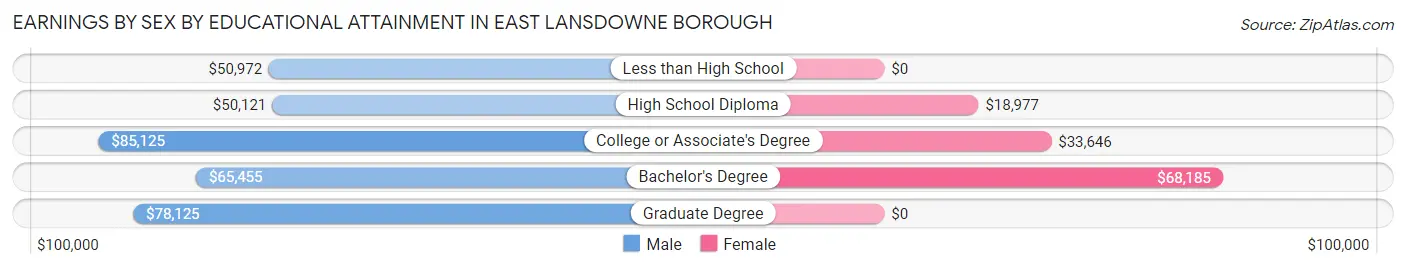
Earnings by Sex by Educational Attainment in East Lansdowne borough
Average earnings in East Lansdowne borough are $51,509 for men and $32,708 for women, a difference of 36.5%. Men with an educational attainment of college or associate's degree enjoy the highest average annual earnings of $85,125, while those with high school diploma education earn the least with $50,121. Women with an educational attainment of bachelor's degree earn the most with the average annual earnings of $68,185, while those with high school diploma education have the smallest earnings of $18,977.
| Educational Attainment | Male Income | Female Income |
| Less than High School | $50,972 | $0 |
| High School Diploma | $50,121 | $18,977 |
| College or Associate's Degree | $85,125 | $33,646 |
| Bachelor's Degree | $65,455 | $68,185 |
| Graduate Degree | $78,125 | $0 |
| Total | $51,509 | $32,708 |
Family Income in East Lansdowne borough
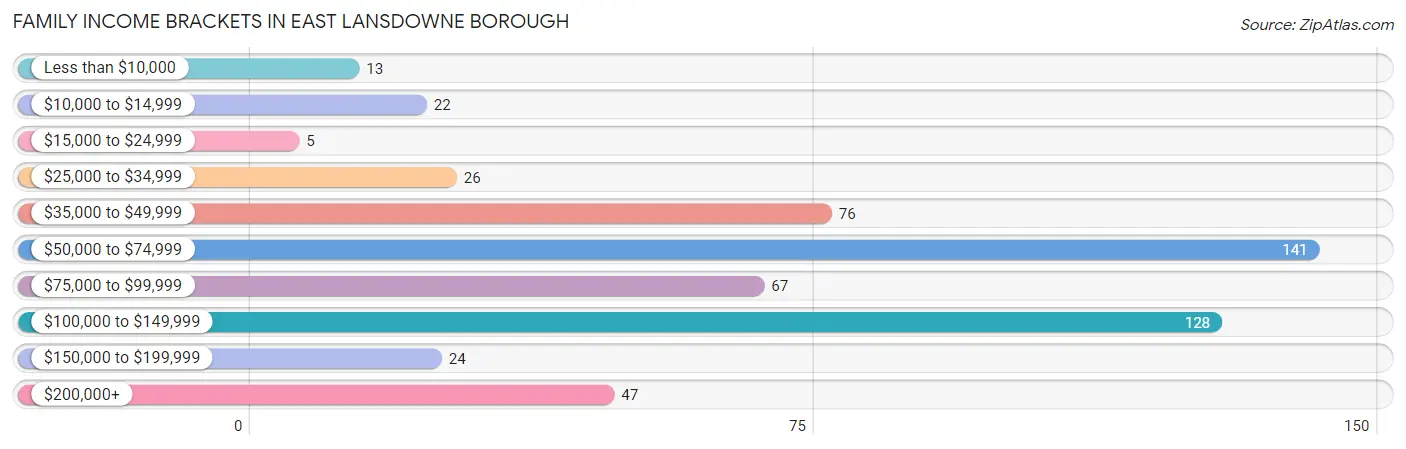
Family Income Brackets in East Lansdowne borough
According to the East Lansdowne borough family income data, there are 141 families falling into the $50,000 to $74,999 income range, which is the most common income bracket and makes up 25.7% of all families. Conversely, the $15,000 to $24,999 income bracket is the least frequent group with only 5 families (0.9%) belonging to this category.
| Income Bracket | # Families | % Families |
| Less than $10,000 | 13 | 2.4% |
| $10,000 to $14,999 | 22 | 4.0% |
| $15,000 to $24,999 | 5 | 0.9% |
| $25,000 to $34,999 | 26 | 4.7% |
| $35,000 to $49,999 | 76 | 13.8% |
| $50,000 to $74,999 | 141 | 25.7% |
| $75,000 to $99,999 | 67 | 12.2% |
| $100,000 to $149,999 | 128 | 23.3% |
| $150,000 to $199,999 | 24 | 4.4% |
| $200,000+ | 47 | 8.6% |
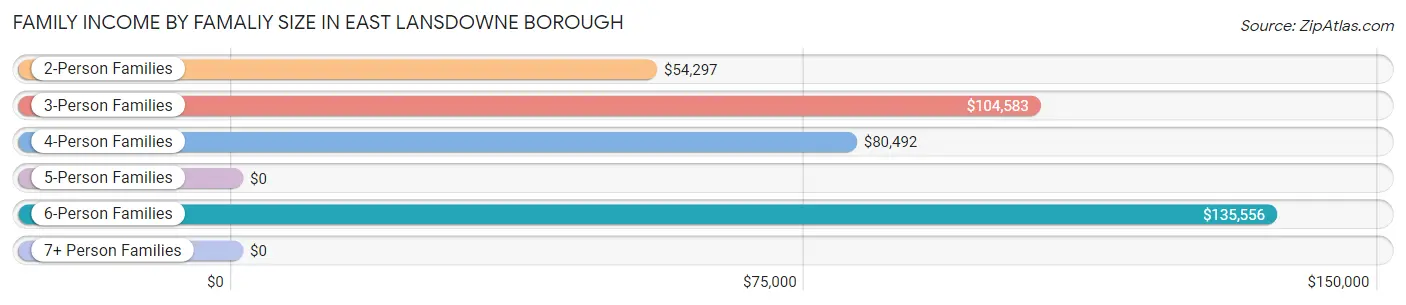
Family Income by Famaliy Size in East Lansdowne borough
6-person families (28 | 5.1%) account for the highest median family income in East Lansdowne borough with $135,556 per family, while 3-person families (175 | 31.9%) have the highest median income of $34,861 per family member.
| Income Bracket | # Families | Median Income |
| 2-Person Families | 200 (36.4%) | $54,297 |
| 3-Person Families | 175 (31.9%) | $104,583 |
| 4-Person Families | 109 (19.9%) | $80,492 |
| 5-Person Families | 37 (6.7%) | $0 |
| 6-Person Families | 28 (5.1%) | $135,556 |
| 7+ Person Families | 0 (0.0%) | $0 |
| Total | 549 (100.0%) | $74,150 |
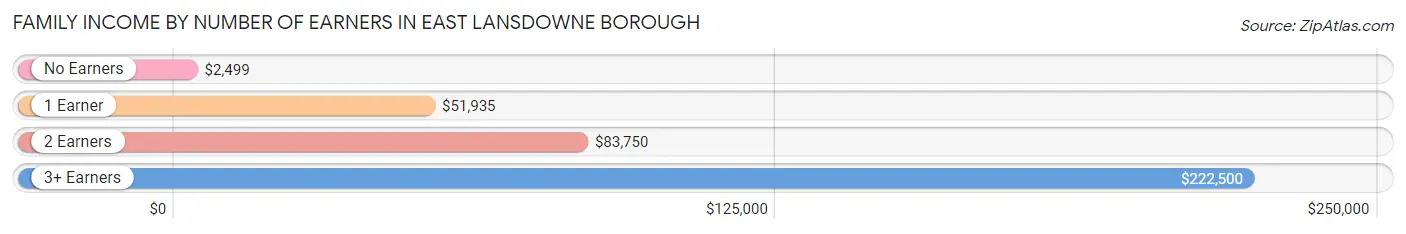
Family Income by Number of Earners in East Lansdowne borough
The median family income in East Lansdowne borough is $74,150, with families comprising 3+ earners (48) having the highest median family income of $222,500, while families with no earners (23) have the lowest median family income of $2,499, accounting for 8.7% and 4.2% of families, respectively.
| Number of Earners | # Families | Median Income |
| No Earners | 23 (4.2%) | $2,499 |
| 1 Earner | 252 (45.9%) | $51,935 |
| 2 Earners | 226 (41.2%) | $83,750 |
| 3+ Earners | 48 (8.7%) | $222,500 |
| Total | 549 (100.0%) | $74,150 |
Household Income in East Lansdowne borough
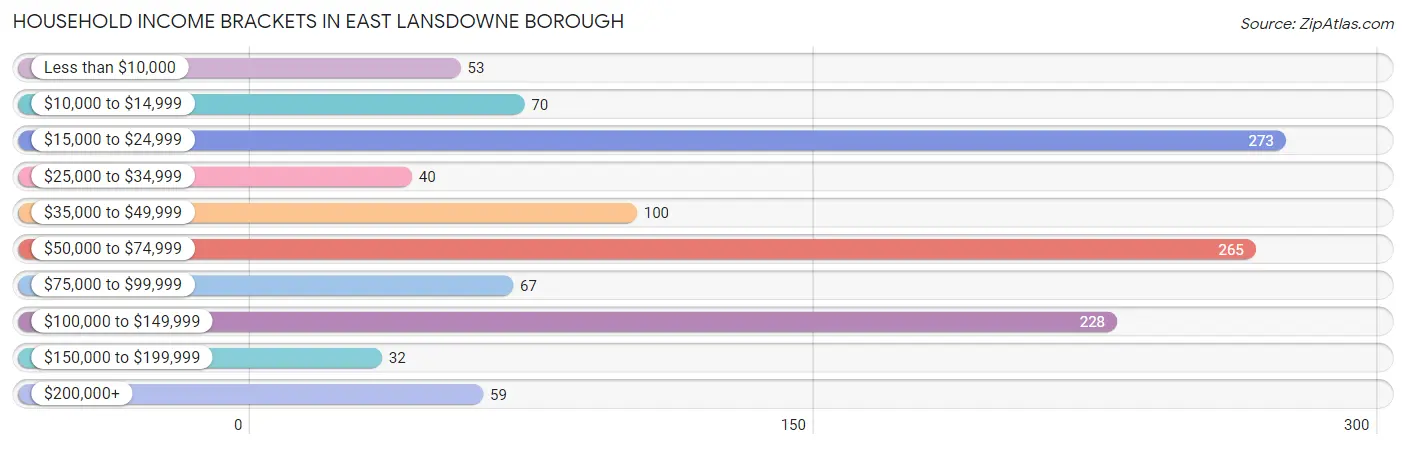
Household Income Brackets in East Lansdowne borough
With 273 households falling in the category, the $15,000 to $24,999 income range is the most frequent in East Lansdowne borough, accounting for 23.0% of all households. In contrast, only 32 households (2.7%) fall into the $150,000 to $199,999 income bracket, making it the least populous group.
| Income Bracket | # Households | % Households |
| Less than $10,000 | 53 | 4.5% |
| $10,000 to $14,999 | 70 | 5.9% |
| $15,000 to $24,999 | 273 | 23.0% |
| $25,000 to $34,999 | 40 | 3.4% |
| $35,000 to $49,999 | 100 | 8.4% |
| $50,000 to $74,999 | 265 | 22.3% |
| $75,000 to $99,999 | 67 | 5.6% |
| $100,000 to $149,999 | 228 | 19.2% |
| $150,000 to $199,999 | 32 | 2.7% |
| $200,000+ | 59 | 5.0% |
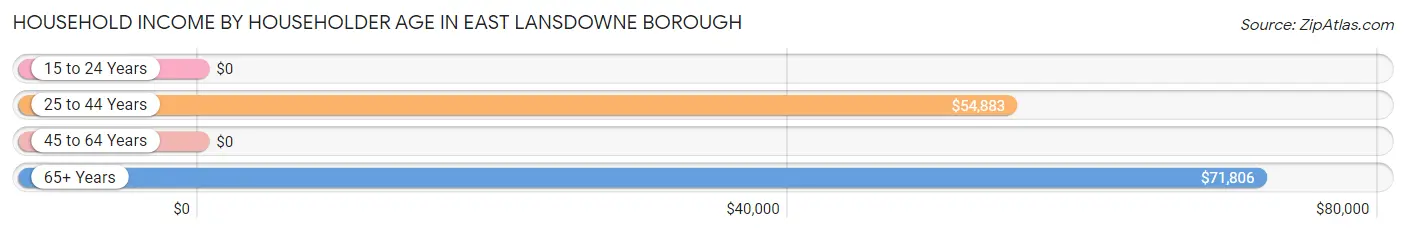
Household Income by Householder Age in East Lansdowne borough
The median household income in East Lansdowne borough is $57,778, with the highest median household income of $71,806 found in the 65+ years age bracket for the primary householder. A total of 231 households (19.4%) fall into this category.
| Income Bracket | # Households | Median Income |
| 15 to 24 Years | 0 (0.0%) | $0 |
| 25 to 44 Years | 561 (47.2%) | $54,883 |
| 45 to 64 Years | 396 (33.3%) | $0 |
| 65+ Years | 231 (19.4%) | $71,806 |
| Total | 1,188 (100.0%) | $57,778 |
Poverty in East Lansdowne borough
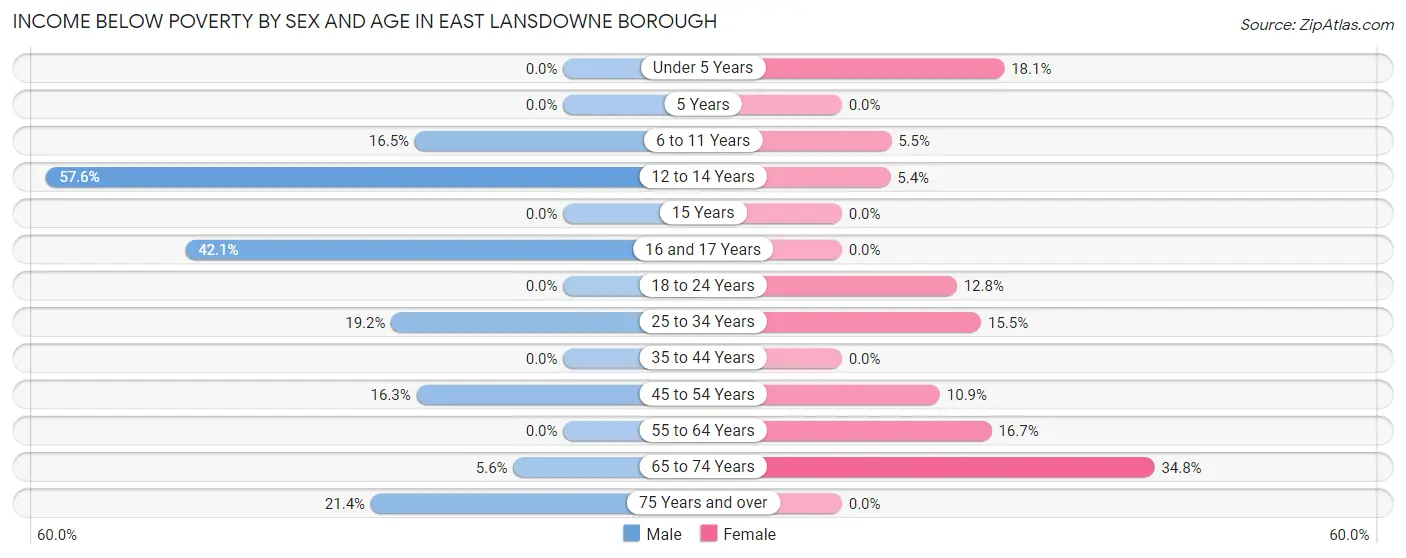
Income Below Poverty by Sex and Age in East Lansdowne borough
With 12.1% poverty level for males and 13.2% for females among the residents of East Lansdowne borough, 12 to 14 year old males and 65 to 74 year old females are the most vulnerable to poverty, with 19 males (57.6%) and 39 females (34.8%) in their respective age groups living below the poverty level.
| Age Bracket | Male | Female |
| Under 5 Years | 0 (0.0%) | 17 (18.1%) |
| 5 Years | 0 (0.0%) | 0 (0.0%) |
| 6 to 11 Years | 20 (16.5%) | 6 (5.5%) |
| 12 to 14 Years | 19 (57.6%) | 2 (5.4%) |
| 15 Years | 0 (0.0%) | 0 (0.0%) |
| 16 and 17 Years | 24 (42.1%) | 0 (0.0%) |
| 18 to 24 Years | 0 (0.0%) | 16 (12.8%) |
| 25 to 34 Years | 41 (19.2%) | 65 (15.5%) |
| 35 to 44 Years | 0 (0.0%) | 0 (0.0%) |
| 45 to 54 Years | 33 (16.3%) | 19 (10.9%) |
| 55 to 64 Years | 0 (0.0%) | 28 (16.7%) |
| 65 to 74 Years | 9 (5.6%) | 39 (34.8%) |
| 75 Years and over | 6 (21.4%) | 0 (0.0%) |
| Total | 152 (12.1%) | 192 (13.2%) |
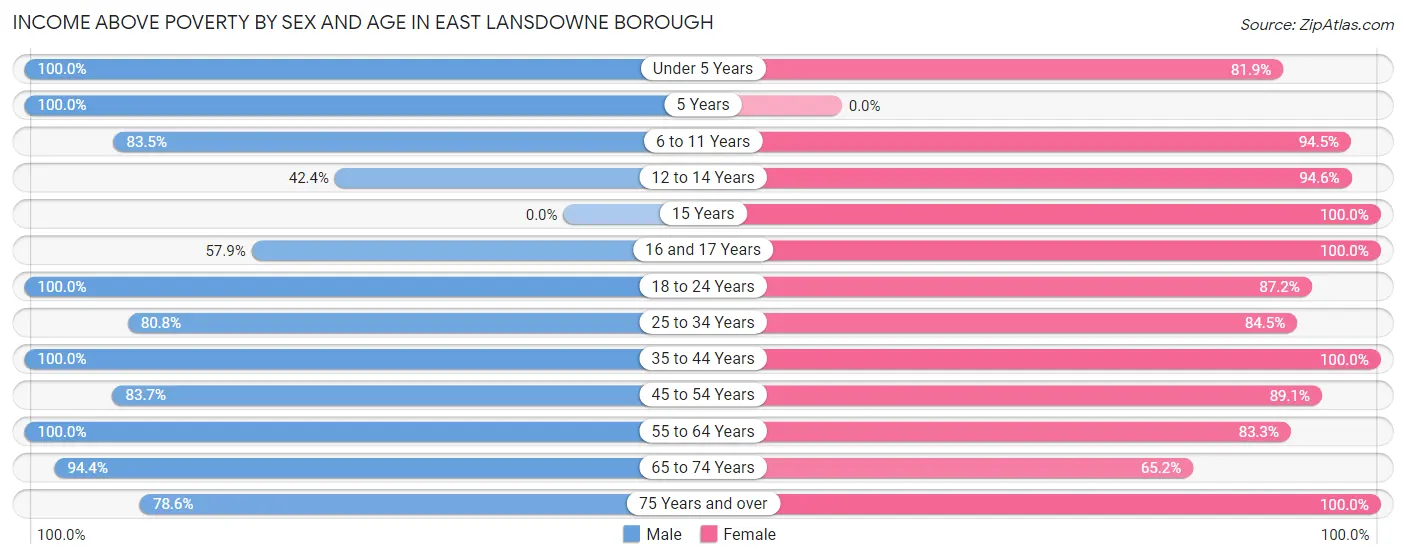
Income Above Poverty by Sex and Age in East Lansdowne borough
According to the poverty statistics in East Lansdowne borough, males aged under 5 years and females aged 15 years are the age groups that are most secure financially, with 100.0% of males and 100.0% of females in these age groups living above the poverty line.
| Age Bracket | Male | Female |
| Under 5 Years | 21 (100.0%) | 77 (81.9%) |
| 5 Years | 18 (100.0%) | 0 (0.0%) |
| 6 to 11 Years | 101 (83.5%) | 103 (94.5%) |
| 12 to 14 Years | 14 (42.4%) | 35 (94.6%) |
| 15 Years | 0 (0.0%) | 15 (100.0%) |
| 16 and 17 Years | 33 (57.9%) | 8 (100.0%) |
| 18 to 24 Years | 71 (100.0%) | 109 (87.2%) |
| 25 to 34 Years | 173 (80.8%) | 354 (84.5%) |
| 35 to 44 Years | 172 (100.0%) | 178 (100.0%) |
| 45 to 54 Years | 169 (83.7%) | 155 (89.1%) |
| 55 to 64 Years | 152 (100.0%) | 140 (83.3%) |
| 65 to 74 Years | 153 (94.4%) | 73 (65.2%) |
| 75 Years and over | 22 (78.6%) | 11 (100.0%) |
| Total | 1,099 (87.8%) | 1,258 (86.8%) |
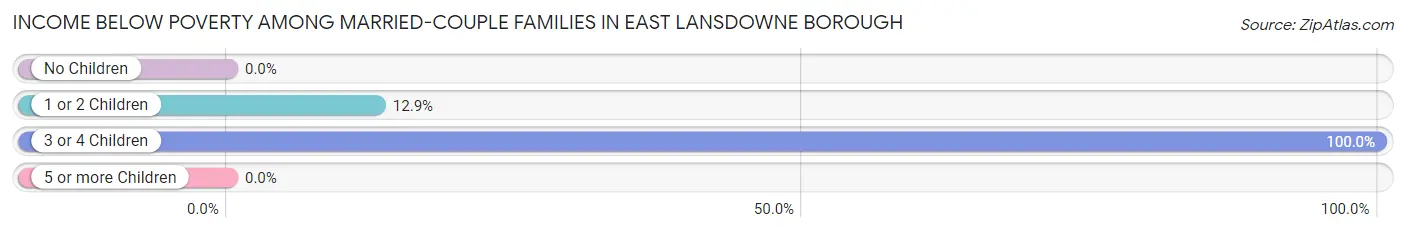
Income Below Poverty Among Married-Couple Families in East Lansdowne borough
The poverty statistics for married-couple families in East Lansdowne borough show that 8.6% or 33 of the total 382 families live below the poverty line. Families with 3 or 4 children have the highest poverty rate of 100.0%, comprising of 20 families. On the other hand, families with no children have the lowest poverty rate of 0.0%, which includes 0 families.
| Children | Above Poverty | Below Poverty |
| No Children | 261 (100.0%) | 0 (0.0%) |
| 1 or 2 Children | 88 (87.1%) | 13 (12.9%) |
| 3 or 4 Children | 0 (0.0%) | 20 (100.0%) |
| 5 or more Children | 0 (0.0%) | 0 (0.0%) |
| Total | 349 (91.4%) | 33 (8.6%) |
Income Below Poverty Among Single-Parent Households in East Lansdowne borough
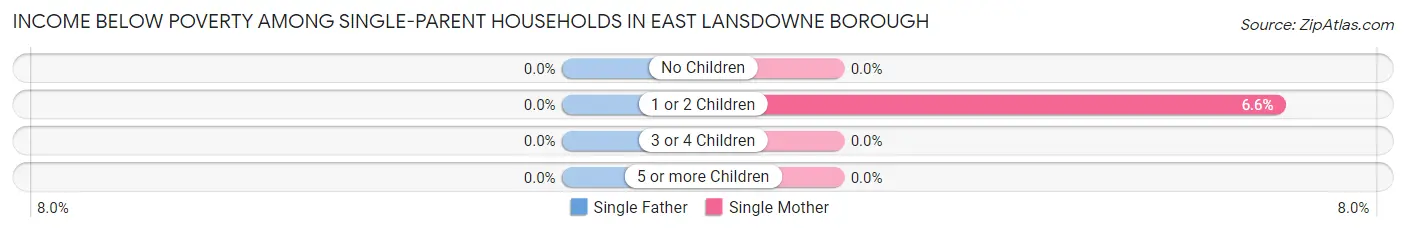
| Children | Single Father | Single Mother |
| No Children | 0 (0.0%) | 0 (0.0%) |
| 1 or 2 Children | 0 (0.0%) | 5 (6.6%) |
| 3 or 4 Children | 0 (0.0%) | 0 (0.0%) |
| 5 or more Children | 0 (0.0%) | 0 (0.0%) |
| Total | 0 (0.0%) | 5 (4.1%) |
Income Below Poverty Among Married-Couple vs Single-Parent Households in East Lansdowne borough
The poverty data for East Lansdowne borough shows that 33 of the married-couple family households (8.6%) and 5 of the single-parent households (3.0%) are living below the poverty level. Within the married-couple family households, those with 3 or 4 children have the highest poverty rate, with 20 households (100.0%) falling below the poverty line. Among the single-parent households, those with 1 or 2 children have the highest poverty rate, with 5 household (4.2%) living below poverty.
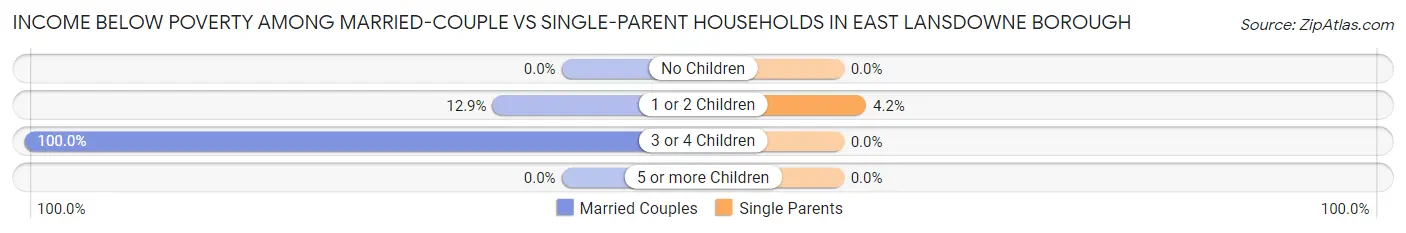
| Children | Married-Couple Families | Single-Parent Households |
| No Children | 0 (0.0%) | 0 (0.0%) |
| 1 or 2 Children | 13 (12.9%) | 5 (4.2%) |
| 3 or 4 Children | 20 (100.0%) | 0 (0.0%) |
| 5 or more Children | 0 (0.0%) | 0 (0.0%) |
| Total | 33 (8.6%) | 5 (3.0%) |
Race in East Lansdowne borough
The most populous races in East Lansdowne borough are Black / African American (1,730 | 64.0%), White / Caucasian (473 | 17.5%), and Two or more Races (259 | 9.6%).
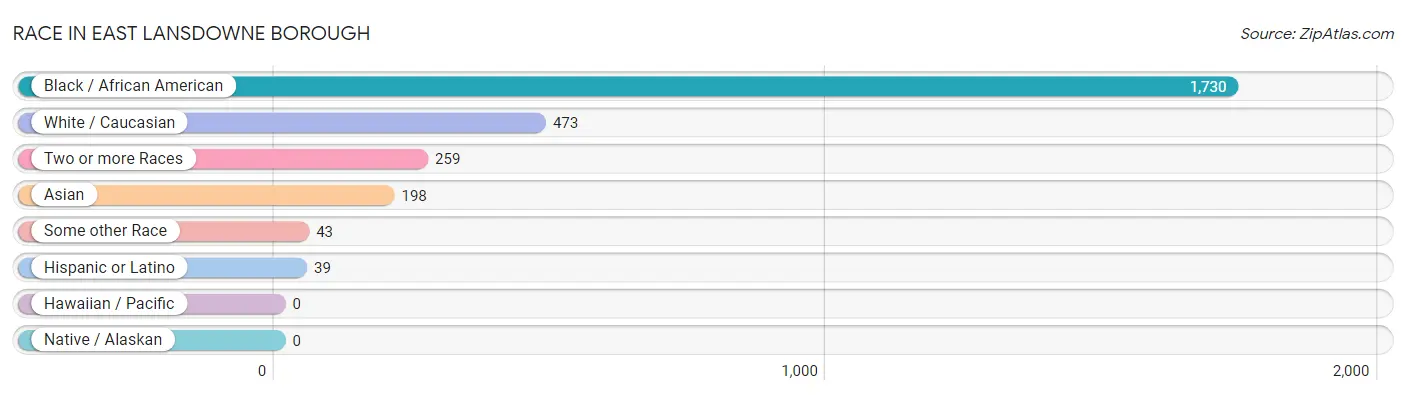
| Race | # Population | % Population |
| Asian | 198 | 7.3% |
| Black / African American | 1,730 | 64.0% |
| Hawaiian / Pacific | 0 | 0.0% |
| Hispanic or Latino | 39 | 1.4% |
| Native / Alaskan | 0 | 0.0% |
| White / Caucasian | 473 | 17.5% |
| Two or more Races | 259 | 9.6% |
| Some other Race | 43 | 1.6% |
| Total | 2,703 | 100.0% |
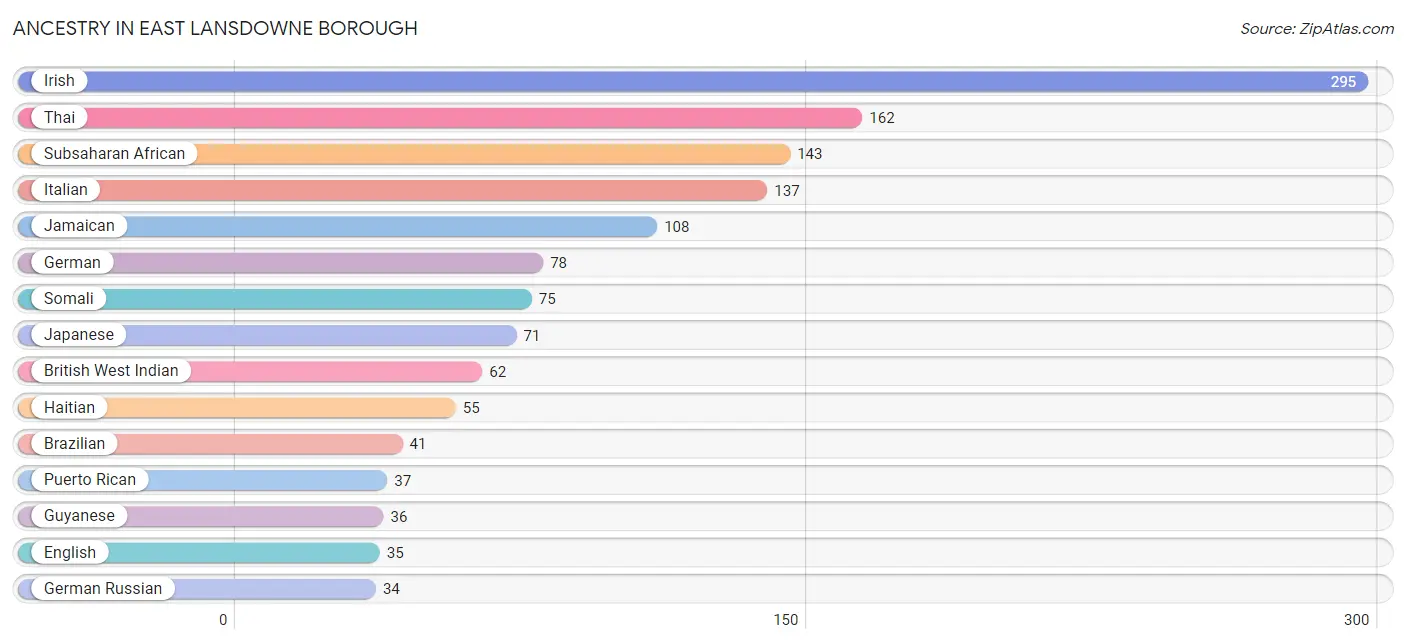
Ancestry in East Lansdowne borough
The most populous ancestries reported in East Lansdowne borough are Irish (295 | 10.9%), Thai (162 | 6.0%), Subsaharan African (143 | 5.3%), Italian (137 | 5.1%), and Jamaican (108 | 4.0%), together accounting for 31.3% of all East Lansdowne borough residents.
| Ancestry | # Population | % Population |
| American | 33 | 1.2% |
| Belgian | 5 | 0.2% |
| Brazilian | 41 | 1.5% |
| British West Indian | 62 | 2.3% |
| Cherokee | 1 | 0.0% |
| Dutch | 5 | 0.2% |
| English | 35 | 1.3% |
| European | 19 | 0.7% |
| German | 78 | 2.9% |
| German Russian | 34 | 1.3% |
| Guyanese | 36 | 1.3% |
| Haitian | 55 | 2.0% |
| Indian (Asian) | 10 | 0.4% |
| Irish | 295 | 10.9% |
| Italian | 137 | 5.1% |
| Jamaican | 108 | 4.0% |
| Japanese | 71 | 2.6% |
| Liberian | 18 | 0.7% |
| Nigerian | 31 | 1.1% |
| Northern European | 4 | 0.2% |
| Peruvian | 2 | 0.1% |
| Polish | 33 | 1.2% |
| Puerto Rican | 37 | 1.4% |
| Russian | 11 | 0.4% |
| Sierra Leonean | 19 | 0.7% |
| Slovak | 4 | 0.2% |
| Somali | 75 | 2.8% |
| South American | 2 | 0.1% |
| Sri Lankan | 26 | 1.0% |
| Subsaharan African | 143 | 5.3% |
| Swedish | 10 | 0.4% |
| Thai | 162 | 6.0% |
| Ukrainian | 11 | 0.4% |
| Welsh | 1 | 0.0% | View All 34 Rows |
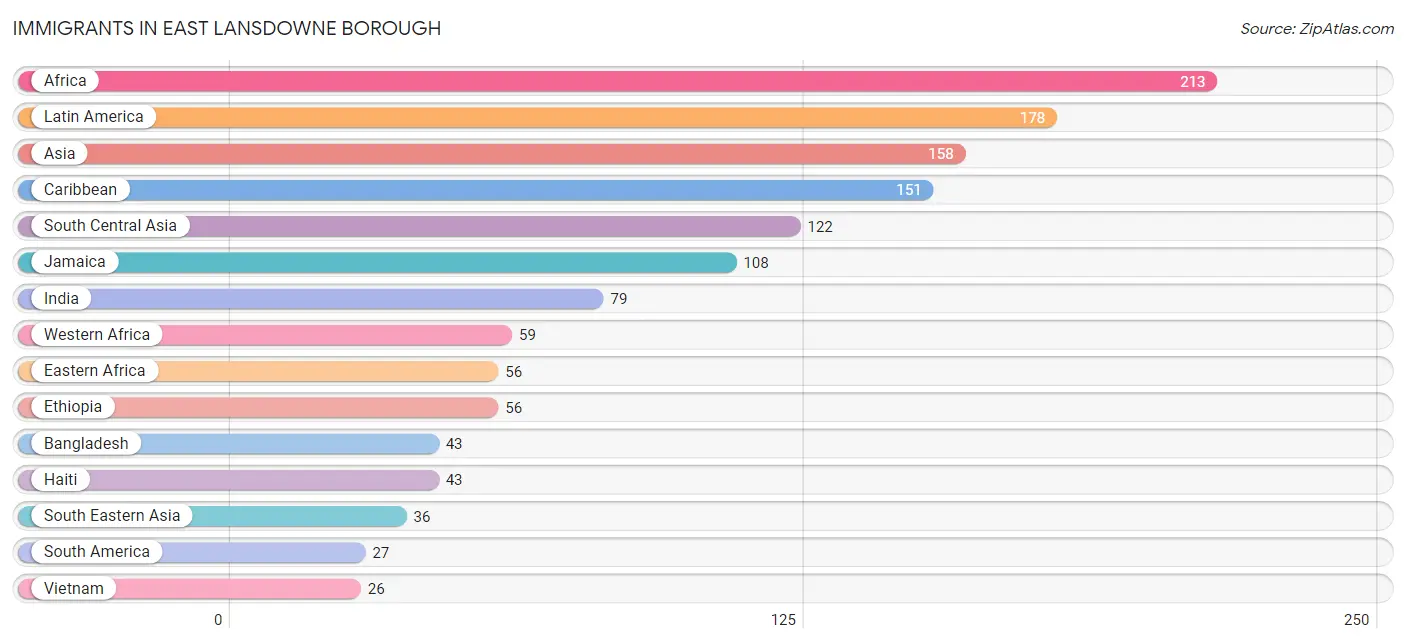
Immigrants in East Lansdowne borough
The most numerous immigrant groups reported in East Lansdowne borough came from Africa (213 | 7.9%), Latin America (178 | 6.6%), Asia (158 | 5.9%), Caribbean (151 | 5.6%), and South Central Asia (122 | 4.5%), together accounting for 30.4% of all East Lansdowne borough residents.
| Immigration Origin | # Population | % Population |
| Africa | 213 | 7.9% |
| Asia | 158 | 5.9% |
| Bangladesh | 43 | 1.6% |
| Brazil | 7 | 0.3% |
| Cambodia | 10 | 0.4% |
| Caribbean | 151 | 5.6% |
| Eastern Africa | 56 | 2.1% |
| Ethiopia | 56 | 2.1% |
| Guyana | 18 | 0.7% |
| Haiti | 43 | 1.6% |
| India | 79 | 2.9% |
| Jamaica | 108 | 4.0% |
| Latin America | 178 | 6.6% |
| Liberia | 18 | 0.7% |
| Nigeria | 22 | 0.8% |
| Northern Africa | 17 | 0.6% |
| Peru | 2 | 0.1% |
| Sierra Leone | 19 | 0.7% |
| South America | 27 | 1.0% |
| South Central Asia | 122 | 4.5% |
| South Eastern Asia | 36 | 1.3% |
| Sudan | 17 | 0.6% |
| Vietnam | 26 | 1.0% |
| Western Africa | 59 | 2.2% | View All 24 Rows |
Sex and Age in East Lansdowne borough
Sex and Age in East Lansdowne borough
The most populous age groups in East Lansdowne borough are 25 to 29 Years (139 | 11.1%) for men and 30 to 34 Years (290 | 20.0%) for women.
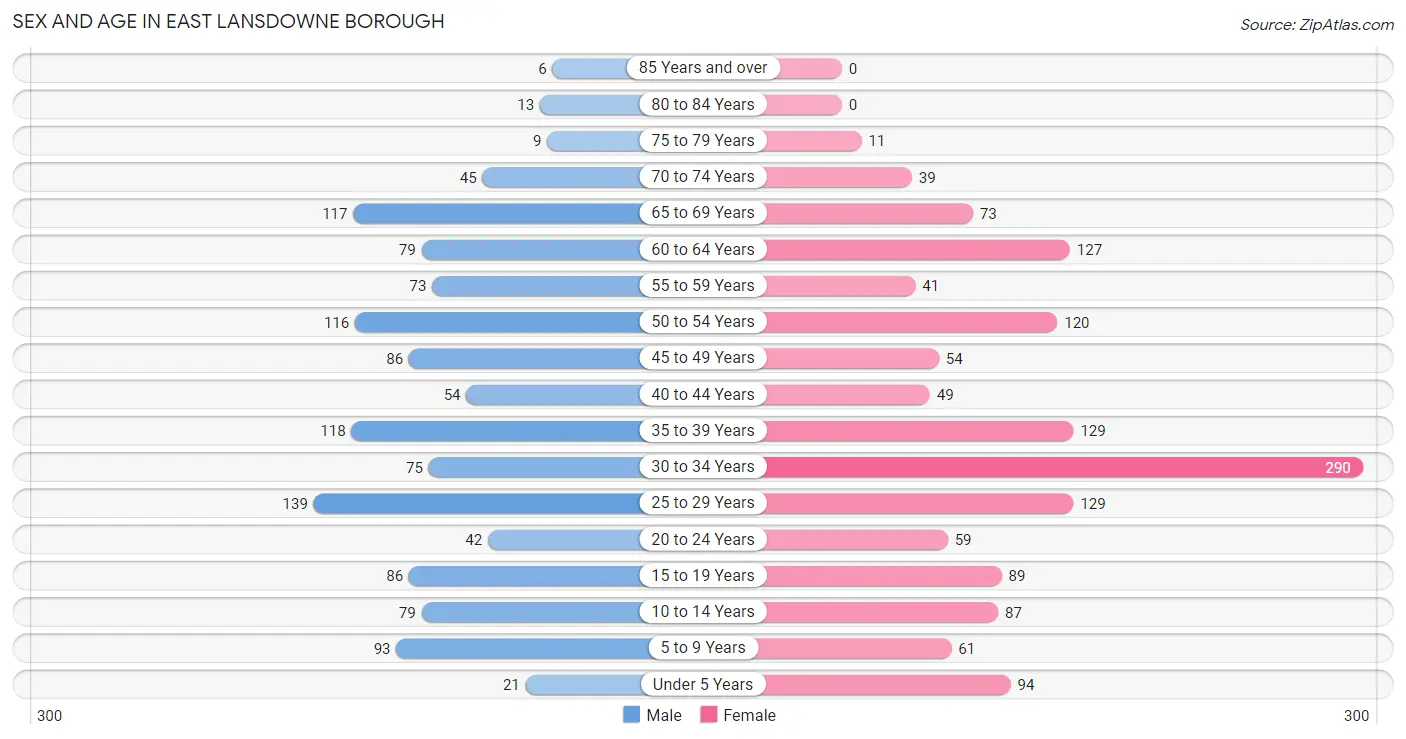
| Age Bracket | Male | Female |
| Under 5 Years | 21 (1.7%) | 94 (6.5%) |
| 5 to 9 Years | 93 (7.4%) | 61 (4.2%) |
| 10 to 14 Years | 79 (6.3%) | 87 (6.0%) |
| 15 to 19 Years | 86 (6.9%) | 89 (6.1%) |
| 20 to 24 Years | 42 (3.4%) | 59 (4.1%) |
| 25 to 29 Years | 139 (11.1%) | 129 (8.9%) |
| 30 to 34 Years | 75 (6.0%) | 290 (20.0%) |
| 35 to 39 Years | 118 (9.4%) | 129 (8.9%) |
| 40 to 44 Years | 54 (4.3%) | 49 (3.4%) |
| 45 to 49 Years | 86 (6.9%) | 54 (3.7%) |
| 50 to 54 Years | 116 (9.3%) | 120 (8.3%) |
| 55 to 59 Years | 73 (5.8%) | 41 (2.8%) |
| 60 to 64 Years | 79 (6.3%) | 127 (8.7%) |
| 65 to 69 Years | 117 (9.3%) | 73 (5.0%) |
| 70 to 74 Years | 45 (3.6%) | 39 (2.7%) |
| 75 to 79 Years | 9 (0.7%) | 11 (0.8%) |
| 80 to 84 Years | 13 (1.0%) | 0 (0.0%) |
| 85 Years and over | 6 (0.5%) | 0 (0.0%) |
| Total | 1,251 (100.0%) | 1,452 (100.0%) |
Families and Households in East Lansdowne borough
Median Family Size in East Lansdowne borough
The median family size in East Lansdowne borough is 3.40 persons per family, with single female/mother families (123 | 22.4%) accounting for the largest median family size of 3.95 persons per family. On the other hand, single male/father families (44 | 8.0%) represent the smallest median family size with 2.64 persons per family.
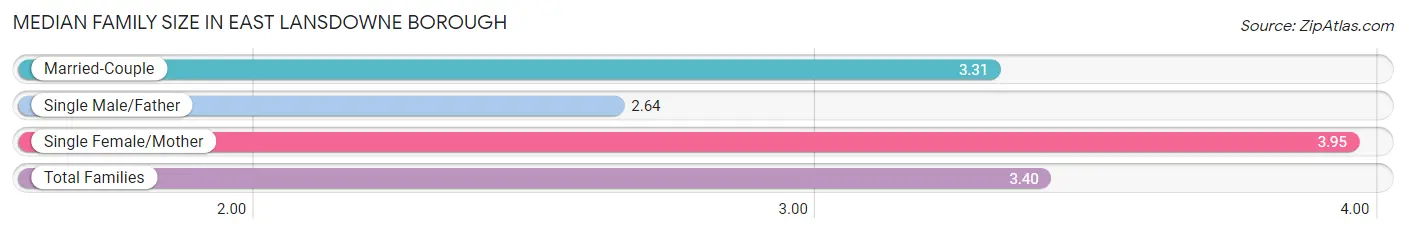
| Family Type | # Families | Family Size |
| Married-Couple | 382 (69.6%) | 3.31 |
| Single Male/Father | 44 (8.0%) | 2.64 |
| Single Female/Mother | 123 (22.4%) | 3.95 |
| Total Families | 549 (100.0%) | 3.40 |
Median Household Size in East Lansdowne borough
The median household size in East Lansdowne borough is 2.27 persons per household, with single female/mother households (123 | 10.3%) accounting for the largest median household size of 4.01 persons per household. non-family households (639 | 53.8%) represent the smallest median household size with 1.21 persons per household.
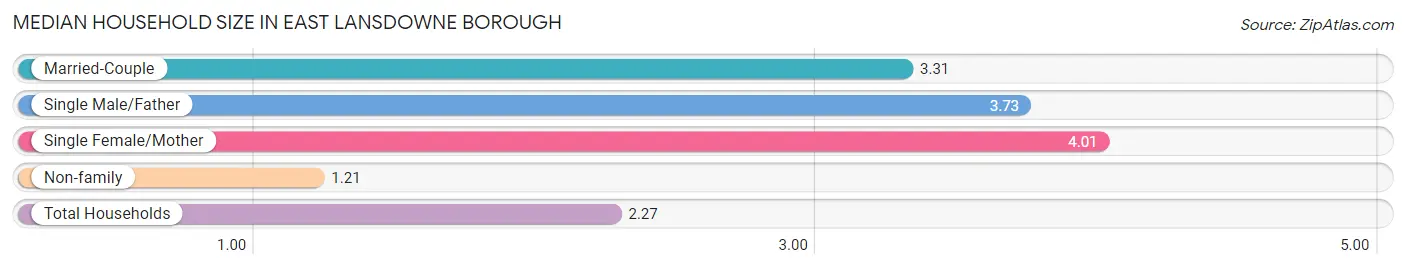
| Household Type | # Households | Household Size |
| Married-Couple | 382 (32.2%) | 3.31 |
| Single Male/Father | 44 (3.7%) | 3.73 |
| Single Female/Mother | 123 (10.3%) | 4.01 |
| Non-family | 639 (53.8%) | 1.21 |
| Total Households | 1,188 (100.0%) | 2.27 |
Household Size by Marriage Status in East Lansdowne borough
Out of a total of 1,188 households in East Lansdowne borough, 549 (46.2%) are family households, while 639 (53.8%) are nonfamily households. The most numerous type of family households are 3-person households, comprising 193, and the most common type of nonfamily households are 1-person households, comprising 590.
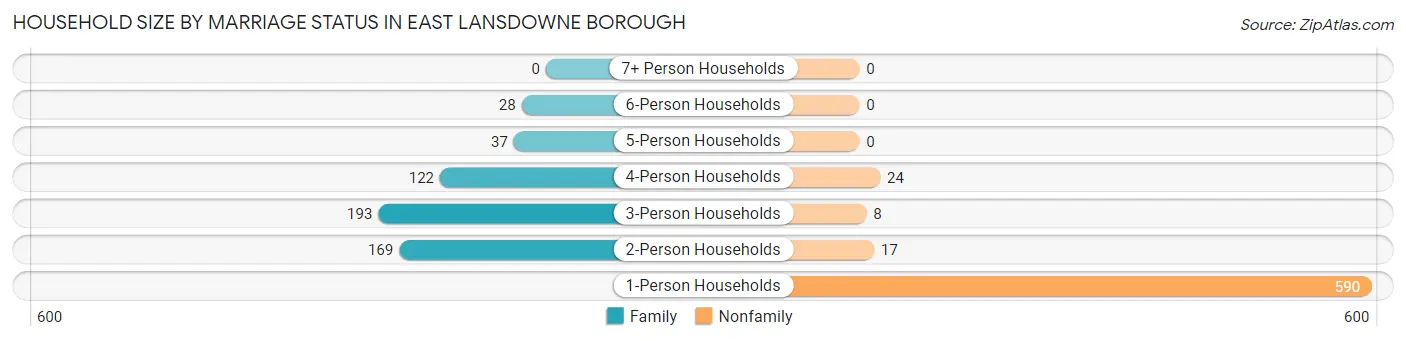
| Household Size | Family Households | Nonfamily Households |
| 1-Person Households | - | 590 (49.7%) |
| 2-Person Households | 169 (14.2%) | 17 (1.4%) |
| 3-Person Households | 193 (16.3%) | 8 (0.7%) |
| 4-Person Households | 122 (10.3%) | 24 (2.0%) |
| 5-Person Households | 37 (3.1%) | 0 (0.0%) |
| 6-Person Households | 28 (2.4%) | 0 (0.0%) |
| 7+ Person Households | 0 (0.0%) | 0 (0.0%) |
| Total | 549 (46.2%) | 639 (53.8%) |
Female Fertility in East Lansdowne borough
Fertility by Age in East Lansdowne borough
Average fertility rate in East Lansdowne borough is 25.0 births per 1,000 women. Women in the age bracket of 35 to 50 years have the highest fertility rate with 80.0 births per 1,000 women. Women in the age bracket of 35 to 50 years acount for 100.0% of all women with births.
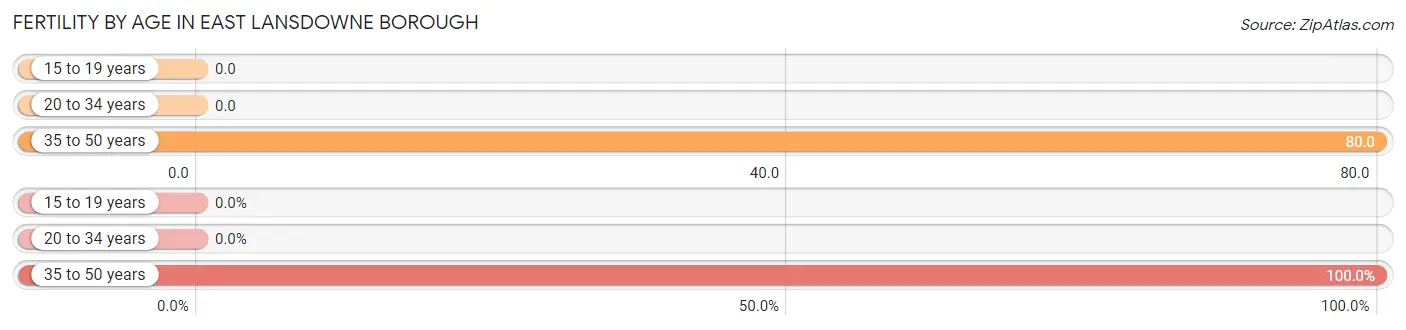
| Age Bracket | Women with Births | Births / 1,000 Women |
| 15 to 19 years | 0 (0.0%) | 0.0 |
| 20 to 34 years | 0 (0.0%) | 0.0 |
| 35 to 50 years | 21 (100.0%) | 80.0 |
| Total | 21 (100.0%) | 25.0 |
Fertility by Age by Marriage Status in East Lansdowne borough
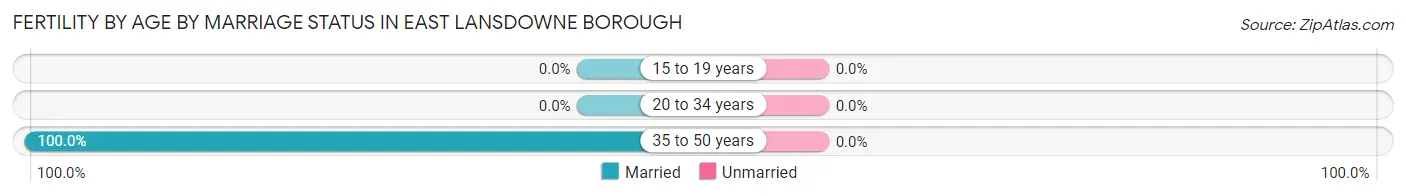
| Age Bracket | Married | Unmarried |
| 15 to 19 years | 0 (0.0%) | 0 (0.0%) |
| 20 to 34 years | 0 (0.0%) | 0 (0.0%) |
| 35 to 50 years | 21 (100.0%) | 0 (0.0%) |
| Total | 21 (100.0%) | 0 (0.0%) |
Fertility by Education in East Lansdowne borough
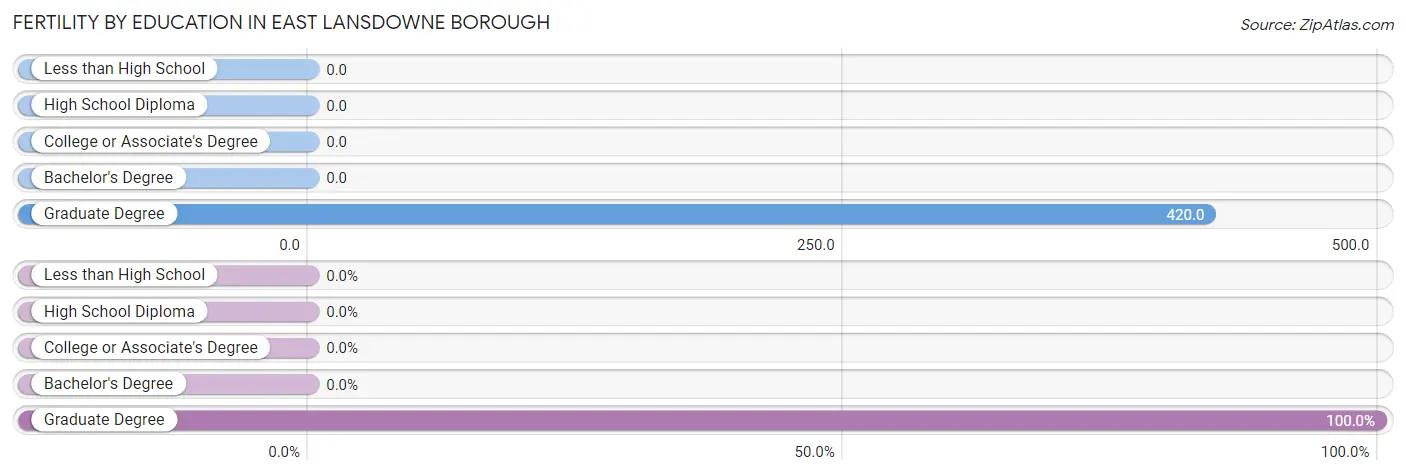
| Educational Attainment | Women with Births | Births / 1,000 Women |
| Less than High School | 0 (0.0%) | 0.0 |
| High School Diploma | 0 (0.0%) | 0.0 |
| College or Associate's Degree | 0 (0.0%) | 0.0 |
| Bachelor's Degree | 0 (0.0%) | 0.0 |
| Graduate Degree | 21 (100.0%) | 420.0 |
| Total | 21 (100.0%) | 25.0 |
Fertility by Education by Marriage Status in East Lansdowne borough
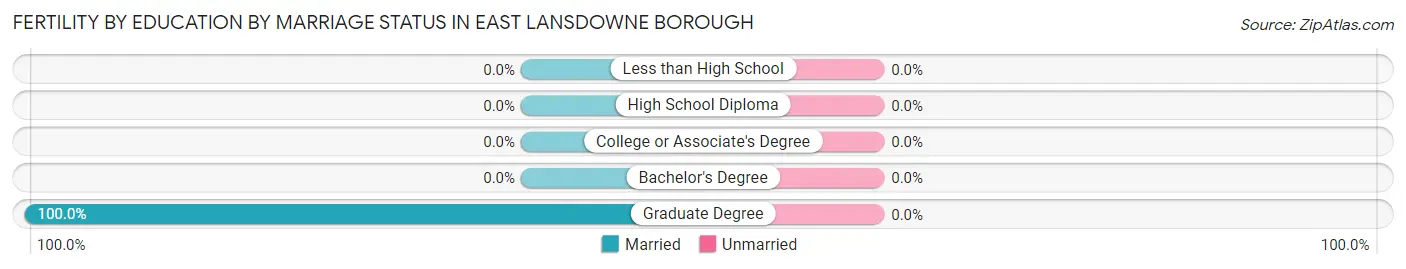
| Educational Attainment | Married | Unmarried |
| Less than High School | 0 (0.0%) | 0 (0.0%) |
| High School Diploma | 0 (0.0%) | 0 (0.0%) |
| College or Associate's Degree | 0 (0.0%) | 0 (0.0%) |
| Bachelor's Degree | 0 (0.0%) | 0 (0.0%) |
| Graduate Degree | 21 (100.0%) | 0 (0.0%) |
| Total | 21 (100.0%) | 0 (0.0%) |
Employment Characteristics in East Lansdowne borough
Employment by Class of Employer in East Lansdowne borough
Among the 1,306 employed individuals in East Lansdowne borough, private company employees (756 | 57.9%), local government employees (176 | 13.5%), and not-for-profit organizations (162 | 12.4%) make up the most common classes of employment.
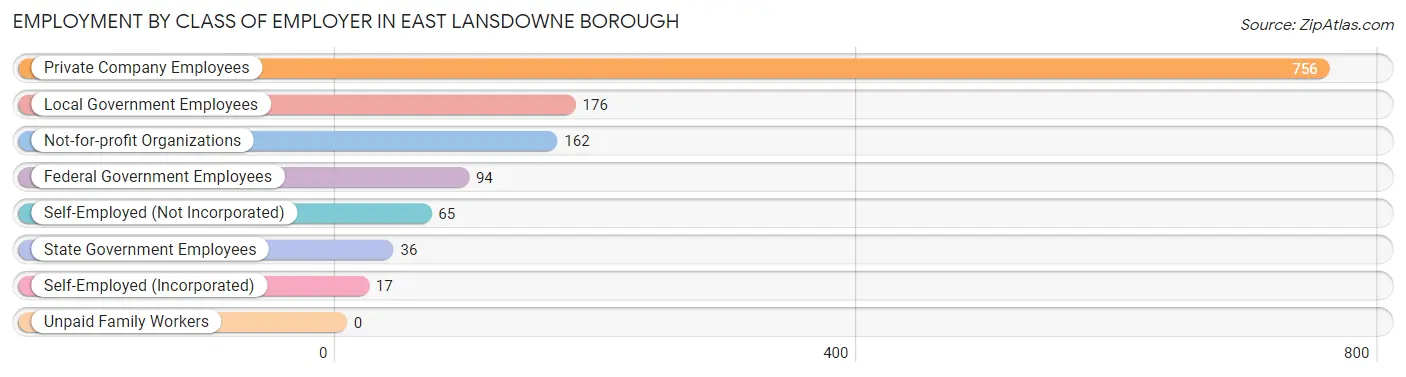
| Employer Class | # Employees | % Employees |
| Private Company Employees | 756 | 57.9% |
| Self-Employed (Incorporated) | 17 | 1.3% |
| Self-Employed (Not Incorporated) | 65 | 5.0% |
| Not-for-profit Organizations | 162 | 12.4% |
| Local Government Employees | 176 | 13.5% |
| State Government Employees | 36 | 2.8% |
| Federal Government Employees | 94 | 7.2% |
| Unpaid Family Workers | 0 | 0.0% |
| Total | 1,306 | 100.0% |
Employment Status by Age in East Lansdowne borough
According to the labor force statistics for East Lansdowne borough, out of the total population over 16 years of age (2,253), 74.9% or 1,687 individuals are in the labor force, with 10.1% or 170 of them unemployed. The age group with the highest labor force participation rate is 25 to 29 years, with 100.0% or 268 individuals in the labor force. Within the labor force, the 20 to 24 years age range has the highest percentage of unemployed individuals, with 64.9% or 48 of them being unemployed.
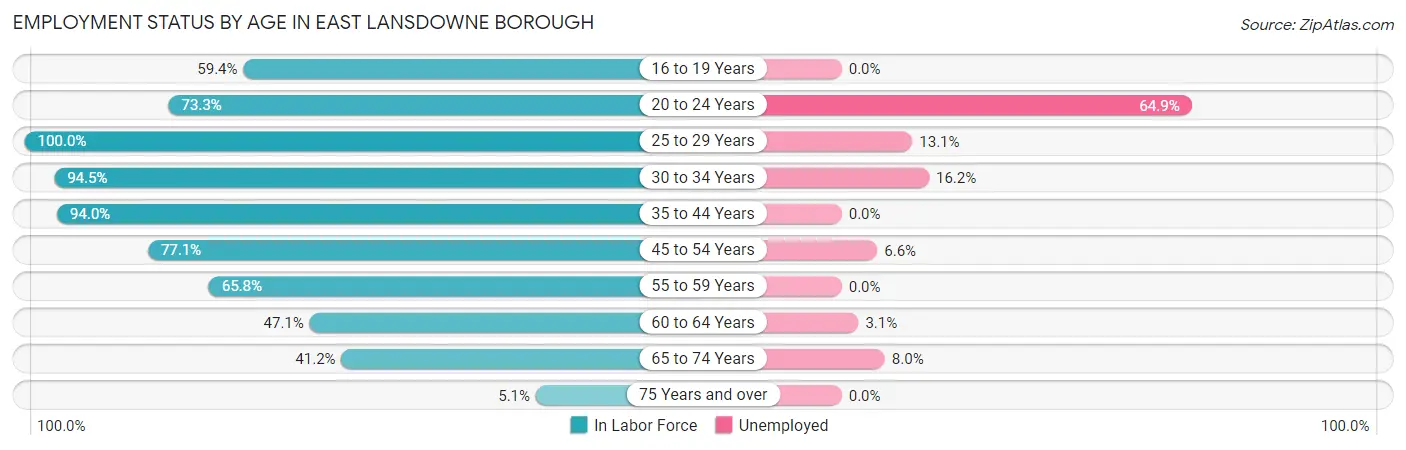
| Age Bracket | In Labor Force | Unemployed |
| 16 to 19 Years | 95 (59.4%) | 0 (0.0%) |
| 20 to 24 Years | 74 (73.3%) | 48 (64.9%) |
| 25 to 29 Years | 268 (100.0%) | 35 (13.1%) |
| 30 to 34 Years | 345 (94.5%) | 56 (16.2%) |
| 35 to 44 Years | 329 (94.0%) | 0 (0.0%) |
| 45 to 54 Years | 290 (77.1%) | 19 (6.6%) |
| 55 to 59 Years | 75 (65.8%) | 0 (0.0%) |
| 60 to 64 Years | 97 (47.1%) | 3 (3.1%) |
| 65 to 74 Years | 113 (41.2%) | 9 (8.0%) |
| 75 Years and over | 2 (5.1%) | 0 (0.0%) |
| Total | 1,687 (74.9%) | 170 (10.1%) |
Employment Status by Educational Attainment in East Lansdowne borough
According to labor force statistics for East Lansdowne borough, 83.6% of individuals (1,404) out of the total population between 25 and 64 years of age (1,679) are in the labor force, with 8.0% or 112 of them being unemployed. The group with the highest labor force participation rate are those with the educational attainment of high school diploma, with 91.8% or 536 individuals in the labor force. Within the labor force, individuals with college / associate degree education have the highest percentage of unemployment, with 13.4% or 73 of them being unemployed.
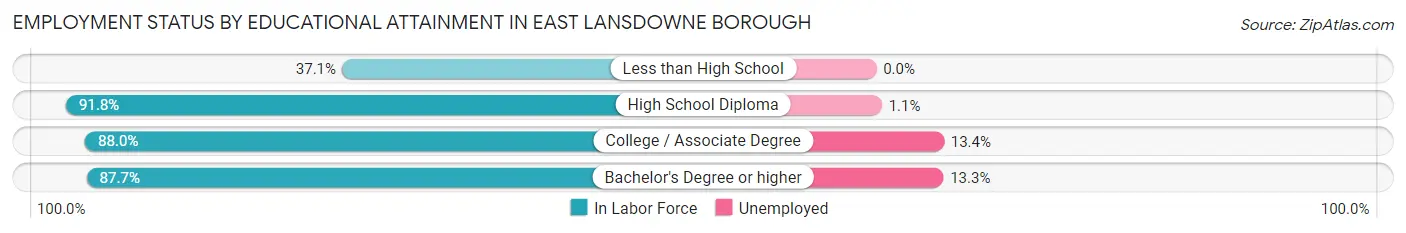
| Educational Attainment | In Labor Force | Unemployed |
| Less than High School | 69 (37.1%) | 0 (0.0%) |
| High School Diploma | 536 (91.8%) | 6 (1.1%) |
| College / Associate Degree | 543 (88.0%) | 83 (13.4%) |
| Bachelor's Degree or higher | 256 (87.7%) | 39 (13.3%) |
| Total | 1,404 (83.6%) | 134 (8.0%) |
Employment Occupations by Sex in East Lansdowne borough
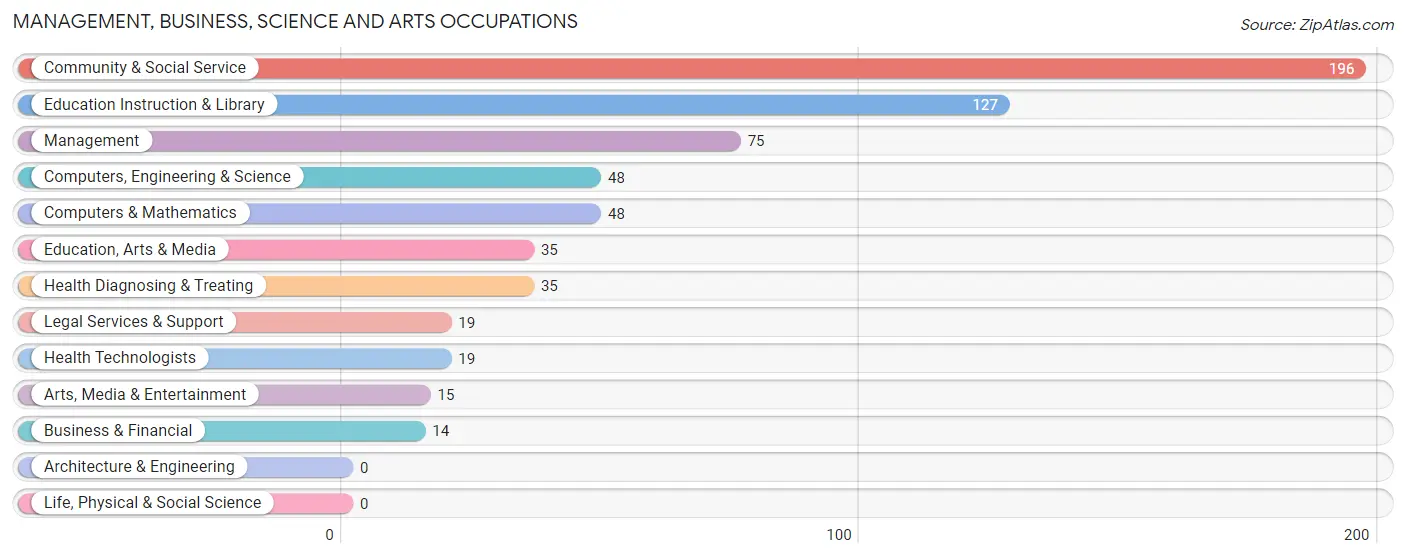
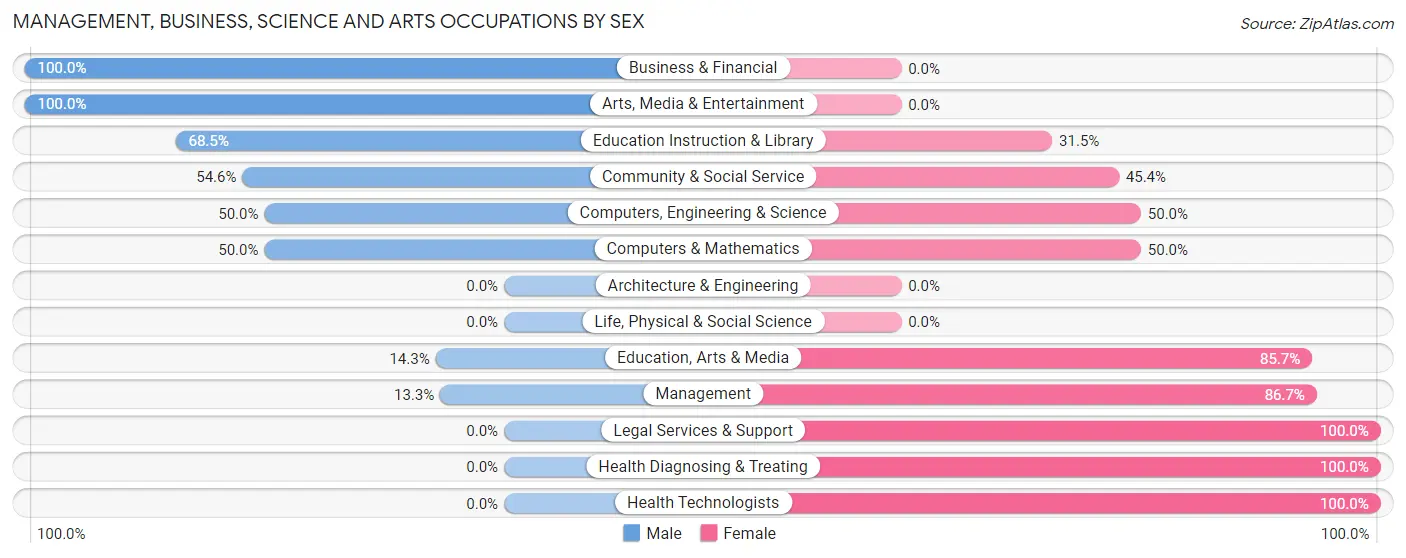
Management, Business, Science and Arts Occupations
The most common Management, Business, Science and Arts occupations in East Lansdowne borough are Community & Social Service (196 | 12.9%), Education Instruction & Library (127 | 8.4%), Management (75 | 4.9%), Computers, Engineering & Science (48 | 3.2%), and Computers & Mathematics (48 | 3.2%).
Management, Business, Science and Arts Occupations by Sex
Within the Management, Business, Science and Arts occupations in East Lansdowne borough, the most male-oriented occupations are Business & Financial (100.0%), Arts, Media & Entertainment (100.0%), and Education Instruction & Library (68.5%), while the most female-oriented occupations are Legal Services & Support (100.0%), Health Diagnosing & Treating (100.0%), and Health Technologists (100.0%).
| Occupation | Male | Female |
| Management | 10 (13.3%) | 65 (86.7%) |
| Business & Financial | 14 (100.0%) | 0 (0.0%) |
| Computers, Engineering & Science | 24 (50.0%) | 24 (50.0%) |
| Computers & Mathematics | 24 (50.0%) | 24 (50.0%) |
| Architecture & Engineering | 0 (0.0%) | 0 (0.0%) |
| Life, Physical & Social Science | 0 (0.0%) | 0 (0.0%) |
| Community & Social Service | 107 (54.6%) | 89 (45.4%) |
| Education, Arts & Media | 5 (14.3%) | 30 (85.7%) |
| Legal Services & Support | 0 (0.0%) | 19 (100.0%) |
| Education Instruction & Library | 87 (68.5%) | 40 (31.5%) |
| Arts, Media & Entertainment | 15 (100.0%) | 0 (0.0%) |
| Health Diagnosing & Treating | 0 (0.0%) | 35 (100.0%) |
| Health Technologists | 0 (0.0%) | 19 (100.0%) |
| Total (Category) | 155 (42.1%) | 213 (57.9%) |
| Total (Overall) | 663 (43.7%) | 855 (56.3%) |
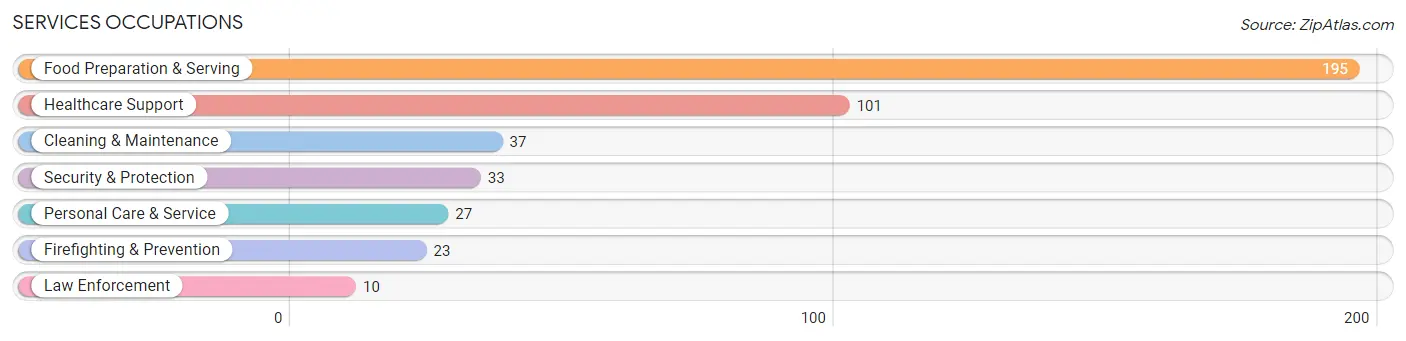
Services Occupations
The most common Services occupations in East Lansdowne borough are Food Preparation & Serving (195 | 12.9%), Healthcare Support (101 | 6.7%), Cleaning & Maintenance (37 | 2.4%), Security & Protection (33 | 2.2%), and Personal Care & Service (27 | 1.8%).
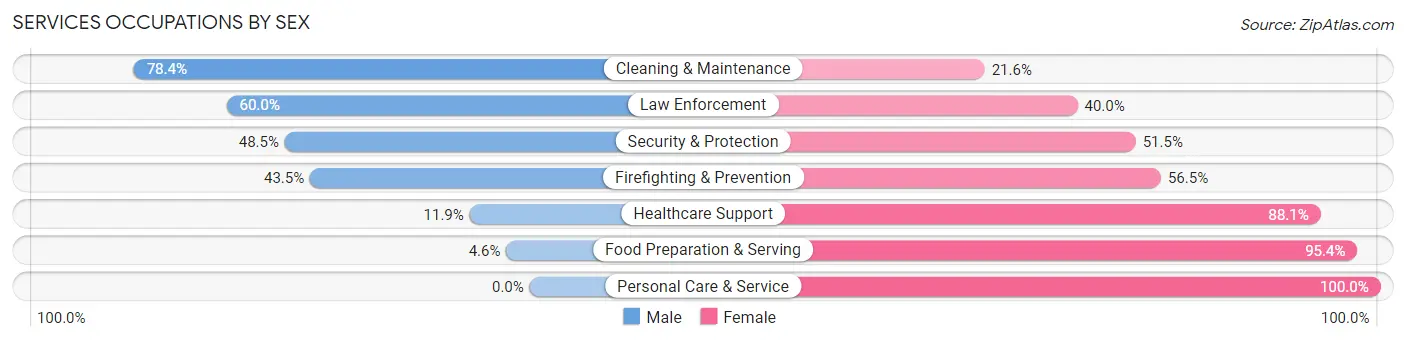
Services Occupations by Sex
Within the Services occupations in East Lansdowne borough, the most male-oriented occupations are Cleaning & Maintenance (78.4%), Law Enforcement (60.0%), and Security & Protection (48.5%), while the most female-oriented occupations are Personal Care & Service (100.0%), Food Preparation & Serving (95.4%), and Healthcare Support (88.1%).
| Occupation | Male | Female |
| Healthcare Support | 12 (11.9%) | 89 (88.1%) |
| Security & Protection | 16 (48.5%) | 17 (51.5%) |
| Firefighting & Prevention | 10 (43.5%) | 13 (56.5%) |
| Law Enforcement | 6 (60.0%) | 4 (40.0%) |
| Food Preparation & Serving | 9 (4.6%) | 186 (95.4%) |
| Cleaning & Maintenance | 29 (78.4%) | 8 (21.6%) |
| Personal Care & Service | 0 (0.0%) | 27 (100.0%) |
| Total (Category) | 66 (16.8%) | 327 (83.2%) |
| Total (Overall) | 663 (43.7%) | 855 (56.3%) |
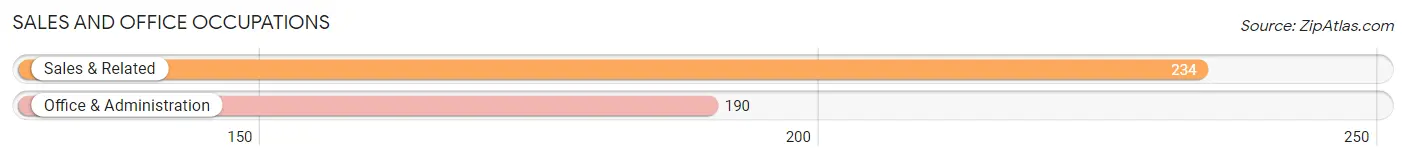
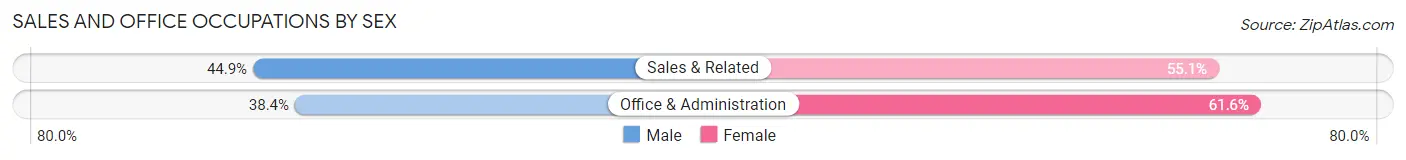
Sales and Office Occupations
The most common Sales and Office occupations in East Lansdowne borough are Sales & Related (234 | 15.4%), and Office & Administration (190 | 12.5%).
Sales and Office Occupations by Sex
| Occupation | Male | Female |
| Sales & Related | 105 (44.9%) | 129 (55.1%) |
| Office & Administration | 73 (38.4%) | 117 (61.6%) |
| Total (Category) | 178 (42.0%) | 246 (58.0%) |
| Total (Overall) | 663 (43.7%) | 855 (56.3%) |
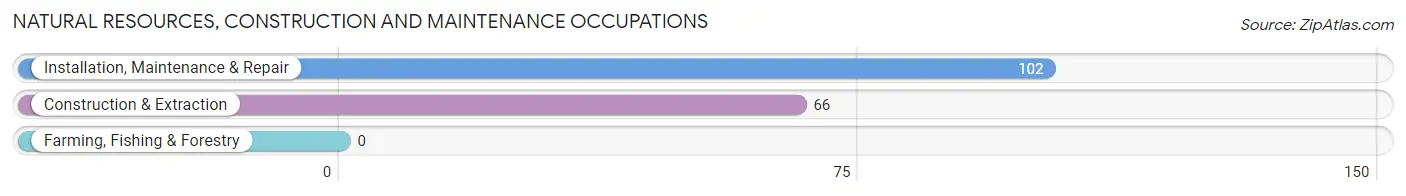
Natural Resources, Construction and Maintenance Occupations
The most common Natural Resources, Construction and Maintenance occupations in East Lansdowne borough are Installation, Maintenance & Repair (102 | 6.7%), and Construction & Extraction (66 | 4.3%).
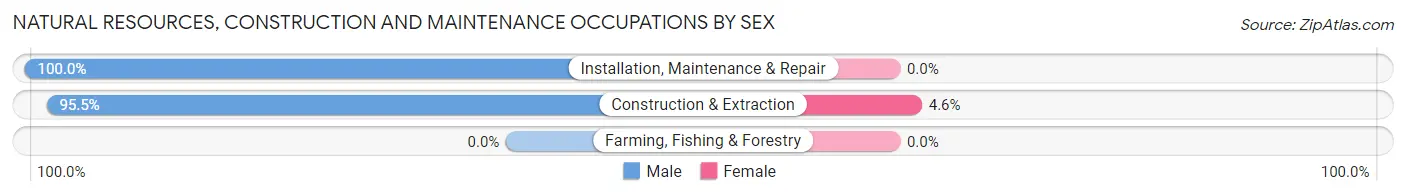
Natural Resources, Construction and Maintenance Occupations by Sex
| Occupation | Male | Female |
| Farming, Fishing & Forestry | 0 (0.0%) | 0 (0.0%) |
| Construction & Extraction | 63 (95.5%) | 3 (4.5%) |
| Installation, Maintenance & Repair | 102 (100.0%) | 0 (0.0%) |
| Total (Category) | 165 (98.2%) | 3 (1.8%) |
| Total (Overall) | 663 (43.7%) | 855 (56.3%) |
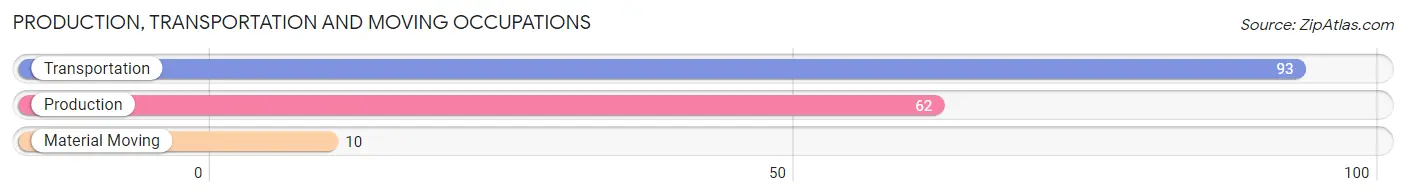
Production, Transportation and Moving Occupations
The most common Production, Transportation and Moving occupations in East Lansdowne borough are Transportation (93 | 6.1%), Production (62 | 4.1%), and Material Moving (10 | 0.7%).
Production, Transportation and Moving Occupations by Sex
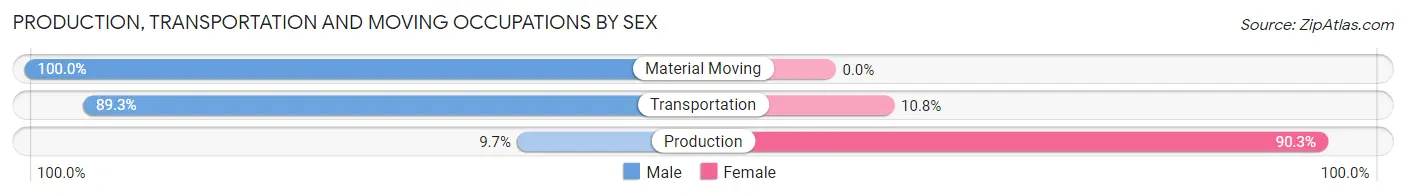
| Occupation | Male | Female |
| Production | 6 (9.7%) | 56 (90.3%) |
| Transportation | 83 (89.2%) | 10 (10.7%) |
| Material Moving | 10 (100.0%) | 0 (0.0%) |
| Total (Category) | 99 (60.0%) | 66 (40.0%) |
| Total (Overall) | 663 (43.7%) | 855 (56.3%) |
Employment Industries by Sex in East Lansdowne borough
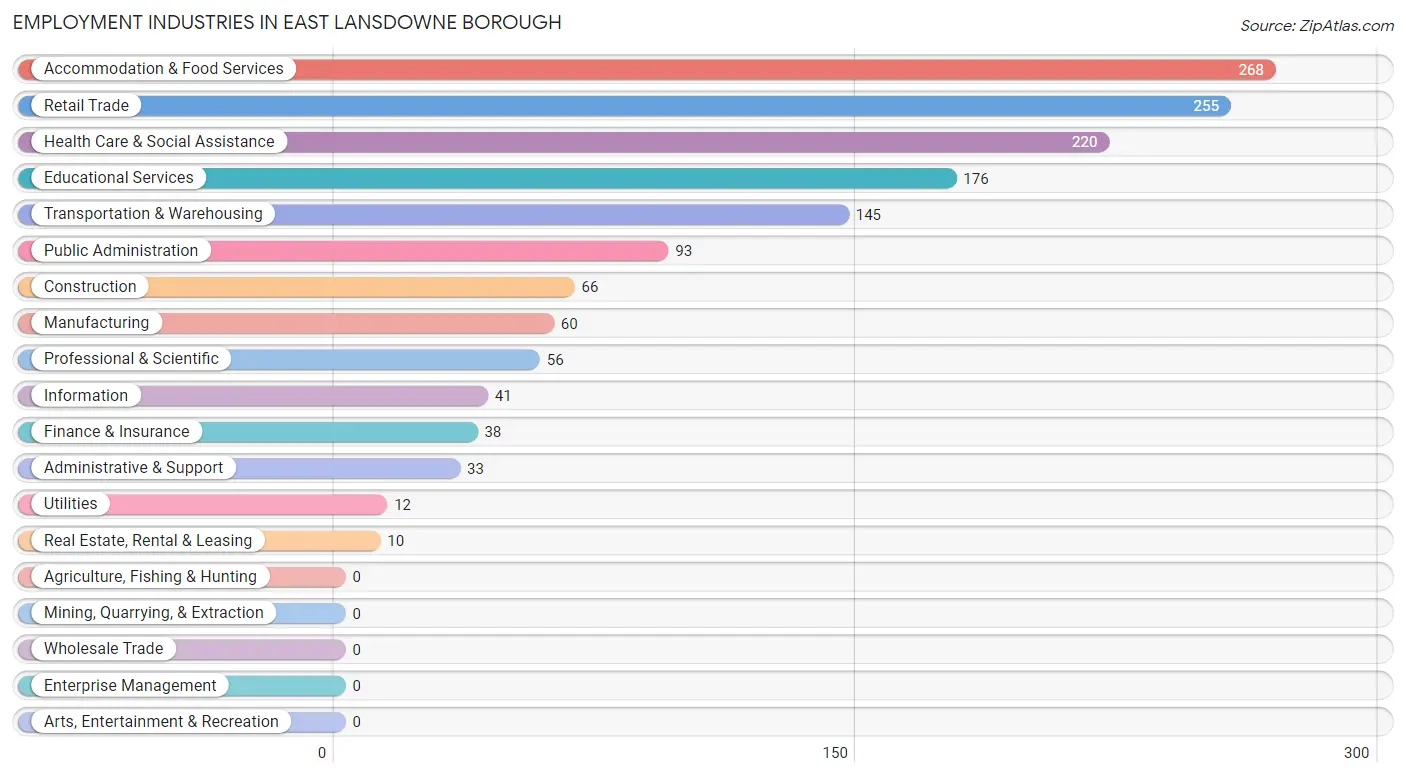
Employment Industries in East Lansdowne borough
The major employment industries in East Lansdowne borough include Accommodation & Food Services (268 | 17.6%), Retail Trade (255 | 16.8%), Health Care & Social Assistance (220 | 14.5%), Educational Services (176 | 11.6%), and Transportation & Warehousing (145 | 9.6%).
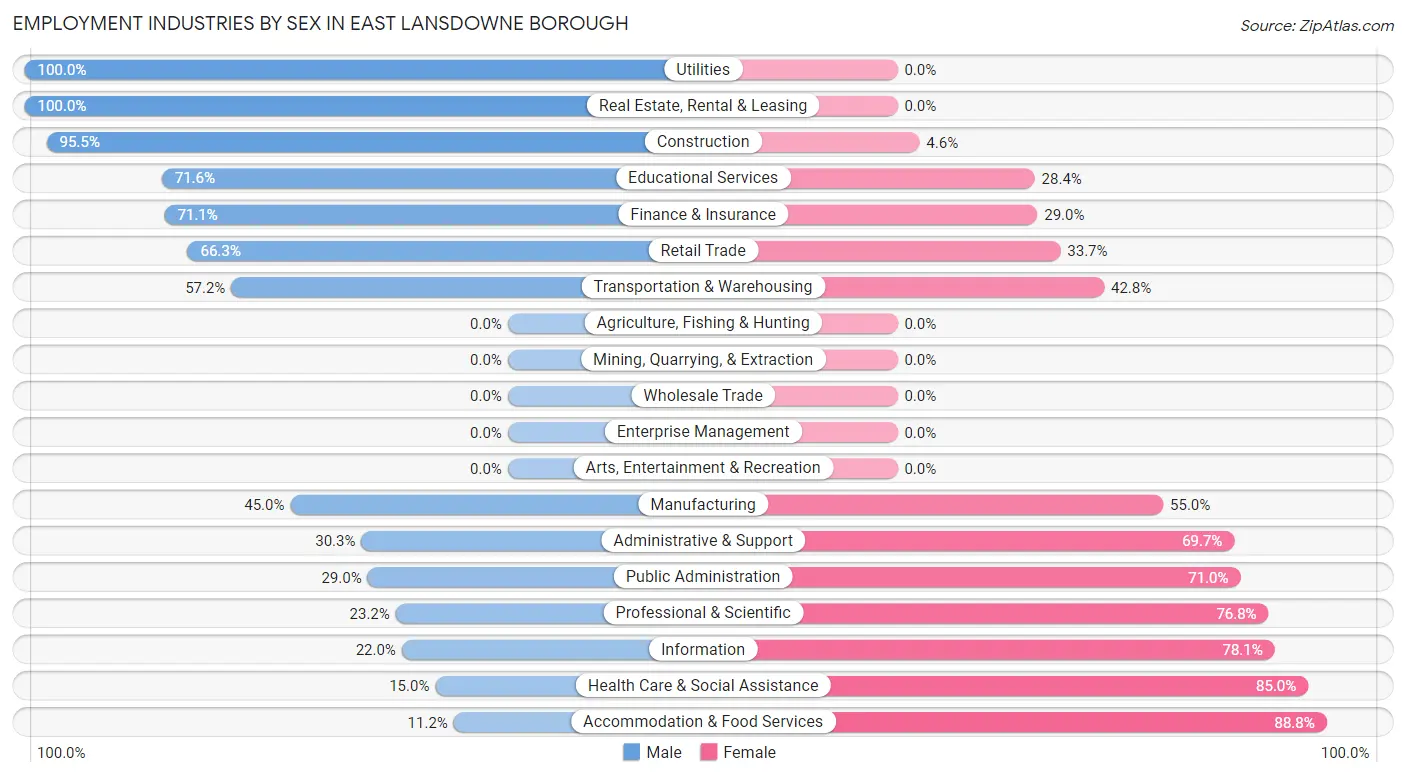
Employment Industries by Sex in East Lansdowne borough
The East Lansdowne borough industries that see more men than women are Utilities (100.0%), Real Estate, Rental & Leasing (100.0%), and Construction (95.5%), whereas the industries that tend to have a higher number of women are Accommodation & Food Services (88.8%), Health Care & Social Assistance (85.0%), and Information (78.0%).
| Industry | Male | Female |
| Agriculture, Fishing & Hunting | 0 (0.0%) | 0 (0.0%) |
| Mining, Quarrying, & Extraction | 0 (0.0%) | 0 (0.0%) |
| Construction | 63 (95.5%) | 3 (4.5%) |
| Manufacturing | 27 (45.0%) | 33 (55.0%) |
| Wholesale Trade | 0 (0.0%) | 0 (0.0%) |
| Retail Trade | 169 (66.3%) | 86 (33.7%) |
| Transportation & Warehousing | 83 (57.2%) | 62 (42.8%) |
| Utilities | 12 (100.0%) | 0 (0.0%) |
| Information | 9 (22.0%) | 32 (78.0%) |
| Finance & Insurance | 27 (71.1%) | 11 (28.9%) |
| Real Estate, Rental & Leasing | 10 (100.0%) | 0 (0.0%) |
| Professional & Scientific | 13 (23.2%) | 43 (76.8%) |
| Enterprise Management | 0 (0.0%) | 0 (0.0%) |
| Administrative & Support | 10 (30.3%) | 23 (69.7%) |
| Educational Services | 126 (71.6%) | 50 (28.4%) |
| Health Care & Social Assistance | 33 (15.0%) | 187 (85.0%) |
| Arts, Entertainment & Recreation | 0 (0.0%) | 0 (0.0%) |
| Accommodation & Food Services | 30 (11.2%) | 238 (88.8%) |
| Public Administration | 27 (29.0%) | 66 (71.0%) |
| Total | 663 (43.7%) | 855 (56.3%) |
Education in East Lansdowne borough
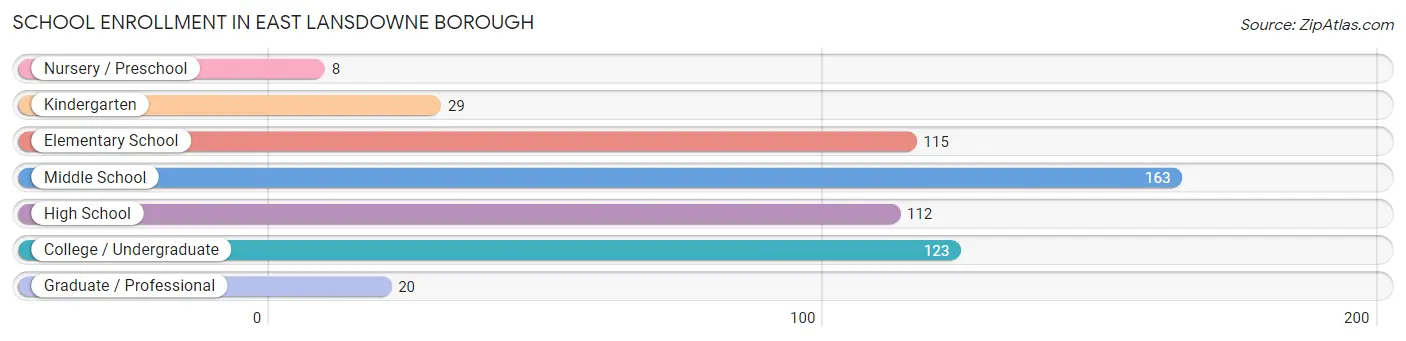
School Enrollment in East Lansdowne borough
The most common levels of schooling among the 570 students in East Lansdowne borough are middle school (163 | 28.6%), college / undergraduate (123 | 21.6%), and elementary school (115 | 20.2%).
| School Level | # Students | % Students |
| Nursery / Preschool | 8 | 1.4% |
| Kindergarten | 29 | 5.1% |
| Elementary School | 115 | 20.2% |
| Middle School | 163 | 28.6% |
| High School | 112 | 19.7% |
| College / Undergraduate | 123 | 21.6% |
| Graduate / Professional | 20 | 3.5% |
| Total | 570 | 100.0% |
School Enrollment by Age by Funding Source in East Lansdowne borough
Out of a total of 570 students who are enrolled in schools in East Lansdowne borough, 142 (24.9%) attend a private institution, while the remaining 428 (75.1%) are enrolled in public schools. The age group of 3 to 4 year olds has the highest likelihood of being enrolled in private schools, with 8 (100.0% in the age bracket) enrolled. Conversely, the age group of 18 to 19 year olds has the lowest likelihood of being enrolled in a private school, with 63 (100.0% in the age bracket) attending a public institution.
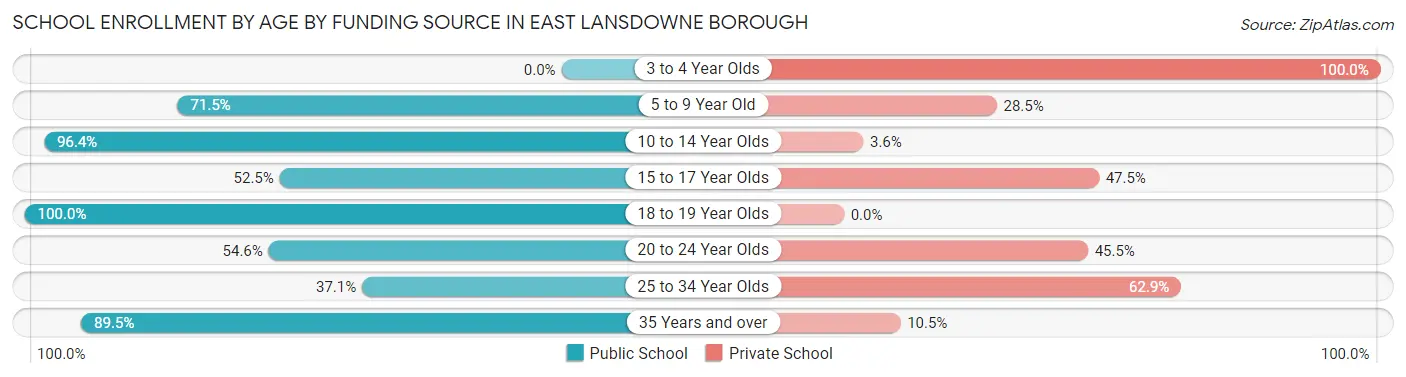
| Age Bracket | Public School | Private School |
| 3 to 4 Year Olds | 0 (0.0%) | 8 (100.0%) |
| 5 to 9 Year Old | 103 (71.5%) | 41 (28.5%) |
| 10 to 14 Year Olds | 160 (96.4%) | 6 (3.6%) |
| 15 to 17 Year Olds | 42 (52.5%) | 38 (47.5%) |
| 18 to 19 Year Olds | 63 (100.0%) | 0 (0.0%) |
| 20 to 24 Year Olds | 30 (54.5%) | 25 (45.5%) |
| 25 to 34 Year Olds | 13 (37.1%) | 22 (62.9%) |
| 35 Years and over | 17 (89.5%) | 2 (10.5%) |
| Total | 428 (75.1%) | 142 (24.9%) |
Educational Attainment by Field of Study in East Lansdowne borough
Business (84 | 21.5%), communications (73 | 18.7%), social sciences (55 | 14.1%), arts & humanities (54 | 13.9%), and science & technology (37 | 9.5%) are the most common fields of study among 390 individuals in East Lansdowne borough who have obtained a bachelor's degree or higher.
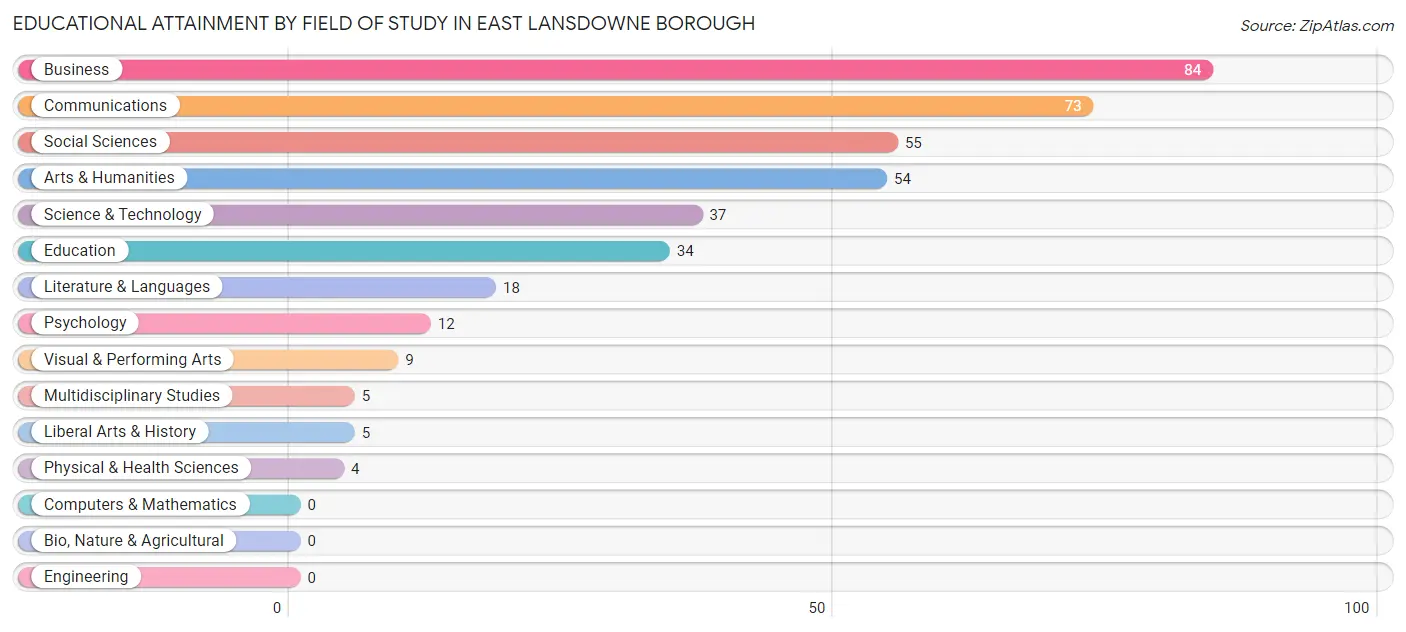
| Field of Study | # Graduates | % Graduates |
| Computers & Mathematics | 0 | 0.0% |
| Bio, Nature & Agricultural | 0 | 0.0% |
| Physical & Health Sciences | 4 | 1.0% |
| Psychology | 12 | 3.1% |
| Social Sciences | 55 | 14.1% |
| Engineering | 0 | 0.0% |
| Multidisciplinary Studies | 5 | 1.3% |
| Science & Technology | 37 | 9.5% |
| Business | 84 | 21.5% |
| Education | 34 | 8.7% |
| Literature & Languages | 18 | 4.6% |
| Liberal Arts & History | 5 | 1.3% |
| Visual & Performing Arts | 9 | 2.3% |
| Communications | 73 | 18.7% |
| Arts & Humanities | 54 | 13.9% |
| Total | 390 | 100.0% |
Transportation & Commute in East Lansdowne borough
Vehicle Availability by Sex in East Lansdowne borough
The most prevalent vehicle ownership categories in East Lansdowne borough are males with 1 vehicle (268, accounting for 41.0%) and females with 1 vehicle (265, making up 41.4%).
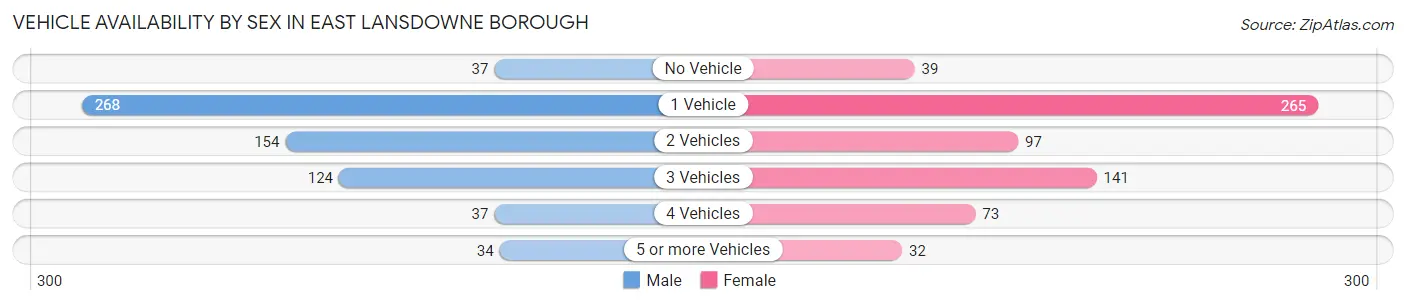
| Vehicles Available | Male | Female |
| No Vehicle | 37 (5.7%) | 39 (6.0%) |
| 1 Vehicle | 268 (41.0%) | 265 (41.0%) |
| 2 Vehicles | 154 (23.5%) | 97 (15.0%) |
| 3 Vehicles | 124 (19.0%) | 141 (21.8%) |
| 4 Vehicles | 37 (5.7%) | 73 (11.3%) |
| 5 or more Vehicles | 34 (5.2%) | 32 (5.0%) |
| Total | 654 (100.0%) | 647 (100.0%) |
Commute Time in East Lansdowne borough
The most frequently occuring commute durations in East Lansdowne borough are 30 to 34 minutes (271 commuters, 23.6%), 20 to 24 minutes (244 commuters, 21.3%), and 15 to 19 minutes (175 commuters, 15.3%).
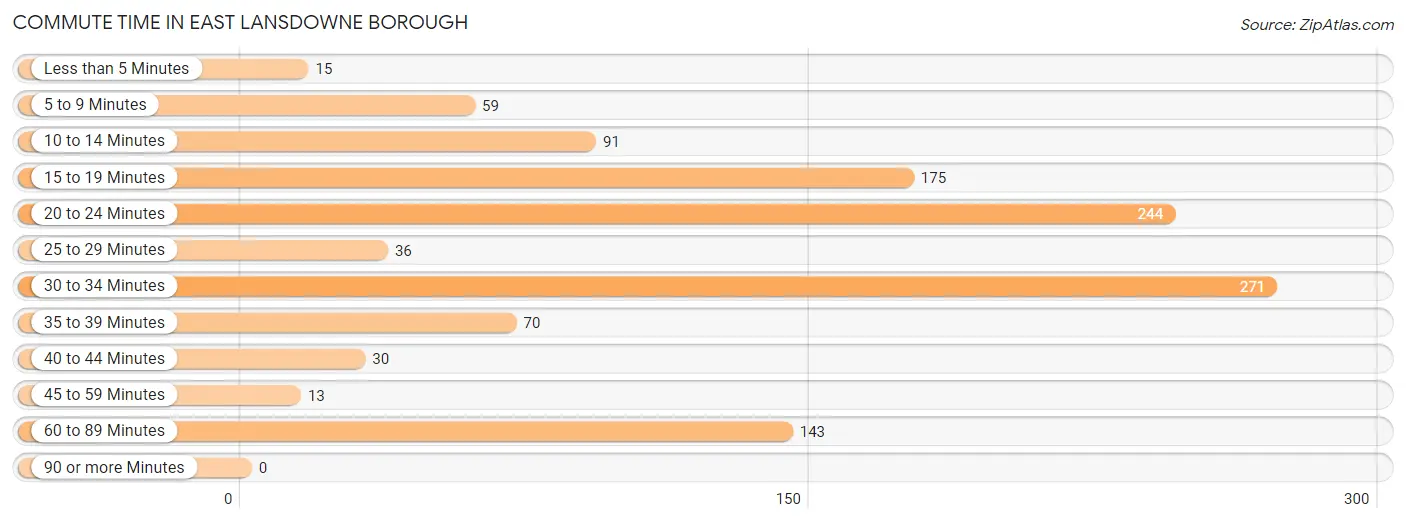
| Commute Time | # Commuters | % Commuters |
| Less than 5 Minutes | 15 | 1.3% |
| 5 to 9 Minutes | 59 | 5.1% |
| 10 to 14 Minutes | 91 | 7.9% |
| 15 to 19 Minutes | 175 | 15.3% |
| 20 to 24 Minutes | 244 | 21.3% |
| 25 to 29 Minutes | 36 | 3.1% |
| 30 to 34 Minutes | 271 | 23.6% |
| 35 to 39 Minutes | 70 | 6.1% |
| 40 to 44 Minutes | 30 | 2.6% |
| 45 to 59 Minutes | 13 | 1.1% |
| 60 to 89 Minutes | 143 | 12.5% |
| 90 or more Minutes | 0 | 0.0% |
Commute Time by Sex in East Lansdowne borough
The most common commute times in East Lansdowne borough are 20 to 24 minutes (158 commuters, 27.1%) for males and 30 to 34 minutes (180 commuters, 31.9%) for females.
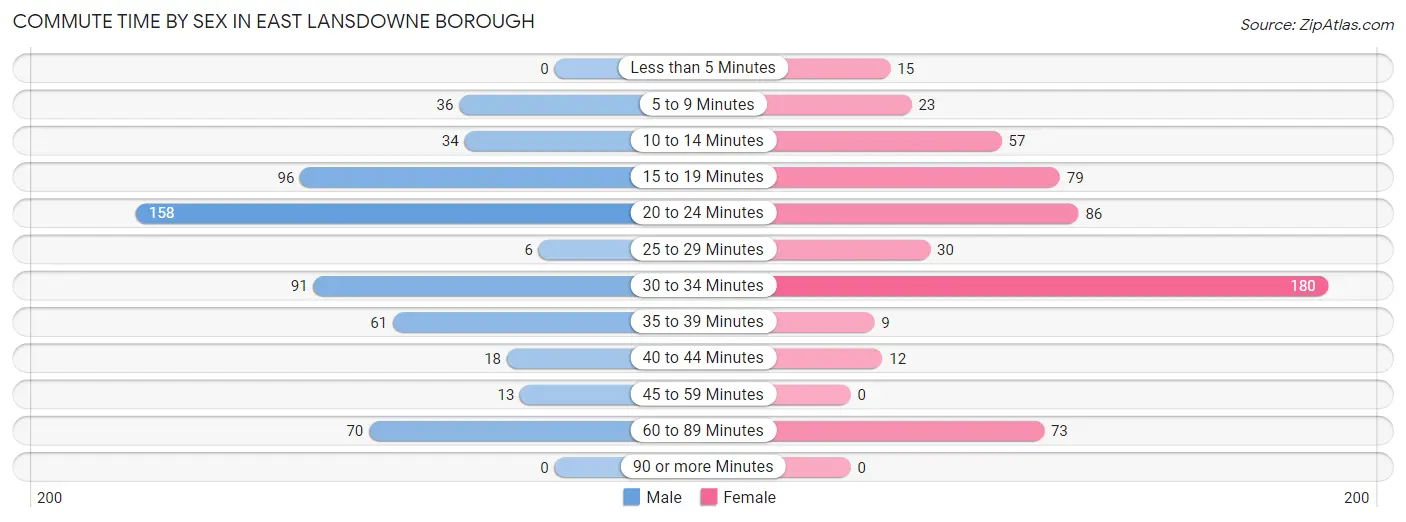
| Commute Time | Male | Female |
| Less than 5 Minutes | 0 (0.0%) | 15 (2.7%) |
| 5 to 9 Minutes | 36 (6.2%) | 23 (4.1%) |
| 10 to 14 Minutes | 34 (5.8%) | 57 (10.1%) |
| 15 to 19 Minutes | 96 (16.5%) | 79 (14.0%) |
| 20 to 24 Minutes | 158 (27.1%) | 86 (15.2%) |
| 25 to 29 Minutes | 6 (1.0%) | 30 (5.3%) |
| 30 to 34 Minutes | 91 (15.6%) | 180 (31.9%) |
| 35 to 39 Minutes | 61 (10.5%) | 9 (1.6%) |
| 40 to 44 Minutes | 18 (3.1%) | 12 (2.1%) |
| 45 to 59 Minutes | 13 (2.2%) | 0 (0.0%) |
| 60 to 89 Minutes | 70 (12.0%) | 73 (12.9%) |
| 90 or more Minutes | 0 (0.0%) | 0 (0.0%) |
Time of Departure to Work by Sex in East Lansdowne borough
The most frequent times of departure to work in East Lansdowne borough are 7:30 AM to 7:59 AM (125, 21.4%) for males and 8:00 AM to 8:29 AM (102, 18.1%) for females.
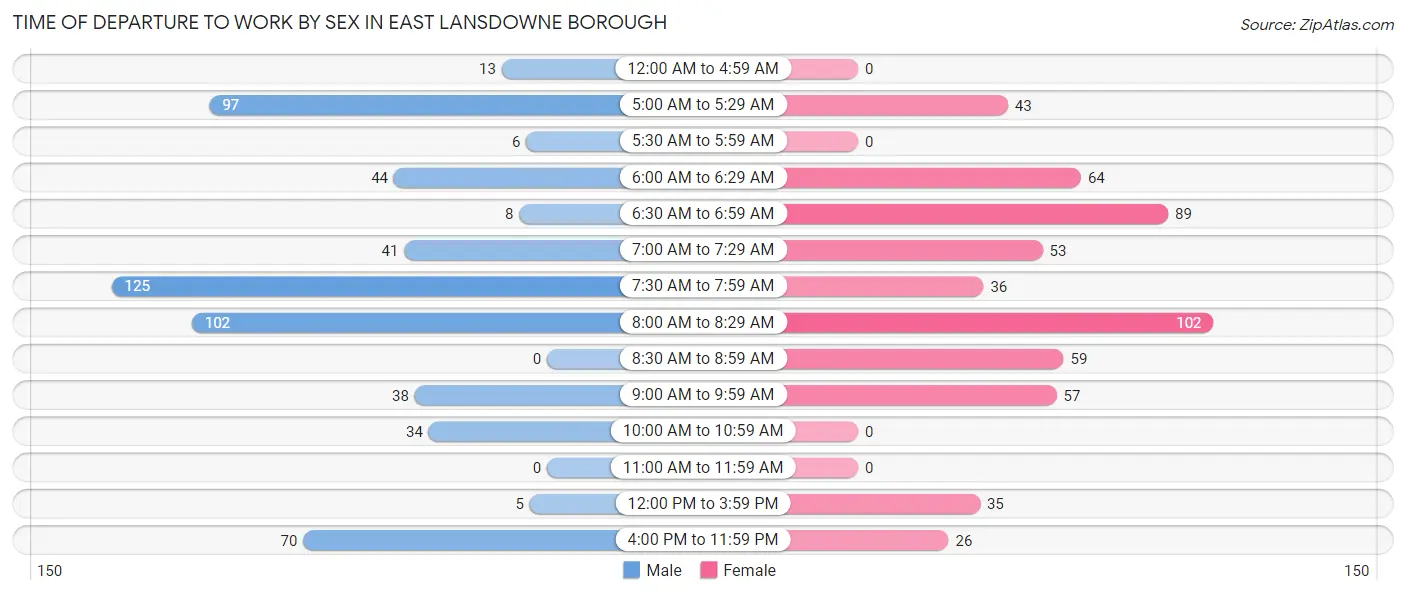
| Time of Departure | Male | Female |
| 12:00 AM to 4:59 AM | 13 (2.2%) | 0 (0.0%) |
| 5:00 AM to 5:29 AM | 97 (16.6%) | 43 (7.6%) |
| 5:30 AM to 5:59 AM | 6 (1.0%) | 0 (0.0%) |
| 6:00 AM to 6:29 AM | 44 (7.5%) | 64 (11.4%) |
| 6:30 AM to 6:59 AM | 8 (1.4%) | 89 (15.8%) |
| 7:00 AM to 7:29 AM | 41 (7.0%) | 53 (9.4%) |
| 7:30 AM to 7:59 AM | 125 (21.4%) | 36 (6.4%) |
| 8:00 AM to 8:29 AM | 102 (17.5%) | 102 (18.1%) |
| 8:30 AM to 8:59 AM | 0 (0.0%) | 59 (10.5%) |
| 9:00 AM to 9:59 AM | 38 (6.5%) | 57 (10.1%) |
| 10:00 AM to 10:59 AM | 34 (5.8%) | 0 (0.0%) |
| 11:00 AM to 11:59 AM | 0 (0.0%) | 0 (0.0%) |
| 12:00 PM to 3:59 PM | 5 (0.9%) | 35 (6.2%) |
| 4:00 PM to 11:59 PM | 70 (12.0%) | 26 (4.6%) |
| Total | 583 (100.0%) | 564 (100.0%) |
Housing Occupancy in East Lansdowne borough
Occupancy by Ownership in East Lansdowne borough
Of the total 1,188 dwellings in East Lansdowne borough, owner-occupied units account for 724 (60.9%), while renter-occupied units make up 464 (39.1%).
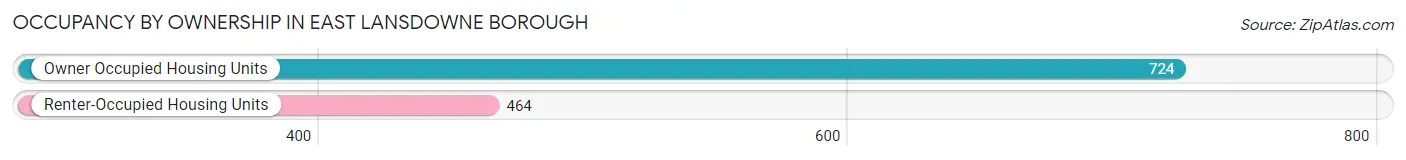
| Occupancy | # Housing Units | % Housing Units |
| Owner Occupied Housing Units | 724 | 60.9% |
| Renter-Occupied Housing Units | 464 | 39.1% |
| Total Occupied Housing Units | 1,188 | 100.0% |
Occupancy by Household Size in East Lansdowne borough
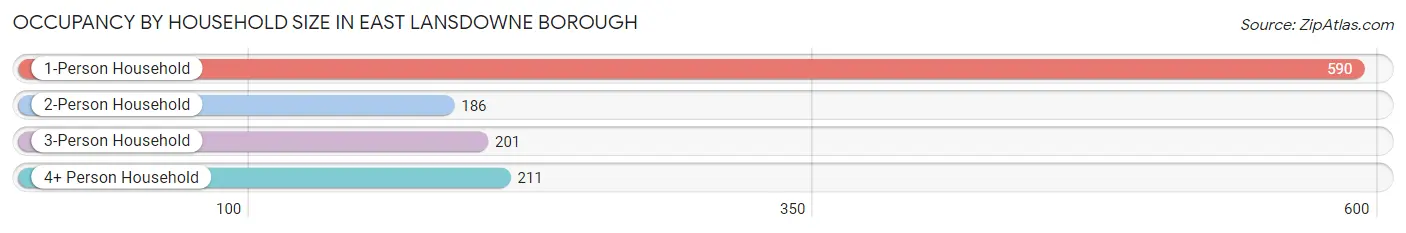
| Household Size | # Housing Units | % Housing Units |
| 1-Person Household | 590 | 49.7% |
| 2-Person Household | 186 | 15.7% |
| 3-Person Household | 201 | 16.9% |
| 4+ Person Household | 211 | 17.8% |
| Total Housing Units | 1,188 | 100.0% |
Occupancy by Ownership by Household Size in East Lansdowne borough
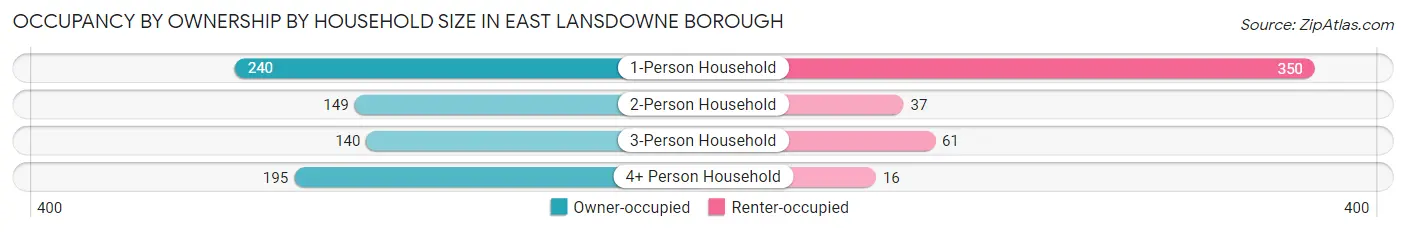
| Household Size | Owner-occupied | Renter-occupied |
| 1-Person Household | 240 (40.7%) | 350 (59.3%) |
| 2-Person Household | 149 (80.1%) | 37 (19.9%) |
| 3-Person Household | 140 (69.7%) | 61 (30.3%) |
| 4+ Person Household | 195 (92.4%) | 16 (7.6%) |
| Total Housing Units | 724 (60.9%) | 464 (39.1%) |
Occupancy by Educational Attainment in East Lansdowne borough
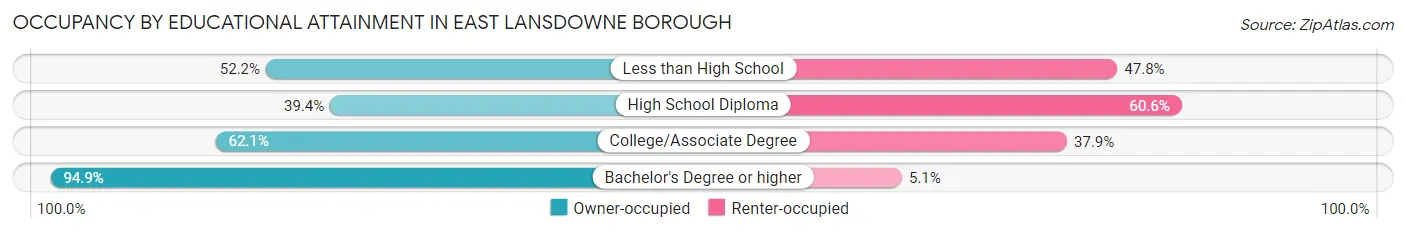
| Household Size | Owner-occupied | Renter-occupied |
| Less than High School | 36 (52.2%) | 33 (47.8%) |
| High School Diploma | 168 (39.4%) | 258 (60.6%) |
| College/Associate Degree | 261 (62.1%) | 159 (37.9%) |
| Bachelor's Degree or higher | 259 (94.9%) | 14 (5.1%) |
Occupancy by Age of Householder in East Lansdowne borough
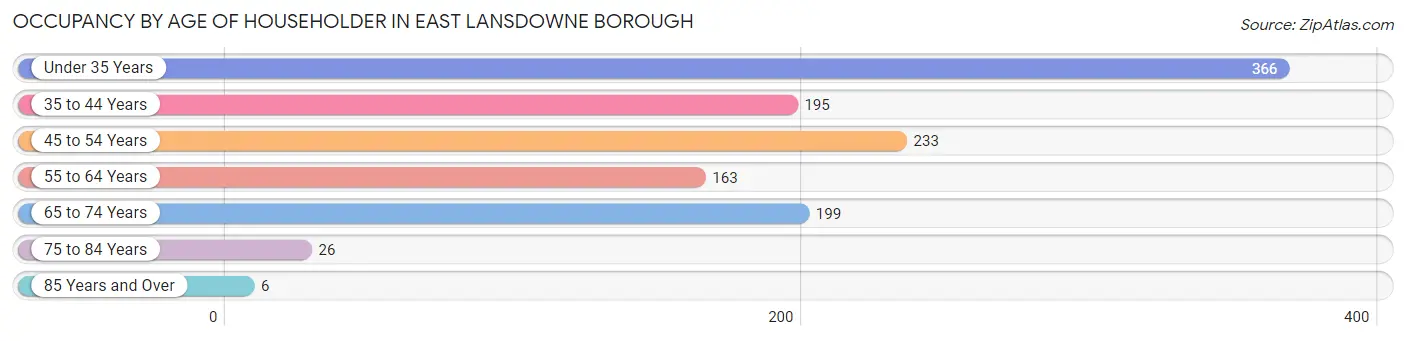
| Age Bracket | # Households | % Households |
| Under 35 Years | 366 | 30.8% |
| 35 to 44 Years | 195 | 16.4% |
| 45 to 54 Years | 233 | 19.6% |
| 55 to 64 Years | 163 | 13.7% |
| 65 to 74 Years | 199 | 16.8% |
| 75 to 84 Years | 26 | 2.2% |
| 85 Years and Over | 6 | 0.5% |
| Total | 1,188 | 100.0% |
Housing Finances in East Lansdowne borough
Median Income by Occupancy in East Lansdowne borough
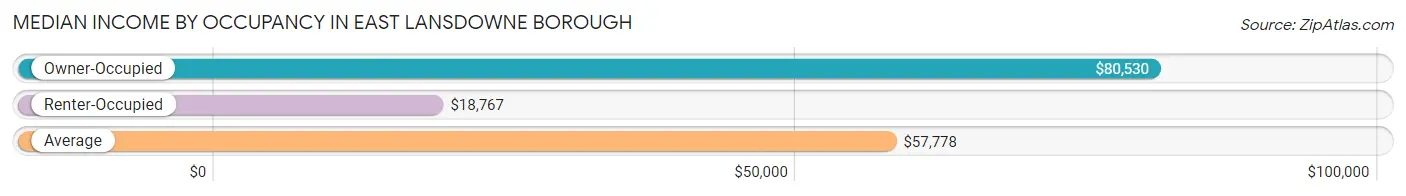
| Occupancy Type | # Households | Median Income |
| Owner-Occupied | 724 (60.9%) | $80,530 |
| Renter-Occupied | 464 (39.1%) | $18,767 |
| Average | 1,188 (100.0%) | $57,778 |
Occupancy by Householder Income Bracket in East Lansdowne borough
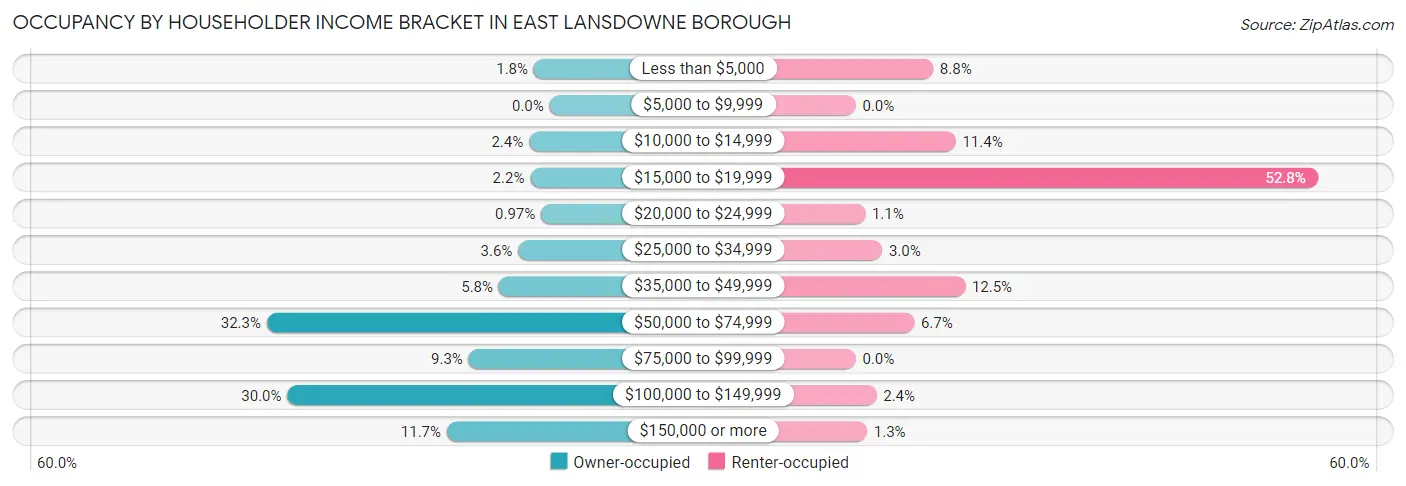
| Income Bracket | Owner-occupied | Renter-occupied |
| Less than $5,000 | 13 (1.8%) | 41 (8.8%) |
| $5,000 to $9,999 | 0 (0.0%) | 0 (0.0%) |
| $10,000 to $14,999 | 17 (2.4%) | 53 (11.4%) |
| $15,000 to $19,999 | 16 (2.2%) | 245 (52.8%) |
| $20,000 to $24,999 | 7 (1.0%) | 5 (1.1%) |
| $25,000 to $34,999 | 26 (3.6%) | 14 (3.0%) |
| $35,000 to $49,999 | 42 (5.8%) | 58 (12.5%) |
| $50,000 to $74,999 | 234 (32.3%) | 31 (6.7%) |
| $75,000 to $99,999 | 67 (9.2%) | 0 (0.0%) |
| $100,000 to $149,999 | 217 (30.0%) | 11 (2.4%) |
| $150,000 or more | 85 (11.7%) | 6 (1.3%) |
| Total | 724 (100.0%) | 464 (100.0%) |
Monthly Housing Cost Tiers in East Lansdowne borough
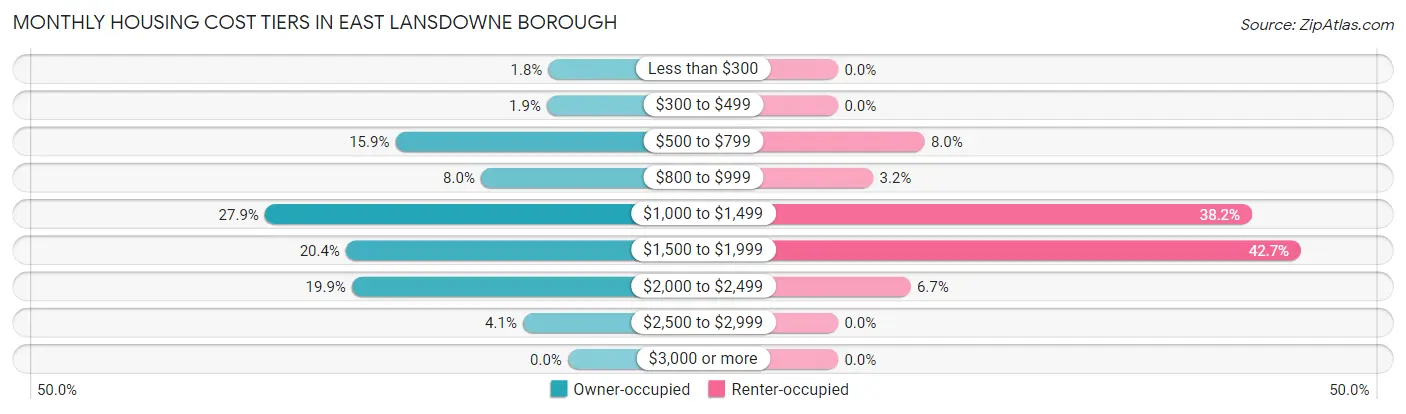
| Monthly Cost | Owner-occupied | Renter-occupied |
| Less than $300 | 13 (1.8%) | 0 (0.0%) |
| $300 to $499 | 14 (1.9%) | 0 (0.0%) |
| $500 to $799 | 115 (15.9%) | 37 (8.0%) |
| $800 to $999 | 58 (8.0%) | 15 (3.2%) |
| $1,000 to $1,499 | 202 (27.9%) | 177 (38.2%) |
| $1,500 to $1,999 | 148 (20.4%) | 198 (42.7%) |
| $2,000 to $2,499 | 144 (19.9%) | 31 (6.7%) |
| $2,500 to $2,999 | 30 (4.1%) | 0 (0.0%) |
| $3,000 or more | 0 (0.0%) | 0 (0.0%) |
| Total | 724 (100.0%) | 464 (100.0%) |
Physical Housing Characteristics in East Lansdowne borough
Housing Structures in East Lansdowne borough
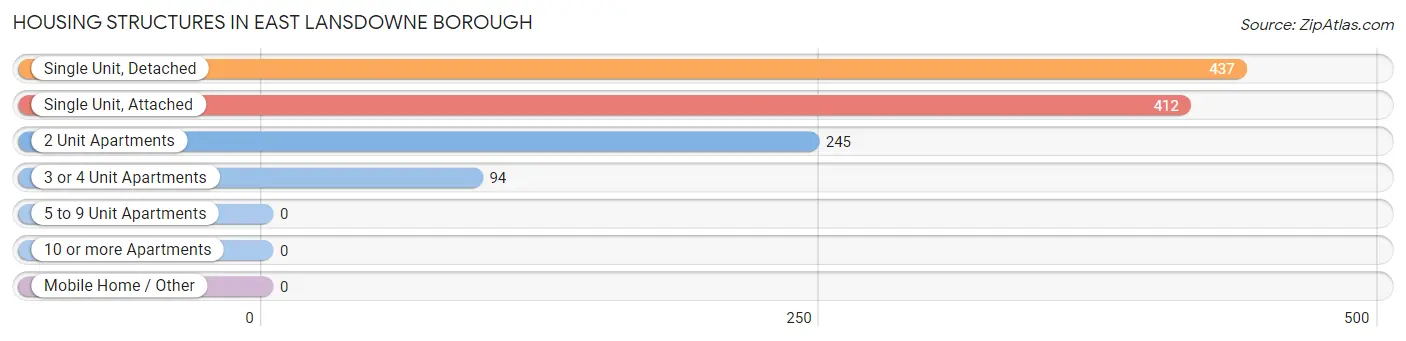
| Structure Type | # Housing Units | % Housing Units |
| Single Unit, Detached | 437 | 36.8% |
| Single Unit, Attached | 412 | 34.7% |
| 2 Unit Apartments | 245 | 20.6% |
| 3 or 4 Unit Apartments | 94 | 7.9% |
| 5 to 9 Unit Apartments | 0 | 0.0% |
| 10 or more Apartments | 0 | 0.0% |
| Mobile Home / Other | 0 | 0.0% |
| Total | 1,188 | 100.0% |
Housing Structures by Occupancy in East Lansdowne borough
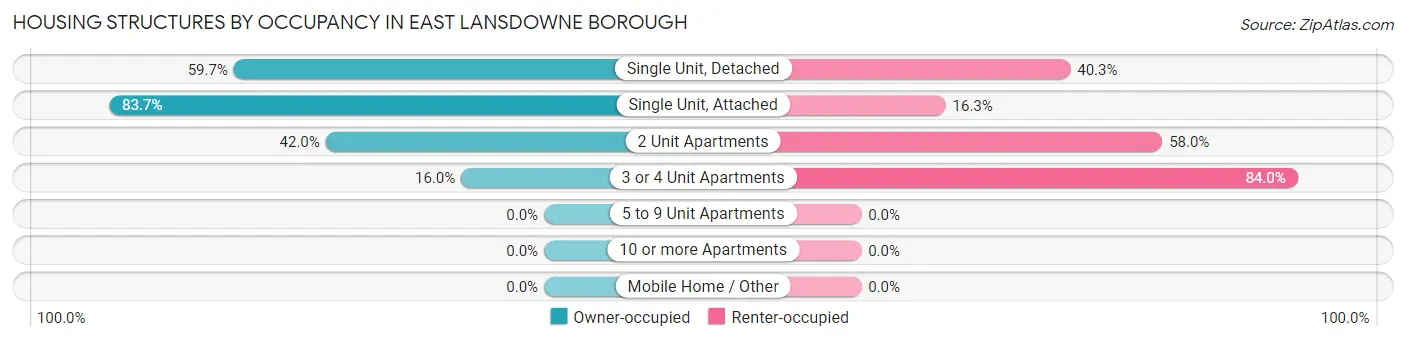
| Structure Type | Owner-occupied | Renter-occupied |
| Single Unit, Detached | 261 (59.7%) | 176 (40.3%) |
| Single Unit, Attached | 345 (83.7%) | 67 (16.3%) |
| 2 Unit Apartments | 103 (42.0%) | 142 (58.0%) |
| 3 or 4 Unit Apartments | 15 (16.0%) | 79 (84.0%) |
| 5 to 9 Unit Apartments | 0 (0.0%) | 0 (0.0%) |
| 10 or more Apartments | 0 (0.0%) | 0 (0.0%) |
| Mobile Home / Other | 0 (0.0%) | 0 (0.0%) |
| Total | 724 (60.9%) | 464 (39.1%) |
Housing Structures by Number of Rooms in East Lansdowne borough
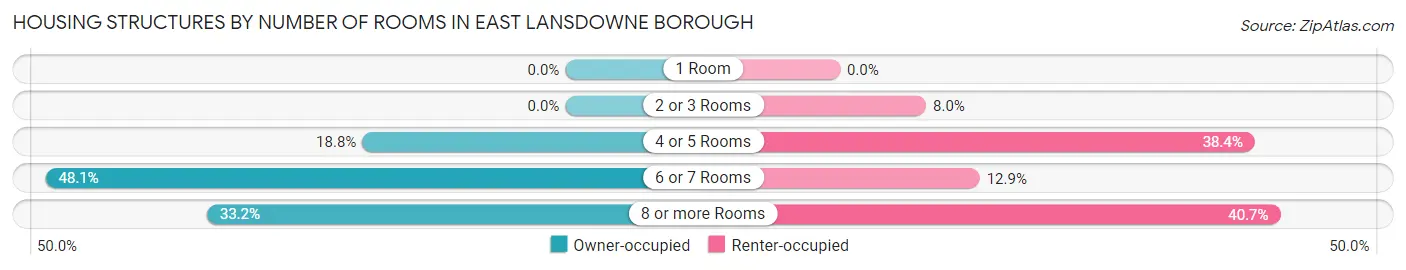
| Number of Rooms | Owner-occupied | Renter-occupied |
| 1 Room | 0 (0.0%) | 0 (0.0%) |
| 2 or 3 Rooms | 0 (0.0%) | 37 (8.0%) |
| 4 or 5 Rooms | 136 (18.8%) | 178 (38.4%) |
| 6 or 7 Rooms | 348 (48.1%) | 60 (12.9%) |
| 8 or more Rooms | 240 (33.2%) | 189 (40.7%) |
| Total | 724 (100.0%) | 464 (100.0%) |
Housing Structure by Heating Type in East Lansdowne borough
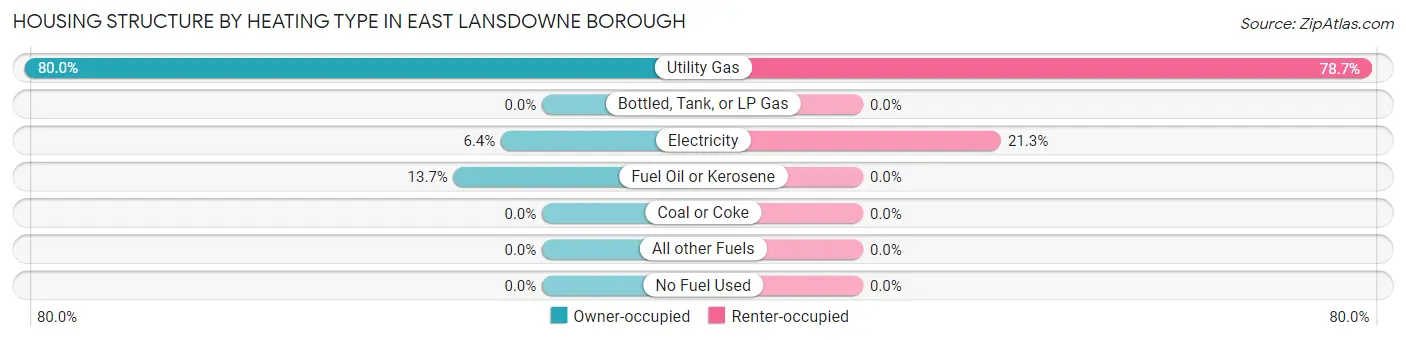
| Heating Type | Owner-occupied | Renter-occupied |
| Utility Gas | 579 (80.0%) | 365 (78.7%) |
| Bottled, Tank, or LP Gas | 0 (0.0%) | 0 (0.0%) |
| Electricity | 46 (6.4%) | 99 (21.3%) |
| Fuel Oil or Kerosene | 99 (13.7%) | 0 (0.0%) |
| Coal or Coke | 0 (0.0%) | 0 (0.0%) |
| All other Fuels | 0 (0.0%) | 0 (0.0%) |
| No Fuel Used | 0 (0.0%) | 0 (0.0%) |
| Total | 724 (100.0%) | 464 (100.0%) |
Household Vehicle Usage in East Lansdowne borough
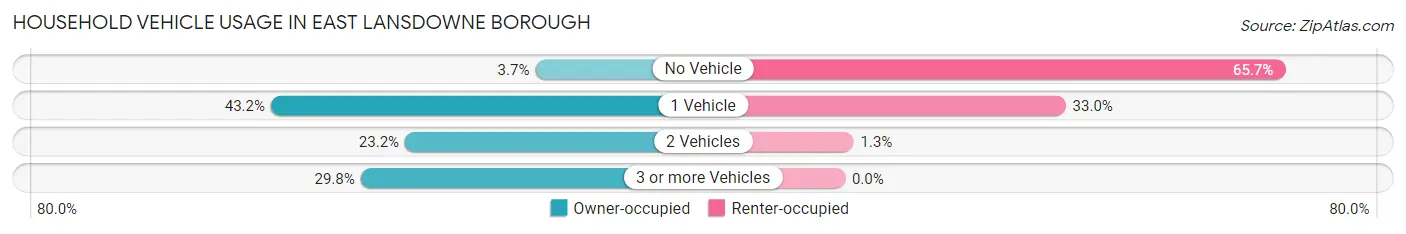
| Vehicles per Household | Owner-occupied | Renter-occupied |
| No Vehicle | 27 (3.7%) | 305 (65.7%) |
| 1 Vehicle | 313 (43.2%) | 153 (33.0%) |
| 2 Vehicles | 168 (23.2%) | 6 (1.3%) |
| 3 or more Vehicles | 216 (29.8%) | 0 (0.0%) |
| Total | 724 (100.0%) | 464 (100.0%) |
Real Estate & Mortgages in East Lansdowne borough
Real Estate and Mortgage Overview in East Lansdowne borough
| Characteristic | Without Mortgage | With Mortgage |
| Housing Units | 234 | 490 |
| Median Property Value | $151,000 | $193,600 |
| Median Household Income | $63,529 | $48 |
| Monthly Housing Costs | $655 | $0 |
| Real Estate Taxes | $3,839 | $0 |
Property Value by Mortgage Status in East Lansdowne borough
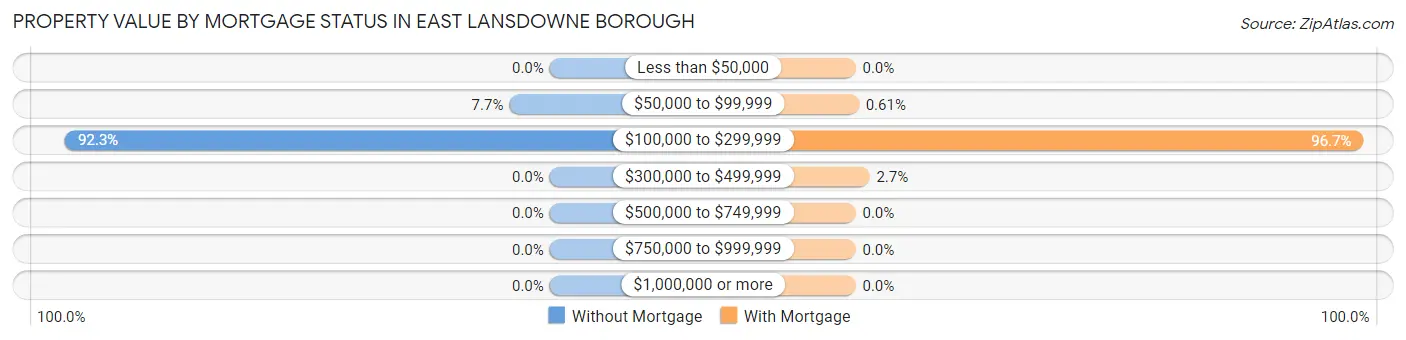
| Property Value | Without Mortgage | With Mortgage |
| Less than $50,000 | 0 (0.0%) | 0 (0.0%) |
| $50,000 to $99,999 | 18 (7.7%) | 3 (0.6%) |
| $100,000 to $299,999 | 216 (92.3%) | 474 (96.7%) |
| $300,000 to $499,999 | 0 (0.0%) | 13 (2.6%) |
| $500,000 to $749,999 | 0 (0.0%) | 0 (0.0%) |
| $750,000 to $999,999 | 0 (0.0%) | 0 (0.0%) |
| $1,000,000 or more | 0 (0.0%) | 0 (0.0%) |
| Total | 234 (100.0%) | 490 (100.0%) |
Household Income by Mortgage Status in East Lansdowne borough
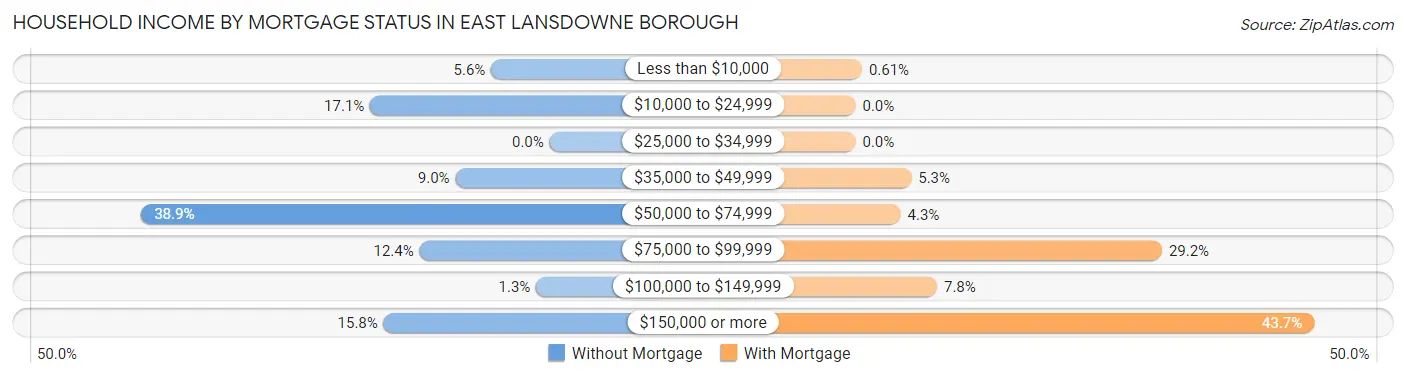
| Household Income | Without Mortgage | With Mortgage |
| Less than $10,000 | 13 (5.6%) | 3 (0.6%) |
| $10,000 to $24,999 | 40 (17.1%) | 0 (0.0%) |
| $25,000 to $34,999 | 0 (0.0%) | 0 (0.0%) |
| $35,000 to $49,999 | 21 (9.0%) | 26 (5.3%) |
| $50,000 to $74,999 | 91 (38.9%) | 21 (4.3%) |
| $75,000 to $99,999 | 29 (12.4%) | 143 (29.2%) |
| $100,000 to $149,999 | 3 (1.3%) | 38 (7.8%) |
| $150,000 or more | 37 (15.8%) | 214 (43.7%) |
| Total | 234 (100.0%) | 490 (100.0%) |
Property Value to Household Income Ratio in East Lansdowne borough
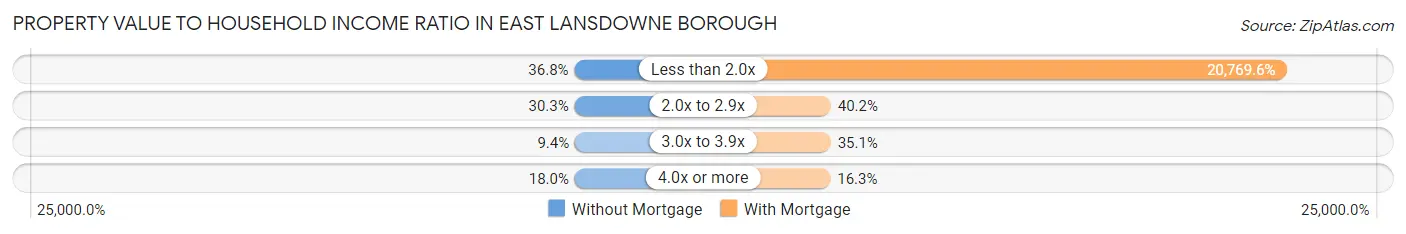
| Value-to-Income Ratio | Without Mortgage | With Mortgage |
| Less than 2.0x | 86 (36.7%) | 101,771 (20,769.6%) |
| 2.0x to 2.9x | 71 (30.3%) | 197 (40.2%) |
| 3.0x to 3.9x | 22 (9.4%) | 172 (35.1%) |
| 4.0x or more | 42 (17.9%) | 80 (16.3%) |
| Total | 234 (100.0%) | 490 (100.0%) |
Real Estate Taxes by Mortgage Status in East Lansdowne borough
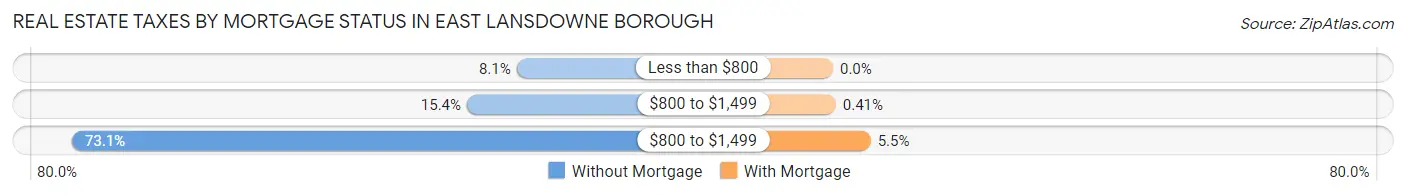
| Property Taxes | Without Mortgage | With Mortgage |
| Less than $800 | 19 (8.1%) | 0 (0.0%) |
| $800 to $1,499 | 36 (15.4%) | 2 (0.4%) |
| $800 to $1,499 | 171 (73.1%) | 27 (5.5%) |
| Total | 234 (100.0%) | 490 (100.0%) |
Health & Disability in East Lansdowne borough
Health Insurance Coverage by Age in East Lansdowne borough
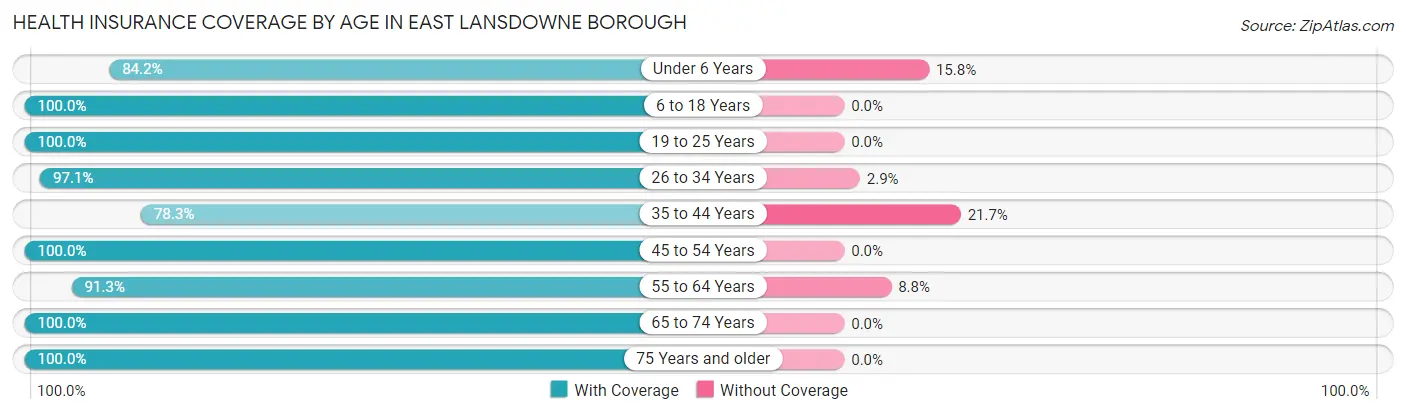
| Age Bracket | With Coverage | Without Coverage |
| Under 6 Years | 112 (84.2%) | 21 (15.8%) |
| 6 to 18 Years | 382 (100.0%) | 0 (0.0%) |
| 19 to 25 Years | 242 (100.0%) | 0 (0.0%) |
| 26 to 34 Years | 570 (97.1%) | 17 (2.9%) |
| 35 to 44 Years | 274 (78.3%) | 76 (21.7%) |
| 45 to 54 Years | 376 (100.0%) | 0 (0.0%) |
| 55 to 64 Years | 292 (91.2%) | 28 (8.7%) |
| 65 to 74 Years | 274 (100.0%) | 0 (0.0%) |
| 75 Years and older | 39 (100.0%) | 0 (0.0%) |
| Total | 2,561 (94.8%) | 142 (5.2%) |
Health Insurance Coverage by Citizenship Status in East Lansdowne borough
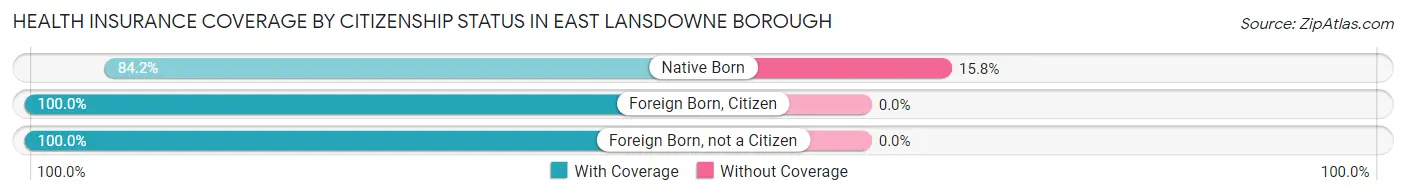
| Citizenship Status | With Coverage | Without Coverage |
| Native Born | 112 (84.2%) | 21 (15.8%) |
| Foreign Born, Citizen | 382 (100.0%) | 0 (0.0%) |
| Foreign Born, not a Citizen | 242 (100.0%) | 0 (0.0%) |
Health Insurance Coverage by Household Income in East Lansdowne borough
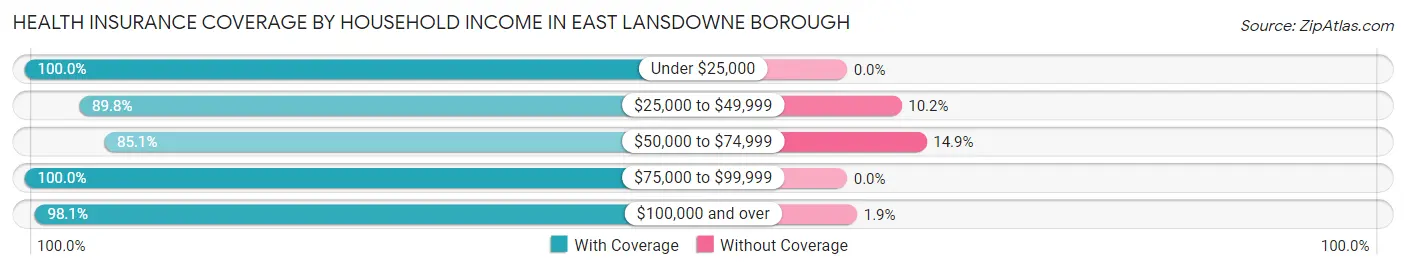
| Household Income | With Coverage | Without Coverage |
| Under $25,000 | 532 (100.0%) | 0 (0.0%) |
| $25,000 to $49,999 | 343 (89.8%) | 39 (10.2%) |
| $50,000 to $74,999 | 486 (85.1%) | 85 (14.9%) |
| $75,000 to $99,999 | 245 (100.0%) | 0 (0.0%) |
| $100,000 and over | 946 (98.1%) | 18 (1.9%) |
Public vs Private Health Insurance Coverage by Age in East Lansdowne borough
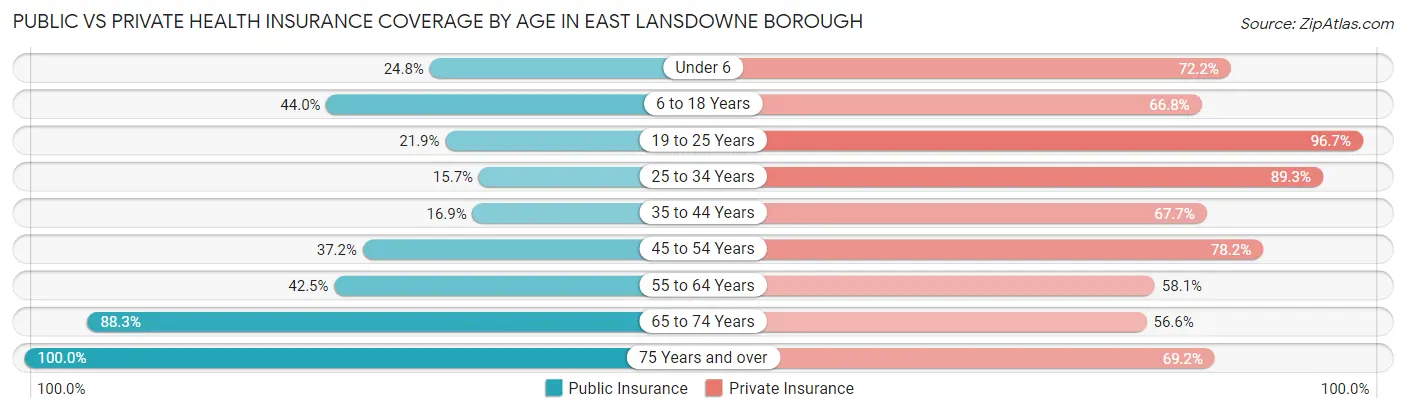
| Age Bracket | Public Insurance | Private Insurance |
| Under 6 | 33 (24.8%) | 96 (72.2%) |
| 6 to 18 Years | 168 (44.0%) | 255 (66.7%) |
| 19 to 25 Years | 53 (21.9%) | 234 (96.7%) |
| 25 to 34 Years | 92 (15.7%) | 524 (89.3%) |
| 35 to 44 Years | 59 (16.9%) | 237 (67.7%) |
| 45 to 54 Years | 140 (37.2%) | 294 (78.2%) |
| 55 to 64 Years | 136 (42.5%) | 186 (58.1%) |
| 65 to 74 Years | 242 (88.3%) | 155 (56.6%) |
| 75 Years and over | 39 (100.0%) | 27 (69.2%) |
| Total | 962 (35.6%) | 2,008 (74.3%) |
Disability Status by Sex by Age in East Lansdowne borough
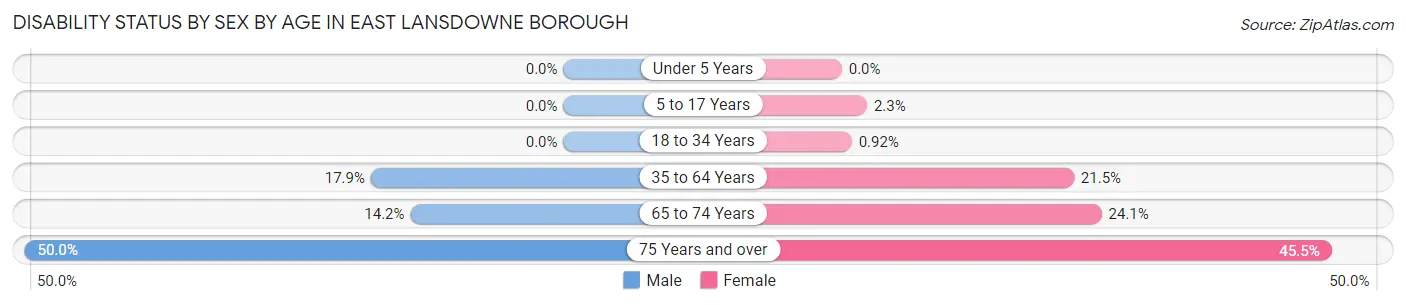
| Age Bracket | Male | Female |
| Under 5 Years | 0 (0.0%) | 0 (0.0%) |
| 5 to 17 Years | 0 (0.0%) | 4 (2.3%) |
| 18 to 34 Years | 0 (0.0%) | 5 (0.9%) |
| 35 to 64 Years | 94 (17.9%) | 112 (21.5%) |
| 65 to 74 Years | 23 (14.2%) | 27 (24.1%) |
| 75 Years and over | 14 (50.0%) | 5 (45.5%) |
Disability Class by Sex by Age in East Lansdowne borough
Disability Class: Hearing Difficulty
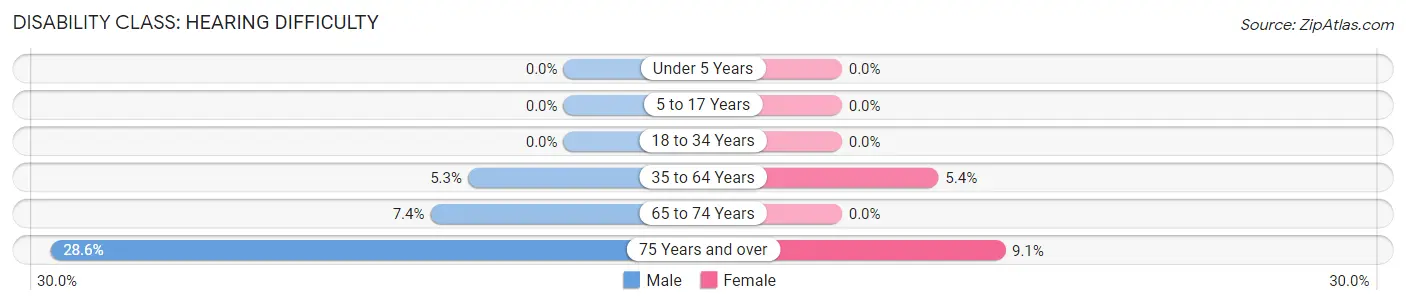
| Age Bracket | Male | Female |
| Under 5 Years | 0 (0.0%) | 0 (0.0%) |
| 5 to 17 Years | 0 (0.0%) | 0 (0.0%) |
| 18 to 34 Years | 0 (0.0%) | 0 (0.0%) |
| 35 to 64 Years | 28 (5.3%) | 28 (5.4%) |
| 65 to 74 Years | 12 (7.4%) | 0 (0.0%) |
| 75 Years and over | 8 (28.6%) | 1 (9.1%) |
Disability Class: Vision Difficulty
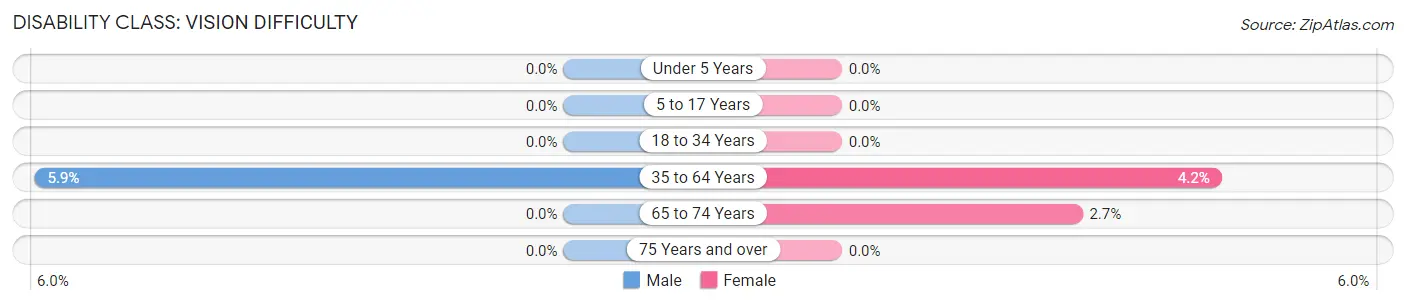
| Age Bracket | Male | Female |
| Under 5 Years | 0 (0.0%) | 0 (0.0%) |
| 5 to 17 Years | 0 (0.0%) | 0 (0.0%) |
| 18 to 34 Years | 0 (0.0%) | 0 (0.0%) |
| 35 to 64 Years | 31 (5.9%) | 22 (4.2%) |
| 65 to 74 Years | 0 (0.0%) | 3 (2.7%) |
| 75 Years and over | 0 (0.0%) | 0 (0.0%) |
Disability Class: Cognitive Difficulty
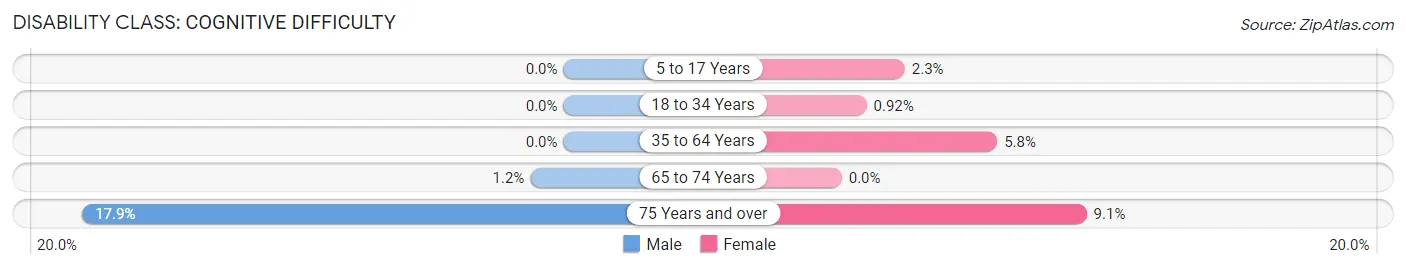
| Age Bracket | Male | Female |
| 5 to 17 Years | 0 (0.0%) | 4 (2.3%) |
| 18 to 34 Years | 0 (0.0%) | 5 (0.9%) |
| 35 to 64 Years | 0 (0.0%) | 30 (5.8%) |
| 65 to 74 Years | 2 (1.2%) | 0 (0.0%) |
| 75 Years and over | 5 (17.9%) | 1 (9.1%) |
Disability Class: Ambulatory Difficulty
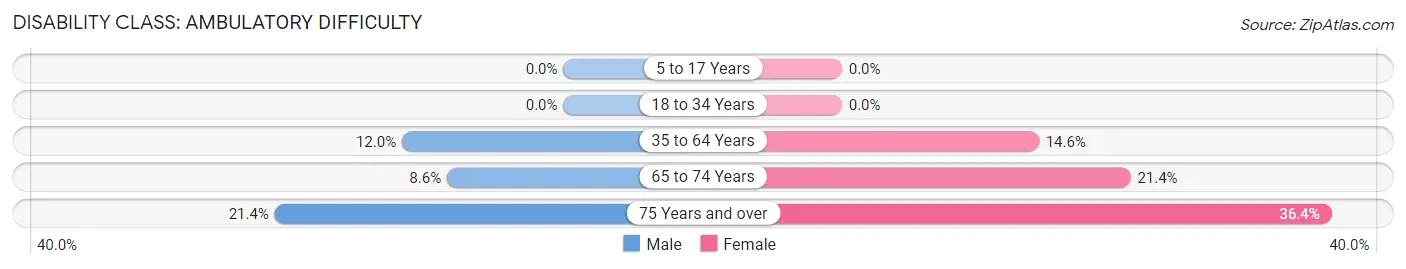
| Age Bracket | Male | Female |
| 5 to 17 Years | 0 (0.0%) | 0 (0.0%) |
| 18 to 34 Years | 0 (0.0%) | 0 (0.0%) |
| 35 to 64 Years | 63 (12.0%) | 76 (14.6%) |
| 65 to 74 Years | 14 (8.6%) | 24 (21.4%) |
| 75 Years and over | 6 (21.4%) | 4 (36.4%) |
Disability Class: Self-Care Difficulty
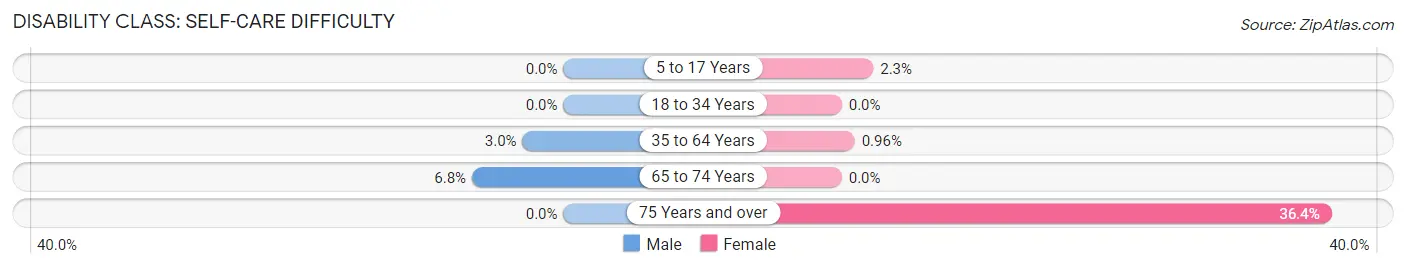
| Age Bracket | Male | Female |
| 5 to 17 Years | 0 (0.0%) | 4 (2.3%) |
| 18 to 34 Years | 0 (0.0%) | 0 (0.0%) |
| 35 to 64 Years | 16 (3.0%) | 5 (1.0%) |
| 65 to 74 Years | 11 (6.8%) | 0 (0.0%) |
| 75 Years and over | 0 (0.0%) | 4 (36.4%) |
Technology Access in East Lansdowne borough
Computing Device Access in East Lansdowne borough
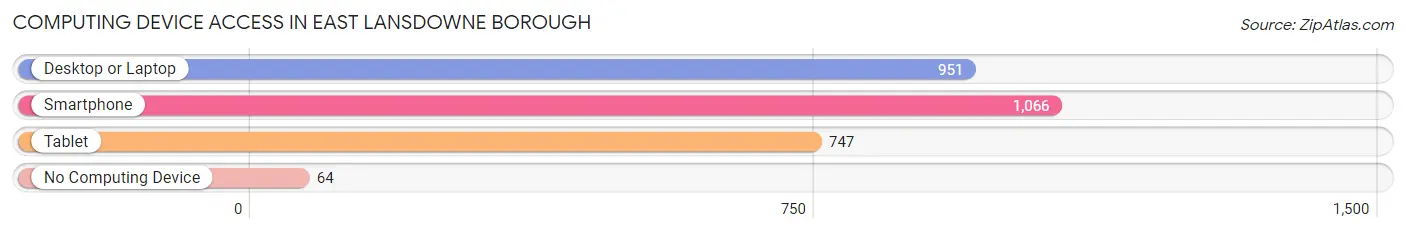
| Device Type | # Households | % Households |
| Desktop or Laptop | 951 | 80.0% |
| Smartphone | 1,066 | 89.7% |
| Tablet | 747 | 62.9% |
| No Computing Device | 64 | 5.4% |
| Total | 1,188 | 100.0% |
Internet Access in East Lansdowne borough
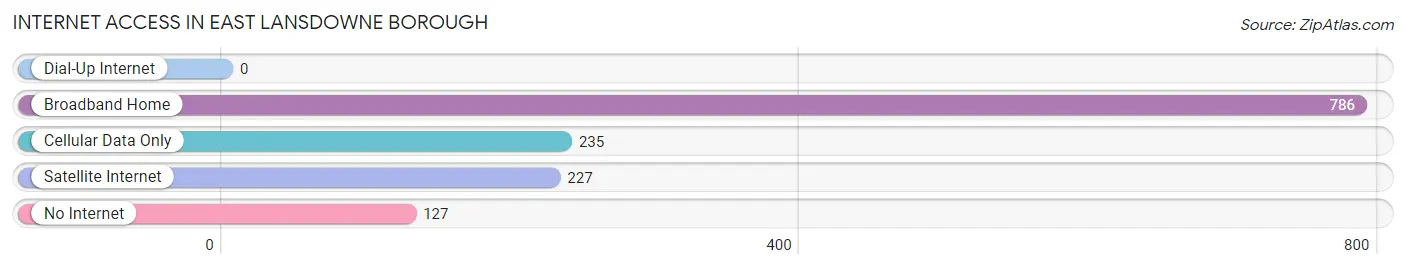
| Internet Type | # Households | % Households |
| Dial-Up Internet | 0 | 0.0% |
| Broadband Home | 786 | 66.2% |
| Cellular Data Only | 235 | 19.8% |
| Satellite Internet | 227 | 19.1% |
| No Internet | 127 | 10.7% |
| Total | 1,188 | 100.0% |
East Lansdowne borough Summary
East Lansdowne Borough is a small borough located in Delaware County, Pennsylvania. It is situated just west of the city of Philadelphia and is part of the Philadelphia metropolitan area. The borough was incorporated in 1924 and has a population of approximately 3,500 people.
History
East Lansdowne Borough was originally part of Darby Township, which was established in 1682. The area was first settled by Quakers in the late 17th century and was known as “Lansdowne” after the Earl of Lansdowne, who was a prominent figure in the British government at the time. The area was primarily agricultural until the late 19th century, when it began to develop into a residential community. The borough was officially incorporated in 1924 and has remained relatively unchanged since then.
Geography
East Lansdowne Borough is located in southeastern Pennsylvania, just west of the city of Philadelphia. It is situated in Delaware County and is bordered by Darby Township to the north, Yeadon Borough to the east, Upper Darby Township to the south, and Clifton Heights Borough to the west. The borough covers an area of 0.6 square miles and is primarily residential.
Economy
East Lansdowne Borough has a small, but diverse economy. The borough is home to a variety of small businesses, including restaurants, retail stores, and professional services. The borough also has a few larger employers, such as the East Lansdowne Post Office and the East Lansdowne Fire Company. The borough is also home to a number of industrial and manufacturing businesses, including a printing company and a metal fabrication shop.
Demographics
As of the 2010 census, East Lansdowne Borough had a population of 3,541 people. The racial makeup of the borough was 79.3% White, 14.2% African American, 0.3% Native American, 1.2% Asian, and 4.9% from other races. The median household income was $45,945 and the median family income was $54,945. The per capita income was $20,945. The unemployment rate was 6.2%.
East Lansdowne Borough is a small, but vibrant community. The borough has a diverse population and a strong economy. The borough is home to a variety of businesses and is a great place to live and work.
Common Questions
What is Per Capita Income in East Lansdowne borough?
Per Capita income in East Lansdowne borough is $32,312.
What is the Median Family Income in East Lansdowne borough?
Median Family Income in East Lansdowne borough is $74,150.
What is the Median Household income in East Lansdowne borough?
Median Household Income in East Lansdowne borough is $57,778.
What is Income or Wage Gap in East Lansdowne borough?
Income or Wage Gap in East Lansdowne borough is 36.0%.
Women in East Lansdowne borough earn 64.0 cents for every dollar earned by a man.
What is Inequality or Gini Index in East Lansdowne borough?
Inequality or Gini Index in East Lansdowne borough is 0.47.
What is the Total Population of East Lansdowne borough?
Total Population of East Lansdowne borough is 2,703.
What is the Total Male Population of East Lansdowne borough?
Total Male Population of East Lansdowne borough is 1,251.
What is the Total Female Population of East Lansdowne borough?
Total Female Population of East Lansdowne borough is 1,452.
What is the Ratio of Males per 100 Females in East Lansdowne borough?
There are 86.16 Males per 100 Females in East Lansdowne borough.
What is the Ratio of Females per 100 Males in East Lansdowne borough?
There are 116.07 Females per 100 Males in East Lansdowne borough.
What is the Median Population Age in East Lansdowne borough?
Median Population Age in East Lansdowne borough is 35.1 Years.
What is the Average Family Size in East Lansdowne borough
Average Family Size in East Lansdowne borough is 3.4 People.
What is the Average Household Size in East Lansdowne borough
Average Household Size in East Lansdowne borough is 2.3 People.
How Large is the Labor Force in East Lansdowne borough?
There are 1,687 People in the Labor Forcein in East Lansdowne borough.
What is the Percentage of People in the Labor Force in East Lansdowne borough?
74.9% of People are in the Labor Force in East Lansdowne borough.
What is the Unemployment Rate in East Lansdowne borough?
Unemployment Rate in East Lansdowne borough is 10.1%.