Plains, PA Map & Demographics
Plains Map
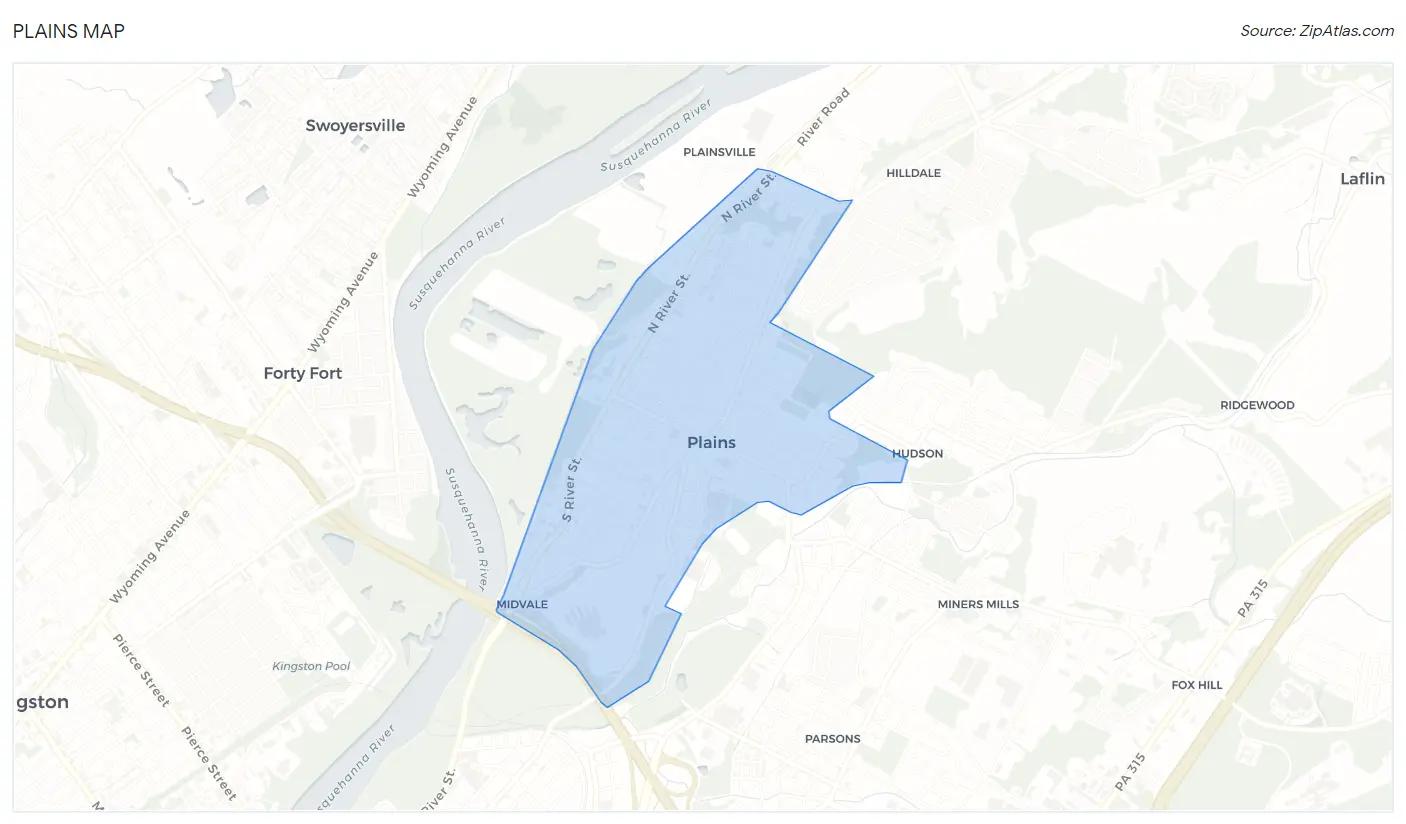
Plains Overview
$32,609
PER CAPITA INCOME
$81,829
AVG FAMILY INCOME
$64,049
AVG HOUSEHOLD INCOME
25.2%
WAGE / INCOME GAP [ % ]
74.8¢/ $1
WAGE / INCOME GAP [ $ ]
0.38
INEQUALITY / GINI INDEX
4,205
TOTAL POPULATION
2,073
MALE POPULATION
2,132
FEMALE POPULATION
97.23
MALES / 100 FEMALES
102.85
FEMALES / 100 MALES
44.1
MEDIAN AGE
2.9
AVG FAMILY SIZE
2.3
AVG HOUSEHOLD SIZE
2,423
LABOR FORCE [ PEOPLE ]
65.5%
PERCENT IN LABOR FORCE
6.3%
UNEMPLOYMENT RATE
Plains Area Codes
Income in Plains
Income Overview in Plains
Per Capita Income in Plains is $32,609, while median incomes of families and households are $81,829 and $64,049 respectively.
| Characteristic | Number | Measure |
| Per Capita Income | 4,205 | $32,609 |
| Median Family Income | 1,095 | $81,829 |
| Mean Family Income | 1,095 | $91,327 |
| Median Household Income | 1,811 | $64,049 |
| Mean Household Income | 1,811 | $74,773 |
| Income Deficit | 1,095 | $0 |
| Wage / Income Gap (%) | 4,205 | 25.16% |
| Wage / Income Gap ($) | 4,205 | 74.84¢ per $1 |
| Gini / Inequality Index | 4,205 | 0.38 |
Earnings by Sex in Plains
Average Earnings in Plains are $34,075, $39,583 for men and $29,625 for women, a difference of 25.2%.
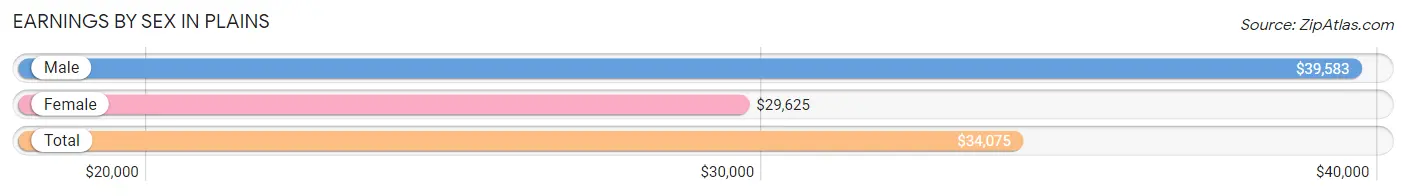
| Sex | Number | Average Earnings |
| Male | 1,274 (51.1%) | $39,583 |
| Female | 1,219 (48.9%) | $29,625 |
| Total | 2,493 (100.0%) | $34,075 |
Earnings by Sex by Income Bracket in Plains
The most common earnings brackets in Plains are $12,500 to $14,999 for men (233 | 18.3%) and $22,500 to $24,999 for women (138 | 11.3%).
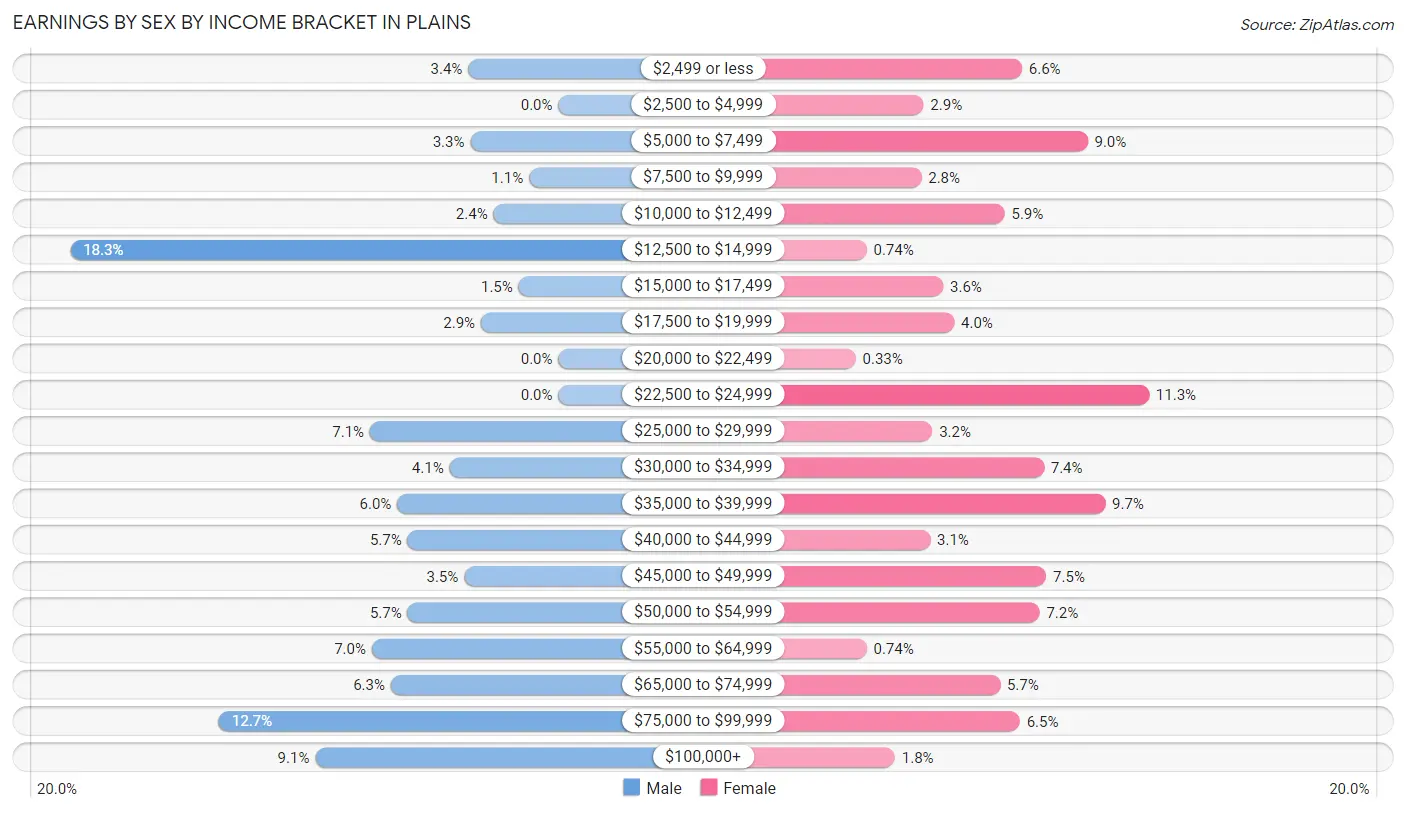
| Income | Male | Female |
| $2,499 or less | 43 (3.4%) | 80 (6.6%) |
| $2,500 to $4,999 | 0 (0.0%) | 35 (2.9%) |
| $5,000 to $7,499 | 42 (3.3%) | 110 (9.0%) |
| $7,500 to $9,999 | 14 (1.1%) | 34 (2.8%) |
| $10,000 to $12,499 | 31 (2.4%) | 72 (5.9%) |
| $12,500 to $14,999 | 233 (18.3%) | 9 (0.7%) |
| $15,000 to $17,499 | 19 (1.5%) | 44 (3.6%) |
| $17,500 to $19,999 | 37 (2.9%) | 49 (4.0%) |
| $20,000 to $22,499 | 0 (0.0%) | 4 (0.3%) |
| $22,500 to $24,999 | 0 (0.0%) | 138 (11.3%) |
| $25,000 to $29,999 | 90 (7.1%) | 39 (3.2%) |
| $30,000 to $34,999 | 52 (4.1%) | 90 (7.4%) |
| $35,000 to $39,999 | 77 (6.0%) | 118 (9.7%) |
| $40,000 to $44,999 | 72 (5.7%) | 38 (3.1%) |
| $45,000 to $49,999 | 45 (3.5%) | 91 (7.5%) |
| $50,000 to $54,999 | 72 (5.7%) | 88 (7.2%) |
| $55,000 to $64,999 | 89 (7.0%) | 9 (0.7%) |
| $65,000 to $74,999 | 80 (6.3%) | 70 (5.7%) |
| $75,000 to $99,999 | 162 (12.7%) | 79 (6.5%) |
| $100,000+ | 116 (9.1%) | 22 (1.8%) |
| Total | 1,274 (100.0%) | 1,219 (100.0%) |
Earnings by Sex by Educational Attainment in Plains
Average earnings in Plains are $41,077 for men and $30,000 for women, a difference of 27.0%. Men with an educational attainment of graduate degree enjoy the highest average annual earnings of $102,794, while those with college or associate's degree education earn the least with $26,397. Women with an educational attainment of graduate degree earn the most with the average annual earnings of $91,797, while those with less than high school education have the smallest earnings of $18,125.
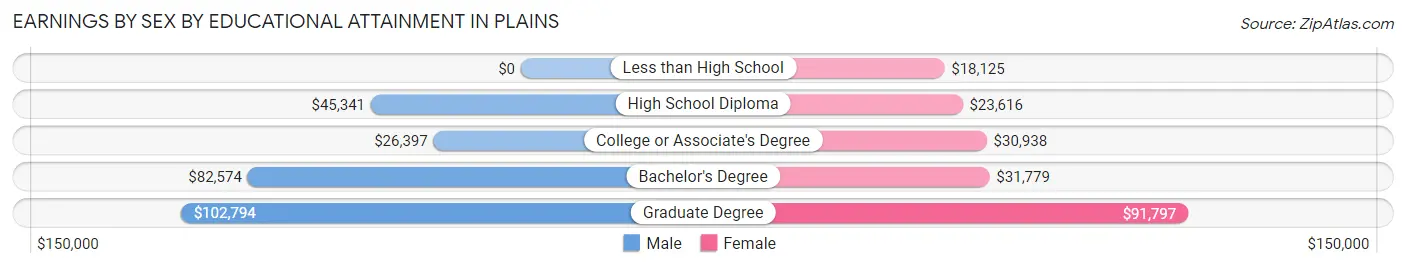
| Educational Attainment | Male Income | Female Income |
| Less than High School | - | - |
| High School Diploma | $45,341 | $23,616 |
| College or Associate's Degree | $26,397 | $30,938 |
| Bachelor's Degree | $82,574 | $31,779 |
| Graduate Degree | $102,794 | $91,797 |
| Total | $41,077 | $30,000 |
Family Income in Plains
Family Income Brackets in Plains
According to the Plains family income data, there are 287 families falling into the $100,000 to $149,999 income range, which is the most common income bracket and makes up 26.2% of all families.
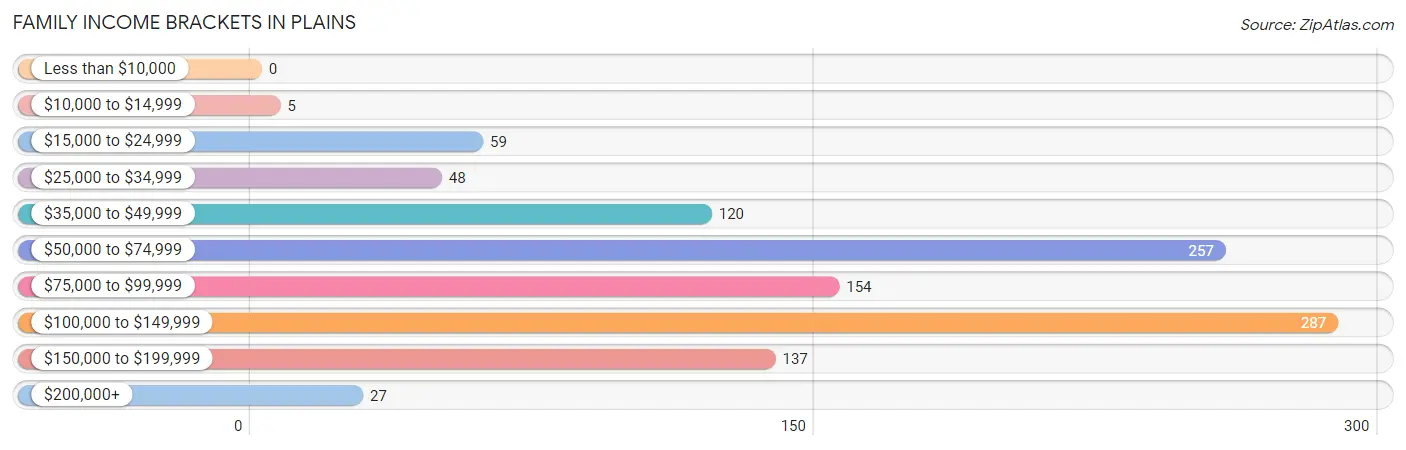
| Income Bracket | # Families | % Families |
| Less than $10,000 | 0 | 0.0% |
| $10,000 to $14,999 | 5 | 0.5% |
| $15,000 to $24,999 | 59 | 5.4% |
| $25,000 to $34,999 | 48 | 4.4% |
| $35,000 to $49,999 | 120 | 11.0% |
| $50,000 to $74,999 | 257 | 23.5% |
| $75,000 to $99,999 | 154 | 14.1% |
| $100,000 to $149,999 | 287 | 26.2% |
| $150,000 to $199,999 | 137 | 12.5% |
| $200,000+ | 27 | 2.5% |
Family Income by Famaliy Size in Plains
5-person families (37 | 3.4%) account for the highest median family income in Plains with $107,875 per family, while 2-person families (572 | 52.2%) have the highest median income of $34,062 per family member.
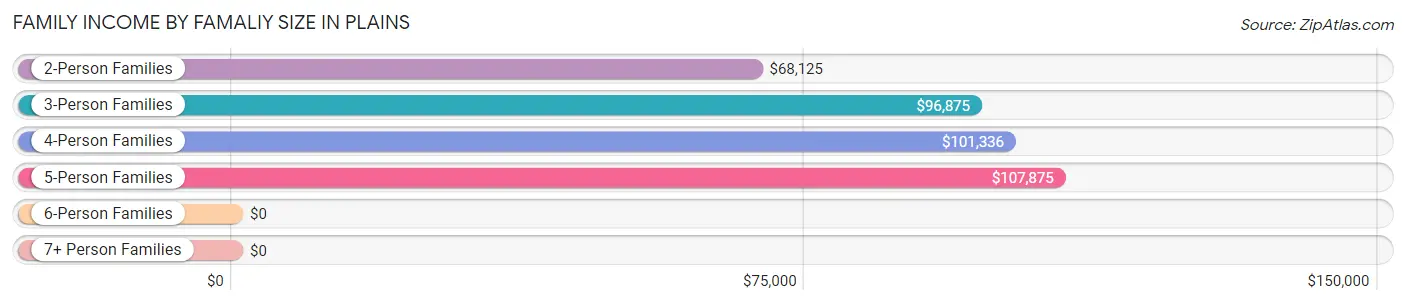
| Income Bracket | # Families | Median Income |
| 2-Person Families | 572 (52.2%) | $68,125 |
| 3-Person Families | 270 (24.7%) | $96,875 |
| 4-Person Families | 190 (17.3%) | $101,336 |
| 5-Person Families | 37 (3.4%) | $107,875 |
| 6-Person Families | 9 (0.8%) | $0 |
| 7+ Person Families | 17 (1.5%) | $0 |
| Total | 1,095 (100.0%) | $81,829 |
Family Income by Number of Earners in Plains
The median family income in Plains is $81,829, with families comprising 3+ earners (216) having the highest median family income of $109,706, while families with no earners (193) have the lowest median family income of $58,368, accounting for 19.7% and 17.6% of families, respectively.
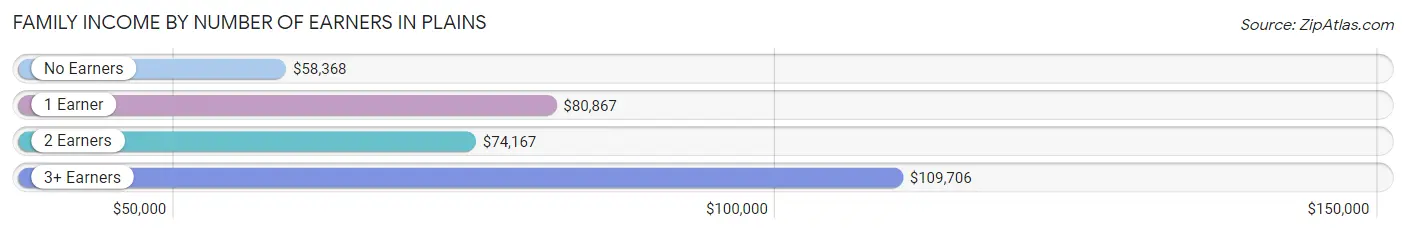
| Number of Earners | # Families | Median Income |
| No Earners | 193 (17.6%) | $58,368 |
| 1 Earner | 244 (22.3%) | $80,867 |
| 2 Earners | 442 (40.4%) | $74,167 |
| 3+ Earners | 216 (19.7%) | $109,706 |
| Total | 1,095 (100.0%) | $81,829 |
Household Income in Plains
Household Income Brackets in Plains
With 413 households falling in the category, the $50,000 to $74,999 income range is the most frequent in Plains, accounting for 22.8% of all households. In contrast, only 42 households (2.3%) fall into the $200,000+ income bracket, making it the least populous group.
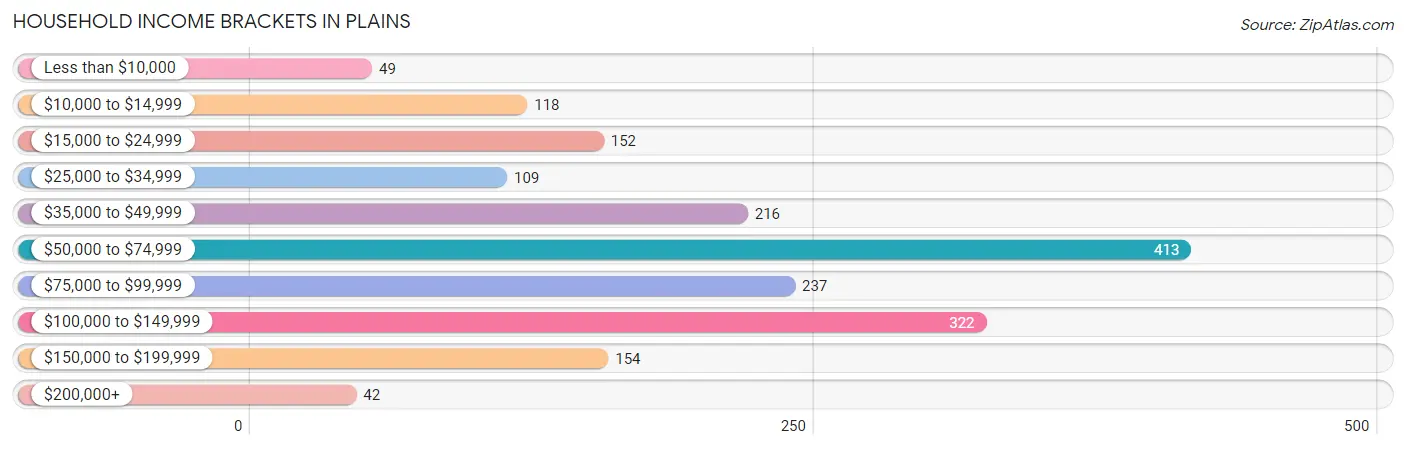
| Income Bracket | # Households | % Households |
| Less than $10,000 | 49 | 2.7% |
| $10,000 to $14,999 | 118 | 6.5% |
| $15,000 to $24,999 | 152 | 8.4% |
| $25,000 to $34,999 | 109 | 6.0% |
| $35,000 to $49,999 | 216 | 11.9% |
| $50,000 to $74,999 | 413 | 22.8% |
| $75,000 to $99,999 | 237 | 13.1% |
| $100,000 to $149,999 | 322 | 17.8% |
| $150,000 to $199,999 | 154 | 8.5% |
| $200,000+ | 42 | 2.3% |
Household Income by Householder Age in Plains
The median household income in Plains is $64,049, with the highest median household income of $69,167 found in the 45 to 64 years age bracket for the primary householder. A total of 668 households (36.9%) fall into this category.
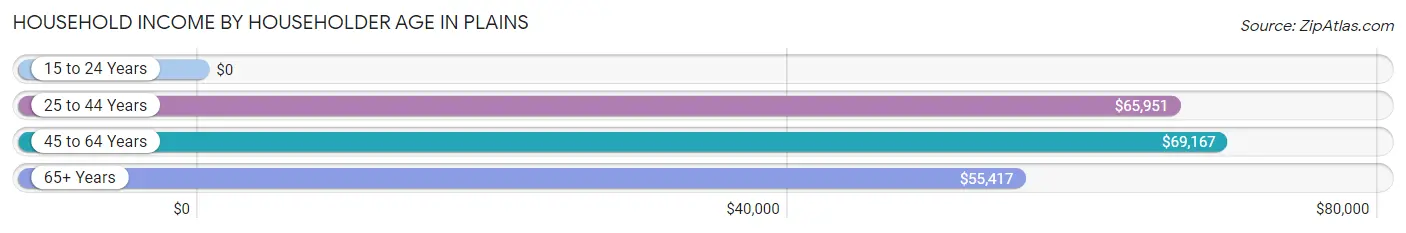
| Income Bracket | # Households | Median Income |
| 15 to 24 Years | 0 (0.0%) | $0 |
| 25 to 44 Years | 505 (27.9%) | $65,951 |
| 45 to 64 Years | 668 (36.9%) | $69,167 |
| 65+ Years | 638 (35.2%) | $55,417 |
| Total | 1,811 (100.0%) | $64,049 |
Poverty in Plains
Income Below Poverty by Sex and Age in Plains
With 19.3% poverty level for males and 15.1% for females among the residents of Plains, 12 to 14 year old males and under 5 year old females are the most vulnerable to poverty, with 18 males (100.0%) and 24 females (32.9%) in their respective age groups living below the poverty level.
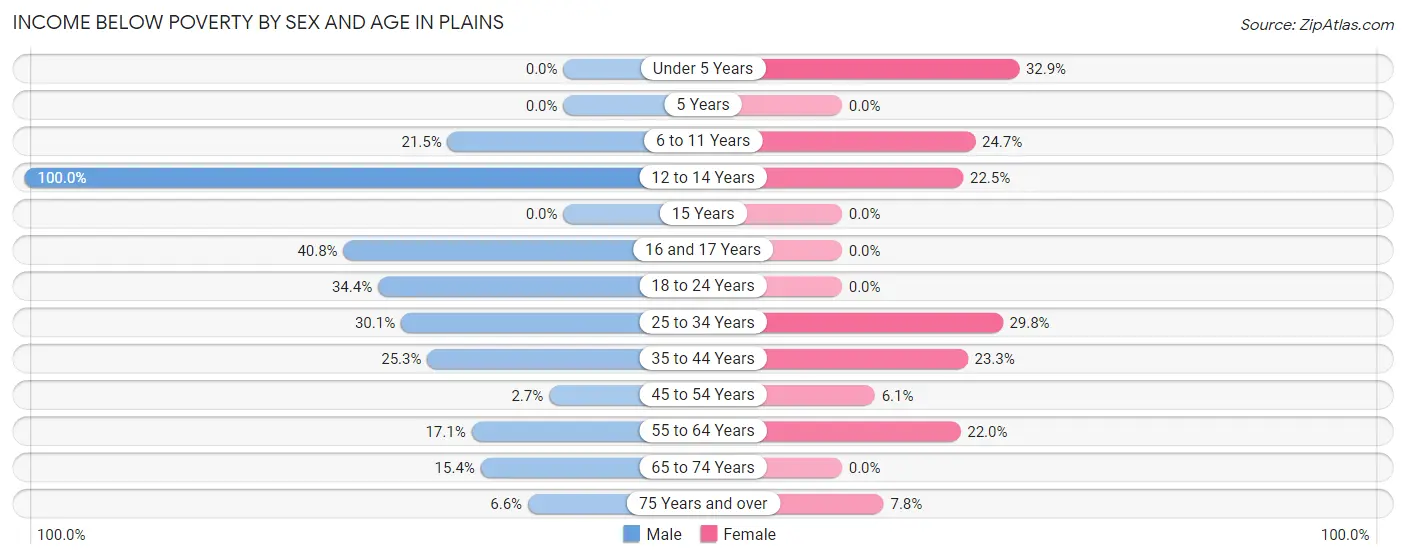
| Age Bracket | Male | Female |
| Under 5 Years | 0 (0.0%) | 24 (32.9%) |
| 5 Years | 0 (0.0%) | 0 (0.0%) |
| 6 to 11 Years | 23 (21.5%) | 23 (24.7%) |
| 12 to 14 Years | 18 (100.0%) | 18 (22.5%) |
| 15 Years | 0 (0.0%) | 0 (0.0%) |
| 16 and 17 Years | 20 (40.8%) | 0 (0.0%) |
| 18 to 24 Years | 32 (34.4%) | 0 (0.0%) |
| 25 to 34 Years | 107 (30.1%) | 68 (29.8%) |
| 35 to 44 Years | 97 (25.3%) | 88 (23.3%) |
| 45 to 54 Years | 6 (2.6%) | 16 (6.1%) |
| 55 to 64 Years | 52 (17.1%) | 66 (22.0%) |
| 65 to 74 Years | 33 (15.3%) | 0 (0.0%) |
| 75 Years and over | 13 (6.6%) | 20 (7.7%) |
| Total | 401 (19.3%) | 323 (15.1%) |
Income Above Poverty by Sex and Age in Plains
According to the poverty statistics in Plains, males aged under 5 years and females aged 15 years are the age groups that are most secure financially, with 100.0% of males and 100.0% of females in these age groups living above the poverty line.
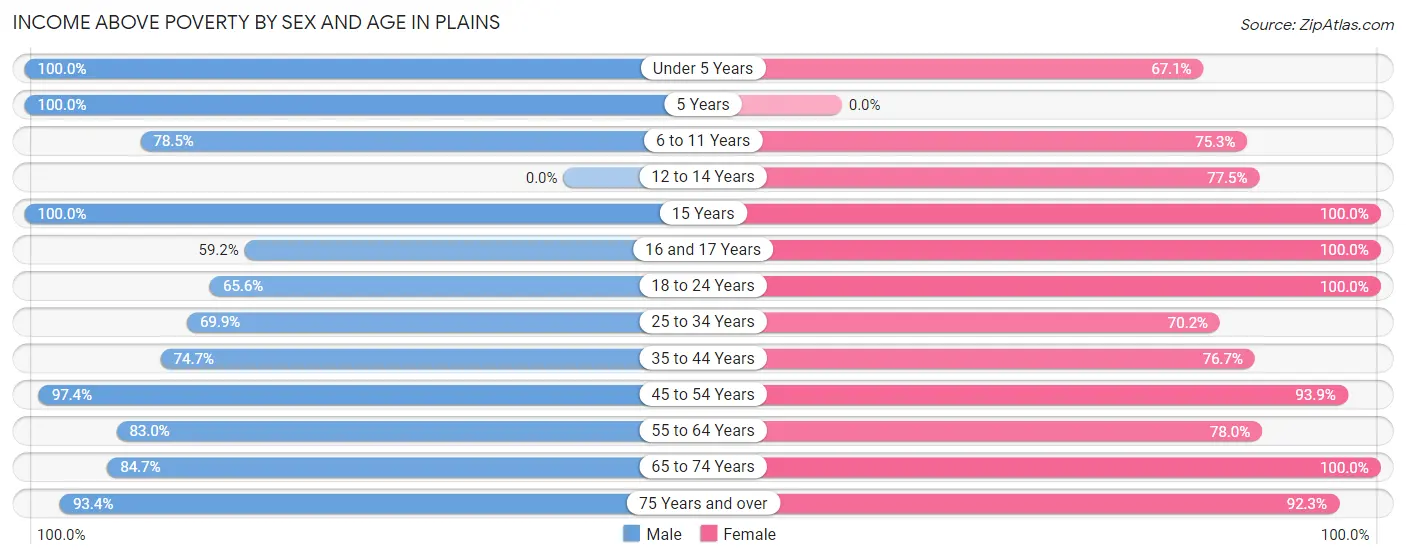
| Age Bracket | Male | Female |
| Under 5 Years | 39 (100.0%) | 49 (67.1%) |
| 5 Years | 39 (100.0%) | 0 (0.0%) |
| 6 to 11 Years | 84 (78.5%) | 70 (75.3%) |
| 12 to 14 Years | 0 (0.0%) | 62 (77.5%) |
| 15 Years | 45 (100.0%) | 12 (100.0%) |
| 16 and 17 Years | 29 (59.2%) | 33 (100.0%) |
| 18 to 24 Years | 61 (65.6%) | 124 (100.0%) |
| 25 to 34 Years | 248 (69.9%) | 160 (70.2%) |
| 35 to 44 Years | 287 (74.7%) | 289 (76.7%) |
| 45 to 54 Years | 220 (97.4%) | 246 (93.9%) |
| 55 to 64 Years | 253 (83.0%) | 234 (78.0%) |
| 65 to 74 Years | 182 (84.7%) | 292 (100.0%) |
| 75 Years and over | 185 (93.4%) | 238 (92.2%) |
| Total | 1,672 (80.7%) | 1,809 (84.9%) |
Income Below Poverty Among Married-Couple Families in Plains
The poverty statistics for married-couple families in Plains show that 2.8% or 23 of the total 819 families live below the poverty line. Families with 5 or more children have the highest poverty rate of 100.0%, comprising of 17 families. On the other hand, families with 1 or 2 children have the lowest poverty rate of 0.0%, which includes 0 families.
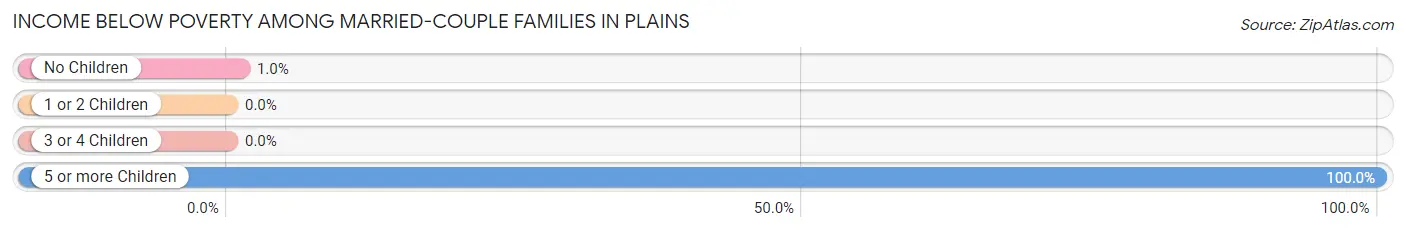
| Children | Above Poverty | Below Poverty |
| No Children | 571 (99.0%) | 6 (1.0%) |
| 1 or 2 Children | 208 (100.0%) | 0 (0.0%) |
| 3 or 4 Children | 17 (100.0%) | 0 (0.0%) |
| 5 or more Children | 0 (0.0%) | 17 (100.0%) |
| Total | 796 (97.2%) | 23 (2.8%) |
Income Below Poverty Among Single-Parent Households in Plains
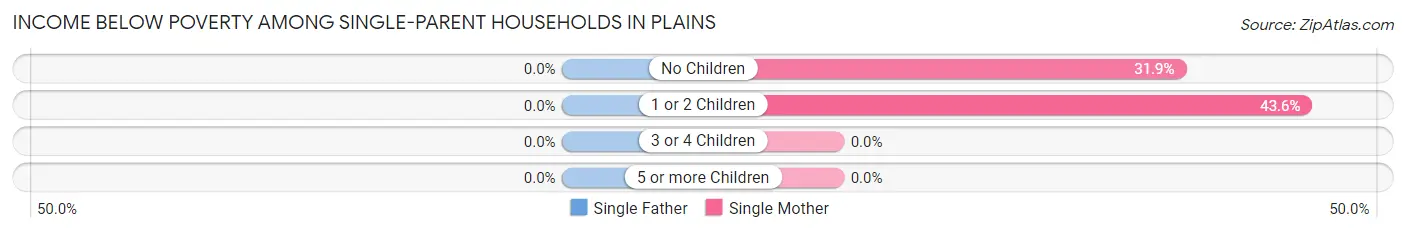
| Children | Single Father | Single Mother |
| No Children | 0 (0.0%) | 45 (31.9%) |
| 1 or 2 Children | 0 (0.0%) | 24 (43.6%) |
| 3 or 4 Children | 0 (0.0%) | 0 (0.0%) |
| 5 or more Children | 0 (0.0%) | 0 (0.0%) |
| Total | 0 (0.0%) | 69 (35.2%) |
Income Below Poverty Among Married-Couple vs Single-Parent Households in Plains
The poverty data for Plains shows that 23 of the married-couple family households (2.8%) and 69 of the single-parent households (25.0%) are living below the poverty level. Within the married-couple family households, those with 5 or more children have the highest poverty rate, with 17 households (100.0%) falling below the poverty line. Among the single-parent households, those with 1 or 2 children have the highest poverty rate, with 24 household (33.8%) living below poverty.
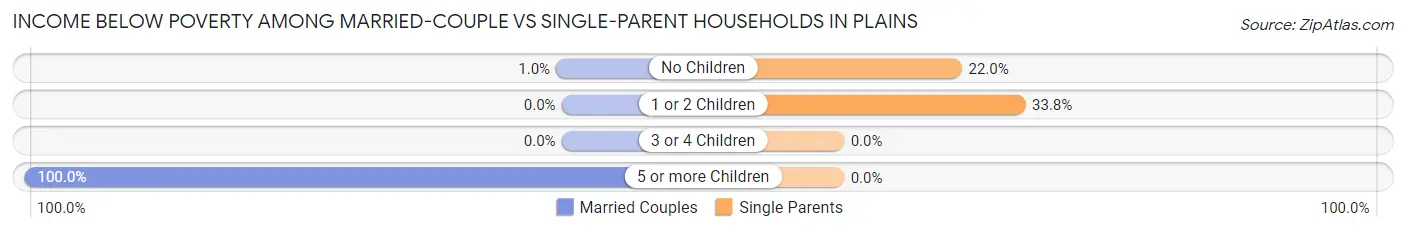
| Children | Married-Couple Families | Single-Parent Households |
| No Children | 6 (1.0%) | 45 (22.0%) |
| 1 or 2 Children | 0 (0.0%) | 24 (33.8%) |
| 3 or 4 Children | 0 (0.0%) | 0 (0.0%) |
| 5 or more Children | 17 (100.0%) | 0 (0.0%) |
| Total | 23 (2.8%) | 69 (25.0%) |
Race in Plains
The most populous races in Plains are White / Caucasian (3,641 | 86.6%), Black / African American (322 | 7.7%), and Two or more Races (172 | 4.1%).
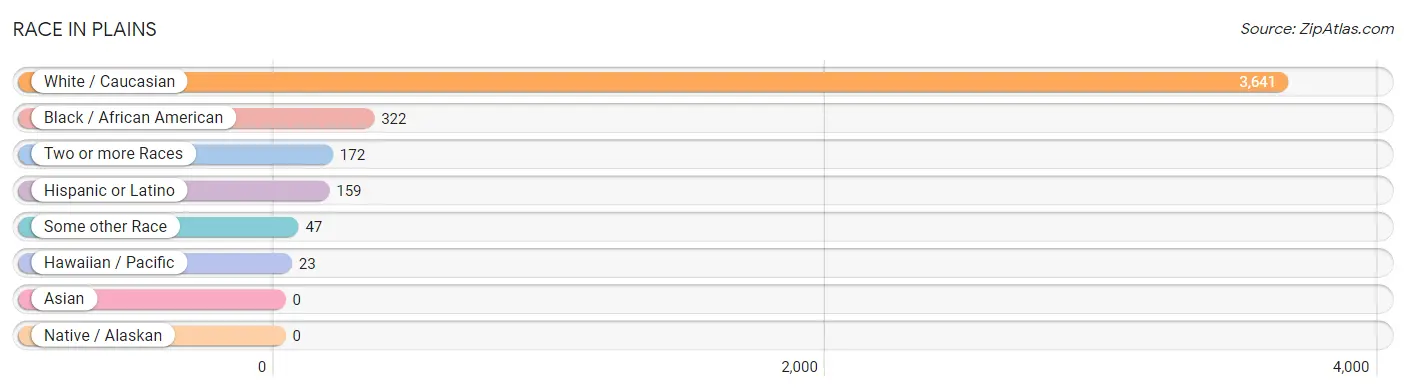
| Race | # Population | % Population |
| Asian | 0 | 0.0% |
| Black / African American | 322 | 7.7% |
| Hawaiian / Pacific | 23 | 0.5% |
| Hispanic or Latino | 159 | 3.8% |
| Native / Alaskan | 0 | 0.0% |
| White / Caucasian | 3,641 | 86.6% |
| Two or more Races | 172 | 4.1% |
| Some other Race | 47 | 1.1% |
| Total | 4,205 | 100.0% |
Ancestry in Plains
The most populous ancestries reported in Plains are Polish (1,267 | 30.1%), German (881 | 20.9%), Italian (747 | 17.8%), Irish (679 | 16.2%), and English (133 | 3.2%), together accounting for 88.1% of all Plains residents.
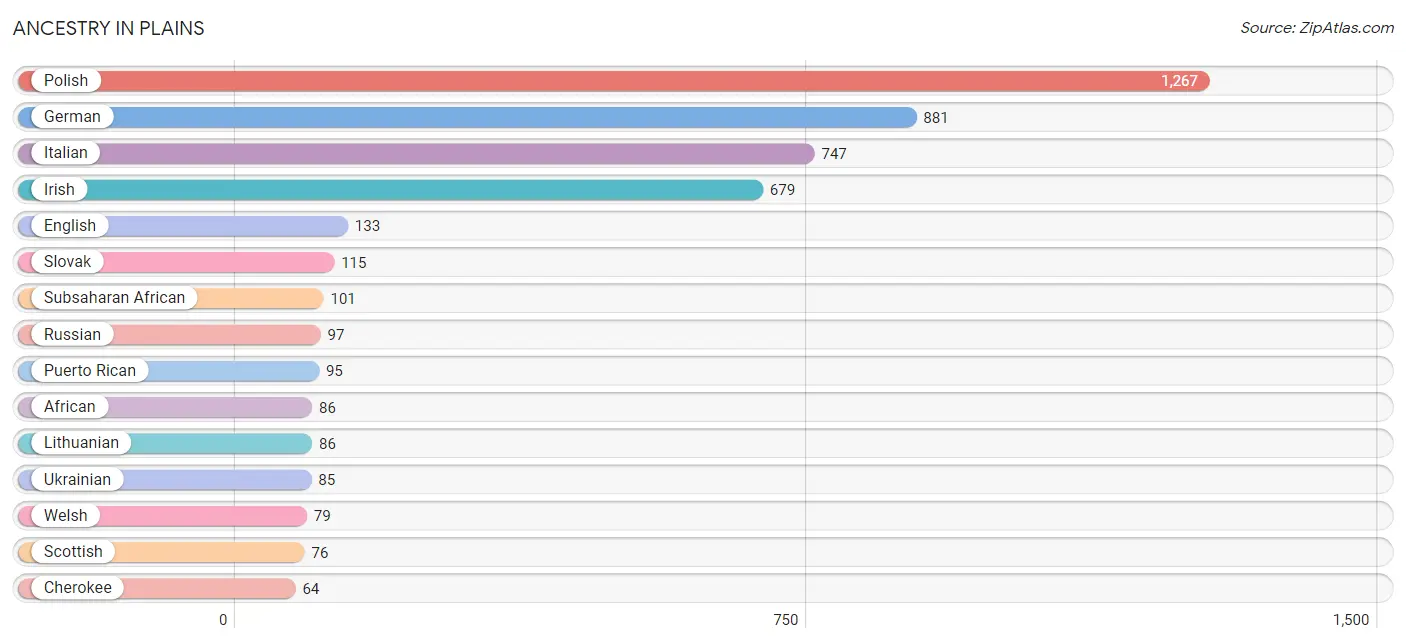
| Ancestry | # Population | % Population |
| African | 86 | 2.1% |
| American | 9 | 0.2% |
| Austrian | 19 | 0.4% |
| British | 13 | 0.3% |
| Burmese | 17 | 0.4% |
| Carpatho Rusyn | 5 | 0.1% |
| Cherokee | 64 | 1.5% |
| Colombian | 10 | 0.2% |
| Cuban | 8 | 0.2% |
| Czechoslovakian | 13 | 0.3% |
| Dominican | 17 | 0.4% |
| Eastern European | 64 | 1.5% |
| English | 133 | 3.2% |
| European | 5 | 0.1% |
| French | 28 | 0.7% |
| German | 881 | 20.9% |
| Guamanian / Chamorro | 32 | 0.8% |
| Hungarian | 24 | 0.6% |
| Irish | 679 | 16.2% |
| Italian | 747 | 17.8% |
| Lithuanian | 86 | 2.1% |
| Mexican | 29 | 0.7% |
| Osage | 2 | 0.1% |
| Pennsylvania German | 5 | 0.1% |
| Polish | 1,267 | 30.1% |
| Portuguese | 25 | 0.6% |
| Puerto Rican | 95 | 2.3% |
| Romanian | 5 | 0.1% |
| Russian | 97 | 2.3% |
| Scotch-Irish | 34 | 0.8% |
| Scottish | 76 | 1.8% |
| Slovak | 115 | 2.7% |
| South African | 15 | 0.4% |
| South American | 10 | 0.2% |
| Subsaharan African | 101 | 2.4% |
| Swiss | 5 | 0.1% |
| Ukrainian | 85 | 2.0% |
| Welsh | 79 | 1.9% | View All 38 Rows |
Immigrants in Plains
The most numerous immigrant groups reported in Plains came from Latin America (97 | 2.3%), Central America (82 | 1.9%), Panama (76 | 1.8%), Europe (18 | 0.4%), and England (13 | 0.3%), together accounting for 6.8% of all Plains residents.
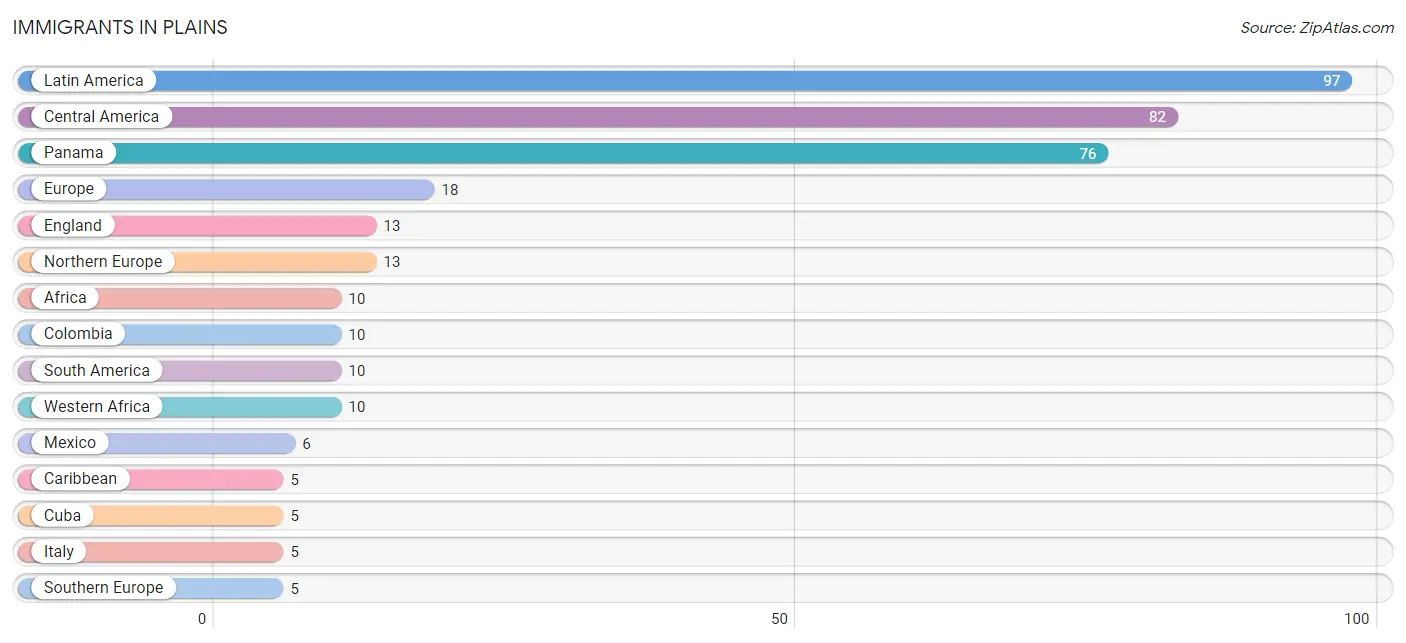
| Immigration Origin | # Population | % Population |
| Africa | 10 | 0.2% |
| Caribbean | 5 | 0.1% |
| Central America | 82 | 1.9% |
| Colombia | 10 | 0.2% |
| Cuba | 5 | 0.1% |
| England | 13 | 0.3% |
| Europe | 18 | 0.4% |
| Italy | 5 | 0.1% |
| Latin America | 97 | 2.3% |
| Mexico | 6 | 0.1% |
| Northern Europe | 13 | 0.3% |
| Panama | 76 | 1.8% |
| South America | 10 | 0.2% |
| Southern Europe | 5 | 0.1% |
| Western Africa | 10 | 0.2% | View All 15 Rows |
Sex and Age in Plains
Sex and Age in Plains
The most populous age groups in Plains are 25 to 29 Years (240 | 11.6%) for men and 70 to 74 Years (219 | 10.3%) for women.
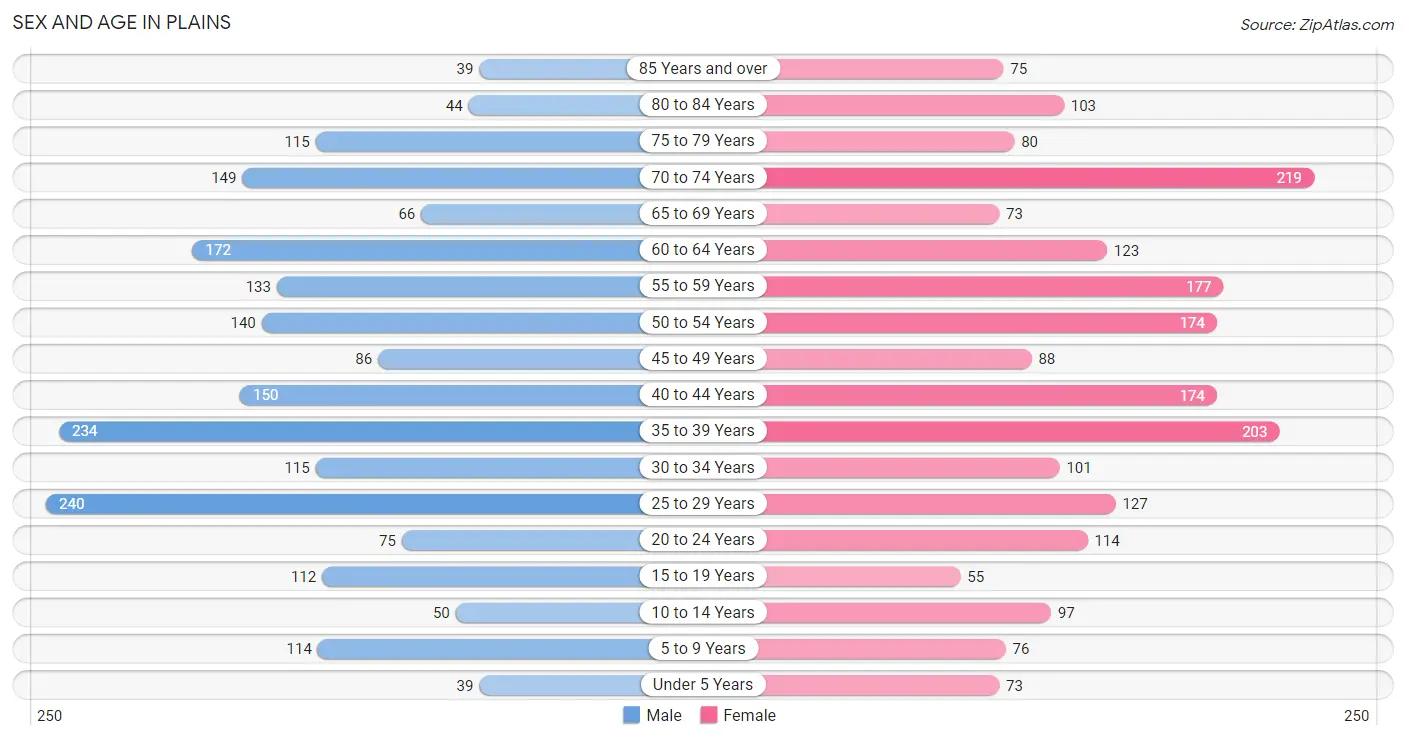
| Age Bracket | Male | Female |
| Under 5 Years | 39 (1.9%) | 73 (3.4%) |
| 5 to 9 Years | 114 (5.5%) | 76 (3.6%) |
| 10 to 14 Years | 50 (2.4%) | 97 (4.5%) |
| 15 to 19 Years | 112 (5.4%) | 55 (2.6%) |
| 20 to 24 Years | 75 (3.6%) | 114 (5.3%) |
| 25 to 29 Years | 240 (11.6%) | 127 (6.0%) |
| 30 to 34 Years | 115 (5.6%) | 101 (4.7%) |
| 35 to 39 Years | 234 (11.3%) | 203 (9.5%) |
| 40 to 44 Years | 150 (7.2%) | 174 (8.2%) |
| 45 to 49 Years | 86 (4.2%) | 88 (4.1%) |
| 50 to 54 Years | 140 (6.8%) | 174 (8.2%) |
| 55 to 59 Years | 133 (6.4%) | 177 (8.3%) |
| 60 to 64 Years | 172 (8.3%) | 123 (5.8%) |
| 65 to 69 Years | 66 (3.2%) | 73 (3.4%) |
| 70 to 74 Years | 149 (7.2%) | 219 (10.3%) |
| 75 to 79 Years | 115 (5.6%) | 80 (3.7%) |
| 80 to 84 Years | 44 (2.1%) | 103 (4.8%) |
| 85 Years and over | 39 (1.9%) | 75 (3.5%) |
| Total | 2,073 (100.0%) | 2,132 (100.0%) |
Families and Households in Plains
Median Family Size in Plains
The median family size in Plains is 2.93 persons per family, with single female/mother families (196 | 17.9%) accounting for the largest median family size of 3.01 persons per family. On the other hand, married-couple families (819 | 74.8%) represent the smallest median family size with 2.91 persons per family.
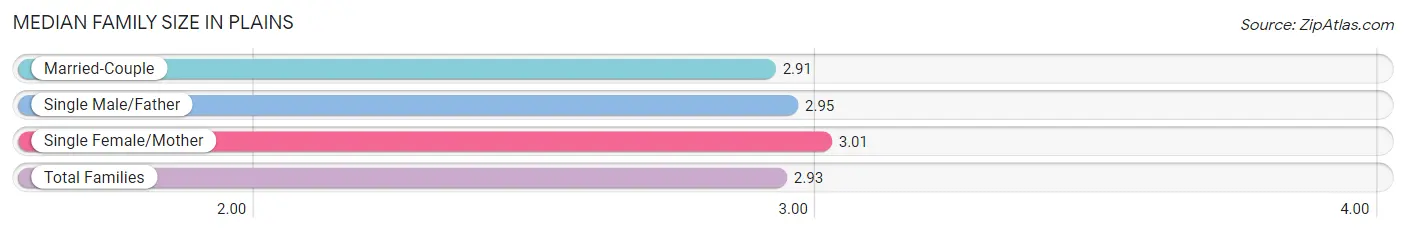
| Family Type | # Families | Family Size |
| Married-Couple | 819 (74.8%) | 2.91 |
| Single Male/Father | 80 (7.3%) | 2.95 |
| Single Female/Mother | 196 (17.9%) | 3.01 |
| Total Families | 1,095 (100.0%) | 2.93 |
Median Household Size in Plains
The median household size in Plains is 2.32 persons per household, with single female/mother households (196 | 10.8%) accounting for the largest median household size of 3.27 persons per household. non-family households (716 | 39.5%) represent the smallest median household size with 1.24 persons per household.
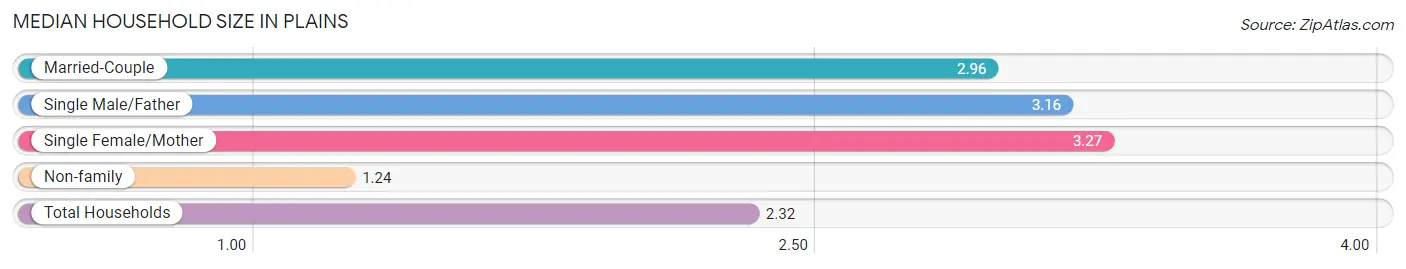
| Household Type | # Households | Household Size |
| Married-Couple | 819 (45.2%) | 2.96 |
| Single Male/Father | 80 (4.4%) | 3.16 |
| Single Female/Mother | 196 (10.8%) | 3.27 |
| Non-family | 716 (39.5%) | 1.24 |
| Total Households | 1,811 (100.0%) | 2.32 |
Household Size by Marriage Status in Plains
Out of a total of 1,811 households in Plains, 1,095 (60.5%) are family households, while 716 (39.5%) are nonfamily households. The most numerous type of family households are 2-person households, comprising 548, and the most common type of nonfamily households are 1-person households, comprising 551.
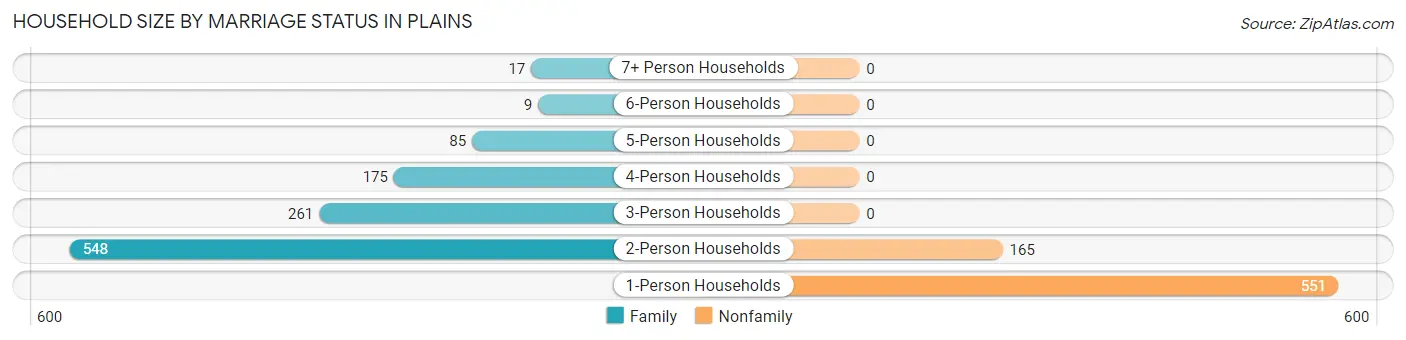
| Household Size | Family Households | Nonfamily Households |
| 1-Person Households | - | 551 (30.4%) |
| 2-Person Households | 548 (30.3%) | 165 (9.1%) |
| 3-Person Households | 261 (14.4%) | 0 (0.0%) |
| 4-Person Households | 175 (9.7%) | 0 (0.0%) |
| 5-Person Households | 85 (4.7%) | 0 (0.0%) |
| 6-Person Households | 9 (0.5%) | 0 (0.0%) |
| 7+ Person Households | 17 (0.9%) | 0 (0.0%) |
| Total | 1,095 (60.5%) | 716 (39.5%) |
Female Fertility in Plains
Fertility by Age in Plains
Average fertility rate in Plains is 13.0 births per 1,000 women. Women in the age bracket of 20 to 34 years have the highest fertility rate with 20.0 births per 1,000 women. Women in the age bracket of 20 to 34 years acount for 63.6% of all women with births.
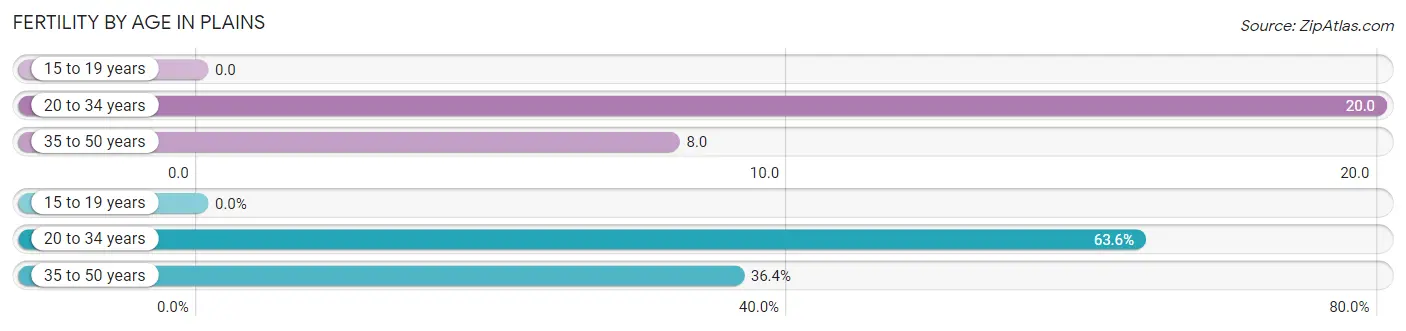
| Age Bracket | Women with Births | Births / 1,000 Women |
| 15 to 19 years | 0 (0.0%) | 0.0 |
| 20 to 34 years | 7 (63.6%) | 20.0 |
| 35 to 50 years | 4 (36.4%) | 8.0 |
| Total | 11 (100.0%) | 13.0 |
Fertility by Age by Marriage Status in Plains
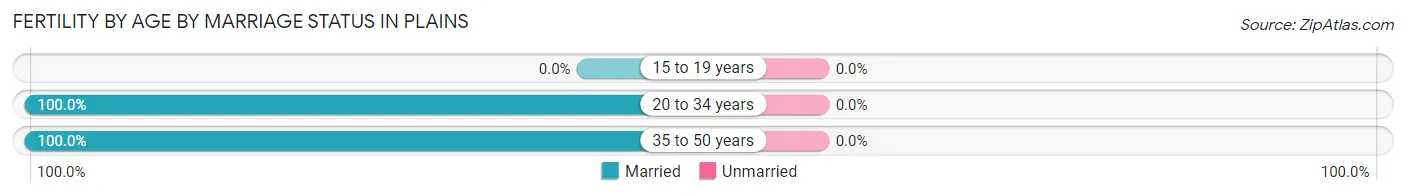
| Age Bracket | Married | Unmarried |
| 15 to 19 years | 0 (0.0%) | 0 (0.0%) |
| 20 to 34 years | 7 (100.0%) | 0 (0.0%) |
| 35 to 50 years | 4 (100.0%) | 0 (0.0%) |
| Total | 11 (100.0%) | 0 (0.0%) |
Fertility by Education in Plains
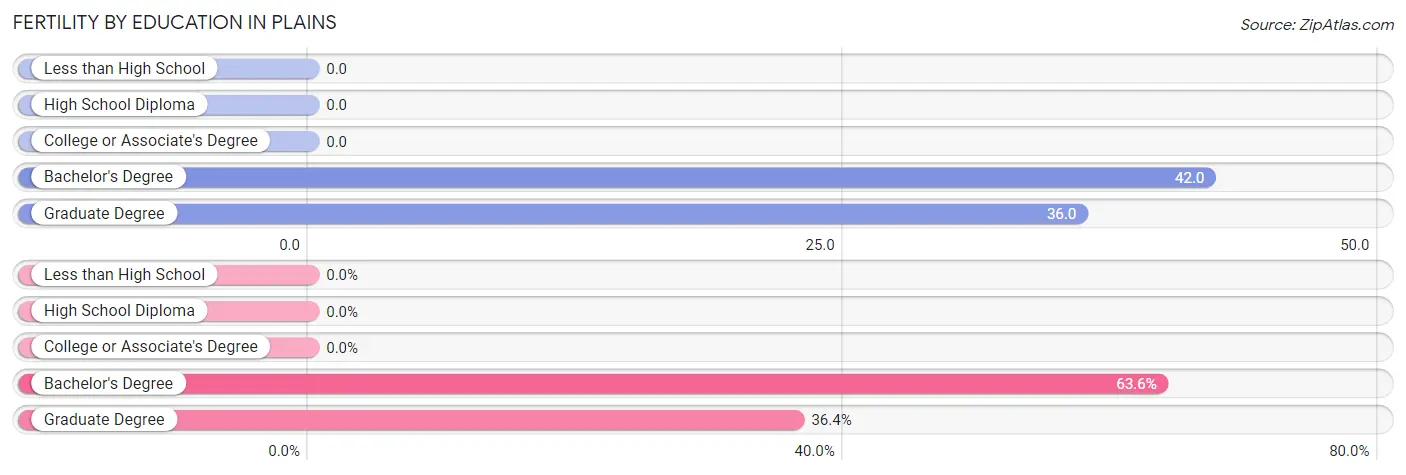
| Educational Attainment | Women with Births | Births / 1,000 Women |
| Less than High School | 0 (0.0%) | 0.0 |
| High School Diploma | 0 (0.0%) | 0.0 |
| College or Associate's Degree | 0 (0.0%) | 0.0 |
| Bachelor's Degree | 7 (63.6%) | 42.0 |
| Graduate Degree | 4 (36.4%) | 36.0 |
| Total | 11 (100.0%) | 13.0 |
Fertility by Education by Marriage Status in Plains
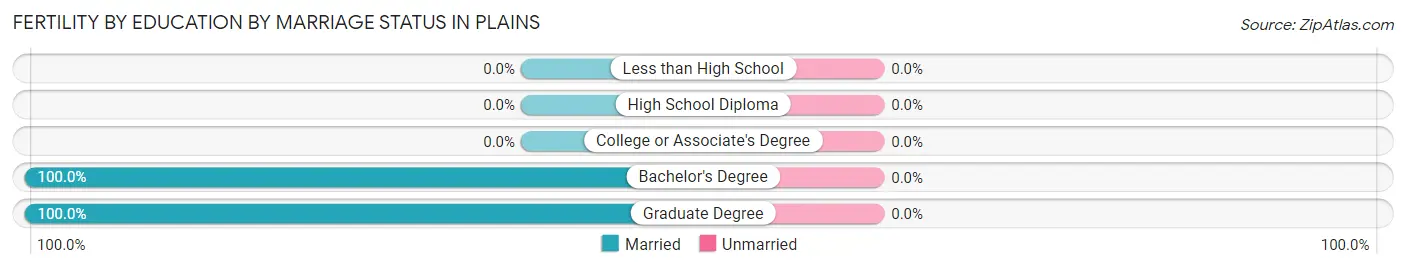
| Educational Attainment | Married | Unmarried |
| Less than High School | 0 (0.0%) | 0 (0.0%) |
| High School Diploma | 0 (0.0%) | 0 (0.0%) |
| College or Associate's Degree | 0 (0.0%) | 0 (0.0%) |
| Bachelor's Degree | 7 (100.0%) | 0 (0.0%) |
| Graduate Degree | 4 (100.0%) | 0 (0.0%) |
| Total | 11 (100.0%) | 0 (0.0%) |
Employment Characteristics in Plains
Employment by Class of Employer in Plains
Among the 2,197 employed individuals in Plains, private company employees (1,434 | 65.3%), self-employed (not incorporated) (252 | 11.5%), and local government employees (238 | 10.8%) make up the most common classes of employment.
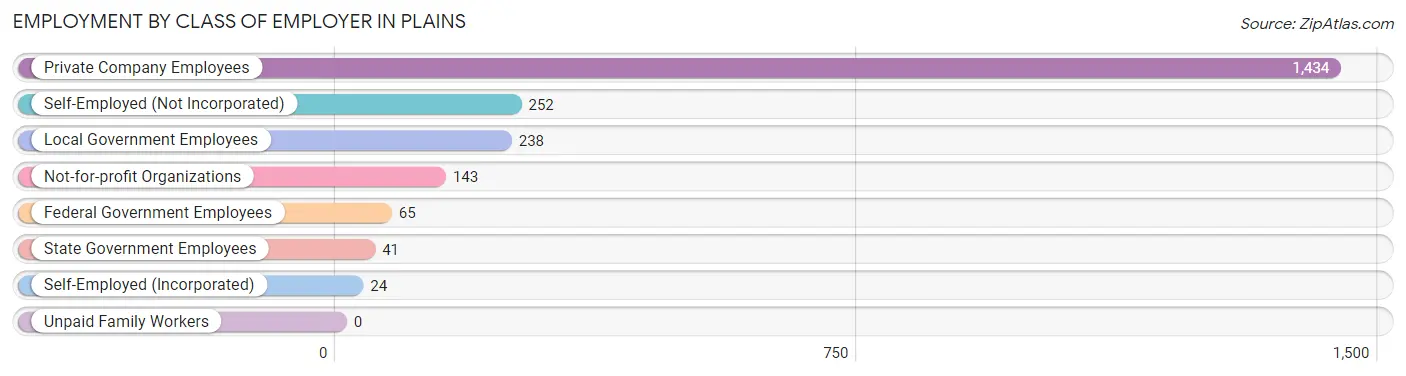
| Employer Class | # Employees | % Employees |
| Private Company Employees | 1,434 | 65.3% |
| Self-Employed (Incorporated) | 24 | 1.1% |
| Self-Employed (Not Incorporated) | 252 | 11.5% |
| Not-for-profit Organizations | 143 | 6.5% |
| Local Government Employees | 238 | 10.8% |
| State Government Employees | 41 | 1.9% |
| Federal Government Employees | 65 | 3.0% |
| Unpaid Family Workers | 0 | 0.0% |
| Total | 2,197 | 100.0% |
Employment Status by Age in Plains
According to the labor force statistics for Plains, out of the total population over 16 years of age (3,699), 65.5% or 2,423 individuals are in the labor force, with 6.3% or 153 of them unemployed. The age group with the highest labor force participation rate is 25 to 29 years, with 100.0% or 367 individuals in the labor force. Within the labor force, the 25 to 29 years age range has the highest percentage of unemployed individuals, with 31.3% or 115 of them being unemployed.
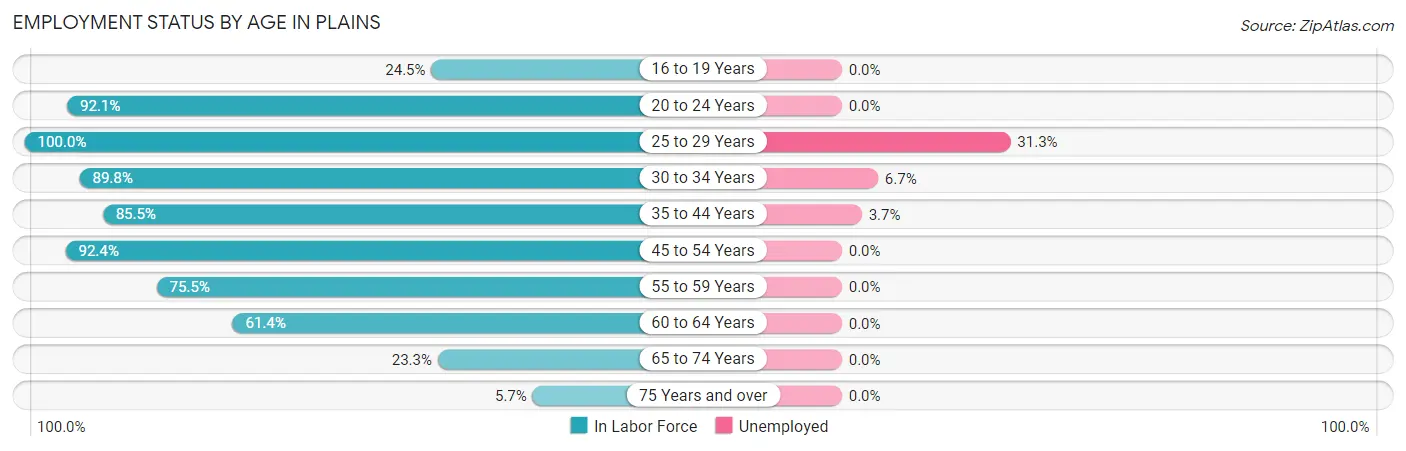
| Age Bracket | In Labor Force | Unemployed |
| 16 to 19 Years | 27 (24.5%) | 0 (0.0%) |
| 20 to 24 Years | 174 (92.1%) | 0 (0.0%) |
| 25 to 29 Years | 367 (100.0%) | 115 (31.3%) |
| 30 to 34 Years | 194 (89.8%) | 13 (6.7%) |
| 35 to 44 Years | 651 (85.5%) | 24 (3.7%) |
| 45 to 54 Years | 451 (92.4%) | 0 (0.0%) |
| 55 to 59 Years | 234 (75.5%) | 0 (0.0%) |
| 60 to 64 Years | 181 (61.4%) | 0 (0.0%) |
| 65 to 74 Years | 118 (23.3%) | 0 (0.0%) |
| 75 Years and over | 26 (5.7%) | 0 (0.0%) |
| Total | 2,423 (65.5%) | 153 (6.3%) |
Employment Status by Educational Attainment in Plains
According to labor force statistics for Plains, 85.3% of individuals (2,079) out of the total population between 25 and 64 years of age (2,437) are in the labor force, with 7.3% or 152 of them being unemployed. The group with the highest labor force participation rate are those with the educational attainment of bachelor's degree or higher, with 96.5% or 554 individuals in the labor force. Within the labor force, individuals with college / associate degree education have the highest percentage of unemployment, with 12.7% or 109 of them being unemployed.
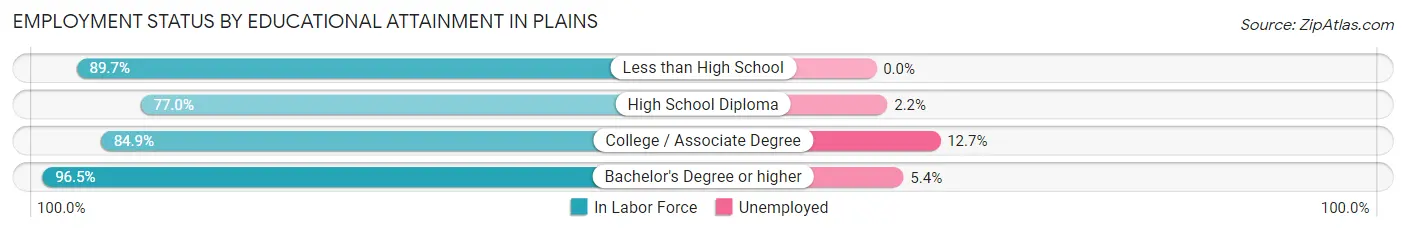
| Educational Attainment | In Labor Force | Unemployed |
| Less than High School | 70 (89.7%) | 0 (0.0%) |
| High School Diploma | 595 (77.0%) | 17 (2.2%) |
| College / Associate Degree | 859 (84.9%) | 129 (12.7%) |
| Bachelor's Degree or higher | 554 (96.5%) | 31 (5.4%) |
| Total | 2,079 (85.3%) | 178 (7.3%) |
Employment Occupations by Sex in Plains
Management, Business, Science and Arts Occupations
The most common Management, Business, Science and Arts occupations in Plains are Community & Social Service (188 | 8.3%), Management (164 | 7.2%), Health Diagnosing & Treating (164 | 7.2%), Health Technologists (101 | 4.4%), and Business & Financial (97 | 4.3%).
Management, Business, Science and Arts Occupations by Sex
Within the Management, Business, Science and Arts occupations in Plains, the most male-oriented occupations are Architecture & Engineering (100.0%), Education, Arts & Media (100.0%), and Legal Services & Support (100.0%), while the most female-oriented occupations are Computers & Mathematics (100.0%), Health Diagnosing & Treating (68.9%), and Health Technologists (68.3%).
| Occupation | Male | Female |
| Management | 84 (51.2%) | 80 (48.8%) |
| Business & Financial | 42 (43.3%) | 55 (56.7%) |
| Computers, Engineering & Science | 45 (53.6%) | 39 (46.4%) |
| Computers & Mathematics | 0 (0.0%) | 7 (100.0%) |
| Architecture & Engineering | 3 (100.0%) | 0 (0.0%) |
| Life, Physical & Social Science | 42 (56.8%) | 32 (43.2%) |
| Community & Social Service | 121 (64.4%) | 67 (35.6%) |
| Education, Arts & Media | 39 (100.0%) | 0 (0.0%) |
| Legal Services & Support | 24 (100.0%) | 0 (0.0%) |
| Education Instruction & Library | 33 (43.4%) | 43 (56.6%) |
| Arts, Media & Entertainment | 25 (51.0%) | 24 (49.0%) |
| Health Diagnosing & Treating | 51 (31.1%) | 113 (68.9%) |
| Health Technologists | 32 (31.7%) | 69 (68.3%) |
| Total (Category) | 343 (49.2%) | 354 (50.8%) |
| Total (Overall) | 1,128 (49.7%) | 1,143 (50.3%) |
Services Occupations
The most common Services occupations in Plains are Cleaning & Maintenance (188 | 8.3%), Personal Care & Service (123 | 5.4%), Food Preparation & Serving (106 | 4.7%), Healthcare Support (41 | 1.8%), and Security & Protection (32 | 1.4%).
Services Occupations by Sex
Within the Services occupations in Plains, the most male-oriented occupations are Security & Protection (100.0%), Firefighting & Prevention (100.0%), and Law Enforcement (100.0%), while the most female-oriented occupations are Healthcare Support (100.0%), Personal Care & Service (78.9%), and Food Preparation & Serving (30.2%).
| Occupation | Male | Female |
| Healthcare Support | 0 (0.0%) | 41 (100.0%) |
| Security & Protection | 32 (100.0%) | 0 (0.0%) |
| Firefighting & Prevention | 17 (100.0%) | 0 (0.0%) |
| Law Enforcement | 15 (100.0%) | 0 (0.0%) |
| Food Preparation & Serving | 74 (69.8%) | 32 (30.2%) |
| Cleaning & Maintenance | 147 (78.2%) | 41 (21.8%) |
| Personal Care & Service | 26 (21.1%) | 97 (78.9%) |
| Total (Category) | 279 (56.9%) | 211 (43.1%) |
| Total (Overall) | 1,128 (49.7%) | 1,143 (50.3%) |
Sales and Office Occupations
The most common Sales and Office occupations in Plains are Office & Administration (326 | 14.3%), and Sales & Related (277 | 12.2%).
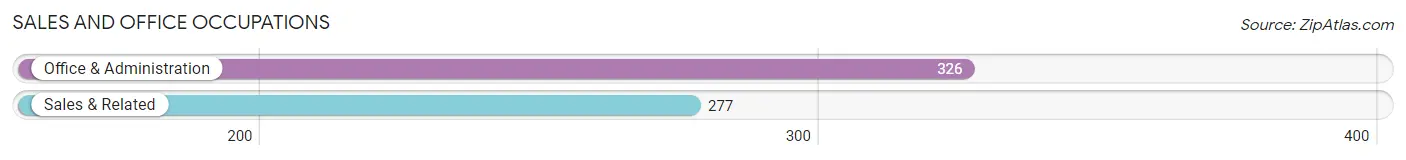
Sales and Office Occupations by Sex
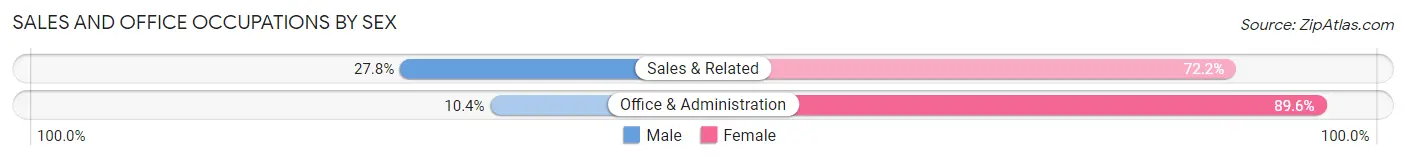
| Occupation | Male | Female |
| Sales & Related | 77 (27.8%) | 200 (72.2%) |
| Office & Administration | 34 (10.4%) | 292 (89.6%) |
| Total (Category) | 111 (18.4%) | 492 (81.6%) |
| Total (Overall) | 1,128 (49.7%) | 1,143 (50.3%) |
Natural Resources, Construction and Maintenance Occupations
The most common Natural Resources, Construction and Maintenance occupations in Plains are Construction & Extraction (117 | 5.1%), and Installation, Maintenance & Repair (53 | 2.3%).
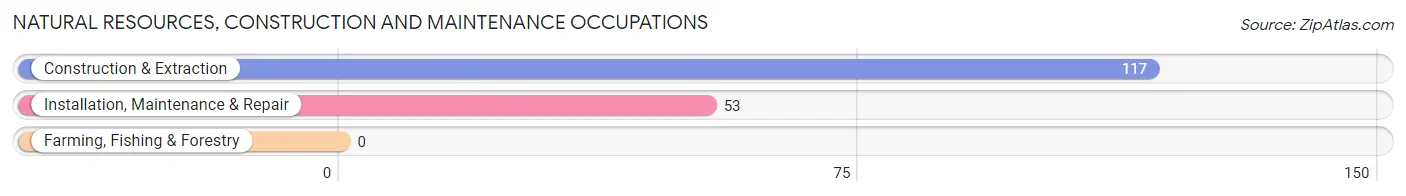
Natural Resources, Construction and Maintenance Occupations by Sex
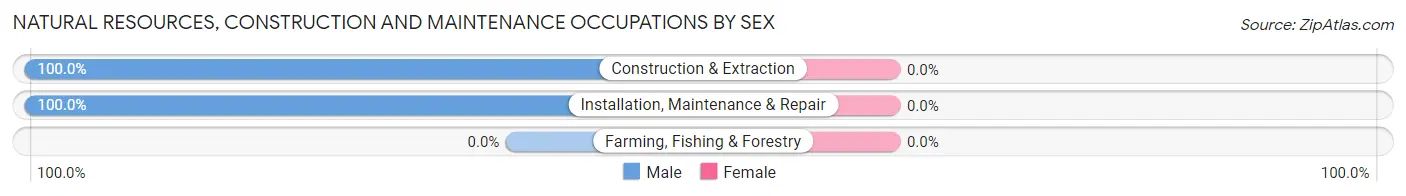
| Occupation | Male | Female |
| Farming, Fishing & Forestry | 0 (0.0%) | 0 (0.0%) |
| Construction & Extraction | 117 (100.0%) | 0 (0.0%) |
| Installation, Maintenance & Repair | 53 (100.0%) | 0 (0.0%) |
| Total (Category) | 170 (100.0%) | 0 (0.0%) |
| Total (Overall) | 1,128 (49.7%) | 1,143 (50.3%) |
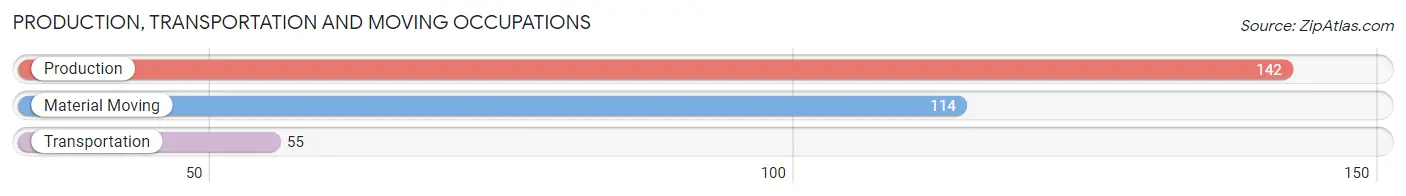
Production, Transportation and Moving Occupations
The most common Production, Transportation and Moving occupations in Plains are Production (142 | 6.2%), Material Moving (114 | 5.0%), and Transportation (55 | 2.4%).
Production, Transportation and Moving Occupations by Sex
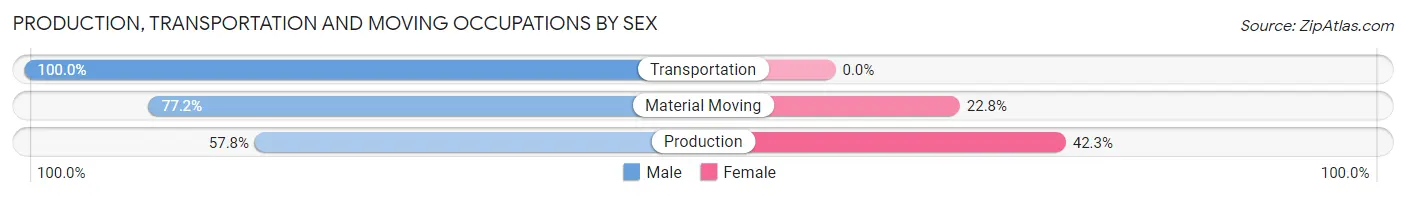
| Occupation | Male | Female |
| Production | 82 (57.8%) | 60 (42.2%) |
| Transportation | 55 (100.0%) | 0 (0.0%) |
| Material Moving | 88 (77.2%) | 26 (22.8%) |
| Total (Category) | 225 (72.4%) | 86 (27.7%) |
| Total (Overall) | 1,128 (49.7%) | 1,143 (50.3%) |
Employment Industries by Sex in Plains
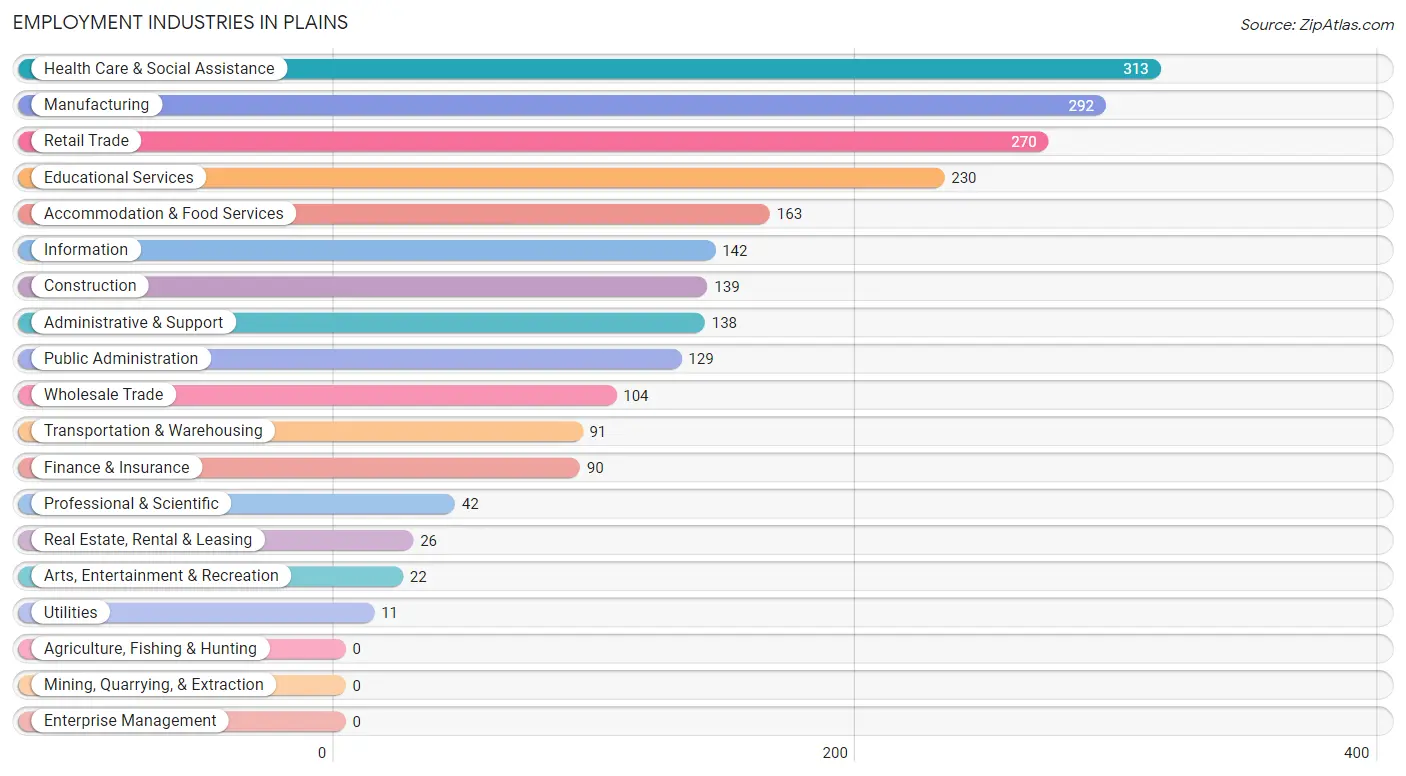
Employment Industries in Plains
The major employment industries in Plains include Health Care & Social Assistance (313 | 13.8%), Manufacturing (292 | 12.9%), Retail Trade (270 | 11.9%), Educational Services (230 | 10.1%), and Accommodation & Food Services (163 | 7.2%).
Employment Industries by Sex in Plains
The Plains industries that see more men than women are Utilities (100.0%), Real Estate, Rental & Leasing (100.0%), and Transportation & Warehousing (83.5%), whereas the industries that tend to have a higher number of women are Finance & Insurance (94.4%), Professional & Scientific (92.9%), and Health Care & Social Assistance (83.7%).
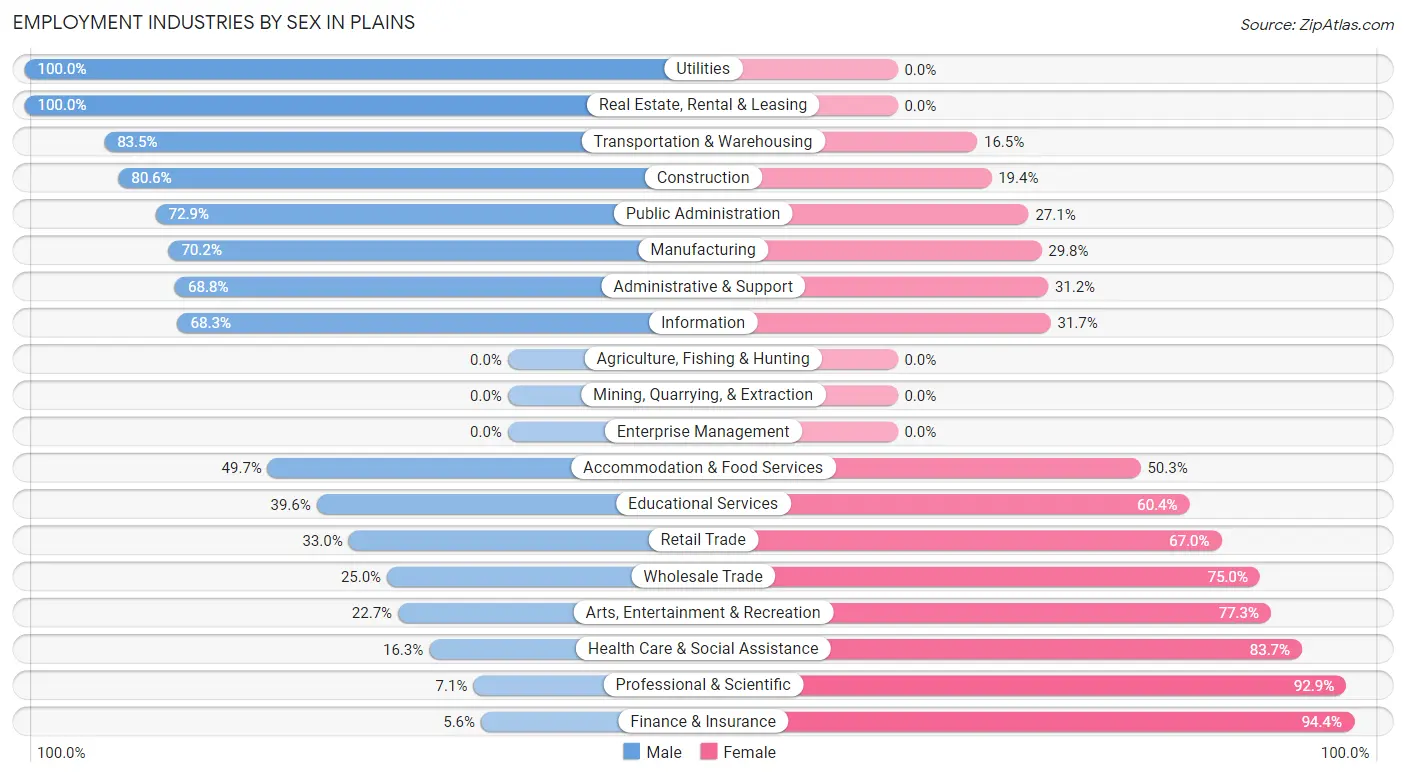
| Industry | Male | Female |
| Agriculture, Fishing & Hunting | 0 (0.0%) | 0 (0.0%) |
| Mining, Quarrying, & Extraction | 0 (0.0%) | 0 (0.0%) |
| Construction | 112 (80.6%) | 27 (19.4%) |
| Manufacturing | 205 (70.2%) | 87 (29.8%) |
| Wholesale Trade | 26 (25.0%) | 78 (75.0%) |
| Retail Trade | 89 (33.0%) | 181 (67.0%) |
| Transportation & Warehousing | 76 (83.5%) | 15 (16.5%) |
| Utilities | 11 (100.0%) | 0 (0.0%) |
| Information | 97 (68.3%) | 45 (31.7%) |
| Finance & Insurance | 5 (5.6%) | 85 (94.4%) |
| Real Estate, Rental & Leasing | 26 (100.0%) | 0 (0.0%) |
| Professional & Scientific | 3 (7.1%) | 39 (92.9%) |
| Enterprise Management | 0 (0.0%) | 0 (0.0%) |
| Administrative & Support | 95 (68.8%) | 43 (31.2%) |
| Educational Services | 91 (39.6%) | 139 (60.4%) |
| Health Care & Social Assistance | 51 (16.3%) | 262 (83.7%) |
| Arts, Entertainment & Recreation | 5 (22.7%) | 17 (77.3%) |
| Accommodation & Food Services | 81 (49.7%) | 82 (50.3%) |
| Public Administration | 94 (72.9%) | 35 (27.1%) |
| Total | 1,128 (49.7%) | 1,143 (50.3%) |
Education in Plains
School Enrollment in Plains
The most common levels of schooling among the 617 students in Plains are high school (167 | 27.1%), elementary school (165 | 26.7%), and middle school (105 | 17.0%).
| School Level | # Students | % Students |
| Nursery / Preschool | 12 | 1.9% |
| Kindergarten | 42 | 6.8% |
| Elementary School | 165 | 26.7% |
| Middle School | 105 | 17.0% |
| High School | 167 | 27.1% |
| College / Undergraduate | 48 | 7.8% |
| Graduate / Professional | 78 | 12.6% |
| Total | 617 | 100.0% |
School Enrollment by Age by Funding Source in Plains
Out of a total of 617 students who are enrolled in schools in Plains, 117 (19.0%) attend a private institution, while the remaining 500 (81.0%) are enrolled in public schools. The age group of 20 to 24 year olds has the highest likelihood of being enrolled in private schools, with 58 (100.0% in the age bracket) enrolled. Conversely, the age group of 3 to 4 year olds has the lowest likelihood of being enrolled in a private school, with 12 (100.0% in the age bracket) attending a public institution.
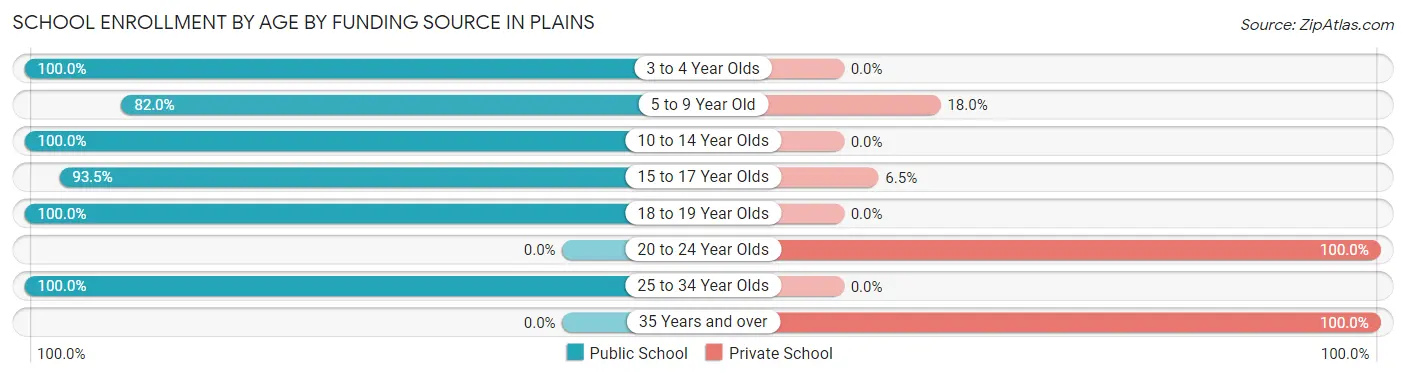
| Age Bracket | Public School | Private School |
| 3 to 4 Year Olds | 12 (100.0%) | 0 (0.0%) |
| 5 to 9 Year Old | 150 (82.0%) | 33 (18.0%) |
| 10 to 14 Year Olds | 147 (100.0%) | 0 (0.0%) |
| 15 to 17 Year Olds | 130 (93.5%) | 9 (6.5%) |
| 18 to 19 Year Olds | 28 (100.0%) | 0 (0.0%) |
| 20 to 24 Year Olds | 0 (0.0%) | 58 (100.0%) |
| 25 to 34 Year Olds | 33 (100.0%) | 0 (0.0%) |
| 35 Years and over | 0 (0.0%) | 17 (100.0%) |
| Total | 500 (81.0%) | 117 (19.0%) |
Educational Attainment by Field of Study in Plains
Business (200 | 26.0%), bio, nature & agricultural (80 | 10.4%), education (78 | 10.2%), science & technology (66 | 8.6%), and social sciences (63 | 8.2%) are the most common fields of study among 768 individuals in Plains who have obtained a bachelor's degree or higher.
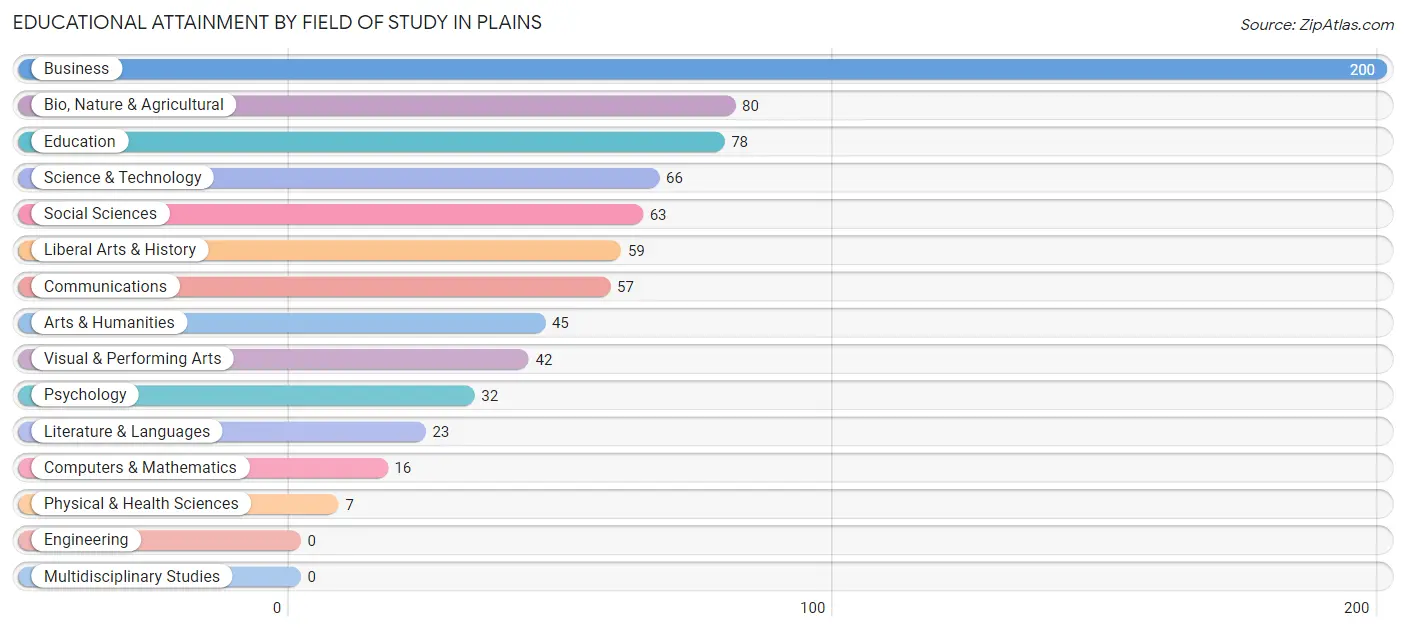
| Field of Study | # Graduates | % Graduates |
| Computers & Mathematics | 16 | 2.1% |
| Bio, Nature & Agricultural | 80 | 10.4% |
| Physical & Health Sciences | 7 | 0.9% |
| Psychology | 32 | 4.2% |
| Social Sciences | 63 | 8.2% |
| Engineering | 0 | 0.0% |
| Multidisciplinary Studies | 0 | 0.0% |
| Science & Technology | 66 | 8.6% |
| Business | 200 | 26.0% |
| Education | 78 | 10.2% |
| Literature & Languages | 23 | 3.0% |
| Liberal Arts & History | 59 | 7.7% |
| Visual & Performing Arts | 42 | 5.5% |
| Communications | 57 | 7.4% |
| Arts & Humanities | 45 | 5.9% |
| Total | 768 | 100.0% |
Transportation & Commute in Plains
Vehicle Availability by Sex in Plains
The most prevalent vehicle ownership categories in Plains are males with 2 vehicles (580, accounting for 53.9%) and females with 2 vehicles (572, making up 51.8%).
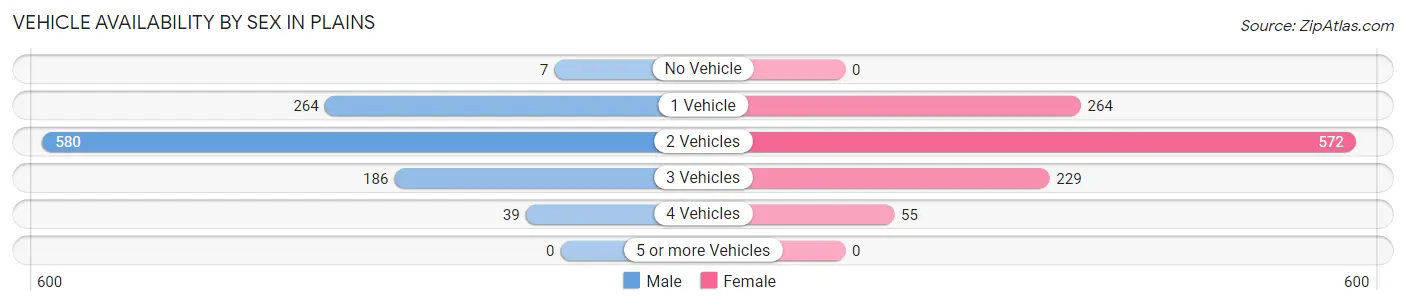
| Vehicles Available | Male | Female |
| No Vehicle | 7 (0.6%) | 0 (0.0%) |
| 1 Vehicle | 264 (24.5%) | 264 (23.6%) |
| 2 Vehicles | 580 (53.9%) | 572 (51.1%) |
| 3 Vehicles | 186 (17.3%) | 229 (20.4%) |
| 4 Vehicles | 39 (3.6%) | 55 (4.9%) |
| 5 or more Vehicles | 0 (0.0%) | 0 (0.0%) |
| Total | 1,076 (100.0%) | 1,120 (100.0%) |
Commute Time in Plains
The most frequently occuring commute durations in Plains are 15 to 19 minutes (520 commuters, 24.9%), 5 to 9 minutes (447 commuters, 21.4%), and 10 to 14 minutes (439 commuters, 21.0%).
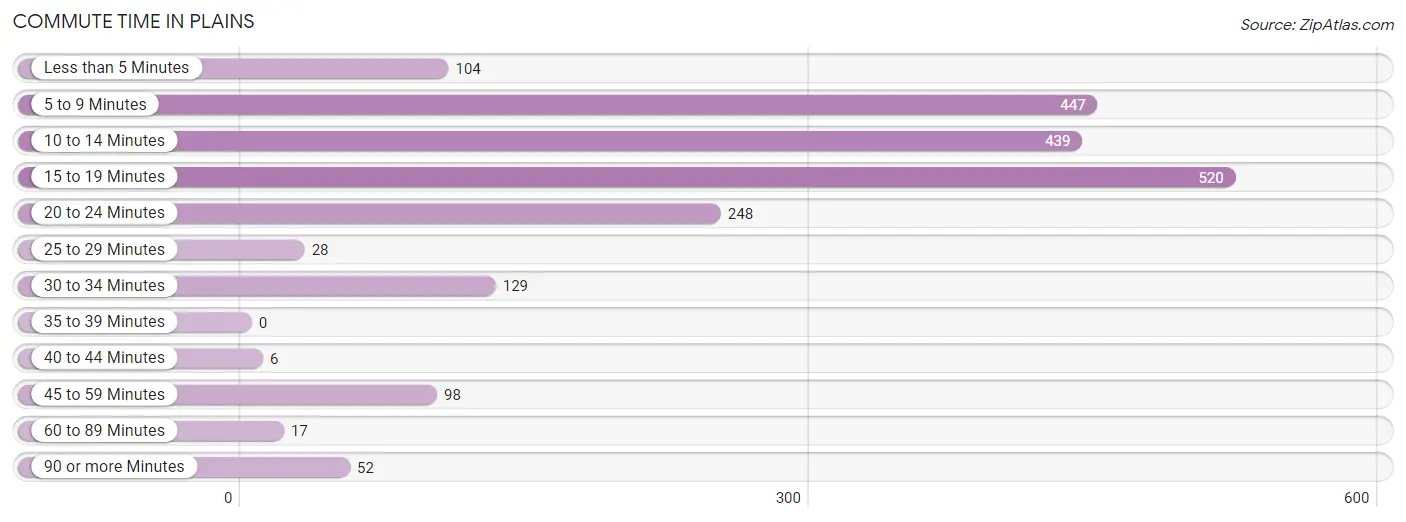
| Commute Time | # Commuters | % Commuters |
| Less than 5 Minutes | 104 | 5.0% |
| 5 to 9 Minutes | 447 | 21.4% |
| 10 to 14 Minutes | 439 | 21.0% |
| 15 to 19 Minutes | 520 | 24.9% |
| 20 to 24 Minutes | 248 | 11.9% |
| 25 to 29 Minutes | 28 | 1.3% |
| 30 to 34 Minutes | 129 | 6.2% |
| 35 to 39 Minutes | 0 | 0.0% |
| 40 to 44 Minutes | 6 | 0.3% |
| 45 to 59 Minutes | 98 | 4.7% |
| 60 to 89 Minutes | 17 | 0.8% |
| 90 or more Minutes | 52 | 2.5% |
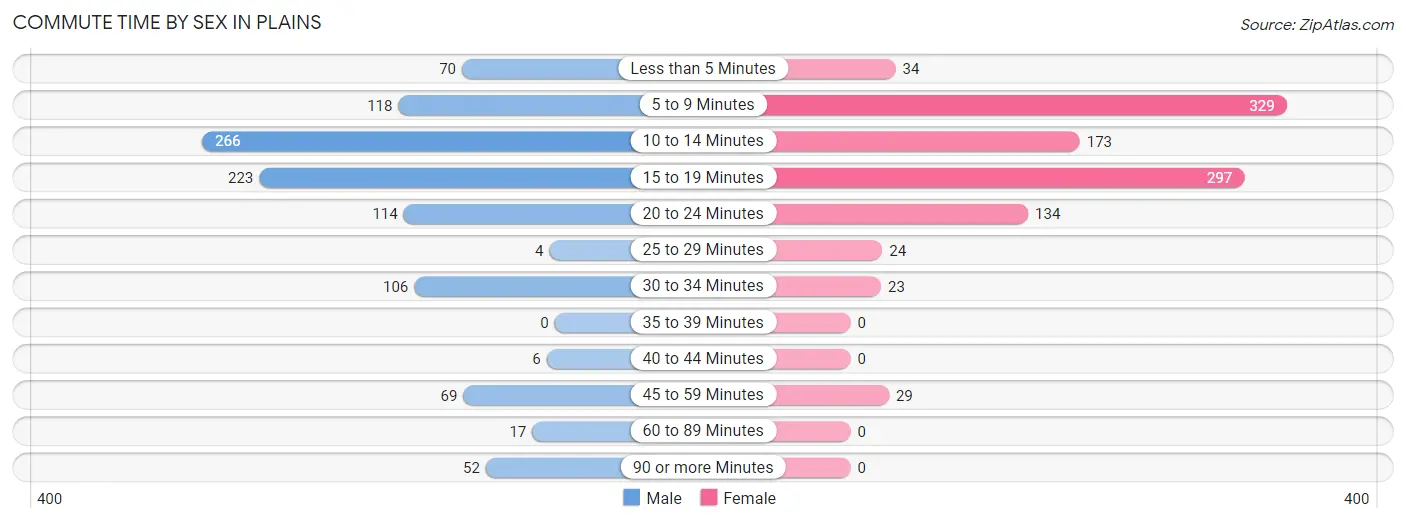
Commute Time by Sex in Plains
The most common commute times in Plains are 10 to 14 minutes (266 commuters, 25.5%) for males and 5 to 9 minutes (329 commuters, 31.5%) for females.
| Commute Time | Male | Female |
| Less than 5 Minutes | 70 (6.7%) | 34 (3.3%) |
| 5 to 9 Minutes | 118 (11.3%) | 329 (31.5%) |
| 10 to 14 Minutes | 266 (25.5%) | 173 (16.6%) |
| 15 to 19 Minutes | 223 (21.3%) | 297 (28.5%) |
| 20 to 24 Minutes | 114 (10.9%) | 134 (12.9%) |
| 25 to 29 Minutes | 4 (0.4%) | 24 (2.3%) |
| 30 to 34 Minutes | 106 (10.1%) | 23 (2.2%) |
| 35 to 39 Minutes | 0 (0.0%) | 0 (0.0%) |
| 40 to 44 Minutes | 6 (0.6%) | 0 (0.0%) |
| 45 to 59 Minutes | 69 (6.6%) | 29 (2.8%) |
| 60 to 89 Minutes | 17 (1.6%) | 0 (0.0%) |
| 90 or more Minutes | 52 (5.0%) | 0 (0.0%) |
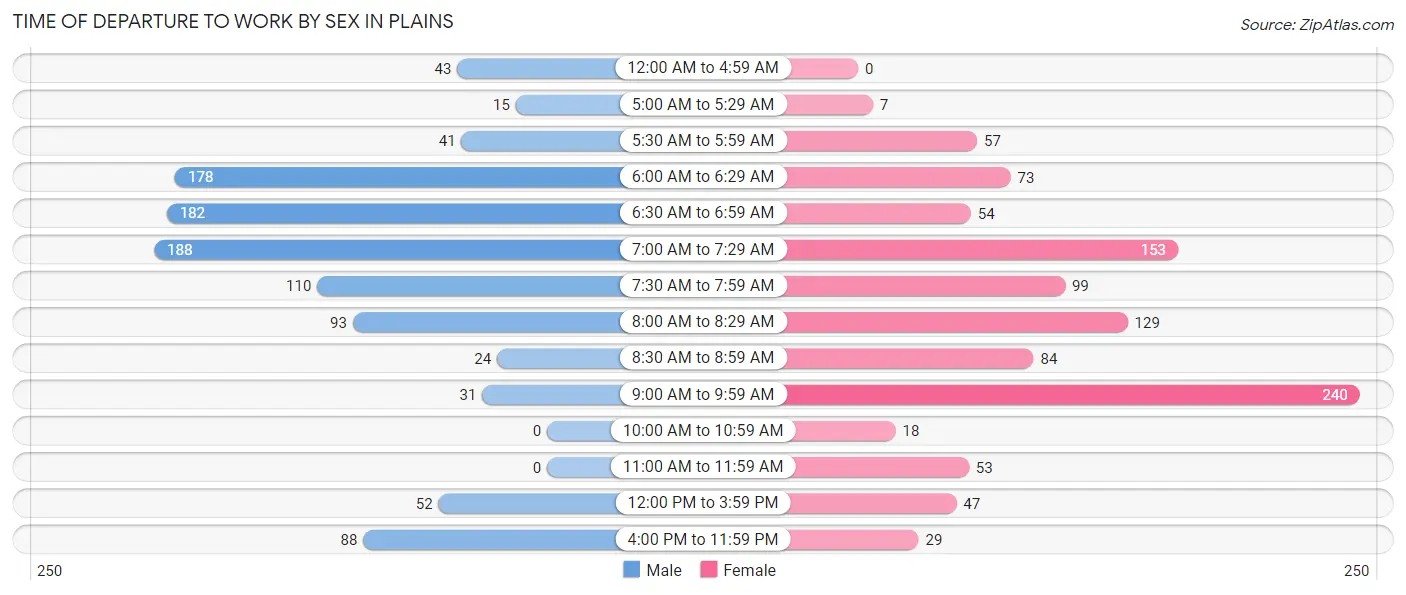
Time of Departure to Work by Sex in Plains
The most frequent times of departure to work in Plains are 7:00 AM to 7:29 AM (188, 18.0%) for males and 9:00 AM to 9:59 AM (240, 23.0%) for females.
| Time of Departure | Male | Female |
| 12:00 AM to 4:59 AM | 43 (4.1%) | 0 (0.0%) |
| 5:00 AM to 5:29 AM | 15 (1.4%) | 7 (0.7%) |
| 5:30 AM to 5:59 AM | 41 (3.9%) | 57 (5.5%) |
| 6:00 AM to 6:29 AM | 178 (17.0%) | 73 (7.0%) |
| 6:30 AM to 6:59 AM | 182 (17.4%) | 54 (5.2%) |
| 7:00 AM to 7:29 AM | 188 (18.0%) | 153 (14.7%) |
| 7:30 AM to 7:59 AM | 110 (10.5%) | 99 (9.5%) |
| 8:00 AM to 8:29 AM | 93 (8.9%) | 129 (12.4%) |
| 8:30 AM to 8:59 AM | 24 (2.3%) | 84 (8.1%) |
| 9:00 AM to 9:59 AM | 31 (3.0%) | 240 (23.0%) |
| 10:00 AM to 10:59 AM | 0 (0.0%) | 18 (1.7%) |
| 11:00 AM to 11:59 AM | 0 (0.0%) | 53 (5.1%) |
| 12:00 PM to 3:59 PM | 52 (5.0%) | 47 (4.5%) |
| 4:00 PM to 11:59 PM | 88 (8.4%) | 29 (2.8%) |
| Total | 1,045 (100.0%) | 1,043 (100.0%) |
Housing Occupancy in Plains
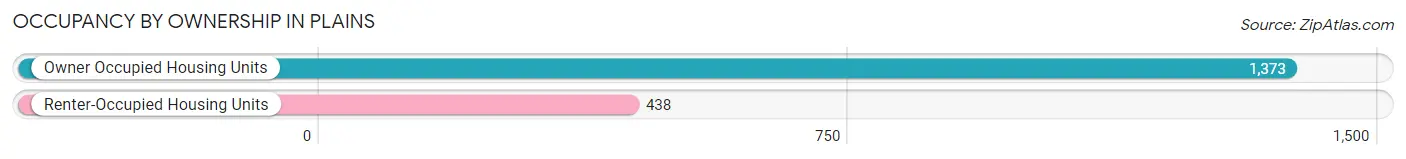
Occupancy by Ownership in Plains
Of the total 1,811 dwellings in Plains, owner-occupied units account for 1,373 (75.8%), while renter-occupied units make up 438 (24.2%).
| Occupancy | # Housing Units | % Housing Units |
| Owner Occupied Housing Units | 1,373 | 75.8% |
| Renter-Occupied Housing Units | 438 | 24.2% |
| Total Occupied Housing Units | 1,811 | 100.0% |
Occupancy by Household Size in Plains
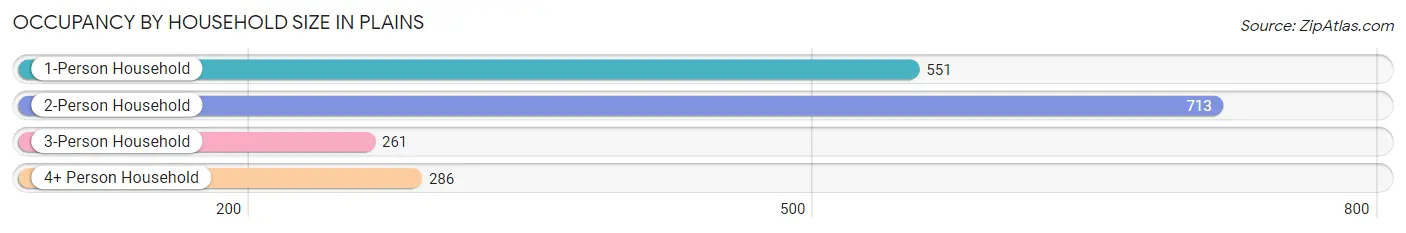
| Household Size | # Housing Units | % Housing Units |
| 1-Person Household | 551 | 30.4% |
| 2-Person Household | 713 | 39.4% |
| 3-Person Household | 261 | 14.4% |
| 4+ Person Household | 286 | 15.8% |
| Total Housing Units | 1,811 | 100.0% |
Occupancy by Ownership by Household Size in Plains
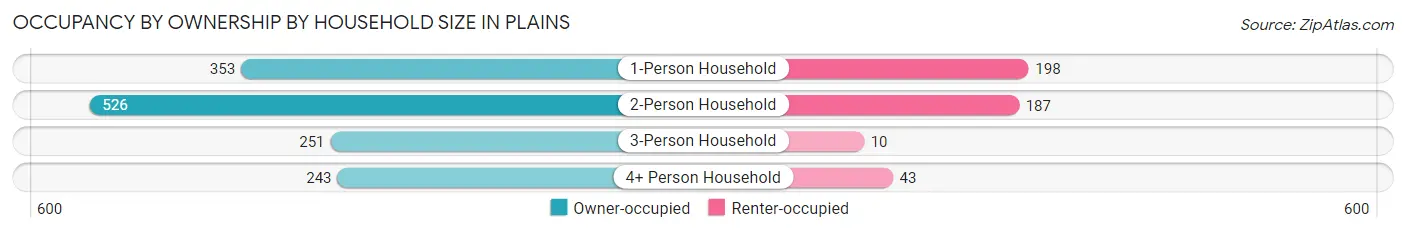
| Household Size | Owner-occupied | Renter-occupied |
| 1-Person Household | 353 (64.1%) | 198 (35.9%) |
| 2-Person Household | 526 (73.8%) | 187 (26.2%) |
| 3-Person Household | 251 (96.2%) | 10 (3.8%) |
| 4+ Person Household | 243 (85.0%) | 43 (15.0%) |
| Total Housing Units | 1,373 (75.8%) | 438 (24.2%) |
Occupancy by Educational Attainment in Plains
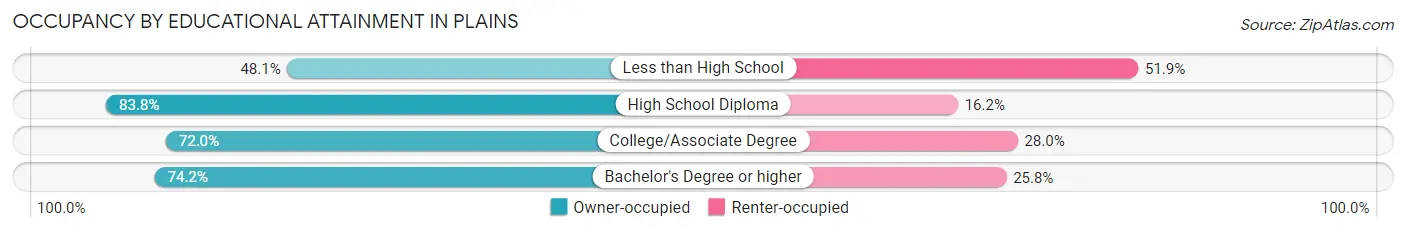
| Household Size | Owner-occupied | Renter-occupied |
| Less than High School | 50 (48.1%) | 54 (51.9%) |
| High School Diploma | 596 (83.8%) | 115 (16.2%) |
| College/Associate Degree | 393 (72.0%) | 153 (28.0%) |
| Bachelor's Degree or higher | 334 (74.2%) | 116 (25.8%) |
Occupancy by Age of Householder in Plains
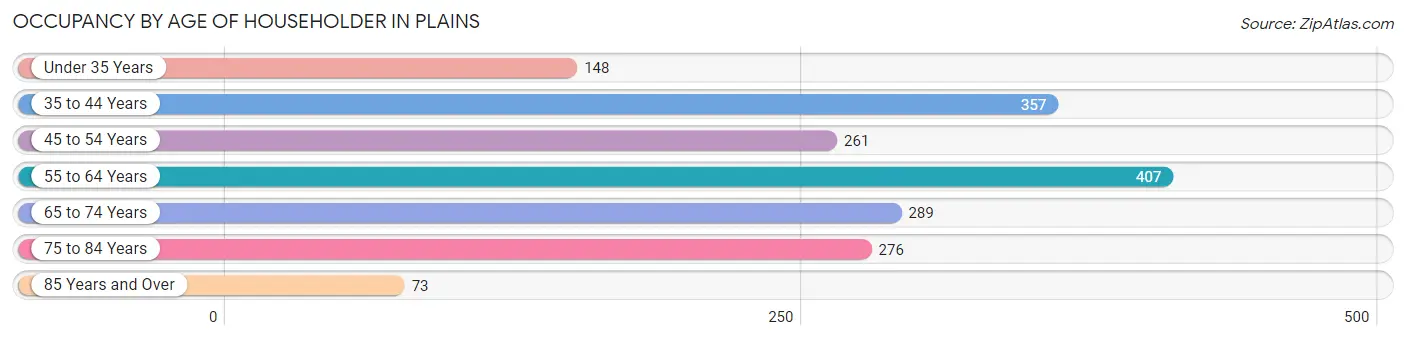
| Age Bracket | # Households | % Households |
| Under 35 Years | 148 | 8.2% |
| 35 to 44 Years | 357 | 19.7% |
| 45 to 54 Years | 261 | 14.4% |
| 55 to 64 Years | 407 | 22.5% |
| 65 to 74 Years | 289 | 16.0% |
| 75 to 84 Years | 276 | 15.2% |
| 85 Years and Over | 73 | 4.0% |
| Total | 1,811 | 100.0% |
Housing Finances in Plains
Median Income by Occupancy in Plains
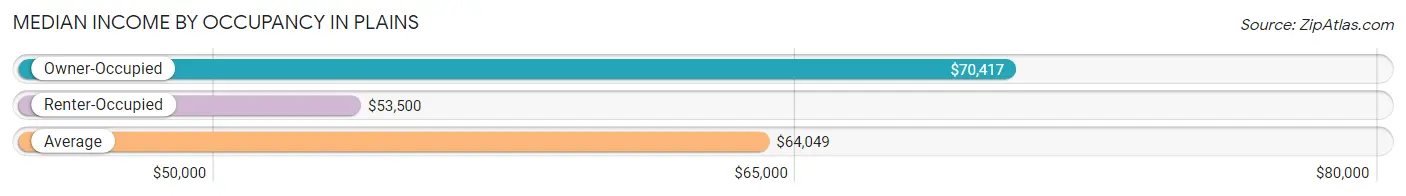
| Occupancy Type | # Households | Median Income |
| Owner-Occupied | 1,373 (75.8%) | $70,417 |
| Renter-Occupied | 438 (24.2%) | $53,500 |
| Average | 1,811 (100.0%) | $64,049 |
Occupancy by Householder Income Bracket in Plains
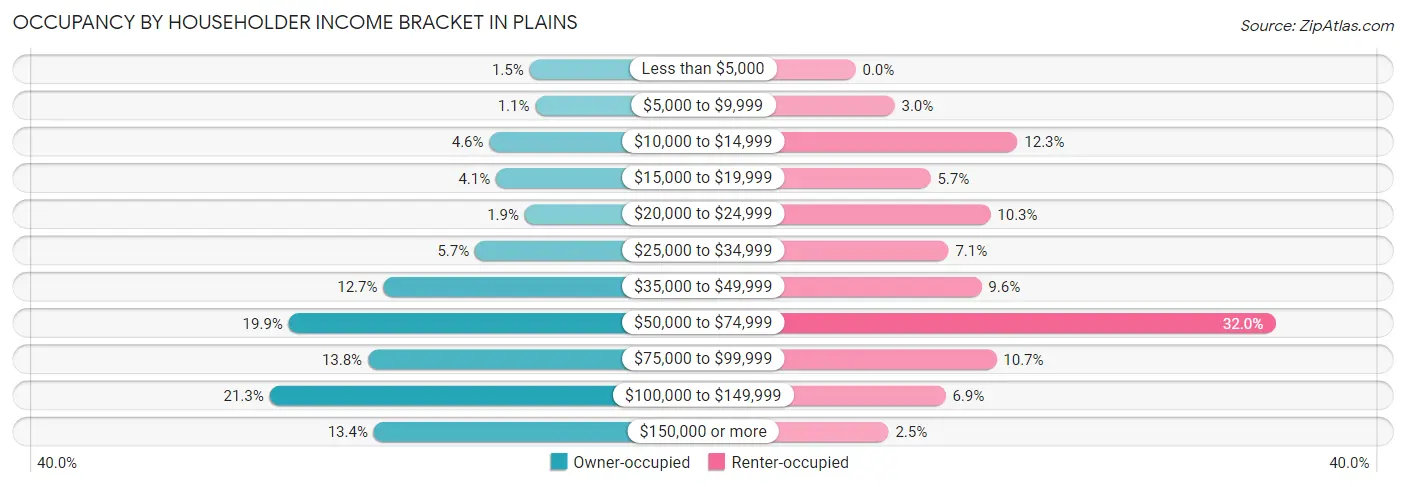
| Income Bracket | Owner-occupied | Renter-occupied |
| Less than $5,000 | 21 (1.5%) | 0 (0.0%) |
| $5,000 to $9,999 | 15 (1.1%) | 13 (3.0%) |
| $10,000 to $14,999 | 63 (4.6%) | 54 (12.3%) |
| $15,000 to $19,999 | 56 (4.1%) | 25 (5.7%) |
| $20,000 to $24,999 | 26 (1.9%) | 45 (10.3%) |
| $25,000 to $34,999 | 78 (5.7%) | 31 (7.1%) |
| $35,000 to $49,999 | 174 (12.7%) | 42 (9.6%) |
| $50,000 to $74,999 | 273 (19.9%) | 140 (32.0%) |
| $75,000 to $99,999 | 190 (13.8%) | 47 (10.7%) |
| $100,000 to $149,999 | 293 (21.3%) | 30 (6.9%) |
| $150,000 or more | 184 (13.4%) | 11 (2.5%) |
| Total | 1,373 (100.0%) | 438 (100.0%) |
Monthly Housing Cost Tiers in Plains
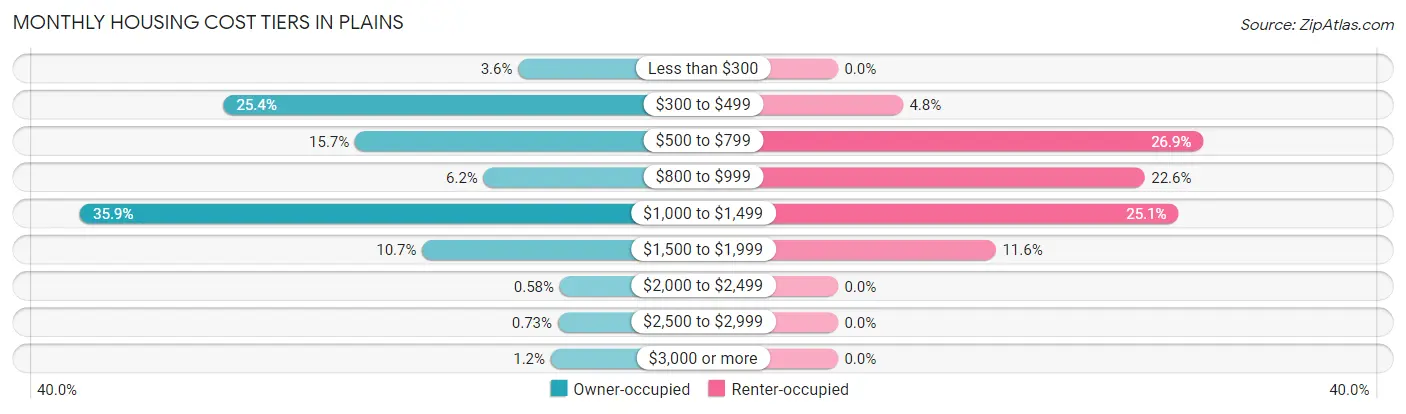
| Monthly Cost | Owner-occupied | Renter-occupied |
| Less than $300 | 50 (3.6%) | 0 (0.0%) |
| $300 to $499 | 348 (25.4%) | 21 (4.8%) |
| $500 to $799 | 215 (15.7%) | 118 (26.9%) |
| $800 to $999 | 85 (6.2%) | 99 (22.6%) |
| $1,000 to $1,499 | 493 (35.9%) | 110 (25.1%) |
| $1,500 to $1,999 | 147 (10.7%) | 51 (11.6%) |
| $2,000 to $2,499 | 8 (0.6%) | 0 (0.0%) |
| $2,500 to $2,999 | 10 (0.7%) | 0 (0.0%) |
| $3,000 or more | 17 (1.2%) | 0 (0.0%) |
| Total | 1,373 (100.0%) | 438 (100.0%) |
Physical Housing Characteristics in Plains
Housing Structures in Plains
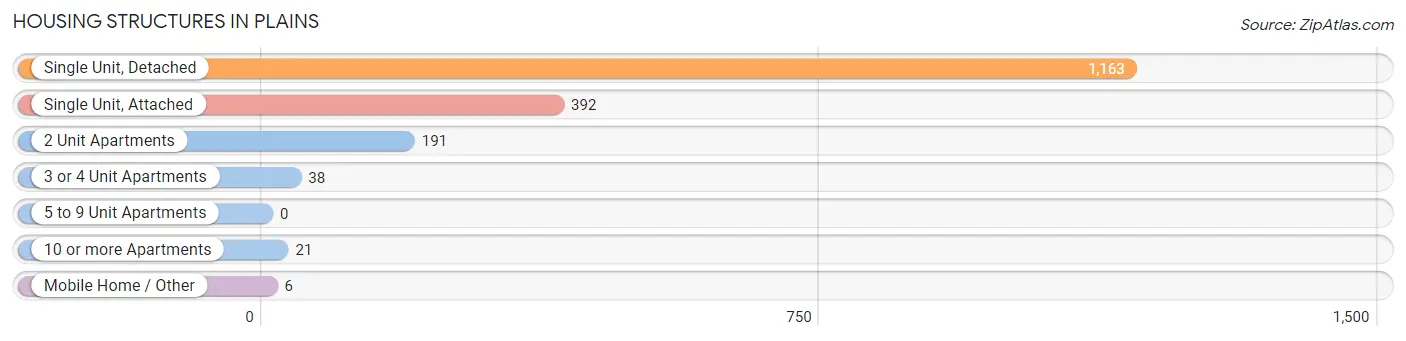
| Structure Type | # Housing Units | % Housing Units |
| Single Unit, Detached | 1,163 | 64.2% |
| Single Unit, Attached | 392 | 21.6% |
| 2 Unit Apartments | 191 | 10.5% |
| 3 or 4 Unit Apartments | 38 | 2.1% |
| 5 to 9 Unit Apartments | 0 | 0.0% |
| 10 or more Apartments | 21 | 1.2% |
| Mobile Home / Other | 6 | 0.3% |
| Total | 1,811 | 100.0% |
Housing Structures by Occupancy in Plains
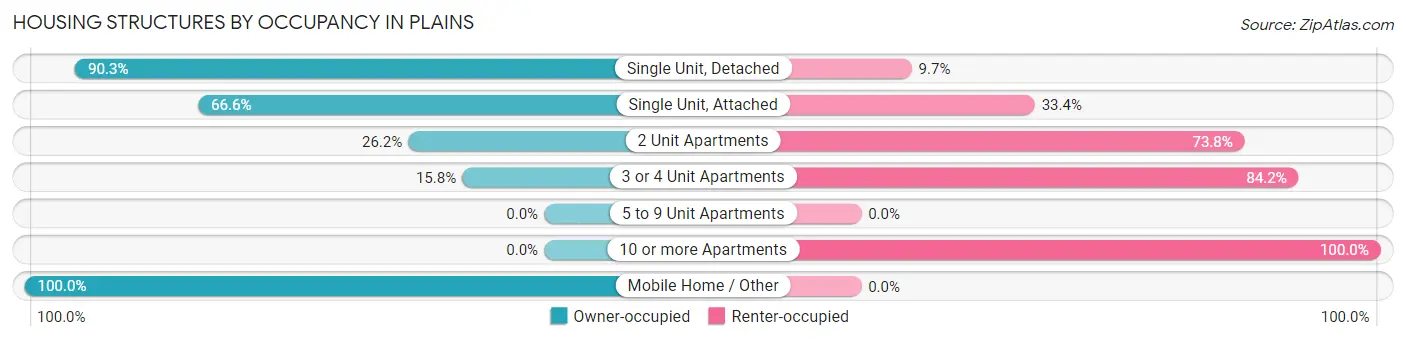
| Structure Type | Owner-occupied | Renter-occupied |
| Single Unit, Detached | 1,050 (90.3%) | 113 (9.7%) |
| Single Unit, Attached | 261 (66.6%) | 131 (33.4%) |
| 2 Unit Apartments | 50 (26.2%) | 141 (73.8%) |
| 3 or 4 Unit Apartments | 6 (15.8%) | 32 (84.2%) |
| 5 to 9 Unit Apartments | 0 (0.0%) | 0 (0.0%) |
| 10 or more Apartments | 0 (0.0%) | 21 (100.0%) |
| Mobile Home / Other | 6 (100.0%) | 0 (0.0%) |
| Total | 1,373 (75.8%) | 438 (24.2%) |
Housing Structures by Number of Rooms in Plains
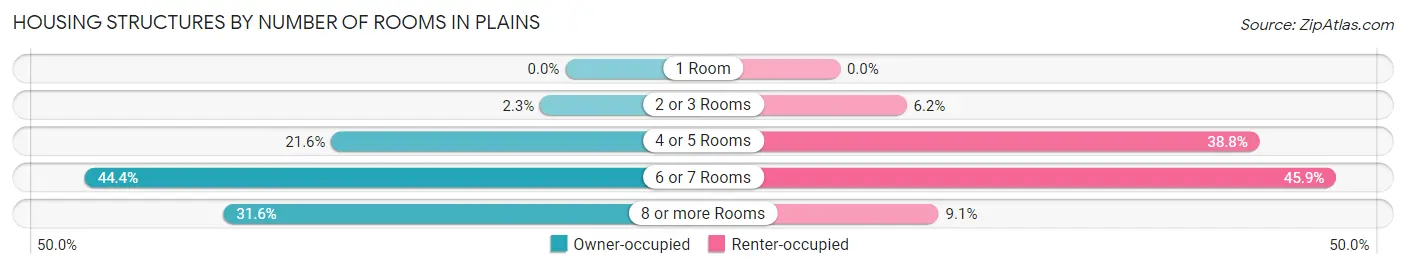
| Number of Rooms | Owner-occupied | Renter-occupied |
| 1 Room | 0 (0.0%) | 0 (0.0%) |
| 2 or 3 Rooms | 32 (2.3%) | 27 (6.2%) |
| 4 or 5 Rooms | 297 (21.6%) | 170 (38.8%) |
| 6 or 7 Rooms | 610 (44.4%) | 201 (45.9%) |
| 8 or more Rooms | 434 (31.6%) | 40 (9.1%) |
| Total | 1,373 (100.0%) | 438 (100.0%) |
Housing Structure by Heating Type in Plains
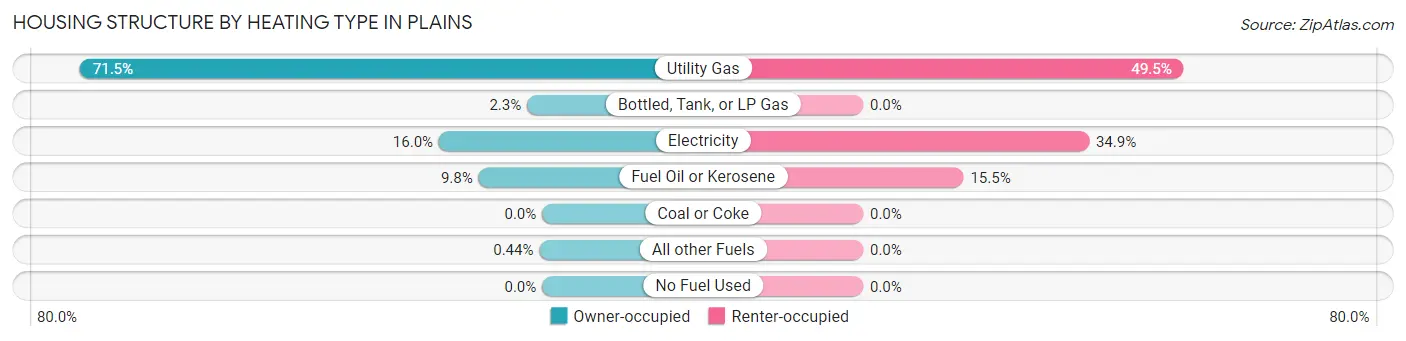
| Heating Type | Owner-occupied | Renter-occupied |
| Utility Gas | 981 (71.5%) | 217 (49.5%) |
| Bottled, Tank, or LP Gas | 32 (2.3%) | 0 (0.0%) |
| Electricity | 219 (16.0%) | 153 (34.9%) |
| Fuel Oil or Kerosene | 135 (9.8%) | 68 (15.5%) |
| Coal or Coke | 0 (0.0%) | 0 (0.0%) |
| All other Fuels | 6 (0.4%) | 0 (0.0%) |
| No Fuel Used | 0 (0.0%) | 0 (0.0%) |
| Total | 1,373 (100.0%) | 438 (100.0%) |
Household Vehicle Usage in Plains
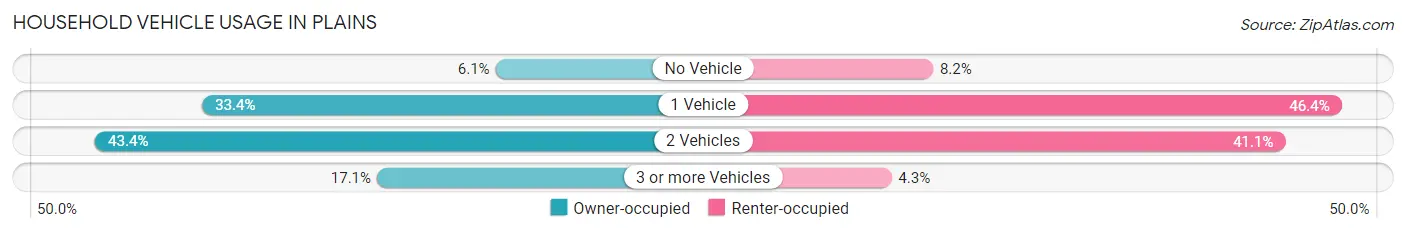
| Vehicles per Household | Owner-occupied | Renter-occupied |
| No Vehicle | 83 (6.0%) | 36 (8.2%) |
| 1 Vehicle | 459 (33.4%) | 203 (46.4%) |
| 2 Vehicles | 596 (43.4%) | 180 (41.1%) |
| 3 or more Vehicles | 235 (17.1%) | 19 (4.3%) |
| Total | 1,373 (100.0%) | 438 (100.0%) |
Real Estate & Mortgages in Plains
Real Estate and Mortgage Overview in Plains
| Characteristic | Without Mortgage | With Mortgage |
| Housing Units | 600 | 773 |
| Median Property Value | $109,300 | $126,400 |
| Median Household Income | $55,625 | $166 |
| Monthly Housing Costs | $451 | $17 |
| Real Estate Taxes | $1,991 | $0 |
Property Value by Mortgage Status in Plains
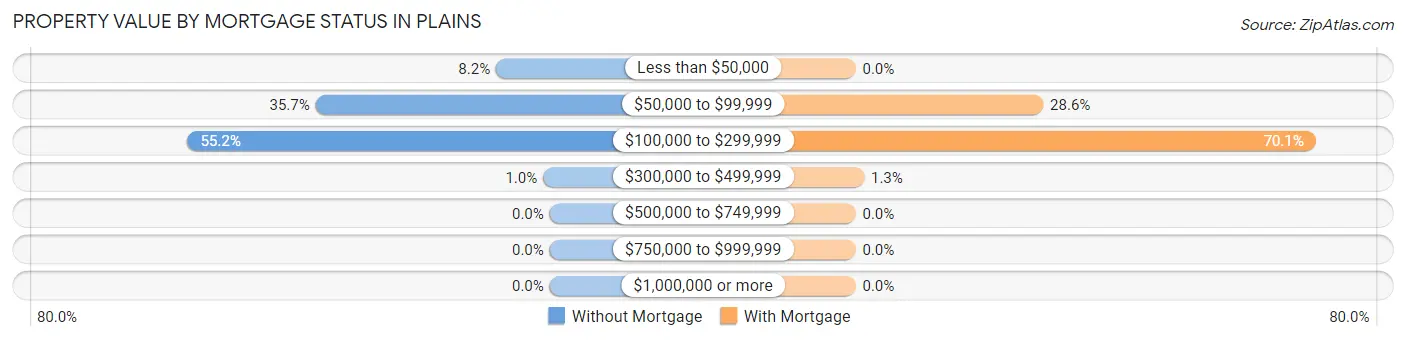
| Property Value | Without Mortgage | With Mortgage |
| Less than $50,000 | 49 (8.2%) | 0 (0.0%) |
| $50,000 to $99,999 | 214 (35.7%) | 221 (28.6%) |
| $100,000 to $299,999 | 331 (55.2%) | 542 (70.1%) |
| $300,000 to $499,999 | 6 (1.0%) | 10 (1.3%) |
| $500,000 to $749,999 | 0 (0.0%) | 0 (0.0%) |
| $750,000 to $999,999 | 0 (0.0%) | 0 (0.0%) |
| $1,000,000 or more | 0 (0.0%) | 0 (0.0%) |
| Total | 600 (100.0%) | 773 (100.0%) |
Household Income by Mortgage Status in Plains
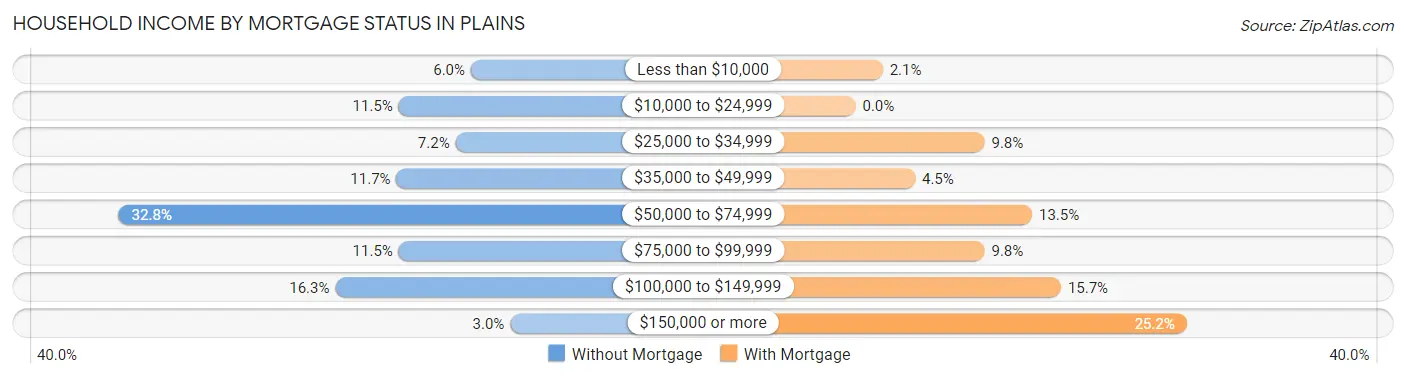
| Household Income | Without Mortgage | With Mortgage |
| Less than $10,000 | 36 (6.0%) | 16 (2.1%) |
| $10,000 to $24,999 | 69 (11.5%) | 0 (0.0%) |
| $25,000 to $34,999 | 43 (7.2%) | 76 (9.8%) |
| $35,000 to $49,999 | 70 (11.7%) | 35 (4.5%) |
| $50,000 to $74,999 | 197 (32.8%) | 104 (13.5%) |
| $75,000 to $99,999 | 69 (11.5%) | 76 (9.8%) |
| $100,000 to $149,999 | 98 (16.3%) | 121 (15.7%) |
| $150,000 or more | 18 (3.0%) | 195 (25.2%) |
| Total | 600 (100.0%) | 773 (100.0%) |
Property Value to Household Income Ratio in Plains
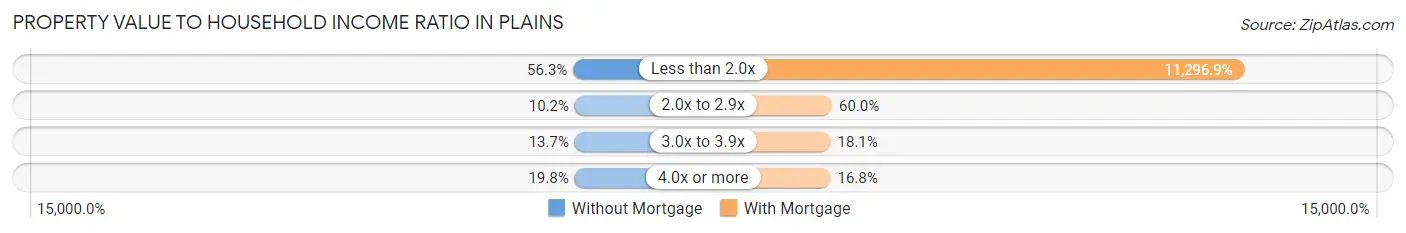
| Value-to-Income Ratio | Without Mortgage | With Mortgage |
| Less than 2.0x | 338 (56.3%) | 87,325 (11,296.9%) |
| 2.0x to 2.9x | 61 (10.2%) | 464 (60.0%) |
| 3.0x to 3.9x | 82 (13.7%) | 140 (18.1%) |
| 4.0x or more | 119 (19.8%) | 130 (16.8%) |
| Total | 600 (100.0%) | 773 (100.0%) |
Real Estate Taxes by Mortgage Status in Plains
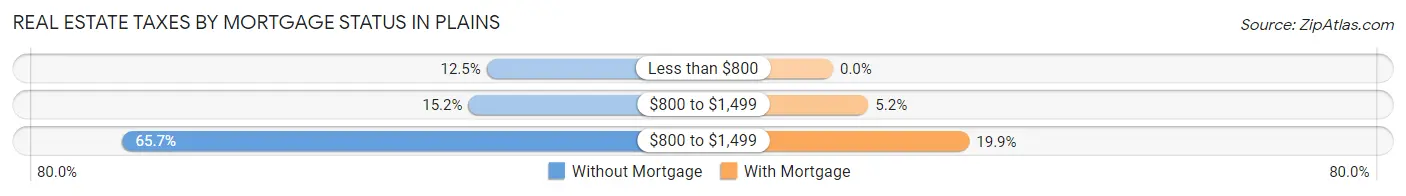
| Property Taxes | Without Mortgage | With Mortgage |
| Less than $800 | 75 (12.5%) | 0 (0.0%) |
| $800 to $1,499 | 91 (15.2%) | 40 (5.2%) |
| $800 to $1,499 | 394 (65.7%) | 154 (19.9%) |
| Total | 600 (100.0%) | 773 (100.0%) |
Health & Disability in Plains
Health Insurance Coverage by Age in Plains
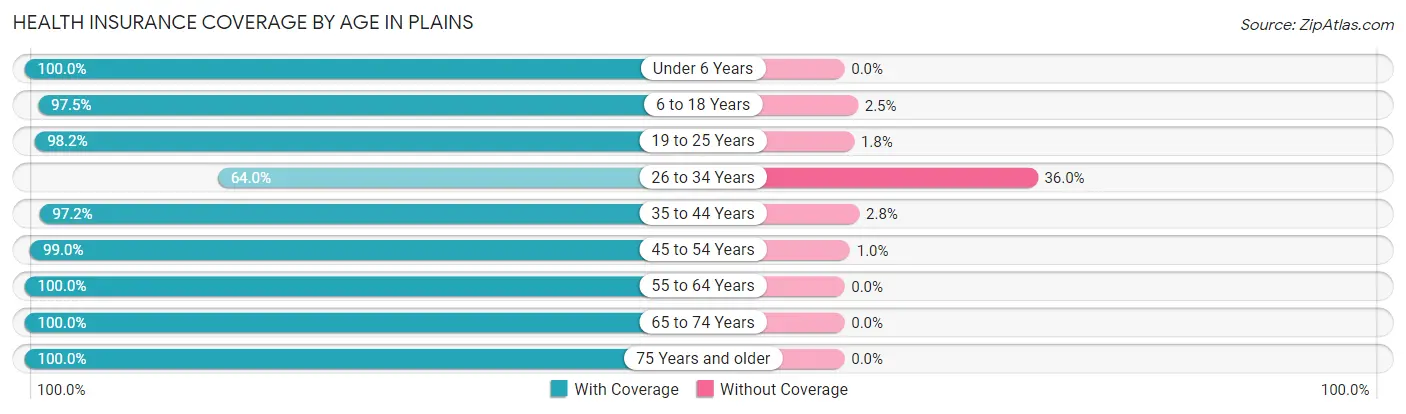
| Age Bracket | With Coverage | Without Coverage |
| Under 6 Years | 151 (100.0%) | 0 (0.0%) |
| 6 to 18 Years | 426 (97.5%) | 11 (2.5%) |
| 19 to 25 Years | 273 (98.2%) | 5 (1.8%) |
| 26 to 34 Years | 334 (64.0%) | 188 (36.0%) |
| 35 to 44 Years | 740 (97.2%) | 21 (2.8%) |
| 45 to 54 Years | 483 (99.0%) | 5 (1.0%) |
| 55 to 64 Years | 605 (100.0%) | 0 (0.0%) |
| 65 to 74 Years | 507 (100.0%) | 0 (0.0%) |
| 75 Years and older | 456 (100.0%) | 0 (0.0%) |
| Total | 3,975 (94.5%) | 230 (5.5%) |
Health Insurance Coverage by Citizenship Status in Plains
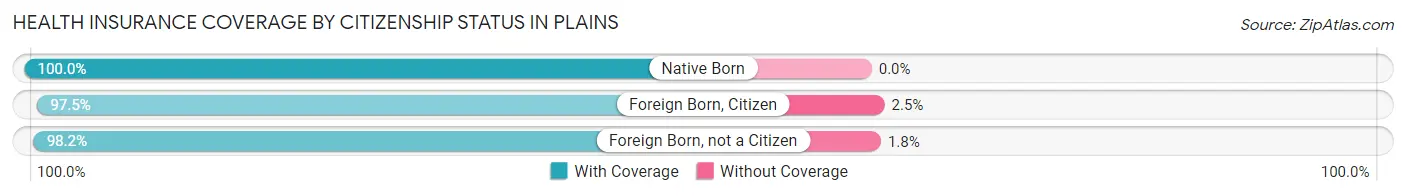
| Citizenship Status | With Coverage | Without Coverage |
| Native Born | 151 (100.0%) | 0 (0.0%) |
| Foreign Born, Citizen | 426 (97.5%) | 11 (2.5%) |
| Foreign Born, not a Citizen | 273 (98.2%) | 5 (1.8%) |
Health Insurance Coverage by Household Income in Plains
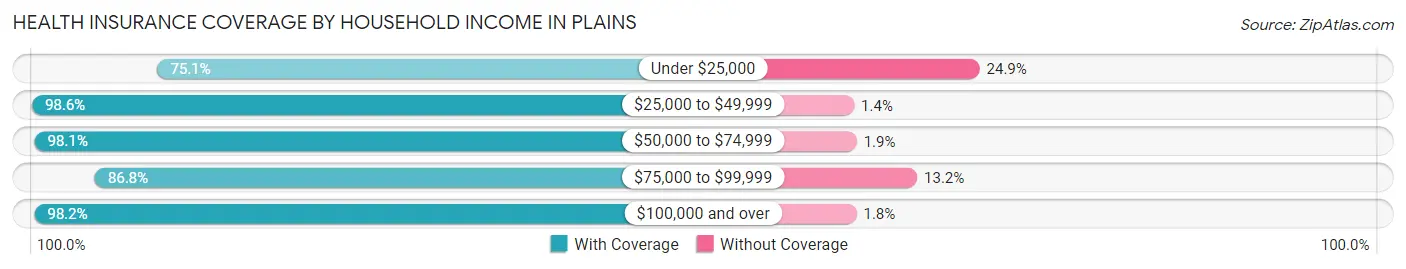
| Household Income | With Coverage | Without Coverage |
| Under $25,000 | 317 (75.1%) | 105 (24.9%) |
| $25,000 to $49,999 | 789 (98.6%) | 11 (1.4%) |
| $50,000 to $74,999 | 843 (98.1%) | 16 (1.9%) |
| $75,000 to $99,999 | 455 (86.8%) | 69 (13.2%) |
| $100,000 and over | 1,568 (98.2%) | 29 (1.8%) |
Public vs Private Health Insurance Coverage by Age in Plains
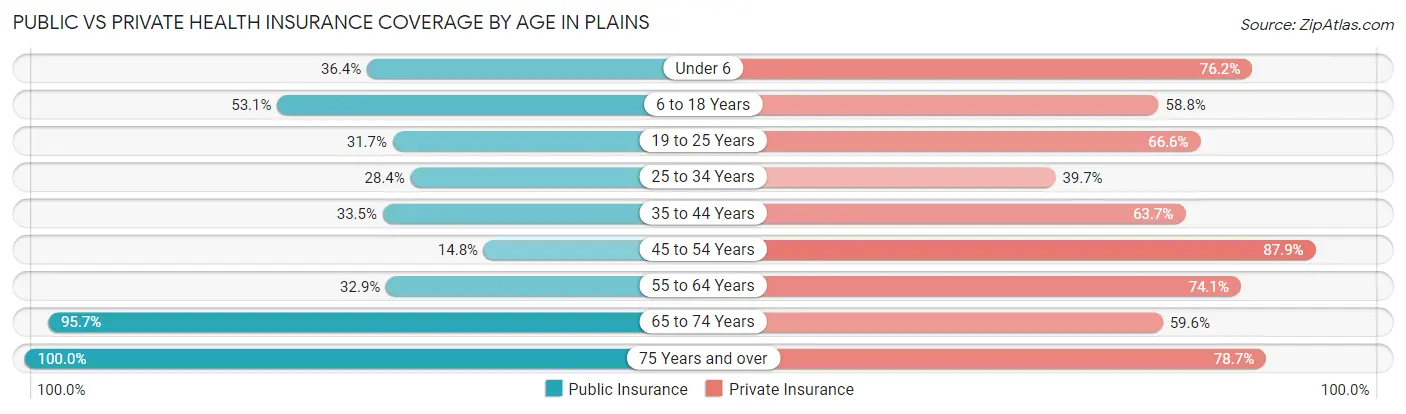
| Age Bracket | Public Insurance | Private Insurance |
| Under 6 | 55 (36.4%) | 115 (76.2%) |
| 6 to 18 Years | 232 (53.1%) | 257 (58.8%) |
| 19 to 25 Years | 88 (31.7%) | 185 (66.5%) |
| 25 to 34 Years | 148 (28.3%) | 207 (39.7%) |
| 35 to 44 Years | 255 (33.5%) | 485 (63.7%) |
| 45 to 54 Years | 72 (14.7%) | 429 (87.9%) |
| 55 to 64 Years | 199 (32.9%) | 448 (74.1%) |
| 65 to 74 Years | 485 (95.7%) | 302 (59.6%) |
| 75 Years and over | 456 (100.0%) | 359 (78.7%) |
| Total | 1,990 (47.3%) | 2,787 (66.3%) |
Disability Status by Sex by Age in Plains
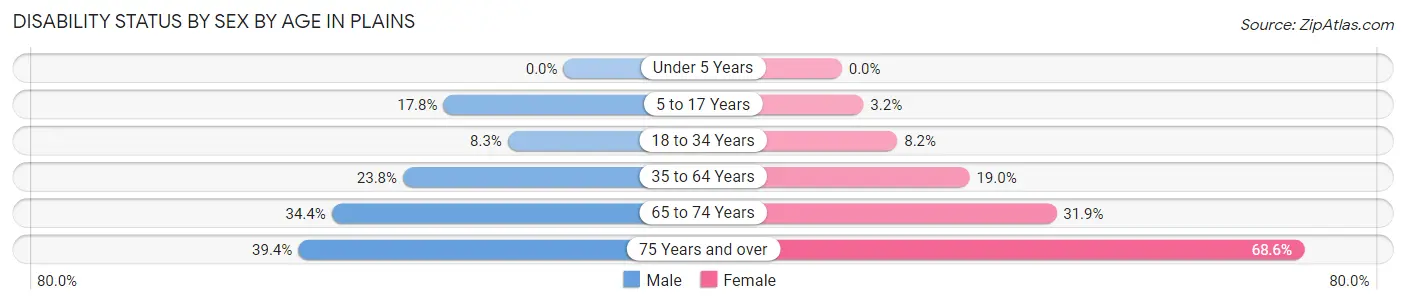
| Age Bracket | Male | Female |
| Under 5 Years | 0 (0.0%) | 0 (0.0%) |
| 5 to 17 Years | 46 (17.8%) | 7 (3.2%) |
| 18 to 34 Years | 37 (8.3%) | 29 (8.2%) |
| 35 to 64 Years | 218 (23.8%) | 178 (19.0%) |
| 65 to 74 Years | 74 (34.4%) | 93 (31.9%) |
| 75 Years and over | 78 (39.4%) | 177 (68.6%) |
Disability Class by Sex by Age in Plains
Disability Class: Hearing Difficulty
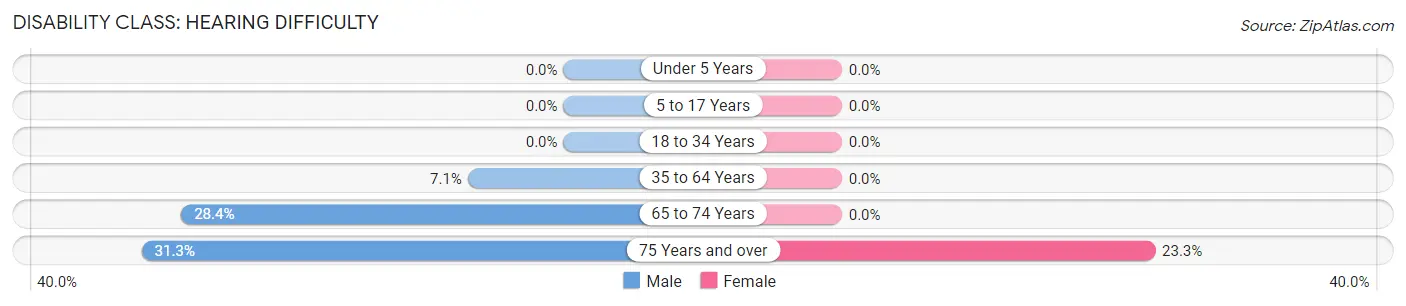
| Age Bracket | Male | Female |
| Under 5 Years | 0 (0.0%) | 0 (0.0%) |
| 5 to 17 Years | 0 (0.0%) | 0 (0.0%) |
| 18 to 34 Years | 0 (0.0%) | 0 (0.0%) |
| 35 to 64 Years | 65 (7.1%) | 0 (0.0%) |
| 65 to 74 Years | 61 (28.4%) | 0 (0.0%) |
| 75 Years and over | 62 (31.3%) | 60 (23.3%) |
Disability Class: Vision Difficulty
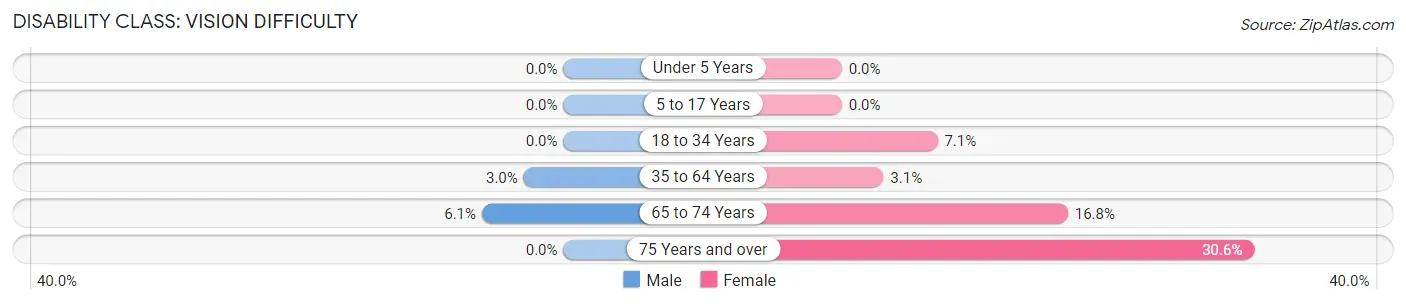
| Age Bracket | Male | Female |
| Under 5 Years | 0 (0.0%) | 0 (0.0%) |
| 5 to 17 Years | 0 (0.0%) | 0 (0.0%) |
| 18 to 34 Years | 0 (0.0%) | 25 (7.1%) |
| 35 to 64 Years | 27 (2.9%) | 29 (3.1%) |
| 65 to 74 Years | 13 (6.0%) | 49 (16.8%) |
| 75 Years and over | 0 (0.0%) | 79 (30.6%) |
Disability Class: Cognitive Difficulty
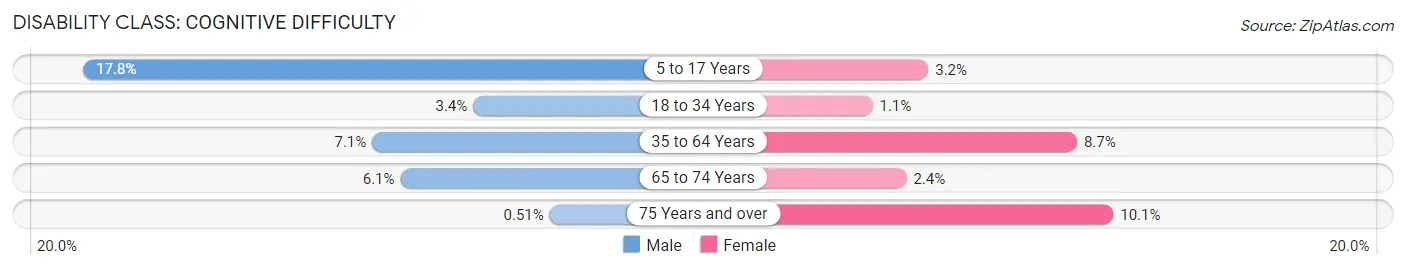
| Age Bracket | Male | Female |
| 5 to 17 Years | 46 (17.8%) | 7 (3.2%) |
| 18 to 34 Years | 15 (3.4%) | 4 (1.1%) |
| 35 to 64 Years | 65 (7.1%) | 82 (8.7%) |
| 65 to 74 Years | 13 (6.0%) | 7 (2.4%) |
| 75 Years and over | 1 (0.5%) | 26 (10.1%) |
Disability Class: Ambulatory Difficulty
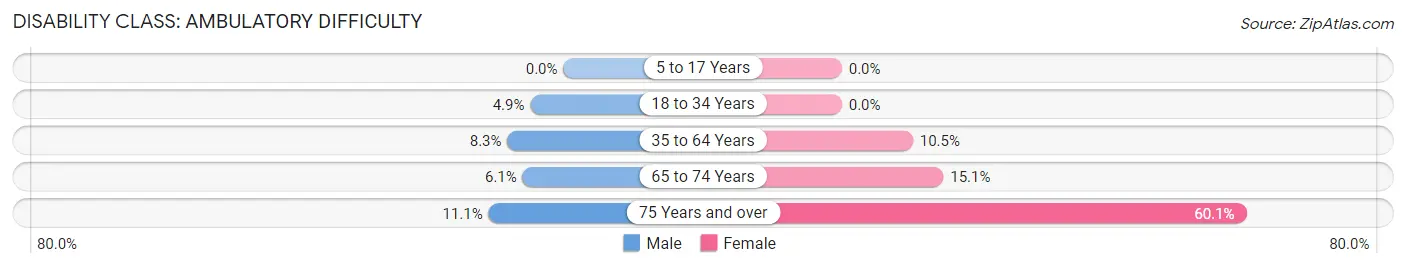
| Age Bracket | Male | Female |
| 5 to 17 Years | 0 (0.0%) | 0 (0.0%) |
| 18 to 34 Years | 22 (4.9%) | 0 (0.0%) |
| 35 to 64 Years | 76 (8.3%) | 99 (10.5%) |
| 65 to 74 Years | 13 (6.0%) | 44 (15.1%) |
| 75 Years and over | 22 (11.1%) | 155 (60.1%) |
Disability Class: Self-Care Difficulty
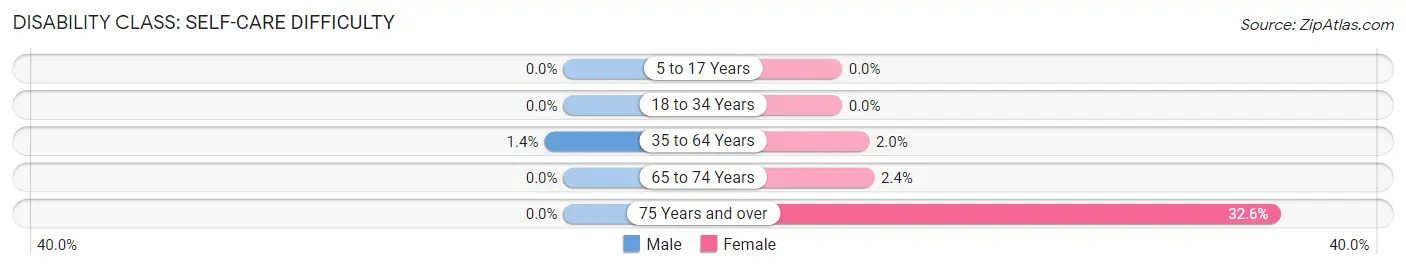
| Age Bracket | Male | Female |
| 5 to 17 Years | 0 (0.0%) | 0 (0.0%) |
| 18 to 34 Years | 0 (0.0%) | 0 (0.0%) |
| 35 to 64 Years | 13 (1.4%) | 19 (2.0%) |
| 65 to 74 Years | 0 (0.0%) | 7 (2.4%) |
| 75 Years and over | 0 (0.0%) | 84 (32.6%) |
Technology Access in Plains
Computing Device Access in Plains
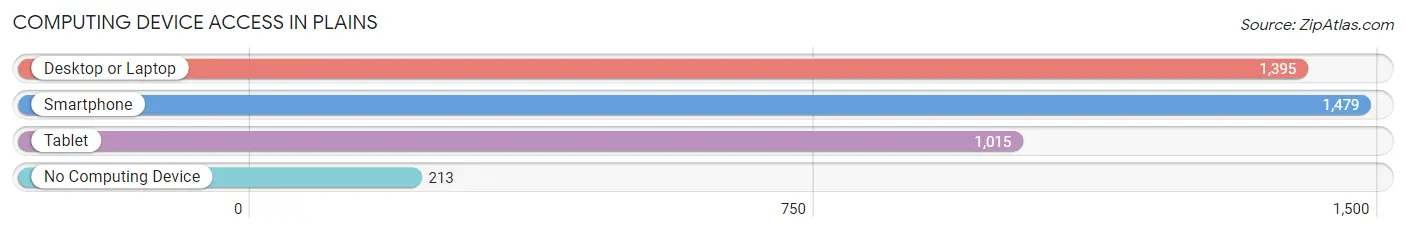
| Device Type | # Households | % Households |
| Desktop or Laptop | 1,395 | 77.0% |
| Smartphone | 1,479 | 81.7% |
| Tablet | 1,015 | 56.0% |
| No Computing Device | 213 | 11.8% |
| Total | 1,811 | 100.0% |
Internet Access in Plains
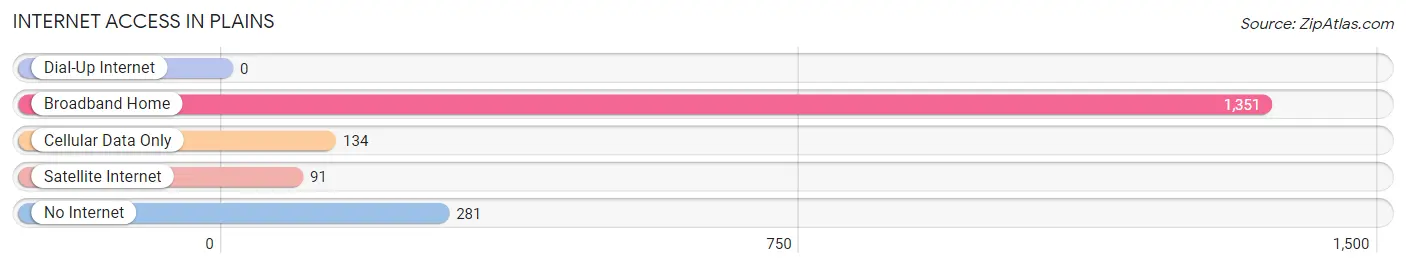
| Internet Type | # Households | % Households |
| Dial-Up Internet | 0 | 0.0% |
| Broadband Home | 1,351 | 74.6% |
| Cellular Data Only | 134 | 7.4% |
| Satellite Internet | 91 | 5.0% |
| No Internet | 281 | 15.5% |
| Total | 1,811 | 100.0% |
Plains Summary
Plains, Pennsylvania is a small borough located in Luzerne County in the northeastern part of the state. It is situated in the Wyoming Valley, a region of the Appalachian Mountains. The borough is bordered by the Susquehanna River to the north and the Lackawanna River to the south. The population of Plains was 2,845 at the 2010 census.
History
The area that is now Plains was originally inhabited by the Susquehannock and Delaware Native American tribes. The first European settlers arrived in the area in the late 1700s. The town was founded in 1835 and was originally known as “Plainville.” The name was changed to Plains in 1875.
The borough was an important stop on the Lehigh Valley Railroad, which ran through the area from 1855 to 1976. The railroad was a major factor in the growth of the town, as it allowed for the transportation of goods and people.
Geography
Plains is located in the Wyoming Valley, a region of the Appalachian Mountains. The borough is bordered by the Susquehanna River to the north and the Lackawanna River to the south. The terrain is mostly flat, with some rolling hills. The climate is humid continental, with cold winters and hot, humid summers.
Economy
The economy of Plains is largely based on agriculture and manufacturing. The borough is home to several small businesses, including a lumber mill, a furniture factory, and a dairy farm. The town also has a few retail stores, restaurants, and a movie theater.
Demographics
As of the 2010 census, the population of Plains was 2,845. The racial makeup of the borough was 97.3% White, 0.7% African American, 0.3% Native American, 0.3% Asian, 0.1% Pacific Islander, 0.3% from other races, and 1.0% from two or more races. Hispanic or Latino of any race were 1.2% of the population.
The median household income in Plains was $37,917, and the median family income was $45,938. The per capita income was $19,945. About 11.2% of families and 13.2% of the population were below the poverty line, including 17.2% of those under age 18 and 8.2% of those age 65 or over.
Common Questions
What is Per Capita Income in Plains?
Per Capita income in Plains is $32,609.
What is the Median Family Income in Plains?
Median Family Income in Plains is $81,829.
What is the Median Household income in Plains?
Median Household Income in Plains is $64,049.
What is Income or Wage Gap in Plains?
Income or Wage Gap in Plains is 25.2%.
Women in Plains earn 74.8 cents for every dollar earned by a man.
What is Inequality or Gini Index in Plains?
Inequality or Gini Index in Plains is 0.38.
What is the Total Population of Plains?
Total Population of Plains is 4,205.
What is the Total Male Population of Plains?
Total Male Population of Plains is 2,073.
What is the Total Female Population of Plains?
Total Female Population of Plains is 2,132.
What is the Ratio of Males per 100 Females in Plains?
There are 97.23 Males per 100 Females in Plains.
What is the Ratio of Females per 100 Males in Plains?
There are 102.85 Females per 100 Males in Plains.
What is the Median Population Age in Plains?
Median Population Age in Plains is 44.1 Years.
What is the Average Family Size in Plains
Average Family Size in Plains is 2.9 People.
What is the Average Household Size in Plains
Average Household Size in Plains is 2.3 People.
How Large is the Labor Force in Plains?
There are 2,423 People in the Labor Forcein in Plains.
What is the Percentage of People in the Labor Force in Plains?
65.5% of People are in the Labor Force in Plains.
What is the Unemployment Rate in Plains?
Unemployment Rate in Plains is 6.3%.