Clifton Heights borough, PA Map & Demographics
Clifton Heights borough Overview
$26,866
PER CAPITA INCOME
$67,850
AVG FAMILY INCOME
$61,155
AVG HOUSEHOLD INCOME
16.5%
WAGE / INCOME GAP [ % ]
83.5¢/ $1
WAGE / INCOME GAP [ $ ]
0.41
INEQUALITY / GINI INDEX
6,834
TOTAL POPULATION
3,069
MALE POPULATION
3,765
FEMALE POPULATION
81.51
MALES / 100 FEMALES
122.68
FEMALES / 100 MALES
32.8
MEDIAN AGE
3.6
AVG FAMILY SIZE
2.8
AVG HOUSEHOLD SIZE
3,390
LABOR FORCE [ PEOPLE ]
63.1%
PERCENT IN LABOR FORCE
18.3%
UNEMPLOYMENT RATE
Income in Clifton Heights borough
Income Overview in Clifton Heights borough
Per Capita Income in Clifton Heights borough is $26,866, while median incomes of families and households are $67,850 and $61,155 respectively.
| Characteristic | Number | Measure |
| Per Capita Income | 6,834 | $26,866 |
| Median Family Income | 1,611 | $67,850 |
| Mean Family Income | 1,611 | $88,927 |
| Median Household Income | 2,433 | $61,155 |
| Mean Household Income | 2,433 | $76,146 |
| Income Deficit | 1,611 | $0 |
| Wage / Income Gap (%) | 6,834 | 16.51% |
| Wage / Income Gap ($) | 6,834 | 83.49¢ per $1 |
| Gini / Inequality Index | 6,834 | 0.41 |
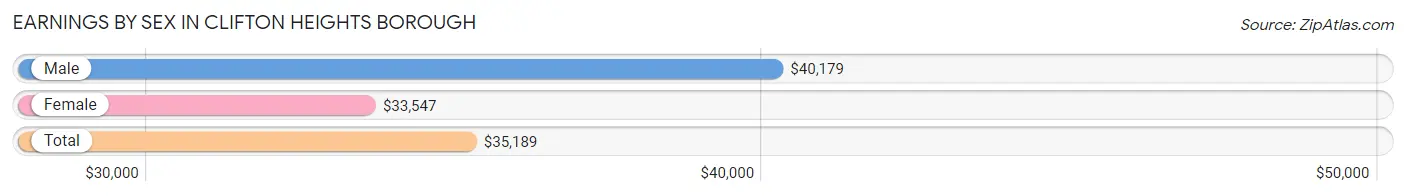
Earnings by Sex in Clifton Heights borough
Average Earnings in Clifton Heights borough are $35,189, $40,179 for men and $33,547 for women, a difference of 16.5%.
| Sex | Number | Average Earnings |
| Male | 1,770 (51.8%) | $40,179 |
| Female | 1,644 (48.1%) | $33,547 |
| Total | 3,414 (100.0%) | $35,189 |
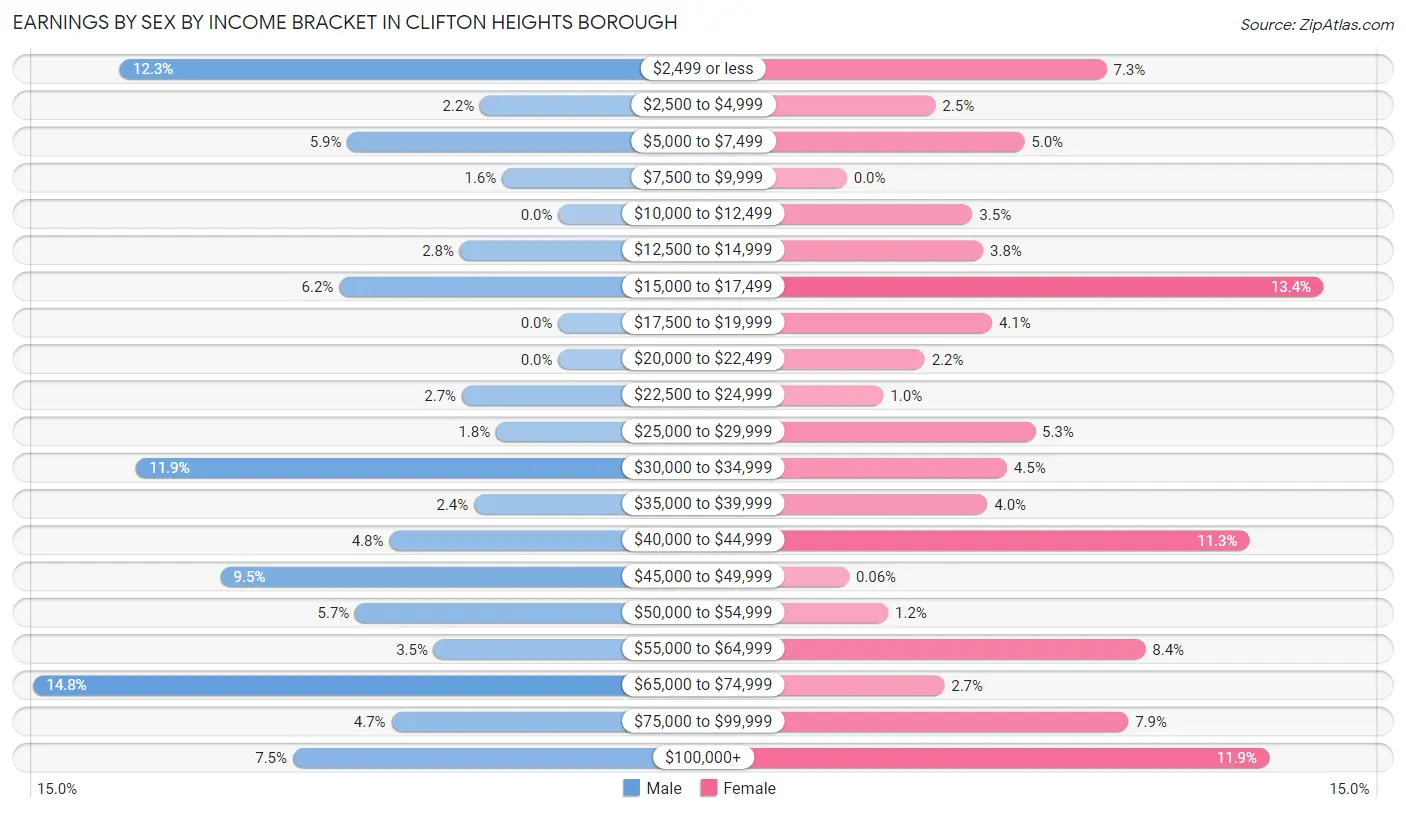
Earnings by Sex by Income Bracket in Clifton Heights borough
The most common earnings brackets in Clifton Heights borough are $65,000 to $74,999 for men (261 | 14.7%) and $15,000 to $17,499 for women (220 | 13.4%).
| Income | Male | Female |
| $2,499 or less | 218 (12.3%) | 120 (7.3%) |
| $2,500 to $4,999 | 39 (2.2%) | 41 (2.5%) |
| $5,000 to $7,499 | 105 (5.9%) | 82 (5.0%) |
| $7,500 to $9,999 | 28 (1.6%) | 0 (0.0%) |
| $10,000 to $12,499 | 0 (0.0%) | 58 (3.5%) |
| $12,500 to $14,999 | 49 (2.8%) | 63 (3.8%) |
| $15,000 to $17,499 | 109 (6.2%) | 220 (13.4%) |
| $17,500 to $19,999 | 0 (0.0%) | 67 (4.1%) |
| $20,000 to $22,499 | 0 (0.0%) | 36 (2.2%) |
| $22,500 to $24,999 | 48 (2.7%) | 17 (1.0%) |
| $25,000 to $29,999 | 31 (1.8%) | 87 (5.3%) |
| $30,000 to $34,999 | 210 (11.9%) | 74 (4.5%) |
| $35,000 to $39,999 | 42 (2.4%) | 65 (4.0%) |
| $40,000 to $44,999 | 84 (4.8%) | 186 (11.3%) |
| $45,000 to $49,999 | 168 (9.5%) | 1 (0.1%) |
| $50,000 to $54,999 | 101 (5.7%) | 19 (1.2%) |
| $55,000 to $64,999 | 62 (3.5%) | 138 (8.4%) |
| $65,000 to $74,999 | 261 (14.7%) | 45 (2.7%) |
| $75,000 to $99,999 | 83 (4.7%) | 130 (7.9%) |
| $100,000+ | 132 (7.5%) | 195 (11.9%) |
| Total | 1,770 (100.0%) | 1,644 (100.0%) |
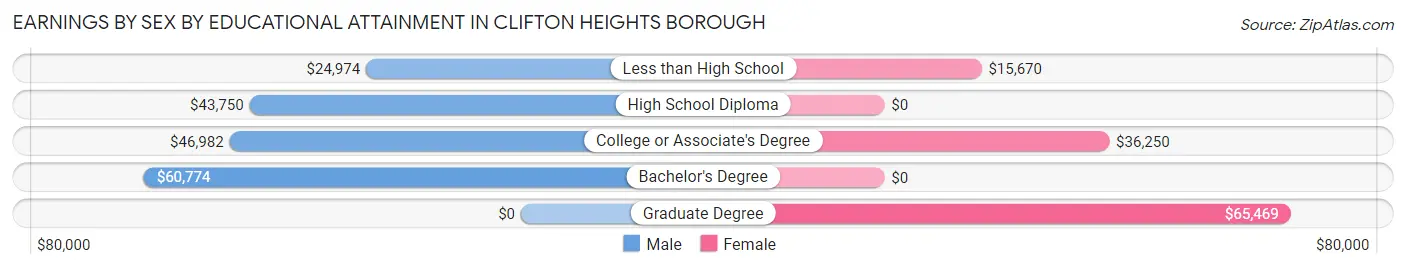
Earnings by Sex by Educational Attainment in Clifton Heights borough
Average earnings in Clifton Heights borough are $45,007 for men and $40,108 for women, a difference of 10.9%. Men with an educational attainment of bachelor's degree enjoy the highest average annual earnings of $60,774, while those with less than high school education earn the least with $24,974. Women with an educational attainment of graduate degree earn the most with the average annual earnings of $65,469, while those with less than high school education have the smallest earnings of $15,670.
| Educational Attainment | Male Income | Female Income |
| Less than High School | $24,974 | $15,670 |
| High School Diploma | $43,750 | $0 |
| College or Associate's Degree | $46,982 | $36,250 |
| Bachelor's Degree | $60,774 | $0 |
| Graduate Degree | - | - |
| Total | $45,007 | $40,108 |
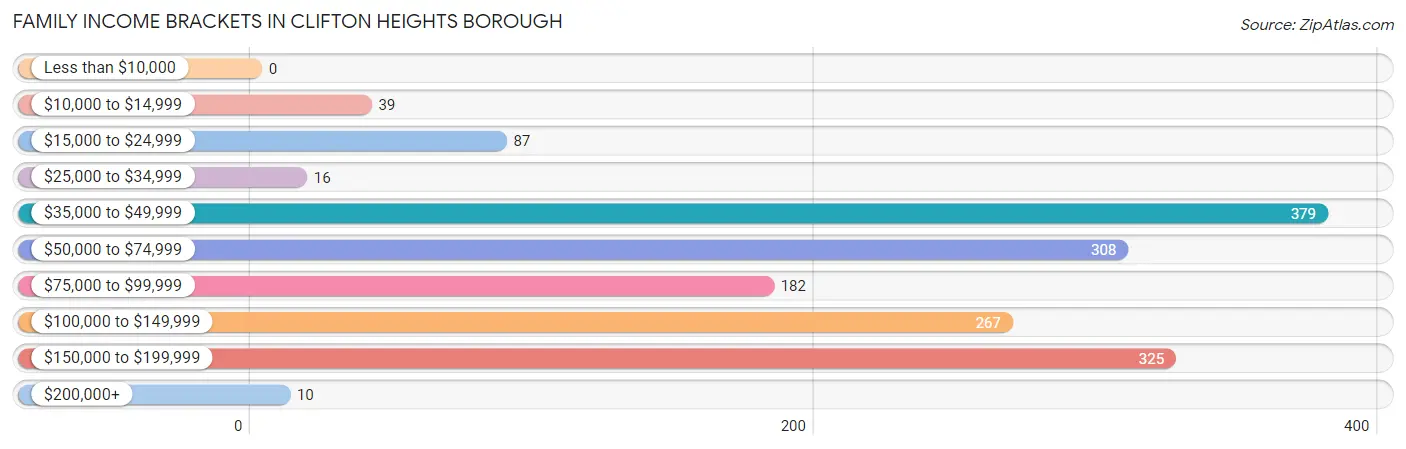
Family Income in Clifton Heights borough
Family Income Brackets in Clifton Heights borough
According to the Clifton Heights borough family income data, there are 379 families falling into the $35,000 to $49,999 income range, which is the most common income bracket and makes up 23.5% of all families.
| Income Bracket | # Families | % Families |
| Less than $10,000 | 0 | 0.0% |
| $10,000 to $14,999 | 39 | 2.4% |
| $15,000 to $24,999 | 87 | 5.4% |
| $25,000 to $34,999 | 16 | 1.0% |
| $35,000 to $49,999 | 379 | 23.5% |
| $50,000 to $74,999 | 308 | 19.1% |
| $75,000 to $99,999 | 182 | 11.3% |
| $100,000 to $149,999 | 267 | 16.6% |
| $150,000 to $199,999 | 325 | 20.2% |
| $200,000+ | 10 | 0.6% |
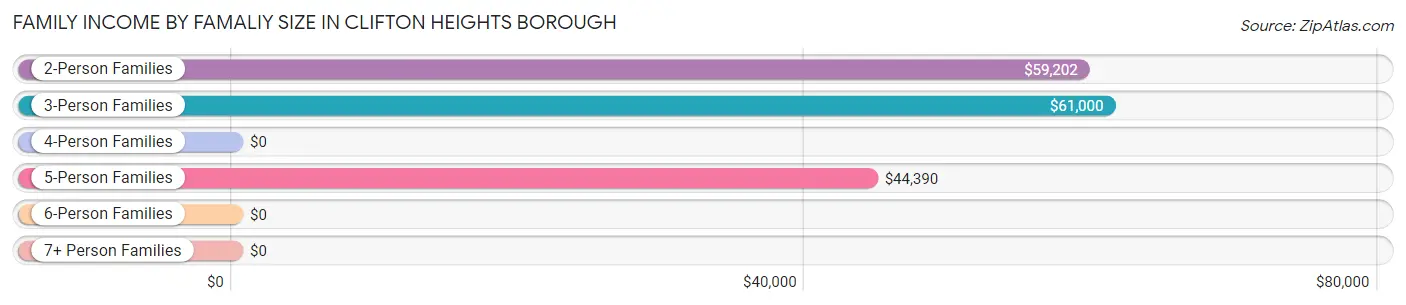
Family Income by Famaliy Size in Clifton Heights borough
3-person families (260 | 16.1%) account for the highest median family income in Clifton Heights borough with $61,000 per family, while 2-person families (602 | 37.4%) have the highest median income of $29,601 per family member.
| Income Bracket | # Families | Median Income |
| 2-Person Families | 602 (37.4%) | $59,202 |
| 3-Person Families | 260 (16.1%) | $61,000 |
| 4-Person Families | 419 (26.0%) | $0 |
| 5-Person Families | 124 (7.7%) | $44,390 |
| 6-Person Families | 139 (8.6%) | $0 |
| 7+ Person Families | 67 (4.2%) | $0 |
| Total | 1,611 (100.0%) | $67,850 |
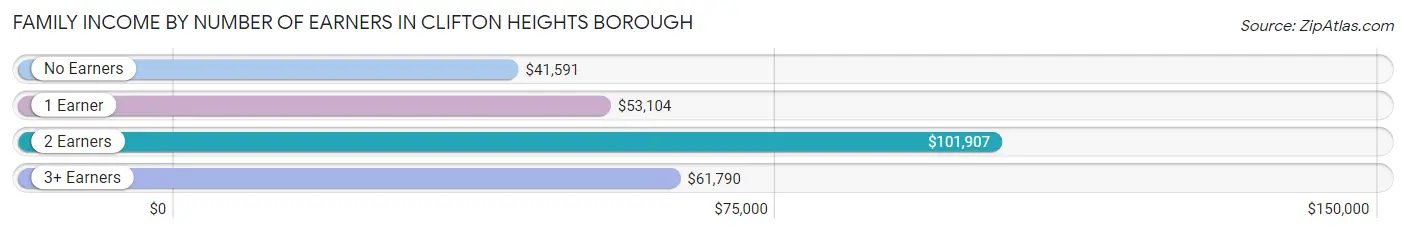
Family Income by Number of Earners in Clifton Heights borough
The median family income in Clifton Heights borough is $67,850, with families comprising 2 earners (753) having the highest median family income of $101,907, while families with no earners (110) have the lowest median family income of $41,591, accounting for 46.7% and 6.8% of families, respectively.
| Number of Earners | # Families | Median Income |
| No Earners | 110 (6.8%) | $41,591 |
| 1 Earner | 519 (32.2%) | $53,104 |
| 2 Earners | 753 (46.7%) | $101,907 |
| 3+ Earners | 229 (14.2%) | $61,790 |
| Total | 1,611 (100.0%) | $67,850 |
Household Income in Clifton Heights borough
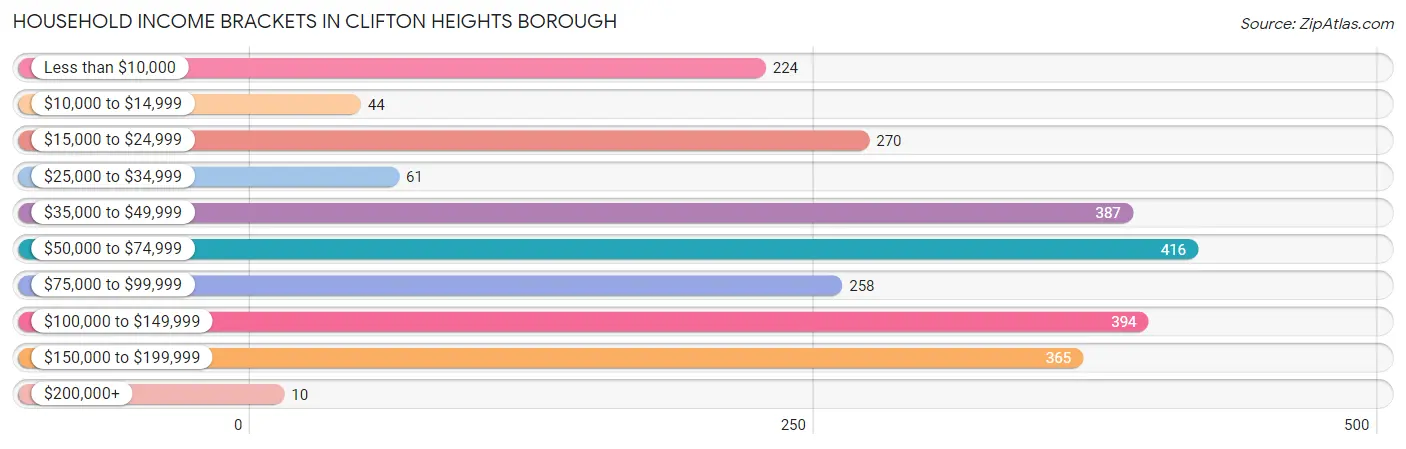
Household Income Brackets in Clifton Heights borough
With 416 households falling in the category, the $50,000 to $74,999 income range is the most frequent in Clifton Heights borough, accounting for 17.1% of all households. In contrast, only 10 households (0.4%) fall into the $200,000+ income bracket, making it the least populous group.
| Income Bracket | # Households | % Households |
| Less than $10,000 | 224 | 9.2% |
| $10,000 to $14,999 | 44 | 1.8% |
| $15,000 to $24,999 | 270 | 11.1% |
| $25,000 to $34,999 | 61 | 2.5% |
| $35,000 to $49,999 | 387 | 15.9% |
| $50,000 to $74,999 | 416 | 17.1% |
| $75,000 to $99,999 | 258 | 10.6% |
| $100,000 to $149,999 | 394 | 16.2% |
| $150,000 to $199,999 | 365 | 15.0% |
| $200,000+ | 10 | 0.4% |
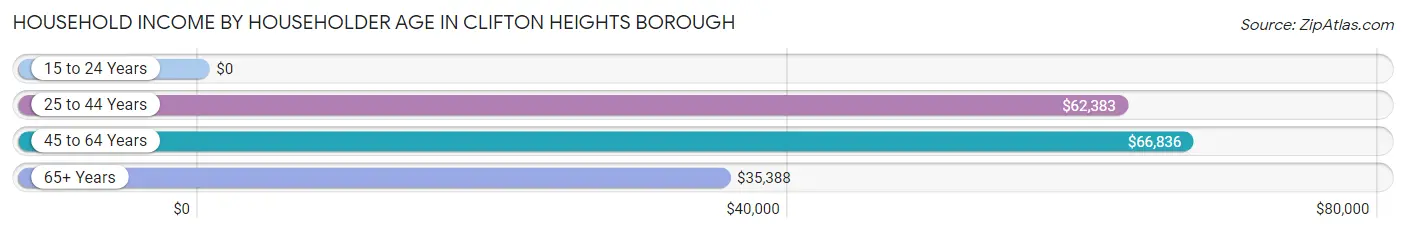
Household Income by Householder Age in Clifton Heights borough
The median household income in Clifton Heights borough is $61,155, with the highest median household income of $66,836 found in the 45 to 64 years age bracket for the primary householder. A total of 993 households (40.8%) fall into this category. Meanwhile, the 15 to 24 years age bracket for the primary householder has the lowest median household income of $0, with 21 households (0.9%) in this group.
| Income Bracket | # Households | Median Income |
| 15 to 24 Years | 21 (0.9%) | $0 |
| 25 to 44 Years | 882 (36.2%) | $62,383 |
| 45 to 64 Years | 993 (40.8%) | $66,836 |
| 65+ Years | 537 (22.1%) | $35,388 |
| Total | 2,433 (100.0%) | $61,155 |
Poverty in Clifton Heights borough
Income Below Poverty by Sex and Age in Clifton Heights borough
With 14.9% poverty level for males and 18.2% for females among the residents of Clifton Heights borough, 55 to 64 year old males and 16 and 17 year old females are the most vulnerable to poverty, with 135 males (30.7%) and 75 females (42.1%) in their respective age groups living below the poverty level.
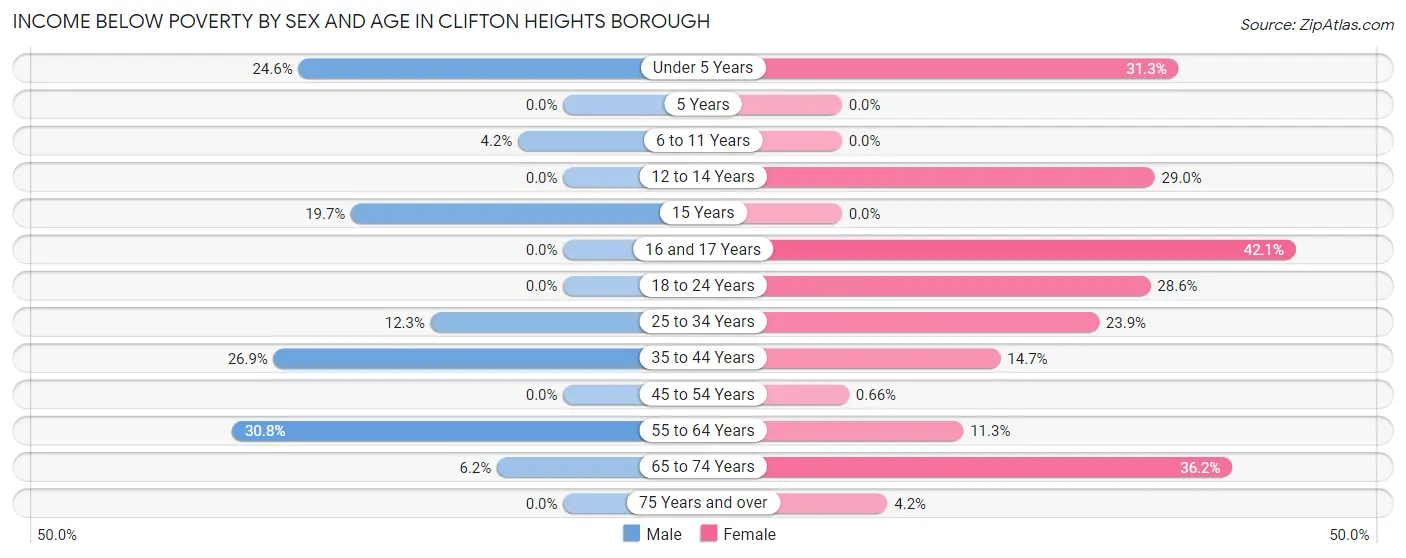
| Age Bracket | Male | Female |
| Under 5 Years | 73 (24.6%) | 70 (31.2%) |
| 5 Years | 0 (0.0%) | 0 (0.0%) |
| 6 to 11 Years | 8 (4.2%) | 0 (0.0%) |
| 12 to 14 Years | 0 (0.0%) | 81 (29.0%) |
| 15 Years | 25 (19.7%) | 0 (0.0%) |
| 16 and 17 Years | 0 (0.0%) | 75 (42.1%) |
| 18 to 24 Years | 0 (0.0%) | 112 (28.6%) |
| 25 to 34 Years | 68 (12.3%) | 126 (23.9%) |
| 35 to 44 Years | 129 (26.9%) | 63 (14.7%) |
| 45 to 54 Years | 0 (0.0%) | 3 (0.7%) |
| 55 to 64 Years | 135 (30.7%) | 72 (11.3%) |
| 65 to 74 Years | 19 (6.1%) | 79 (36.2%) |
| 75 Years and over | 0 (0.0%) | 6 (4.2%) |
| Total | 457 (14.9%) | 687 (18.2%) |
Income Above Poverty by Sex and Age in Clifton Heights borough
According to the poverty statistics in Clifton Heights borough, males aged 12 to 14 years and females aged 5 years are the age groups that are most secure financially, with 100.0% of males and 100.0% of females in these age groups living above the poverty line.
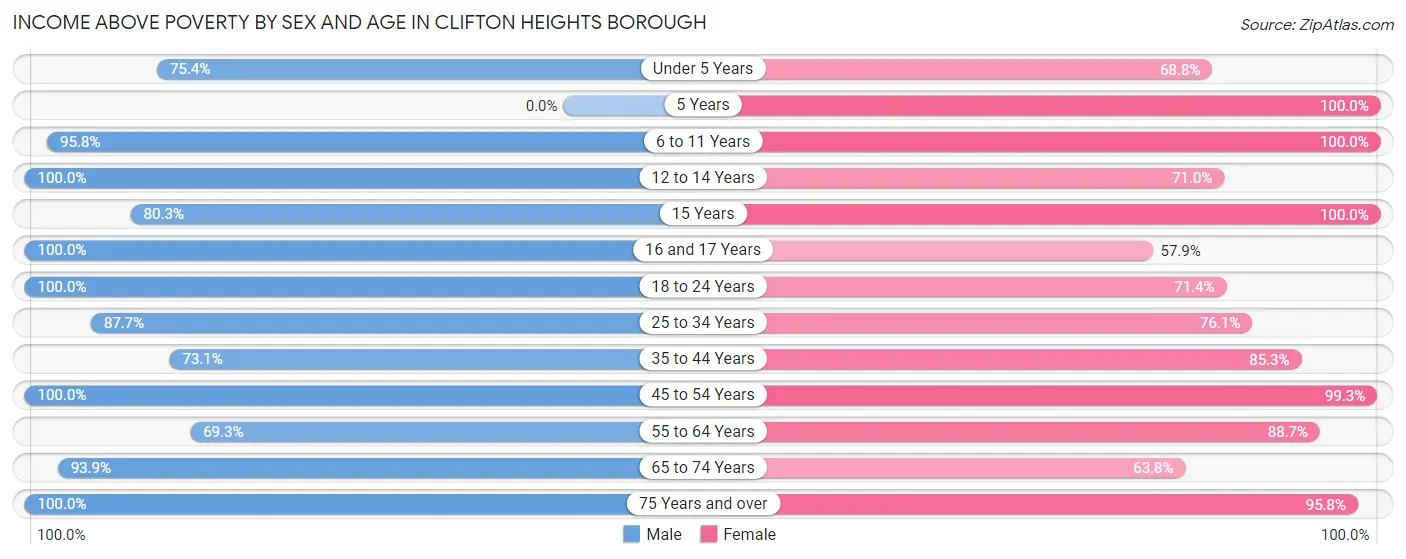
| Age Bracket | Male | Female |
| Under 5 Years | 224 (75.4%) | 154 (68.8%) |
| 5 Years | 0 (0.0%) | 17 (100.0%) |
| 6 to 11 Years | 183 (95.8%) | 215 (100.0%) |
| 12 to 14 Years | 63 (100.0%) | 198 (71.0%) |
| 15 Years | 102 (80.3%) | 48 (100.0%) |
| 16 and 17 Years | 44 (100.0%) | 103 (57.9%) |
| 18 to 24 Years | 398 (100.0%) | 279 (71.4%) |
| 25 to 34 Years | 485 (87.7%) | 402 (76.1%) |
| 35 to 44 Years | 351 (73.1%) | 365 (85.3%) |
| 45 to 54 Years | 158 (100.0%) | 455 (99.3%) |
| 55 to 64 Years | 304 (69.3%) | 567 (88.7%) |
| 65 to 74 Years | 290 (93.9%) | 139 (63.8%) |
| 75 Years and over | 10 (100.0%) | 136 (95.8%) |
| Total | 2,612 (85.1%) | 3,078 (81.8%) |
Income Below Poverty Among Married-Couple Families in Clifton Heights borough
The poverty statistics for married-couple families in Clifton Heights borough show that 15.0% or 159 of the total 1,058 families live below the poverty line. Families with 3 or 4 children have the highest poverty rate of 32.5%, comprising of 67 families. On the other hand, families with 1 or 2 children have the lowest poverty rate of 4.9%, which includes 20 families.
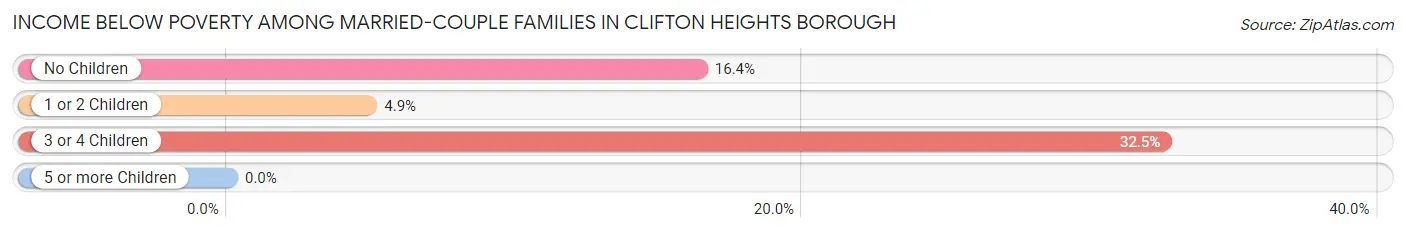
| Children | Above Poverty | Below Poverty |
| No Children | 368 (83.6%) | 72 (16.4%) |
| 1 or 2 Children | 392 (95.2%) | 20 (4.9%) |
| 3 or 4 Children | 139 (67.5%) | 67 (32.5%) |
| 5 or more Children | 0 (0.0%) | 0 (0.0%) |
| Total | 899 (85.0%) | 159 (15.0%) |
Income Below Poverty Among Single-Parent Households in Clifton Heights borough
According to the poverty data in Clifton Heights borough, 10.1% or 16 single-father households and 4.6% or 18 single-mother households are living below the poverty line. Among single-father households, those with 1 or 2 children have the highest poverty rate, with 16 households (29.6%) experiencing poverty. Likewise, among single-mother households, those with 1 or 2 children have the highest poverty rate, with 18 households (12.5%) falling below the poverty line.
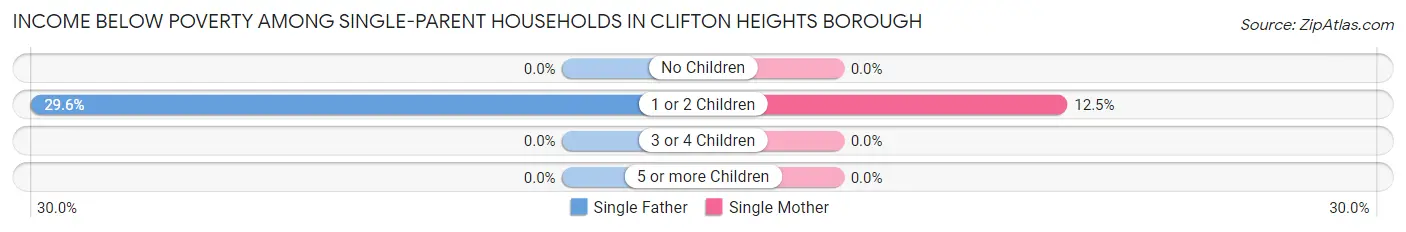
| Children | Single Father | Single Mother |
| No Children | 0 (0.0%) | 0 (0.0%) |
| 1 or 2 Children | 16 (29.6%) | 18 (12.5%) |
| 3 or 4 Children | 0 (0.0%) | 0 (0.0%) |
| 5 or more Children | 0 (0.0%) | 0 (0.0%) |
| Total | 16 (10.1%) | 18 (4.6%) |
Income Below Poverty Among Married-Couple vs Single-Parent Households in Clifton Heights borough
The poverty data for Clifton Heights borough shows that 159 of the married-couple family households (15.0%) and 34 of the single-parent households (6.1%) are living below the poverty level. Within the married-couple family households, those with 3 or 4 children have the highest poverty rate, with 67 households (32.5%) falling below the poverty line. Among the single-parent households, those with 1 or 2 children have the highest poverty rate, with 34 household (17.2%) living below poverty.
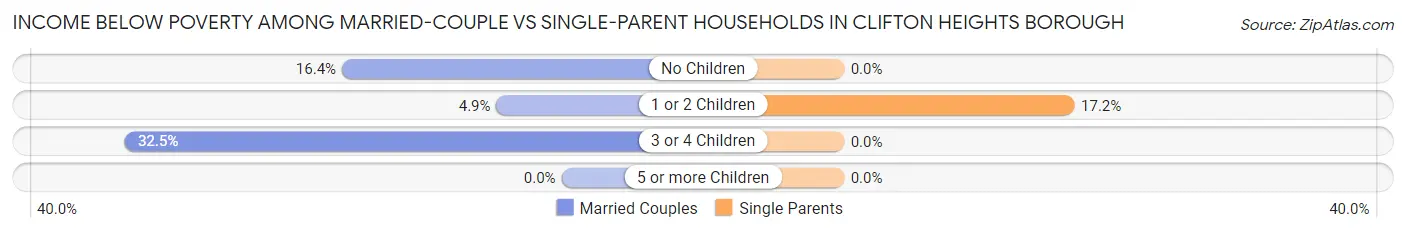
| Children | Married-Couple Families | Single-Parent Households |
| No Children | 72 (16.4%) | 0 (0.0%) |
| 1 or 2 Children | 20 (4.9%) | 34 (17.2%) |
| 3 or 4 Children | 67 (32.5%) | 0 (0.0%) |
| 5 or more Children | 0 (0.0%) | 0 (0.0%) |
| Total | 159 (15.0%) | 34 (6.1%) |
Race in Clifton Heights borough
The most populous races in Clifton Heights borough are White / Caucasian (3,640 | 53.3%), Black / African American (2,662 | 39.0%), and Asian (312 | 4.6%).
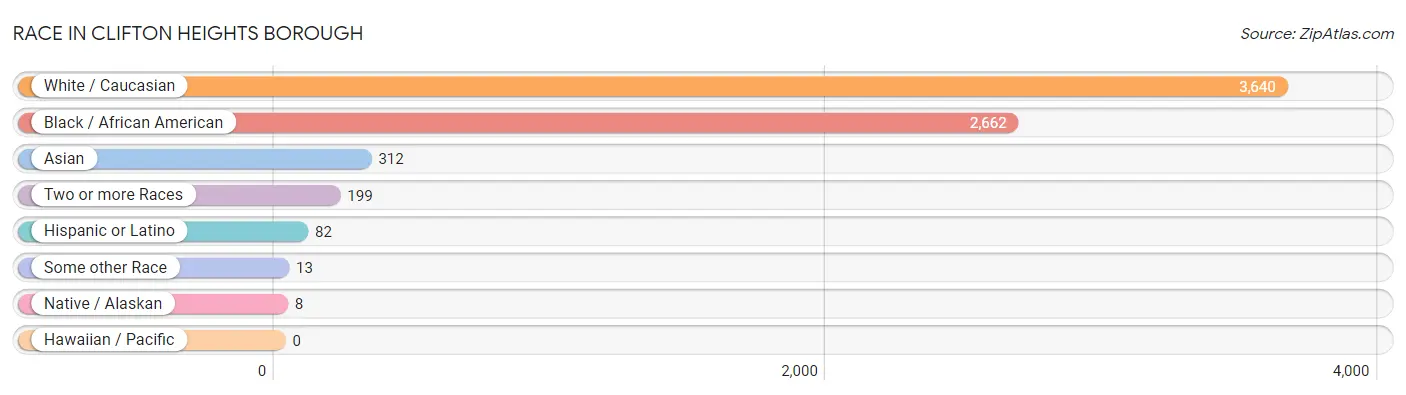
| Race | # Population | % Population |
| Asian | 312 | 4.6% |
| Black / African American | 2,662 | 39.0% |
| Hawaiian / Pacific | 0 | 0.0% |
| Hispanic or Latino | 82 | 1.2% |
| Native / Alaskan | 8 | 0.1% |
| White / Caucasian | 3,640 | 53.3% |
| Two or more Races | 199 | 2.9% |
| Some other Race | 13 | 0.2% |
| Total | 6,834 | 100.0% |
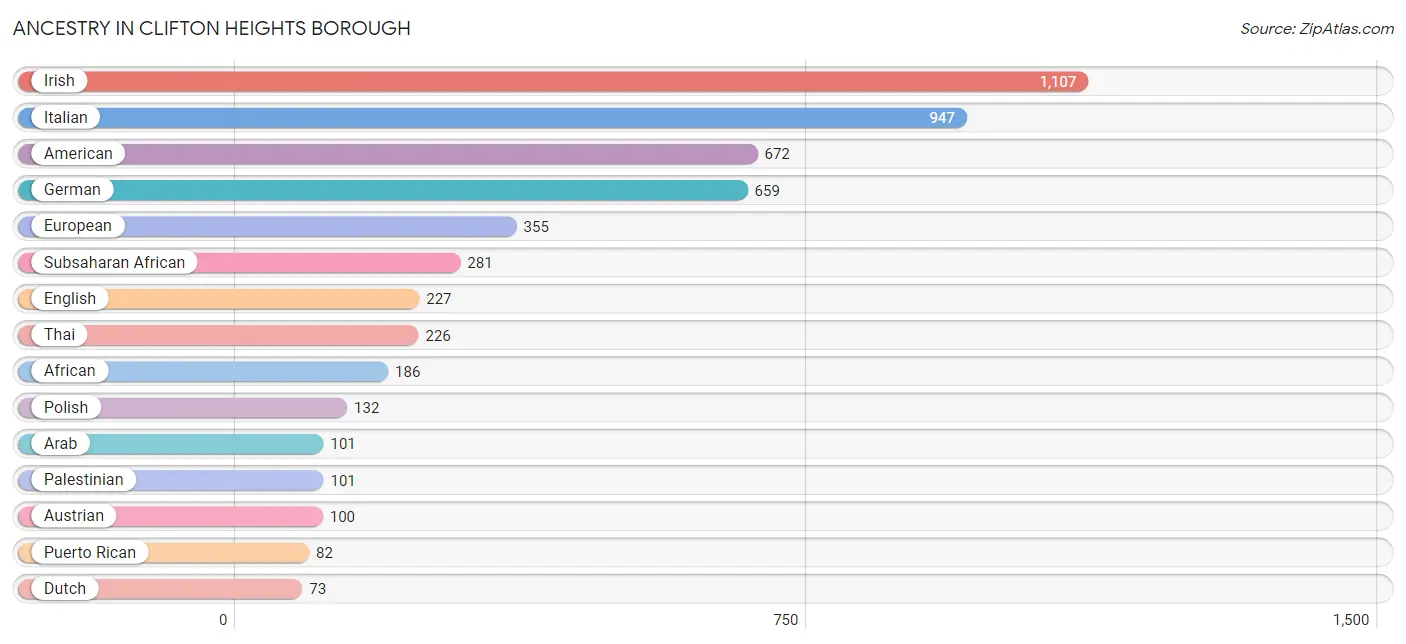
Ancestry in Clifton Heights borough
The most populous ancestries reported in Clifton Heights borough are Irish (1,107 | 16.2%), Italian (947 | 13.9%), American (672 | 9.8%), German (659 | 9.6%), and European (355 | 5.2%), together accounting for 54.7% of all Clifton Heights borough residents.
| Ancestry | # Population | % Population |
| Afghan | 21 | 0.3% |
| African | 186 | 2.7% |
| American | 672 | 9.8% |
| Arab | 101 | 1.5% |
| Austrian | 100 | 1.5% |
| British West Indian | 16 | 0.2% |
| Canadian | 9 | 0.1% |
| Cherokee | 16 | 0.2% |
| Czech | 10 | 0.2% |
| Danish | 28 | 0.4% |
| Dutch | 73 | 1.1% |
| Eastern European | 16 | 0.2% |
| English | 227 | 3.3% |
| European | 355 | 5.2% |
| French | 67 | 1.0% |
| German | 659 | 9.6% |
| Haitian | 25 | 0.4% |
| Hungarian | 38 | 0.6% |
| Indian (Asian) | 65 | 0.9% |
| Irish | 1,107 | 16.2% |
| Italian | 947 | 13.9% |
| Jamaican | 52 | 0.8% |
| Lebanese | 6 | 0.1% |
| Lithuanian | 12 | 0.2% |
| Nigerian | 41 | 0.6% |
| Northern European | 29 | 0.4% |
| Palestinian | 101 | 1.5% |
| Polish | 132 | 1.9% |
| Puerto Rican | 82 | 1.2% |
| Sierra Leonean | 54 | 0.8% |
| Slovak | 43 | 0.6% |
| Subsaharan African | 281 | 4.1% |
| Thai | 226 | 3.3% |
| Welsh | 54 | 0.8% | View All 34 Rows |
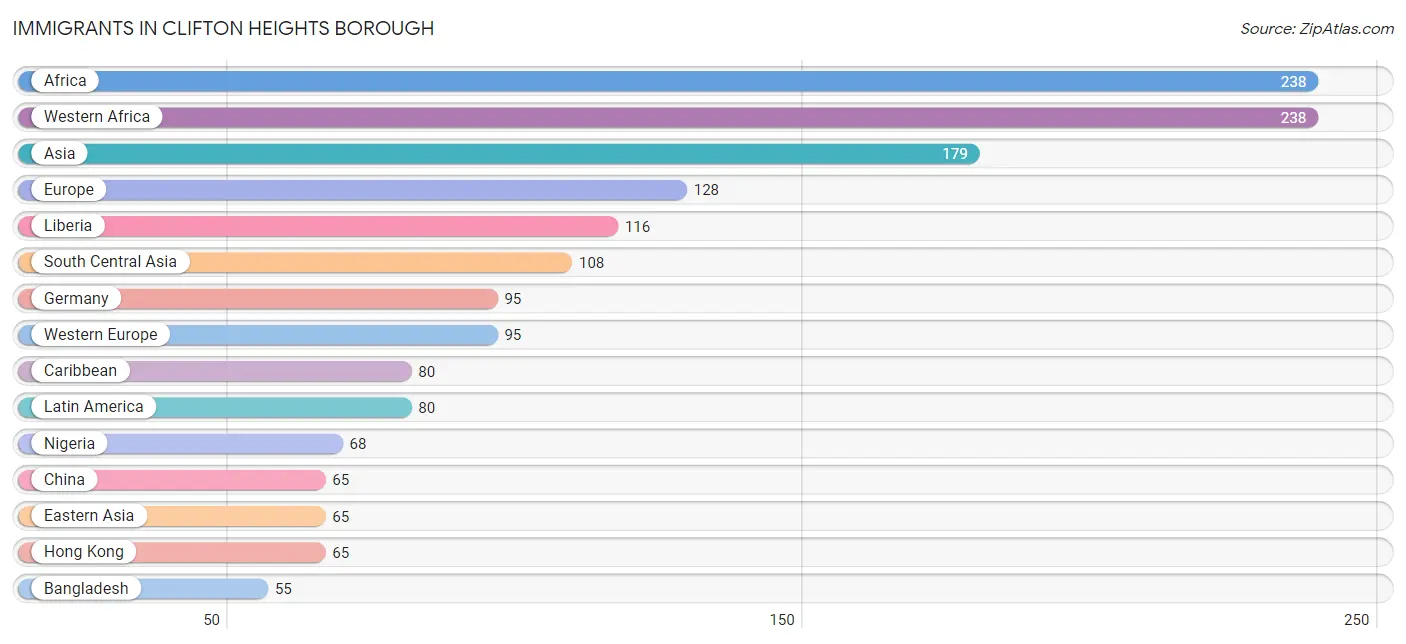
Immigrants in Clifton Heights borough
The most numerous immigrant groups reported in Clifton Heights borough came from Africa (238 | 3.5%), Western Africa (238 | 3.5%), Asia (179 | 2.6%), Europe (128 | 1.9%), and Liberia (116 | 1.7%), together accounting for 13.2% of all Clifton Heights borough residents.
| Immigration Origin | # Population | % Population |
| Afghanistan | 21 | 0.3% |
| Africa | 238 | 3.5% |
| Asia | 179 | 2.6% |
| Bangladesh | 55 | 0.8% |
| Caribbean | 80 | 1.2% |
| China | 65 | 0.9% |
| Eastern Asia | 65 | 0.9% |
| Eastern Europe | 14 | 0.2% |
| Europe | 128 | 1.9% |
| Germany | 95 | 1.4% |
| Hong Kong | 65 | 0.9% |
| India | 32 | 0.5% |
| Italy | 19 | 0.3% |
| Latin America | 80 | 1.2% |
| Liberia | 116 | 1.7% |
| Nigeria | 68 | 1.0% |
| Sierra Leone | 54 | 0.8% |
| South Central Asia | 108 | 1.6% |
| Southern Europe | 19 | 0.3% |
| St. Vincent and the Grenadines | 38 | 0.6% |
| West Indies | 42 | 0.6% |
| Western Africa | 238 | 3.5% |
| Western Europe | 95 | 1.4% | View All 23 Rows |
Sex and Age in Clifton Heights borough
Sex and Age in Clifton Heights borough
The most populous age groups in Clifton Heights borough are 30 to 34 Years (420 | 13.7%) for men and 55 to 59 Years (448 | 11.9%) for women.
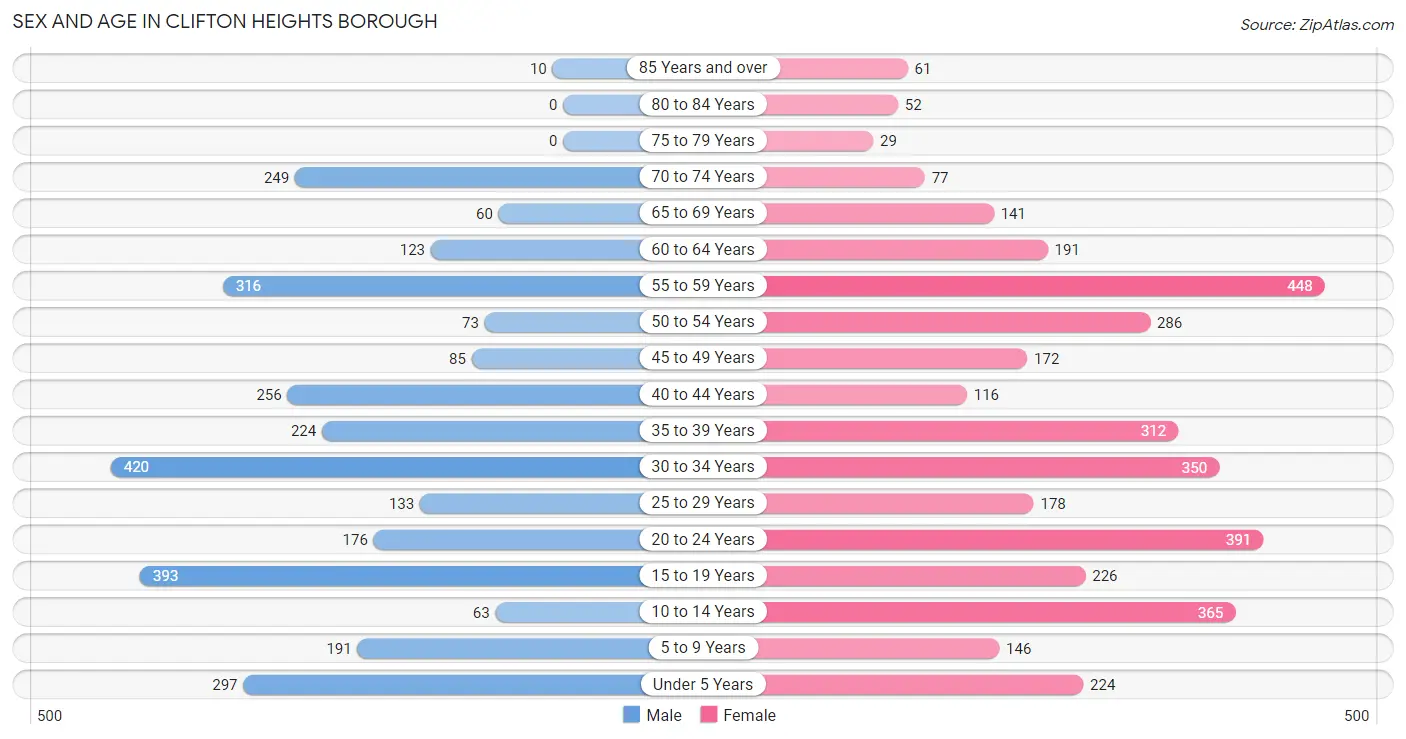
| Age Bracket | Male | Female |
| Under 5 Years | 297 (9.7%) | 224 (5.9%) |
| 5 to 9 Years | 191 (6.2%) | 146 (3.9%) |
| 10 to 14 Years | 63 (2.1%) | 365 (9.7%) |
| 15 to 19 Years | 393 (12.8%) | 226 (6.0%) |
| 20 to 24 Years | 176 (5.7%) | 391 (10.4%) |
| 25 to 29 Years | 133 (4.3%) | 178 (4.7%) |
| 30 to 34 Years | 420 (13.7%) | 350 (9.3%) |
| 35 to 39 Years | 224 (7.3%) | 312 (8.3%) |
| 40 to 44 Years | 256 (8.3%) | 116 (3.1%) |
| 45 to 49 Years | 85 (2.8%) | 172 (4.6%) |
| 50 to 54 Years | 73 (2.4%) | 286 (7.6%) |
| 55 to 59 Years | 316 (10.3%) | 448 (11.9%) |
| 60 to 64 Years | 123 (4.0%) | 191 (5.1%) |
| 65 to 69 Years | 60 (2.0%) | 141 (3.7%) |
| 70 to 74 Years | 249 (8.1%) | 77 (2.1%) |
| 75 to 79 Years | 0 (0.0%) | 29 (0.8%) |
| 80 to 84 Years | 0 (0.0%) | 52 (1.4%) |
| 85 Years and over | 10 (0.3%) | 61 (1.6%) |
| Total | 3,069 (100.0%) | 3,765 (100.0%) |
Families and Households in Clifton Heights borough
Median Family Size in Clifton Heights borough
The median family size in Clifton Heights borough is 3.61 persons per family, with married-couple families (1,058 | 65.7%) accounting for the largest median family size of 3.91 persons per family. On the other hand, single male/father families (159 | 9.9%) represent the smallest median family size with 2.62 persons per family.
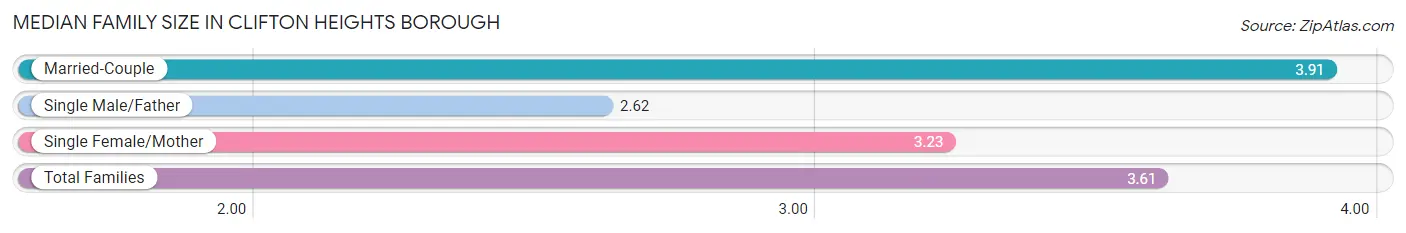
| Family Type | # Families | Family Size |
| Married-Couple | 1,058 (65.7%) | 3.91 |
| Single Male/Father | 159 (9.9%) | 2.62 |
| Single Female/Mother | 394 (24.5%) | 3.23 |
| Total Families | 1,611 (100.0%) | 3.61 |
Median Household Size in Clifton Heights borough
The median household size in Clifton Heights borough is 2.81 persons per household, with married-couple households (1,058 | 43.5%) accounting for the largest median household size of 3.91 persons per household. non-family households (822 | 33.8%) represent the smallest median household size with 1.06 persons per household.
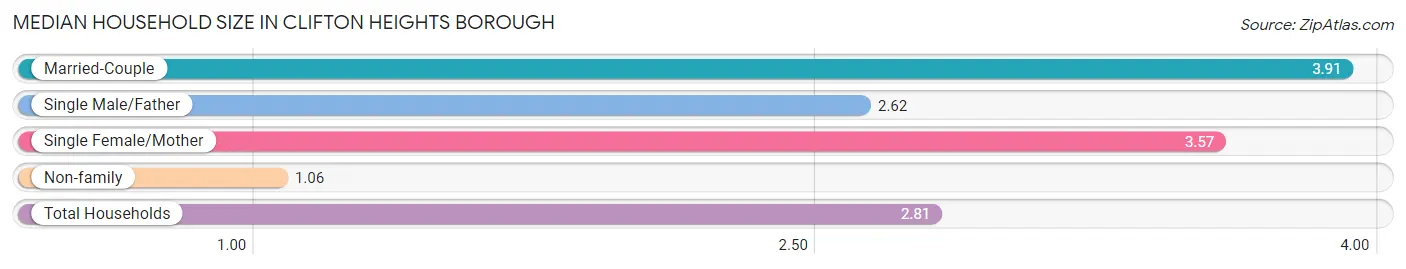
| Household Type | # Households | Household Size |
| Married-Couple | 1,058 (43.5%) | 3.91 |
| Single Male/Father | 159 (6.5%) | 2.62 |
| Single Female/Mother | 394 (16.2%) | 3.57 |
| Non-family | 822 (33.8%) | 1.06 |
| Total Households | 2,433 (100.0%) | 2.81 |
Household Size by Marriage Status in Clifton Heights borough
Out of a total of 2,433 households in Clifton Heights borough, 1,611 (66.2%) are family households, while 822 (33.8%) are nonfamily households. The most numerous type of family households are 2-person households, comprising 554, and the most common type of nonfamily households are 1-person households, comprising 773.
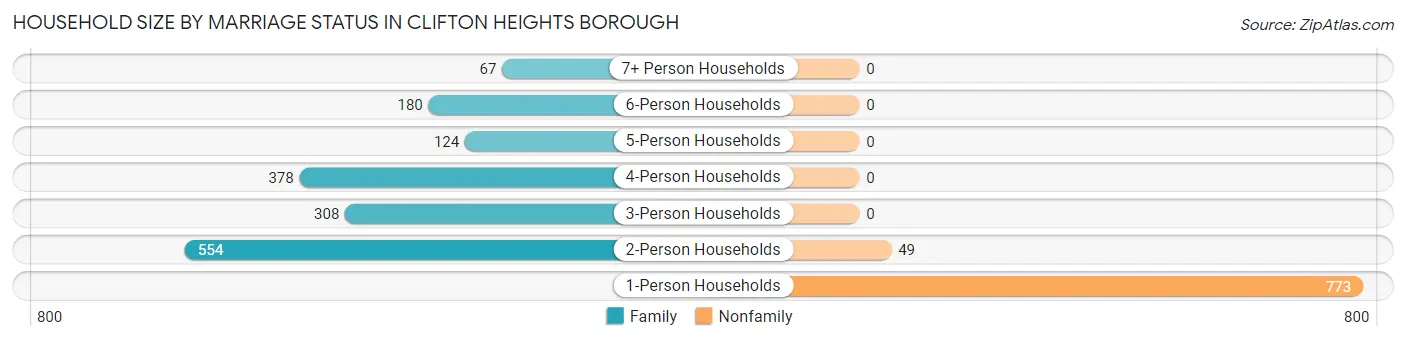
| Household Size | Family Households | Nonfamily Households |
| 1-Person Households | - | 773 (31.8%) |
| 2-Person Households | 554 (22.8%) | 49 (2.0%) |
| 3-Person Households | 308 (12.7%) | 0 (0.0%) |
| 4-Person Households | 378 (15.5%) | 0 (0.0%) |
| 5-Person Households | 124 (5.1%) | 0 (0.0%) |
| 6-Person Households | 180 (7.4%) | 0 (0.0%) |
| 7+ Person Households | 67 (2.8%) | 0 (0.0%) |
| Total | 1,611 (66.2%) | 822 (33.8%) |
Female Fertility in Clifton Heights borough
Fertility by Age in Clifton Heights borough
Average fertility rate in Clifton Heights borough is 107.0 births per 1,000 women. Women in the age bracket of 20 to 34 years have the highest fertility rate with 202.0 births per 1,000 women. Women in the age bracket of 20 to 34 years acount for 100.0% of all women with births.
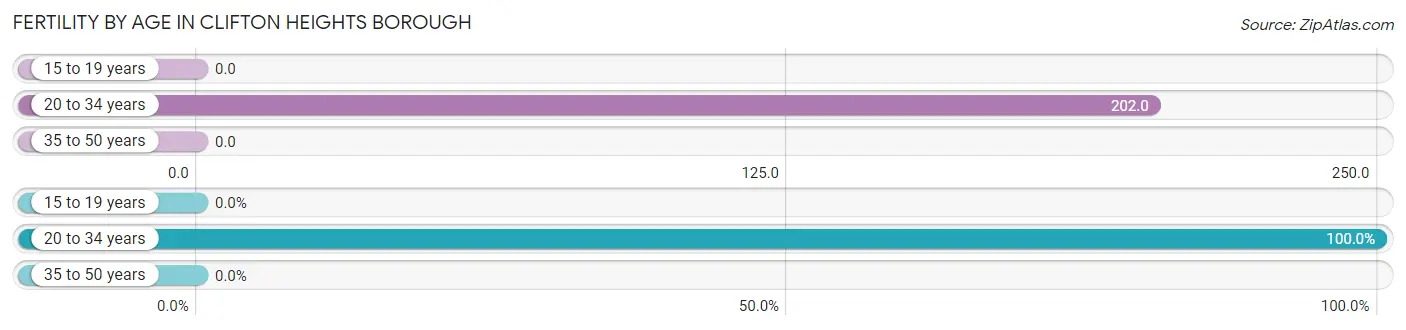
| Age Bracket | Women with Births | Births / 1,000 Women |
| 15 to 19 years | 0 (0.0%) | 0.0 |
| 20 to 34 years | 186 (100.0%) | 202.0 |
| 35 to 50 years | 0 (0.0%) | 0.0 |
| Total | 186 (100.0%) | 107.0 |
Fertility by Age by Marriage Status in Clifton Heights borough
48.9% of women with births (186) in Clifton Heights borough are married. The highest percentage of unmarried women with births falls into 20 to 34 years age bracket with 51.1% of them unmarried at the time of birth, while the lowest percentage of unmarried women with births belong to 20 to 34 years age bracket with 51.1% of them unmarried.
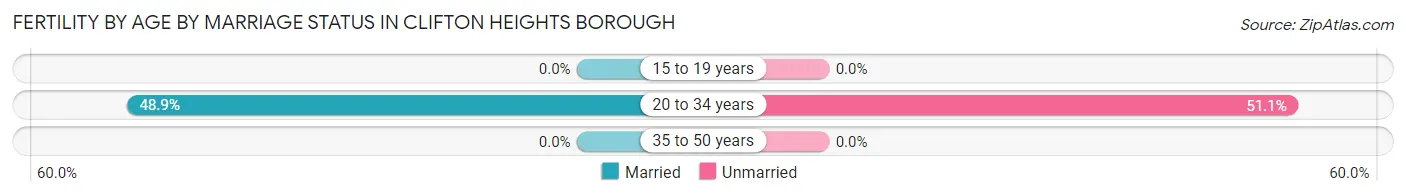
| Age Bracket | Married | Unmarried |
| 15 to 19 years | 0 (0.0%) | 0 (0.0%) |
| 20 to 34 years | 91 (48.9%) | 95 (51.1%) |
| 35 to 50 years | 0 (0.0%) | 0 (0.0%) |
| Total | 91 (48.9%) | 95 (51.1%) |
Fertility by Education in Clifton Heights borough
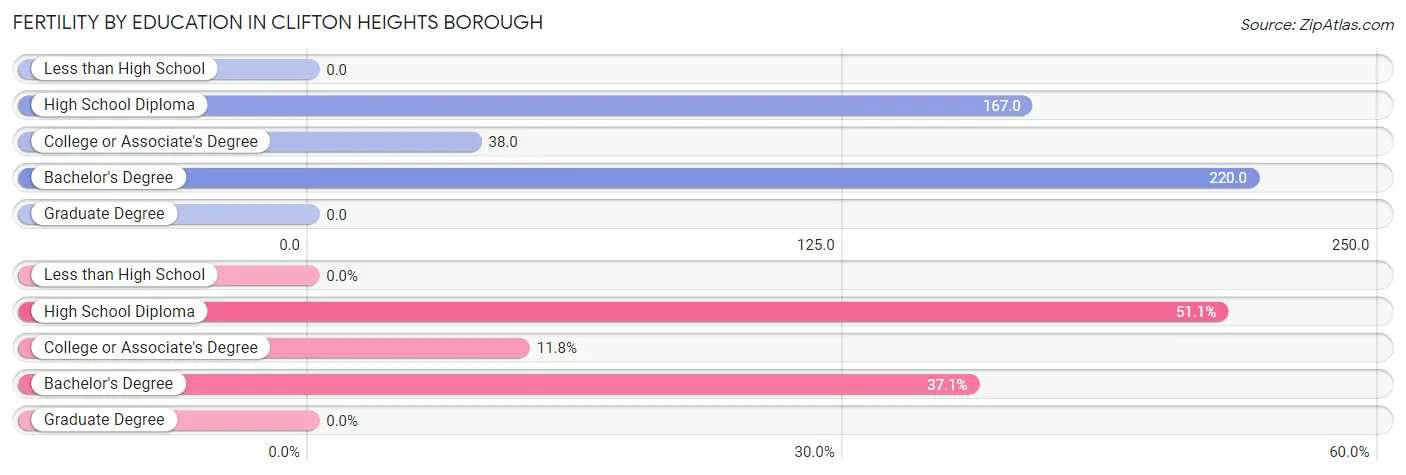
| Educational Attainment | Women with Births | Births / 1,000 Women |
| Less than High School | 0 (0.0%) | 0.0 |
| High School Diploma | 95 (51.1%) | 167.0 |
| College or Associate's Degree | 22 (11.8%) | 38.0 |
| Bachelor's Degree | 69 (37.1%) | 220.0 |
| Graduate Degree | 0 (0.0%) | 0.0 |
| Total | 186 (100.0%) | 107.0 |
Fertility by Education by Marriage Status in Clifton Heights borough
51.1% of women with births in Clifton Heights borough are unmarried. Women with the educational attainment of college or associate's degree are most likely to be married with 100.0% of them married at childbirth, while women with the educational attainment of high school diploma are least likely to be married with 100.0% of them unmarried at childbirth.
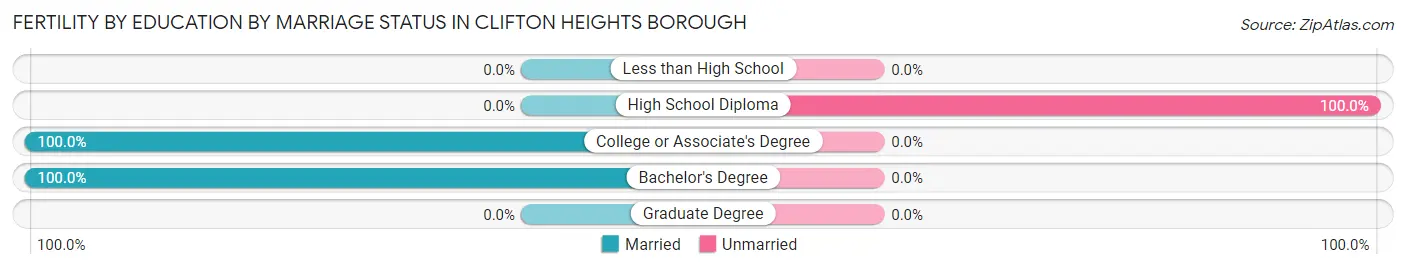
| Educational Attainment | Married | Unmarried |
| Less than High School | 0 (0.0%) | 0 (0.0%) |
| High School Diploma | 0 (0.0%) | 95 (100.0%) |
| College or Associate's Degree | 22 (100.0%) | 0 (0.0%) |
| Bachelor's Degree | 69 (100.0%) | 0 (0.0%) |
| Graduate Degree | 0 (0.0%) | 0 (0.0%) |
| Total | 91 (48.9%) | 95 (51.1%) |
Employment Characteristics in Clifton Heights borough
Employment by Class of Employer in Clifton Heights borough
Among the 2,780 employed individuals in Clifton Heights borough, private company employees (2,136 | 76.8%), not-for-profit organizations (205 | 7.4%), and federal government employees (199 | 7.2%) make up the most common classes of employment.
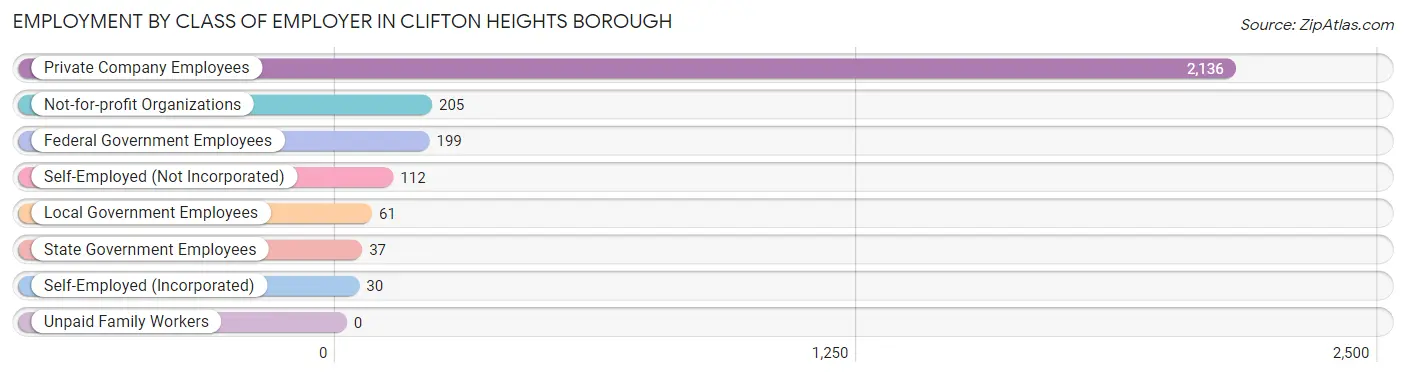
| Employer Class | # Employees | % Employees |
| Private Company Employees | 2,136 | 76.8% |
| Self-Employed (Incorporated) | 30 | 1.1% |
| Self-Employed (Not Incorporated) | 112 | 4.0% |
| Not-for-profit Organizations | 205 | 7.4% |
| Local Government Employees | 61 | 2.2% |
| State Government Employees | 37 | 1.3% |
| Federal Government Employees | 199 | 7.2% |
| Unpaid Family Workers | 0 | 0.0% |
| Total | 2,780 | 100.0% |
Employment Status by Age in Clifton Heights borough
According to the labor force statistics for Clifton Heights borough, out of the total population over 16 years of age (5,373), 63.1% or 3,390 individuals are in the labor force, with 18.3% or 620 of them unemployed. The age group with the highest labor force participation rate is 35 to 44 years, with 88.9% or 807 individuals in the labor force. Within the labor force, the 16 to 19 years age range has the highest percentage of unemployed individuals, with 53.6% or 113 of them being unemployed.
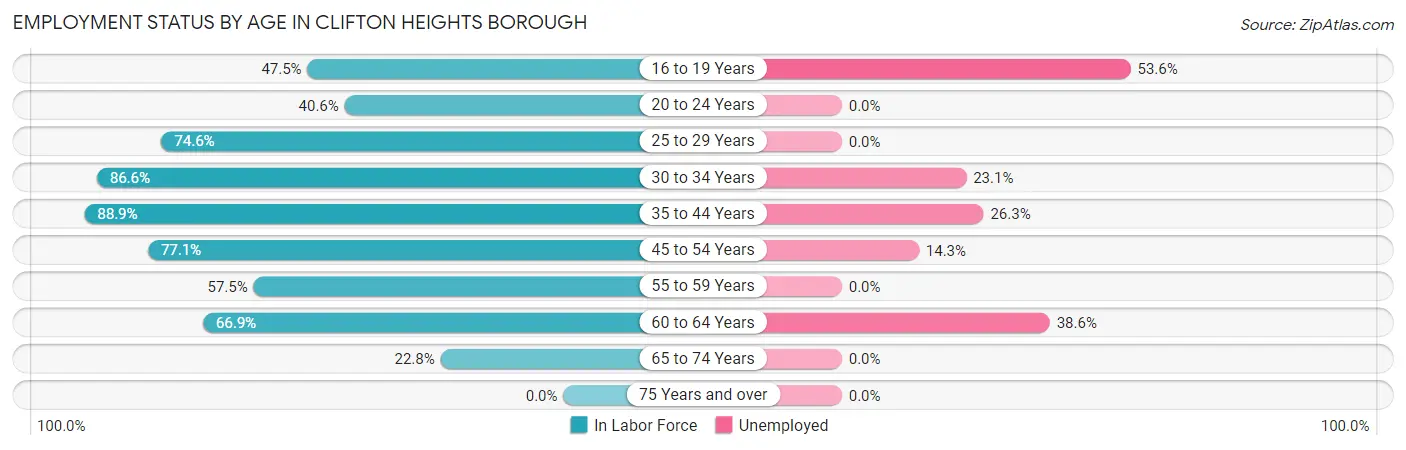
| Age Bracket | In Labor Force | Unemployed |
| 16 to 19 Years | 211 (47.5%) | 113 (53.6%) |
| 20 to 24 Years | 230 (40.6%) | 0 (0.0%) |
| 25 to 29 Years | 232 (74.6%) | 0 (0.0%) |
| 30 to 34 Years | 667 (86.6%) | 154 (23.1%) |
| 35 to 44 Years | 807 (88.9%) | 212 (26.3%) |
| 45 to 54 Years | 475 (77.1%) | 68 (14.3%) |
| 55 to 59 Years | 439 (57.5%) | 0 (0.0%) |
| 60 to 64 Years | 210 (66.9%) | 81 (38.6%) |
| 65 to 74 Years | 120 (22.8%) | 0 (0.0%) |
| 75 Years and over | 0 (0.0%) | 0 (0.0%) |
| Total | 3,390 (63.1%) | 620 (18.3%) |
Employment Status by Educational Attainment in Clifton Heights borough
According to labor force statistics for Clifton Heights borough, 76.8% of individuals (2,829) out of the total population between 25 and 64 years of age (3,683) are in the labor force, with 18.0% or 509 of them being unemployed. The group with the highest labor force participation rate are those with the educational attainment of college / associate degree, with 88.7% or 1,335 individuals in the labor force. Within the labor force, individuals with college / associate degree education have the highest percentage of unemployment, with 23.2% or 310 of them being unemployed.
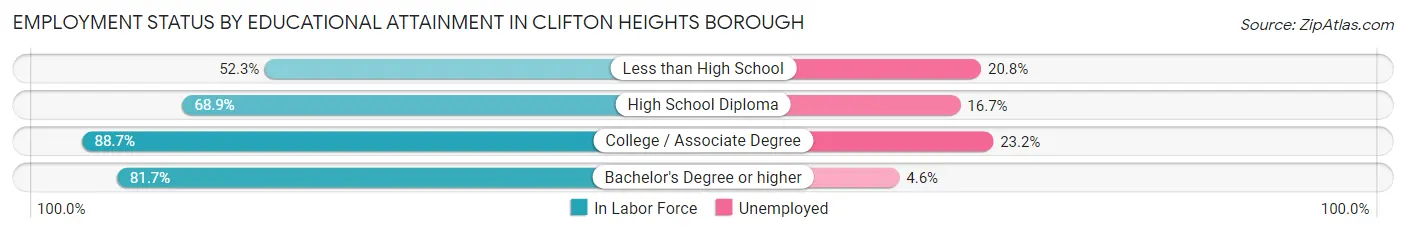
| Educational Attainment | In Labor Force | Unemployed |
| Less than High School | 231 (52.3%) | 92 (20.8%) |
| High School Diploma | 827 (68.9%) | 201 (16.7%) |
| College / Associate Degree | 1,335 (88.7%) | 349 (23.2%) |
| Bachelor's Degree or higher | 437 (81.7%) | 25 (4.6%) |
| Total | 2,829 (76.8%) | 663 (18.0%) |
Employment Occupations by Sex in Clifton Heights borough
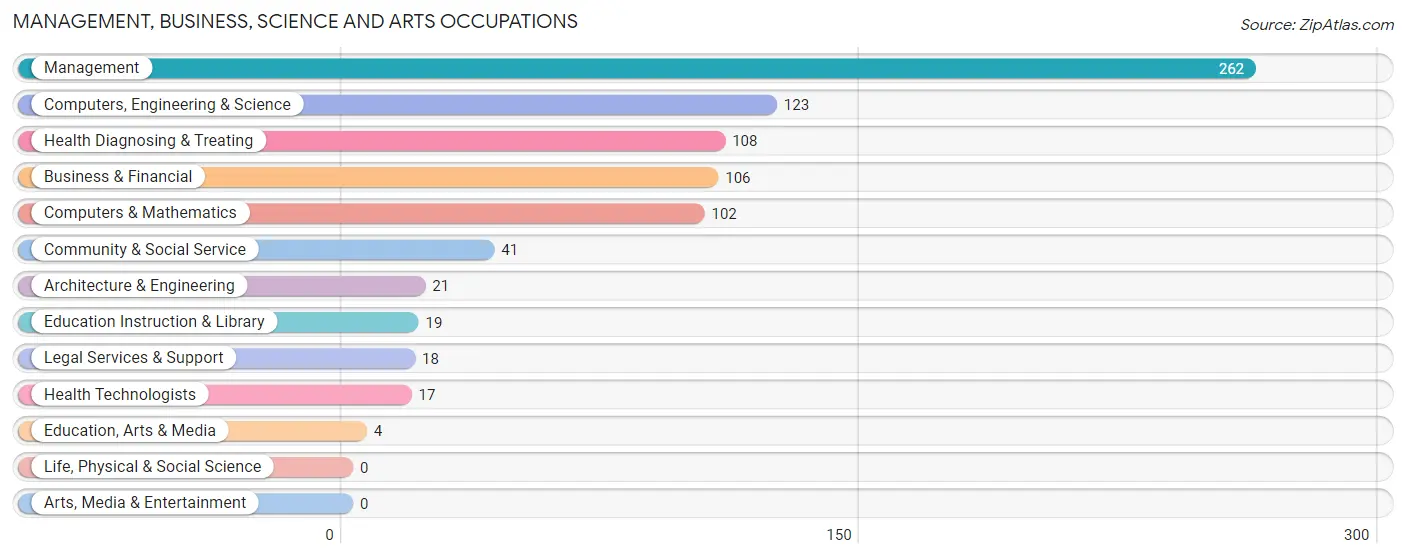
Management, Business, Science and Arts Occupations
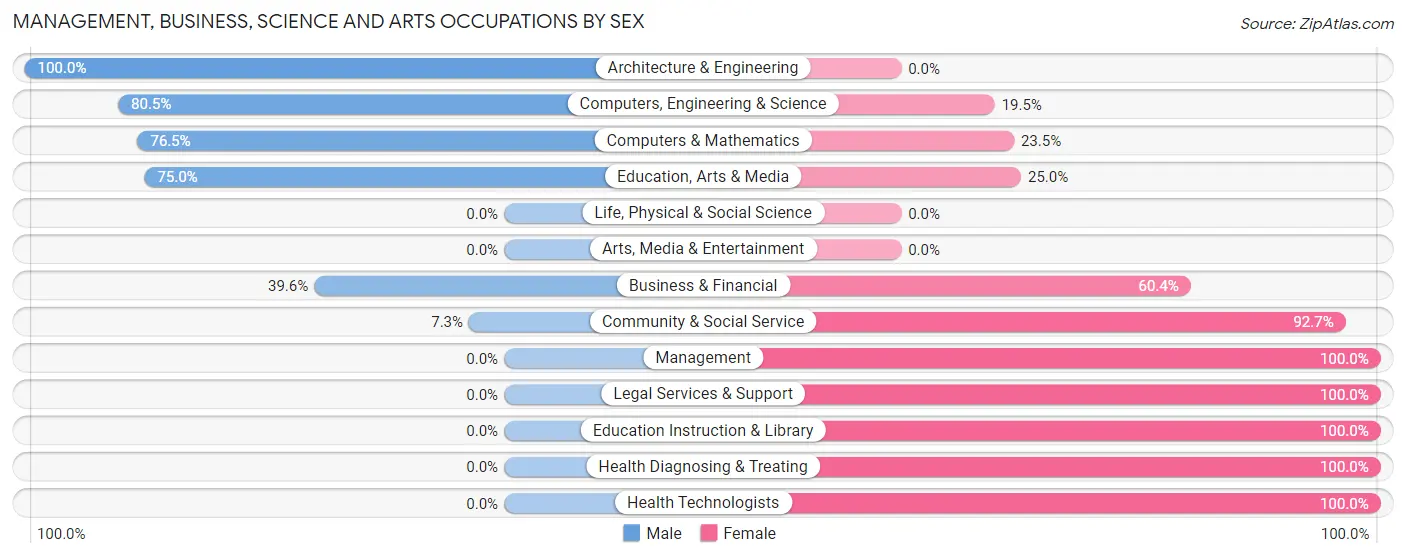
The most common Management, Business, Science and Arts occupations in Clifton Heights borough are Management (262 | 9.9%), Computers, Engineering & Science (123 | 4.6%), Health Diagnosing & Treating (108 | 4.1%), Business & Financial (106 | 4.0%), and Computers & Mathematics (102 | 3.8%).
Management, Business, Science and Arts Occupations by Sex
Within the Management, Business, Science and Arts occupations in Clifton Heights borough, the most male-oriented occupations are Architecture & Engineering (100.0%), Computers, Engineering & Science (80.5%), and Computers & Mathematics (76.5%), while the most female-oriented occupations are Management (100.0%), Legal Services & Support (100.0%), and Education Instruction & Library (100.0%).
| Occupation | Male | Female |
| Management | 0 (0.0%) | 262 (100.0%) |
| Business & Financial | 42 (39.6%) | 64 (60.4%) |
| Computers, Engineering & Science | 99 (80.5%) | 24 (19.5%) |
| Computers & Mathematics | 78 (76.5%) | 24 (23.5%) |
| Architecture & Engineering | 21 (100.0%) | 0 (0.0%) |
| Life, Physical & Social Science | 0 (0.0%) | 0 (0.0%) |
| Community & Social Service | 3 (7.3%) | 38 (92.7%) |
| Education, Arts & Media | 3 (75.0%) | 1 (25.0%) |
| Legal Services & Support | 0 (0.0%) | 18 (100.0%) |
| Education Instruction & Library | 0 (0.0%) | 19 (100.0%) |
| Arts, Media & Entertainment | 0 (0.0%) | 0 (0.0%) |
| Health Diagnosing & Treating | 0 (0.0%) | 108 (100.0%) |
| Health Technologists | 0 (0.0%) | 17 (100.0%) |
| Total (Category) | 144 (22.5%) | 496 (77.5%) |
| Total (Overall) | 1,293 (48.7%) | 1,362 (51.3%) |
Services Occupations
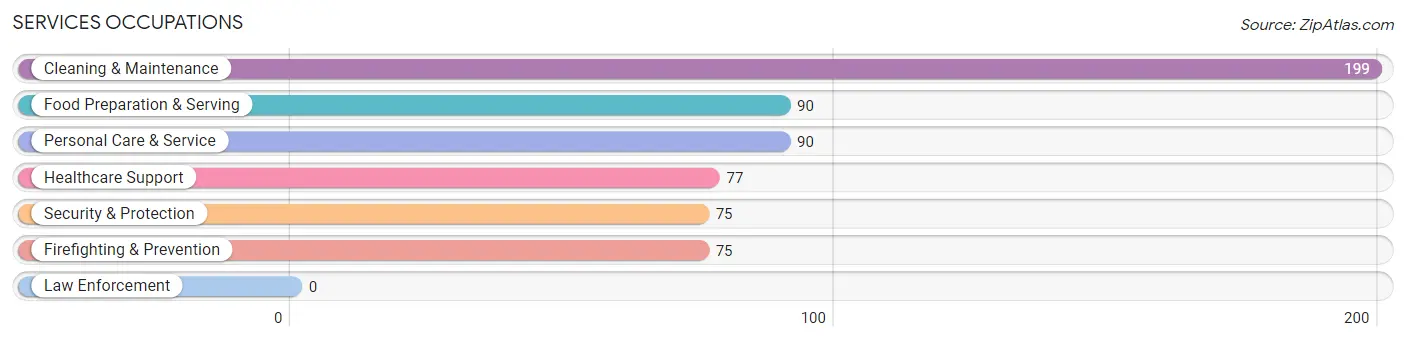
The most common Services occupations in Clifton Heights borough are Cleaning & Maintenance (199 | 7.5%), Food Preparation & Serving (90 | 3.4%), Personal Care & Service (90 | 3.4%), Healthcare Support (77 | 2.9%), and Security & Protection (75 | 2.8%).
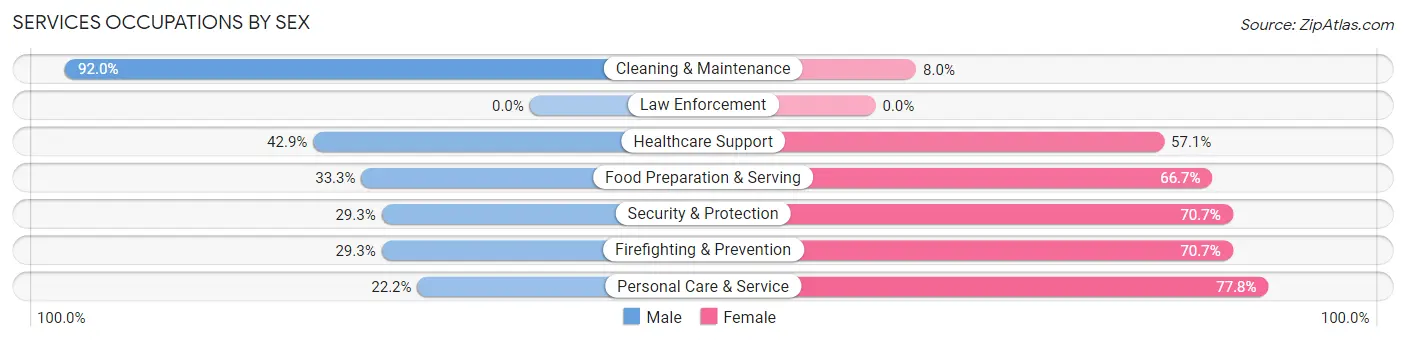
Services Occupations by Sex
Within the Services occupations in Clifton Heights borough, the most male-oriented occupations are Cleaning & Maintenance (92.0%), Healthcare Support (42.9%), and Food Preparation & Serving (33.3%), while the most female-oriented occupations are Personal Care & Service (77.8%), Security & Protection (70.7%), and Firefighting & Prevention (70.7%).
| Occupation | Male | Female |
| Healthcare Support | 33 (42.9%) | 44 (57.1%) |
| Security & Protection | 22 (29.3%) | 53 (70.7%) |
| Firefighting & Prevention | 22 (29.3%) | 53 (70.7%) |
| Law Enforcement | 0 (0.0%) | 0 (0.0%) |
| Food Preparation & Serving | 30 (33.3%) | 60 (66.7%) |
| Cleaning & Maintenance | 183 (92.0%) | 16 (8.0%) |
| Personal Care & Service | 20 (22.2%) | 70 (77.8%) |
| Total (Category) | 288 (54.2%) | 243 (45.8%) |
| Total (Overall) | 1,293 (48.7%) | 1,362 (51.3%) |
Sales and Office Occupations
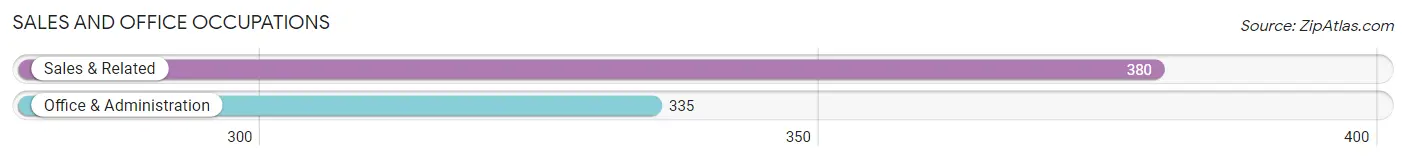
The most common Sales and Office occupations in Clifton Heights borough are Sales & Related (380 | 14.3%), and Office & Administration (335 | 12.6%).
Sales and Office Occupations by Sex
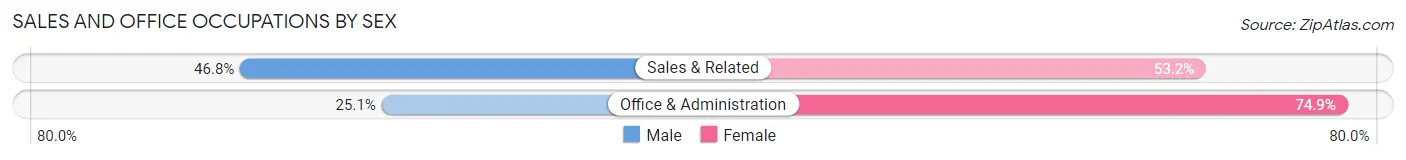
| Occupation | Male | Female |
| Sales & Related | 178 (46.8%) | 202 (53.2%) |
| Office & Administration | 84 (25.1%) | 251 (74.9%) |
| Total (Category) | 262 (36.6%) | 453 (63.4%) |
| Total (Overall) | 1,293 (48.7%) | 1,362 (51.3%) |
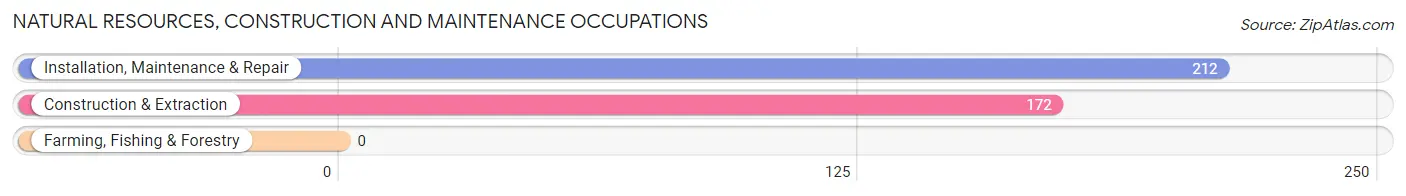
Natural Resources, Construction and Maintenance Occupations
The most common Natural Resources, Construction and Maintenance occupations in Clifton Heights borough are Installation, Maintenance & Repair (212 | 8.0%), and Construction & Extraction (172 | 6.5%).
Natural Resources, Construction and Maintenance Occupations by Sex
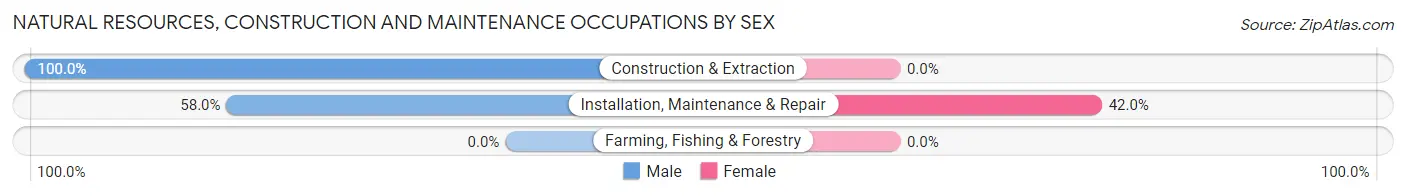
| Occupation | Male | Female |
| Farming, Fishing & Forestry | 0 (0.0%) | 0 (0.0%) |
| Construction & Extraction | 172 (100.0%) | 0 (0.0%) |
| Installation, Maintenance & Repair | 123 (58.0%) | 89 (42.0%) |
| Total (Category) | 295 (76.8%) | 89 (23.2%) |
| Total (Overall) | 1,293 (48.7%) | 1,362 (51.3%) |
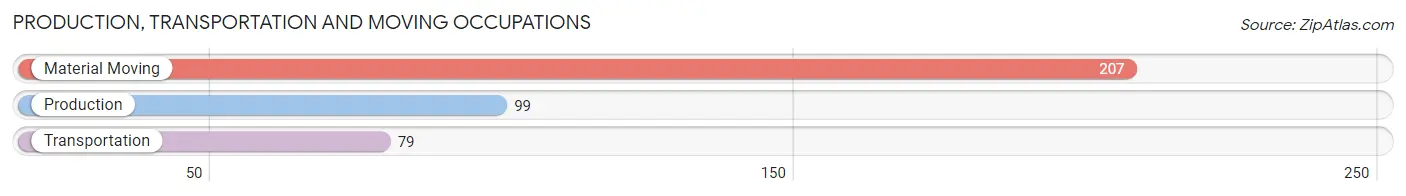
Production, Transportation and Moving Occupations
The most common Production, Transportation and Moving occupations in Clifton Heights borough are Material Moving (207 | 7.8%), Production (99 | 3.7%), and Transportation (79 | 3.0%).
Production, Transportation and Moving Occupations by Sex
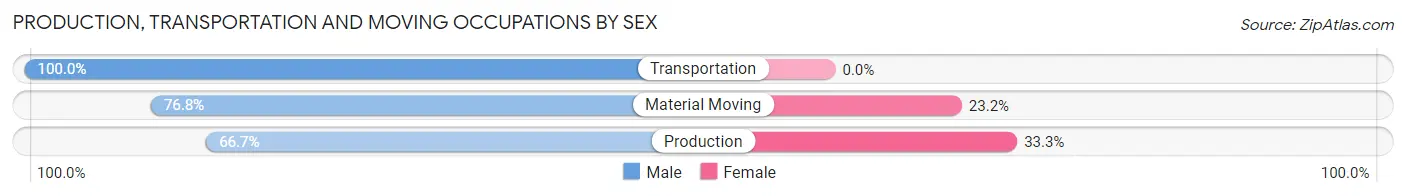
| Occupation | Male | Female |
| Production | 66 (66.7%) | 33 (33.3%) |
| Transportation | 79 (100.0%) | 0 (0.0%) |
| Material Moving | 159 (76.8%) | 48 (23.2%) |
| Total (Category) | 304 (79.0%) | 81 (21.0%) |
| Total (Overall) | 1,293 (48.7%) | 1,362 (51.3%) |
Employment Industries by Sex in Clifton Heights borough
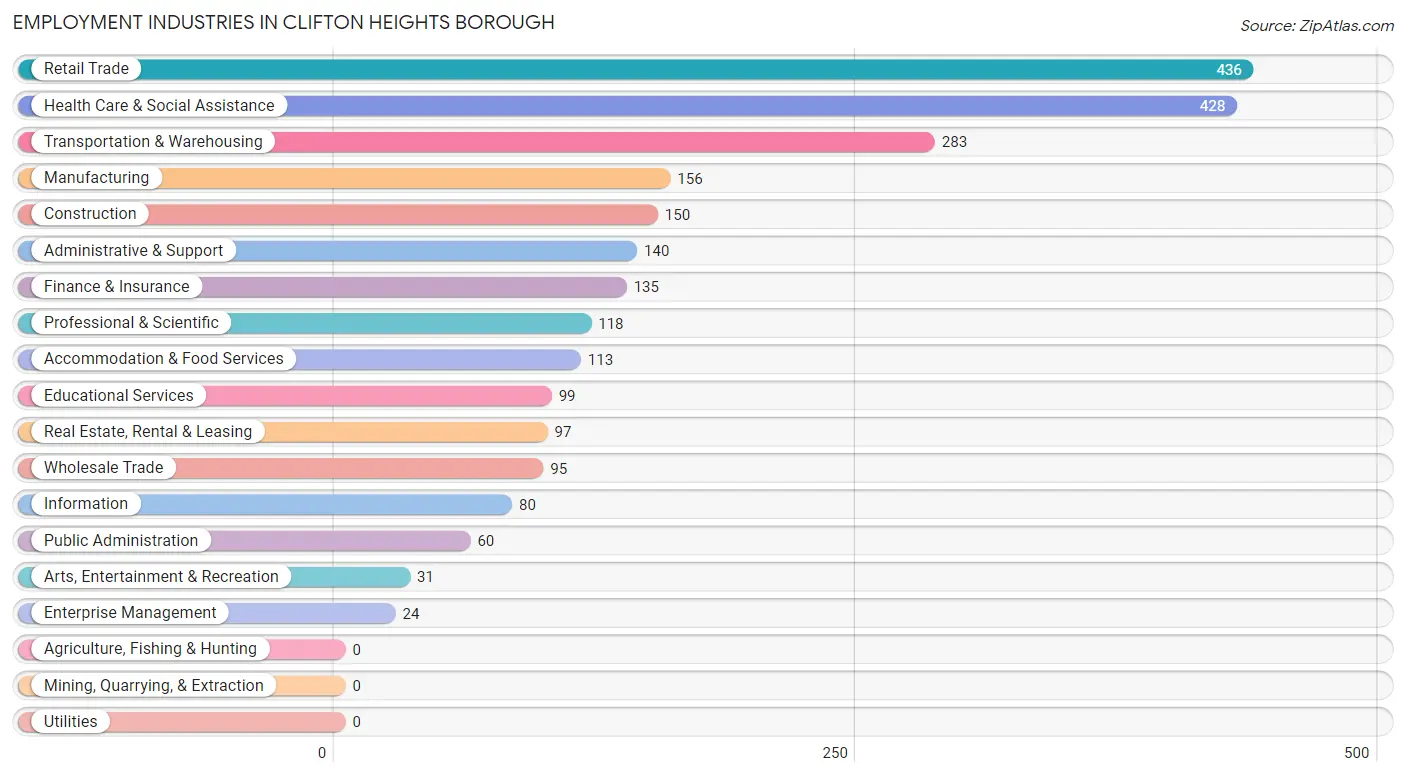
Employment Industries in Clifton Heights borough
The major employment industries in Clifton Heights borough include Retail Trade (436 | 16.4%), Health Care & Social Assistance (428 | 16.1%), Transportation & Warehousing (283 | 10.7%), Manufacturing (156 | 5.9%), and Construction (150 | 5.7%).
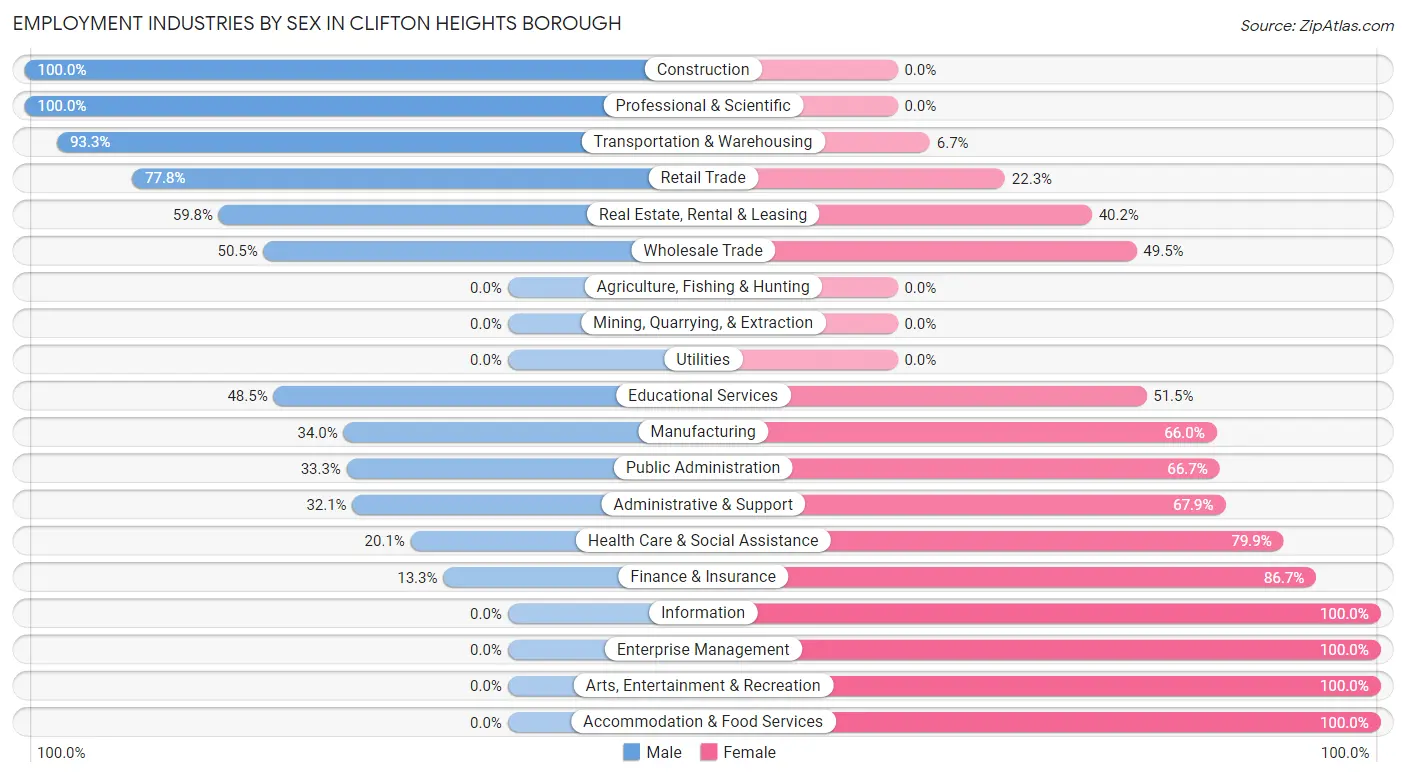
Employment Industries by Sex in Clifton Heights borough
The Clifton Heights borough industries that see more men than women are Construction (100.0%), Professional & Scientific (100.0%), and Transportation & Warehousing (93.3%), whereas the industries that tend to have a higher number of women are Information (100.0%), Enterprise Management (100.0%), and Arts, Entertainment & Recreation (100.0%).
| Industry | Male | Female |
| Agriculture, Fishing & Hunting | 0 (0.0%) | 0 (0.0%) |
| Mining, Quarrying, & Extraction | 0 (0.0%) | 0 (0.0%) |
| Construction | 150 (100.0%) | 0 (0.0%) |
| Manufacturing | 53 (34.0%) | 103 (66.0%) |
| Wholesale Trade | 48 (50.5%) | 47 (49.5%) |
| Retail Trade | 339 (77.7%) | 97 (22.3%) |
| Transportation & Warehousing | 264 (93.3%) | 19 (6.7%) |
| Utilities | 0 (0.0%) | 0 (0.0%) |
| Information | 0 (0.0%) | 80 (100.0%) |
| Finance & Insurance | 18 (13.3%) | 117 (86.7%) |
| Real Estate, Rental & Leasing | 58 (59.8%) | 39 (40.2%) |
| Professional & Scientific | 118 (100.0%) | 0 (0.0%) |
| Enterprise Management | 0 (0.0%) | 24 (100.0%) |
| Administrative & Support | 45 (32.1%) | 95 (67.9%) |
| Educational Services | 48 (48.5%) | 51 (51.5%) |
| Health Care & Social Assistance | 86 (20.1%) | 342 (79.9%) |
| Arts, Entertainment & Recreation | 0 (0.0%) | 31 (100.0%) |
| Accommodation & Food Services | 0 (0.0%) | 113 (100.0%) |
| Public Administration | 20 (33.3%) | 40 (66.7%) |
| Total | 1,293 (48.7%) | 1,362 (51.3%) |
Education in Clifton Heights borough
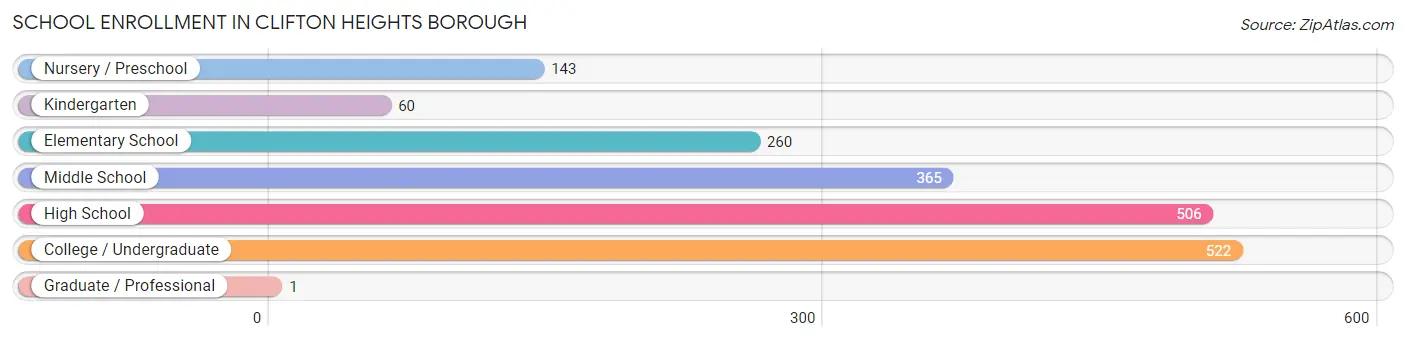
School Enrollment in Clifton Heights borough
The most common levels of schooling among the 1,857 students in Clifton Heights borough are college / undergraduate (522 | 28.1%), high school (506 | 27.3%), and middle school (365 | 19.7%).
| School Level | # Students | % Students |
| Nursery / Preschool | 143 | 7.7% |
| Kindergarten | 60 | 3.2% |
| Elementary School | 260 | 14.0% |
| Middle School | 365 | 19.7% |
| High School | 506 | 27.3% |
| College / Undergraduate | 522 | 28.1% |
| Graduate / Professional | 1 | 0.1% |
| Total | 1,857 | 100.0% |
School Enrollment by Age by Funding Source in Clifton Heights borough
Out of a total of 1,857 students who are enrolled in schools in Clifton Heights borough, 594 (32.0%) attend a private institution, while the remaining 1,263 (68.0%) are enrolled in public schools. The age group of 3 to 4 year olds has the highest likelihood of being enrolled in private schools, with 90 (71.4% in the age bracket) enrolled. Conversely, the age group of 18 to 19 year olds has the lowest likelihood of being enrolled in a private school, with 30 (100.0% in the age bracket) attending a public institution.
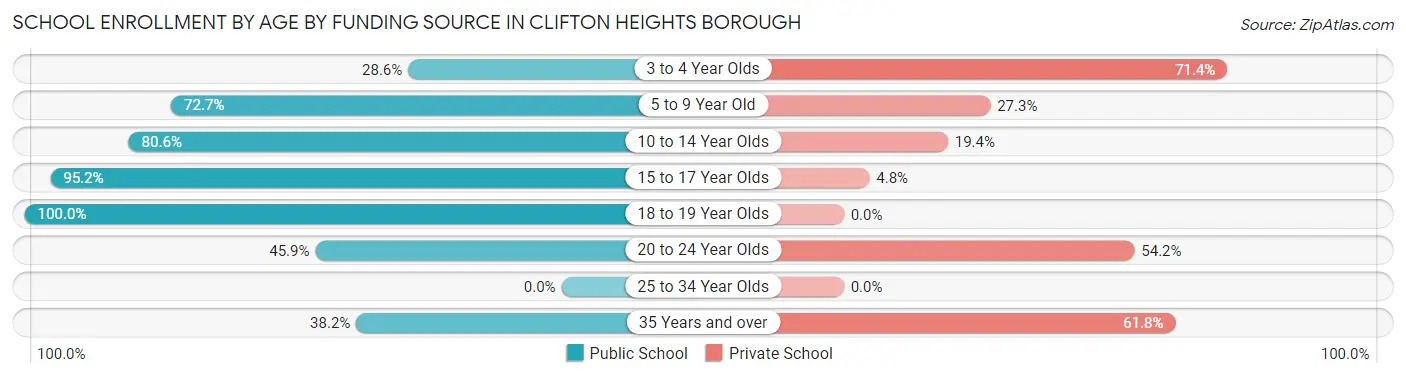
| Age Bracket | Public School | Private School |
| 3 to 4 Year Olds | 36 (28.6%) | 90 (71.4%) |
| 5 to 9 Year Old | 245 (72.7%) | 92 (27.3%) |
| 10 to 14 Year Olds | 345 (80.6%) | 83 (19.4%) |
| 15 to 17 Year Olds | 378 (95.2%) | 19 (4.8%) |
| 18 to 19 Year Olds | 30 (100.0%) | 0 (0.0%) |
| 20 to 24 Year Olds | 138 (45.9%) | 163 (54.1%) |
| 25 to 34 Year Olds | 0 (0.0%) | 0 (0.0%) |
| 35 Years and over | 91 (38.2%) | 147 (61.8%) |
| Total | 1,263 (68.0%) | 594 (32.0%) |
Educational Attainment by Field of Study in Clifton Heights borough
Physical & health sciences (159 | 26.8%), business (109 | 18.3%), communications (92 | 15.5%), science & technology (68 | 11.5%), and bio, nature & agricultural (67 | 11.3%) are the most common fields of study among 594 individuals in Clifton Heights borough who have obtained a bachelor's degree or higher.
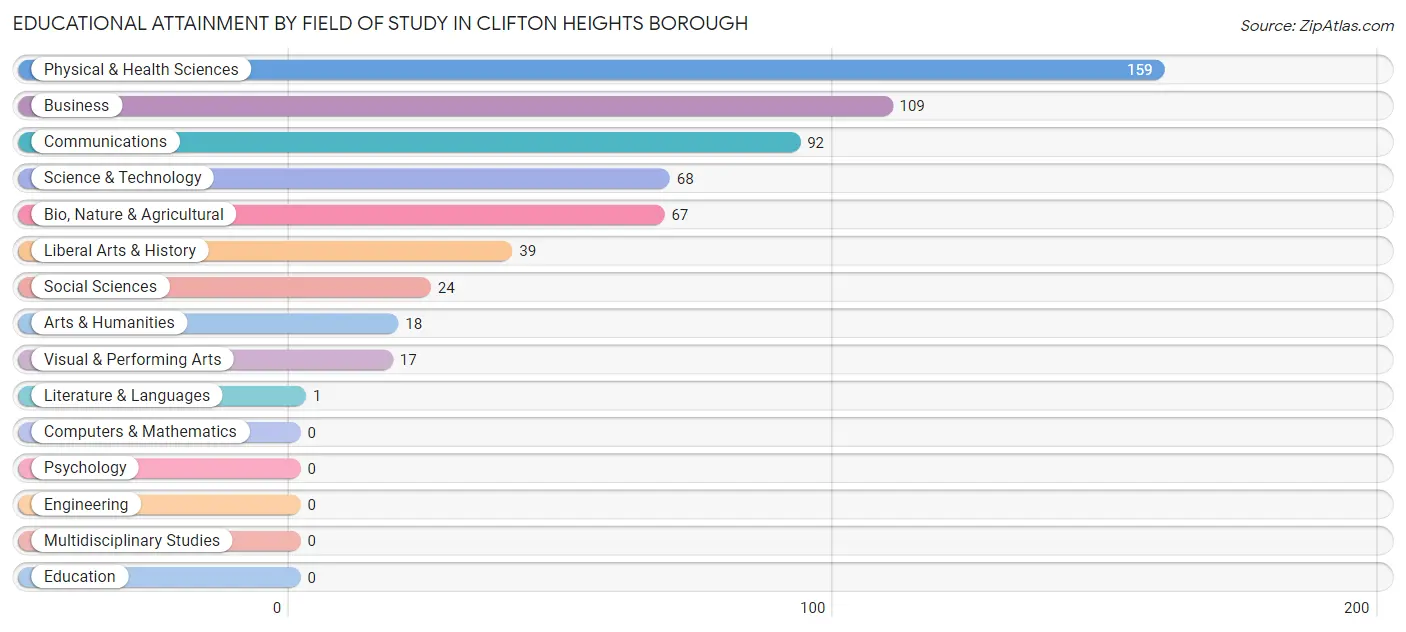
| Field of Study | # Graduates | % Graduates |
| Computers & Mathematics | 0 | 0.0% |
| Bio, Nature & Agricultural | 67 | 11.3% |
| Physical & Health Sciences | 159 | 26.8% |
| Psychology | 0 | 0.0% |
| Social Sciences | 24 | 4.0% |
| Engineering | 0 | 0.0% |
| Multidisciplinary Studies | 0 | 0.0% |
| Science & Technology | 68 | 11.5% |
| Business | 109 | 18.3% |
| Education | 0 | 0.0% |
| Literature & Languages | 1 | 0.2% |
| Liberal Arts & History | 39 | 6.6% |
| Visual & Performing Arts | 17 | 2.9% |
| Communications | 92 | 15.5% |
| Arts & Humanities | 18 | 3.0% |
| Total | 594 | 100.0% |
Transportation & Commute in Clifton Heights borough
Vehicle Availability by Sex in Clifton Heights borough
The most prevalent vehicle ownership categories in Clifton Heights borough are males with 2 vehicles (638, accounting for 45.1%) and females with 2 vehicles (653, making up 46.9%).
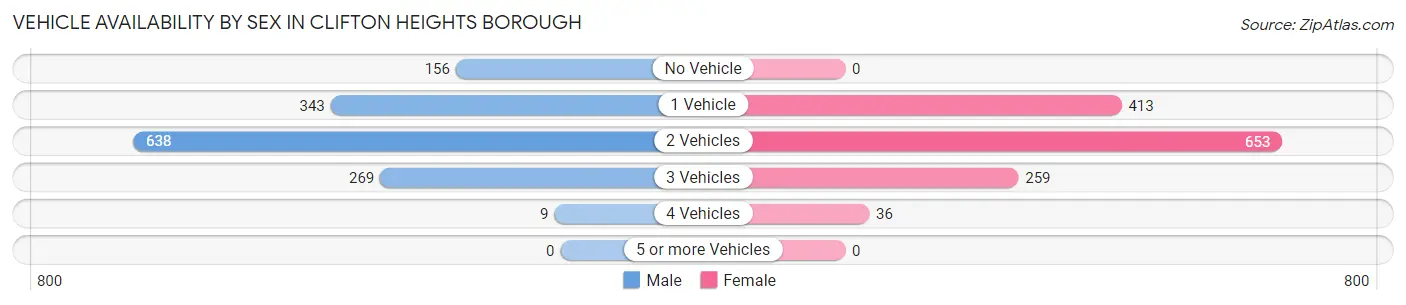
| Vehicles Available | Male | Female |
| No Vehicle | 156 (11.0%) | 0 (0.0%) |
| 1 Vehicle | 343 (24.2%) | 413 (30.3%) |
| 2 Vehicles | 638 (45.1%) | 653 (48.0%) |
| 3 Vehicles | 269 (19.0%) | 259 (19.0%) |
| 4 Vehicles | 9 (0.6%) | 36 (2.6%) |
| 5 or more Vehicles | 0 (0.0%) | 0 (0.0%) |
| Total | 1,415 (100.0%) | 1,361 (100.0%) |
Commute Time in Clifton Heights borough
The most frequently occuring commute durations in Clifton Heights borough are 15 to 19 minutes (638 commuters, 24.4%), 30 to 34 minutes (569 commuters, 21.8%), and 20 to 24 minutes (360 commuters, 13.8%).
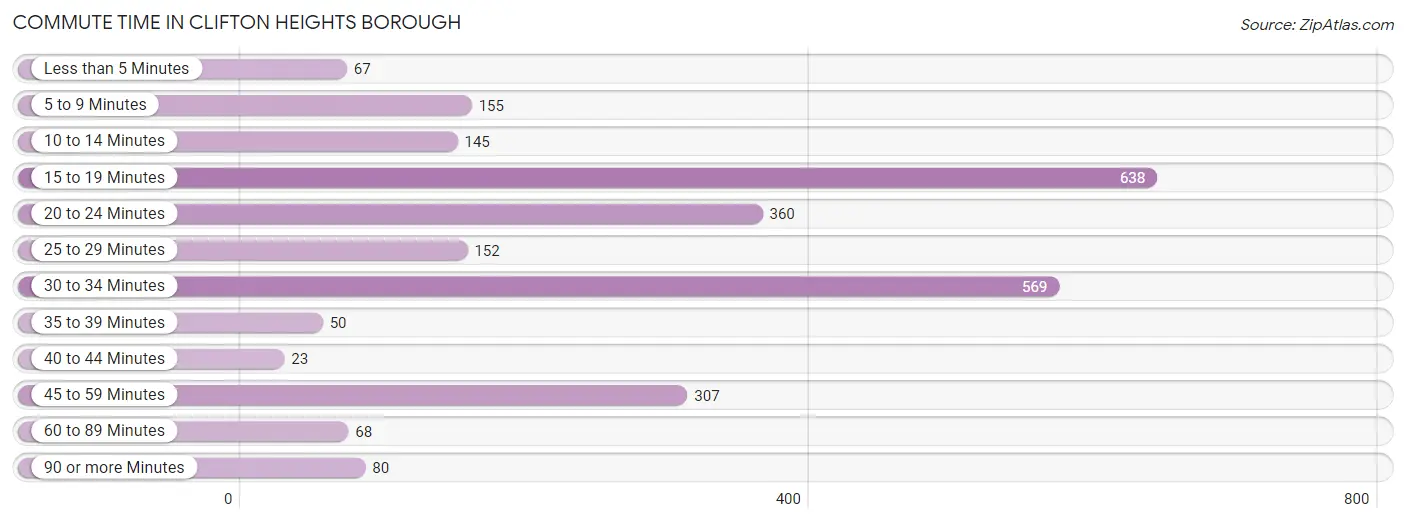
| Commute Time | # Commuters | % Commuters |
| Less than 5 Minutes | 67 | 2.6% |
| 5 to 9 Minutes | 155 | 5.9% |
| 10 to 14 Minutes | 145 | 5.6% |
| 15 to 19 Minutes | 638 | 24.4% |
| 20 to 24 Minutes | 360 | 13.8% |
| 25 to 29 Minutes | 152 | 5.8% |
| 30 to 34 Minutes | 569 | 21.8% |
| 35 to 39 Minutes | 50 | 1.9% |
| 40 to 44 Minutes | 23 | 0.9% |
| 45 to 59 Minutes | 307 | 11.7% |
| 60 to 89 Minutes | 68 | 2.6% |
| 90 or more Minutes | 80 | 3.1% |
Commute Time by Sex in Clifton Heights borough
The most common commute times in Clifton Heights borough are 30 to 34 minutes (397 commuters, 29.7%) for males and 15 to 19 minutes (383 commuters, 30.0%) for females.
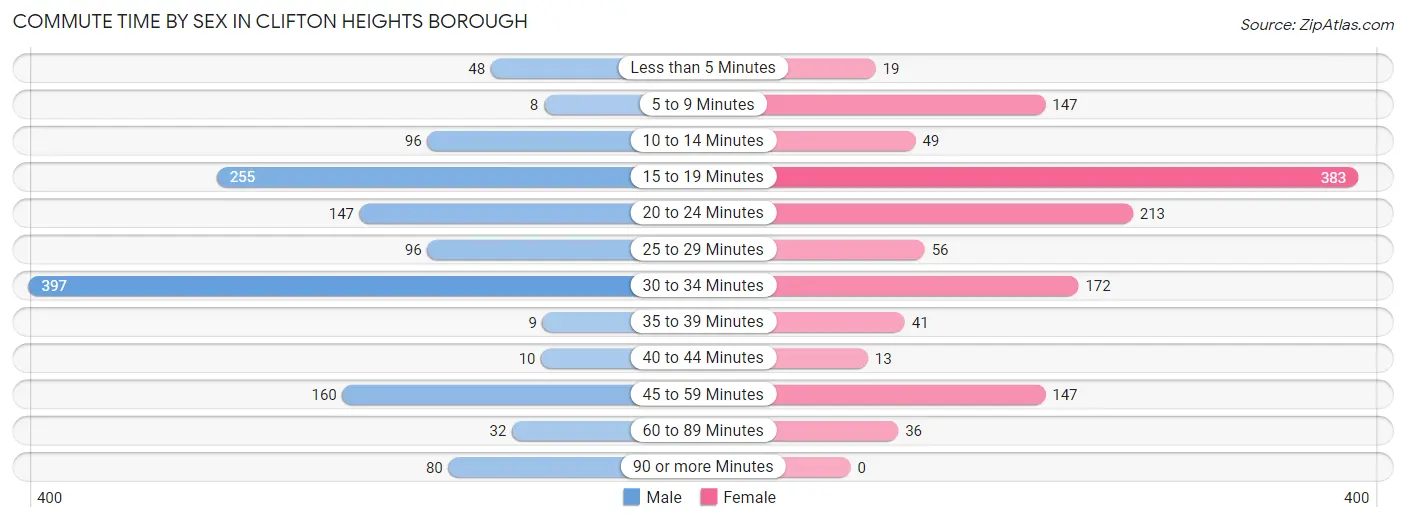
| Commute Time | Male | Female |
| Less than 5 Minutes | 48 (3.6%) | 19 (1.5%) |
| 5 to 9 Minutes | 8 (0.6%) | 147 (11.5%) |
| 10 to 14 Minutes | 96 (7.2%) | 49 (3.8%) |
| 15 to 19 Minutes | 255 (19.1%) | 383 (30.0%) |
| 20 to 24 Minutes | 147 (11.0%) | 213 (16.7%) |
| 25 to 29 Minutes | 96 (7.2%) | 56 (4.4%) |
| 30 to 34 Minutes | 397 (29.7%) | 172 (13.5%) |
| 35 to 39 Minutes | 9 (0.7%) | 41 (3.2%) |
| 40 to 44 Minutes | 10 (0.7%) | 13 (1.0%) |
| 45 to 59 Minutes | 160 (12.0%) | 147 (11.5%) |
| 60 to 89 Minutes | 32 (2.4%) | 36 (2.8%) |
| 90 or more Minutes | 80 (6.0%) | 0 (0.0%) |
Time of Departure to Work by Sex in Clifton Heights borough
The most frequent times of departure to work in Clifton Heights borough are 6:30 AM to 6:59 AM (237, 17.7%) for males and 8:00 AM to 8:29 AM (306, 24.0%) for females.
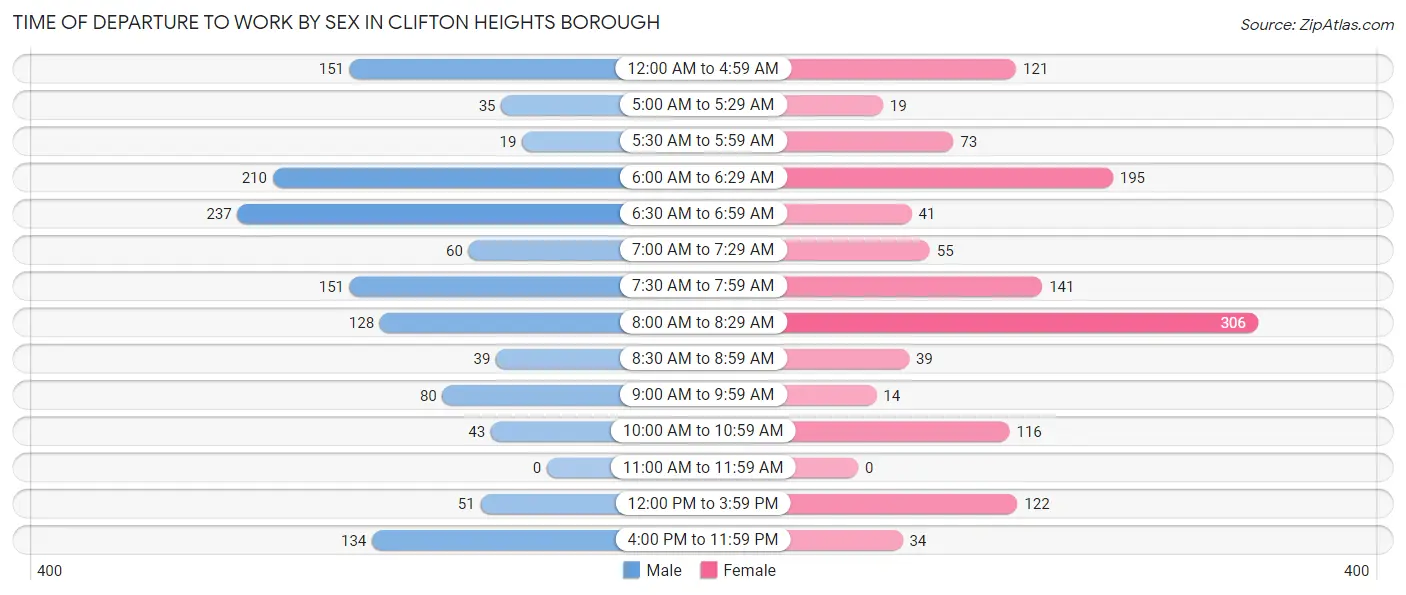
| Time of Departure | Male | Female |
| 12:00 AM to 4:59 AM | 151 (11.3%) | 121 (9.5%) |
| 5:00 AM to 5:29 AM | 35 (2.6%) | 19 (1.5%) |
| 5:30 AM to 5:59 AM | 19 (1.4%) | 73 (5.7%) |
| 6:00 AM to 6:29 AM | 210 (15.7%) | 195 (15.3%) |
| 6:30 AM to 6:59 AM | 237 (17.7%) | 41 (3.2%) |
| 7:00 AM to 7:29 AM | 60 (4.5%) | 55 (4.3%) |
| 7:30 AM to 7:59 AM | 151 (11.3%) | 141 (11.1%) |
| 8:00 AM to 8:29 AM | 128 (9.6%) | 306 (24.0%) |
| 8:30 AM to 8:59 AM | 39 (2.9%) | 39 (3.1%) |
| 9:00 AM to 9:59 AM | 80 (6.0%) | 14 (1.1%) |
| 10:00 AM to 10:59 AM | 43 (3.2%) | 116 (9.1%) |
| 11:00 AM to 11:59 AM | 0 (0.0%) | 0 (0.0%) |
| 12:00 PM to 3:59 PM | 51 (3.8%) | 122 (9.6%) |
| 4:00 PM to 11:59 PM | 134 (10.0%) | 34 (2.7%) |
| Total | 1,338 (100.0%) | 1,276 (100.0%) |
Housing Occupancy in Clifton Heights borough
Occupancy by Ownership in Clifton Heights borough
Of the total 2,433 dwellings in Clifton Heights borough, owner-occupied units account for 1,717 (70.6%), while renter-occupied units make up 716 (29.4%).
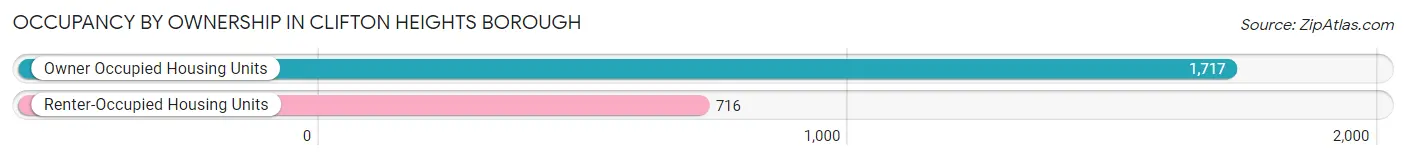
| Occupancy | # Housing Units | % Housing Units |
| Owner Occupied Housing Units | 1,717 | 70.6% |
| Renter-Occupied Housing Units | 716 | 29.4% |
| Total Occupied Housing Units | 2,433 | 100.0% |
Occupancy by Household Size in Clifton Heights borough
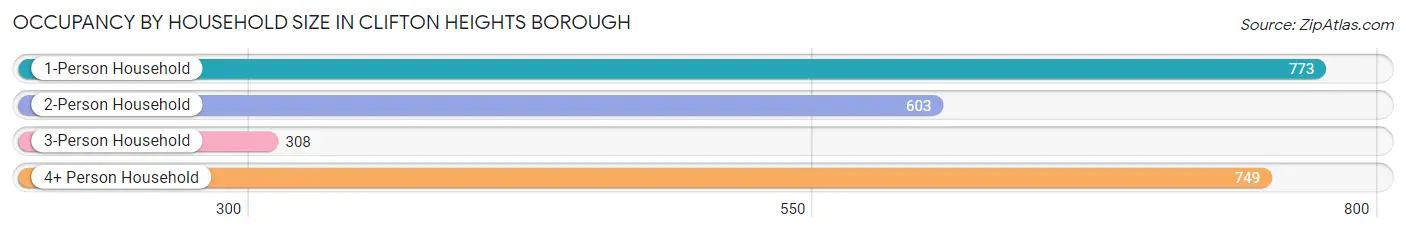
| Household Size | # Housing Units | % Housing Units |
| 1-Person Household | 773 | 31.8% |
| 2-Person Household | 603 | 24.8% |
| 3-Person Household | 308 | 12.7% |
| 4+ Person Household | 749 | 30.8% |
| Total Housing Units | 2,433 | 100.0% |
Occupancy by Ownership by Household Size in Clifton Heights borough
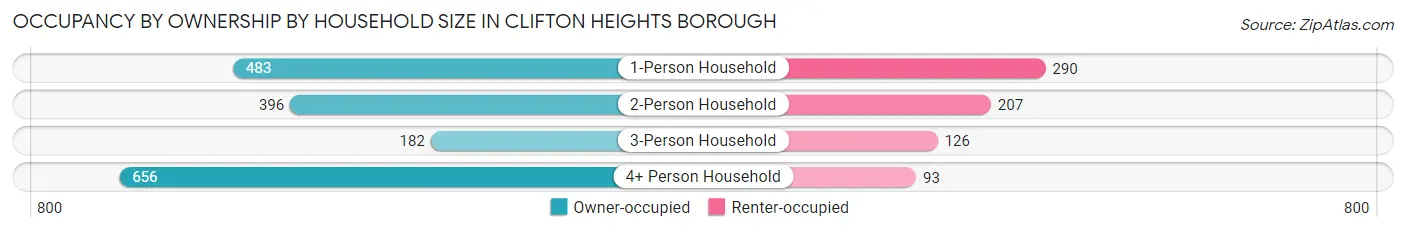
| Household Size | Owner-occupied | Renter-occupied |
| 1-Person Household | 483 (62.5%) | 290 (37.5%) |
| 2-Person Household | 396 (65.7%) | 207 (34.3%) |
| 3-Person Household | 182 (59.1%) | 126 (40.9%) |
| 4+ Person Household | 656 (87.6%) | 93 (12.4%) |
| Total Housing Units | 1,717 (70.6%) | 716 (29.4%) |
Occupancy by Educational Attainment in Clifton Heights borough
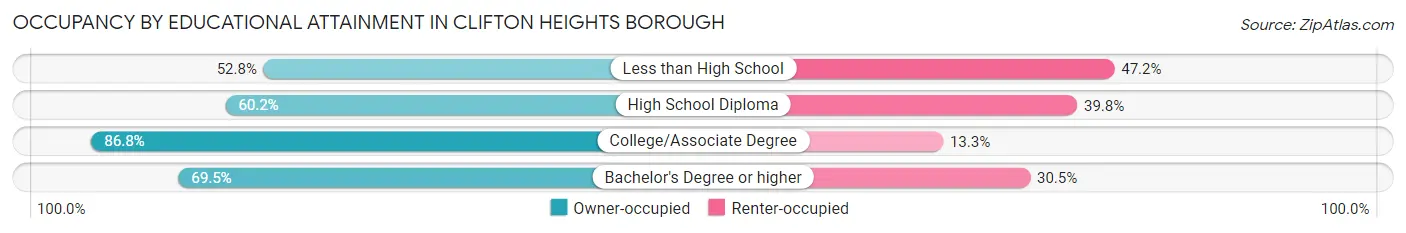
| Household Size | Owner-occupied | Renter-occupied |
| Less than High School | 208 (52.8%) | 186 (47.2%) |
| High School Diploma | 432 (60.2%) | 286 (39.8%) |
| College/Associate Degree | 799 (86.8%) | 122 (13.3%) |
| Bachelor's Degree or higher | 278 (69.5%) | 122 (30.5%) |
Occupancy by Age of Householder in Clifton Heights borough
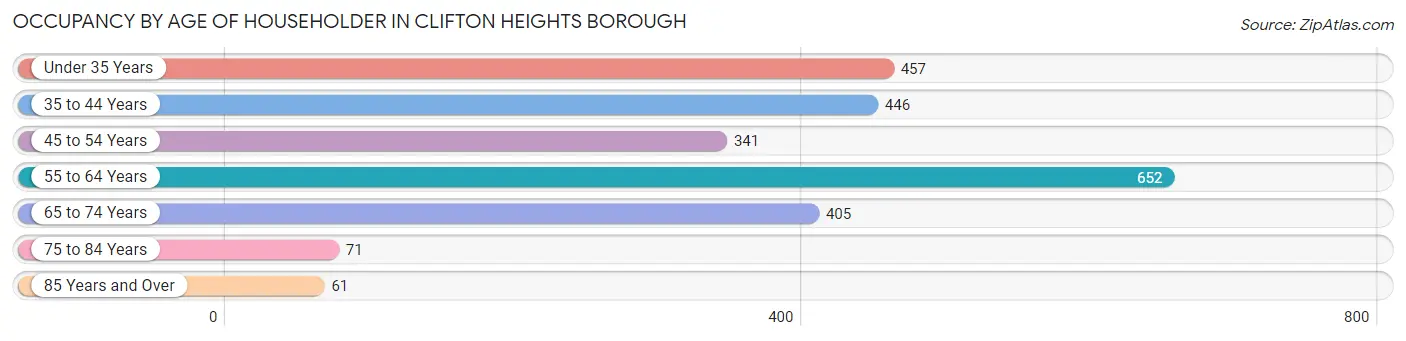
| Age Bracket | # Households | % Households |
| Under 35 Years | 457 | 18.8% |
| 35 to 44 Years | 446 | 18.3% |
| 45 to 54 Years | 341 | 14.0% |
| 55 to 64 Years | 652 | 26.8% |
| 65 to 74 Years | 405 | 16.7% |
| 75 to 84 Years | 71 | 2.9% |
| 85 Years and Over | 61 | 2.5% |
| Total | 2,433 | 100.0% |
Housing Finances in Clifton Heights borough
Median Income by Occupancy in Clifton Heights borough
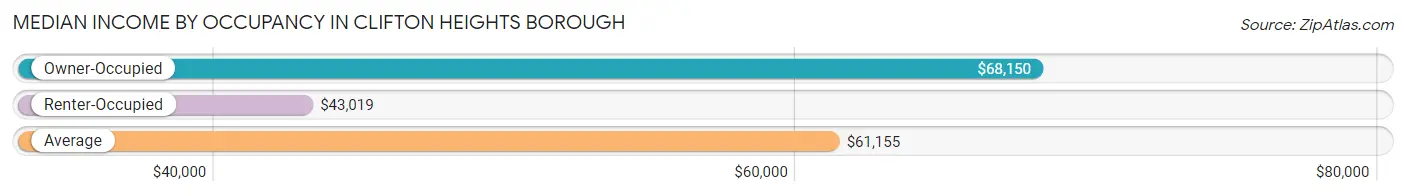
| Occupancy Type | # Households | Median Income |
| Owner-Occupied | 1,717 (70.6%) | $68,150 |
| Renter-Occupied | 716 (29.4%) | $43,019 |
| Average | 2,433 (100.0%) | $61,155 |
Occupancy by Householder Income Bracket in Clifton Heights borough
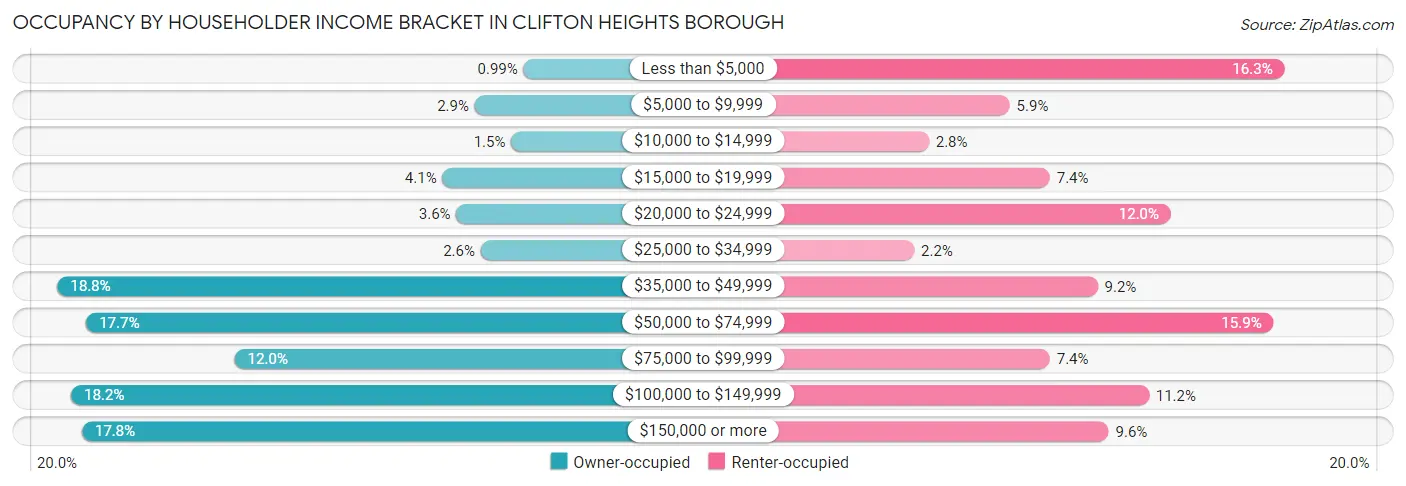
| Income Bracket | Owner-occupied | Renter-occupied |
| Less than $5,000 | 17 (1.0%) | 117 (16.3%) |
| $5,000 to $9,999 | 49 (2.9%) | 42 (5.9%) |
| $10,000 to $14,999 | 25 (1.5%) | 20 (2.8%) |
| $15,000 to $19,999 | 70 (4.1%) | 53 (7.4%) |
| $20,000 to $24,999 | 61 (3.5%) | 86 (12.0%) |
| $25,000 to $34,999 | 45 (2.6%) | 16 (2.2%) |
| $35,000 to $49,999 | 322 (18.8%) | 66 (9.2%) |
| $50,000 to $74,999 | 303 (17.6%) | 114 (15.9%) |
| $75,000 to $99,999 | 206 (12.0%) | 53 (7.4%) |
| $100,000 to $149,999 | 313 (18.2%) | 80 (11.2%) |
| $150,000 or more | 306 (17.8%) | 69 (9.6%) |
| Total | 1,717 (100.0%) | 716 (100.0%) |
Monthly Housing Cost Tiers in Clifton Heights borough
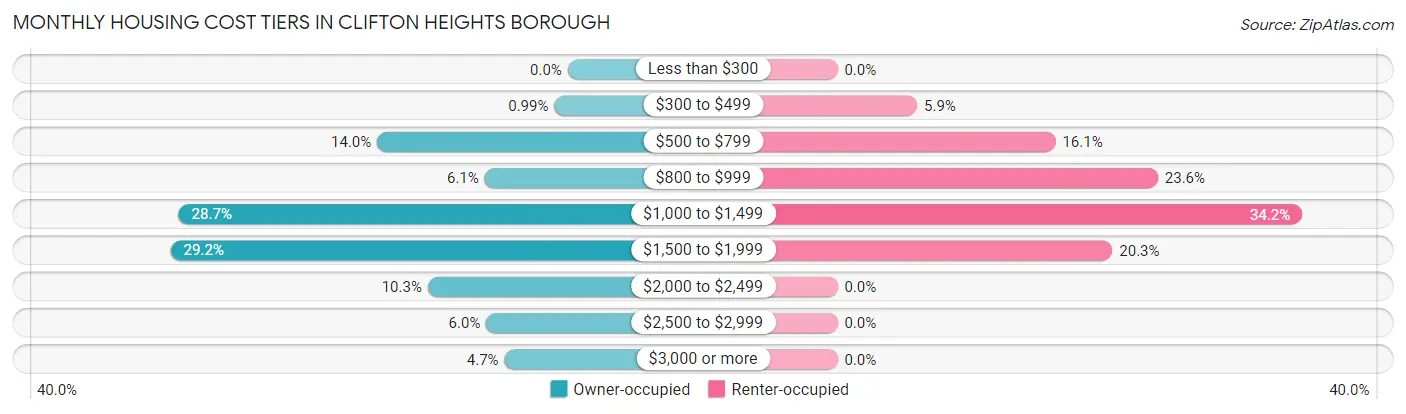
| Monthly Cost | Owner-occupied | Renter-occupied |
| Less than $300 | 0 (0.0%) | 0 (0.0%) |
| $300 to $499 | 17 (1.0%) | 42 (5.9%) |
| $500 to $799 | 241 (14.0%) | 115 (16.1%) |
| $800 to $999 | 105 (6.1%) | 169 (23.6%) |
| $1,000 to $1,499 | 492 (28.6%) | 245 (34.2%) |
| $1,500 to $1,999 | 502 (29.2%) | 145 (20.3%) |
| $2,000 to $2,499 | 177 (10.3%) | 0 (0.0%) |
| $2,500 to $2,999 | 103 (6.0%) | 0 (0.0%) |
| $3,000 or more | 80 (4.7%) | 0 (0.0%) |
| Total | 1,717 (100.0%) | 716 (100.0%) |
Physical Housing Characteristics in Clifton Heights borough
Housing Structures in Clifton Heights borough
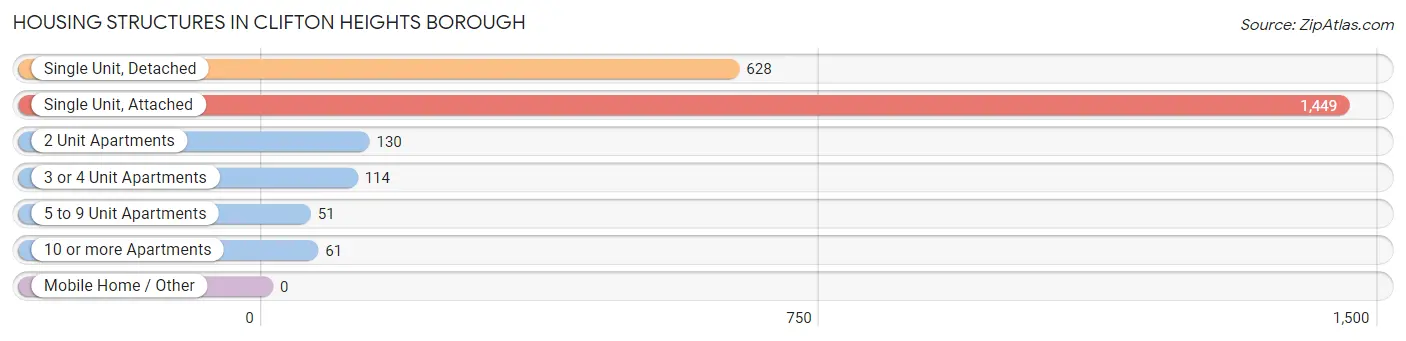
| Structure Type | # Housing Units | % Housing Units |
| Single Unit, Detached | 628 | 25.8% |
| Single Unit, Attached | 1,449 | 59.6% |
| 2 Unit Apartments | 130 | 5.3% |
| 3 or 4 Unit Apartments | 114 | 4.7% |
| 5 to 9 Unit Apartments | 51 | 2.1% |
| 10 or more Apartments | 61 | 2.5% |
| Mobile Home / Other | 0 | 0.0% |
| Total | 2,433 | 100.0% |
Housing Structures by Occupancy in Clifton Heights borough
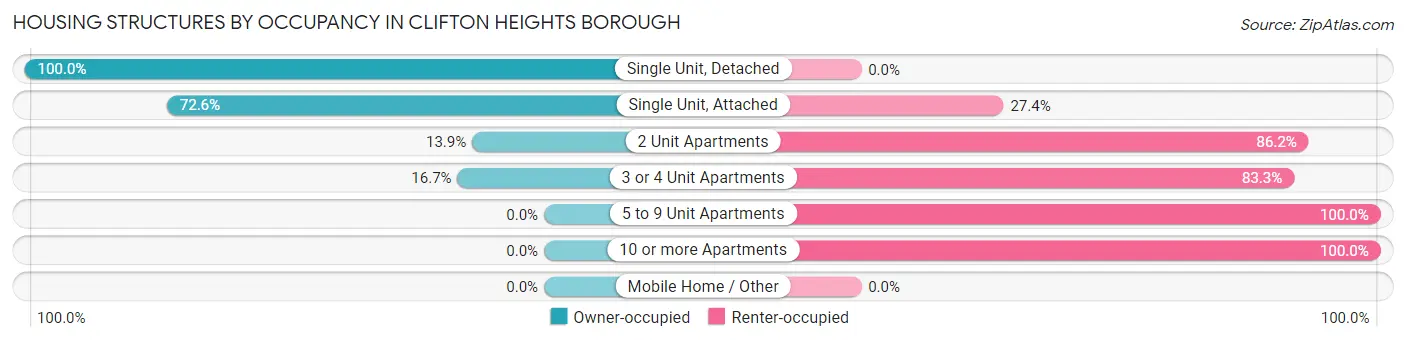
| Structure Type | Owner-occupied | Renter-occupied |
| Single Unit, Detached | 628 (100.0%) | 0 (0.0%) |
| Single Unit, Attached | 1,052 (72.6%) | 397 (27.4%) |
| 2 Unit Apartments | 18 (13.9%) | 112 (86.2%) |
| 3 or 4 Unit Apartments | 19 (16.7%) | 95 (83.3%) |
| 5 to 9 Unit Apartments | 0 (0.0%) | 51 (100.0%) |
| 10 or more Apartments | 0 (0.0%) | 61 (100.0%) |
| Mobile Home / Other | 0 (0.0%) | 0 (0.0%) |
| Total | 1,717 (70.6%) | 716 (29.4%) |
Housing Structures by Number of Rooms in Clifton Heights borough
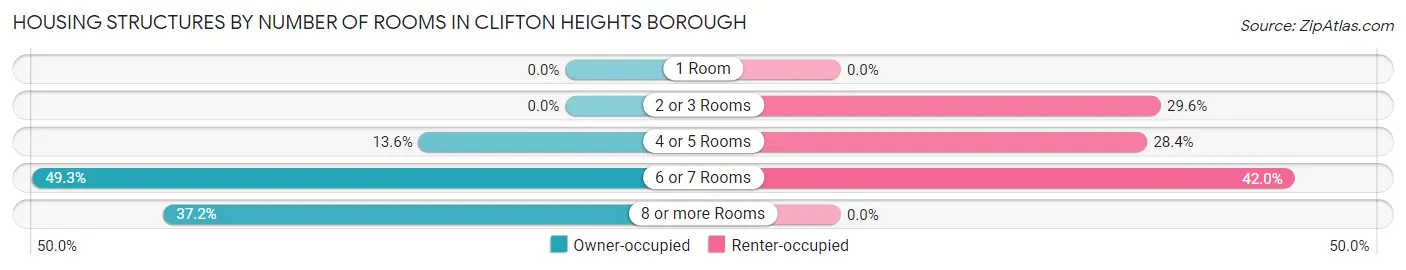
| Number of Rooms | Owner-occupied | Renter-occupied |
| 1 Room | 0 (0.0%) | 0 (0.0%) |
| 2 or 3 Rooms | 0 (0.0%) | 212 (29.6%) |
| 4 or 5 Rooms | 233 (13.6%) | 203 (28.3%) |
| 6 or 7 Rooms | 846 (49.3%) | 301 (42.0%) |
| 8 or more Rooms | 638 (37.2%) | 0 (0.0%) |
| Total | 1,717 (100.0%) | 716 (100.0%) |
Housing Structure by Heating Type in Clifton Heights borough
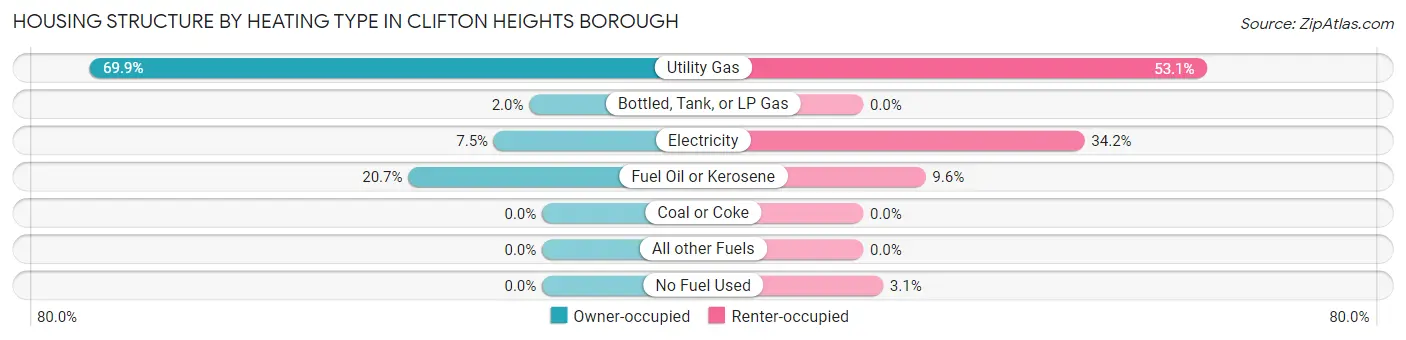
| Heating Type | Owner-occupied | Renter-occupied |
| Utility Gas | 1,200 (69.9%) | 380 (53.1%) |
| Bottled, Tank, or LP Gas | 34 (2.0%) | 0 (0.0%) |
| Electricity | 128 (7.4%) | 245 (34.2%) |
| Fuel Oil or Kerosene | 355 (20.7%) | 69 (9.6%) |
| Coal or Coke | 0 (0.0%) | 0 (0.0%) |
| All other Fuels | 0 (0.0%) | 0 (0.0%) |
| No Fuel Used | 0 (0.0%) | 22 (3.1%) |
| Total | 1,717 (100.0%) | 716 (100.0%) |
Household Vehicle Usage in Clifton Heights borough
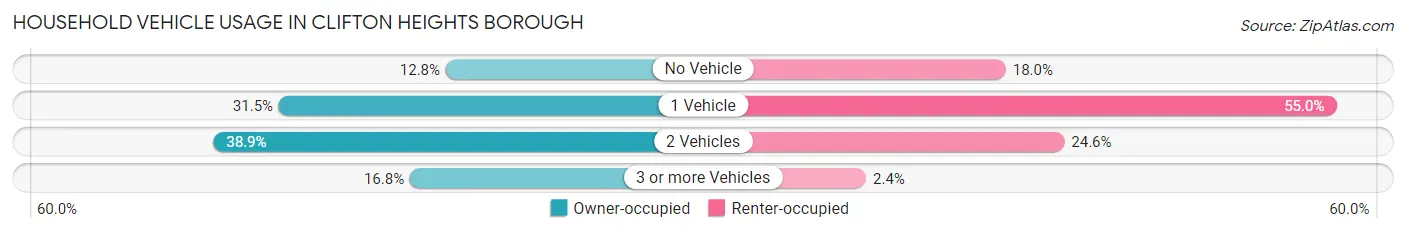
| Vehicles per Household | Owner-occupied | Renter-occupied |
| No Vehicle | 220 (12.8%) | 129 (18.0%) |
| 1 Vehicle | 541 (31.5%) | 394 (55.0%) |
| 2 Vehicles | 667 (38.9%) | 176 (24.6%) |
| 3 or more Vehicles | 289 (16.8%) | 17 (2.4%) |
| Total | 1,717 (100.0%) | 716 (100.0%) |
Real Estate & Mortgages in Clifton Heights borough
Real Estate and Mortgage Overview in Clifton Heights borough
| Characteristic | Without Mortgage | With Mortgage |
| Housing Units | 383 | 1,334 |
| Median Property Value | $163,200 | $190,400 |
| Median Household Income | $72,917 | $248 |
| Monthly Housing Costs | $697 | $80 |
| Real Estate Taxes | $4,561 | $15 |
Property Value by Mortgage Status in Clifton Heights borough
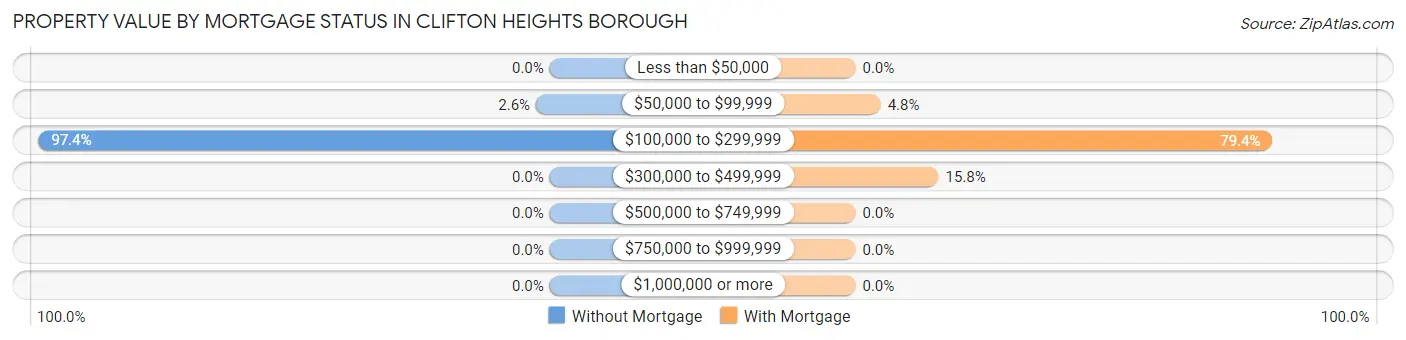
| Property Value | Without Mortgage | With Mortgage |
| Less than $50,000 | 0 (0.0%) | 0 (0.0%) |
| $50,000 to $99,999 | 10 (2.6%) | 64 (4.8%) |
| $100,000 to $299,999 | 373 (97.4%) | 1,059 (79.4%) |
| $300,000 to $499,999 | 0 (0.0%) | 211 (15.8%) |
| $500,000 to $749,999 | 0 (0.0%) | 0 (0.0%) |
| $750,000 to $999,999 | 0 (0.0%) | 0 (0.0%) |
| $1,000,000 or more | 0 (0.0%) | 0 (0.0%) |
| Total | 383 (100.0%) | 1,334 (100.0%) |
Household Income by Mortgage Status in Clifton Heights borough
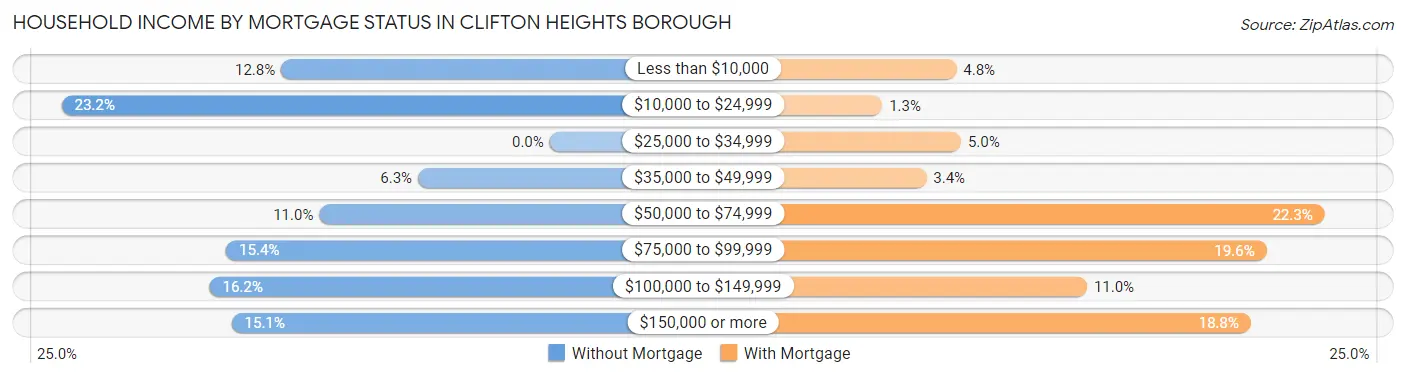
| Household Income | Without Mortgage | With Mortgage |
| Less than $10,000 | 49 (12.8%) | 64 (4.8%) |
| $10,000 to $24,999 | 89 (23.2%) | 17 (1.3%) |
| $25,000 to $34,999 | 0 (0.0%) | 67 (5.0%) |
| $35,000 to $49,999 | 24 (6.3%) | 45 (3.4%) |
| $50,000 to $74,999 | 42 (11.0%) | 298 (22.3%) |
| $75,000 to $99,999 | 59 (15.4%) | 261 (19.6%) |
| $100,000 to $149,999 | 62 (16.2%) | 147 (11.0%) |
| $150,000 or more | 58 (15.1%) | 251 (18.8%) |
| Total | 383 (100.0%) | 1,334 (100.0%) |
Property Value to Household Income Ratio in Clifton Heights borough
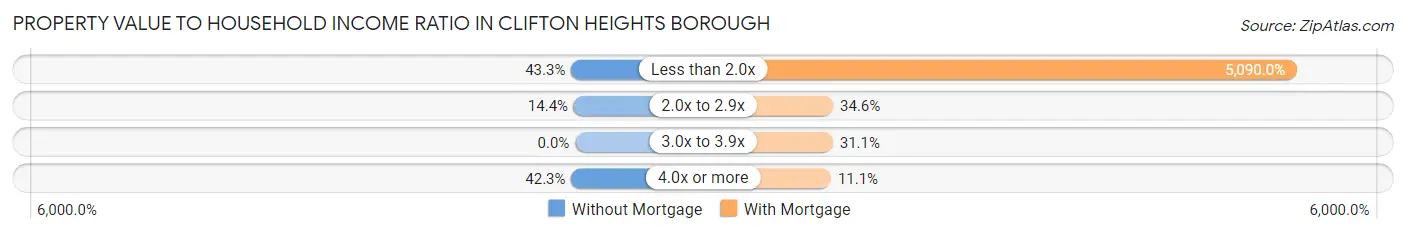
| Value-to-Income Ratio | Without Mortgage | With Mortgage |
| Less than 2.0x | 166 (43.3%) | 67,900 (5,090.0%) |
| 2.0x to 2.9x | 55 (14.4%) | 462 (34.6%) |
| 3.0x to 3.9x | 0 (0.0%) | 415 (31.1%) |
| 4.0x or more | 162 (42.3%) | 148 (11.1%) |
| Total | 383 (100.0%) | 1,334 (100.0%) |
Real Estate Taxes by Mortgage Status in Clifton Heights borough
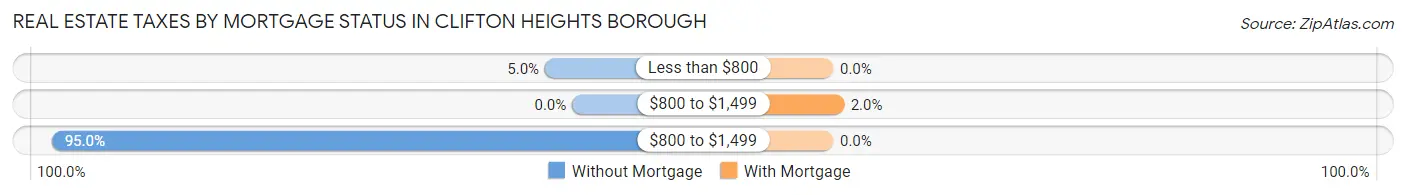
| Property Taxes | Without Mortgage | With Mortgage |
| Less than $800 | 19 (5.0%) | 0 (0.0%) |
| $800 to $1,499 | 0 (0.0%) | 26 (1.9%) |
| $800 to $1,499 | 364 (95.0%) | 0 (0.0%) |
| Total | 383 (100.0%) | 1,334 (100.0%) |
Health & Disability in Clifton Heights borough
Health Insurance Coverage by Age in Clifton Heights borough
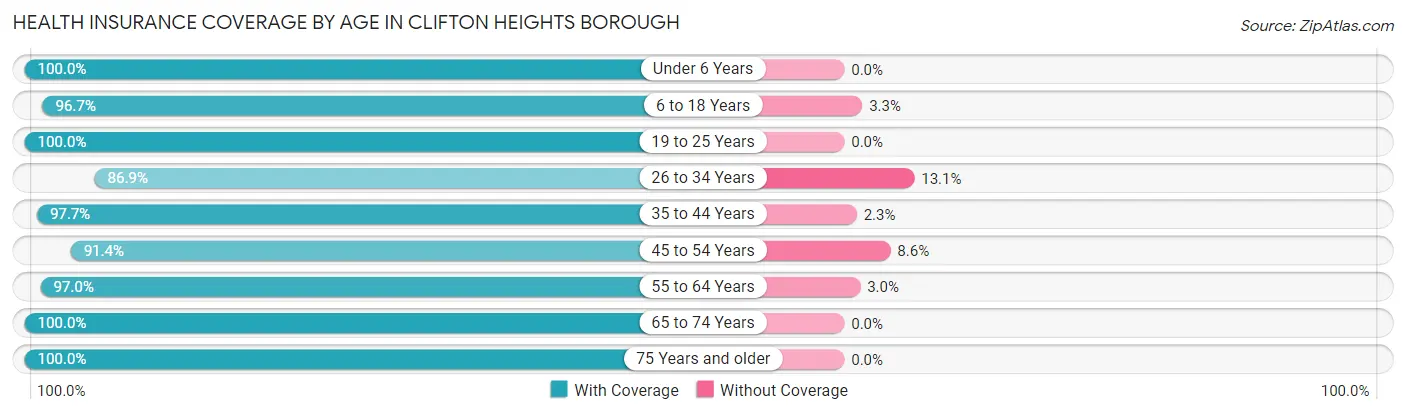
| Age Bracket | With Coverage | Without Coverage |
| Under 6 Years | 538 (100.0%) | 0 (0.0%) |
| 6 to 18 Years | 1,245 (96.7%) | 43 (3.3%) |
| 19 to 25 Years | 714 (100.0%) | 0 (0.0%) |
| 26 to 34 Years | 759 (86.9%) | 114 (13.1%) |
| 35 to 44 Years | 887 (97.7%) | 21 (2.3%) |
| 45 to 54 Years | 563 (91.4%) | 53 (8.6%) |
| 55 to 64 Years | 1,046 (97.0%) | 32 (3.0%) |
| 65 to 74 Years | 527 (100.0%) | 0 (0.0%) |
| 75 Years and older | 152 (100.0%) | 0 (0.0%) |
| Total | 6,431 (96.1%) | 263 (3.9%) |
Health Insurance Coverage by Citizenship Status in Clifton Heights borough
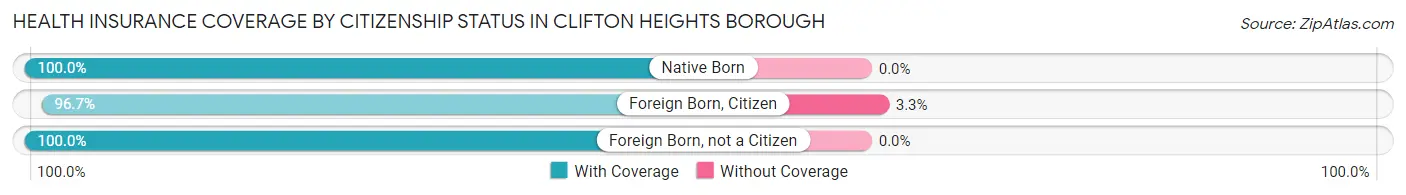
| Citizenship Status | With Coverage | Without Coverage |
| Native Born | 538 (100.0%) | 0 (0.0%) |
| Foreign Born, Citizen | 1,245 (96.7%) | 43 (3.3%) |
| Foreign Born, not a Citizen | 714 (100.0%) | 0 (0.0%) |
Health Insurance Coverage by Household Income in Clifton Heights borough
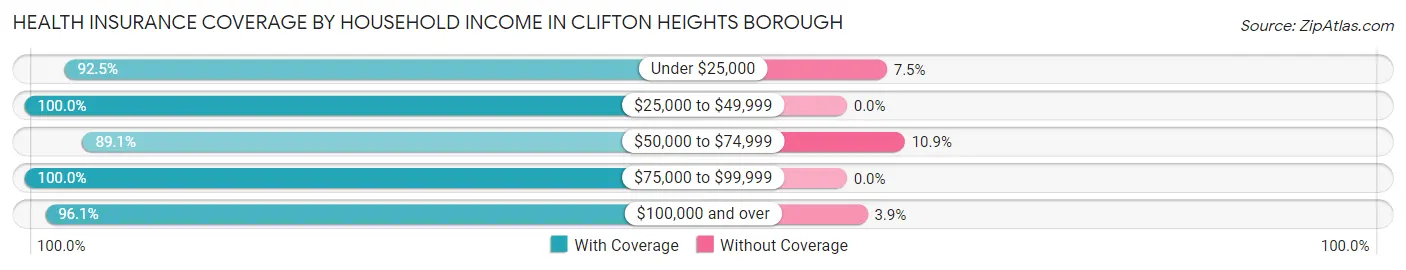
| Household Income | With Coverage | Without Coverage |
| Under $25,000 | 778 (92.5%) | 63 (7.5%) |
| $25,000 to $49,999 | 1,614 (100.0%) | 0 (0.0%) |
| $50,000 to $74,999 | 862 (89.1%) | 105 (10.9%) |
| $75,000 to $99,999 | 832 (100.0%) | 0 (0.0%) |
| $100,000 and over | 2,337 (96.1%) | 94 (3.9%) |
Public vs Private Health Insurance Coverage by Age in Clifton Heights borough
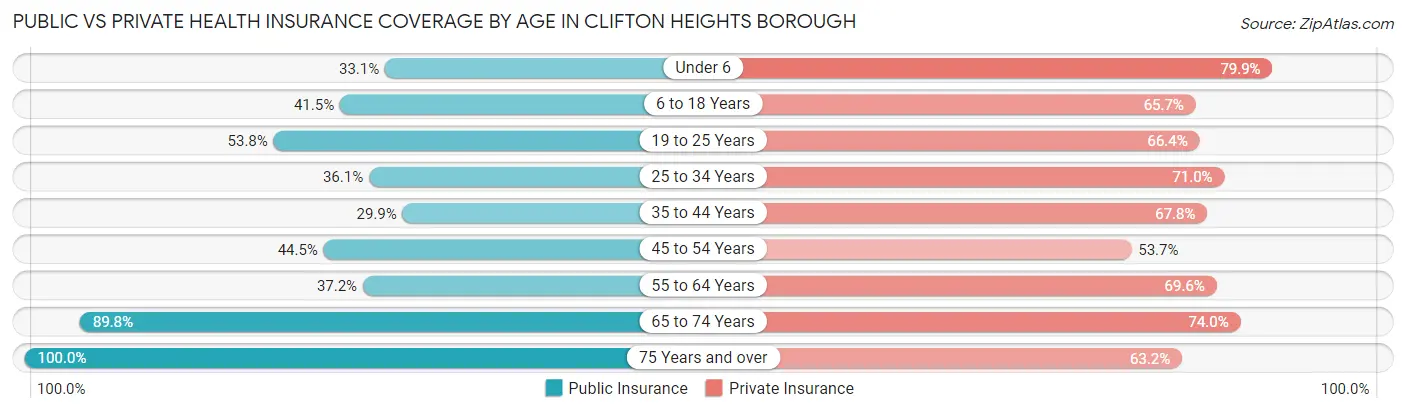
| Age Bracket | Public Insurance | Private Insurance |
| Under 6 | 178 (33.1%) | 430 (79.9%) |
| 6 to 18 Years | 534 (41.5%) | 846 (65.7%) |
| 19 to 25 Years | 384 (53.8%) | 474 (66.4%) |
| 25 to 34 Years | 315 (36.1%) | 620 (71.0%) |
| 35 to 44 Years | 271 (29.8%) | 616 (67.8%) |
| 45 to 54 Years | 274 (44.5%) | 331 (53.7%) |
| 55 to 64 Years | 401 (37.2%) | 750 (69.6%) |
| 65 to 74 Years | 473 (89.7%) | 390 (74.0%) |
| 75 Years and over | 152 (100.0%) | 96 (63.2%) |
| Total | 2,982 (44.6%) | 4,553 (68.0%) |
Disability Status by Sex by Age in Clifton Heights borough
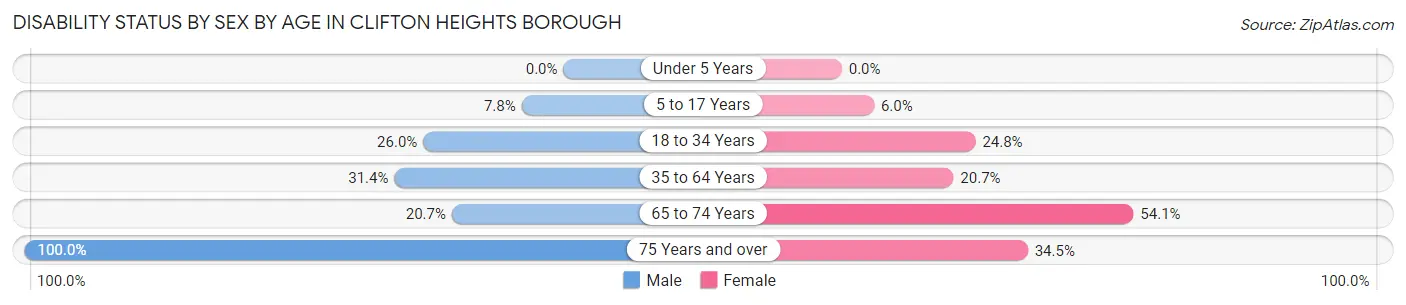
| Age Bracket | Male | Female |
| Under 5 Years | 0 (0.0%) | 0 (0.0%) |
| 5 to 17 Years | 33 (7.8%) | 44 (6.0%) |
| 18 to 34 Years | 211 (26.0%) | 228 (24.8%) |
| 35 to 64 Years | 338 (31.4%) | 316 (20.7%) |
| 65 to 74 Years | 64 (20.7%) | 118 (54.1%) |
| 75 Years and over | 10 (100.0%) | 49 (34.5%) |
Disability Class by Sex by Age in Clifton Heights borough
Disability Class: Hearing Difficulty
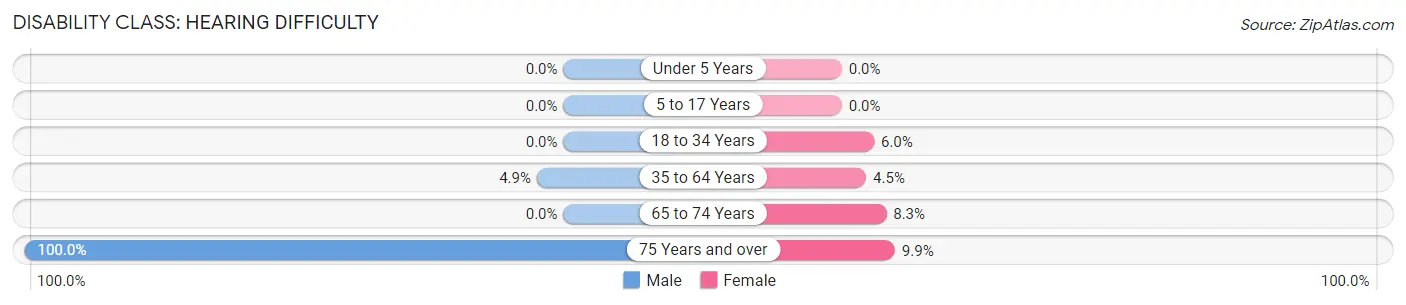
| Age Bracket | Male | Female |
| Under 5 Years | 0 (0.0%) | 0 (0.0%) |
| 5 to 17 Years | 0 (0.0%) | 0 (0.0%) |
| 18 to 34 Years | 0 (0.0%) | 55 (6.0%) |
| 35 to 64 Years | 53 (4.9%) | 69 (4.5%) |
| 65 to 74 Years | 0 (0.0%) | 18 (8.3%) |
| 75 Years and over | 10 (100.0%) | 14 (9.9%) |
Disability Class: Vision Difficulty
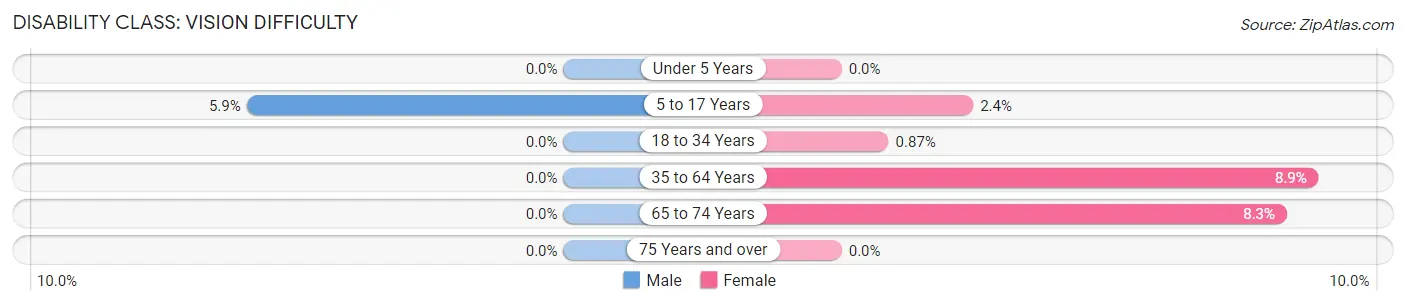
| Age Bracket | Male | Female |
| Under 5 Years | 0 (0.0%) | 0 (0.0%) |
| 5 to 17 Years | 25 (5.9%) | 18 (2.4%) |
| 18 to 34 Years | 0 (0.0%) | 8 (0.9%) |
| 35 to 64 Years | 0 (0.0%) | 135 (8.8%) |
| 65 to 74 Years | 0 (0.0%) | 18 (8.3%) |
| 75 Years and over | 0 (0.0%) | 0 (0.0%) |
Disability Class: Cognitive Difficulty
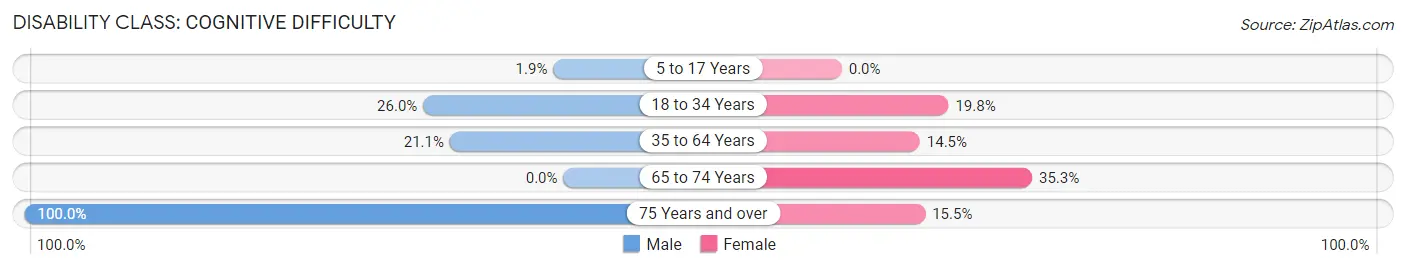
| Age Bracket | Male | Female |
| 5 to 17 Years | 8 (1.9%) | 0 (0.0%) |
| 18 to 34 Years | 211 (26.0%) | 182 (19.8%) |
| 35 to 64 Years | 227 (21.1%) | 221 (14.5%) |
| 65 to 74 Years | 0 (0.0%) | 77 (35.3%) |
| 75 Years and over | 10 (100.0%) | 22 (15.5%) |
Disability Class: Ambulatory Difficulty
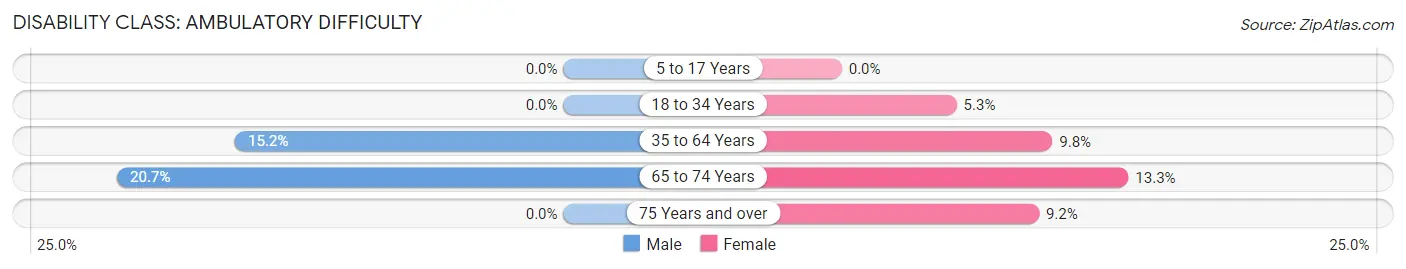
| Age Bracket | Male | Female |
| 5 to 17 Years | 0 (0.0%) | 0 (0.0%) |
| 18 to 34 Years | 0 (0.0%) | 49 (5.3%) |
| 35 to 64 Years | 164 (15.2%) | 149 (9.8%) |
| 65 to 74 Years | 64 (20.7%) | 29 (13.3%) |
| 75 Years and over | 0 (0.0%) | 13 (9.1%) |
Disability Class: Self-Care Difficulty
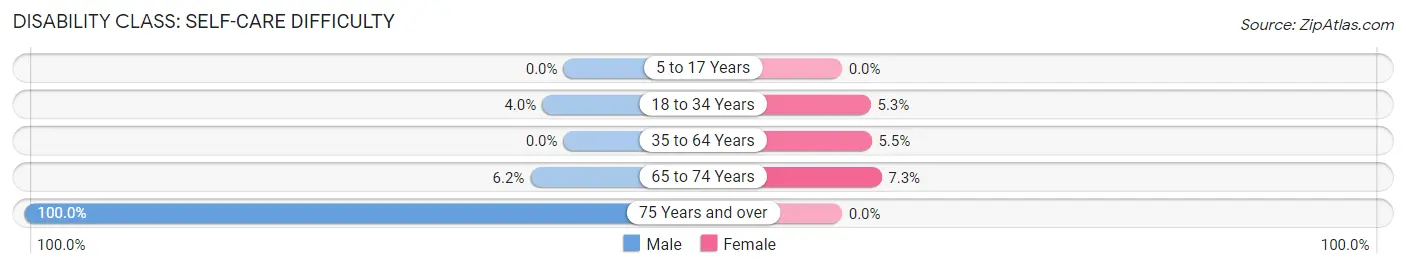
| Age Bracket | Male | Female |
| 5 to 17 Years | 0 (0.0%) | 0 (0.0%) |
| 18 to 34 Years | 32 (4.0%) | 49 (5.3%) |
| 35 to 64 Years | 0 (0.0%) | 84 (5.5%) |
| 65 to 74 Years | 19 (6.1%) | 16 (7.3%) |
| 75 Years and over | 10 (100.0%) | 0 (0.0%) |
Technology Access in Clifton Heights borough
Computing Device Access in Clifton Heights borough
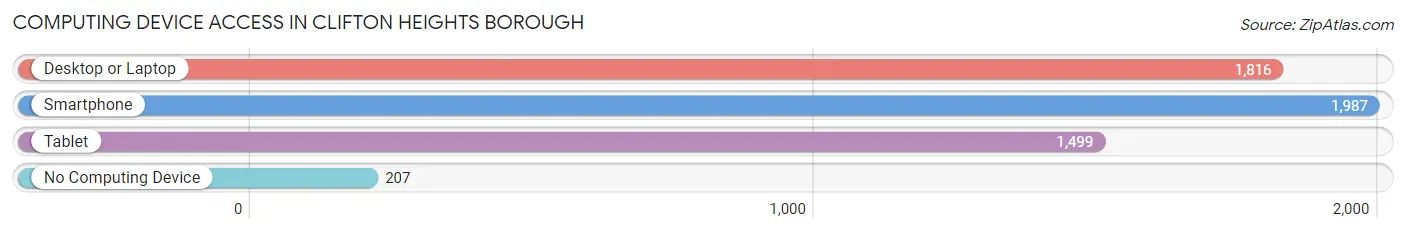
| Device Type | # Households | % Households |
| Desktop or Laptop | 1,816 | 74.6% |
| Smartphone | 1,987 | 81.7% |
| Tablet | 1,499 | 61.6% |
| No Computing Device | 207 | 8.5% |
| Total | 2,433 | 100.0% |
Internet Access in Clifton Heights borough
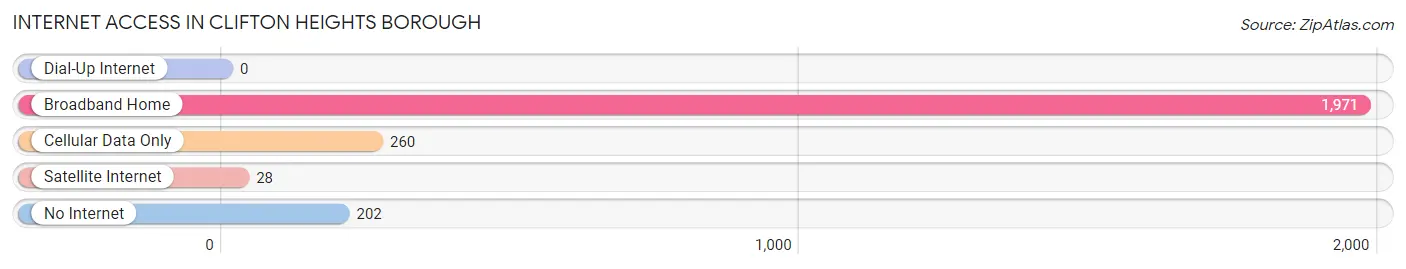
| Internet Type | # Households | % Households |
| Dial-Up Internet | 0 | 0.0% |
| Broadband Home | 1,971 | 81.0% |
| Cellular Data Only | 260 | 10.7% |
| Satellite Internet | 28 | 1.1% |
| No Internet | 202 | 8.3% |
| Total | 2,433 | 100.0% |
Clifton Heights borough Summary
Clifton Heights Borough is a small borough located in Delaware County, Pennsylvania. It is situated just west of the city of Philadelphia and is part of the Philadelphia metropolitan area. The borough is home to approximately 6,000 people and covers an area of 0.8 square miles.
History
Clifton Heights was originally part of the larger borough of Darby, which was established in 1682. In 1853, the area that is now Clifton Heights was separated from Darby and incorporated as its own borough. The name of the borough was chosen to honor the Clifton family, who were prominent landowners in the area.
The borough was primarily a rural area until the late 19th century, when the Pennsylvania Railroad began to expand its lines through the area. This led to an influx of new residents and businesses, and the borough began to develop into a more urbanized area.
In the early 20th century, the borough experienced a period of rapid growth. This was due in part to the construction of the Clifton Heights trolley line, which connected the borough to Philadelphia. The trolley line was eventually replaced by a bus line, which is still in operation today.
Geography
Clifton Heights is located in southeastern Pennsylvania, just west of the city of Philadelphia. It is situated in Delaware County, and is bordered by the boroughs of Darby, Lansdowne, and Upper Darby. The borough is located on the Delaware River, and is part of the Philadelphia metropolitan area.
The borough covers an area of 0.8 square miles, and is primarily composed of residential neighborhoods. The terrain is mostly flat, with some hills in the northern part of the borough. The climate is humid subtropical, with hot, humid summers and cold, wet winters.
Economy
Clifton Heights is primarily a residential borough, and the majority of its residents are employed in the service sector. The borough is home to several small businesses, including restaurants, retail stores, and professional services. The borough also has a few industrial sites, which are primarily used for light manufacturing.
The borough is served by the SEPTA bus and trolley lines, which provide access to Philadelphia and other nearby towns. The borough is also served by the Philadelphia International Airport, which is located just outside of the borough limits.
Demographics
As of the 2010 census, the population of Clifton Heights was 6,039. The racial makeup of the borough was 79.2% White, 14.2% African American, 0.3% Native American, 2.2% Asian, and 4.1% from other races. Hispanic or Latino of any race were 6.3% of the population.
The median household income in Clifton Heights was $45,945, and the median family income was $54,813. The per capita income was $22,845. About 11.2% of the population was below the poverty line.
Conclusion
Clifton Heights is a small borough located in Delaware County, Pennsylvania. It is situated just west of the city of Philadelphia and is part of the Philadelphia metropolitan area. The borough is home to approximately 6,000 people and covers an area of 0.8 square miles. The borough was originally part of the larger borough of Darby, and was incorporated as its own borough in 1853. The borough is primarily a residential area, and is served by the SEPTA bus and trolley lines. The population of Clifton Heights is primarily White, with a small African American and Asian population. The median household income in Clifton Heights is $45,945, and the per capita income is $22,845.
Common Questions
What is Per Capita Income in Clifton Heights borough?
Per Capita income in Clifton Heights borough is $26,866.
What is the Median Family Income in Clifton Heights borough?
Median Family Income in Clifton Heights borough is $67,850.
What is the Median Household income in Clifton Heights borough?
Median Household Income in Clifton Heights borough is $61,155.
What is Income or Wage Gap in Clifton Heights borough?
Income or Wage Gap in Clifton Heights borough is 16.5%.
Women in Clifton Heights borough earn 83.5 cents for every dollar earned by a man.
What is Inequality or Gini Index in Clifton Heights borough?
Inequality or Gini Index in Clifton Heights borough is 0.41.
What is the Total Population of Clifton Heights borough?
Total Population of Clifton Heights borough is 6,834.
What is the Total Male Population of Clifton Heights borough?
Total Male Population of Clifton Heights borough is 3,069.
What is the Total Female Population of Clifton Heights borough?
Total Female Population of Clifton Heights borough is 3,765.
What is the Ratio of Males per 100 Females in Clifton Heights borough?
There are 81.51 Males per 100 Females in Clifton Heights borough.
What is the Ratio of Females per 100 Males in Clifton Heights borough?
There are 122.68 Females per 100 Males in Clifton Heights borough.
What is the Median Population Age in Clifton Heights borough?
Median Population Age in Clifton Heights borough is 32.8 Years.
What is the Average Family Size in Clifton Heights borough
Average Family Size in Clifton Heights borough is 3.6 People.
What is the Average Household Size in Clifton Heights borough
Average Household Size in Clifton Heights borough is 2.8 People.
How Large is the Labor Force in Clifton Heights borough?
There are 3,390 People in the Labor Forcein in Clifton Heights borough.
What is the Percentage of People in the Labor Force in Clifton Heights borough?
63.1% of People are in the Labor Force in Clifton Heights borough.
What is the Unemployment Rate in Clifton Heights borough?
Unemployment Rate in Clifton Heights borough is 18.3%.