Seven Springs borough, PA Map & Demographics
Seven Springs borough Overview
$55,753
PER CAPITA INCOME
$41,250
AVG HOUSEHOLD INCOME
0.42
INEQUALITY / GINI INDEX
38
TOTAL POPULATION
13
MALE POPULATION
25
FEMALE POPULATION
52.00
MALES / 100 FEMALES
192.31
FEMALES / 100 MALES
29.0
MEDIAN AGE
2.0
AVG FAMILY SIZE
1.0
AVG HOUSEHOLD SIZE
32
LABOR FORCE [ PEOPLE ]
86.5%
PERCENT IN LABOR FORCE
Income in Seven Springs borough
Income Overview in Seven Springs borough
| Characteristic | Number | Measure |
| Per Capita Income | 38 | $55,753 |
| Median Family Income | 1 | $0 |
| Mean Family Income | 1 | $0 |
| Median Household Income | 34 | $41,250 |
| Mean Household Income | 34 | $62,312 |
| Income Deficit | 1 | $0 |
| Wage / Income Gap (%) | 38 | 0.00% |
| Wage / Income Gap ($) | 38 | 100.00¢ per $1 |
| Gini / Inequality Index | 38 | 0.42 |
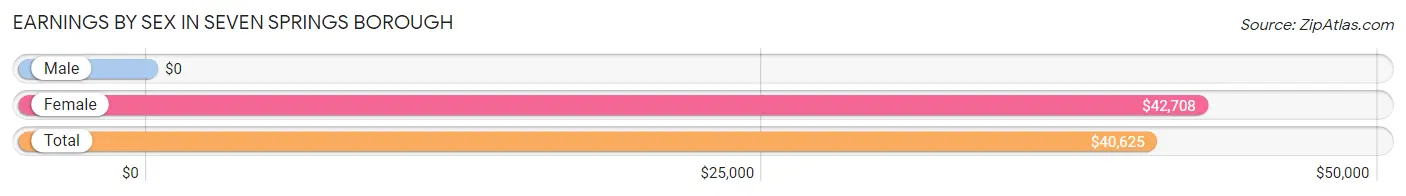
Earnings by Sex in Seven Springs borough
| Sex | Number | Average Earnings |
| Male | 11 (33.3%) | $0 |
| Female | 22 (66.7%) | $42,708 |
| Total | 33 (100.0%) | $40,625 |
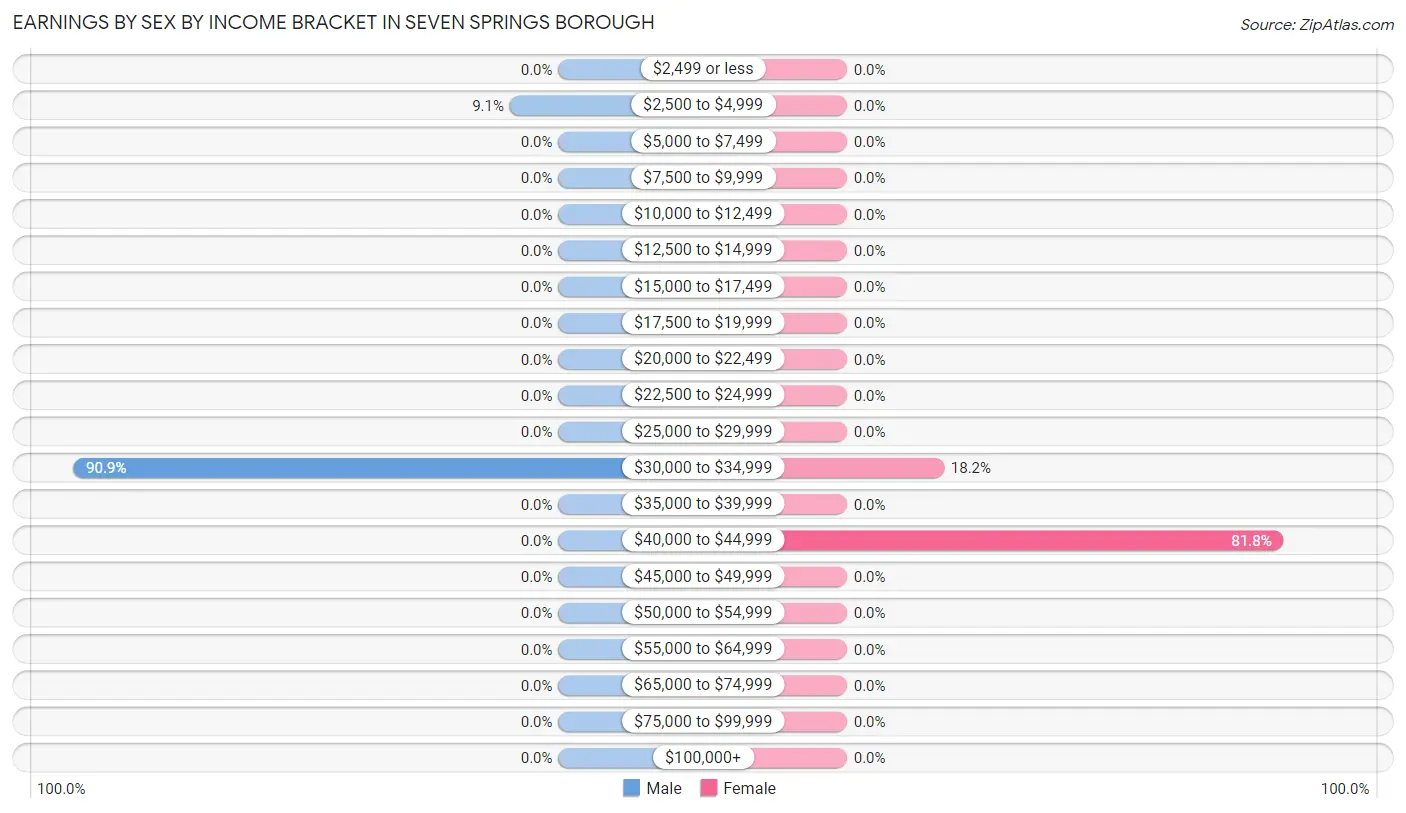
Earnings by Sex by Income Bracket in Seven Springs borough
The most common earnings brackets in Seven Springs borough are $30,000 to $34,999 for men (10 | 90.9%) and $40,000 to $44,999 for women (18 | 81.8%).
| Income | Male | Female |
| $2,499 or less | 0 (0.0%) | 0 (0.0%) |
| $2,500 to $4,999 | 1 (9.1%) | 0 (0.0%) |
| $5,000 to $7,499 | 0 (0.0%) | 0 (0.0%) |
| $7,500 to $9,999 | 0 (0.0%) | 0 (0.0%) |
| $10,000 to $12,499 | 0 (0.0%) | 0 (0.0%) |
| $12,500 to $14,999 | 0 (0.0%) | 0 (0.0%) |
| $15,000 to $17,499 | 0 (0.0%) | 0 (0.0%) |
| $17,500 to $19,999 | 0 (0.0%) | 0 (0.0%) |
| $20,000 to $22,499 | 0 (0.0%) | 0 (0.0%) |
| $22,500 to $24,999 | 0 (0.0%) | 0 (0.0%) |
| $25,000 to $29,999 | 0 (0.0%) | 0 (0.0%) |
| $30,000 to $34,999 | 10 (90.9%) | 4 (18.2%) |
| $35,000 to $39,999 | 0 (0.0%) | 0 (0.0%) |
| $40,000 to $44,999 | 0 (0.0%) | 18 (81.8%) |
| $45,000 to $49,999 | 0 (0.0%) | 0 (0.0%) |
| $50,000 to $54,999 | 0 (0.0%) | 0 (0.0%) |
| $55,000 to $64,999 | 0 (0.0%) | 0 (0.0%) |
| $65,000 to $74,999 | 0 (0.0%) | 0 (0.0%) |
| $75,000 to $99,999 | 0 (0.0%) | 0 (0.0%) |
| $100,000+ | 0 (0.0%) | 0 (0.0%) |
| Total | 11 (100.0%) | 22 (100.0%) |
Earnings by Sex by Educational Attainment in Seven Springs borough
| Educational Attainment | Male Income | Female Income |
| Less than High School | - | - |
| High School Diploma | - | - |
| College or Associate's Degree | - | - |
| Bachelor's Degree | - | - |
| Graduate Degree | - | - |
| Total | - | - |
Family Income in Seven Springs borough
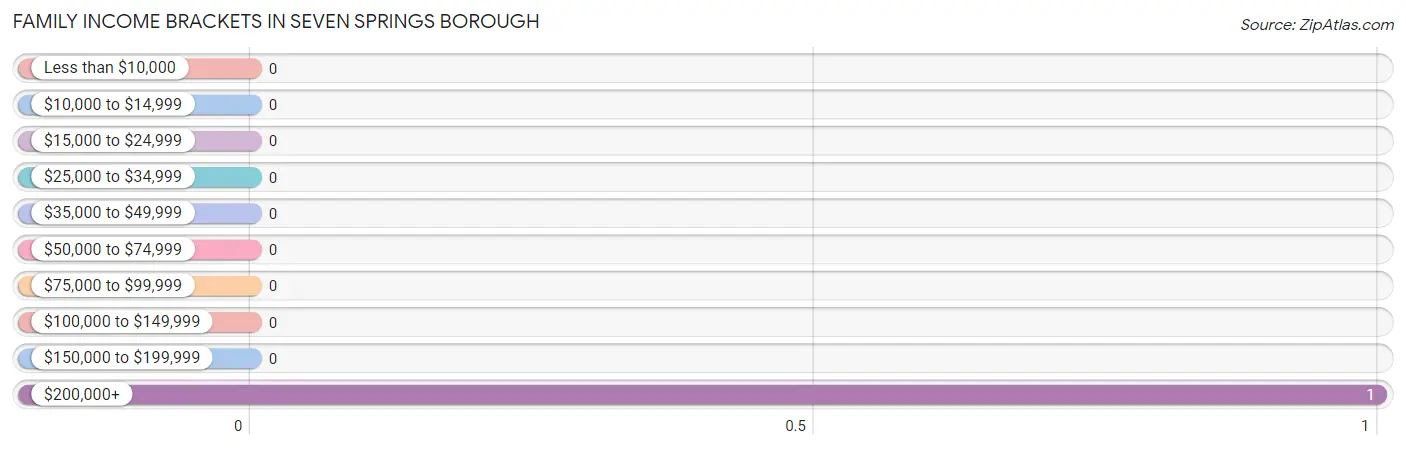
Family Income Brackets in Seven Springs borough
According to the Seven Springs borough family income data, there are 1 families falling into the $200,000+ income range, which is the most common income bracket and makes up 100.0% of all families.
| Income Bracket | # Families | % Families |
| Less than $10,000 | 0 | 0.0% |
| $10,000 to $14,999 | 0 | 0.0% |
| $15,000 to $24,999 | 0 | 0.0% |
| $25,000 to $34,999 | 0 | 0.0% |
| $35,000 to $49,999 | 0 | 0.0% |
| $50,000 to $74,999 | 0 | 0.0% |
| $75,000 to $99,999 | 0 | 0.0% |
| $100,000 to $149,999 | 0 | 0.0% |
| $150,000 to $199,999 | 0 | 0.0% |
| $200,000+ | 1 | 100.0% |
Family Income by Famaliy Size in Seven Springs borough
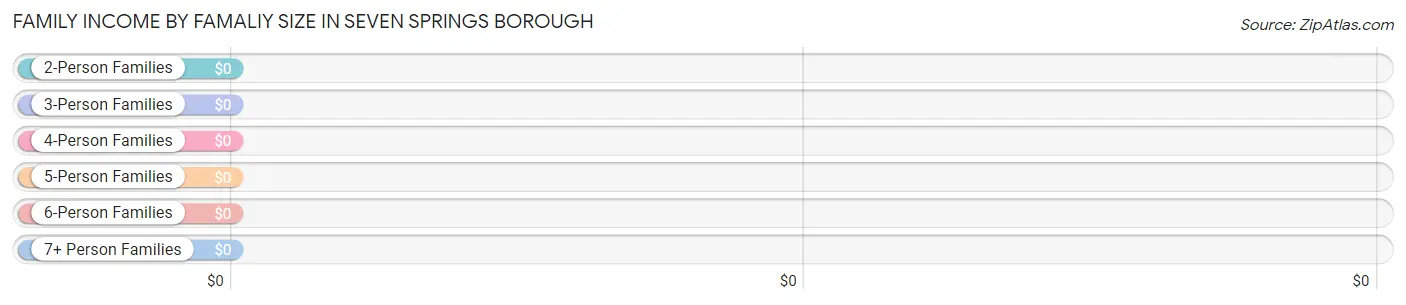
| Income Bracket | # Families | Median Income |
| 2-Person Families | 1 (100.0%) | $0 |
| 3-Person Families | 0 (0.0%) | $0 |
| 4-Person Families | 0 (0.0%) | $0 |
| 5-Person Families | 0 (0.0%) | $0 |
| 6-Person Families | 0 (0.0%) | $0 |
| 7+ Person Families | 0 (0.0%) | $0 |
| Total | 1 (100.0%) | $0 |
Family Income by Number of Earners in Seven Springs borough
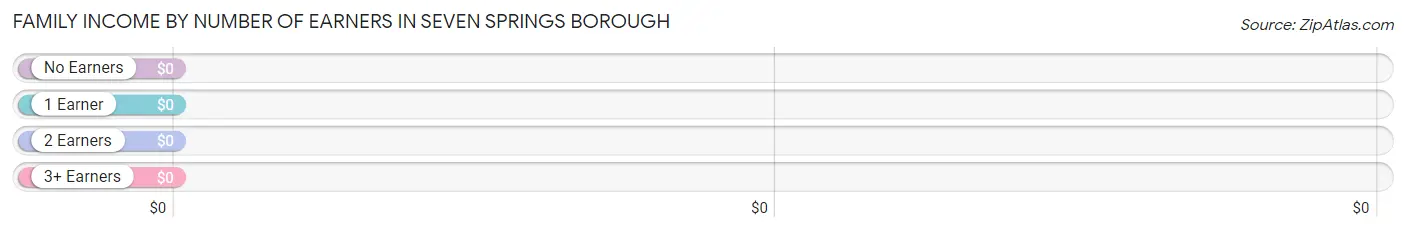
| Number of Earners | # Families | Median Income |
| No Earners | 1 (100.0%) | $0 |
| 1 Earner | 0 (0.0%) | $0 |
| 2 Earners | 0 (0.0%) | $0 |
| 3+ Earners | 0 (0.0%) | $0 |
| Total | 1 (100.0%) | $0 |
Household Income in Seven Springs borough
Household Income Brackets in Seven Springs borough
With 18 households falling in the category, the $35,000 to $49,999 income range is the most frequent in Seven Springs borough, accounting for 52.9% of all households.
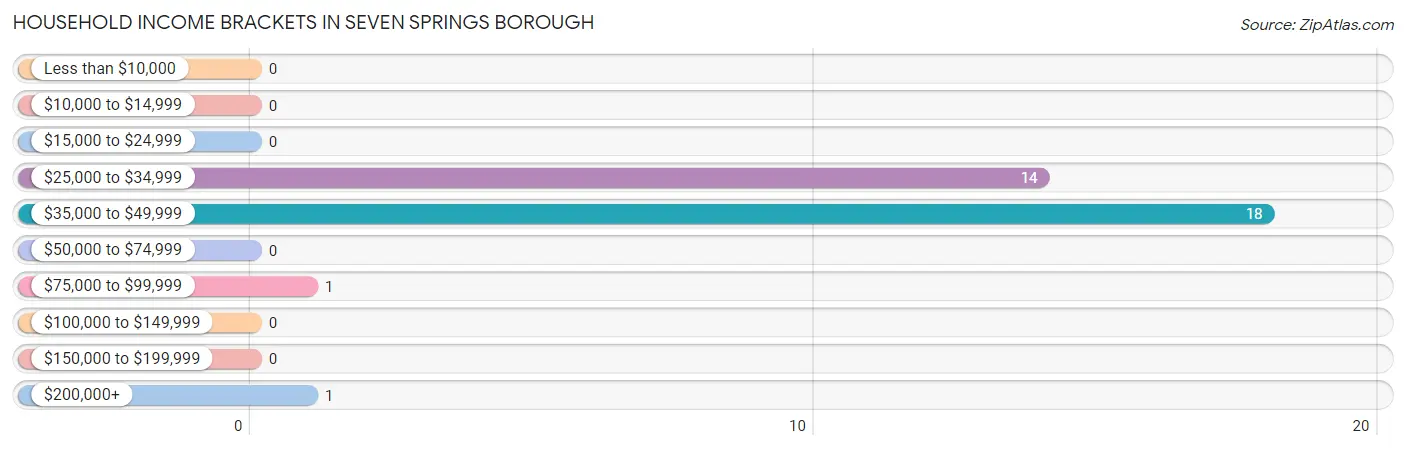
| Income Bracket | # Households | % Households |
| Less than $10,000 | 0 | 0.0% |
| $10,000 to $14,999 | 0 | 0.0% |
| $15,000 to $24,999 | 0 | 0.0% |
| $25,000 to $34,999 | 14 | 41.2% |
| $35,000 to $49,999 | 18 | 52.9% |
| $50,000 to $74,999 | 0 | 0.0% |
| $75,000 to $99,999 | 1 | 2.9% |
| $100,000 to $149,999 | 0 | 0.0% |
| $150,000 to $199,999 | 0 | 0.0% |
| $200,000+ | 1 | 2.9% |
Household Income by Householder Age in Seven Springs borough
The median household income in Seven Springs borough is $41,250, with the highest median household income of $34,375 found in the 25 to 44 years age bracket for the primary householder. A total of 26 households (76.5%) fall into this category. Meanwhile, the 15 to 24 years age bracket for the primary householder has the lowest median household income of $0, with 6 households (17.6%) in this group.
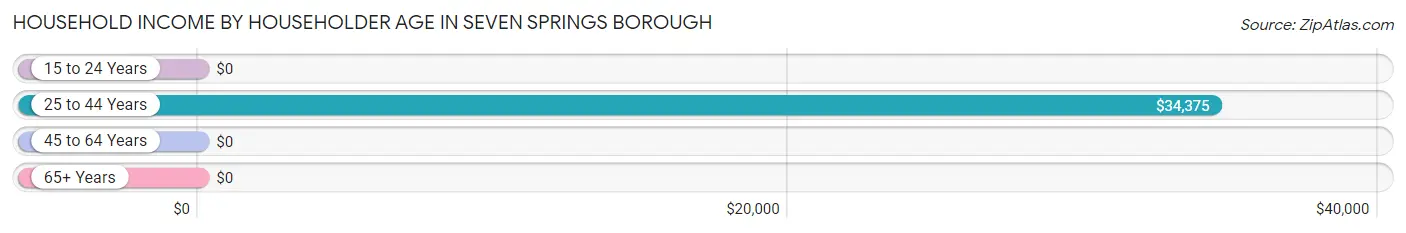
| Income Bracket | # Households | Median Income |
| 15 to 24 Years | 6 (17.6%) | $0 |
| 25 to 44 Years | 26 (76.5%) | $34,375 |
| 45 to 64 Years | 1 (2.9%) | $0 |
| 65+ Years | 1 (2.9%) | $0 |
| Total | 34 (100.0%) | $41,250 |
Poverty in Seven Springs borough
Income Below Poverty by Sex and Age in Seven Springs borough
With 7.7% poverty level for males and 4.2% for females among the residents of Seven Springs borough, 25 to 34 year old males and 45 to 54 year old females are the most vulnerable to poverty, with 1 males (9.1%) and 1 females (100.0%) in their respective age groups living below the poverty level.
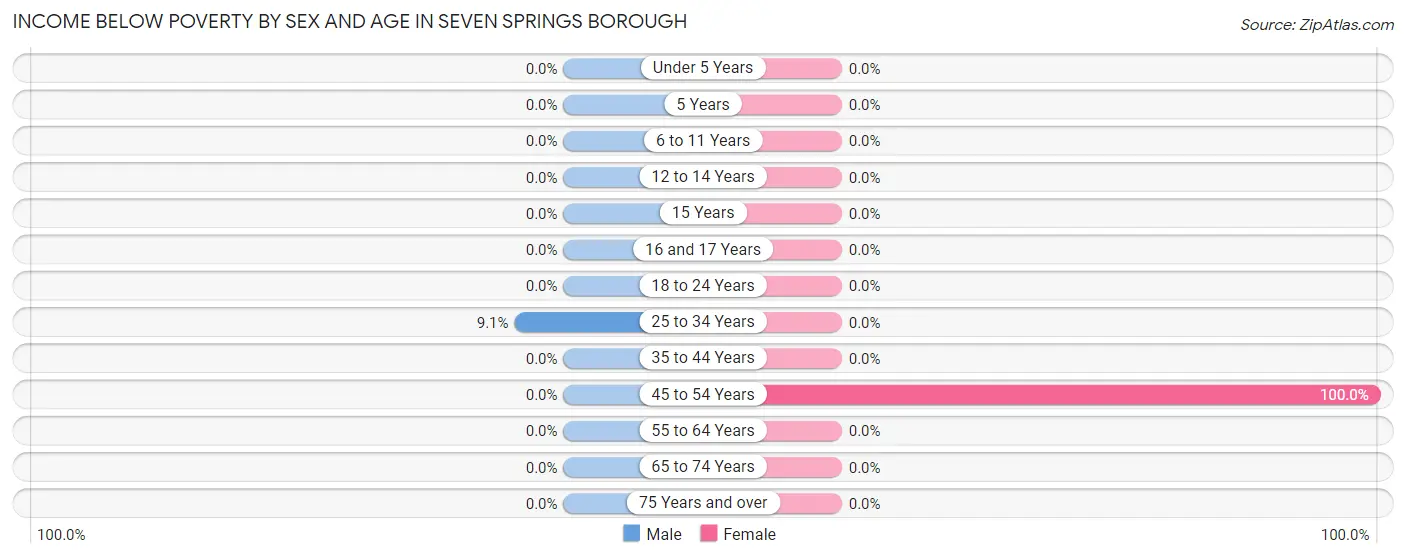
| Age Bracket | Male | Female |
| Under 5 Years | 0 (0.0%) | 0 (0.0%) |
| 5 Years | 0 (0.0%) | 0 (0.0%) |
| 6 to 11 Years | 0 (0.0%) | 0 (0.0%) |
| 12 to 14 Years | 0 (0.0%) | 0 (0.0%) |
| 15 Years | 0 (0.0%) | 0 (0.0%) |
| 16 and 17 Years | 0 (0.0%) | 0 (0.0%) |
| 18 to 24 Years | 0 (0.0%) | 0 (0.0%) |
| 25 to 34 Years | 1 (9.1%) | 0 (0.0%) |
| 35 to 44 Years | 0 (0.0%) | 0 (0.0%) |
| 45 to 54 Years | 0 (0.0%) | 1 (100.0%) |
| 55 to 64 Years | 0 (0.0%) | 0 (0.0%) |
| 65 to 74 Years | 0 (0.0%) | 0 (0.0%) |
| 75 Years and over | 0 (0.0%) | 0 (0.0%) |
| Total | 1 (7.7%) | 1 (4.2%) |
Income Above Poverty by Sex and Age in Seven Springs borough
According to the poverty statistics in Seven Springs borough, males aged 55 to 64 years and females aged 18 to 24 years are the age groups that are most secure financially, with 100.0% of males and 100.0% of females in these age groups living above the poverty line.
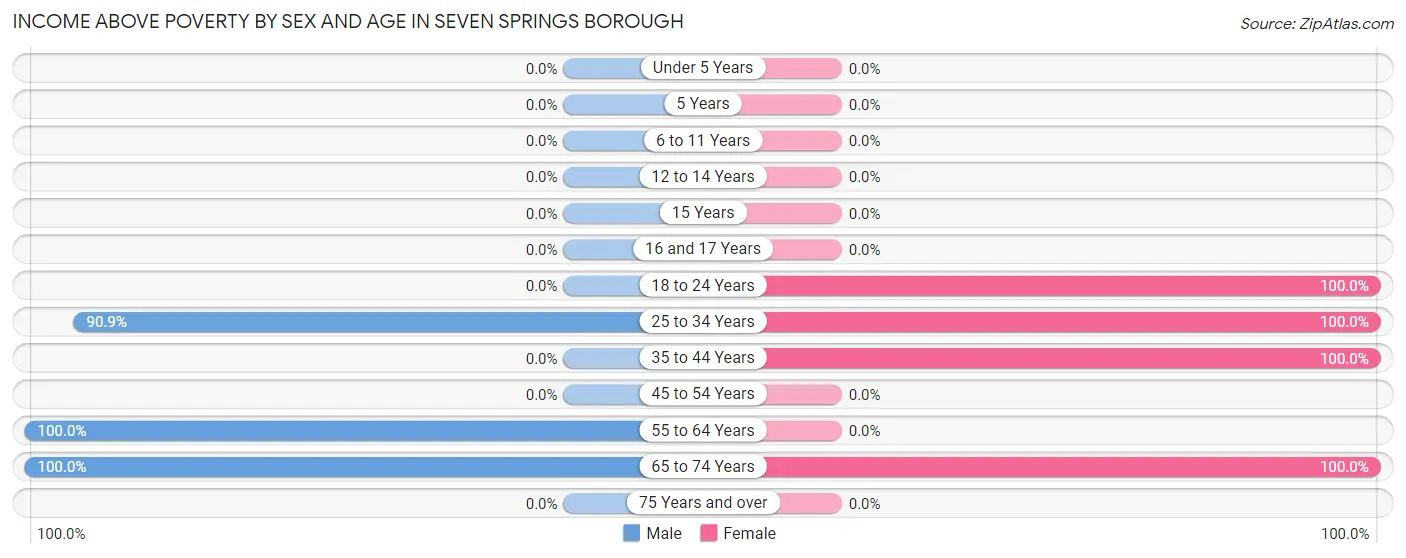
| Age Bracket | Male | Female |
| Under 5 Years | 0 (0.0%) | 0 (0.0%) |
| 5 Years | 0 (0.0%) | 0 (0.0%) |
| 6 to 11 Years | 0 (0.0%) | 0 (0.0%) |
| 12 to 14 Years | 0 (0.0%) | 0 (0.0%) |
| 15 Years | 0 (0.0%) | 0 (0.0%) |
| 16 and 17 Years | 0 (0.0%) | 0 (0.0%) |
| 18 to 24 Years | 0 (0.0%) | 6 (100.0%) |
| 25 to 34 Years | 10 (90.9%) | 12 (100.0%) |
| 35 to 44 Years | 0 (0.0%) | 4 (100.0%) |
| 45 to 54 Years | 0 (0.0%) | 0 (0.0%) |
| 55 to 64 Years | 1 (100.0%) | 0 (0.0%) |
| 65 to 74 Years | 1 (100.0%) | 1 (100.0%) |
| 75 Years and over | 0 (0.0%) | 0 (0.0%) |
| Total | 12 (92.3%) | 23 (95.8%) |
Income Below Poverty Among Married-Couple Families in Seven Springs borough
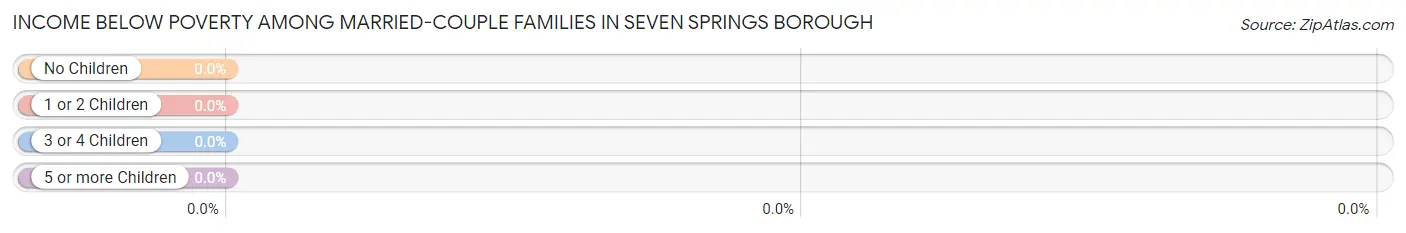
| Children | Above Poverty | Below Poverty |
| No Children | 1 (100.0%) | 0 (0.0%) |
| 1 or 2 Children | 0 (0.0%) | 0 (0.0%) |
| 3 or 4 Children | 0 (0.0%) | 0 (0.0%) |
| 5 or more Children | 0 (0.0%) | 0 (0.0%) |
| Total | 1 (100.0%) | 0 (0.0%) |
Income Below Poverty Among Single-Parent Households in Seven Springs borough
| Children | Single Father | Single Mother |
| No Children | 0 (0.0%) | 0 (0.0%) |
| 1 or 2 Children | 0 (0.0%) | 0 (0.0%) |
| 3 or 4 Children | 0 (0.0%) | 0 (0.0%) |
| 5 or more Children | 0 (0.0%) | 0 (0.0%) |
| Total | 0 (0.0%) | 0 (0.0%) |
Income Below Poverty Among Married-Couple vs Single-Parent Households in Seven Springs borough
| Children | Married-Couple Families | Single-Parent Households |
| No Children | 0 (0.0%) | 0 (0.0%) |
| 1 or 2 Children | 0 (0.0%) | 0 (0.0%) |
| 3 or 4 Children | 0 (0.0%) | 0 (0.0%) |
| 5 or more Children | 0 (0.0%) | 0 (0.0%) |
| Total | 0 (0.0%) | 0 (0.0%) |
Race in Seven Springs borough
The most populous races in Seven Springs borough are White / Caucasian (22 | 57.9%), and Two or more Races (16 | 42.1%).
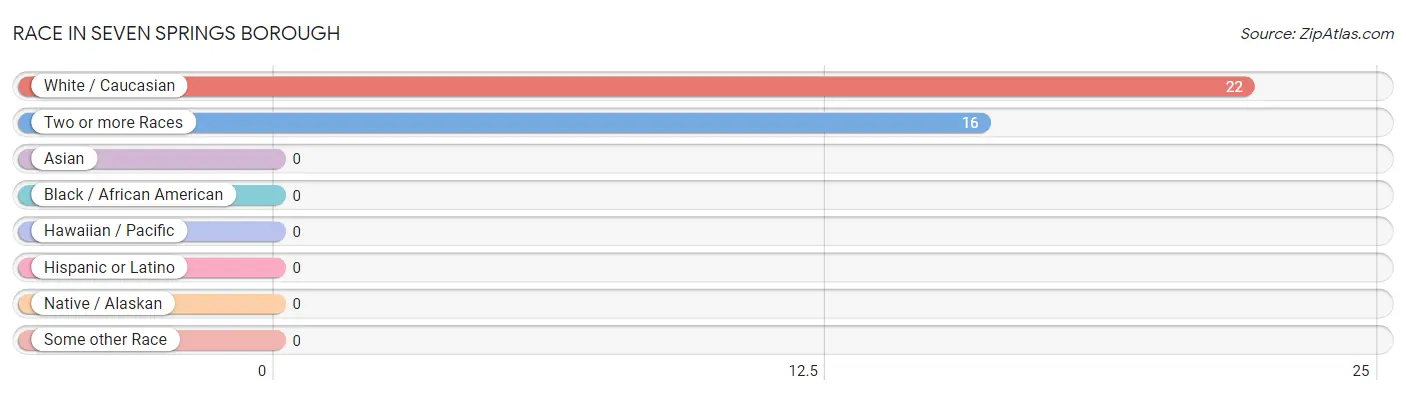
| Race | # Population | % Population |
| Asian | 0 | 0.0% |
| Black / African American | 0 | 0.0% |
| Hawaiian / Pacific | 0 | 0.0% |
| Hispanic or Latino | 0 | 0.0% |
| Native / Alaskan | 0 | 0.0% |
| White / Caucasian | 22 | 57.9% |
| Two or more Races | 16 | 42.1% |
| Some other Race | 0 | 0.0% |
| Total | 38 | 100.0% |
Ancestry in Seven Springs borough
The most populous ancestries reported in Seven Springs borough are American (12 | 31.6%), Burmese (10 | 26.3%), Cherokee (10 | 26.3%), French (10 | 26.3%), and Irish (10 | 26.3%), together accounting for 136.9% of all Seven Springs borough residents.
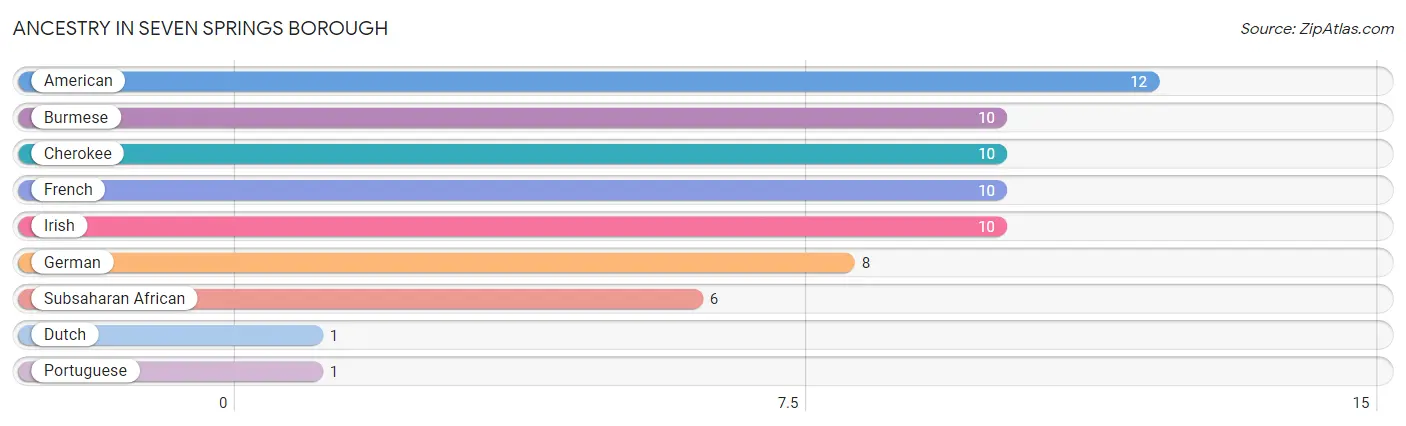
| Ancestry | # Population | % Population |
| American | 12 | 31.6% |
| Burmese | 10 | 26.3% |
| Cherokee | 10 | 26.3% |
| Dutch | 1 | 2.6% |
| French | 10 | 26.3% |
| German | 8 | 21.0% |
| Irish | 10 | 26.3% |
| Portuguese | 1 | 2.6% |
| Subsaharan African | 6 | 15.8% | View All 9 Rows |
Immigrants in Seven Springs borough

| Immigration Origin | # Population | % Population | View All 0 Rows |
Sex and Age in Seven Springs borough
Sex and Age in Seven Springs borough
The most populous age groups in Seven Springs borough are 25 to 29 Years (10 | 76.9%) for men and 25 to 29 Years (12 | 48.0%) for women.
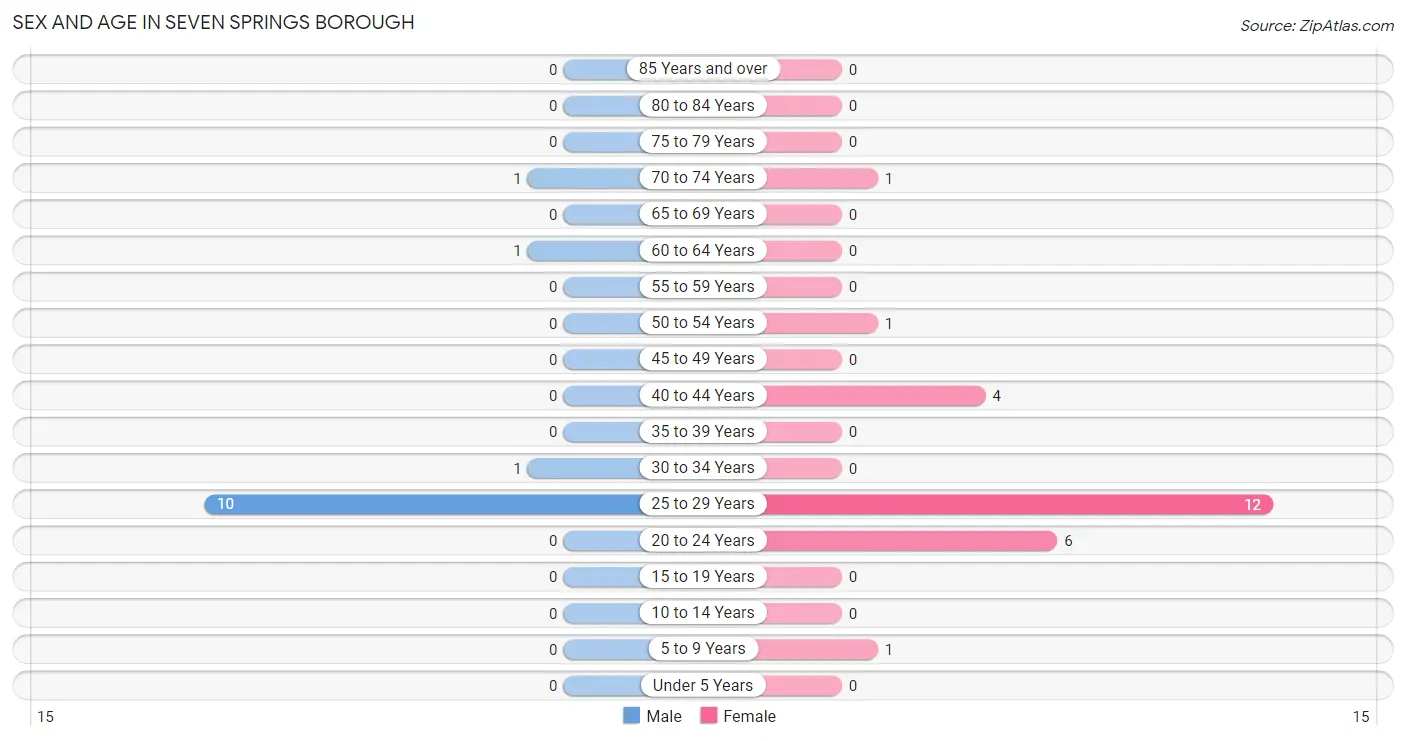
| Age Bracket | Male | Female |
| Under 5 Years | 0 (0.0%) | 0 (0.0%) |
| 5 to 9 Years | 0 (0.0%) | 1 (4.0%) |
| 10 to 14 Years | 0 (0.0%) | 0 (0.0%) |
| 15 to 19 Years | 0 (0.0%) | 0 (0.0%) |
| 20 to 24 Years | 0 (0.0%) | 6 (24.0%) |
| 25 to 29 Years | 10 (76.9%) | 12 (48.0%) |
| 30 to 34 Years | 1 (7.7%) | 0 (0.0%) |
| 35 to 39 Years | 0 (0.0%) | 0 (0.0%) |
| 40 to 44 Years | 0 (0.0%) | 4 (16.0%) |
| 45 to 49 Years | 0 (0.0%) | 0 (0.0%) |
| 50 to 54 Years | 0 (0.0%) | 1 (4.0%) |
| 55 to 59 Years | 0 (0.0%) | 0 (0.0%) |
| 60 to 64 Years | 1 (7.7%) | 0 (0.0%) |
| 65 to 69 Years | 0 (0.0%) | 0 (0.0%) |
| 70 to 74 Years | 1 (7.7%) | 1 (4.0%) |
| 75 to 79 Years | 0 (0.0%) | 0 (0.0%) |
| 80 to 84 Years | 0 (0.0%) | 0 (0.0%) |
| 85 Years and over | 0 (0.0%) | 0 (0.0%) |
| Total | 13 (100.0%) | 25 (100.0%) |
Families and Households in Seven Springs borough
Median Family Size in Seven Springs borough
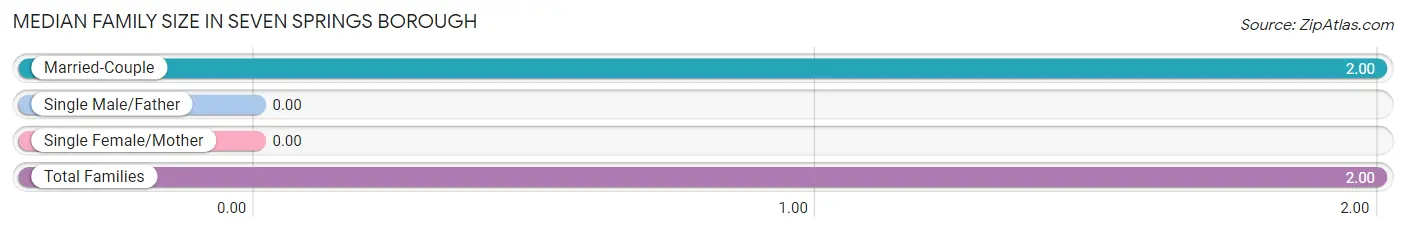
| Family Type | # Families | Family Size |
| Married-Couple | 1 (100.0%) | 2.00 |
| Single Male/Father | 0 (0.0%) | - |
| Single Female/Mother | 0 (0.0%) | - |
| Total Families | 1 (100.0%) | 2.00 |
Median Household Size in Seven Springs borough
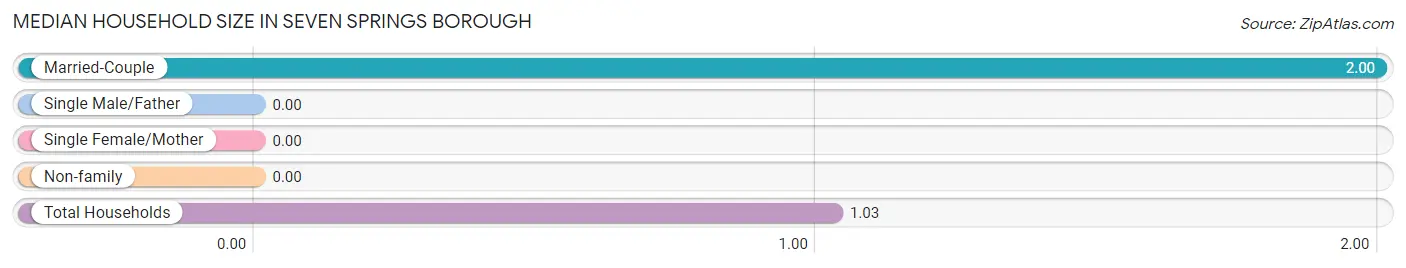
| Household Type | # Households | Household Size |
| Married-Couple | 1 (2.9%) | 2.00 |
| Single Male/Father | 0 (0.0%) | - |
| Single Female/Mother | 0 (0.0%) | - |
| Non-family | 33 (97.1%) | - |
| Total Households | 34 (100.0%) | 1.03 |
Household Size by Marriage Status in Seven Springs borough
Out of a total of 34 households in Seven Springs borough, 1 (2.9%) are family households, while 33 (97.1%) are nonfamily households. The most numerous type of family households are 2-person households, comprising 1, and the most common type of nonfamily households are 1-person households, comprising 33.
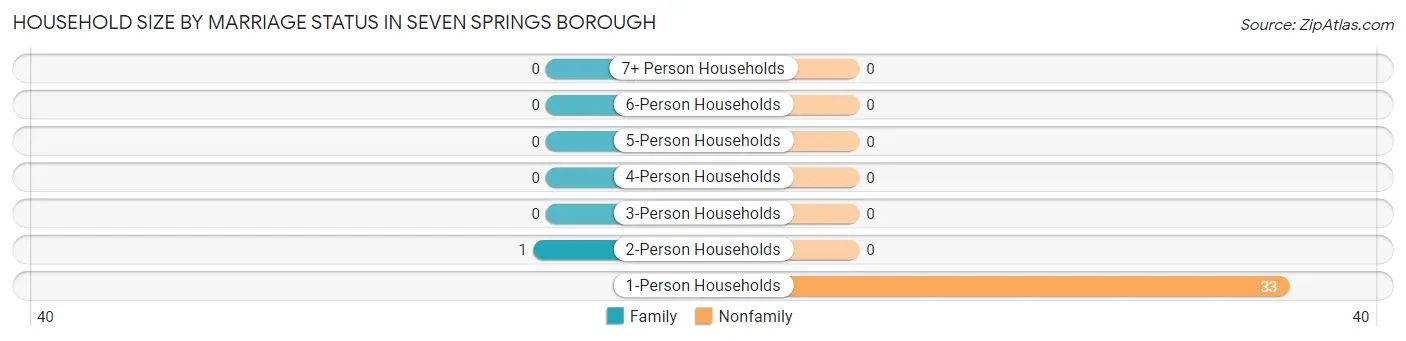
| Household Size | Family Households | Nonfamily Households |
| 1-Person Households | - | 33 (97.1%) |
| 2-Person Households | 1 (2.9%) | 0 (0.0%) |
| 3-Person Households | 0 (0.0%) | 0 (0.0%) |
| 4-Person Households | 0 (0.0%) | 0 (0.0%) |
| 5-Person Households | 0 (0.0%) | 0 (0.0%) |
| 6-Person Households | 0 (0.0%) | 0 (0.0%) |
| 7+ Person Households | 0 (0.0%) | 0 (0.0%) |
| Total | 1 (2.9%) | 33 (97.1%) |
Female Fertility in Seven Springs borough
Fertility by Age in Seven Springs borough
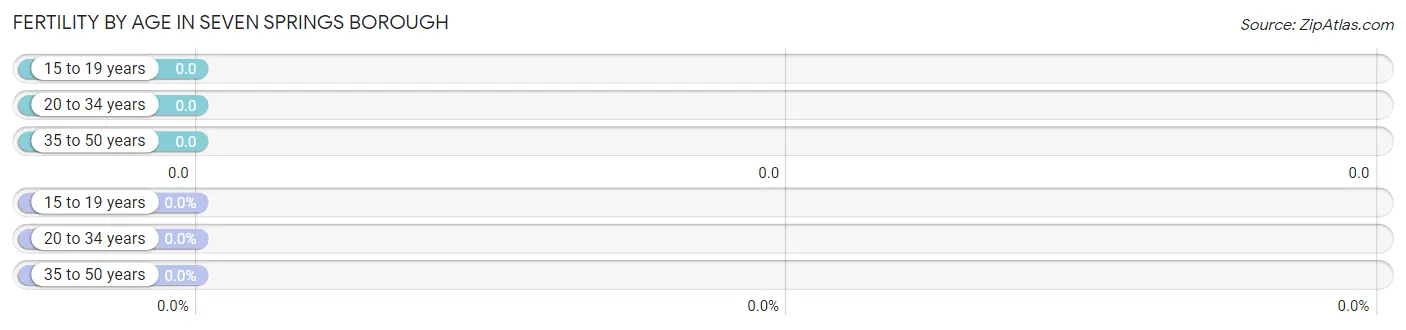
| Age Bracket | Women with Births | Births / 1,000 Women |
| 15 to 19 years | 0 (0.0%) | 0.0 |
| 20 to 34 years | 0 (0.0%) | 0.0 |
| 35 to 50 years | 0 (0.0%) | 0.0 |
| Total | 0 (0.0%) | 0.0 |
Fertility by Age by Marriage Status in Seven Springs borough
| Age Bracket | Married | Unmarried |
| 15 to 19 years | 0 (0.0%) | 0 (0.0%) |
| 20 to 34 years | 0 (0.0%) | 0 (0.0%) |
| 35 to 50 years | 0 (0.0%) | 0 (0.0%) |
| Total | 0 (0.0%) | 0 (0.0%) |
Fertility by Education in Seven Springs borough
| Educational Attainment | Women with Births | Births / 1,000 Women |
| Less than High School | 0 (0.0%) | 0.0 |
| High School Diploma | 0 (0.0%) | 0.0 |
| College or Associate's Degree | 0 (0.0%) | 0.0 |
| Bachelor's Degree | 0 (0.0%) | 0.0 |
| Graduate Degree | 0 (0.0%) | 0.0 |
| Total | 0 (0.0%) | 0.0 |
Fertility by Education by Marriage Status in Seven Springs borough
| Educational Attainment | Married | Unmarried |
| Less than High School | 0 (0.0%) | 0 (0.0%) |
| High School Diploma | 0 (0.0%) | 0 (0.0%) |
| College or Associate's Degree | 0 (0.0%) | 0 (0.0%) |
| Bachelor's Degree | 0 (0.0%) | 0 (0.0%) |
| Graduate Degree | 0 (0.0%) | 0 (0.0%) |
| Total | 0 (0.0%) | 0 (0.0%) |
Employment Characteristics in Seven Springs borough
Employment by Class of Employer in Seven Springs borough
Among the 32 employed individuals in Seven Springs borough, , and private company employees (32 | 100.0%) make up the most common classes of employment.
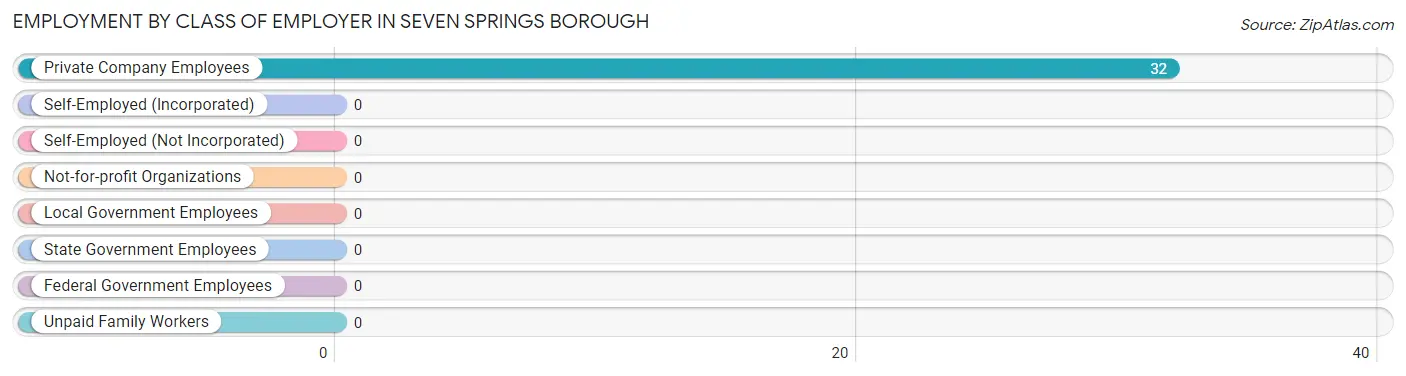
| Employer Class | # Employees | % Employees |
| Private Company Employees | 32 | 100.0% |
| Self-Employed (Incorporated) | 0 | 0.0% |
| Self-Employed (Not Incorporated) | 0 | 0.0% |
| Not-for-profit Organizations | 0 | 0.0% |
| Local Government Employees | 0 | 0.0% |
| State Government Employees | 0 | 0.0% |
| Federal Government Employees | 0 | 0.0% |
| Unpaid Family Workers | 0 | 0.0% |
| Total | 32 | 100.0% |
Employment Status by Age in Seven Springs borough
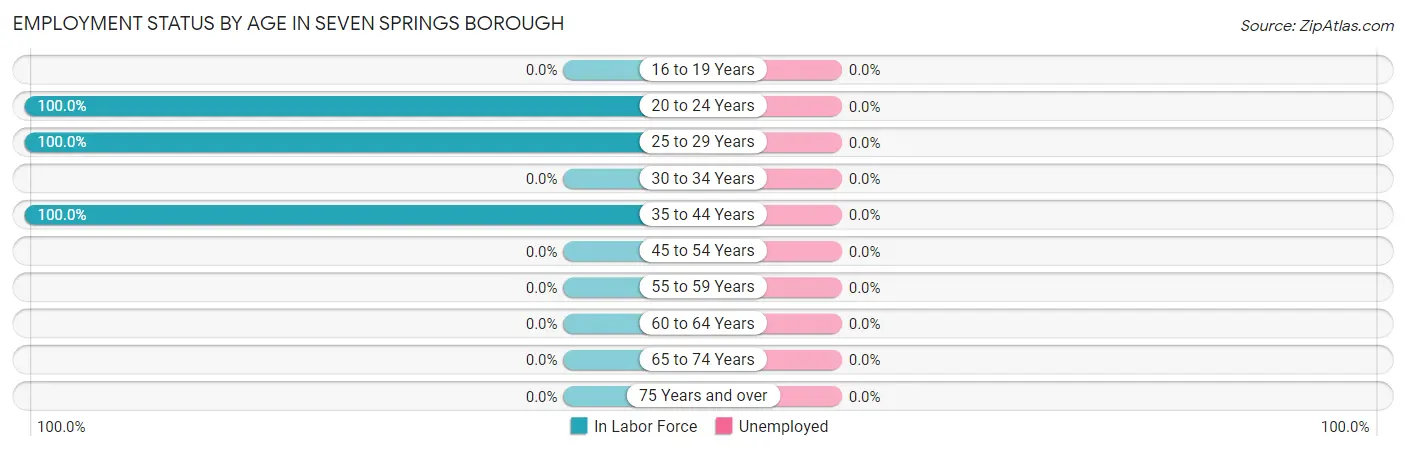
| Age Bracket | In Labor Force | Unemployed |
| 16 to 19 Years | 0 (0.0%) | 0 (0.0%) |
| 20 to 24 Years | 6 (100.0%) | 0 (0.0%) |
| 25 to 29 Years | 22 (100.0%) | 0 (0.0%) |
| 30 to 34 Years | 0 (0.0%) | 0 (0.0%) |
| 35 to 44 Years | 4 (100.0%) | 0 (0.0%) |
| 45 to 54 Years | 0 (0.0%) | 0 (0.0%) |
| 55 to 59 Years | 0 (0.0%) | 0 (0.0%) |
| 60 to 64 Years | 0 (0.0%) | 0 (0.0%) |
| 65 to 74 Years | 0 (0.0%) | 0 (0.0%) |
| 75 Years and over | 0 (0.0%) | 0 (0.0%) |
| Total | 32 (86.5%) | 0 (0.0%) |
Employment Status by Educational Attainment in Seven Springs borough
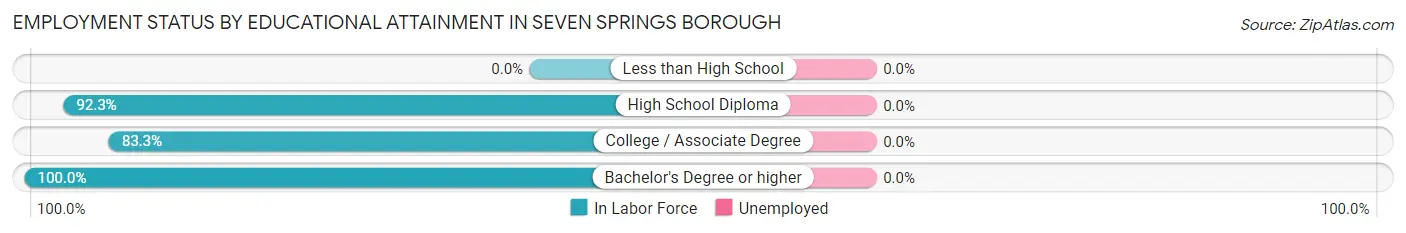
| Educational Attainment | In Labor Force | Unemployed |
| Less than High School | 0 (0.0%) | 0 (0.0%) |
| High School Diploma | 12 (92.3%) | 0 (0.0%) |
| College / Associate Degree | 10 (83.3%) | 0 (0.0%) |
| Bachelor's Degree or higher | 4 (100.0%) | 0 (0.0%) |
| Total | 26 (89.7%) | 0 (0.0%) |
Employment Occupations by Sex in Seven Springs borough
Management, Business, Science and Arts Occupations
The most common Management, Business, Science and Arts occupations in Seven Springs borough are , and Business & Financial (10 | 31.2%).
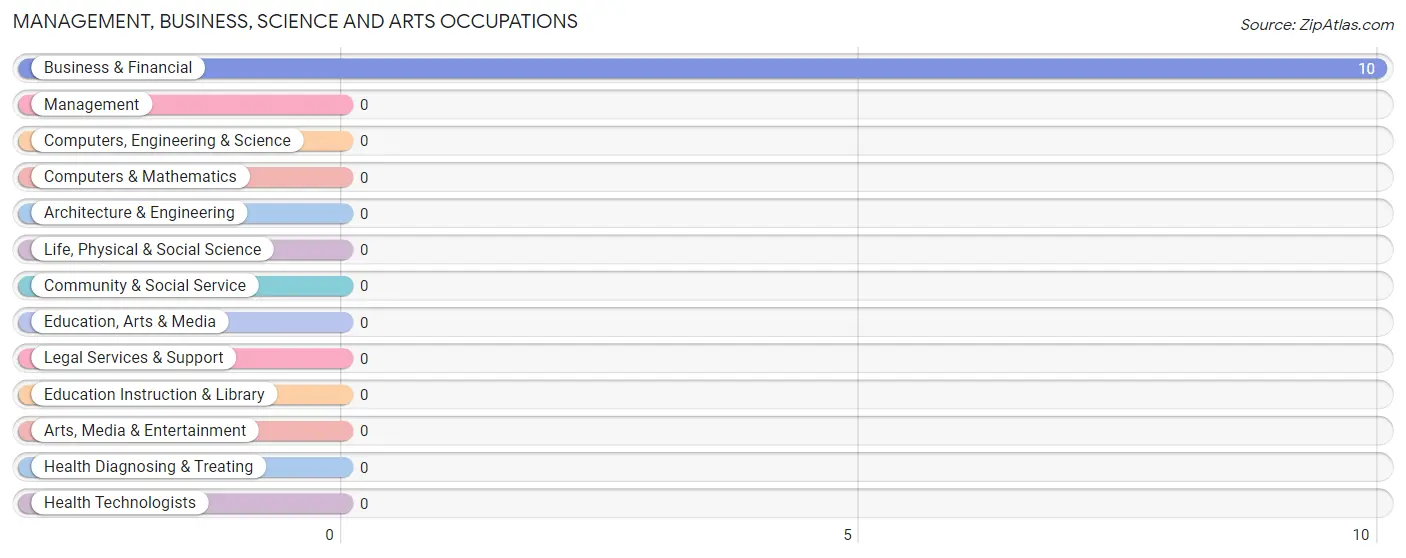
Management, Business, Science and Arts Occupations by Sex
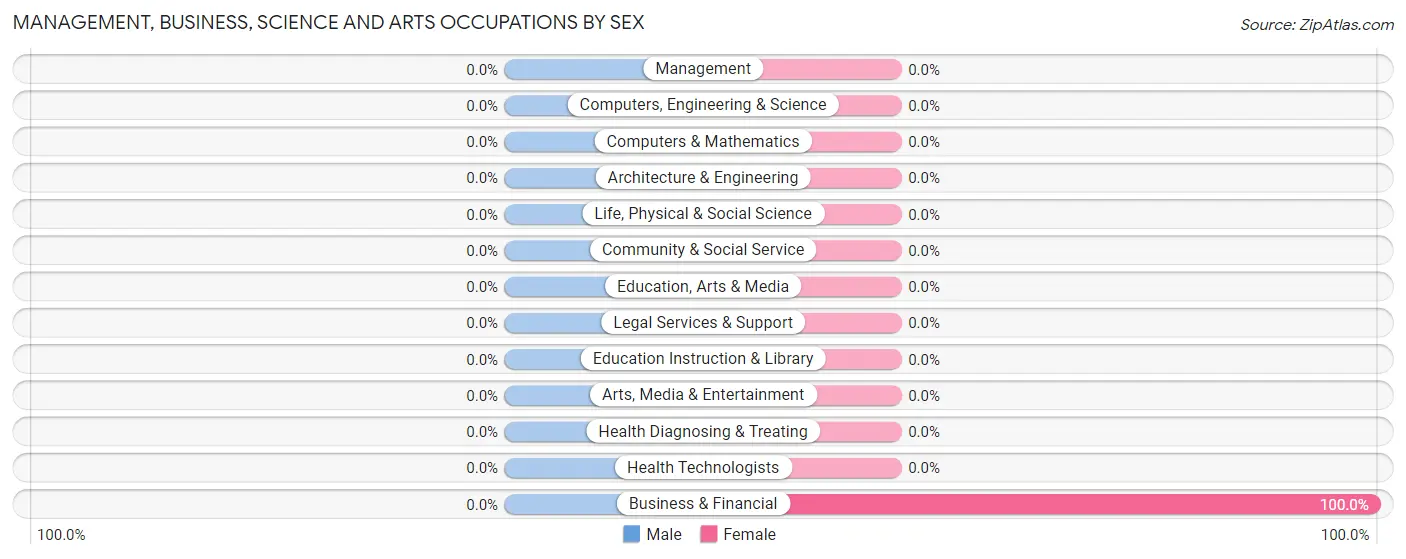
| Occupation | Male | Female |
| Management | 0 (0.0%) | 0 (0.0%) |
| Business & Financial | 0 (0.0%) | 10 (100.0%) |
| Computers, Engineering & Science | 0 (0.0%) | 0 (0.0%) |
| Computers & Mathematics | 0 (0.0%) | 0 (0.0%) |
| Architecture & Engineering | 0 (0.0%) | 0 (0.0%) |
| Life, Physical & Social Science | 0 (0.0%) | 0 (0.0%) |
| Community & Social Service | 0 (0.0%) | 0 (0.0%) |
| Education, Arts & Media | 0 (0.0%) | 0 (0.0%) |
| Legal Services & Support | 0 (0.0%) | 0 (0.0%) |
| Education Instruction & Library | 0 (0.0%) | 0 (0.0%) |
| Arts, Media & Entertainment | 0 (0.0%) | 0 (0.0%) |
| Health Diagnosing & Treating | 0 (0.0%) | 0 (0.0%) |
| Health Technologists | 0 (0.0%) | 0 (0.0%) |
| Total (Category) | 0 (0.0%) | 10 (100.0%) |
| Total (Overall) | 10 (31.2%) | 22 (68.8%) |
Services Occupations
The most common Services occupations in Seven Springs borough are , and Personal Care & Service (10 | 31.2%).
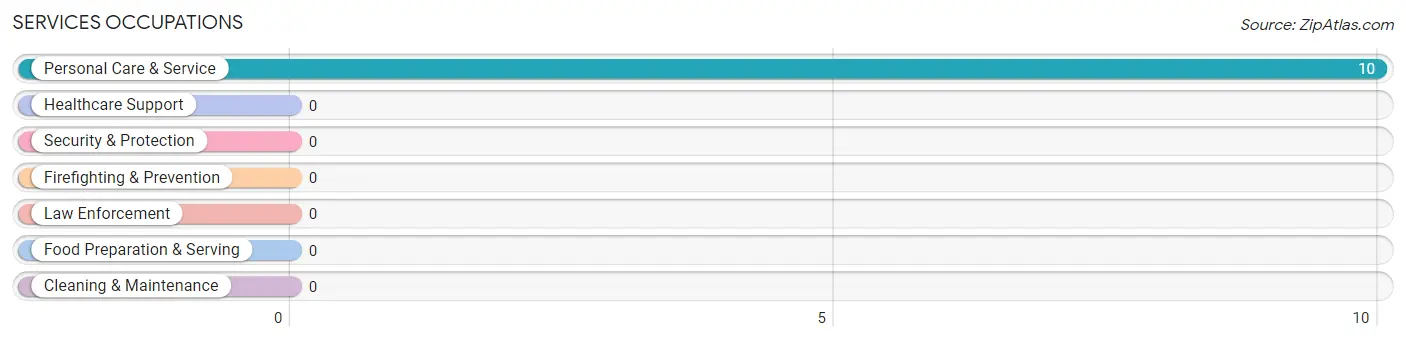
Services Occupations by Sex
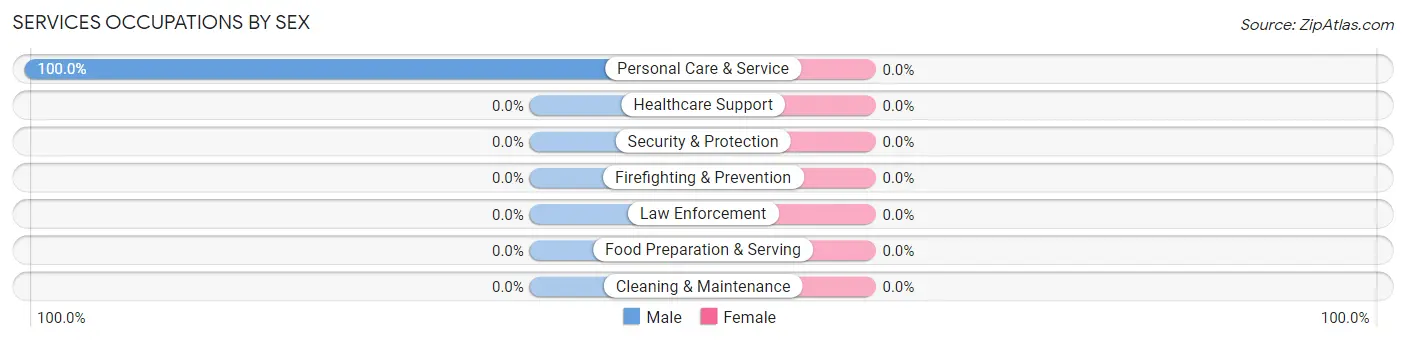
| Occupation | Male | Female |
| Healthcare Support | 0 (0.0%) | 0 (0.0%) |
| Security & Protection | 0 (0.0%) | 0 (0.0%) |
| Firefighting & Prevention | 0 (0.0%) | 0 (0.0%) |
| Law Enforcement | 0 (0.0%) | 0 (0.0%) |
| Food Preparation & Serving | 0 (0.0%) | 0 (0.0%) |
| Cleaning & Maintenance | 0 (0.0%) | 0 (0.0%) |
| Personal Care & Service | 10 (100.0%) | 0 (0.0%) |
| Total (Category) | 10 (100.0%) | 0 (0.0%) |
| Total (Overall) | 10 (31.2%) | 22 (68.8%) |
Sales and Office Occupations
The most common Sales and Office occupations in Seven Springs borough are , and Sales & Related (12 | 37.5%).
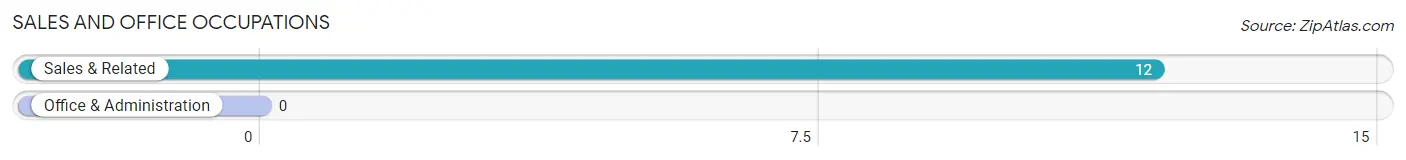
Sales and Office Occupations by Sex
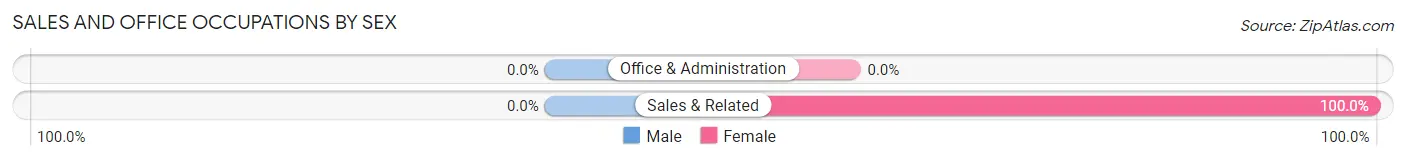
| Occupation | Male | Female |
| Sales & Related | 0 (0.0%) | 12 (100.0%) |
| Office & Administration | 0 (0.0%) | 0 (0.0%) |
| Total (Category) | 0 (0.0%) | 12 (100.0%) |
| Total (Overall) | 10 (31.2%) | 22 (68.8%) |
Natural Resources, Construction and Maintenance Occupations
Natural Resources, Construction and Maintenance Occupations by Sex
| Occupation | Male | Female |
| Farming, Fishing & Forestry | 0 (0.0%) | 0 (0.0%) |
| Construction & Extraction | 0 (0.0%) | 0 (0.0%) |
| Installation, Maintenance & Repair | 0 (0.0%) | 0 (0.0%) |
| Total (Category) | 0 (0.0%) | 0 (0.0%) |
| Total (Overall) | 10 (31.2%) | 22 (68.8%) |
Production, Transportation and Moving Occupations
Production, Transportation and Moving Occupations by Sex
| Occupation | Male | Female |
| Production | 0 (0.0%) | 0 (0.0%) |
| Transportation | 0 (0.0%) | 0 (0.0%) |
| Material Moving | 0 (0.0%) | 0 (0.0%) |
| Total (Category) | 0 (0.0%) | 0 (0.0%) |
| Total (Overall) | 10 (31.2%) | 22 (68.8%) |
Employment Industries by Sex in Seven Springs borough
Employment Industries in Seven Springs borough
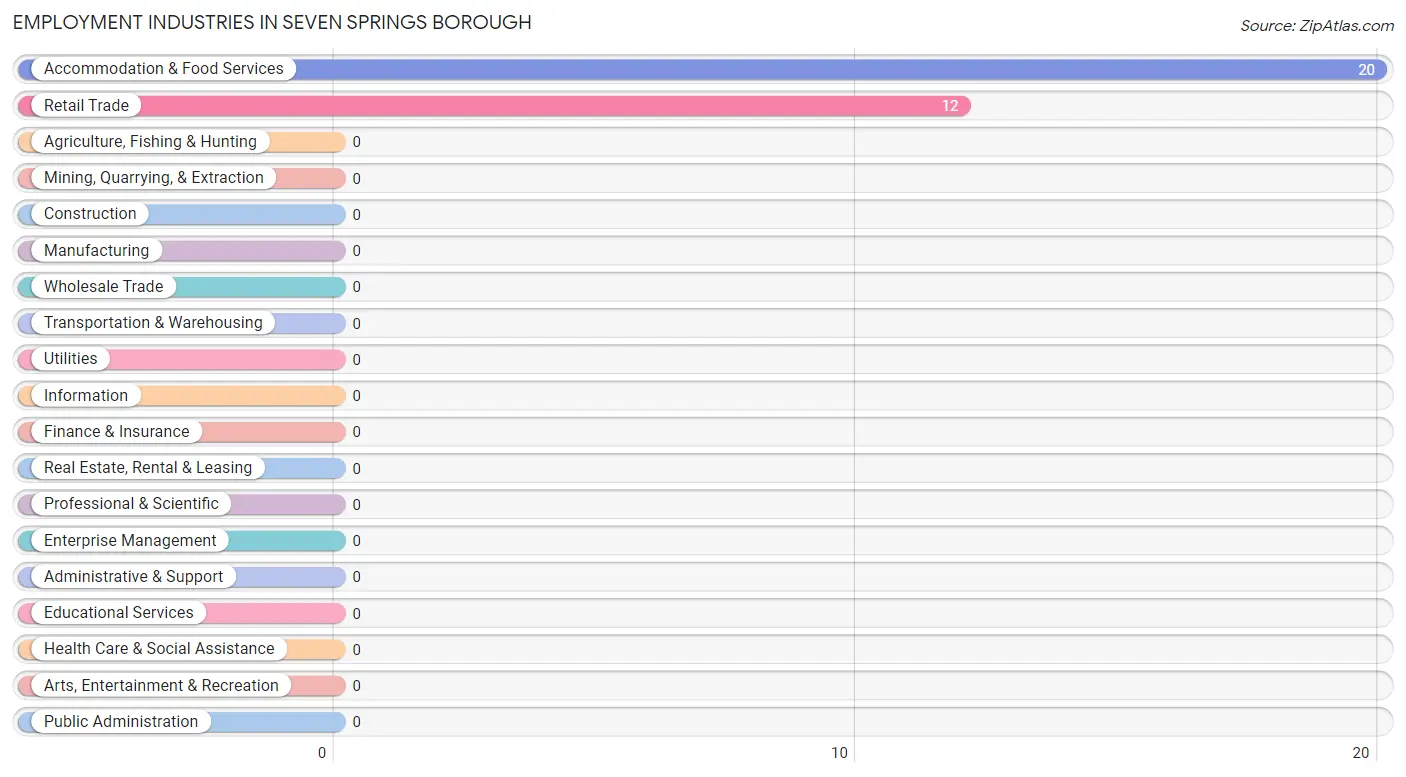
The major employment industries in Seven Springs borough include Accommodation & Food Services (20 | 62.5%), and Retail Trade (12 | 37.5%).
Employment Industries by Sex in Seven Springs borough
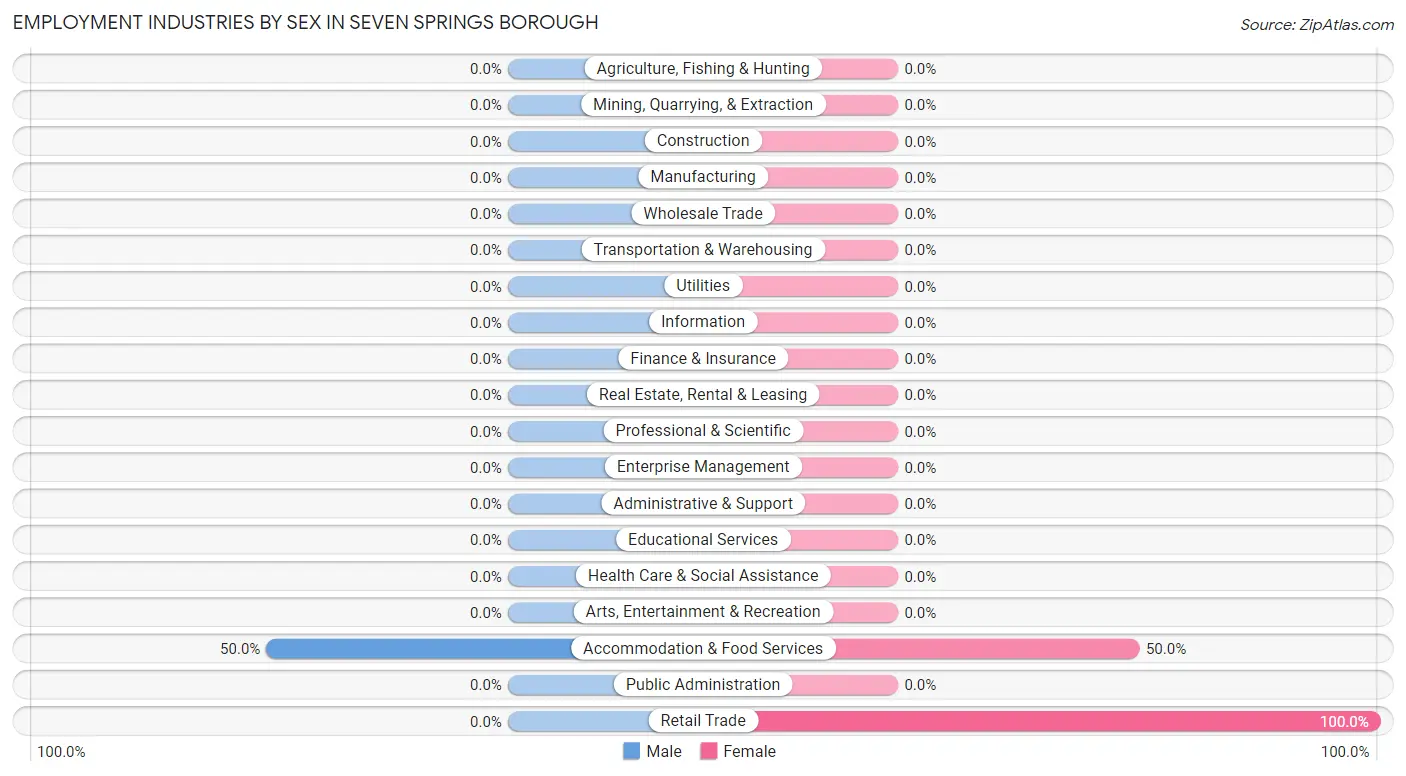
| Industry | Male | Female |
| Agriculture, Fishing & Hunting | 0 (0.0%) | 0 (0.0%) |
| Mining, Quarrying, & Extraction | 0 (0.0%) | 0 (0.0%) |
| Construction | 0 (0.0%) | 0 (0.0%) |
| Manufacturing | 0 (0.0%) | 0 (0.0%) |
| Wholesale Trade | 0 (0.0%) | 0 (0.0%) |
| Retail Trade | 0 (0.0%) | 12 (100.0%) |
| Transportation & Warehousing | 0 (0.0%) | 0 (0.0%) |
| Utilities | 0 (0.0%) | 0 (0.0%) |
| Information | 0 (0.0%) | 0 (0.0%) |
| Finance & Insurance | 0 (0.0%) | 0 (0.0%) |
| Real Estate, Rental & Leasing | 0 (0.0%) | 0 (0.0%) |
| Professional & Scientific | 0 (0.0%) | 0 (0.0%) |
| Enterprise Management | 0 (0.0%) | 0 (0.0%) |
| Administrative & Support | 0 (0.0%) | 0 (0.0%) |
| Educational Services | 0 (0.0%) | 0 (0.0%) |
| Health Care & Social Assistance | 0 (0.0%) | 0 (0.0%) |
| Arts, Entertainment & Recreation | 0 (0.0%) | 0 (0.0%) |
| Accommodation & Food Services | 10 (50.0%) | 10 (50.0%) |
| Public Administration | 0 (0.0%) | 0 (0.0%) |
| Total | 10 (31.2%) | 22 (68.8%) |
Education in Seven Springs borough
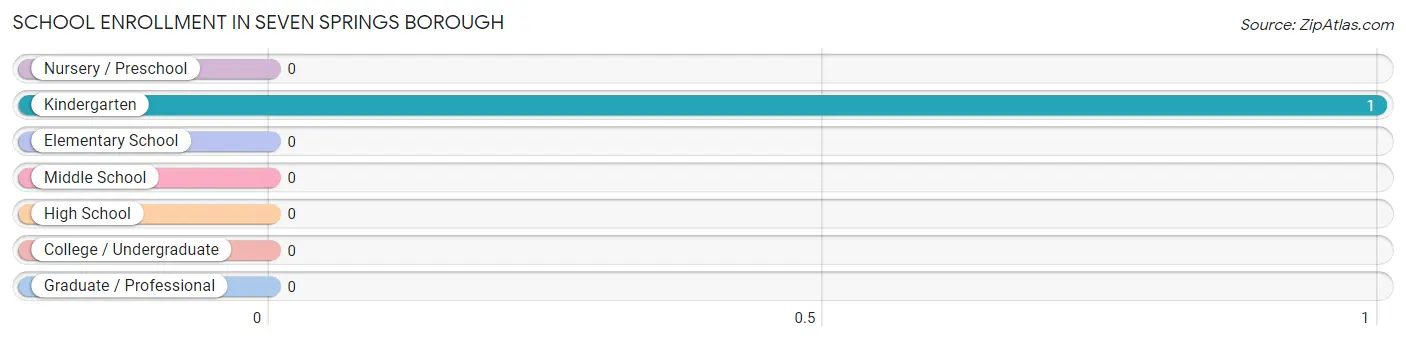
School Enrollment in Seven Springs borough
| School Level | # Students | % Students |
| Nursery / Preschool | 0 | 0.0% |
| Kindergarten | 1 | 100.0% |
| Elementary School | 0 | 0.0% |
| Middle School | 0 | 0.0% |
| High School | 0 | 0.0% |
| College / Undergraduate | 0 | 0.0% |
| Graduate / Professional | 0 | 0.0% |
| Total | 1 | 100.0% |
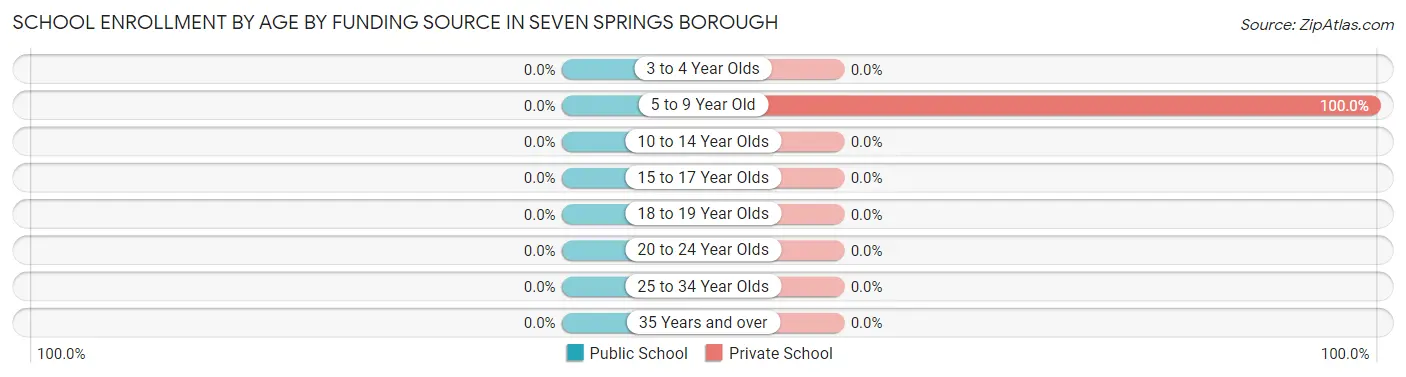
School Enrollment by Age by Funding Source in Seven Springs borough
| Age Bracket | Public School | Private School |
| 3 to 4 Year Olds | 0 (0.0%) | 0 (0.0%) |
| 5 to 9 Year Old | 0 (0.0%) | 1 (100.0%) |
| 10 to 14 Year Olds | 0 (0.0%) | 0 (0.0%) |
| 15 to 17 Year Olds | 0 (0.0%) | 0 (0.0%) |
| 18 to 19 Year Olds | 0 (0.0%) | 0 (0.0%) |
| 20 to 24 Year Olds | 0 (0.0%) | 0 (0.0%) |
| 25 to 34 Year Olds | 0 (0.0%) | 0 (0.0%) |
| 35 Years and over | 0 (0.0%) | 0 (0.0%) |
| Total | 0 (0.0%) | 1 (100.0%) |
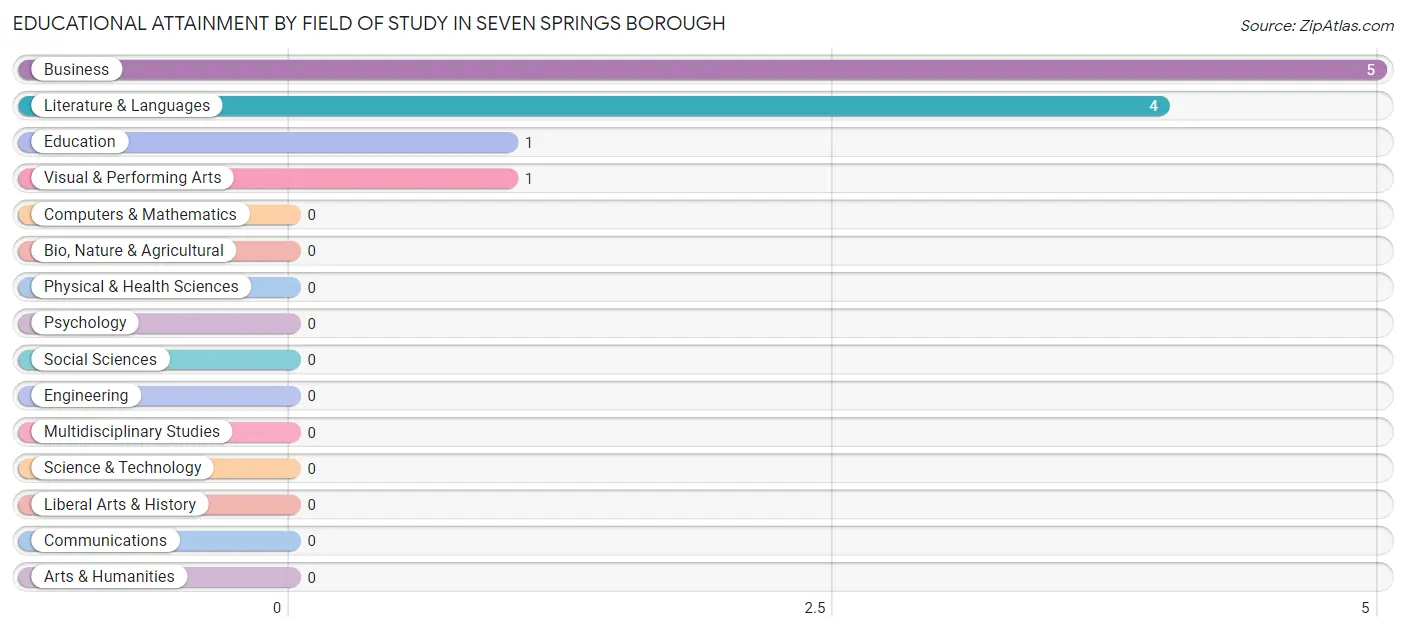
Educational Attainment by Field of Study in Seven Springs borough
Business (5 | 45.5%), literature & languages (4 | 36.4%), education (1 | 9.1%), and visual & performing arts (1 | 9.1%) are the most common fields of study among 11 individuals in Seven Springs borough who have obtained a bachelor's degree or higher.
| Field of Study | # Graduates | % Graduates |
| Computers & Mathematics | 0 | 0.0% |
| Bio, Nature & Agricultural | 0 | 0.0% |
| Physical & Health Sciences | 0 | 0.0% |
| Psychology | 0 | 0.0% |
| Social Sciences | 0 | 0.0% |
| Engineering | 0 | 0.0% |
| Multidisciplinary Studies | 0 | 0.0% |
| Science & Technology | 0 | 0.0% |
| Business | 5 | 45.5% |
| Education | 1 | 9.1% |
| Literature & Languages | 4 | 36.4% |
| Liberal Arts & History | 0 | 0.0% |
| Visual & Performing Arts | 1 | 9.1% |
| Communications | 0 | 0.0% |
| Arts & Humanities | 0 | 0.0% |
| Total | 11 | 100.0% |
Transportation & Commute in Seven Springs borough
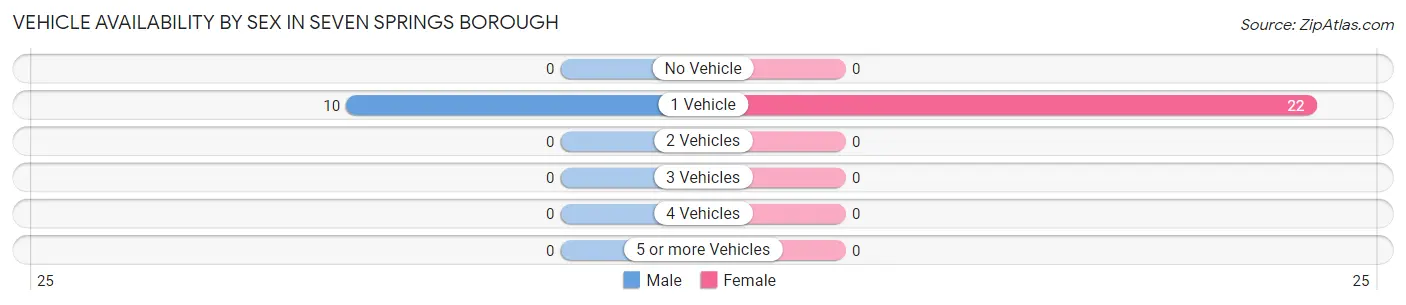
Vehicle Availability by Sex in Seven Springs borough
The most prevalent vehicle ownership categories in Seven Springs borough are males with 1 vehicle (10, accounting for 100.0%) and females with 1 vehicle (22, making up 45.5%).
| Vehicles Available | Male | Female |
| No Vehicle | 0 (0.0%) | 0 (0.0%) |
| 1 Vehicle | 10 (100.0%) | 22 (100.0%) |
| 2 Vehicles | 0 (0.0%) | 0 (0.0%) |
| 3 Vehicles | 0 (0.0%) | 0 (0.0%) |
| 4 Vehicles | 0 (0.0%) | 0 (0.0%) |
| 5 or more Vehicles | 0 (0.0%) | 0 (0.0%) |
| Total | 10 (100.0%) | 22 (100.0%) |
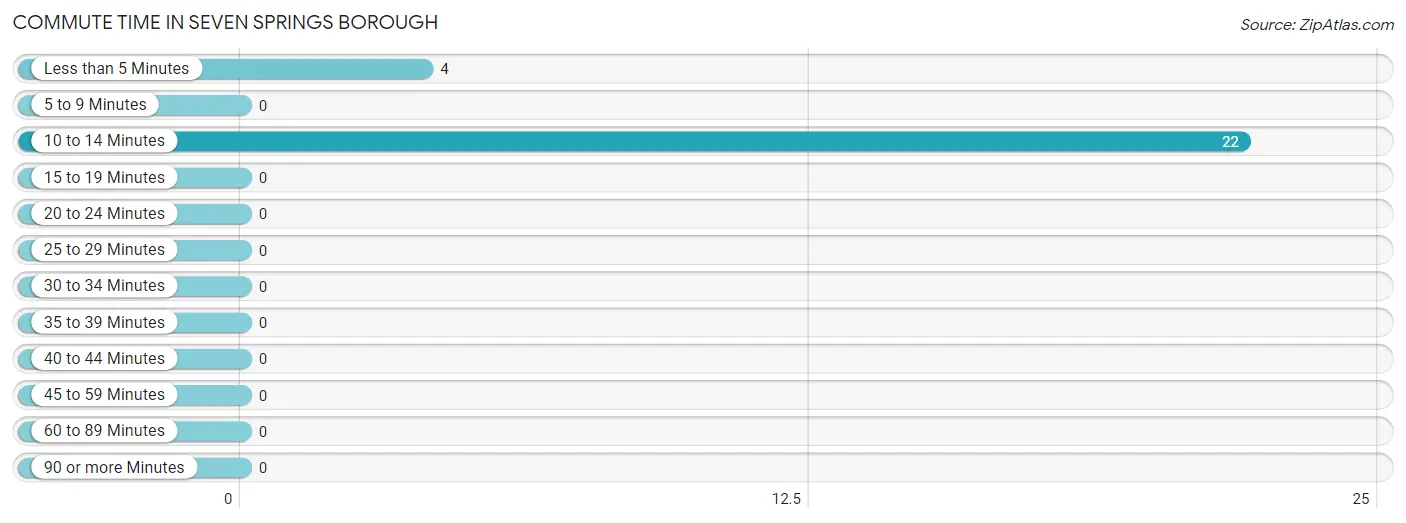
Commute Time in Seven Springs borough
The most frequently occuring commute durations in Seven Springs borough are 10 to 14 minutes (22 commuters, 84.6%), less than 5 minutes (4 commuters, 15.4%), and 5 to 9 minutes (0 commuters, 0.0%).
| Commute Time | # Commuters | % Commuters |
| Less than 5 Minutes | 4 | 15.4% |
| 5 to 9 Minutes | 0 | 0.0% |
| 10 to 14 Minutes | 22 | 84.6% |
| 15 to 19 Minutes | 0 | 0.0% |
| 20 to 24 Minutes | 0 | 0.0% |
| 25 to 29 Minutes | 0 | 0.0% |
| 30 to 34 Minutes | 0 | 0.0% |
| 35 to 39 Minutes | 0 | 0.0% |
| 40 to 44 Minutes | 0 | 0.0% |
| 45 to 59 Minutes | 0 | 0.0% |
| 60 to 89 Minutes | 0 | 0.0% |
| 90 or more Minutes | 0 | 0.0% |
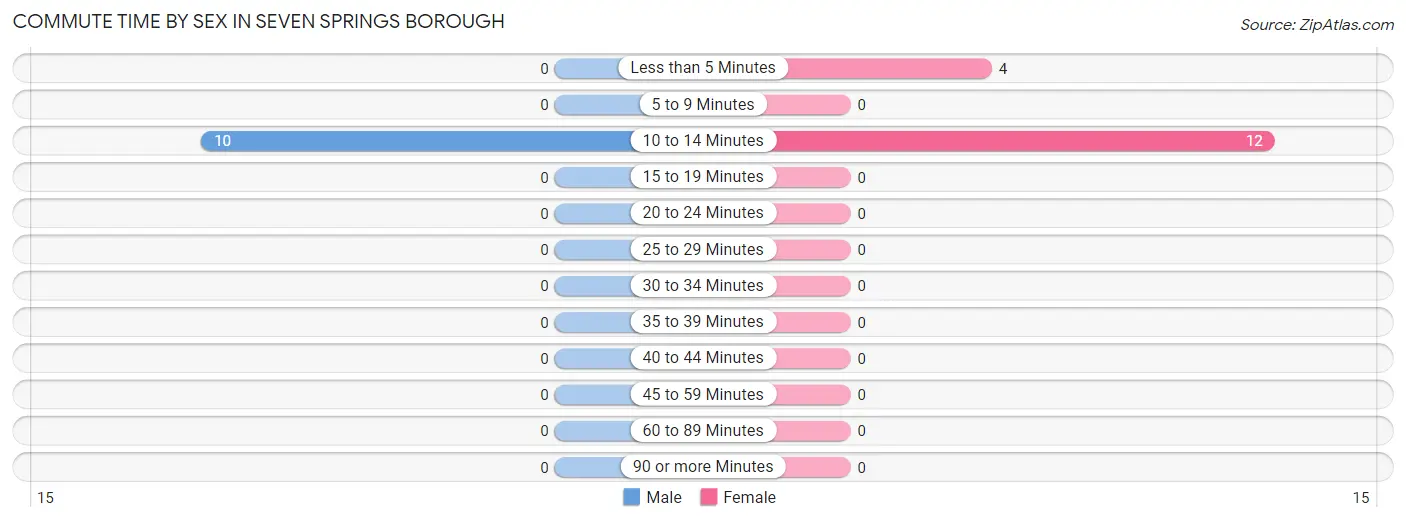
Commute Time by Sex in Seven Springs borough
The most common commute times in Seven Springs borough are 10 to 14 minutes (10 commuters, 100.0%) for males and 10 to 14 minutes (12 commuters, 75.0%) for females.
| Commute Time | Male | Female |
| Less than 5 Minutes | 0 (0.0%) | 4 (25.0%) |
| 5 to 9 Minutes | 0 (0.0%) | 0 (0.0%) |
| 10 to 14 Minutes | 10 (100.0%) | 12 (75.0%) |
| 15 to 19 Minutes | 0 (0.0%) | 0 (0.0%) |
| 20 to 24 Minutes | 0 (0.0%) | 0 (0.0%) |
| 25 to 29 Minutes | 0 (0.0%) | 0 (0.0%) |
| 30 to 34 Minutes | 0 (0.0%) | 0 (0.0%) |
| 35 to 39 Minutes | 0 (0.0%) | 0 (0.0%) |
| 40 to 44 Minutes | 0 (0.0%) | 0 (0.0%) |
| 45 to 59 Minutes | 0 (0.0%) | 0 (0.0%) |
| 60 to 89 Minutes | 0 (0.0%) | 0 (0.0%) |
| 90 or more Minutes | 0 (0.0%) | 0 (0.0%) |
Time of Departure to Work by Sex in Seven Springs borough
The most frequent times of departure to work in Seven Springs borough are 6:00 AM to 6:29 AM (10, 100.0%) for males and 4:00 PM to 11:59 PM (12, 75.0%) for females.
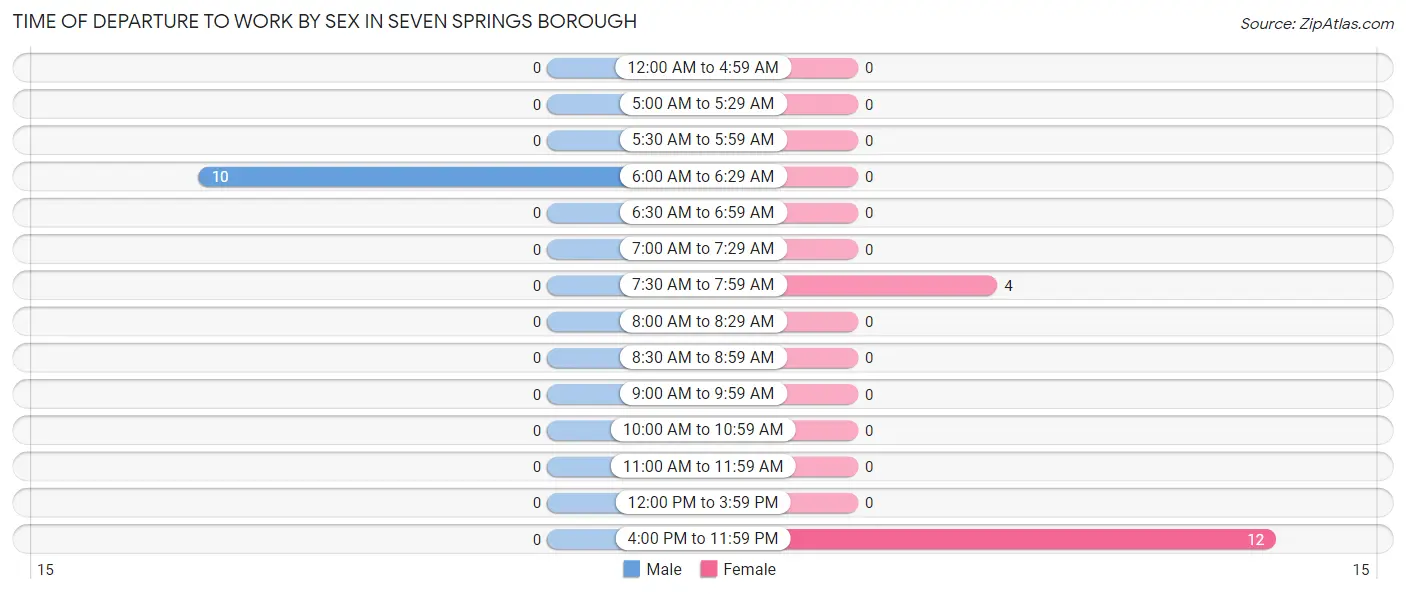
| Time of Departure | Male | Female |
| 12:00 AM to 4:59 AM | 0 (0.0%) | 0 (0.0%) |
| 5:00 AM to 5:29 AM | 0 (0.0%) | 0 (0.0%) |
| 5:30 AM to 5:59 AM | 0 (0.0%) | 0 (0.0%) |
| 6:00 AM to 6:29 AM | 10 (100.0%) | 0 (0.0%) |
| 6:30 AM to 6:59 AM | 0 (0.0%) | 0 (0.0%) |
| 7:00 AM to 7:29 AM | 0 (0.0%) | 0 (0.0%) |
| 7:30 AM to 7:59 AM | 0 (0.0%) | 4 (25.0%) |
| 8:00 AM to 8:29 AM | 0 (0.0%) | 0 (0.0%) |
| 8:30 AM to 8:59 AM | 0 (0.0%) | 0 (0.0%) |
| 9:00 AM to 9:59 AM | 0 (0.0%) | 0 (0.0%) |
| 10:00 AM to 10:59 AM | 0 (0.0%) | 0 (0.0%) |
| 11:00 AM to 11:59 AM | 0 (0.0%) | 0 (0.0%) |
| 12:00 PM to 3:59 PM | 0 (0.0%) | 0 (0.0%) |
| 4:00 PM to 11:59 PM | 0 (0.0%) | 12 (75.0%) |
| Total | 10 (100.0%) | 16 (100.0%) |
Housing Occupancy in Seven Springs borough
Occupancy by Ownership in Seven Springs borough
Of the total 34 dwellings in Seven Springs borough, owner-occupied units account for 2 (5.9%), while renter-occupied units make up 32 (94.1%).
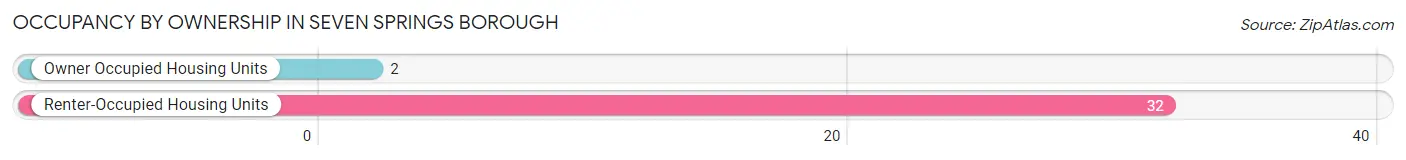
| Occupancy | # Housing Units | % Housing Units |
| Owner Occupied Housing Units | 2 | 5.9% |
| Renter-Occupied Housing Units | 32 | 94.1% |
| Total Occupied Housing Units | 34 | 100.0% |
Occupancy by Household Size in Seven Springs borough
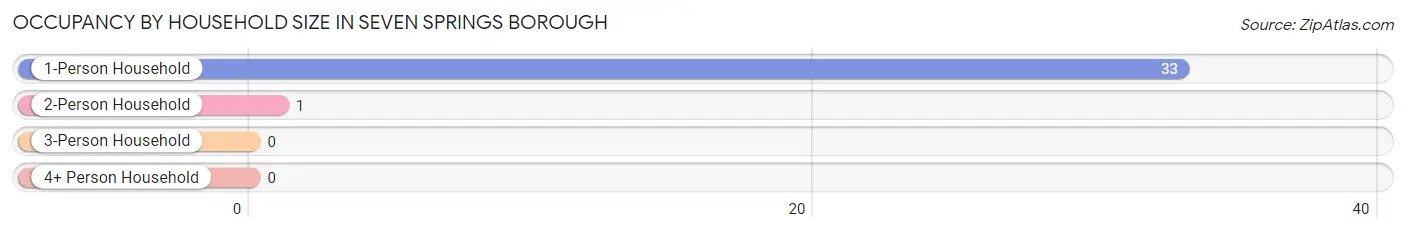
| Household Size | # Housing Units | % Housing Units |
| 1-Person Household | 33 | 97.1% |
| 2-Person Household | 1 | 2.9% |
| 3-Person Household | 0 | 0.0% |
| 4+ Person Household | 0 | 0.0% |
| Total Housing Units | 34 | 100.0% |
Occupancy by Ownership by Household Size in Seven Springs borough
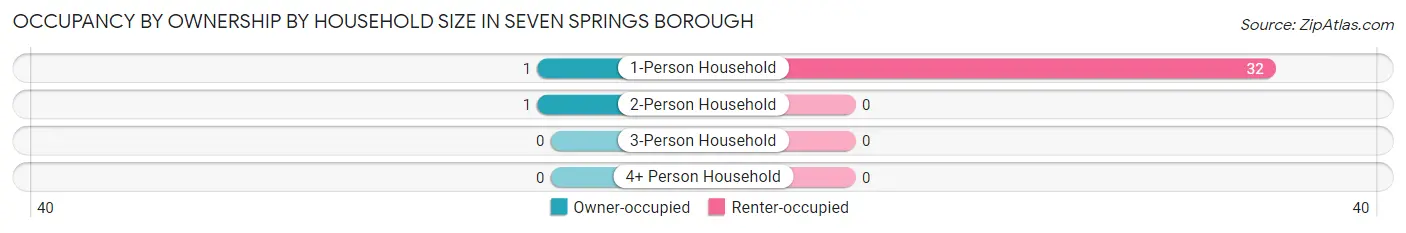
| Household Size | Owner-occupied | Renter-occupied |
| 1-Person Household | 1 (3.0%) | 32 (97.0%) |
| 2-Person Household | 1 (100.0%) | 0 (0.0%) |
| 3-Person Household | 0 (0.0%) | 0 (0.0%) |
| 4+ Person Household | 0 (0.0%) | 0 (0.0%) |
| Total Housing Units | 2 (5.9%) | 32 (94.1%) |
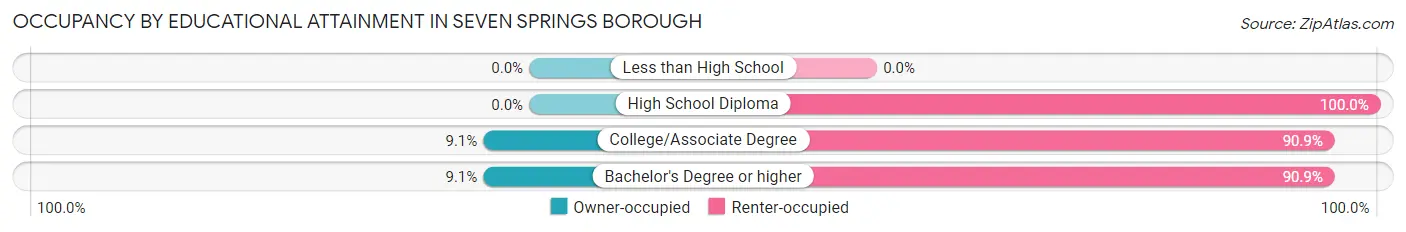
Occupancy by Educational Attainment in Seven Springs borough
| Household Size | Owner-occupied | Renter-occupied |
| Less than High School | 0 (0.0%) | 0 (0.0%) |
| High School Diploma | 0 (0.0%) | 12 (100.0%) |
| College/Associate Degree | 1 (9.1%) | 10 (90.9%) |
| Bachelor's Degree or higher | 1 (9.1%) | 10 (90.9%) |
Occupancy by Age of Householder in Seven Springs borough
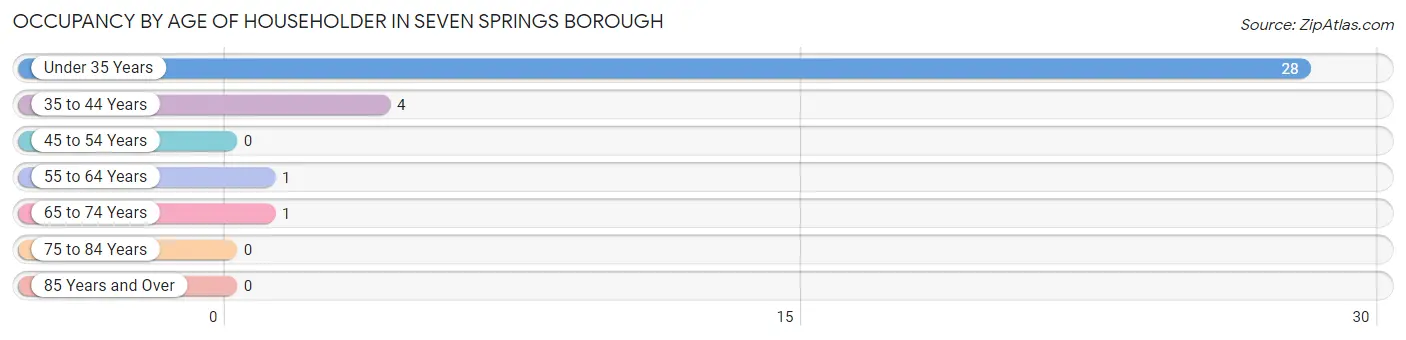
| Age Bracket | # Households | % Households |
| Under 35 Years | 28 | 82.4% |
| 35 to 44 Years | 4 | 11.8% |
| 45 to 54 Years | 0 | 0.0% |
| 55 to 64 Years | 1 | 2.9% |
| 65 to 74 Years | 1 | 2.9% |
| 75 to 84 Years | 0 | 0.0% |
| 85 Years and Over | 0 | 0.0% |
| Total | 34 | 100.0% |
Housing Finances in Seven Springs borough
Median Income by Occupancy in Seven Springs borough
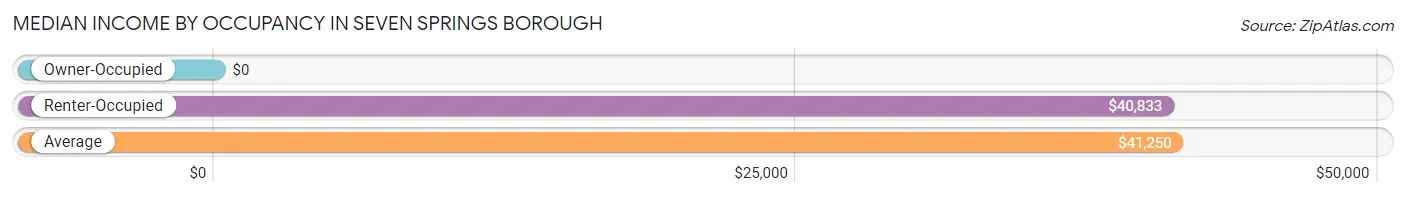
| Occupancy Type | # Households | Median Income |
| Owner-Occupied | 2 (5.9%) | $0 |
| Renter-Occupied | 32 (94.1%) | $40,833 |
| Average | 34 (100.0%) | $41,250 |
Occupancy by Householder Income Bracket in Seven Springs borough
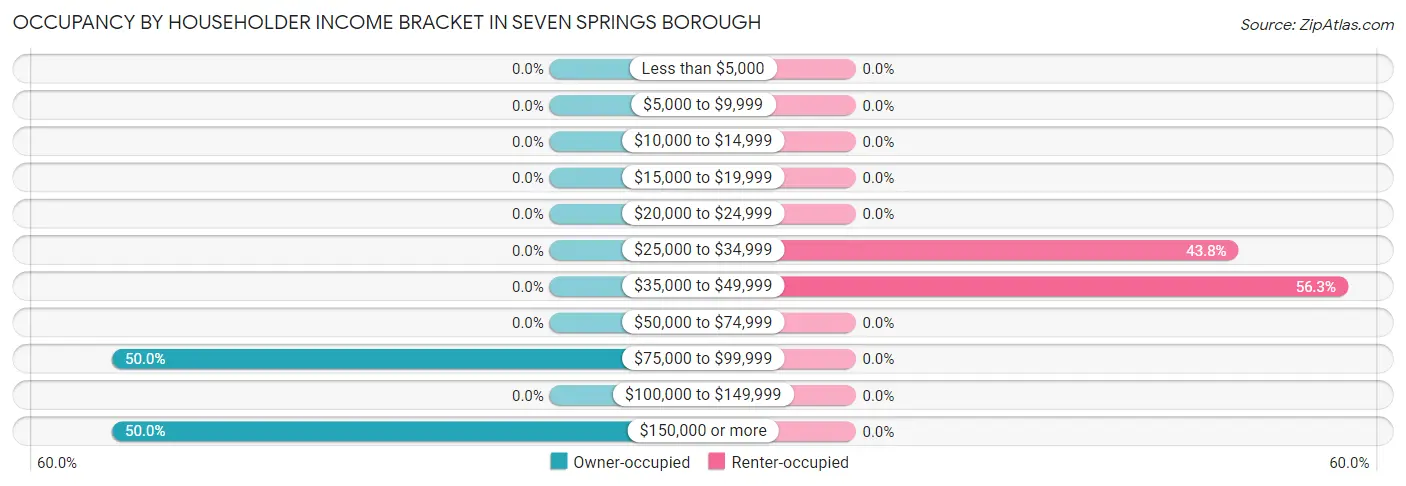
| Income Bracket | Owner-occupied | Renter-occupied |
| Less than $5,000 | 0 (0.0%) | 0 (0.0%) |
| $5,000 to $9,999 | 0 (0.0%) | 0 (0.0%) |
| $10,000 to $14,999 | 0 (0.0%) | 0 (0.0%) |
| $15,000 to $19,999 | 0 (0.0%) | 0 (0.0%) |
| $20,000 to $24,999 | 0 (0.0%) | 0 (0.0%) |
| $25,000 to $34,999 | 0 (0.0%) | 14 (43.8%) |
| $35,000 to $49,999 | 0 (0.0%) | 18 (56.2%) |
| $50,000 to $74,999 | 0 (0.0%) | 0 (0.0%) |
| $75,000 to $99,999 | 1 (50.0%) | 0 (0.0%) |
| $100,000 to $149,999 | 0 (0.0%) | 0 (0.0%) |
| $150,000 or more | 1 (50.0%) | 0 (0.0%) |
| Total | 2 (100.0%) | 32 (100.0%) |
Monthly Housing Cost Tiers in Seven Springs borough
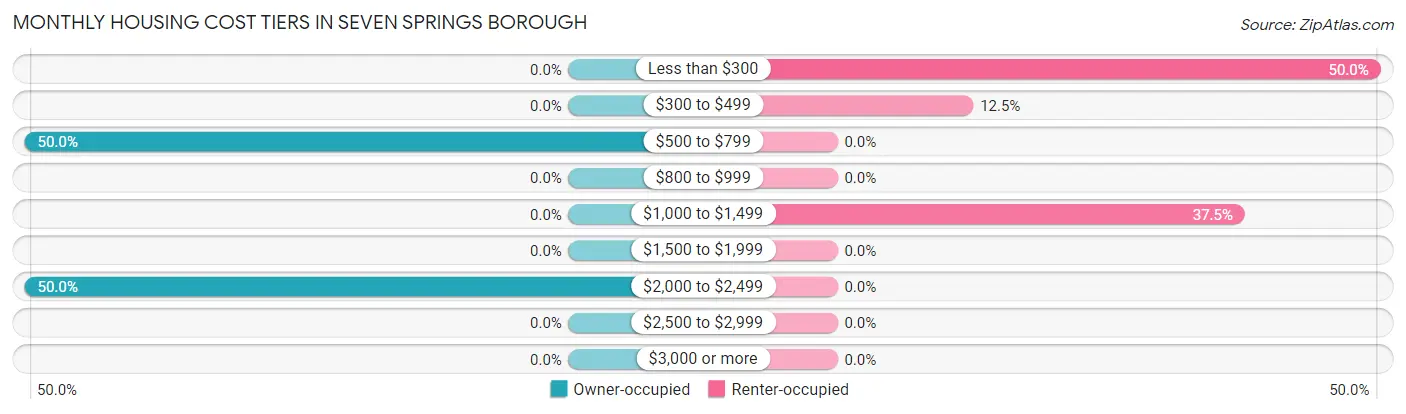
| Monthly Cost | Owner-occupied | Renter-occupied |
| Less than $300 | 0 (0.0%) | 16 (50.0%) |
| $300 to $499 | 0 (0.0%) | 4 (12.5%) |
| $500 to $799 | 1 (50.0%) | 0 (0.0%) |
| $800 to $999 | 0 (0.0%) | 0 (0.0%) |
| $1,000 to $1,499 | 0 (0.0%) | 12 (37.5%) |
| $1,500 to $1,999 | 0 (0.0%) | 0 (0.0%) |
| $2,000 to $2,499 | 1 (50.0%) | 0 (0.0%) |
| $2,500 to $2,999 | 0 (0.0%) | 0 (0.0%) |
| $3,000 or more | 0 (0.0%) | 0 (0.0%) |
| Total | 2 (100.0%) | 32 (100.0%) |
Physical Housing Characteristics in Seven Springs borough
Housing Structures in Seven Springs borough
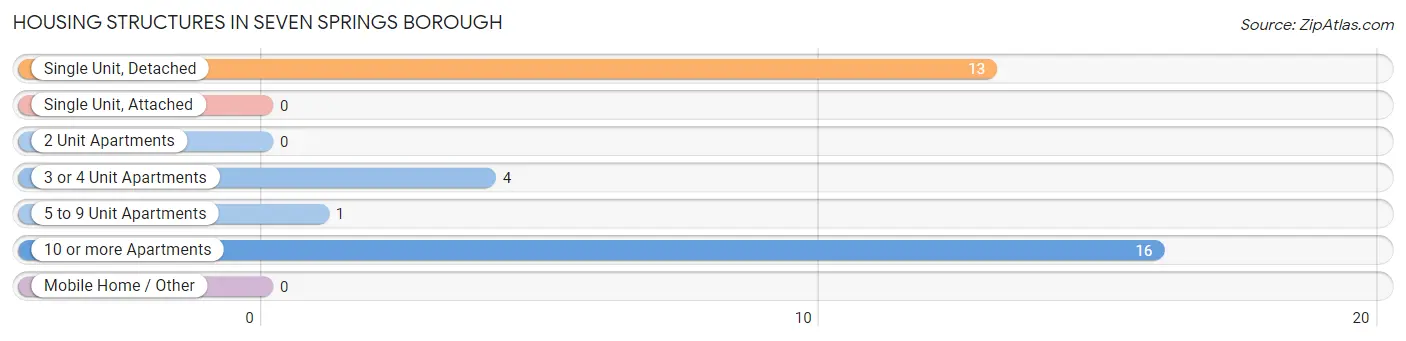
| Structure Type | # Housing Units | % Housing Units |
| Single Unit, Detached | 13 | 38.2% |
| Single Unit, Attached | 0 | 0.0% |
| 2 Unit Apartments | 0 | 0.0% |
| 3 or 4 Unit Apartments | 4 | 11.8% |
| 5 to 9 Unit Apartments | 1 | 2.9% |
| 10 or more Apartments | 16 | 47.1% |
| Mobile Home / Other | 0 | 0.0% |
| Total | 34 | 100.0% |
Housing Structures by Occupancy in Seven Springs borough
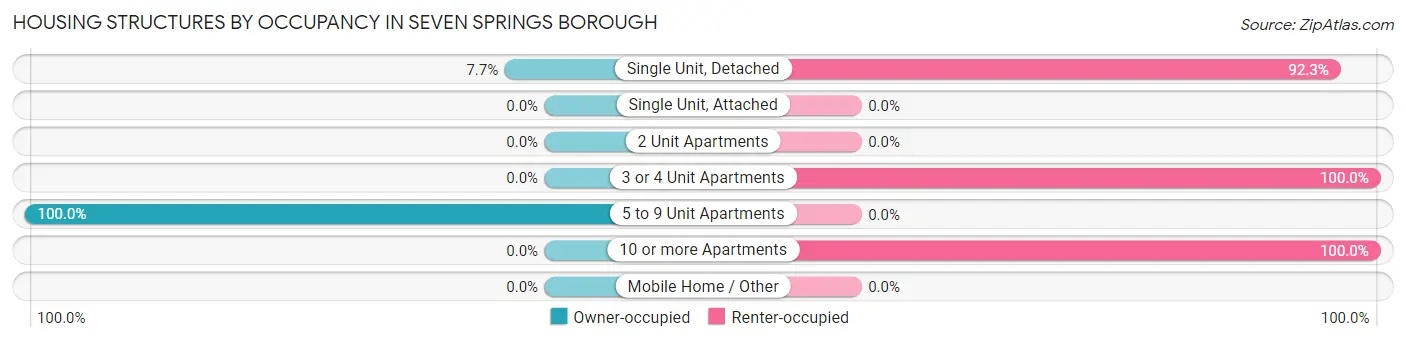
| Structure Type | Owner-occupied | Renter-occupied |
| Single Unit, Detached | 1 (7.7%) | 12 (92.3%) |
| Single Unit, Attached | 0 (0.0%) | 0 (0.0%) |
| 2 Unit Apartments | 0 (0.0%) | 0 (0.0%) |
| 3 or 4 Unit Apartments | 0 (0.0%) | 4 (100.0%) |
| 5 to 9 Unit Apartments | 1 (100.0%) | 0 (0.0%) |
| 10 or more Apartments | 0 (0.0%) | 16 (100.0%) |
| Mobile Home / Other | 0 (0.0%) | 0 (0.0%) |
| Total | 2 (5.9%) | 32 (94.1%) |
Housing Structures by Number of Rooms in Seven Springs borough
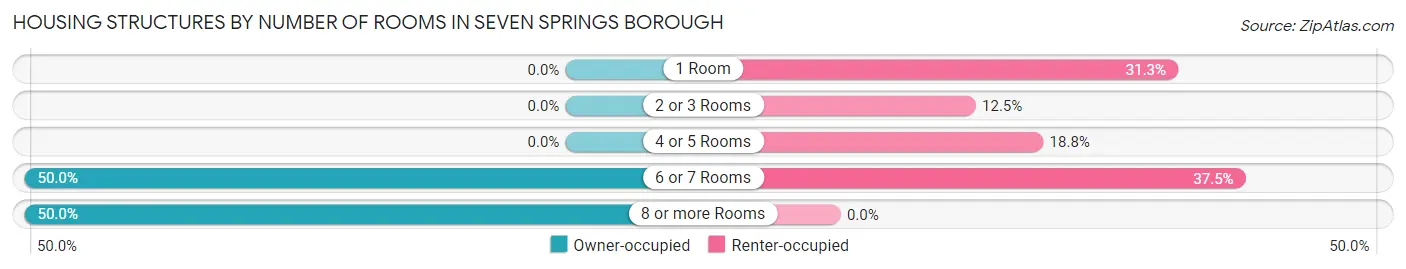
| Number of Rooms | Owner-occupied | Renter-occupied |
| 1 Room | 0 (0.0%) | 10 (31.2%) |
| 2 or 3 Rooms | 0 (0.0%) | 4 (12.5%) |
| 4 or 5 Rooms | 0 (0.0%) | 6 (18.8%) |
| 6 or 7 Rooms | 1 (50.0%) | 12 (37.5%) |
| 8 or more Rooms | 1 (50.0%) | 0 (0.0%) |
| Total | 2 (100.0%) | 32 (100.0%) |
Housing Structure by Heating Type in Seven Springs borough
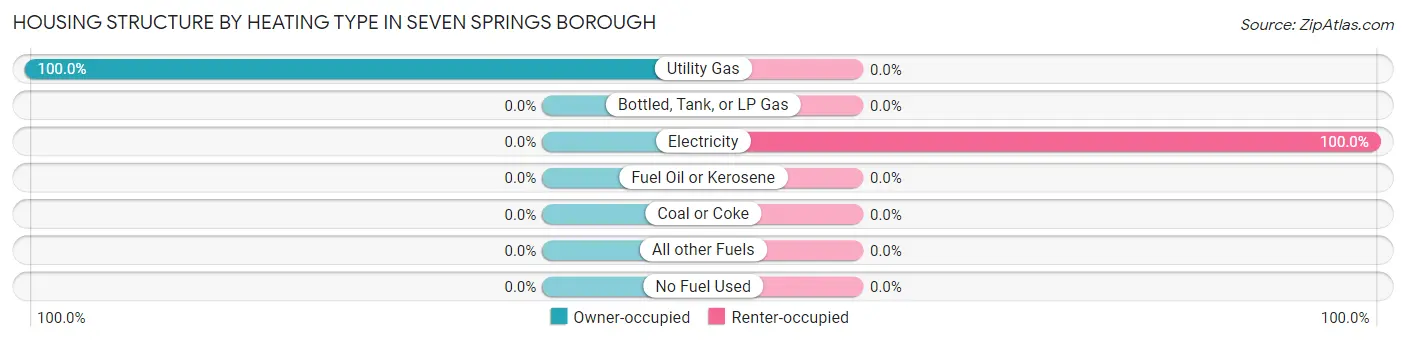
| Heating Type | Owner-occupied | Renter-occupied |
| Utility Gas | 2 (100.0%) | 0 (0.0%) |
| Bottled, Tank, or LP Gas | 0 (0.0%) | 0 (0.0%) |
| Electricity | 0 (0.0%) | 32 (100.0%) |
| Fuel Oil or Kerosene | 0 (0.0%) | 0 (0.0%) |
| Coal or Coke | 0 (0.0%) | 0 (0.0%) |
| All other Fuels | 0 (0.0%) | 0 (0.0%) |
| No Fuel Used | 0 (0.0%) | 0 (0.0%) |
| Total | 2 (100.0%) | 32 (100.0%) |
Household Vehicle Usage in Seven Springs borough
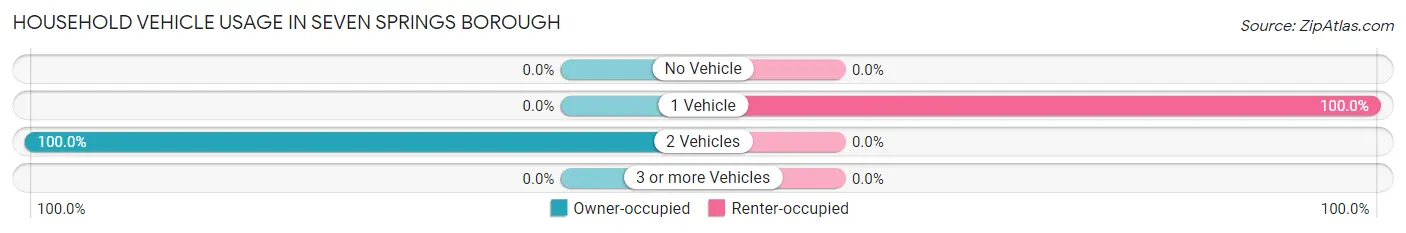
| Vehicles per Household | Owner-occupied | Renter-occupied |
| No Vehicle | 0 (0.0%) | 0 (0.0%) |
| 1 Vehicle | 0 (0.0%) | 32 (100.0%) |
| 2 Vehicles | 2 (100.0%) | 0 (0.0%) |
| 3 or more Vehicles | 0 (0.0%) | 0 (0.0%) |
| Total | 2 (100.0%) | 32 (100.0%) |
Real Estate & Mortgages in Seven Springs borough
Real Estate and Mortgage Overview in Seven Springs borough
| Characteristic | Without Mortgage | With Mortgage |
| Housing Units | 2 | 0 |
| Median Property Value | - | - |
| Median Household Income | - | - |
| Monthly Housing Costs | - | - |
| Real Estate Taxes | - | - |
Property Value by Mortgage Status in Seven Springs borough
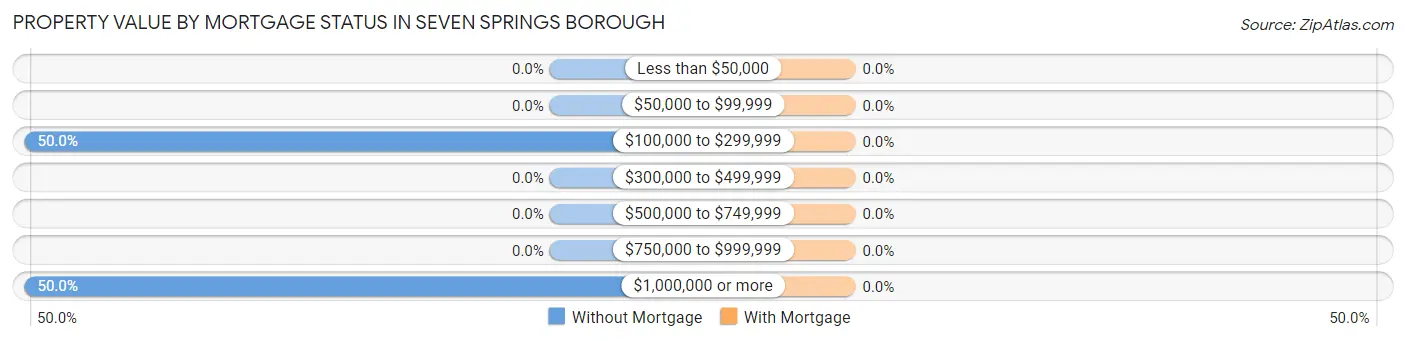
| Property Value | Without Mortgage | With Mortgage |
| Less than $50,000 | 0 (0.0%) | 0 (0.0%) |
| $50,000 to $99,999 | 0 (0.0%) | 0 (0.0%) |
| $100,000 to $299,999 | 1 (50.0%) | 0 (0.0%) |
| $300,000 to $499,999 | 0 (0.0%) | 0 (0.0%) |
| $500,000 to $749,999 | 0 (0.0%) | 0 (0.0%) |
| $750,000 to $999,999 | 0 (0.0%) | 0 (0.0%) |
| $1,000,000 or more | 1 (50.0%) | 0 (0.0%) |
| Total | 2 (100.0%) | 0 (0.0%) |
Household Income by Mortgage Status in Seven Springs borough
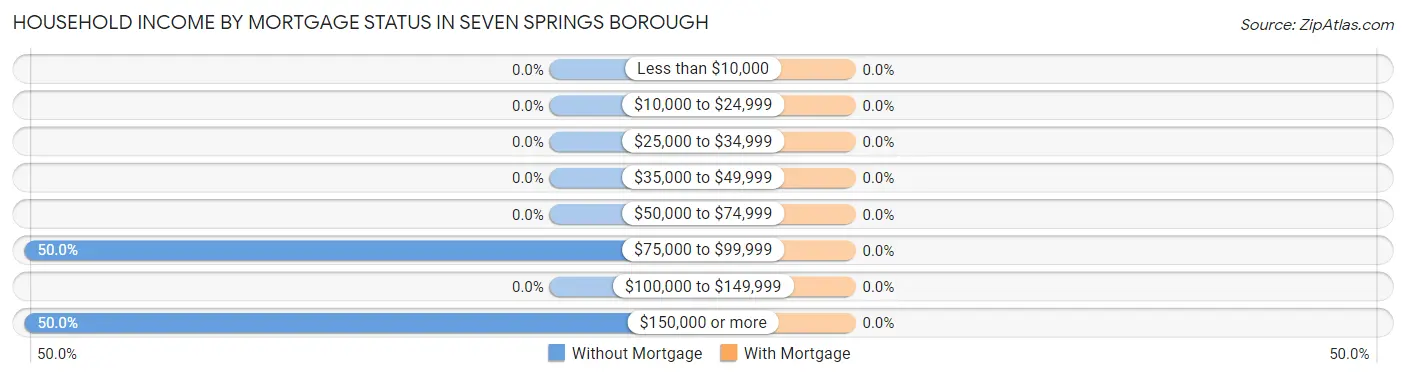
| Household Income | Without Mortgage | With Mortgage |
| Less than $10,000 | 0 (0.0%) | 0 (0.0%) |
| $10,000 to $24,999 | 0 (0.0%) | 0 (0.0%) |
| $25,000 to $34,999 | 0 (0.0%) | 0 (0.0%) |
| $35,000 to $49,999 | 0 (0.0%) | 0 (0.0%) |
| $50,000 to $74,999 | 0 (0.0%) | 0 (0.0%) |
| $75,000 to $99,999 | 1 (50.0%) | 0 (0.0%) |
| $100,000 to $149,999 | 0 (0.0%) | 0 (0.0%) |
| $150,000 or more | 1 (50.0%) | 0 (0.0%) |
| Total | 2 (100.0%) | 0 (0.0%) |
Property Value to Household Income Ratio in Seven Springs borough
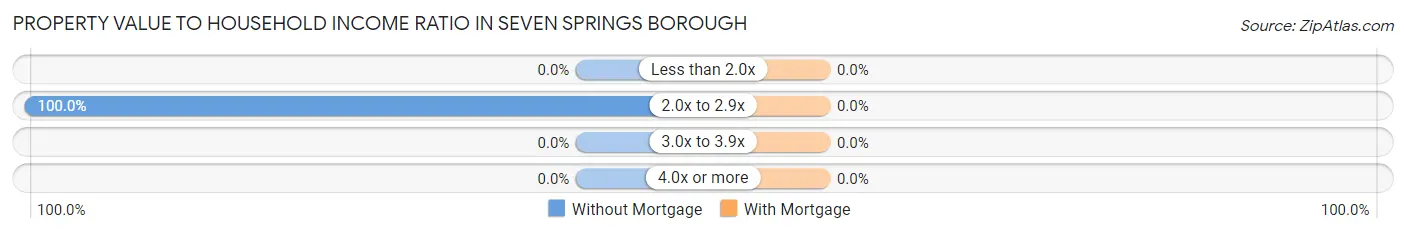
| Value-to-Income Ratio | Without Mortgage | With Mortgage |
| Less than 2.0x | 0 (0.0%) | 0 (0.0%) |
| 2.0x to 2.9x | 2 (100.0%) | 0 (0.0%) |
| 3.0x to 3.9x | 0 (0.0%) | 0 (0.0%) |
| 4.0x or more | 0 (0.0%) | 0 (0.0%) |
| Total | 2 (100.0%) | 0 (0.0%) |
Real Estate Taxes by Mortgage Status in Seven Springs borough
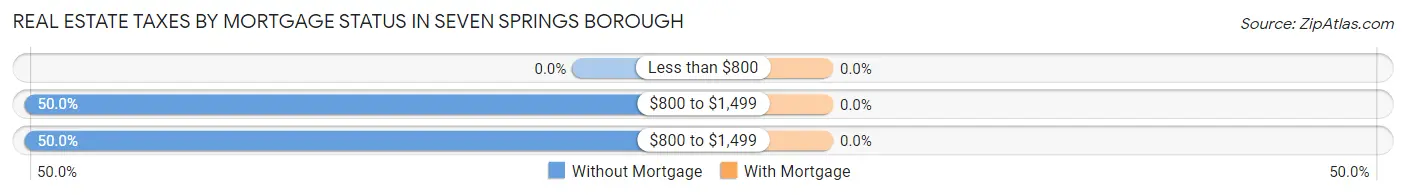
| Property Taxes | Without Mortgage | With Mortgage |
| Less than $800 | 0 (0.0%) | 0 (0.0%) |
| $800 to $1,499 | 1 (50.0%) | 0 (0.0%) |
| $800 to $1,499 | 1 (50.0%) | 0 (0.0%) |
| Total | 2 (100.0%) | 0 (0.0%) |
Health & Disability in Seven Springs borough
Health Insurance Coverage by Age in Seven Springs borough
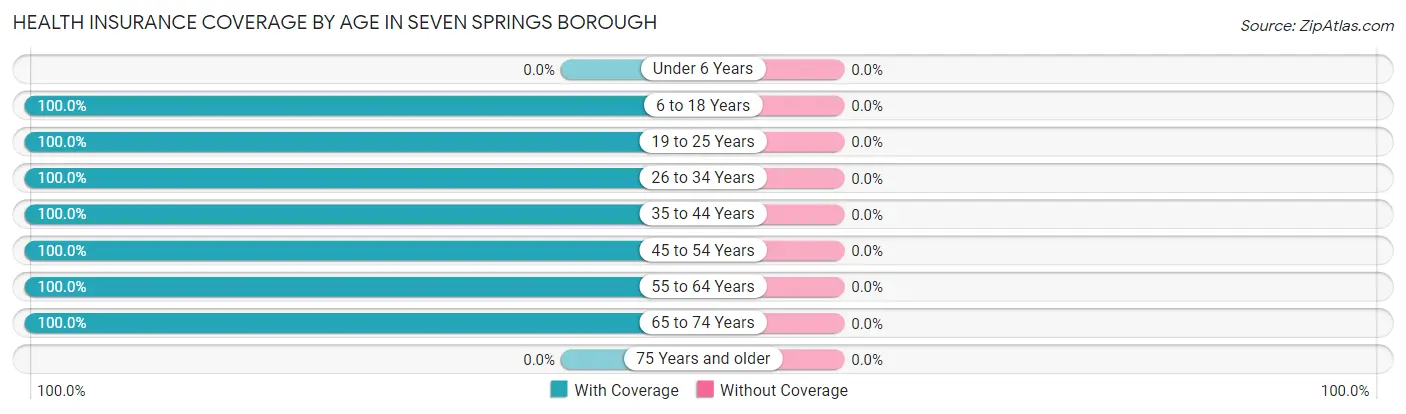
| Age Bracket | With Coverage | Without Coverage |
| Under 6 Years | 0 (0.0%) | 0 (0.0%) |
| 6 to 18 Years | 1 (100.0%) | 0 (0.0%) |
| 19 to 25 Years | 6 (100.0%) | 0 (0.0%) |
| 26 to 34 Years | 23 (100.0%) | 0 (0.0%) |
| 35 to 44 Years | 4 (100.0%) | 0 (0.0%) |
| 45 to 54 Years | 1 (100.0%) | 0 (0.0%) |
| 55 to 64 Years | 1 (100.0%) | 0 (0.0%) |
| 65 to 74 Years | 2 (100.0%) | 0 (0.0%) |
| 75 Years and older | 0 (0.0%) | 0 (0.0%) |
| Total | 38 (100.0%) | 0 (0.0%) |
Health Insurance Coverage by Citizenship Status in Seven Springs borough
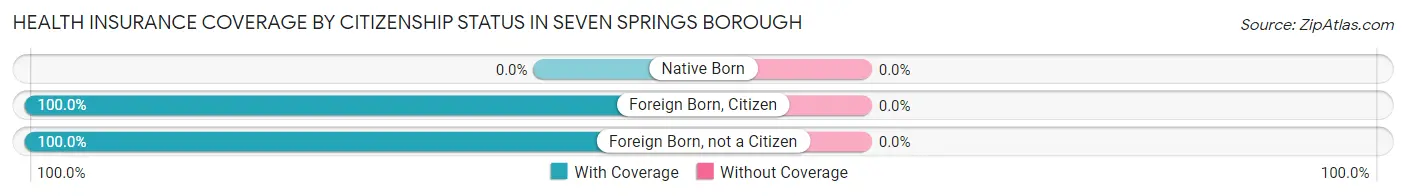
| Citizenship Status | With Coverage | Without Coverage |
| Native Born | 0 (0.0%) | 0 (0.0%) |
| Foreign Born, Citizen | 1 (100.0%) | 0 (0.0%) |
| Foreign Born, not a Citizen | 6 (100.0%) | 0 (0.0%) |
Health Insurance Coverage by Household Income in Seven Springs borough
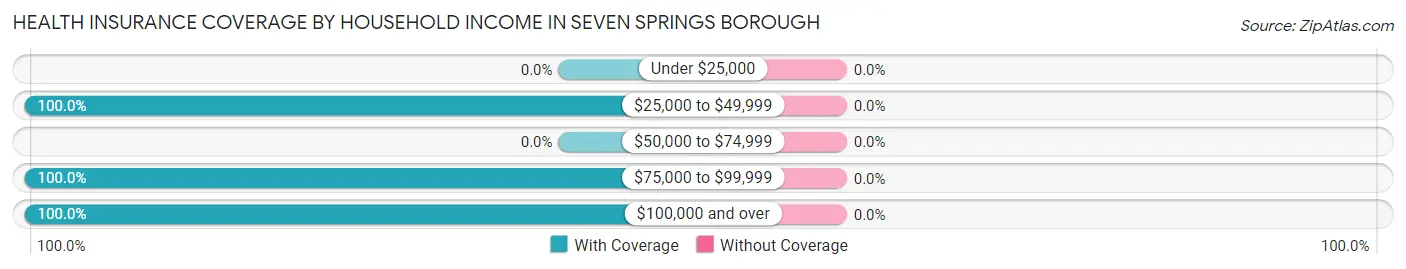
| Household Income | With Coverage | Without Coverage |
| Under $25,000 | 0 (0.0%) | 0 (0.0%) |
| $25,000 to $49,999 | 32 (100.0%) | 0 (0.0%) |
| $50,000 to $74,999 | 0 (0.0%) | 0 (0.0%) |
| $75,000 to $99,999 | 1 (100.0%) | 0 (0.0%) |
| $100,000 and over | 2 (100.0%) | 0 (0.0%) |
Public vs Private Health Insurance Coverage by Age in Seven Springs borough
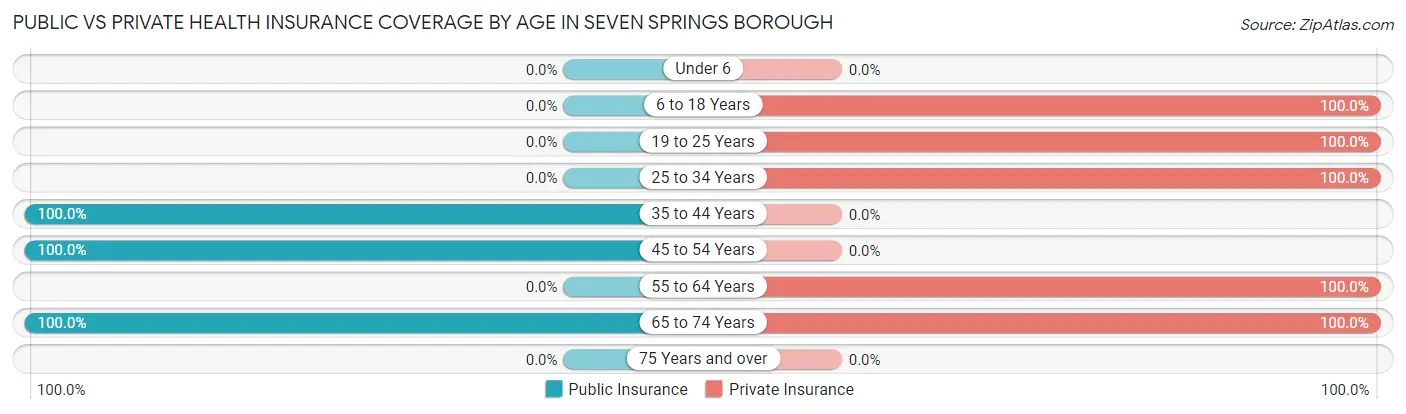
| Age Bracket | Public Insurance | Private Insurance |
| Under 6 | 0 (0.0%) | 0 (0.0%) |
| 6 to 18 Years | 0 (0.0%) | 1 (100.0%) |
| 19 to 25 Years | 0 (0.0%) | 6 (100.0%) |
| 25 to 34 Years | 0 (0.0%) | 23 (100.0%) |
| 35 to 44 Years | 4 (100.0%) | 0 (0.0%) |
| 45 to 54 Years | 1 (100.0%) | 0 (0.0%) |
| 55 to 64 Years | 0 (0.0%) | 1 (100.0%) |
| 65 to 74 Years | 2 (100.0%) | 2 (100.0%) |
| 75 Years and over | 0 (0.0%) | 0 (0.0%) |
| Total | 7 (18.4%) | 33 (86.8%) |
Disability Status by Sex by Age in Seven Springs borough
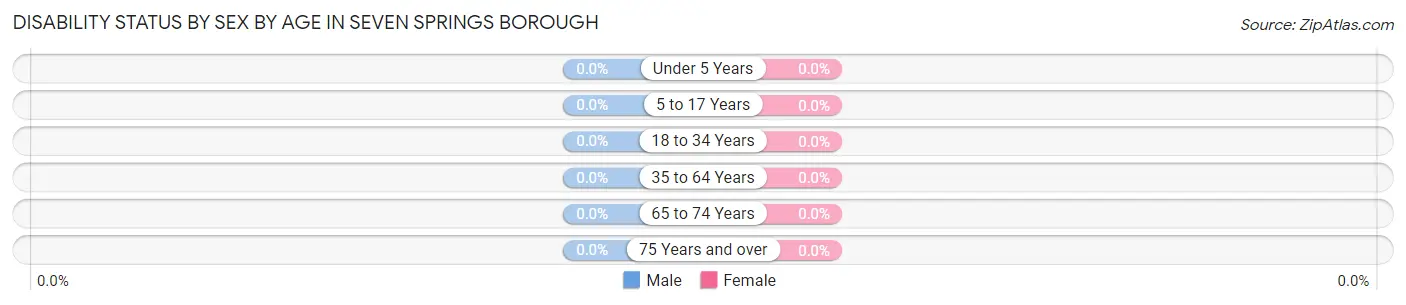
| Age Bracket | Male | Female |
| Under 5 Years | 0 (0.0%) | 0 (0.0%) |
| 5 to 17 Years | 0 (0.0%) | 0 (0.0%) |
| 18 to 34 Years | 0 (0.0%) | 0 (0.0%) |
| 35 to 64 Years | 0 (0.0%) | 0 (0.0%) |
| 65 to 74 Years | 0 (0.0%) | 0 (0.0%) |
| 75 Years and over | 0 (0.0%) | 0 (0.0%) |
Disability Class by Sex by Age in Seven Springs borough
Disability Class: Hearing Difficulty
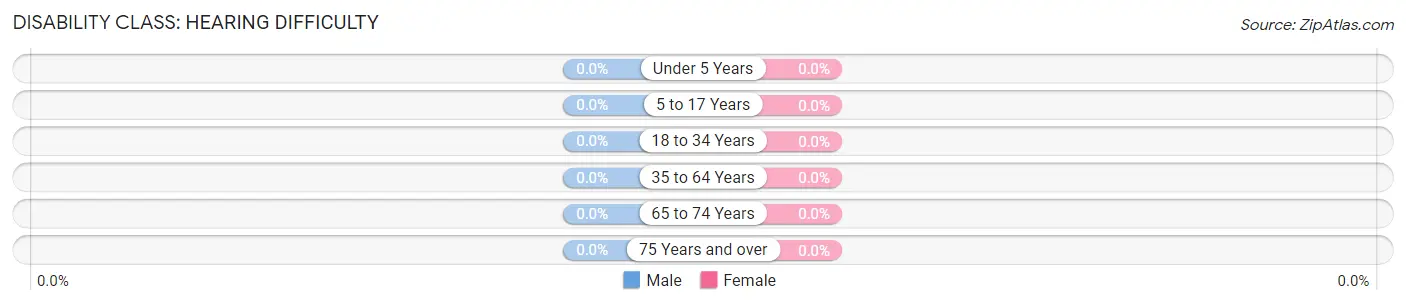
| Age Bracket | Male | Female |
| Under 5 Years | 0 (0.0%) | 0 (0.0%) |
| 5 to 17 Years | 0 (0.0%) | 0 (0.0%) |
| 18 to 34 Years | 0 (0.0%) | 0 (0.0%) |
| 35 to 64 Years | 0 (0.0%) | 0 (0.0%) |
| 65 to 74 Years | 0 (0.0%) | 0 (0.0%) |
| 75 Years and over | 0 (0.0%) | 0 (0.0%) |
Disability Class: Vision Difficulty
| Age Bracket | Male | Female |
| Under 5 Years | 0 (0.0%) | 0 (0.0%) |
| 5 to 17 Years | 0 (0.0%) | 0 (0.0%) |
| 18 to 34 Years | 0 (0.0%) | 0 (0.0%) |
| 35 to 64 Years | 0 (0.0%) | 0 (0.0%) |
| 65 to 74 Years | 0 (0.0%) | 0 (0.0%) |
| 75 Years and over | 0 (0.0%) | 0 (0.0%) |
Disability Class: Cognitive Difficulty
| Age Bracket | Male | Female |
| 5 to 17 Years | 0 (0.0%) | 0 (0.0%) |
| 18 to 34 Years | 0 (0.0%) | 0 (0.0%) |
| 35 to 64 Years | 0 (0.0%) | 0 (0.0%) |
| 65 to 74 Years | 0 (0.0%) | 0 (0.0%) |
| 75 Years and over | 0 (0.0%) | 0 (0.0%) |
Disability Class: Ambulatory Difficulty
| Age Bracket | Male | Female |
| 5 to 17 Years | 0 (0.0%) | 0 (0.0%) |
| 18 to 34 Years | 0 (0.0%) | 0 (0.0%) |
| 35 to 64 Years | 0 (0.0%) | 0 (0.0%) |
| 65 to 74 Years | 0 (0.0%) | 0 (0.0%) |
| 75 Years and over | 0 (0.0%) | 0 (0.0%) |
Disability Class: Self-Care Difficulty
| Age Bracket | Male | Female |
| 5 to 17 Years | 0 (0.0%) | 0 (0.0%) |
| 18 to 34 Years | 0 (0.0%) | 0 (0.0%) |
| 35 to 64 Years | 0 (0.0%) | 0 (0.0%) |
| 65 to 74 Years | 0 (0.0%) | 0 (0.0%) |
| 75 Years and over | 0 (0.0%) | 0 (0.0%) |
Technology Access in Seven Springs borough
Computing Device Access in Seven Springs borough
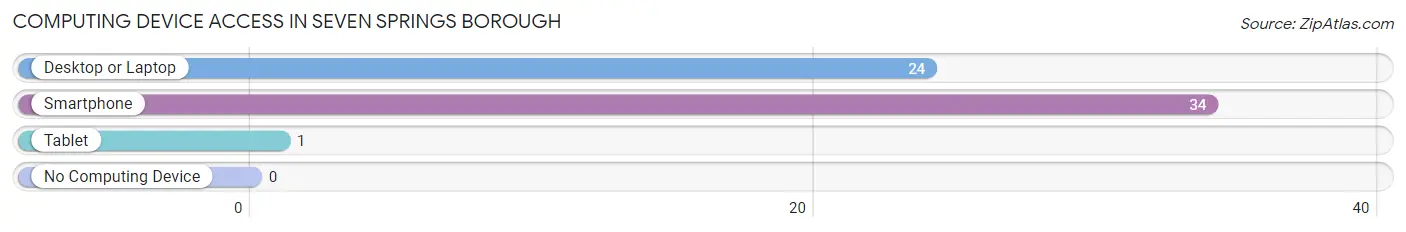
| Device Type | # Households | % Households |
| Desktop or Laptop | 24 | 70.6% |
| Smartphone | 34 | 100.0% |
| Tablet | 1 | 2.9% |
| No Computing Device | 0 | 0.0% |
| Total | 34 | 100.0% |
Internet Access in Seven Springs borough
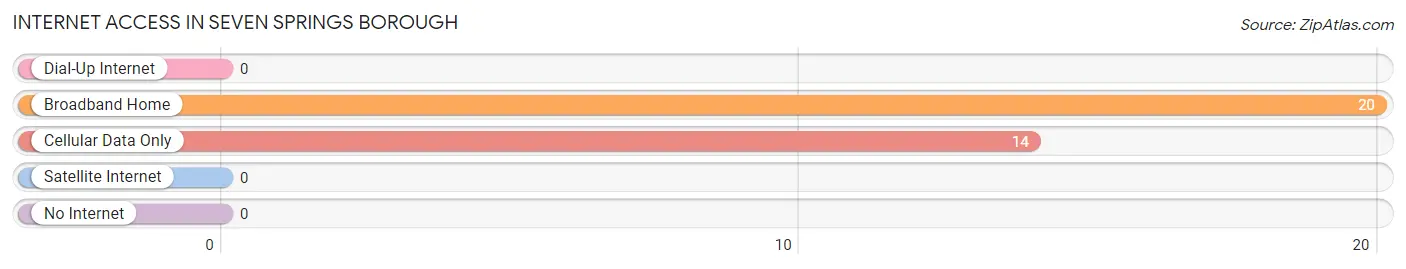
| Internet Type | # Households | % Households |
| Dial-Up Internet | 0 | 0.0% |
| Broadband Home | 20 | 58.8% |
| Cellular Data Only | 14 | 41.2% |
| Satellite Internet | 0 | 0.0% |
| No Internet | 0 | 0.0% |
| Total | 34 | 100.0% |
Seven Springs borough Summary
Seven Springs Borough is a small borough located in the south-central region of Pennsylvania. It is situated in the foothills of the Allegheny Mountains and is part of Somerset County. The borough is home to a population of just over 500 people and covers an area of 0.3 square miles.
History
The area that is now Seven Springs Borough was first settled in the late 1700s by German and Swiss immigrants. The first settlers were attracted to the area due to its abundance of natural resources, including timber and coal. The area was originally known as “Seven Springs” due to the seven natural springs that were located in the area.
In 1845, the area was officially incorporated as a borough. The borough was named after the seven springs that were located in the area. The borough was primarily an agricultural community, with the main crops being wheat, oats, and corn.
In the late 1800s, the borough began to experience a period of growth and development. The first railroad line was built in the area in 1887, connecting the borough to the nearby towns of Somerset and Johnstown. This allowed for the transportation of goods and people to and from the borough.
In the early 1900s, the borough experienced a period of industrialization. Several coal mines were opened in the area, providing employment for many of the borough’s residents. The borough also became a popular tourist destination, with several hotels and resorts being built in the area.
Geography
Seven Springs Borough is located in the south-central region of Pennsylvania. It is situated in the foothills of the Allegheny Mountains and is part of Somerset County. The borough is home to a population of just over 500 people and covers an area of 0.3 square miles.
The borough is located in a valley surrounded by mountains. The highest point in the borough is located at an elevation of 1,890 feet. The borough is located near several rivers, including the Stonycreek River, the Casselman River, and the Youghiogheny River.
Economy
The economy of Seven Springs Borough is primarily based on tourism and agriculture. The borough is home to several resorts and hotels, which attract visitors from all over the region. The borough is also home to several farms, which produce a variety of crops, including wheat, oats, and corn.
The borough is also home to several small businesses, including restaurants, shops, and other services. The borough is also home to several manufacturing companies, which produce a variety of products, including furniture, clothing, and electronics.
Demographics
As of the 2010 census, the population of Seven Springs Borough was 517. The racial makeup of the borough was 97.3% White, 0.6% African American, 0.2% Native American, 0.4% Asian, and 1.5% from other races. Hispanic or Latino of any race were 1.2% of the population.
The median household income in the borough was $41,250, and the median family income was $45,833. The per capita income in the borough was $20,945. About 8.3% of families and 10.2% of the population were below the poverty line, including 14.3% of those under age 18 and 6.3% of those age 65 or over.
Common Questions
What is Per Capita Income in Seven Springs borough?
Per Capita income in Seven Springs borough is $55,753.
What is the Median Household income in Seven Springs borough?
Median Household Income in Seven Springs borough is $41,250.
What is Inequality or Gini Index in Seven Springs borough?
Inequality or Gini Index in Seven Springs borough is 0.42.
What is the Total Population of Seven Springs borough?
Total Population of Seven Springs borough is 38.
What is the Total Male Population of Seven Springs borough?
Total Male Population of Seven Springs borough is 13.
What is the Total Female Population of Seven Springs borough?
Total Female Population of Seven Springs borough is 25.
What is the Ratio of Males per 100 Females in Seven Springs borough?
There are 52.00 Males per 100 Females in Seven Springs borough.
What is the Ratio of Females per 100 Males in Seven Springs borough?
There are 192.31 Females per 100 Males in Seven Springs borough.
What is the Median Population Age in Seven Springs borough?
Median Population Age in Seven Springs borough is 29.0 Years.
What is the Average Family Size in Seven Springs borough
Average Family Size in Seven Springs borough is 2.0 People.
What is the Average Household Size in Seven Springs borough
Average Household Size in Seven Springs borough is 1.0 People.
How Large is the Labor Force in Seven Springs borough?
There are 32 People in the Labor Forcein in Seven Springs borough.
What is the Percentage of People in the Labor Force in Seven Springs borough?
86.5% of People are in the Labor Force in Seven Springs borough.