Trexlertown, PA Map & Demographics
Trexlertown Map
Trexlertown Overview
$45,024
PER CAPITA INCOME
$142,909
AVG FAMILY INCOME
$93,472
AVG HOUSEHOLD INCOME
18.8%
WAGE / INCOME GAP [ % ]
81.2¢/ $1
WAGE / INCOME GAP [ $ ]
0.31
INEQUALITY / GINI INDEX
1,885
TOTAL POPULATION
905
MALE POPULATION
980
FEMALE POPULATION
92.35
MALES / 100 FEMALES
108.29
FEMALES / 100 MALES
34.6
MEDIAN AGE
3.1
AVG FAMILY SIZE
2.4
AVG HOUSEHOLD SIZE
1,229
LABOR FORCE [ PEOPLE ]
85.3%
PERCENT IN LABOR FORCE
Trexlertown Zip Codes
Trexlertown Area Codes
Income in Trexlertown
Income Overview in Trexlertown
Per Capita Income in Trexlertown is $45,024, while median incomes of families and households are $142,909 and $93,472 respectively.
| Characteristic | Number | Measure |
| Per Capita Income | 1,885 | $45,024 |
| Median Family Income | 497 | $142,909 |
| Mean Family Income | 497 | $133,798 |
| Median Household Income | 759 | $93,472 |
| Mean Household Income | 759 | $114,484 |
| Income Deficit | 497 | $0 |
| Wage / Income Gap (%) | 1,885 | 18.80% |
| Wage / Income Gap ($) | 1,885 | 81.20¢ per $1 |
| Gini / Inequality Index | 1,885 | 0.31 |
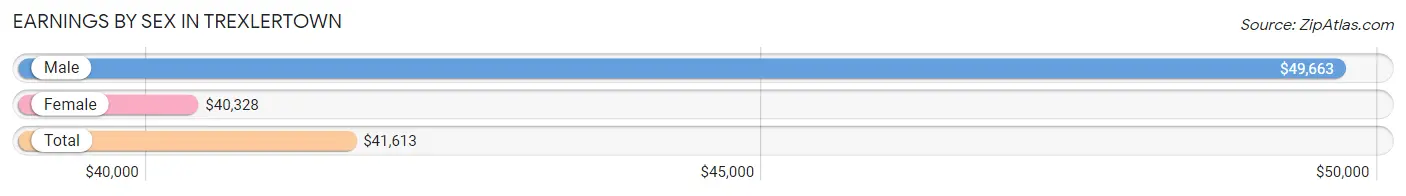
Earnings by Sex in Trexlertown
Average Earnings in Trexlertown are $41,613, $49,663 for men and $40,328 for women, a difference of 18.8%.
| Sex | Number | Average Earnings |
| Male | 572 (45.8%) | $49,663 |
| Female | 678 (54.2%) | $40,328 |
| Total | 1,250 (100.0%) | $41,613 |
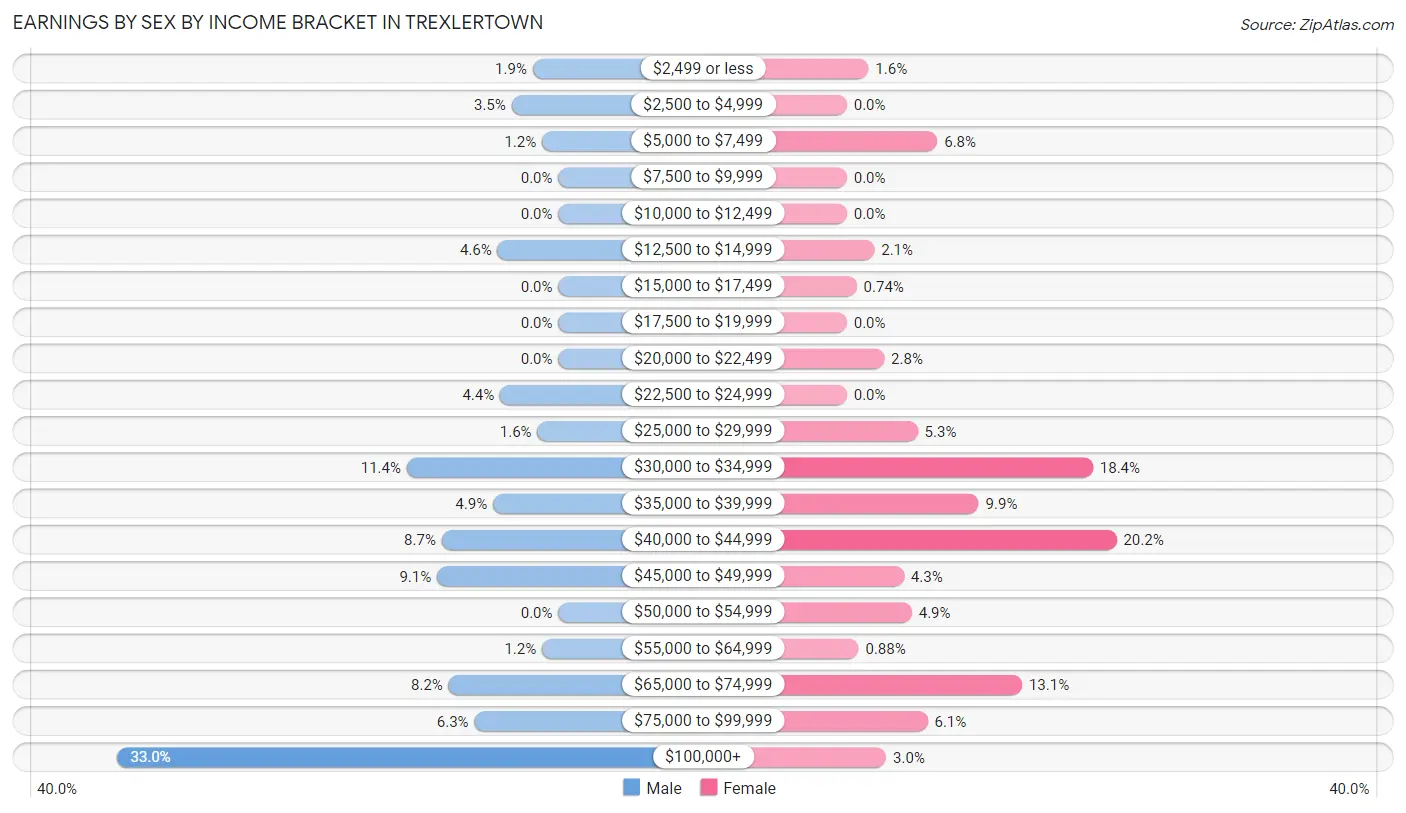
Earnings by Sex by Income Bracket in Trexlertown
The most common earnings brackets in Trexlertown are $100,000+ for men (189 | 33.0%) and $40,000 to $44,999 for women (137 | 20.2%).
| Income | Male | Female |
| $2,499 or less | 11 (1.9%) | 11 (1.6%) |
| $2,500 to $4,999 | 20 (3.5%) | 0 (0.0%) |
| $5,000 to $7,499 | 7 (1.2%) | 46 (6.8%) |
| $7,500 to $9,999 | 0 (0.0%) | 0 (0.0%) |
| $10,000 to $12,499 | 0 (0.0%) | 0 (0.0%) |
| $12,500 to $14,999 | 26 (4.5%) | 14 (2.1%) |
| $15,000 to $17,499 | 0 (0.0%) | 5 (0.7%) |
| $17,500 to $19,999 | 0 (0.0%) | 0 (0.0%) |
| $20,000 to $22,499 | 0 (0.0%) | 19 (2.8%) |
| $22,500 to $24,999 | 25 (4.4%) | 0 (0.0%) |
| $25,000 to $29,999 | 9 (1.6%) | 36 (5.3%) |
| $30,000 to $34,999 | 65 (11.4%) | 125 (18.4%) |
| $35,000 to $39,999 | 28 (4.9%) | 67 (9.9%) |
| $40,000 to $44,999 | 50 (8.7%) | 137 (20.2%) |
| $45,000 to $49,999 | 52 (9.1%) | 29 (4.3%) |
| $50,000 to $54,999 | 0 (0.0%) | 33 (4.9%) |
| $55,000 to $64,999 | 7 (1.2%) | 6 (0.9%) |
| $65,000 to $74,999 | 47 (8.2%) | 89 (13.1%) |
| $75,000 to $99,999 | 36 (6.3%) | 41 (6.0%) |
| $100,000+ | 189 (33.0%) | 20 (2.9%) |
| Total | 572 (100.0%) | 678 (100.0%) |
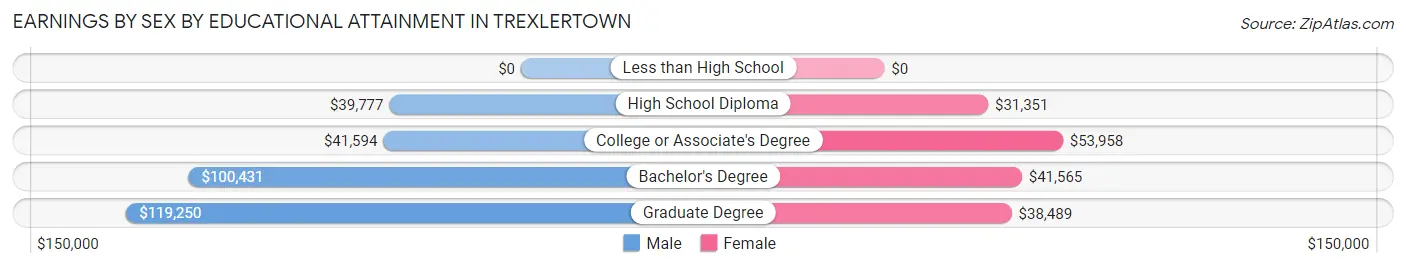
Earnings by Sex by Educational Attainment in Trexlertown
Average earnings in Trexlertown are $66,920 for men and $40,584 for women, a difference of 39.4%. Men with an educational attainment of graduate degree enjoy the highest average annual earnings of $119,250, while those with high school diploma education earn the least with $39,777. Women with an educational attainment of college or associate's degree earn the most with the average annual earnings of $53,958, while those with high school diploma education have the smallest earnings of $31,351.
| Educational Attainment | Male Income | Female Income |
| Less than High School | - | - |
| High School Diploma | $39,777 | $31,351 |
| College or Associate's Degree | $41,594 | $53,958 |
| Bachelor's Degree | $100,431 | $41,565 |
| Graduate Degree | $119,250 | $38,489 |
| Total | $66,920 | $40,584 |
Family Income in Trexlertown
Family Income Brackets in Trexlertown
According to the Trexlertown family income data, there are 227 families falling into the $100,000 to $149,999 income range, which is the most common income bracket and makes up 45.7% of all families.
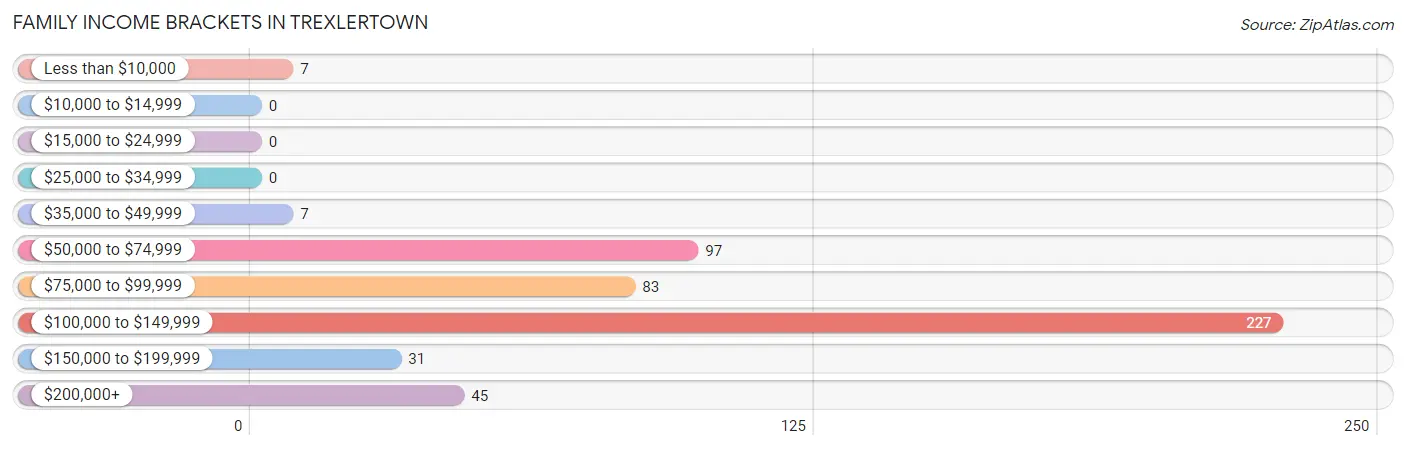
| Income Bracket | # Families | % Families |
| Less than $10,000 | 7 | 1.4% |
| $10,000 to $14,999 | 0 | 0.0% |
| $15,000 to $24,999 | 0 | 0.0% |
| $25,000 to $34,999 | 0 | 0.0% |
| $35,000 to $49,999 | 7 | 1.4% |
| $50,000 to $74,999 | 97 | 19.5% |
| $75,000 to $99,999 | 83 | 16.7% |
| $100,000 to $149,999 | 227 | 45.7% |
| $150,000 to $199,999 | 31 | 6.2% |
| $200,000+ | 45 | 9.1% |
Family Income by Famaliy Size in Trexlertown
3-person families (108 | 21.7%) account for the highest median family income in Trexlertown with $148,942 per family, while 2-person families (213 | 42.9%) have the highest median income of $71,598 per family member.
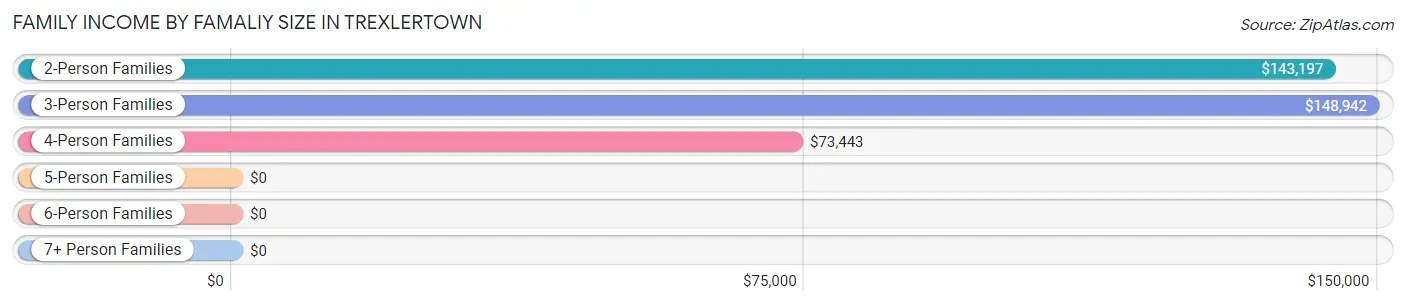
| Income Bracket | # Families | Median Income |
| 2-Person Families | 213 (42.9%) | $143,197 |
| 3-Person Families | 108 (21.7%) | $148,942 |
| 4-Person Families | 94 (18.9%) | $73,443 |
| 5-Person Families | 42 (8.5%) | $0 |
| 6-Person Families | 40 (8.1%) | $0 |
| 7+ Person Families | 0 (0.0%) | $0 |
| Total | 497 (100.0%) | $142,909 |
Family Income by Number of Earners in Trexlertown
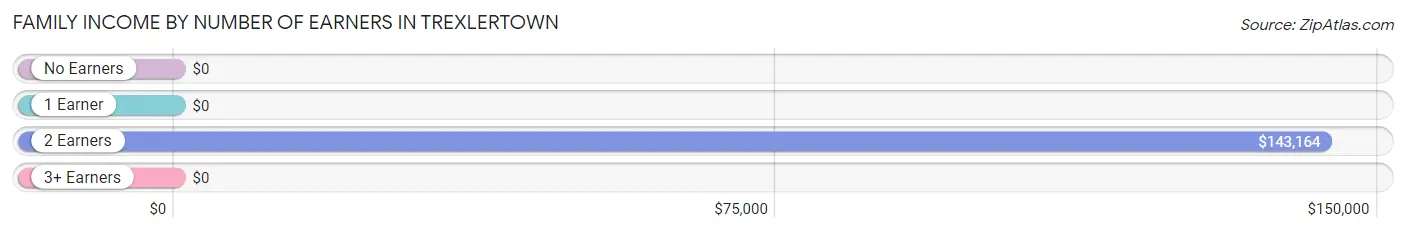
| Number of Earners | # Families | Median Income |
| No Earners | 14 (2.8%) | $0 |
| 1 Earner | 16 (3.2%) | $0 |
| 2 Earners | 412 (82.9%) | $143,164 |
| 3+ Earners | 55 (11.1%) | $0 |
| Total | 497 (100.0%) | $142,909 |
Household Income in Trexlertown
Household Income Brackets in Trexlertown
With 246 households falling in the category, the $50,000 to $74,999 income range is the most frequent in Trexlertown, accounting for 32.4% of all households.
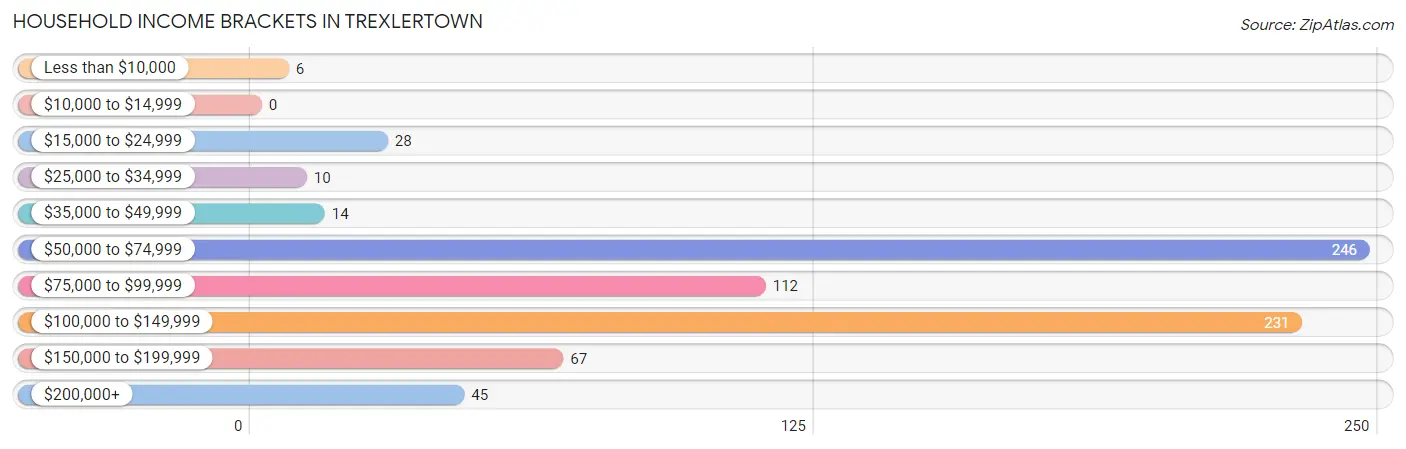
| Income Bracket | # Households | % Households |
| Less than $10,000 | 6 | 0.8% |
| $10,000 to $14,999 | 0 | 0.0% |
| $15,000 to $24,999 | 28 | 3.7% |
| $25,000 to $34,999 | 10 | 1.3% |
| $35,000 to $49,999 | 14 | 1.8% |
| $50,000 to $74,999 | 246 | 32.4% |
| $75,000 to $99,999 | 112 | 14.8% |
| $100,000 to $149,999 | 231 | 30.4% |
| $150,000 to $199,999 | 67 | 8.8% |
| $200,000+ | 45 | 5.9% |
Household Income by Householder Age in Trexlertown
The median household income in Trexlertown is $93,472, with the highest median household income of $142,843 found in the 25 to 44 years age bracket for the primary householder. A total of 421 households (55.5%) fall into this category.
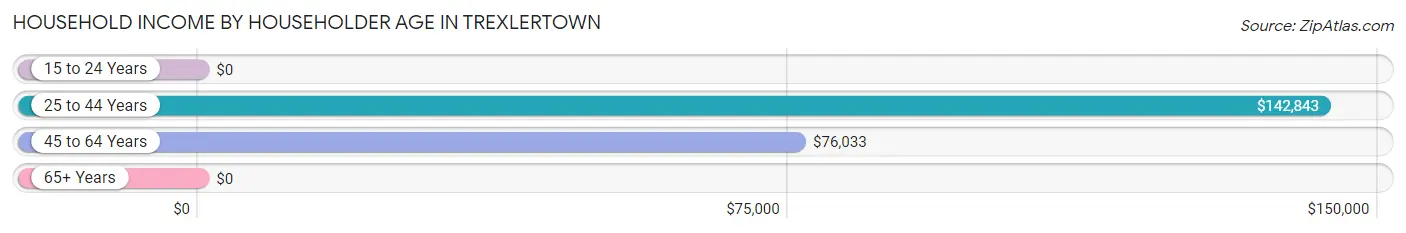
| Income Bracket | # Households | Median Income |
| 15 to 24 Years | 0 (0.0%) | $0 |
| 25 to 44 Years | 421 (55.5%) | $142,843 |
| 45 to 64 Years | 217 (28.6%) | $76,033 |
| 65+ Years | 121 (15.9%) | $0 |
| Total | 759 (100.0%) | $93,472 |
Poverty in Trexlertown
Income Below Poverty by Sex and Age in Trexlertown
With 1.0% poverty level for males and 1.5% for females among the residents of Trexlertown, 45 to 54 year old males and 6 to 11 year old females are the most vulnerable to poverty, with 6 males (6.3%) and 7 females (21.9%) in their respective age groups living below the poverty level.
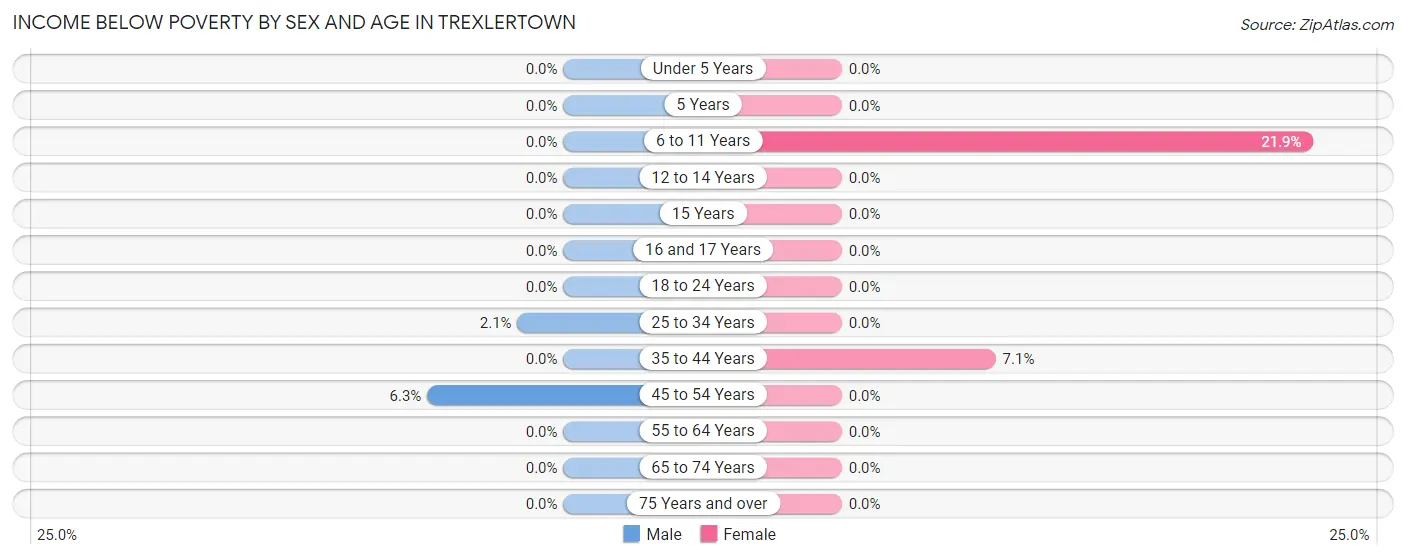
| Age Bracket | Male | Female |
| Under 5 Years | 0 (0.0%) | 0 (0.0%) |
| 5 Years | 0 (0.0%) | 0 (0.0%) |
| 6 to 11 Years | 0 (0.0%) | 7 (21.9%) |
| 12 to 14 Years | 0 (0.0%) | 0 (0.0%) |
| 15 Years | 0 (0.0%) | 0 (0.0%) |
| 16 and 17 Years | 0 (0.0%) | 0 (0.0%) |
| 18 to 24 Years | 0 (0.0%) | 0 (0.0%) |
| 25 to 34 Years | 3 (2.1%) | 0 (0.0%) |
| 35 to 44 Years | 0 (0.0%) | 7 (7.1%) |
| 45 to 54 Years | 6 (6.3%) | 0 (0.0%) |
| 55 to 64 Years | 0 (0.0%) | 0 (0.0%) |
| 65 to 74 Years | 0 (0.0%) | 0 (0.0%) |
| 75 Years and over | 0 (0.0%) | 0 (0.0%) |
| Total | 9 (1.0%) | 14 (1.5%) |
Income Above Poverty by Sex and Age in Trexlertown
According to the poverty statistics in Trexlertown, males aged under 5 years and females aged under 5 years are the age groups that are most secure financially, with 100.0% of males and 100.0% of females in these age groups living above the poverty line.
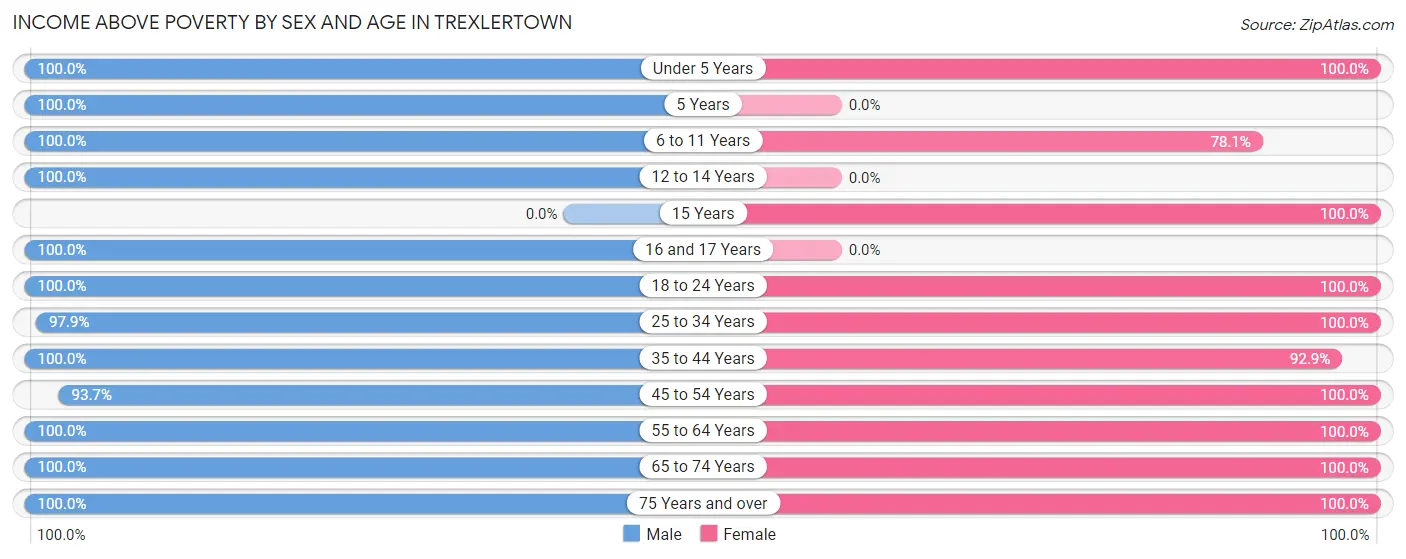
| Age Bracket | Male | Female |
| Under 5 Years | 178 (100.0%) | 123 (100.0%) |
| 5 Years | 22 (100.0%) | 0 (0.0%) |
| 6 to 11 Years | 57 (100.0%) | 25 (78.1%) |
| 12 to 14 Years | 7 (100.0%) | 0 (0.0%) |
| 15 Years | 0 (0.0%) | 22 (100.0%) |
| 16 and 17 Years | 10 (100.0%) | 0 (0.0%) |
| 18 to 24 Years | 61 (100.0%) | 25 (100.0%) |
| 25 to 34 Years | 138 (97.9%) | 289 (100.0%) |
| 35 to 44 Years | 200 (100.0%) | 91 (92.9%) |
| 45 to 54 Years | 89 (93.7%) | 195 (100.0%) |
| 55 to 64 Years | 46 (100.0%) | 87 (100.0%) |
| 65 to 74 Years | 10 (100.0%) | 46 (100.0%) |
| 75 Years and over | 65 (100.0%) | 16 (100.0%) |
| Total | 883 (99.0%) | 919 (98.5%) |
Income Below Poverty Among Married-Couple Families in Trexlertown
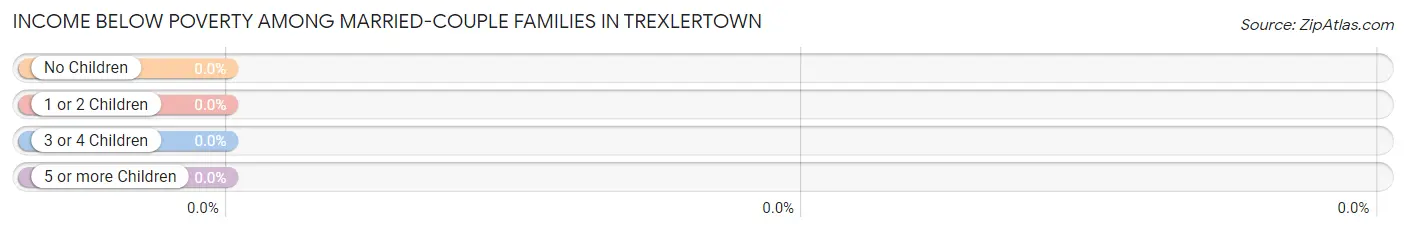
| Children | Above Poverty | Below Poverty |
| No Children | 199 (100.0%) | 0 (0.0%) |
| 1 or 2 Children | 218 (100.0%) | 0 (0.0%) |
| 3 or 4 Children | 40 (100.0%) | 0 (0.0%) |
| 5 or more Children | 0 (0.0%) | 0 (0.0%) |
| Total | 457 (100.0%) | 0 (0.0%) |
Income Below Poverty Among Single-Parent Households in Trexlertown
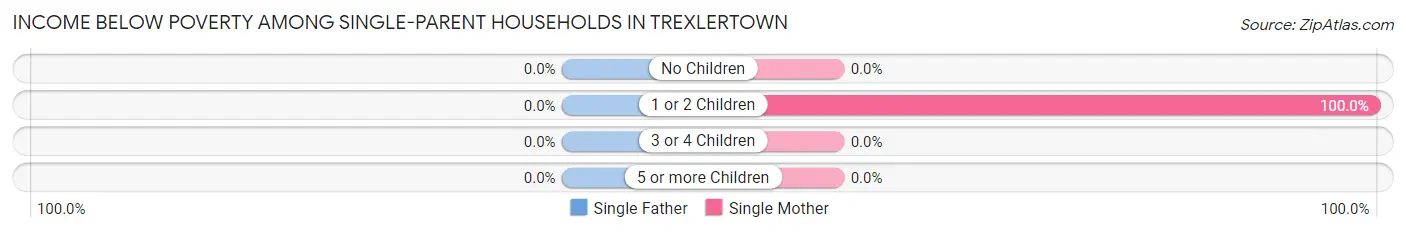
| Children | Single Father | Single Mother |
| No Children | 0 (0.0%) | 0 (0.0%) |
| 1 or 2 Children | 0 (0.0%) | 7 (100.0%) |
| 3 or 4 Children | 0 (0.0%) | 0 (0.0%) |
| 5 or more Children | 0 (0.0%) | 0 (0.0%) |
| Total | 0 (0.0%) | 7 (17.5%) |
Income Below Poverty Among Married-Couple vs Single-Parent Households in Trexlertown
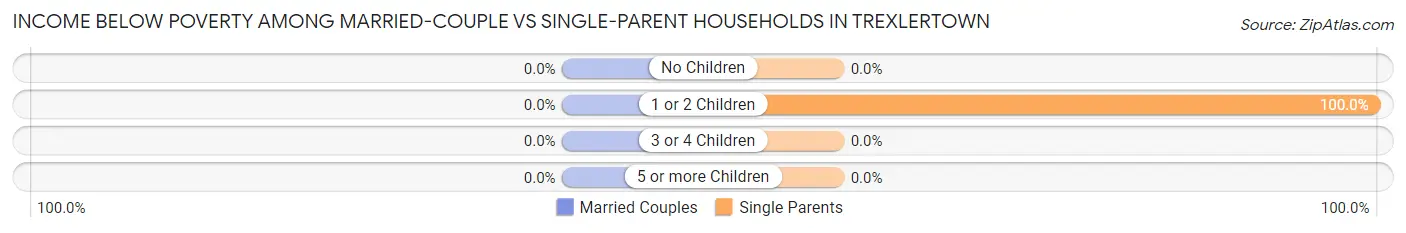
| Children | Married-Couple Families | Single-Parent Households |
| No Children | 0 (0.0%) | 0 (0.0%) |
| 1 or 2 Children | 0 (0.0%) | 7 (100.0%) |
| 3 or 4 Children | 0 (0.0%) | 0 (0.0%) |
| 5 or more Children | 0 (0.0%) | 0 (0.0%) |
| Total | 0 (0.0%) | 7 (17.5%) |
Race in Trexlertown
The most populous races in Trexlertown are White / Caucasian (1,323 | 70.2%), Black / African American (346 | 18.4%), and Asian (199 | 10.6%).
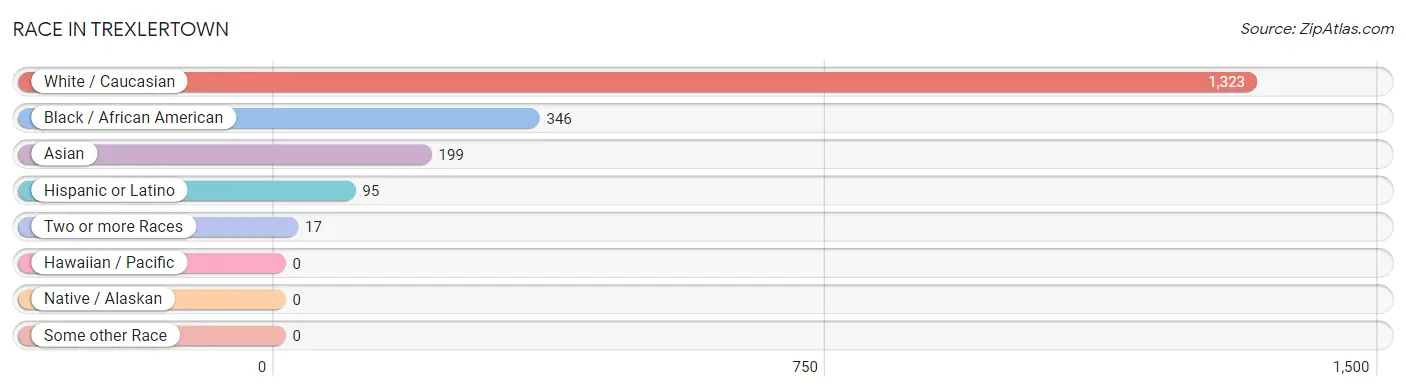
| Race | # Population | % Population |
| Asian | 199 | 10.6% |
| Black / African American | 346 | 18.4% |
| Hawaiian / Pacific | 0 | 0.0% |
| Hispanic or Latino | 95 | 5.0% |
| Native / Alaskan | 0 | 0.0% |
| White / Caucasian | 1,323 | 70.2% |
| Two or more Races | 17 | 0.9% |
| Some other Race | 0 | 0.0% |
| Total | 1,885 | 100.0% |
Ancestry in Trexlertown
The most populous ancestries reported in Trexlertown are German (268 | 14.2%), Subsaharan African (243 | 12.9%), Ethiopian (240 | 12.7%), American (233 | 12.4%), and Romanian (228 | 12.1%), together accounting for 64.3% of all Trexlertown residents.
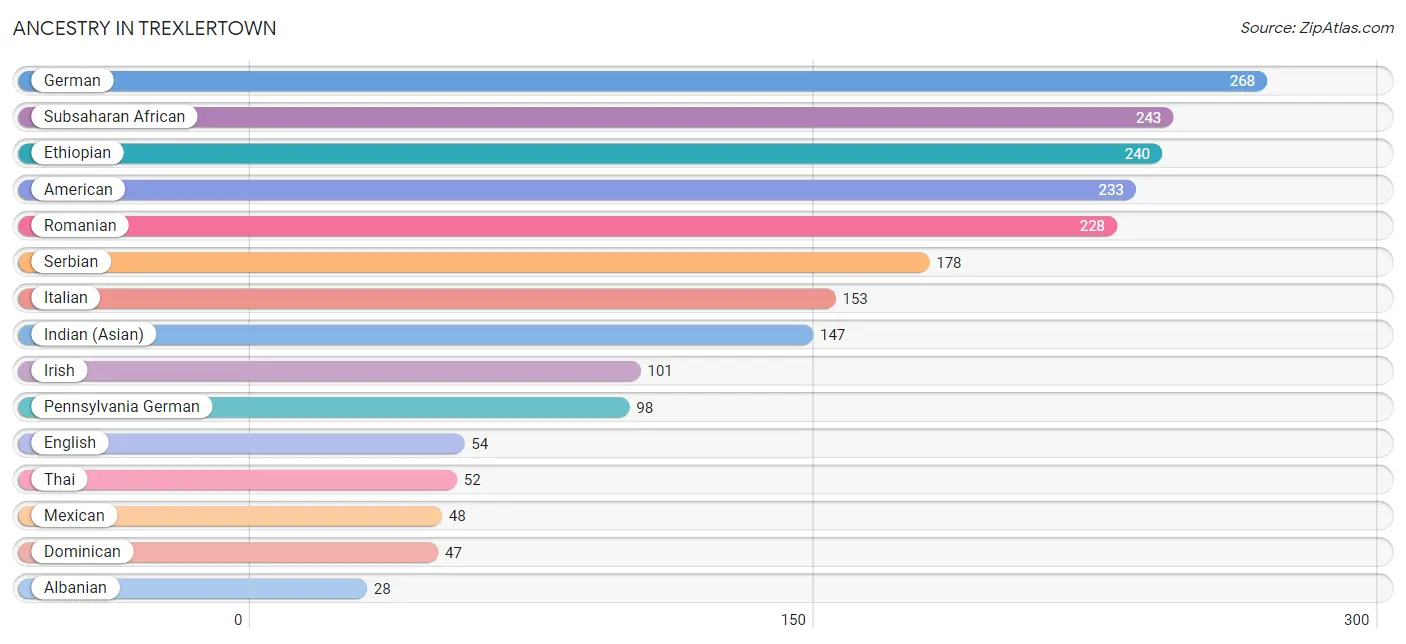
| Ancestry | # Population | % Population |
| African | 3 | 0.2% |
| Albanian | 28 | 1.5% |
| American | 233 | 12.4% |
| Arab | 4 | 0.2% |
| Austrian | 4 | 0.2% |
| Barbadian | 23 | 1.2% |
| British | 8 | 0.4% |
| Danish | 3 | 0.2% |
| Dominican | 47 | 2.5% |
| Egyptian | 4 | 0.2% |
| English | 54 | 2.9% |
| Ethiopian | 240 | 12.7% |
| French | 8 | 0.4% |
| French Canadian | 7 | 0.4% |
| German | 268 | 14.2% |
| Greek | 4 | 0.2% |
| Hungarian | 4 | 0.2% |
| Indian (Asian) | 147 | 7.8% |
| Irish | 101 | 5.4% |
| Italian | 153 | 8.1% |
| Kiowa | 3 | 0.2% |
| Lithuanian | 6 | 0.3% |
| Mexican | 48 | 2.5% |
| Pennsylvania German | 98 | 5.2% |
| Romanian | 228 | 12.1% |
| Russian | 27 | 1.4% |
| Serbian | 178 | 9.4% |
| Slovak | 9 | 0.5% |
| Subsaharan African | 243 | 12.9% |
| Swedish | 20 | 1.1% |
| Thai | 52 | 2.8% | View All 31 Rows |
Immigrants in Trexlertown
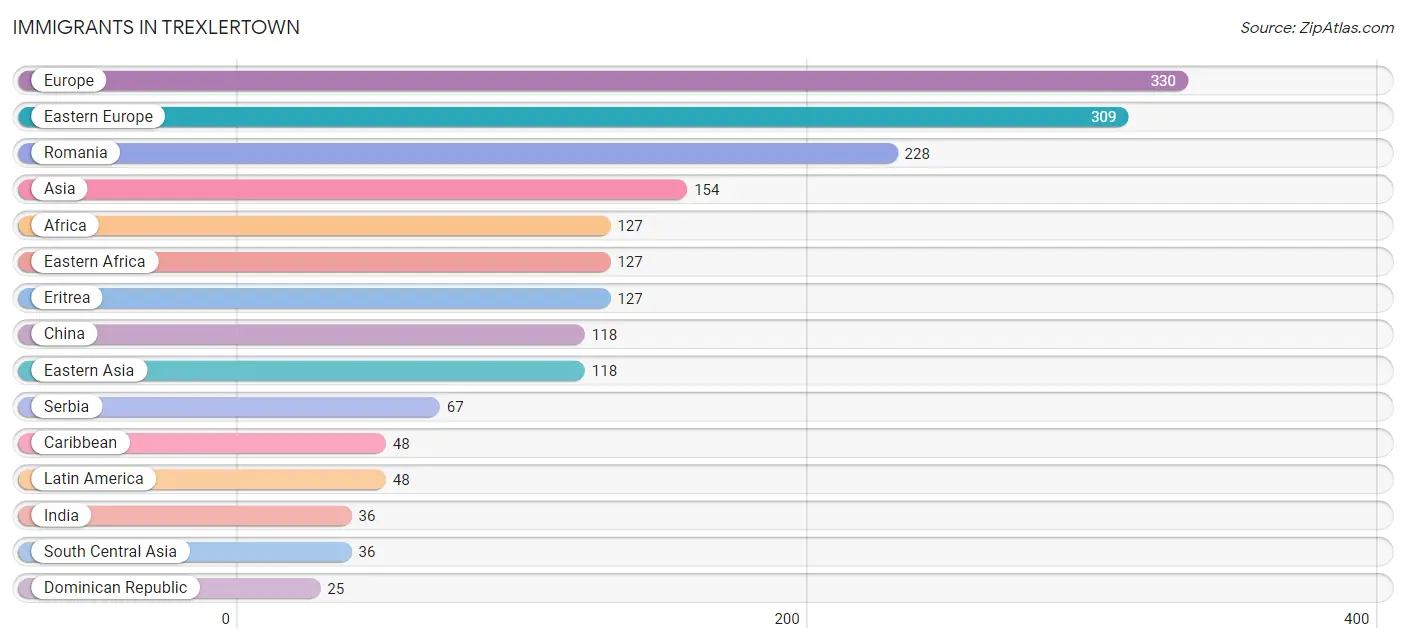
The most numerous immigrant groups reported in Trexlertown came from Europe (330 | 17.5%), Eastern Europe (309 | 16.4%), Romania (228 | 12.1%), Asia (154 | 8.2%), and Africa (127 | 6.7%), together accounting for 60.9% of all Trexlertown residents.
| Immigration Origin | # Population | % Population |
| Africa | 127 | 6.7% |
| Asia | 154 | 8.2% |
| Austria | 4 | 0.2% |
| Barbados | 23 | 1.2% |
| Caribbean | 48 | 2.5% |
| China | 118 | 6.3% |
| Dominican Republic | 25 | 1.3% |
| Eastern Africa | 127 | 6.7% |
| Eastern Asia | 118 | 6.3% |
| Eastern Europe | 309 | 16.4% |
| Eritrea | 127 | 6.7% |
| Europe | 330 | 17.5% |
| India | 36 | 1.9% |
| Italy | 5 | 0.3% |
| Latin America | 48 | 2.5% |
| Northern Europe | 12 | 0.6% |
| Romania | 228 | 12.1% |
| Serbia | 67 | 3.5% |
| South Central Asia | 36 | 1.9% |
| Southern Europe | 5 | 0.3% |
| Western Europe | 4 | 0.2% | View All 21 Rows |
Sex and Age in Trexlertown
Sex and Age in Trexlertown
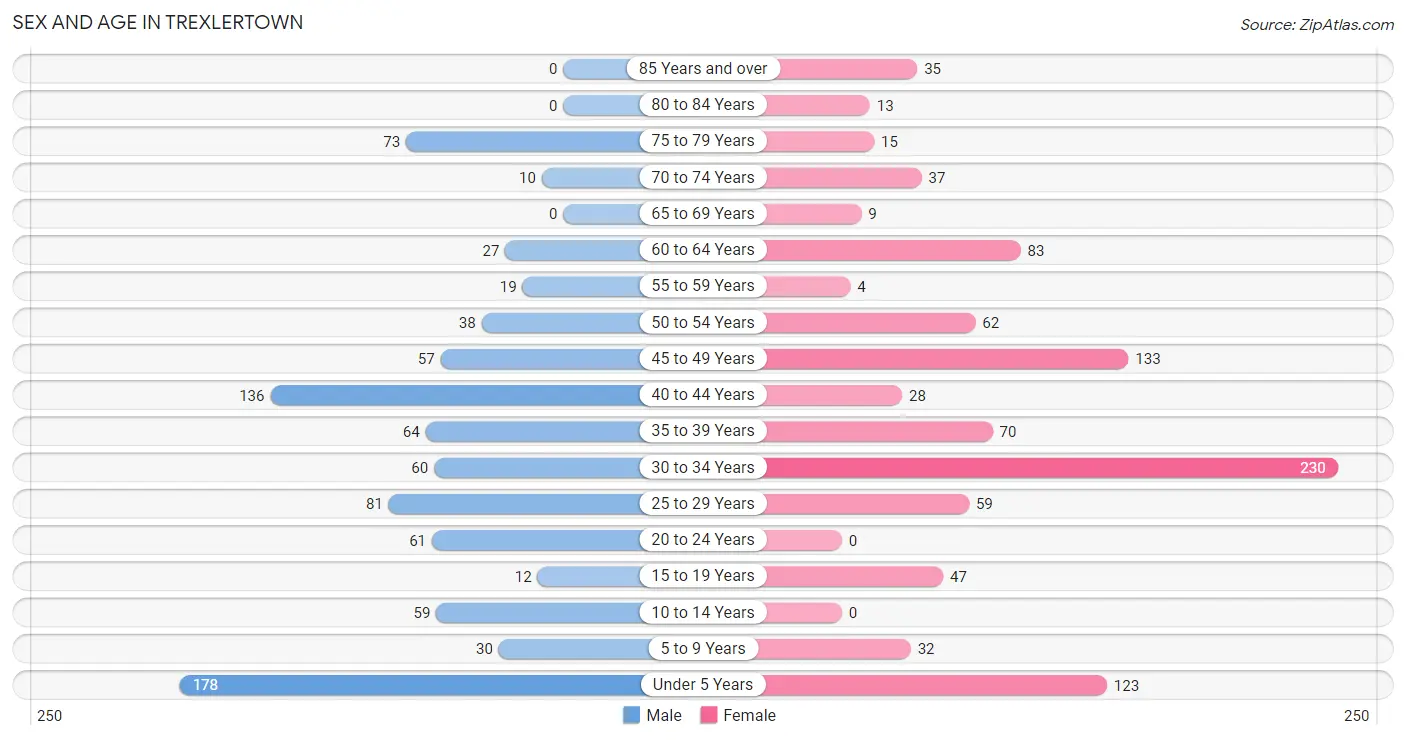
The most populous age groups in Trexlertown are Under 5 Years (178 | 19.7%) for men and 30 to 34 Years (230 | 23.5%) for women.
| Age Bracket | Male | Female |
| Under 5 Years | 178 (19.7%) | 123 (12.6%) |
| 5 to 9 Years | 30 (3.3%) | 32 (3.3%) |
| 10 to 14 Years | 59 (6.5%) | 0 (0.0%) |
| 15 to 19 Years | 12 (1.3%) | 47 (4.8%) |
| 20 to 24 Years | 61 (6.7%) | 0 (0.0%) |
| 25 to 29 Years | 81 (8.9%) | 59 (6.0%) |
| 30 to 34 Years | 60 (6.6%) | 230 (23.5%) |
| 35 to 39 Years | 64 (7.1%) | 70 (7.1%) |
| 40 to 44 Years | 136 (15.0%) | 28 (2.9%) |
| 45 to 49 Years | 57 (6.3%) | 133 (13.6%) |
| 50 to 54 Years | 38 (4.2%) | 62 (6.3%) |
| 55 to 59 Years | 19 (2.1%) | 4 (0.4%) |
| 60 to 64 Years | 27 (3.0%) | 83 (8.5%) |
| 65 to 69 Years | 0 (0.0%) | 9 (0.9%) |
| 70 to 74 Years | 10 (1.1%) | 37 (3.8%) |
| 75 to 79 Years | 73 (8.1%) | 15 (1.5%) |
| 80 to 84 Years | 0 (0.0%) | 13 (1.3%) |
| 85 Years and over | 0 (0.0%) | 35 (3.6%) |
| Total | 905 (100.0%) | 980 (100.0%) |
Families and Households in Trexlertown
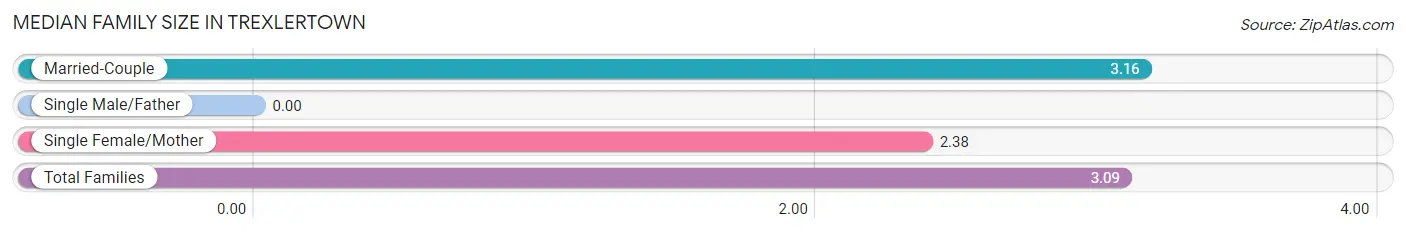
Median Family Size in Trexlertown
| Family Type | # Families | Family Size |
| Married-Couple | 457 (91.9%) | 3.16 |
| Single Male/Father | 0 (0.0%) | - |
| Single Female/Mother | 40 (8.1%) | 2.38 |
| Total Families | 497 (100.0%) | 3.09 |
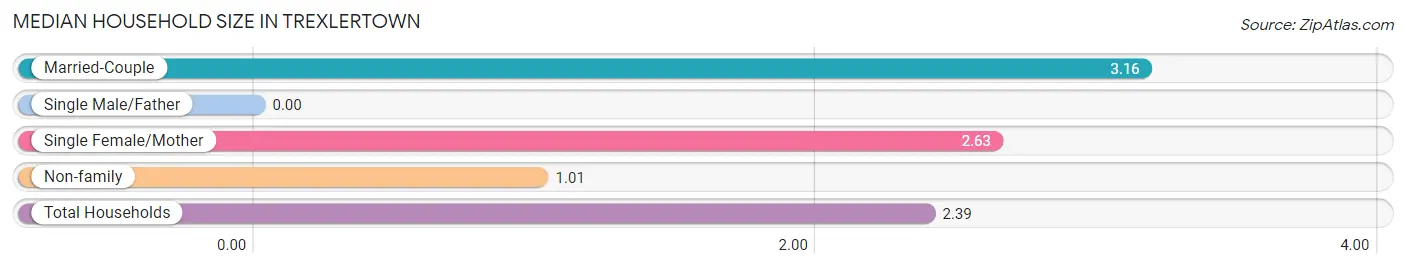
Median Household Size in Trexlertown
| Household Type | # Households | Household Size |
| Married-Couple | 457 (60.2%) | 3.16 |
| Single Male/Father | 0 (0.0%) | - |
| Single Female/Mother | 40 (5.3%) | 2.63 |
| Non-family | 262 (34.5%) | 1.01 |
| Total Households | 759 (100.0%) | 2.39 |
Household Size by Marriage Status in Trexlertown
Out of a total of 759 households in Trexlertown, 497 (65.5%) are family households, while 262 (34.5%) are nonfamily households. The most numerous type of family households are 2-person households, comprising 206, and the most common type of nonfamily households are 1-person households, comprising 256.
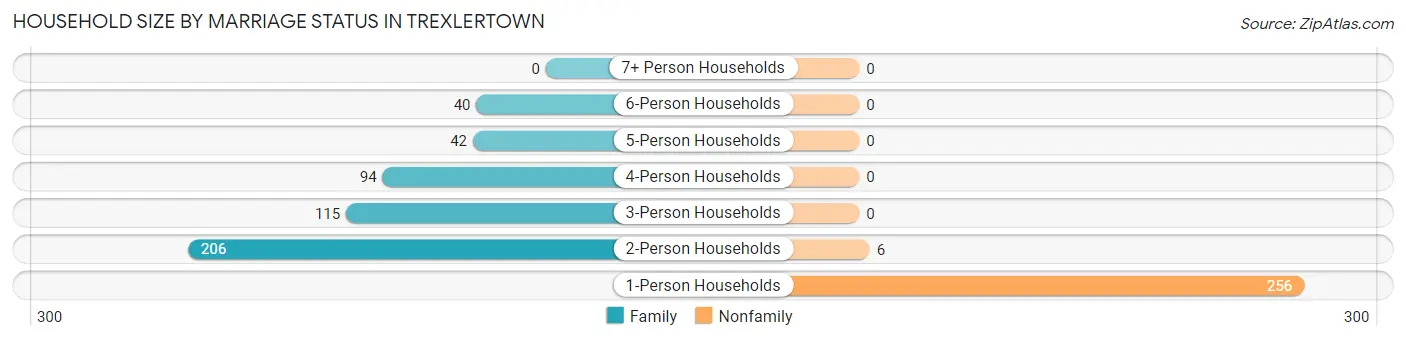
| Household Size | Family Households | Nonfamily Households |
| 1-Person Households | - | 256 (33.7%) |
| 2-Person Households | 206 (27.1%) | 6 (0.8%) |
| 3-Person Households | 115 (15.1%) | 0 (0.0%) |
| 4-Person Households | 94 (12.4%) | 0 (0.0%) |
| 5-Person Households | 42 (5.5%) | 0 (0.0%) |
| 6-Person Households | 40 (5.3%) | 0 (0.0%) |
| 7+ Person Households | 0 (0.0%) | 0 (0.0%) |
| Total | 497 (65.5%) | 262 (34.5%) |
Female Fertility in Trexlertown
Fertility by Age in Trexlertown
Average fertility rate in Trexlertown is 257.0 births per 1,000 women. Women in the age bracket of 20 to 34 years have the highest fertility rate with 522.0 births per 1,000 women. Women in the age bracket of 20 to 34 years acount for 100.0% of all women with births.
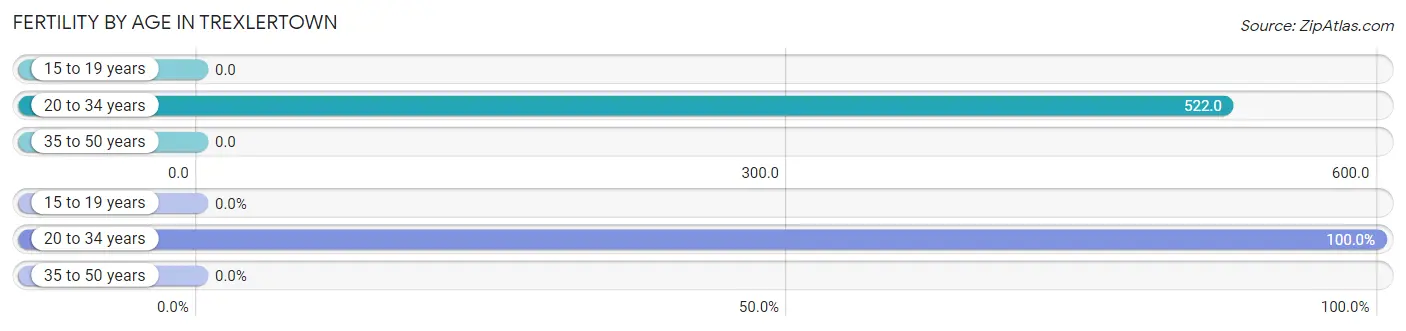
| Age Bracket | Women with Births | Births / 1,000 Women |
| 15 to 19 years | 0 (0.0%) | 0.0 |
| 20 to 34 years | 151 (100.0%) | 522.0 |
| 35 to 50 years | 0 (0.0%) | 0.0 |
| Total | 151 (100.0%) | 257.0 |
Fertility by Age by Marriage Status in Trexlertown
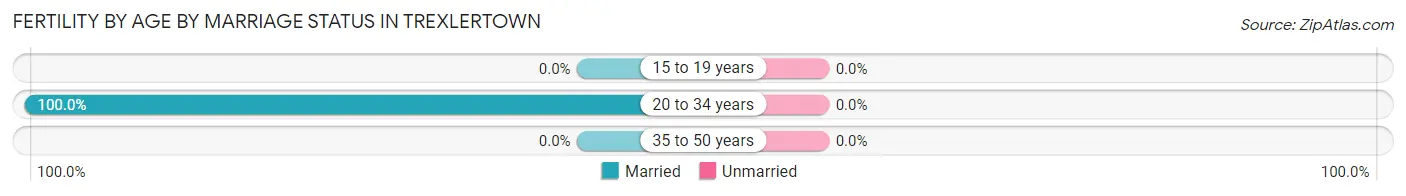
| Age Bracket | Married | Unmarried |
| 15 to 19 years | 0 (0.0%) | 0 (0.0%) |
| 20 to 34 years | 151 (100.0%) | 0 (0.0%) |
| 35 to 50 years | 0 (0.0%) | 0 (0.0%) |
| Total | 151 (100.0%) | 0 (0.0%) |
Fertility by Education in Trexlertown
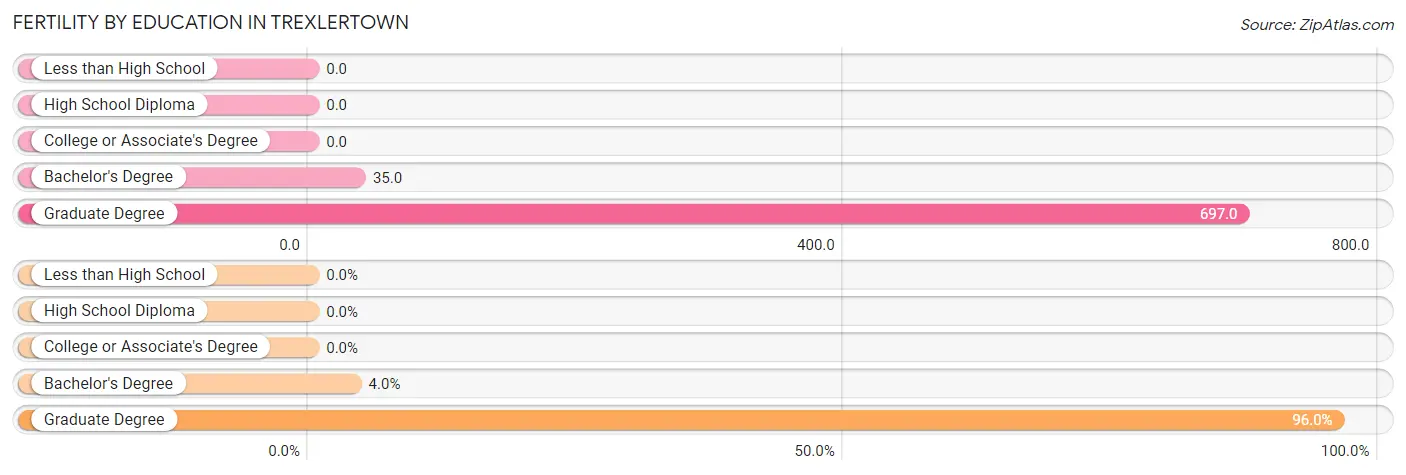
| Educational Attainment | Women with Births | Births / 1,000 Women |
| Less than High School | 0 (0.0%) | 0.0 |
| High School Diploma | 0 (0.0%) | 0.0 |
| College or Associate's Degree | 0 (0.0%) | 0.0 |
| Bachelor's Degree | 6 (4.0%) | 35.0 |
| Graduate Degree | 145 (96.0%) | 697.0 |
| Total | 151 (100.0%) | 257.0 |
Fertility by Education by Marriage Status in Trexlertown
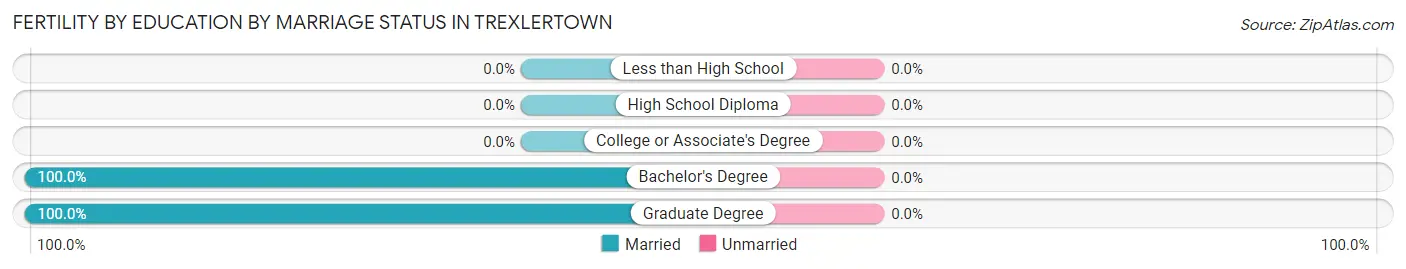
| Educational Attainment | Married | Unmarried |
| Less than High School | 0 (0.0%) | 0 (0.0%) |
| High School Diploma | 0 (0.0%) | 0 (0.0%) |
| College or Associate's Degree | 0 (0.0%) | 0 (0.0%) |
| Bachelor's Degree | 6 (100.0%) | 0 (0.0%) |
| Graduate Degree | 145 (100.0%) | 0 (0.0%) |
| Total | 151 (100.0%) | 0 (0.0%) |
Employment Characteristics in Trexlertown
Employment by Class of Employer in Trexlertown
Among the 1,156 employed individuals in Trexlertown, private company employees (857 | 74.1%), not-for-profit organizations (162 | 14.0%), and self-employed (not incorporated) (113 | 9.8%) make up the most common classes of employment.
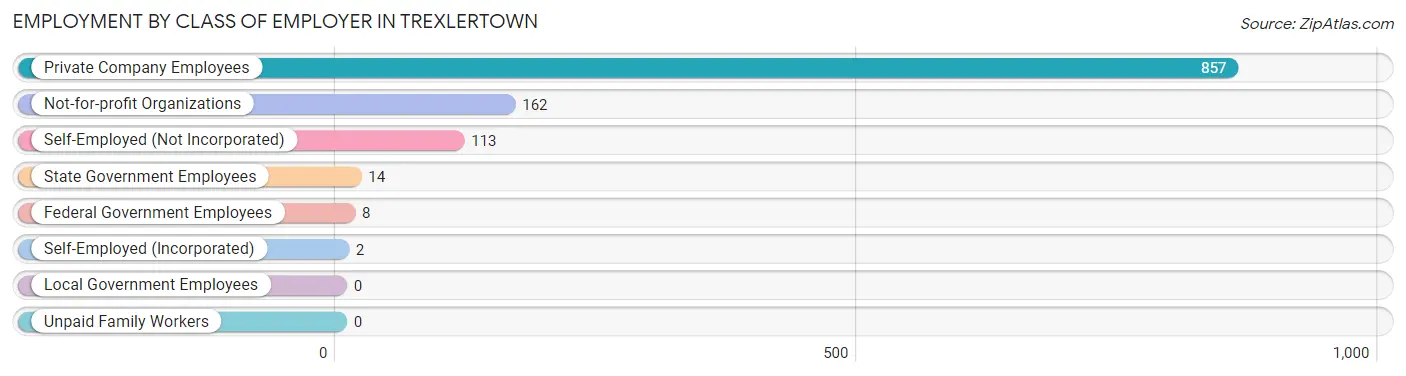
| Employer Class | # Employees | % Employees |
| Private Company Employees | 857 | 74.1% |
| Self-Employed (Incorporated) | 2 | 0.2% |
| Self-Employed (Not Incorporated) | 113 | 9.8% |
| Not-for-profit Organizations | 162 | 14.0% |
| Local Government Employees | 0 | 0.0% |
| State Government Employees | 14 | 1.2% |
| Federal Government Employees | 8 | 0.7% |
| Unpaid Family Workers | 0 | 0.0% |
| Total | 1,156 | 100.0% |
Employment Status by Age in Trexlertown
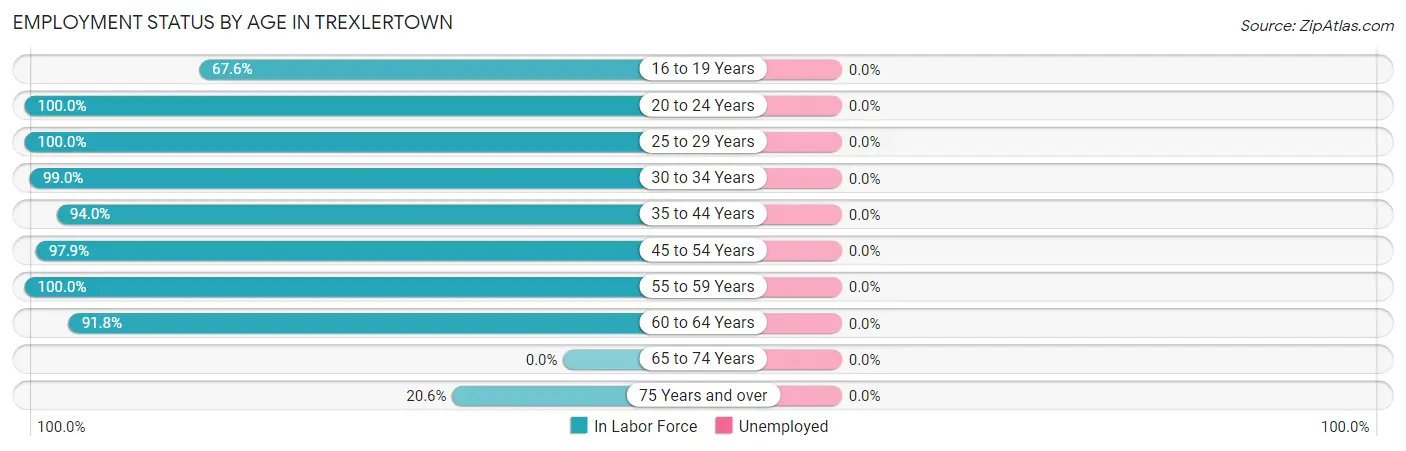
| Age Bracket | In Labor Force | Unemployed |
| 16 to 19 Years | 25 (67.6%) | 0 (0.0%) |
| 20 to 24 Years | 61 (100.0%) | 0 (0.0%) |
| 25 to 29 Years | 140 (100.0%) | 0 (0.0%) |
| 30 to 34 Years | 287 (99.0%) | 0 (0.0%) |
| 35 to 44 Years | 280 (94.0%) | 0 (0.0%) |
| 45 to 54 Years | 284 (97.9%) | 0 (0.0%) |
| 55 to 59 Years | 23 (100.0%) | 0 (0.0%) |
| 60 to 64 Years | 101 (91.8%) | 0 (0.0%) |
| 65 to 74 Years | 0 (0.0%) | 0 (0.0%) |
| 75 Years and over | 28 (20.6%) | 0 (0.0%) |
| Total | 1,229 (85.3%) | 0 (0.0%) |
Employment Status by Educational Attainment in Trexlertown
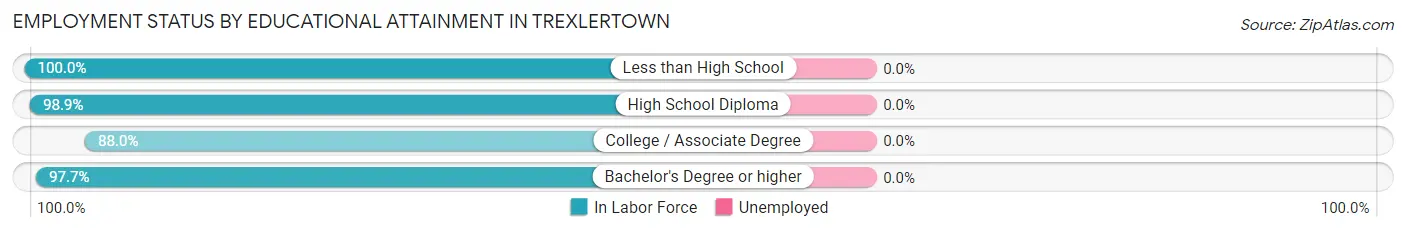
| Educational Attainment | In Labor Force | Unemployed |
| Less than High School | 10 (100.0%) | 0 (0.0%) |
| High School Diploma | 273 (98.9%) | 0 (0.0%) |
| College / Associate Degree | 117 (88.0%) | 0 (0.0%) |
| Bachelor's Degree or higher | 715 (97.7%) | 0 (0.0%) |
| Total | 1,115 (96.9%) | 0 (0.0%) |
Employment Occupations by Sex in Trexlertown
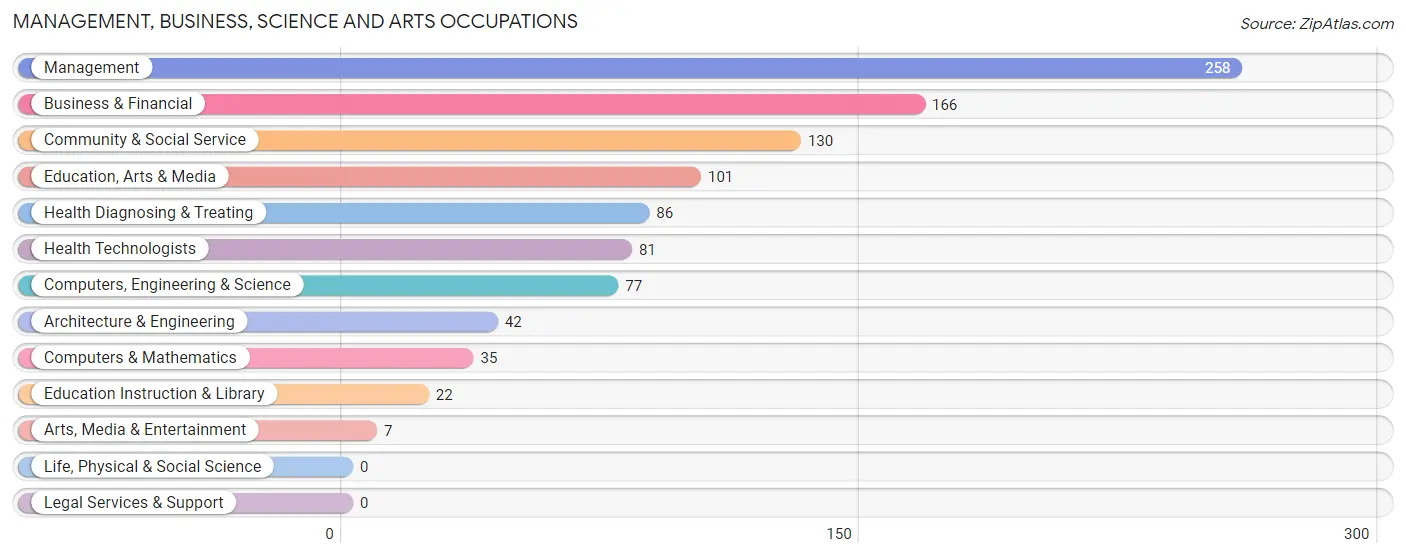
Management, Business, Science and Arts Occupations
The most common Management, Business, Science and Arts occupations in Trexlertown are Management (258 | 21.0%), Business & Financial (166 | 13.5%), Community & Social Service (130 | 10.6%), Education, Arts & Media (101 | 8.2%), and Health Diagnosing & Treating (86 | 7.0%).
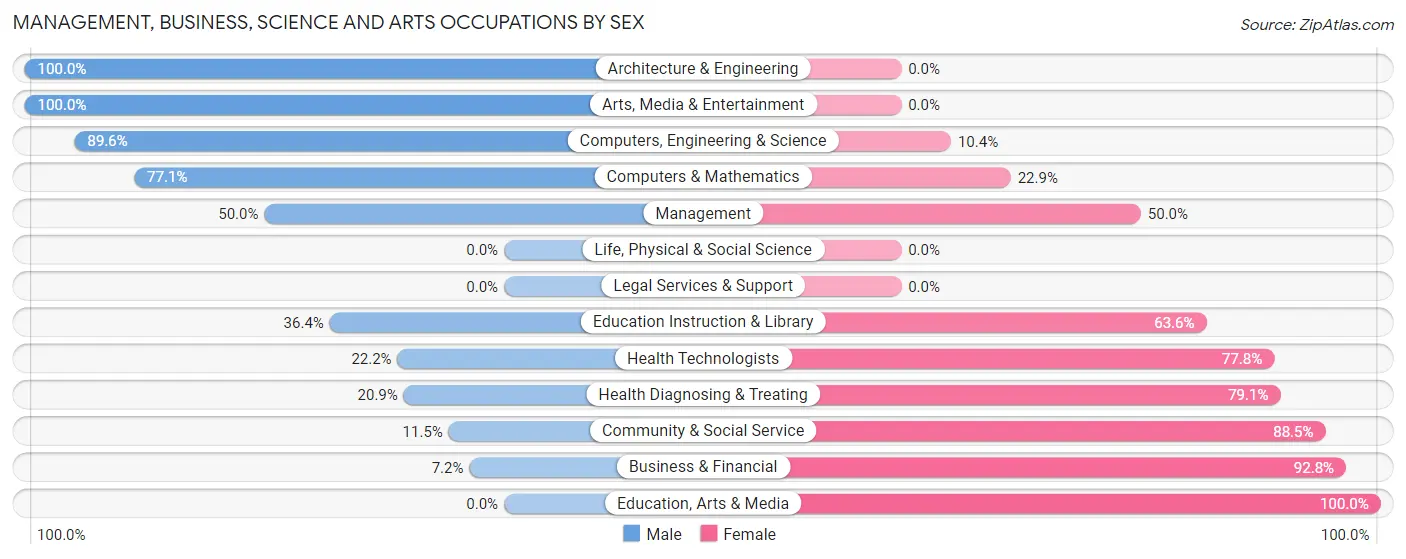
Management, Business, Science and Arts Occupations by Sex
Within the Management, Business, Science and Arts occupations in Trexlertown, the most male-oriented occupations are Architecture & Engineering (100.0%), Arts, Media & Entertainment (100.0%), and Computers, Engineering & Science (89.6%), while the most female-oriented occupations are Education, Arts & Media (100.0%), Business & Financial (92.8%), and Community & Social Service (88.5%).
| Occupation | Male | Female |
| Management | 129 (50.0%) | 129 (50.0%) |
| Business & Financial | 12 (7.2%) | 154 (92.8%) |
| Computers, Engineering & Science | 69 (89.6%) | 8 (10.4%) |
| Computers & Mathematics | 27 (77.1%) | 8 (22.9%) |
| Architecture & Engineering | 42 (100.0%) | 0 (0.0%) |
| Life, Physical & Social Science | 0 (0.0%) | 0 (0.0%) |
| Community & Social Service | 15 (11.5%) | 115 (88.5%) |
| Education, Arts & Media | 0 (0.0%) | 101 (100.0%) |
| Legal Services & Support | 0 (0.0%) | 0 (0.0%) |
| Education Instruction & Library | 8 (36.4%) | 14 (63.6%) |
| Arts, Media & Entertainment | 7 (100.0%) | 0 (0.0%) |
| Health Diagnosing & Treating | 18 (20.9%) | 68 (79.1%) |
| Health Technologists | 18 (22.2%) | 63 (77.8%) |
| Total (Category) | 243 (33.9%) | 474 (66.1%) |
| Total (Overall) | 562 (45.7%) | 667 (54.3%) |
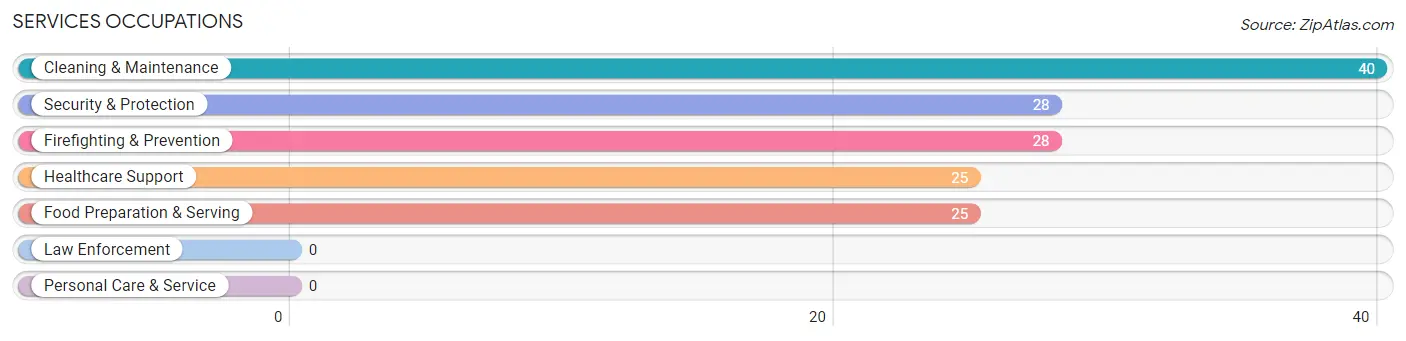
Services Occupations
The most common Services occupations in Trexlertown are Cleaning & Maintenance (40 | 3.3%), Security & Protection (28 | 2.3%), Firefighting & Prevention (28 | 2.3%), Healthcare Support (25 | 2.0%), and Food Preparation & Serving (25 | 2.0%).
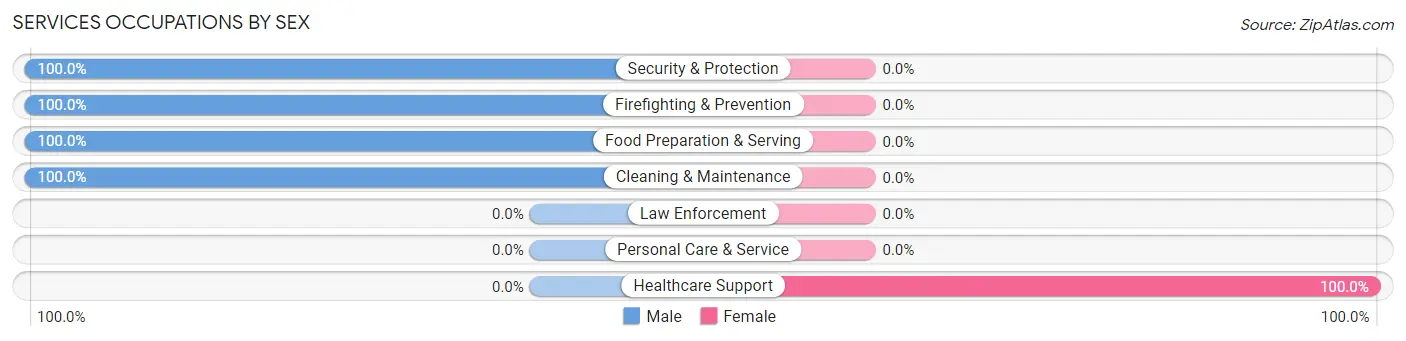
Services Occupations by Sex
| Occupation | Male | Female |
| Healthcare Support | 0 (0.0%) | 25 (100.0%) |
| Security & Protection | 28 (100.0%) | 0 (0.0%) |
| Firefighting & Prevention | 28 (100.0%) | 0 (0.0%) |
| Law Enforcement | 0 (0.0%) | 0 (0.0%) |
| Food Preparation & Serving | 25 (100.0%) | 0 (0.0%) |
| Cleaning & Maintenance | 40 (100.0%) | 0 (0.0%) |
| Personal Care & Service | 0 (0.0%) | 0 (0.0%) |
| Total (Category) | 93 (78.8%) | 25 (21.2%) |
| Total (Overall) | 562 (45.7%) | 667 (54.3%) |
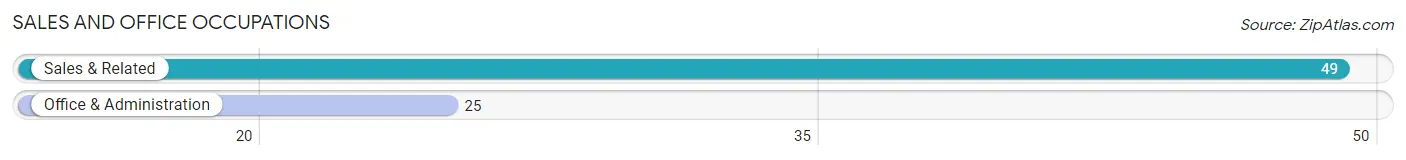
Sales and Office Occupations
The most common Sales and Office occupations in Trexlertown are Sales & Related (49 | 4.0%), and Office & Administration (25 | 2.0%).
Sales and Office Occupations by Sex
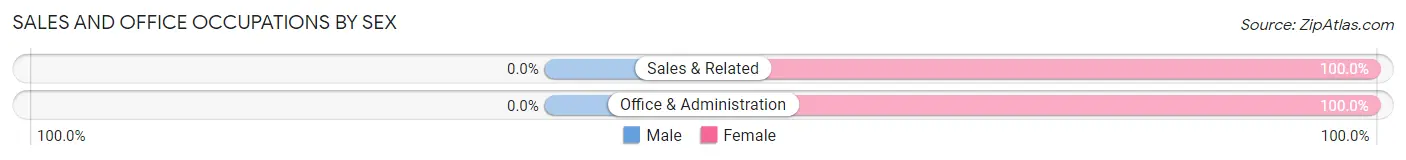
| Occupation | Male | Female |
| Sales & Related | 0 (0.0%) | 49 (100.0%) |
| Office & Administration | 0 (0.0%) | 25 (100.0%) |
| Total (Category) | 0 (0.0%) | 74 (100.0%) |
| Total (Overall) | 562 (45.7%) | 667 (54.3%) |
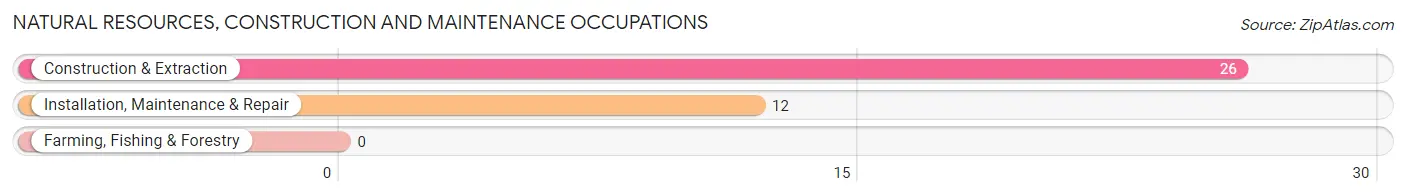
Natural Resources, Construction and Maintenance Occupations
The most common Natural Resources, Construction and Maintenance occupations in Trexlertown are Construction & Extraction (26 | 2.1%), and Installation, Maintenance & Repair (12 | 1.0%).
Natural Resources, Construction and Maintenance Occupations by Sex
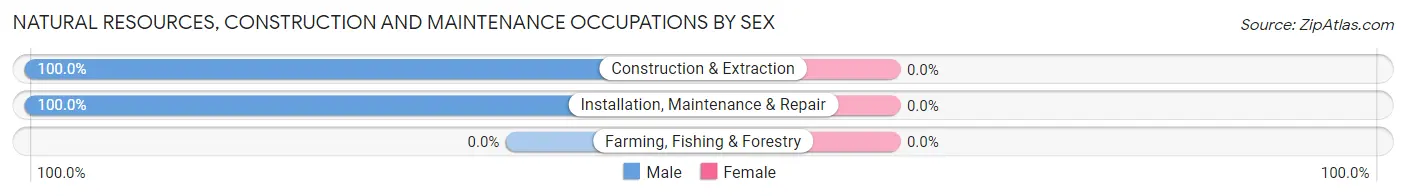
| Occupation | Male | Female |
| Farming, Fishing & Forestry | 0 (0.0%) | 0 (0.0%) |
| Construction & Extraction | 26 (100.0%) | 0 (0.0%) |
| Installation, Maintenance & Repair | 12 (100.0%) | 0 (0.0%) |
| Total (Category) | 38 (100.0%) | 0 (0.0%) |
| Total (Overall) | 562 (45.7%) | 667 (54.3%) |
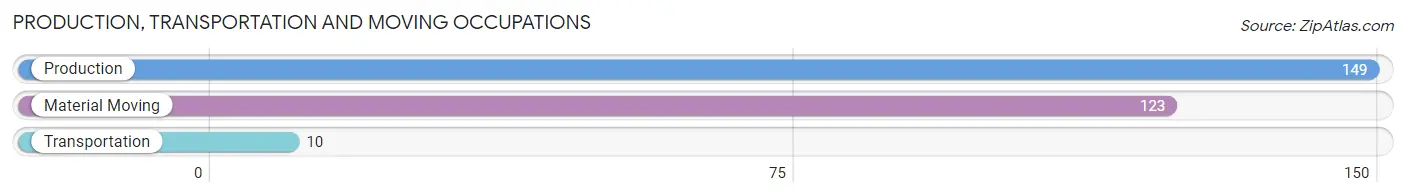
Production, Transportation and Moving Occupations
The most common Production, Transportation and Moving occupations in Trexlertown are Production (149 | 12.1%), Material Moving (123 | 10.0%), and Transportation (10 | 0.8%).
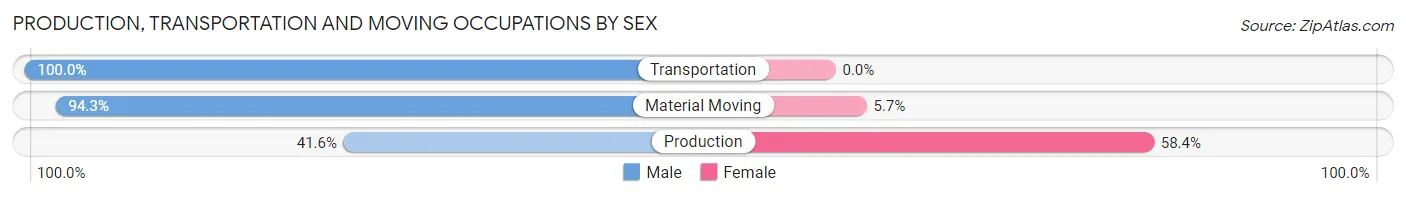
Production, Transportation and Moving Occupations by Sex
| Occupation | Male | Female |
| Production | 62 (41.6%) | 87 (58.4%) |
| Transportation | 10 (100.0%) | 0 (0.0%) |
| Material Moving | 116 (94.3%) | 7 (5.7%) |
| Total (Category) | 188 (66.7%) | 94 (33.3%) |
| Total (Overall) | 562 (45.7%) | 667 (54.3%) |
Employment Industries by Sex in Trexlertown
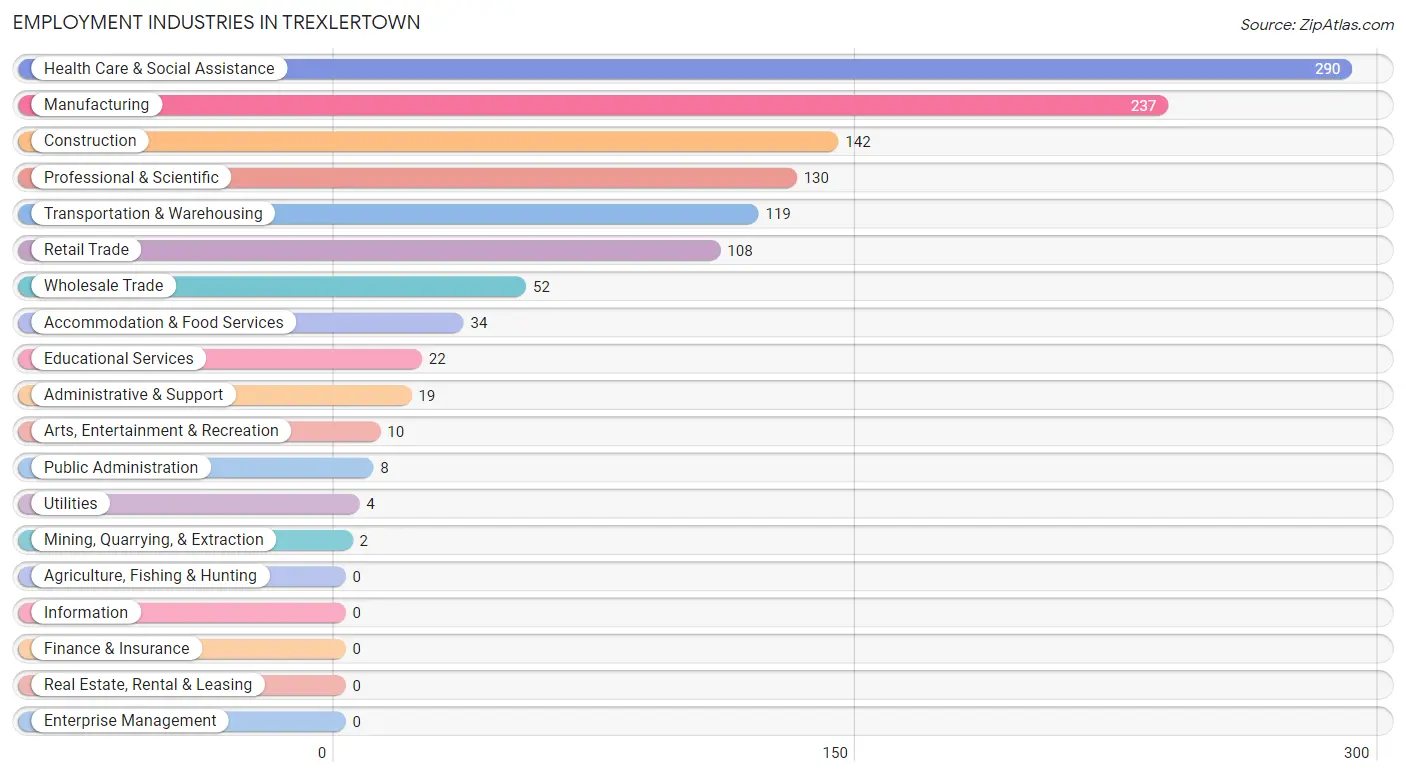
Employment Industries in Trexlertown
The major employment industries in Trexlertown include Health Care & Social Assistance (290 | 23.6%), Manufacturing (237 | 19.3%), Construction (142 | 11.6%), Professional & Scientific (130 | 10.6%), and Transportation & Warehousing (119 | 9.7%).
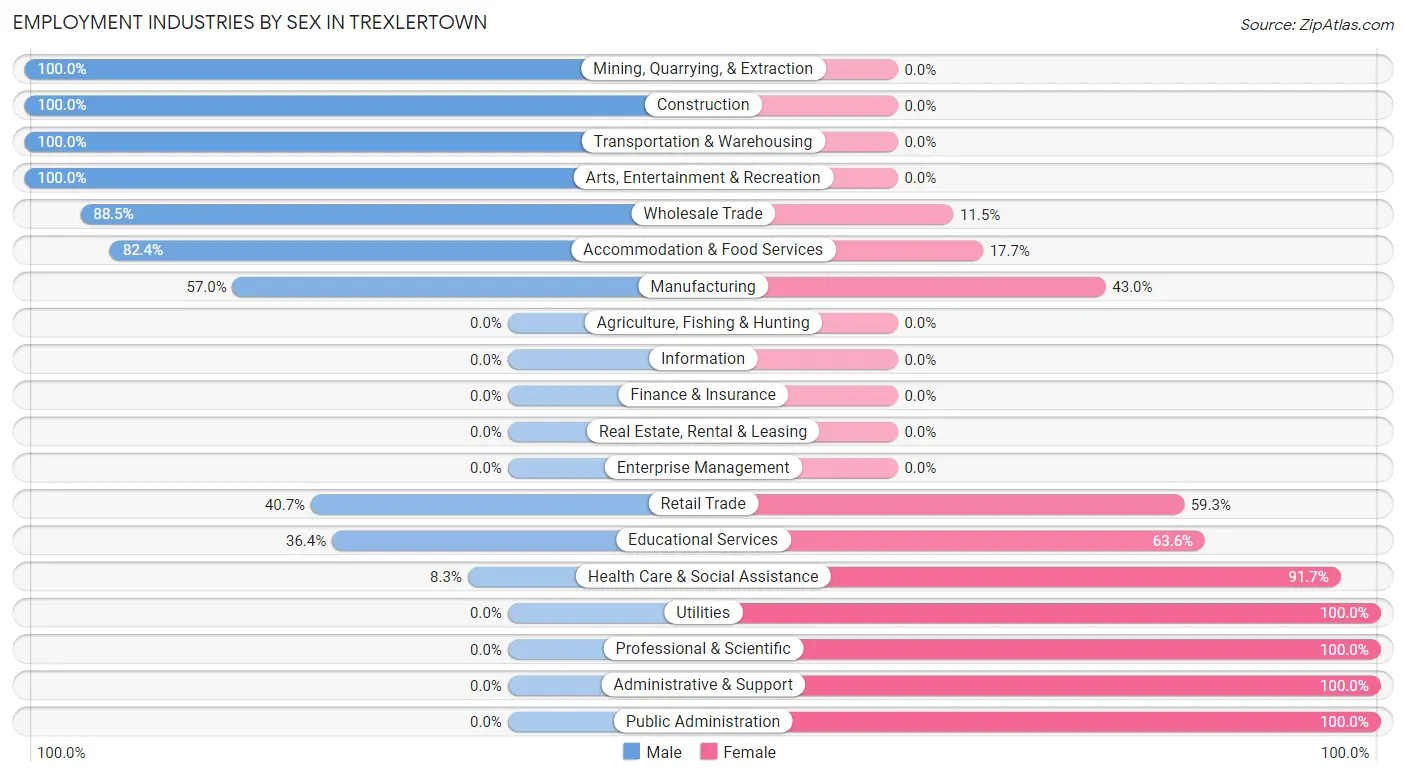
Employment Industries by Sex in Trexlertown
The Trexlertown industries that see more men than women are Mining, Quarrying, & Extraction (100.0%), Construction (100.0%), and Transportation & Warehousing (100.0%), whereas the industries that tend to have a higher number of women are Utilities (100.0%), Professional & Scientific (100.0%), and Administrative & Support (100.0%).
| Industry | Male | Female |
| Agriculture, Fishing & Hunting | 0 (0.0%) | 0 (0.0%) |
| Mining, Quarrying, & Extraction | 2 (100.0%) | 0 (0.0%) |
| Construction | 142 (100.0%) | 0 (0.0%) |
| Manufacturing | 135 (57.0%) | 102 (43.0%) |
| Wholesale Trade | 46 (88.5%) | 6 (11.5%) |
| Retail Trade | 44 (40.7%) | 64 (59.3%) |
| Transportation & Warehousing | 119 (100.0%) | 0 (0.0%) |
| Utilities | 0 (0.0%) | 4 (100.0%) |
| Information | 0 (0.0%) | 0 (0.0%) |
| Finance & Insurance | 0 (0.0%) | 0 (0.0%) |
| Real Estate, Rental & Leasing | 0 (0.0%) | 0 (0.0%) |
| Professional & Scientific | 0 (0.0%) | 130 (100.0%) |
| Enterprise Management | 0 (0.0%) | 0 (0.0%) |
| Administrative & Support | 0 (0.0%) | 19 (100.0%) |
| Educational Services | 8 (36.4%) | 14 (63.6%) |
| Health Care & Social Assistance | 24 (8.3%) | 266 (91.7%) |
| Arts, Entertainment & Recreation | 10 (100.0%) | 0 (0.0%) |
| Accommodation & Food Services | 28 (82.4%) | 6 (17.6%) |
| Public Administration | 0 (0.0%) | 8 (100.0%) |
| Total | 562 (45.7%) | 667 (54.3%) |
Education in Trexlertown
School Enrollment in Trexlertown
The most common levels of schooling among the 291 students in Trexlertown are college / undergraduate (79 | 27.2%), middle school (59 | 20.3%), and high school (47 | 16.2%).
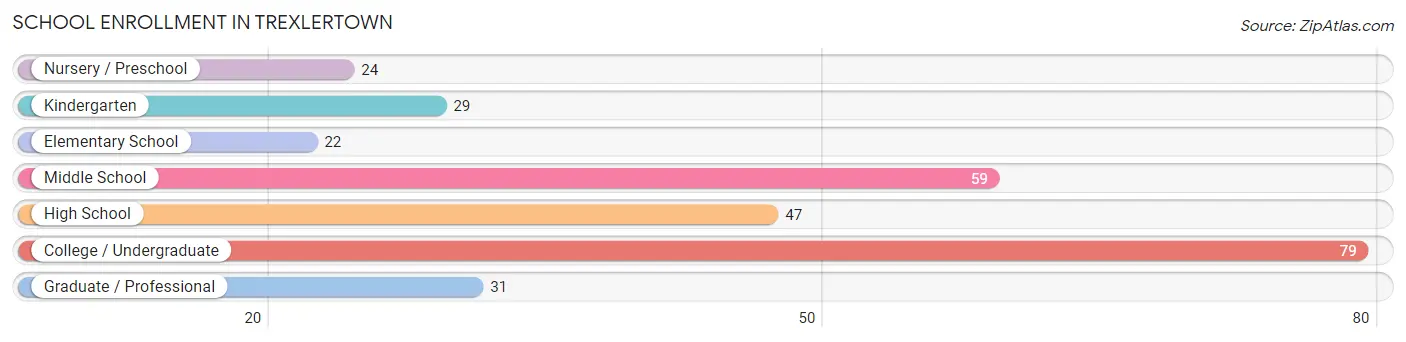
| School Level | # Students | % Students |
| Nursery / Preschool | 24 | 8.3% |
| Kindergarten | 29 | 10.0% |
| Elementary School | 22 | 7.6% |
| Middle School | 59 | 20.3% |
| High School | 47 | 16.2% |
| College / Undergraduate | 79 | 27.2% |
| Graduate / Professional | 31 | 10.6% |
| Total | 291 | 100.0% |
School Enrollment by Age by Funding Source in Trexlertown
Out of a total of 291 students who are enrolled in schools in Trexlertown, 19 (6.5%) attend a private institution, while the remaining 272 (93.5%) are enrolled in public schools. The age group of 3 to 4 year olds has the highest likelihood of being enrolled in private schools, with 16 (66.7% in the age bracket) enrolled. Conversely, the age group of 5 to 9 year old has the lowest likelihood of being enrolled in a private school, with 50 (100.0% in the age bracket) attending a public institution.
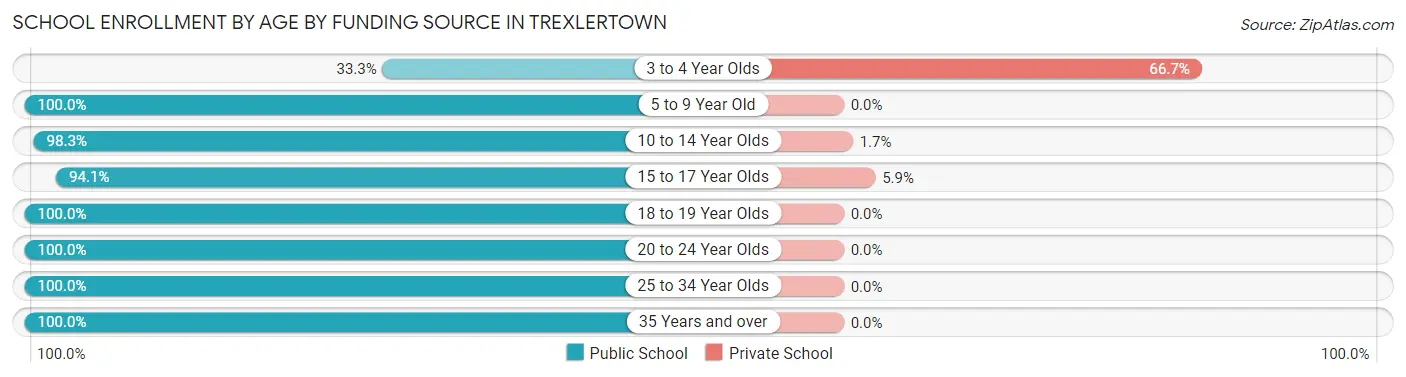
| Age Bracket | Public School | Private School |
| 3 to 4 Year Olds | 8 (33.3%) | 16 (66.7%) |
| 5 to 9 Year Old | 50 (100.0%) | 0 (0.0%) |
| 10 to 14 Year Olds | 58 (98.3%) | 1 (1.7%) |
| 15 to 17 Year Olds | 32 (94.1%) | 2 (5.9%) |
| 18 to 19 Year Olds | 25 (100.0%) | 0 (0.0%) |
| 20 to 24 Year Olds | 26 (100.0%) | 0 (0.0%) |
| 25 to 34 Year Olds | 42 (100.0%) | 0 (0.0%) |
| 35 Years and over | 31 (100.0%) | 0 (0.0%) |
| Total | 272 (93.5%) | 19 (6.5%) |
Educational Attainment by Field of Study in Trexlertown
Business (300 | 32.6%), arts & humanities (218 | 23.7%), social sciences (113 | 12.3%), engineering (68 | 7.4%), and bio, nature & agricultural (46 | 5.0%) are the most common fields of study among 921 individuals in Trexlertown who have obtained a bachelor's degree or higher.
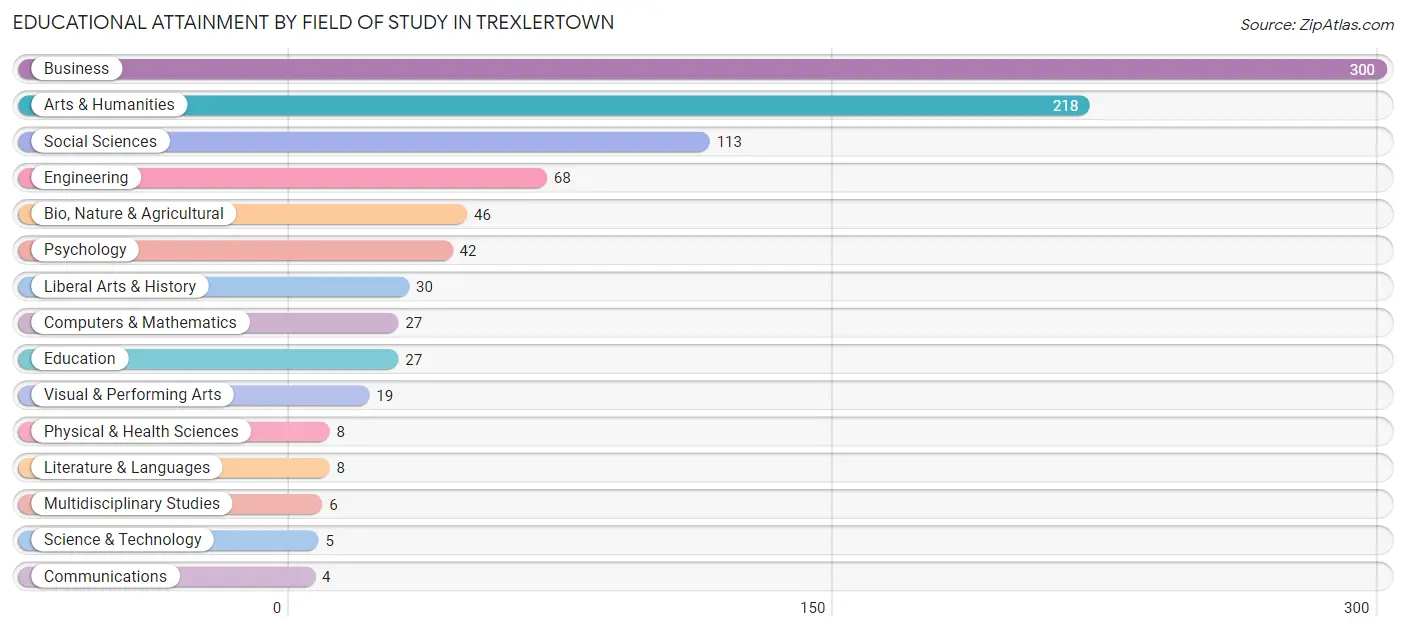
| Field of Study | # Graduates | % Graduates |
| Computers & Mathematics | 27 | 2.9% |
| Bio, Nature & Agricultural | 46 | 5.0% |
| Physical & Health Sciences | 8 | 0.9% |
| Psychology | 42 | 4.6% |
| Social Sciences | 113 | 12.3% |
| Engineering | 68 | 7.4% |
| Multidisciplinary Studies | 6 | 0.6% |
| Science & Technology | 5 | 0.5% |
| Business | 300 | 32.6% |
| Education | 27 | 2.9% |
| Literature & Languages | 8 | 0.9% |
| Liberal Arts & History | 30 | 3.3% |
| Visual & Performing Arts | 19 | 2.1% |
| Communications | 4 | 0.4% |
| Arts & Humanities | 218 | 23.7% |
| Total | 921 | 100.0% |
Transportation & Commute in Trexlertown
Vehicle Availability by Sex in Trexlertown
The most prevalent vehicle ownership categories in Trexlertown are males with 2 vehicles (377, accounting for 67.1%) and females with 2 vehicles (386, making up 64.0%).
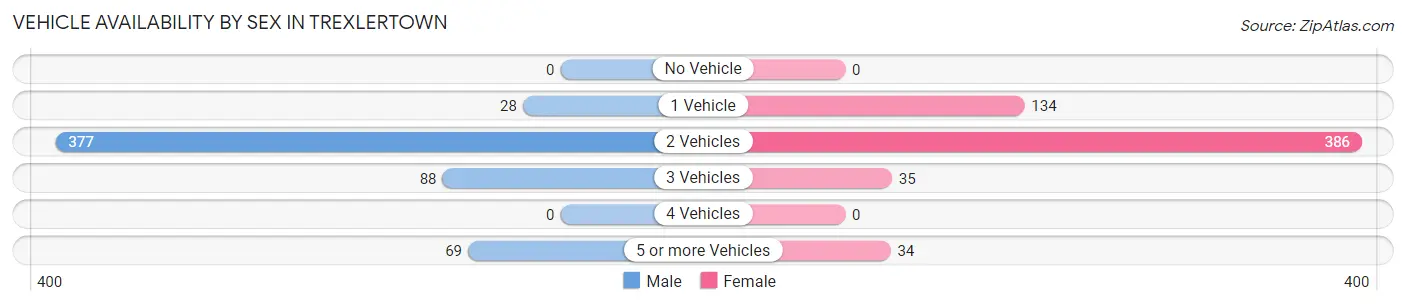
| Vehicles Available | Male | Female |
| No Vehicle | 0 (0.0%) | 0 (0.0%) |
| 1 Vehicle | 28 (5.0%) | 134 (22.8%) |
| 2 Vehicles | 377 (67.1%) | 386 (65.5%) |
| 3 Vehicles | 88 (15.7%) | 35 (5.9%) |
| 4 Vehicles | 0 (0.0%) | 0 (0.0%) |
| 5 or more Vehicles | 69 (12.3%) | 34 (5.8%) |
| Total | 562 (100.0%) | 589 (100.0%) |
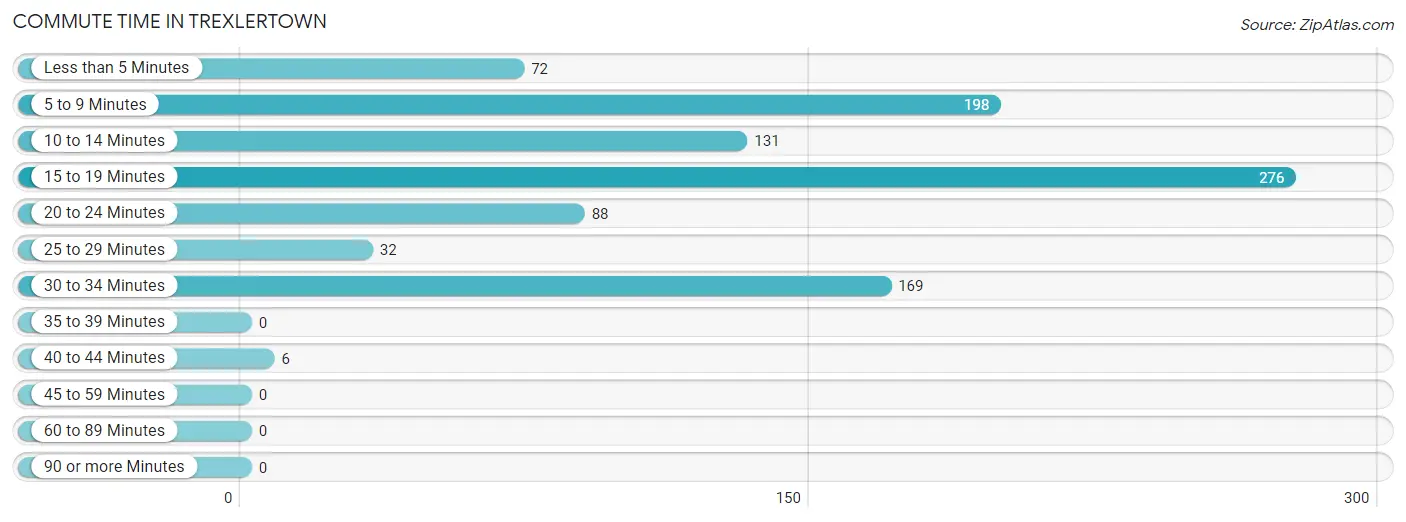
Commute Time in Trexlertown
The most frequently occuring commute durations in Trexlertown are 15 to 19 minutes (276 commuters, 28.4%), 5 to 9 minutes (198 commuters, 20.4%), and 30 to 34 minutes (169 commuters, 17.4%).
| Commute Time | # Commuters | % Commuters |
| Less than 5 Minutes | 72 | 7.4% |
| 5 to 9 Minutes | 198 | 20.4% |
| 10 to 14 Minutes | 131 | 13.5% |
| 15 to 19 Minutes | 276 | 28.4% |
| 20 to 24 Minutes | 88 | 9.0% |
| 25 to 29 Minutes | 32 | 3.3% |
| 30 to 34 Minutes | 169 | 17.4% |
| 35 to 39 Minutes | 0 | 0.0% |
| 40 to 44 Minutes | 6 | 0.6% |
| 45 to 59 Minutes | 0 | 0.0% |
| 60 to 89 Minutes | 0 | 0.0% |
| 90 or more Minutes | 0 | 0.0% |
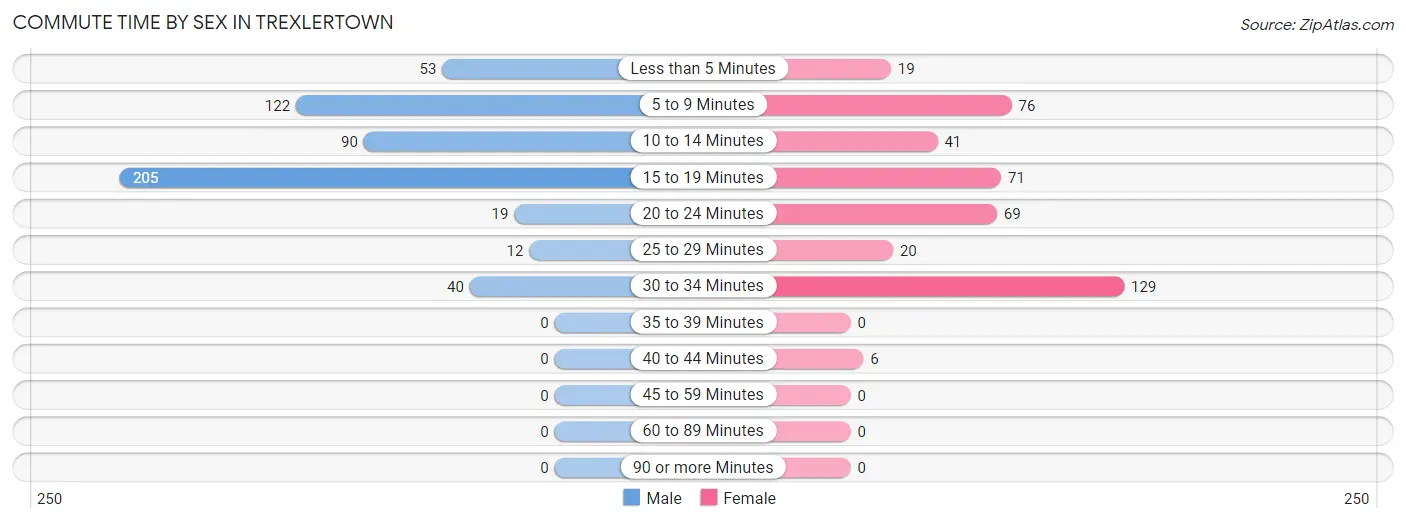
Commute Time by Sex in Trexlertown
The most common commute times in Trexlertown are 15 to 19 minutes (205 commuters, 37.9%) for males and 30 to 34 minutes (129 commuters, 29.9%) for females.
| Commute Time | Male | Female |
| Less than 5 Minutes | 53 (9.8%) | 19 (4.4%) |
| 5 to 9 Minutes | 122 (22.6%) | 76 (17.6%) |
| 10 to 14 Minutes | 90 (16.6%) | 41 (9.5%) |
| 15 to 19 Minutes | 205 (37.9%) | 71 (16.5%) |
| 20 to 24 Minutes | 19 (3.5%) | 69 (16.0%) |
| 25 to 29 Minutes | 12 (2.2%) | 20 (4.6%) |
| 30 to 34 Minutes | 40 (7.4%) | 129 (29.9%) |
| 35 to 39 Minutes | 0 (0.0%) | 0 (0.0%) |
| 40 to 44 Minutes | 0 (0.0%) | 6 (1.4%) |
| 45 to 59 Minutes | 0 (0.0%) | 0 (0.0%) |
| 60 to 89 Minutes | 0 (0.0%) | 0 (0.0%) |
| 90 or more Minutes | 0 (0.0%) | 0 (0.0%) |
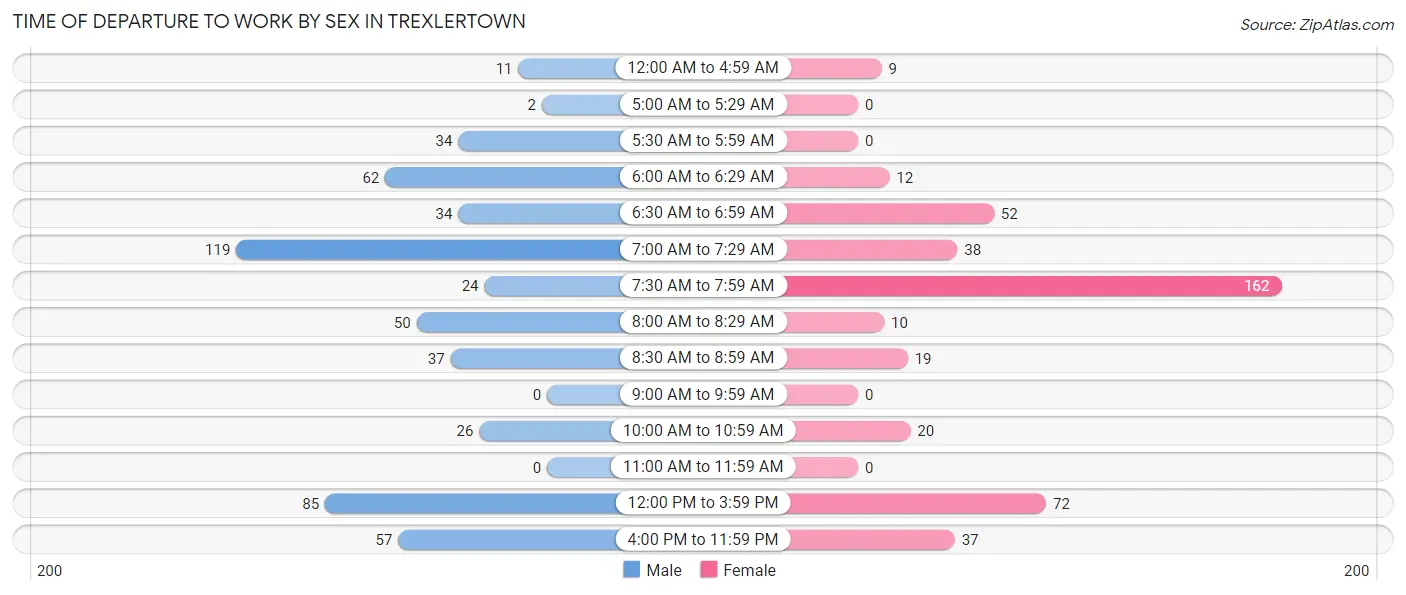
Time of Departure to Work by Sex in Trexlertown
The most frequent times of departure to work in Trexlertown are 7:00 AM to 7:29 AM (119, 22.0%) for males and 7:30 AM to 7:59 AM (162, 37.6%) for females.
| Time of Departure | Male | Female |
| 12:00 AM to 4:59 AM | 11 (2.0%) | 9 (2.1%) |
| 5:00 AM to 5:29 AM | 2 (0.4%) | 0 (0.0%) |
| 5:30 AM to 5:59 AM | 34 (6.3%) | 0 (0.0%) |
| 6:00 AM to 6:29 AM | 62 (11.5%) | 12 (2.8%) |
| 6:30 AM to 6:59 AM | 34 (6.3%) | 52 (12.1%) |
| 7:00 AM to 7:29 AM | 119 (22.0%) | 38 (8.8%) |
| 7:30 AM to 7:59 AM | 24 (4.4%) | 162 (37.6%) |
| 8:00 AM to 8:29 AM | 50 (9.2%) | 10 (2.3%) |
| 8:30 AM to 8:59 AM | 37 (6.8%) | 19 (4.4%) |
| 9:00 AM to 9:59 AM | 0 (0.0%) | 0 (0.0%) |
| 10:00 AM to 10:59 AM | 26 (4.8%) | 20 (4.6%) |
| 11:00 AM to 11:59 AM | 0 (0.0%) | 0 (0.0%) |
| 12:00 PM to 3:59 PM | 85 (15.7%) | 72 (16.7%) |
| 4:00 PM to 11:59 PM | 57 (10.5%) | 37 (8.6%) |
| Total | 541 (100.0%) | 431 (100.0%) |
Housing Occupancy in Trexlertown
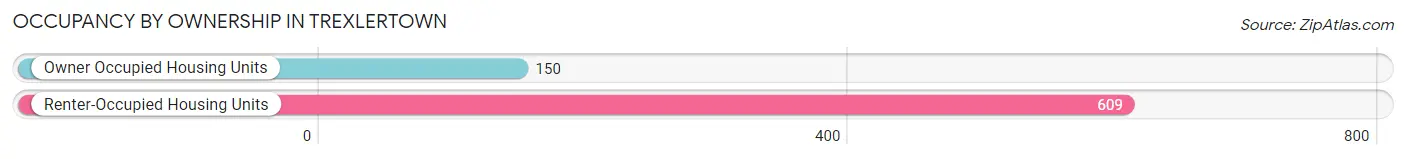
Occupancy by Ownership in Trexlertown
Of the total 759 dwellings in Trexlertown, owner-occupied units account for 150 (19.8%), while renter-occupied units make up 609 (80.2%).
| Occupancy | # Housing Units | % Housing Units |
| Owner Occupied Housing Units | 150 | 19.8% |
| Renter-Occupied Housing Units | 609 | 80.2% |
| Total Occupied Housing Units | 759 | 100.0% |
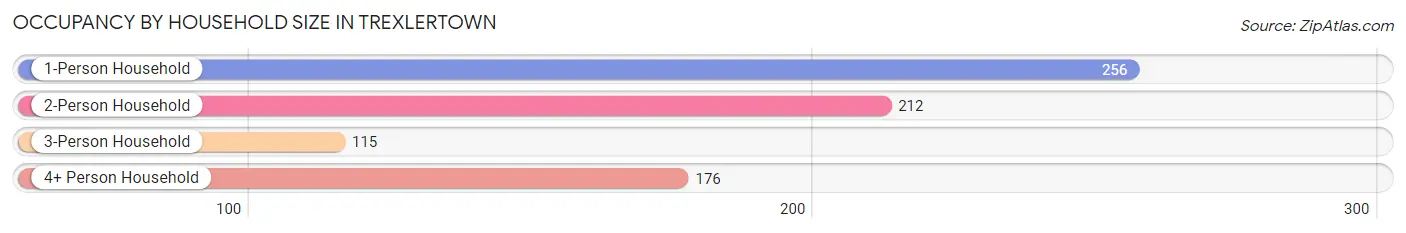
Occupancy by Household Size in Trexlertown
| Household Size | # Housing Units | % Housing Units |
| 1-Person Household | 256 | 33.7% |
| 2-Person Household | 212 | 27.9% |
| 3-Person Household | 115 | 15.1% |
| 4+ Person Household | 176 | 23.2% |
| Total Housing Units | 759 | 100.0% |
Occupancy by Ownership by Household Size in Trexlertown
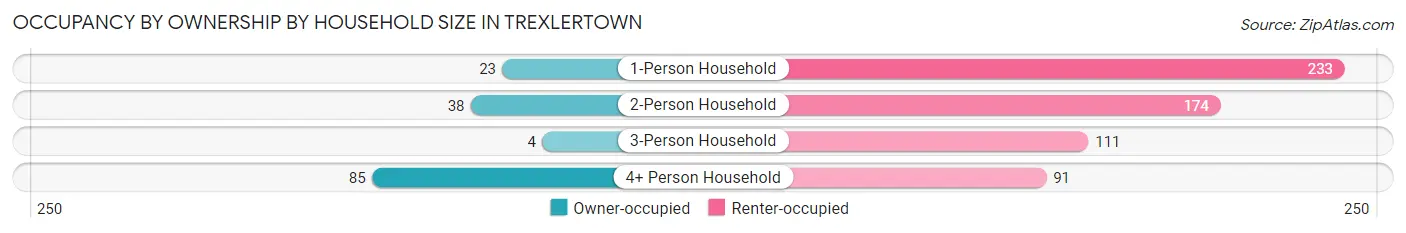
| Household Size | Owner-occupied | Renter-occupied |
| 1-Person Household | 23 (9.0%) | 233 (91.0%) |
| 2-Person Household | 38 (17.9%) | 174 (82.1%) |
| 3-Person Household | 4 (3.5%) | 111 (96.5%) |
| 4+ Person Household | 85 (48.3%) | 91 (51.7%) |
| Total Housing Units | 150 (19.8%) | 609 (80.2%) |
Occupancy by Educational Attainment in Trexlertown
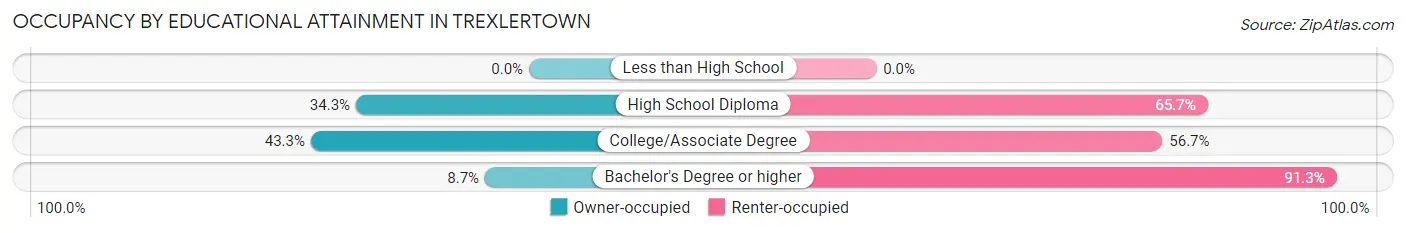
| Household Size | Owner-occupied | Renter-occupied |
| Less than High School | 0 (0.0%) | 0 (0.0%) |
| High School Diploma | 47 (34.3%) | 90 (65.7%) |
| College/Associate Degree | 61 (43.3%) | 80 (56.7%) |
| Bachelor's Degree or higher | 42 (8.7%) | 439 (91.3%) |
Occupancy by Age of Householder in Trexlertown
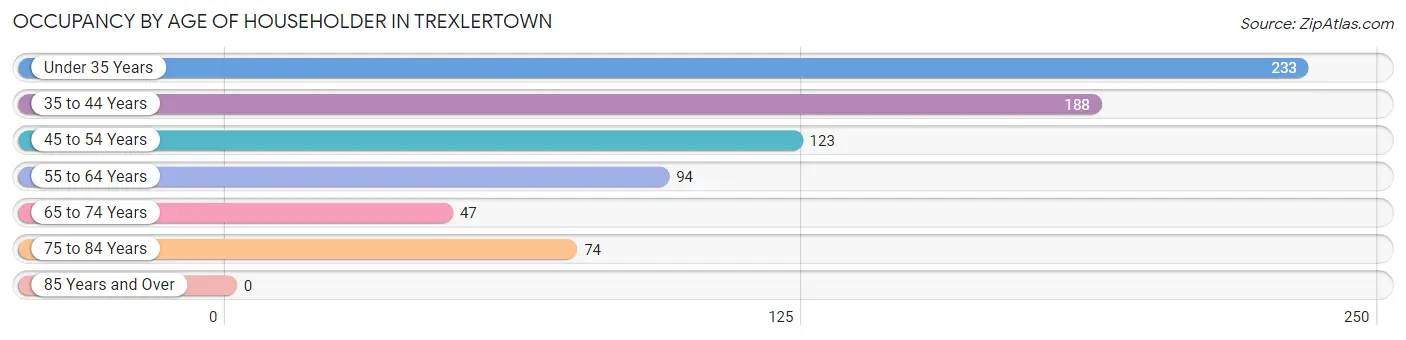
| Age Bracket | # Households | % Households |
| Under 35 Years | 233 | 30.7% |
| 35 to 44 Years | 188 | 24.8% |
| 45 to 54 Years | 123 | 16.2% |
| 55 to 64 Years | 94 | 12.4% |
| 65 to 74 Years | 47 | 6.2% |
| 75 to 84 Years | 74 | 9.8% |
| 85 Years and Over | 0 | 0.0% |
| Total | 759 | 100.0% |
Housing Finances in Trexlertown
Median Income by Occupancy in Trexlertown
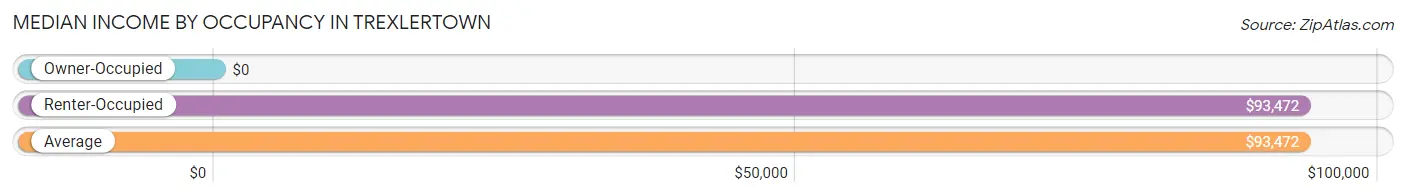
| Occupancy Type | # Households | Median Income |
| Owner-Occupied | 150 (19.8%) | $0 |
| Renter-Occupied | 609 (80.2%) | $93,472 |
| Average | 759 (100.0%) | $93,472 |
Occupancy by Householder Income Bracket in Trexlertown
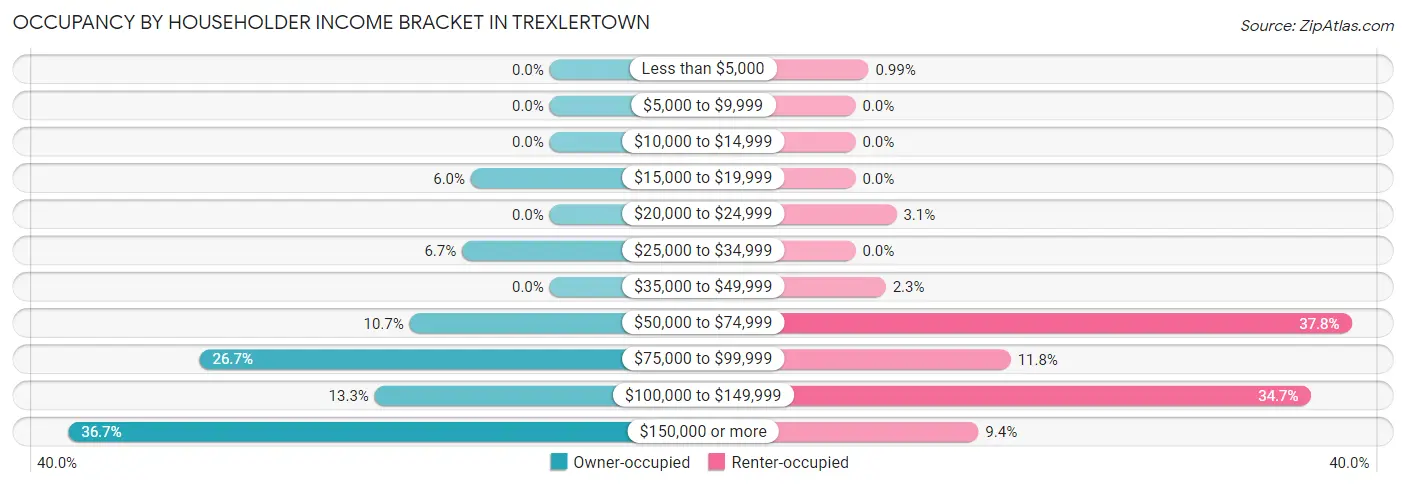
| Income Bracket | Owner-occupied | Renter-occupied |
| Less than $5,000 | 0 (0.0%) | 6 (1.0%) |
| $5,000 to $9,999 | 0 (0.0%) | 0 (0.0%) |
| $10,000 to $14,999 | 0 (0.0%) | 0 (0.0%) |
| $15,000 to $19,999 | 9 (6.0%) | 0 (0.0%) |
| $20,000 to $24,999 | 0 (0.0%) | 19 (3.1%) |
| $25,000 to $34,999 | 10 (6.7%) | 0 (0.0%) |
| $35,000 to $49,999 | 0 (0.0%) | 14 (2.3%) |
| $50,000 to $74,999 | 16 (10.7%) | 230 (37.8%) |
| $75,000 to $99,999 | 40 (26.7%) | 72 (11.8%) |
| $100,000 to $149,999 | 20 (13.3%) | 211 (34.6%) |
| $150,000 or more | 55 (36.7%) | 57 (9.4%) |
| Total | 150 (100.0%) | 609 (100.0%) |
Monthly Housing Cost Tiers in Trexlertown
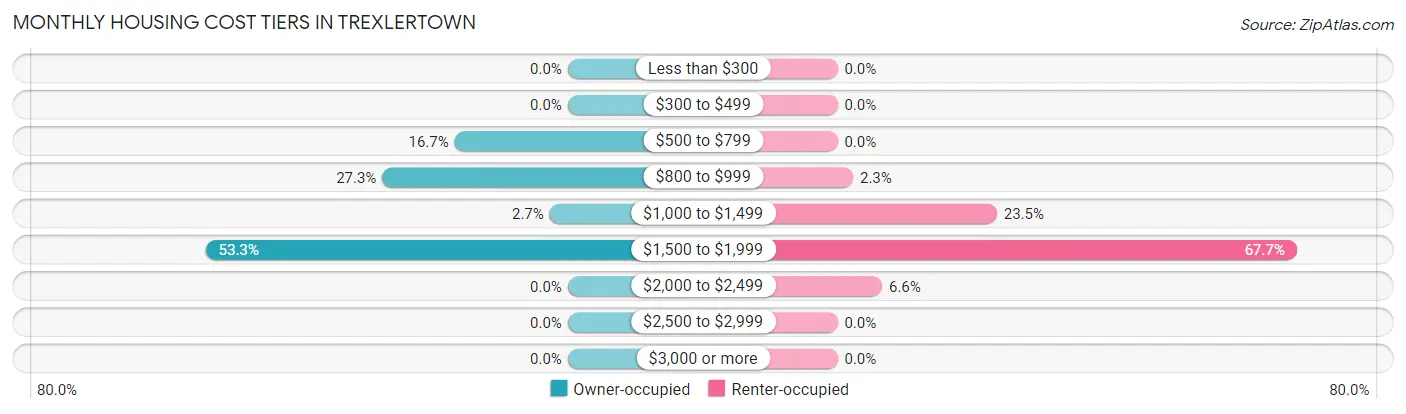
| Monthly Cost | Owner-occupied | Renter-occupied |
| Less than $300 | 0 (0.0%) | 0 (0.0%) |
| $300 to $499 | 0 (0.0%) | 0 (0.0%) |
| $500 to $799 | 25 (16.7%) | 0 (0.0%) |
| $800 to $999 | 41 (27.3%) | 14 (2.3%) |
| $1,000 to $1,499 | 4 (2.7%) | 143 (23.5%) |
| $1,500 to $1,999 | 80 (53.3%) | 412 (67.6%) |
| $2,000 to $2,499 | 0 (0.0%) | 40 (6.6%) |
| $2,500 to $2,999 | 0 (0.0%) | 0 (0.0%) |
| $3,000 or more | 0 (0.0%) | 0 (0.0%) |
| Total | 150 (100.0%) | 609 (100.0%) |
Physical Housing Characteristics in Trexlertown
Housing Structures in Trexlertown
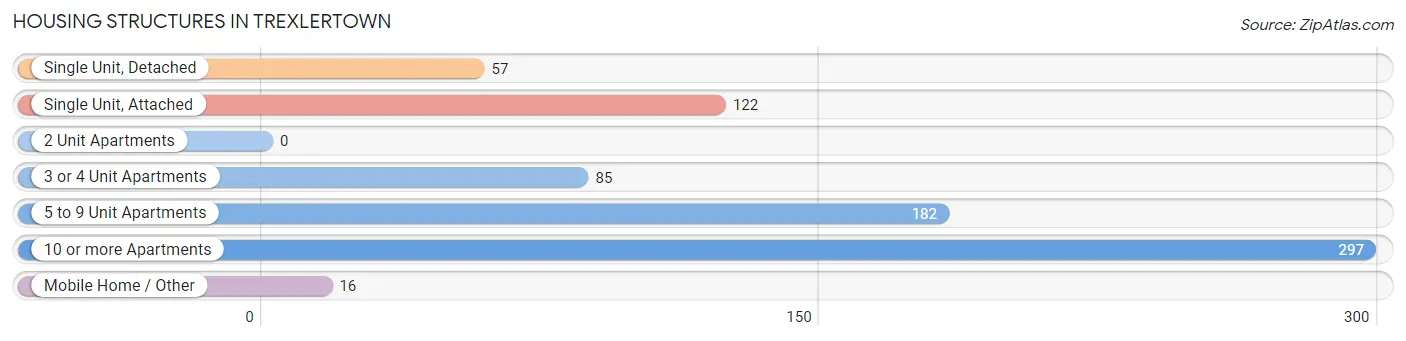
| Structure Type | # Housing Units | % Housing Units |
| Single Unit, Detached | 57 | 7.5% |
| Single Unit, Attached | 122 | 16.1% |
| 2 Unit Apartments | 0 | 0.0% |
| 3 or 4 Unit Apartments | 85 | 11.2% |
| 5 to 9 Unit Apartments | 182 | 24.0% |
| 10 or more Apartments | 297 | 39.1% |
| Mobile Home / Other | 16 | 2.1% |
| Total | 759 | 100.0% |
Housing Structures by Occupancy in Trexlertown
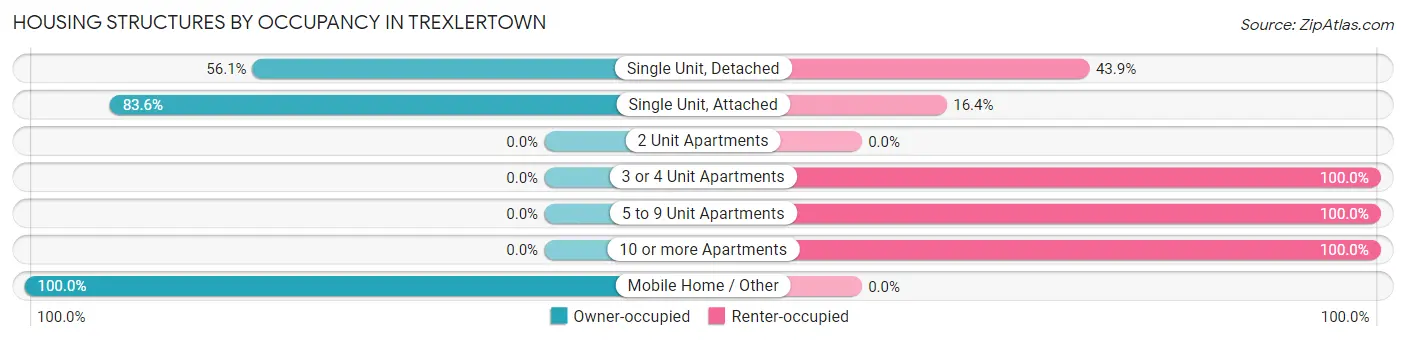
| Structure Type | Owner-occupied | Renter-occupied |
| Single Unit, Detached | 32 (56.1%) | 25 (43.9%) |
| Single Unit, Attached | 102 (83.6%) | 20 (16.4%) |
| 2 Unit Apartments | 0 (0.0%) | 0 (0.0%) |
| 3 or 4 Unit Apartments | 0 (0.0%) | 85 (100.0%) |
| 5 to 9 Unit Apartments | 0 (0.0%) | 182 (100.0%) |
| 10 or more Apartments | 0 (0.0%) | 297 (100.0%) |
| Mobile Home / Other | 16 (100.0%) | 0 (0.0%) |
| Total | 150 (19.8%) | 609 (80.2%) |
Housing Structures by Number of Rooms in Trexlertown
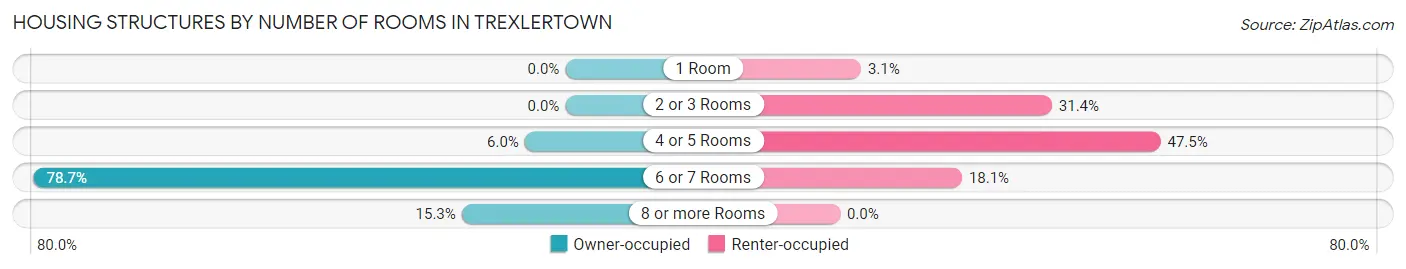
| Number of Rooms | Owner-occupied | Renter-occupied |
| 1 Room | 0 (0.0%) | 19 (3.1%) |
| 2 or 3 Rooms | 0 (0.0%) | 191 (31.4%) |
| 4 or 5 Rooms | 9 (6.0%) | 289 (47.4%) |
| 6 or 7 Rooms | 118 (78.7%) | 110 (18.1%) |
| 8 or more Rooms | 23 (15.3%) | 0 (0.0%) |
| Total | 150 (100.0%) | 609 (100.0%) |
Housing Structure by Heating Type in Trexlertown
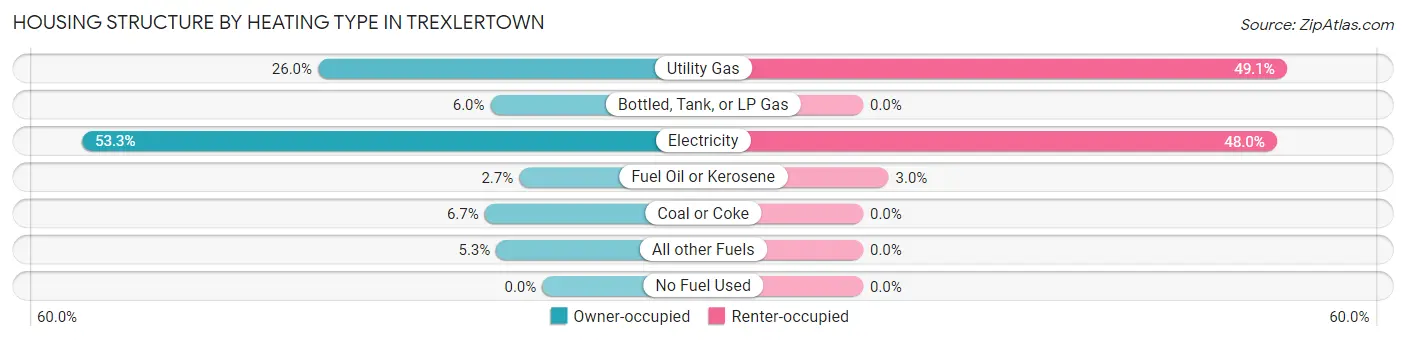
| Heating Type | Owner-occupied | Renter-occupied |
| Utility Gas | 39 (26.0%) | 299 (49.1%) |
| Bottled, Tank, or LP Gas | 9 (6.0%) | 0 (0.0%) |
| Electricity | 80 (53.3%) | 292 (47.9%) |
| Fuel Oil or Kerosene | 4 (2.7%) | 18 (3.0%) |
| Coal or Coke | 10 (6.7%) | 0 (0.0%) |
| All other Fuels | 8 (5.3%) | 0 (0.0%) |
| No Fuel Used | 0 (0.0%) | 0 (0.0%) |
| Total | 150 (100.0%) | 609 (100.0%) |
Household Vehicle Usage in Trexlertown
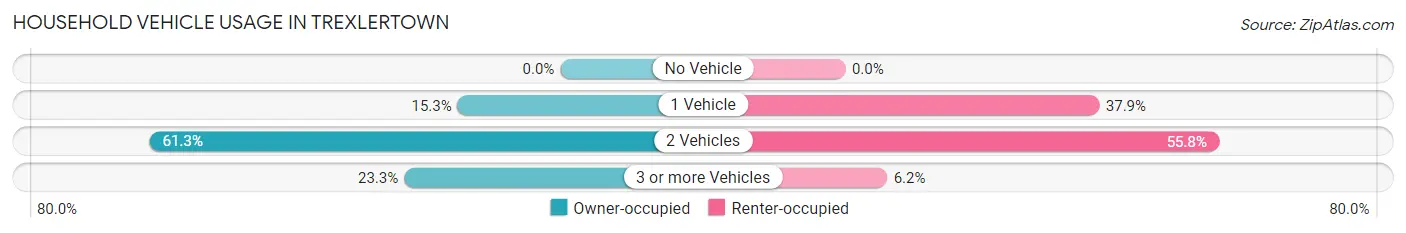
| Vehicles per Household | Owner-occupied | Renter-occupied |
| No Vehicle | 0 (0.0%) | 0 (0.0%) |
| 1 Vehicle | 23 (15.3%) | 231 (37.9%) |
| 2 Vehicles | 92 (61.3%) | 340 (55.8%) |
| 3 or more Vehicles | 35 (23.3%) | 38 (6.2%) |
| Total | 150 (100.0%) | 609 (100.0%) |
Real Estate & Mortgages in Trexlertown
Real Estate and Mortgage Overview in Trexlertown
| Characteristic | Without Mortgage | With Mortgage |
| Housing Units | 51 | 99 |
| Median Property Value | $358,300 | $250,500 |
| Median Household Income | - | - |
| Monthly Housing Costs | $803 | $0 |
| Real Estate Taxes | $5,625 | $40 |
Property Value by Mortgage Status in Trexlertown
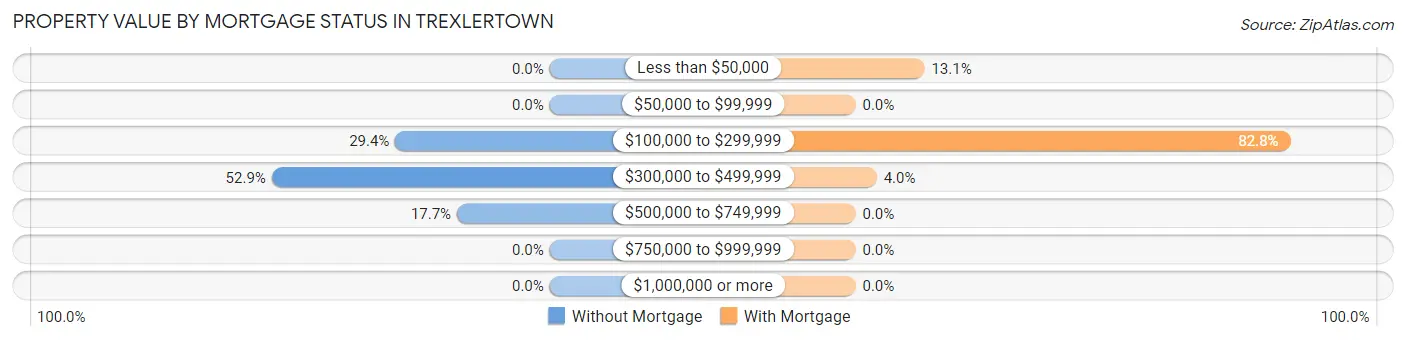
| Property Value | Without Mortgage | With Mortgage |
| Less than $50,000 | 0 (0.0%) | 13 (13.1%) |
| $50,000 to $99,999 | 0 (0.0%) | 0 (0.0%) |
| $100,000 to $299,999 | 15 (29.4%) | 82 (82.8%) |
| $300,000 to $499,999 | 27 (52.9%) | 4 (4.0%) |
| $500,000 to $749,999 | 9 (17.6%) | 0 (0.0%) |
| $750,000 to $999,999 | 0 (0.0%) | 0 (0.0%) |
| $1,000,000 or more | 0 (0.0%) | 0 (0.0%) |
| Total | 51 (100.0%) | 99 (100.0%) |
Household Income by Mortgage Status in Trexlertown
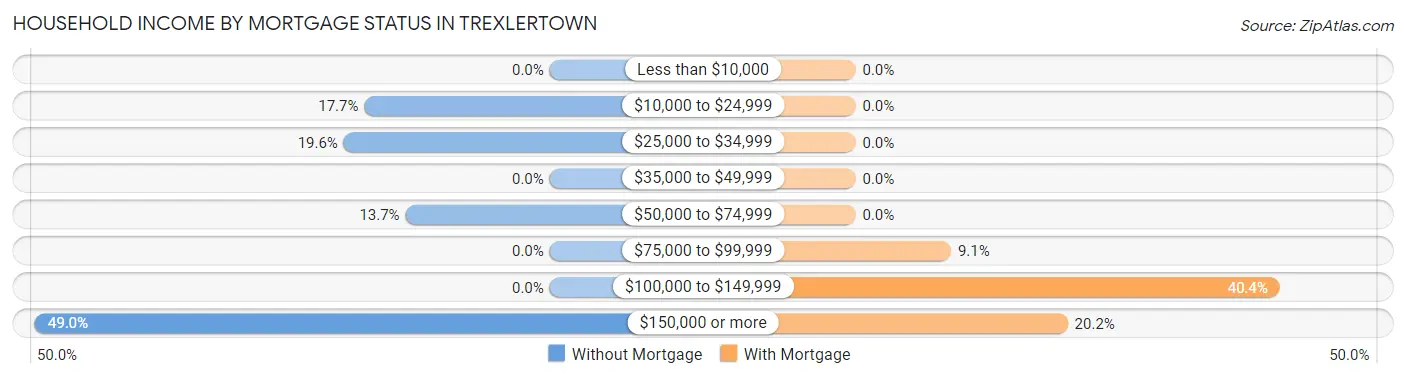
| Household Income | Without Mortgage | With Mortgage |
| Less than $10,000 | 0 (0.0%) | 0 (0.0%) |
| $10,000 to $24,999 | 9 (17.6%) | 0 (0.0%) |
| $25,000 to $34,999 | 10 (19.6%) | 0 (0.0%) |
| $35,000 to $49,999 | 0 (0.0%) | 0 (0.0%) |
| $50,000 to $74,999 | 7 (13.7%) | 0 (0.0%) |
| $75,000 to $99,999 | 0 (0.0%) | 9 (9.1%) |
| $100,000 to $149,999 | 0 (0.0%) | 40 (40.4%) |
| $150,000 or more | 25 (49.0%) | 20 (20.2%) |
| Total | 51 (100.0%) | 99 (100.0%) |
Property Value to Household Income Ratio in Trexlertown
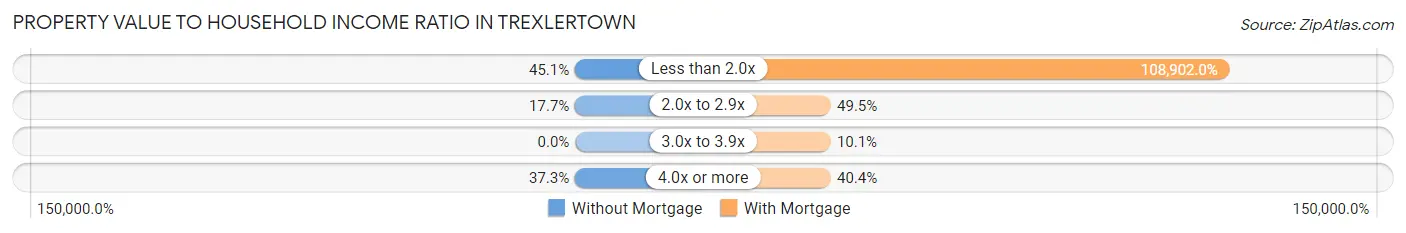
| Value-to-Income Ratio | Without Mortgage | With Mortgage |
| Less than 2.0x | 23 (45.1%) | 107,813 (108,902.0%) |
| 2.0x to 2.9x | 9 (17.6%) | 49 (49.5%) |
| 3.0x to 3.9x | 0 (0.0%) | 10 (10.1%) |
| 4.0x or more | 19 (37.2%) | 40 (40.4%) |
| Total | 51 (100.0%) | 99 (100.0%) |
Real Estate Taxes by Mortgage Status in Trexlertown
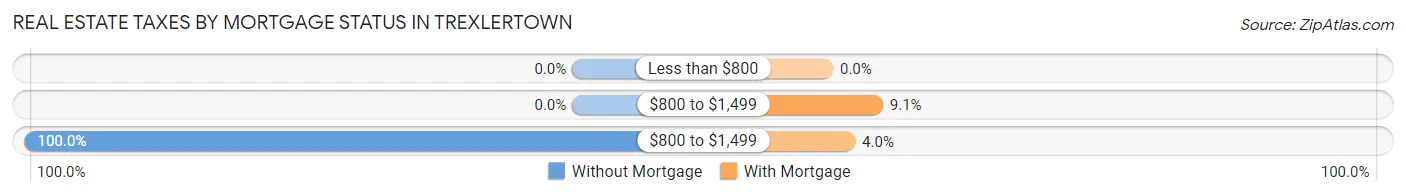
| Property Taxes | Without Mortgage | With Mortgage |
| Less than $800 | 0 (0.0%) | 0 (0.0%) |
| $800 to $1,499 | 0 (0.0%) | 9 (9.1%) |
| $800 to $1,499 | 51 (100.0%) | 4 (4.0%) |
| Total | 51 (100.0%) | 99 (100.0%) |
Health & Disability in Trexlertown
Health Insurance Coverage by Age in Trexlertown
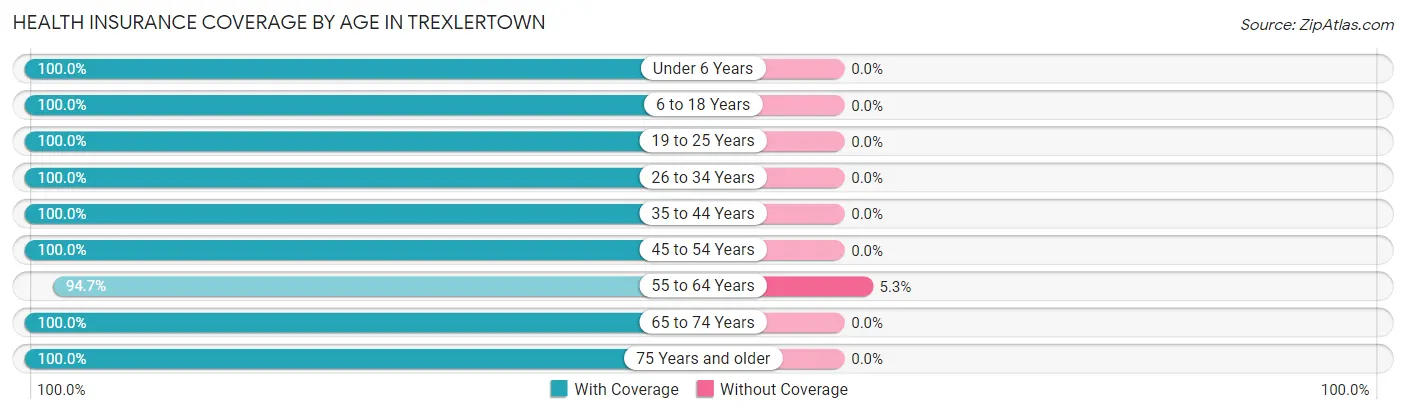
| Age Bracket | With Coverage | Without Coverage |
| Under 6 Years | 323 (100.0%) | 0 (0.0%) |
| 6 to 18 Years | 153 (100.0%) | 0 (0.0%) |
| 19 to 25 Years | 97 (100.0%) | 0 (0.0%) |
| 26 to 34 Years | 394 (100.0%) | 0 (0.0%) |
| 35 to 44 Years | 298 (100.0%) | 0 (0.0%) |
| 45 to 54 Years | 290 (100.0%) | 0 (0.0%) |
| 55 to 64 Years | 126 (94.7%) | 7 (5.3%) |
| 65 to 74 Years | 56 (100.0%) | 0 (0.0%) |
| 75 Years and older | 81 (100.0%) | 0 (0.0%) |
| Total | 1,818 (99.6%) | 7 (0.4%) |
Health Insurance Coverage by Citizenship Status in Trexlertown
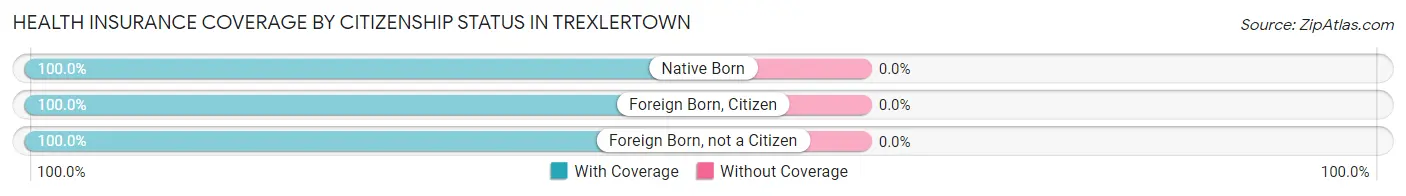
| Citizenship Status | With Coverage | Without Coverage |
| Native Born | 323 (100.0%) | 0 (0.0%) |
| Foreign Born, Citizen | 153 (100.0%) | 0 (0.0%) |
| Foreign Born, not a Citizen | 97 (100.0%) | 0 (0.0%) |
Health Insurance Coverage by Household Income in Trexlertown
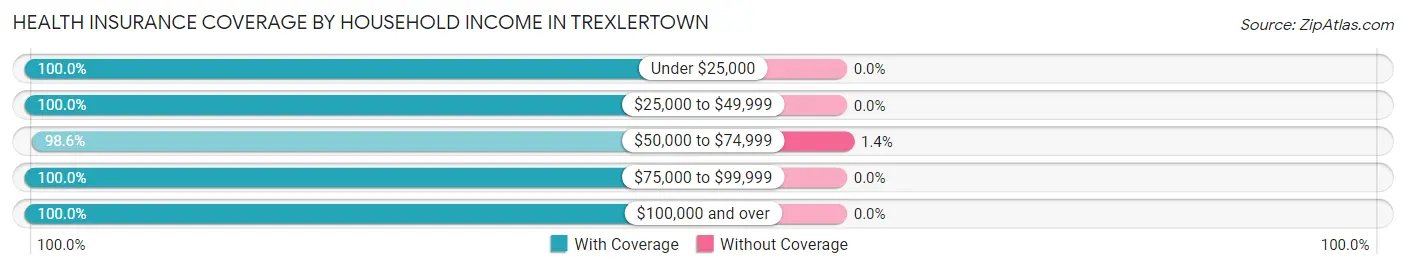
| Household Income | With Coverage | Without Coverage |
| Under $25,000 | 34 (100.0%) | 0 (0.0%) |
| $25,000 to $49,999 | 62 (100.0%) | 0 (0.0%) |
| $50,000 to $74,999 | 507 (98.6%) | 7 (1.4%) |
| $75,000 to $99,999 | 443 (100.0%) | 0 (0.0%) |
| $100,000 and over | 759 (100.0%) | 0 (0.0%) |
Public vs Private Health Insurance Coverage by Age in Trexlertown
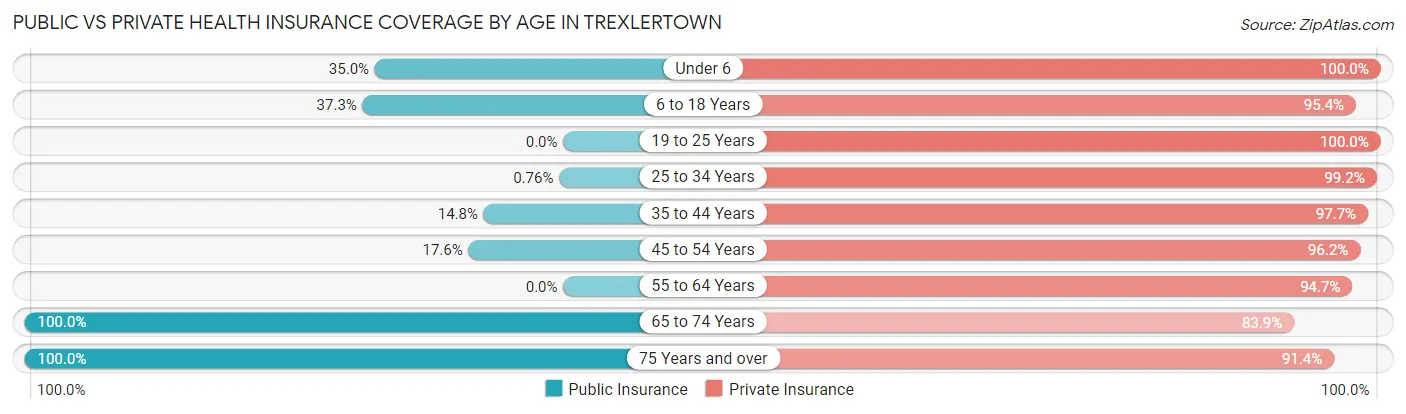
| Age Bracket | Public Insurance | Private Insurance |
| Under 6 | 113 (35.0%) | 323 (100.0%) |
| 6 to 18 Years | 57 (37.2%) | 146 (95.4%) |
| 19 to 25 Years | 0 (0.0%) | 97 (100.0%) |
| 25 to 34 Years | 3 (0.8%) | 391 (99.2%) |
| 35 to 44 Years | 44 (14.8%) | 291 (97.7%) |
| 45 to 54 Years | 51 (17.6%) | 279 (96.2%) |
| 55 to 64 Years | 0 (0.0%) | 126 (94.7%) |
| 65 to 74 Years | 56 (100.0%) | 47 (83.9%) |
| 75 Years and over | 81 (100.0%) | 74 (91.4%) |
| Total | 405 (22.2%) | 1,774 (97.2%) |
Disability Status by Sex by Age in Trexlertown
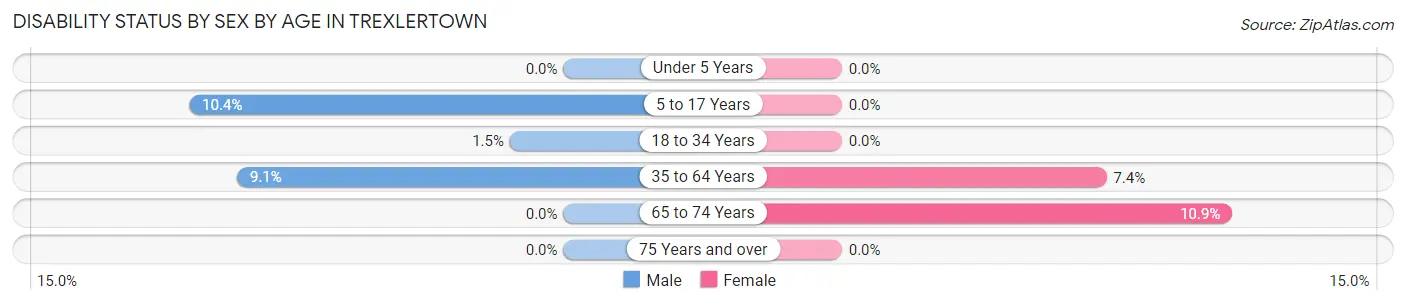
| Age Bracket | Male | Female |
| Under 5 Years | 0 (0.0%) | 0 (0.0%) |
| 5 to 17 Years | 10 (10.4%) | 0 (0.0%) |
| 18 to 34 Years | 3 (1.5%) | 0 (0.0%) |
| 35 to 64 Years | 31 (9.1%) | 28 (7.4%) |
| 65 to 74 Years | 0 (0.0%) | 5 (10.9%) |
| 75 Years and over | 0 (0.0%) | 0 (0.0%) |
Disability Class by Sex by Age in Trexlertown
Disability Class: Hearing Difficulty
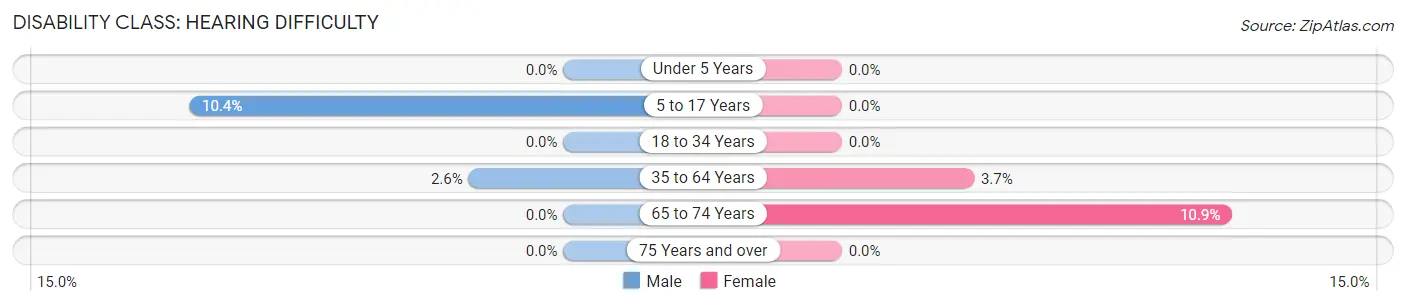
| Age Bracket | Male | Female |
| Under 5 Years | 0 (0.0%) | 0 (0.0%) |
| 5 to 17 Years | 10 (10.4%) | 0 (0.0%) |
| 18 to 34 Years | 0 (0.0%) | 0 (0.0%) |
| 35 to 64 Years | 9 (2.6%) | 14 (3.7%) |
| 65 to 74 Years | 0 (0.0%) | 5 (10.9%) |
| 75 Years and over | 0 (0.0%) | 0 (0.0%) |
Disability Class: Vision Difficulty
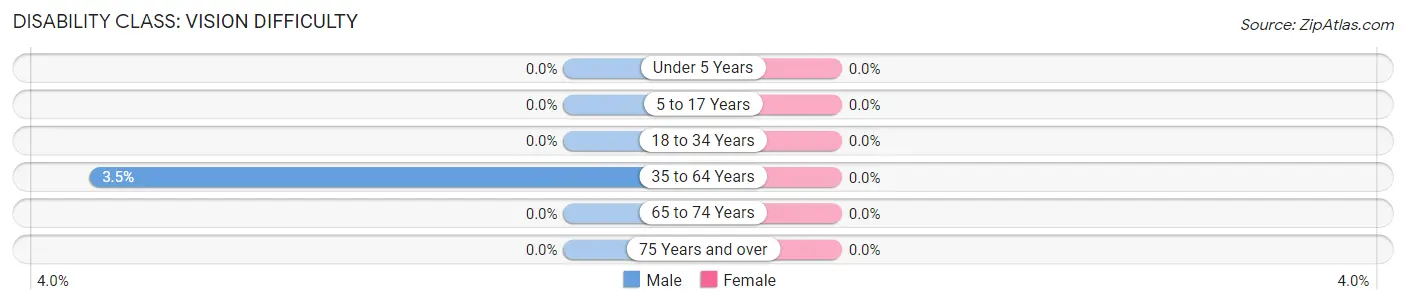
| Age Bracket | Male | Female |
| Under 5 Years | 0 (0.0%) | 0 (0.0%) |
| 5 to 17 Years | 0 (0.0%) | 0 (0.0%) |
| 18 to 34 Years | 0 (0.0%) | 0 (0.0%) |
| 35 to 64 Years | 12 (3.5%) | 0 (0.0%) |
| 65 to 74 Years | 0 (0.0%) | 0 (0.0%) |
| 75 Years and over | 0 (0.0%) | 0 (0.0%) |
Disability Class: Cognitive Difficulty
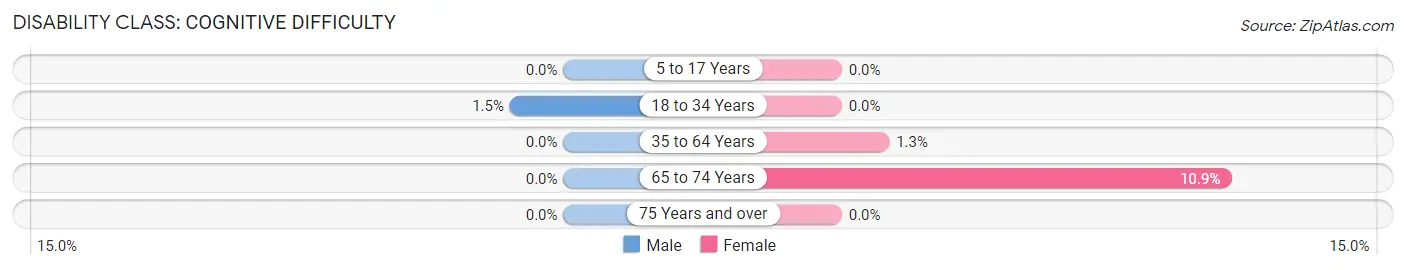
| Age Bracket | Male | Female |
| 5 to 17 Years | 0 (0.0%) | 0 (0.0%) |
| 18 to 34 Years | 3 (1.5%) | 0 (0.0%) |
| 35 to 64 Years | 0 (0.0%) | 5 (1.3%) |
| 65 to 74 Years | 0 (0.0%) | 5 (10.9%) |
| 75 Years and over | 0 (0.0%) | 0 (0.0%) |
Disability Class: Ambulatory Difficulty
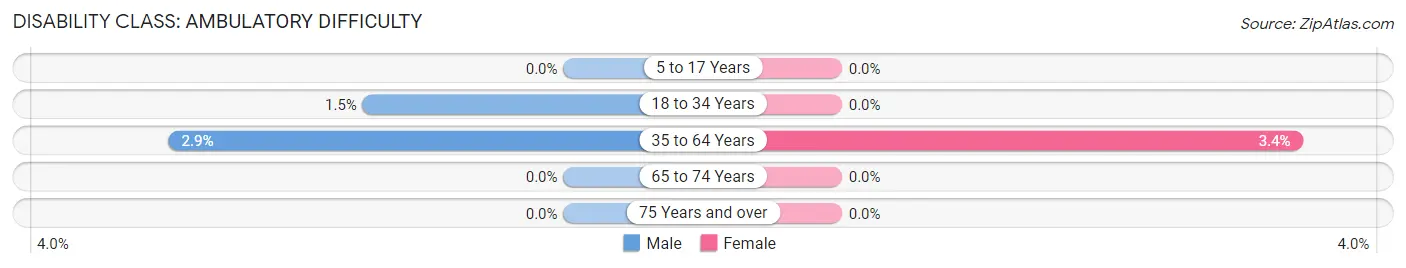
| Age Bracket | Male | Female |
| 5 to 17 Years | 0 (0.0%) | 0 (0.0%) |
| 18 to 34 Years | 3 (1.5%) | 0 (0.0%) |
| 35 to 64 Years | 10 (2.9%) | 13 (3.4%) |
| 65 to 74 Years | 0 (0.0%) | 0 (0.0%) |
| 75 Years and over | 0 (0.0%) | 0 (0.0%) |
Disability Class: Self-Care Difficulty
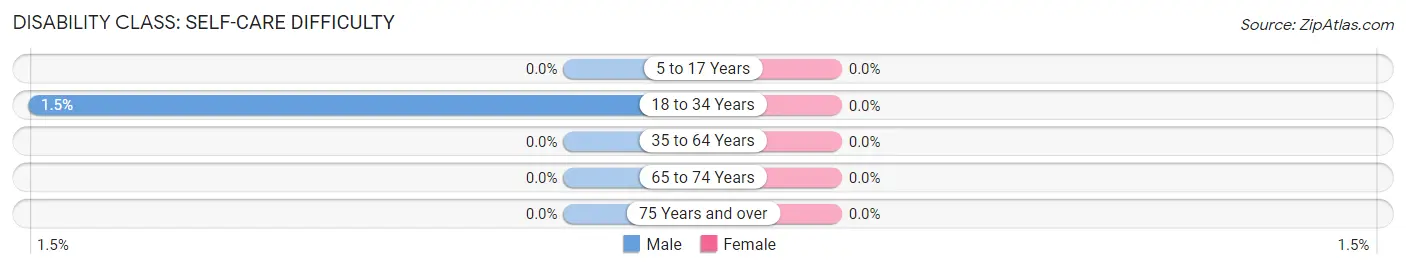
| Age Bracket | Male | Female |
| 5 to 17 Years | 0 (0.0%) | 0 (0.0%) |
| 18 to 34 Years | 3 (1.5%) | 0 (0.0%) |
| 35 to 64 Years | 0 (0.0%) | 0 (0.0%) |
| 65 to 74 Years | 0 (0.0%) | 0 (0.0%) |
| 75 Years and over | 0 (0.0%) | 0 (0.0%) |
Technology Access in Trexlertown
Computing Device Access in Trexlertown
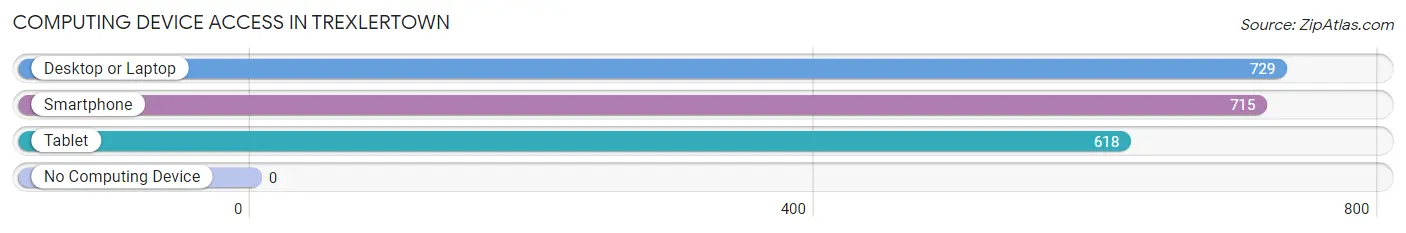
| Device Type | # Households | % Households |
| Desktop or Laptop | 729 | 96.1% |
| Smartphone | 715 | 94.2% |
| Tablet | 618 | 81.4% |
| No Computing Device | 0 | 0.0% |
| Total | 759 | 100.0% |
Internet Access in Trexlertown
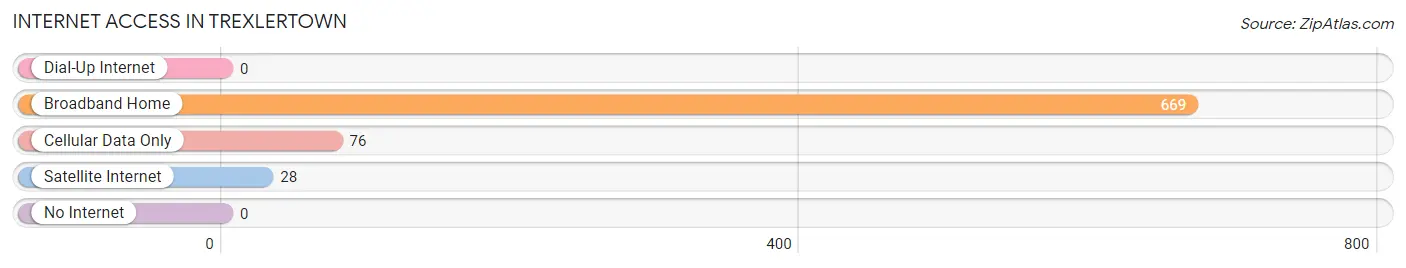
| Internet Type | # Households | % Households |
| Dial-Up Internet | 0 | 0.0% |
| Broadband Home | 669 | 88.1% |
| Cellular Data Only | 76 | 10.0% |
| Satellite Internet | 28 | 3.7% |
| No Internet | 0 | 0.0% |
| Total | 759 | 100.0% |
Trexlertown Summary
Trexlertown, Pennsylvania is a small unincorporated community located in Lehigh County, Pennsylvania. It is situated in the Lehigh Valley region of the state, approximately 10 miles northwest of Allentown, the county seat. The population of Trexlertown was estimated to be 2,845 in 2019.
History
Trexlertown was founded in 1750 by John Trexler, a German immigrant who purchased a large tract of land in the area. The town was originally known as Trexlerstown, but the name was changed to Trexlertown in 1875. The town was primarily an agricultural community until the early 20th century, when it began to develop into a small industrial center. The first industry to locate in Trexlertown was the Trexler Leather Company, which opened in 1906. The company was later renamed the Trexlertown Leather Company and operated until the mid-1960s.
In the 1950s, Trexlertown began to experience a period of rapid growth and development. The Trexlertown Shopping Center opened in 1956, followed by the Trexlertown Plaza in 1959. The Trexlertown Industrial Park was established in the 1960s, and the Trexlertown Airport opened in 1967.
Geography
Trexlertown is located in the Lehigh Valley region of Pennsylvania, approximately 10 miles northwest of Allentown. The town is situated in the foothills of the Appalachian Mountains, and is bordered by the Lehigh River to the east and the Little Lehigh Creek to the west. The town covers an area of 2.3 square miles, and has an elevation of 441 feet above sea level.
Economy
Trexlertown is primarily a residential community, but it is also home to a number of businesses and industries. The Trexlertown Industrial Park is home to a variety of businesses, including manufacturing, warehousing, and distribution companies. The Trexlertown Airport is also located in the town, and is used for general aviation and corporate flights.
Demographics
As of the 2010 census, the population of Trexlertown was 2,717. The racial makeup of the town was 94.3% White, 1.2% African American, 0.3% Native American, 1.2% Asian, 0.1% Pacific Islander, 1.2% from other races, and 1.9% from two or more races. Hispanic or Latino of any race were 3.3% of the population.
The median household income in Trexlertown was $50,938 in 2019, and the median home value was $219,400. The town has a high rate of homeownership, with 73.3% of residents owning their homes. The unemployment rate in Trexlertown was 3.7% in 2019.
Conclusion
Trexlertown is a small unincorporated community located in Lehigh County, Pennsylvania. It was founded in 1750 by John Trexler, and has since developed into a small industrial center. The town is primarily a residential community, but it is also home to a number of businesses and industries. The population of Trexlertown was estimated to be 2,845 in 2019, and the median household income was $50,938. Trexlertown is a vibrant community with a rich history and a bright future.
Common Questions
What is Per Capita Income in Trexlertown?
Per Capita income in Trexlertown is $45,024.
What is the Median Family Income in Trexlertown?
Median Family Income in Trexlertown is $142,909.
What is the Median Household income in Trexlertown?
Median Household Income in Trexlertown is $93,472.
What is Income or Wage Gap in Trexlertown?
Income or Wage Gap in Trexlertown is 18.8%.
Women in Trexlertown earn 81.2 cents for every dollar earned by a man.
What is Inequality or Gini Index in Trexlertown?
Inequality or Gini Index in Trexlertown is 0.31.
What is the Total Population of Trexlertown?
Total Population of Trexlertown is 1,885.
What is the Total Male Population of Trexlertown?
Total Male Population of Trexlertown is 905.
What is the Total Female Population of Trexlertown?
Total Female Population of Trexlertown is 980.
What is the Ratio of Males per 100 Females in Trexlertown?
There are 92.35 Males per 100 Females in Trexlertown.
What is the Ratio of Females per 100 Males in Trexlertown?
There are 108.29 Females per 100 Males in Trexlertown.
What is the Median Population Age in Trexlertown?
Median Population Age in Trexlertown is 34.6 Years.
What is the Average Family Size in Trexlertown
Average Family Size in Trexlertown is 3.1 People.
What is the Average Household Size in Trexlertown
Average Household Size in Trexlertown is 2.4 People.
How Large is the Labor Force in Trexlertown?
There are 1,229 People in the Labor Forcein in Trexlertown.
What is the Percentage of People in the Labor Force in Trexlertown?
85.3% of People are in the Labor Force in Trexlertown.