Schwenksville borough, PA Map & Demographics
Schwenksville borough Overview
$35,778
PER CAPITA INCOME
$83,194
AVG FAMILY INCOME
$65,962
AVG HOUSEHOLD INCOME
5.0%
WAGE / INCOME GAP [ % ]
95.0¢/ $1
WAGE / INCOME GAP [ $ ]
0.37
INEQUALITY / GINI INDEX
1,366
TOTAL POPULATION
646
MALE POPULATION
720
FEMALE POPULATION
89.72
MALES / 100 FEMALES
111.46
FEMALES / 100 MALES
39.9
MEDIAN AGE
3.0
AVG FAMILY SIZE
2.1
AVG HOUSEHOLD SIZE
769
LABOR FORCE [ PEOPLE ]
73.3%
PERCENT IN LABOR FORCE
4.1%
UNEMPLOYMENT RATE
Income in Schwenksville borough
Income Overview in Schwenksville borough
Per Capita Income in Schwenksville borough is $35,778, while median incomes of families and households are $83,194 and $65,962 respectively.
| Characteristic | Number | Measure |
| Per Capita Income | 1,366 | $35,778 |
| Median Family Income | 301 | $83,194 |
| Mean Family Income | 301 | $90,256 |
| Median Household Income | 620 | $65,962 |
| Mean Household Income | 620 | $77,285 |
| Income Deficit | 301 | $0 |
| Wage / Income Gap (%) | 1,366 | 4.96% |
| Wage / Income Gap ($) | 1,366 | 95.04¢ per $1 |
| Gini / Inequality Index | 1,366 | 0.37 |
Earnings by Sex in Schwenksville borough
Average Earnings in Schwenksville borough are $43,958, $45,521 for men and $43,264 for women, a difference of 5.0%.
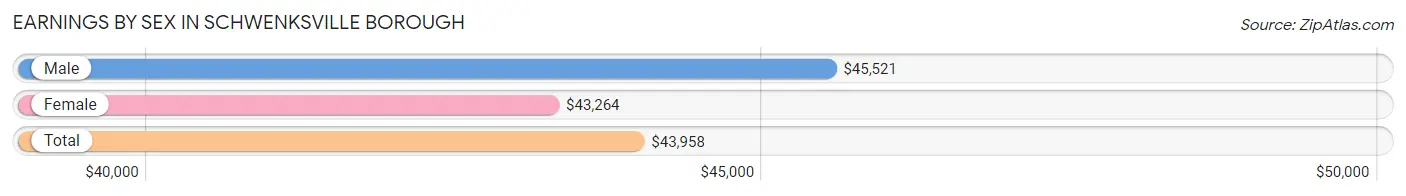
| Sex | Number | Average Earnings |
| Male | 401 (50.1%) | $45,521 |
| Female | 399 (49.9%) | $43,264 |
| Total | 800 (100.0%) | $43,958 |
Earnings by Sex by Income Bracket in Schwenksville borough
The most common earnings brackets in Schwenksville borough are $75,000 to $99,999 for men (63 | 15.7%) and $35,000 to $39,999 for women (41 | 10.3%).
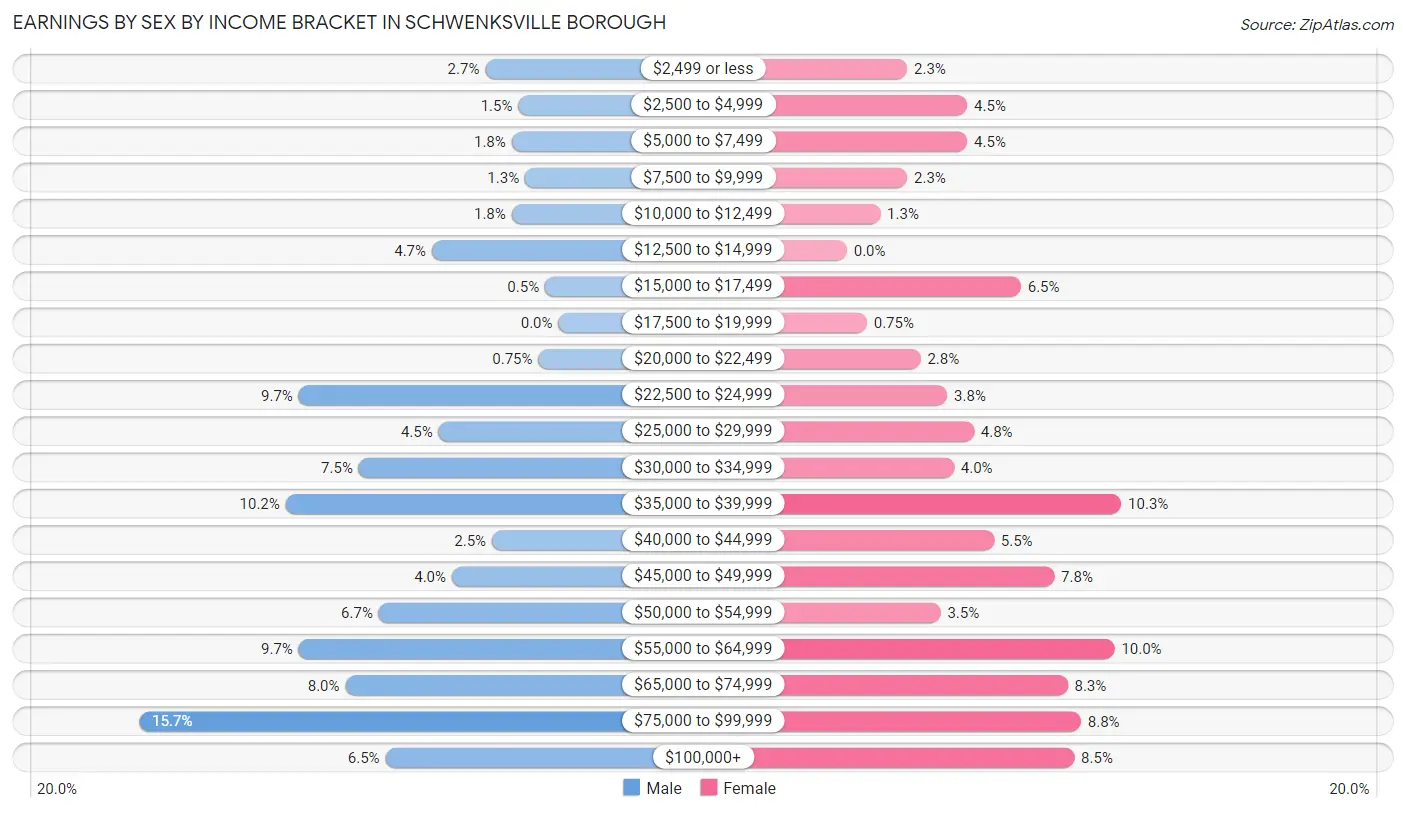
| Income | Male | Female |
| $2,499 or less | 11 (2.7%) | 9 (2.3%) |
| $2,500 to $4,999 | 6 (1.5%) | 18 (4.5%) |
| $5,000 to $7,499 | 7 (1.8%) | 18 (4.5%) |
| $7,500 to $9,999 | 5 (1.3%) | 9 (2.3%) |
| $10,000 to $12,499 | 7 (1.8%) | 5 (1.3%) |
| $12,500 to $14,999 | 19 (4.7%) | 0 (0.0%) |
| $15,000 to $17,499 | 2 (0.5%) | 26 (6.5%) |
| $17,500 to $19,999 | 0 (0.0%) | 3 (0.7%) |
| $20,000 to $22,499 | 3 (0.7%) | 11 (2.8%) |
| $22,500 to $24,999 | 39 (9.7%) | 15 (3.8%) |
| $25,000 to $29,999 | 18 (4.5%) | 19 (4.8%) |
| $30,000 to $34,999 | 30 (7.5%) | 16 (4.0%) |
| $35,000 to $39,999 | 41 (10.2%) | 41 (10.3%) |
| $40,000 to $44,999 | 10 (2.5%) | 22 (5.5%) |
| $45,000 to $49,999 | 16 (4.0%) | 31 (7.8%) |
| $50,000 to $54,999 | 27 (6.7%) | 14 (3.5%) |
| $55,000 to $64,999 | 39 (9.7%) | 40 (10.0%) |
| $65,000 to $74,999 | 32 (8.0%) | 33 (8.3%) |
| $75,000 to $99,999 | 63 (15.7%) | 35 (8.8%) |
| $100,000+ | 26 (6.5%) | 34 (8.5%) |
| Total | 401 (100.0%) | 399 (100.0%) |
Earnings by Sex by Educational Attainment in Schwenksville borough
Average earnings in Schwenksville borough are $48,125 for men and $45,529 for women, a difference of 5.4%. Men with an educational attainment of college or associate's degree enjoy the highest average annual earnings of $69,063, while those with graduate degree education earn the least with $24,183. Women with an educational attainment of bachelor's degree earn the most with the average annual earnings of $76,250, while those with college or associate's degree education have the smallest earnings of $35,875.
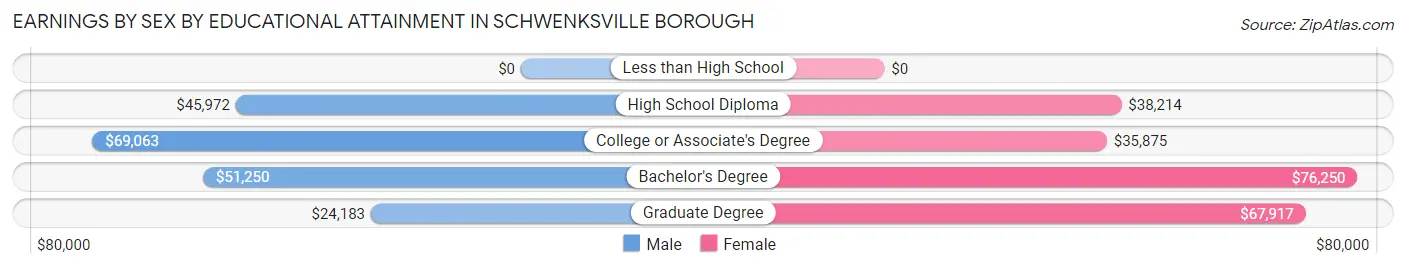
| Educational Attainment | Male Income | Female Income |
| Less than High School | - | - |
| High School Diploma | $45,972 | $38,214 |
| College or Associate's Degree | $69,063 | $35,875 |
| Bachelor's Degree | $51,250 | $76,250 |
| Graduate Degree | $24,183 | $67,917 |
| Total | $48,125 | $45,529 |
Family Income in Schwenksville borough
Family Income Brackets in Schwenksville borough
According to the Schwenksville borough family income data, there are 68 families falling into the $100,000 to $149,999 income range, which is the most common income bracket and makes up 22.6% of all families. Conversely, the $25,000 to $34,999 income bracket is the least frequent group with only 6 families (2.0%) belonging to this category.
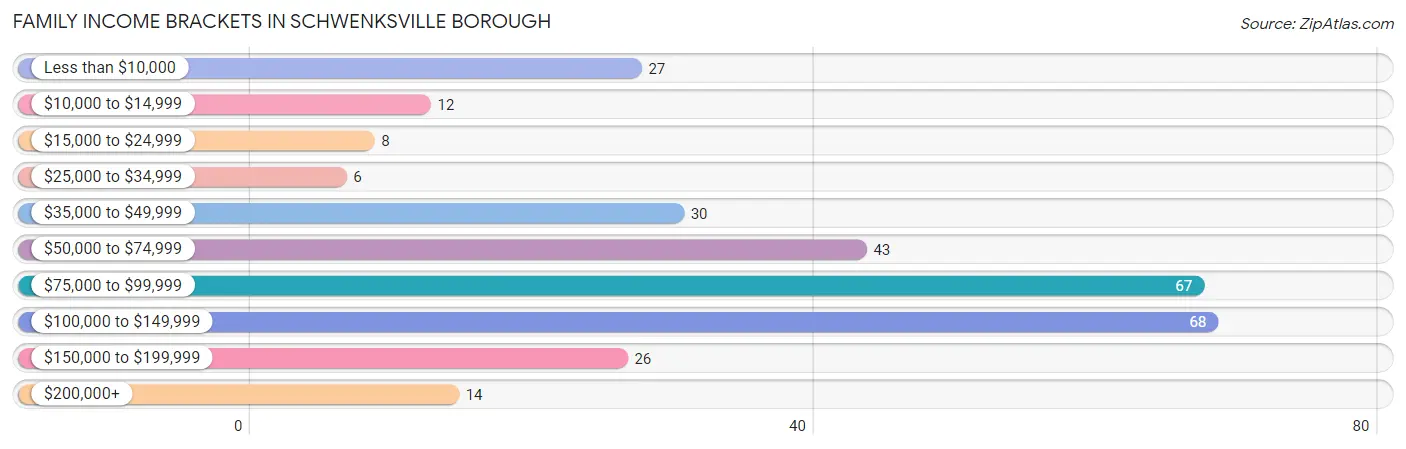
| Income Bracket | # Families | % Families |
| Less than $10,000 | 27 | 9.0% |
| $10,000 to $14,999 | 12 | 4.0% |
| $15,000 to $24,999 | 8 | 2.7% |
| $25,000 to $34,999 | 6 | 2.0% |
| $35,000 to $49,999 | 30 | 10.0% |
| $50,000 to $74,999 | 43 | 14.3% |
| $75,000 to $99,999 | 67 | 22.3% |
| $100,000 to $149,999 | 68 | 22.6% |
| $150,000 to $199,999 | 26 | 8.6% |
| $200,000+ | 14 | 4.7% |
Family Income by Famaliy Size in Schwenksville borough
4-person families (42 | 14.0%) account for the highest median family income in Schwenksville borough with $126,250 per family, while 2-person families (125 | 41.5%) have the highest median income of $39,018 per family member.
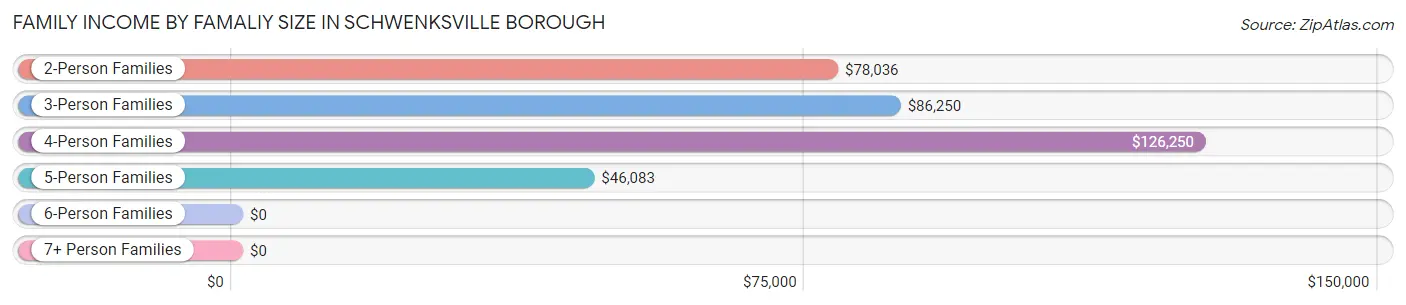
| Income Bracket | # Families | Median Income |
| 2-Person Families | 125 (41.5%) | $78,036 |
| 3-Person Families | 94 (31.2%) | $86,250 |
| 4-Person Families | 42 (14.0%) | $126,250 |
| 5-Person Families | 29 (9.6%) | $46,083 |
| 6-Person Families | 11 (3.6%) | $0 |
| 7+ Person Families | 0 (0.0%) | $0 |
| Total | 301 (100.0%) | $83,194 |
Family Income by Number of Earners in Schwenksville borough
The median family income in Schwenksville borough is $83,194, with families comprising 3+ earners (21) having the highest median family income of $128,393, while families with no earners (30) have the lowest median family income of $2,499, accounting for 7.0% and 10.0% of families, respectively.
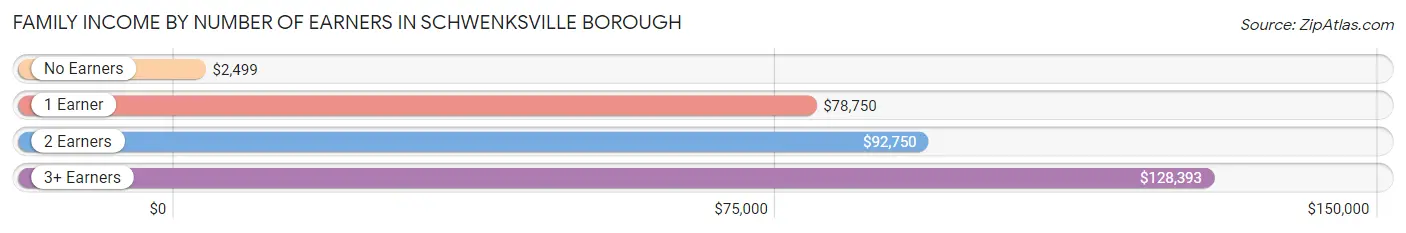
| Number of Earners | # Families | Median Income |
| No Earners | 30 (10.0%) | $2,499 |
| 1 Earner | 113 (37.5%) | $78,750 |
| 2 Earners | 137 (45.5%) | $92,750 |
| 3+ Earners | 21 (7.0%) | $128,393 |
| Total | 301 (100.0%) | $83,194 |
Household Income in Schwenksville borough
Household Income Brackets in Schwenksville borough
With 167 households falling in the category, the $50,000 to $74,999 income range is the most frequent in Schwenksville borough, accounting for 26.9% of all households. In contrast, only 19 households (3.1%) fall into the $200,000+ income bracket, making it the least populous group.
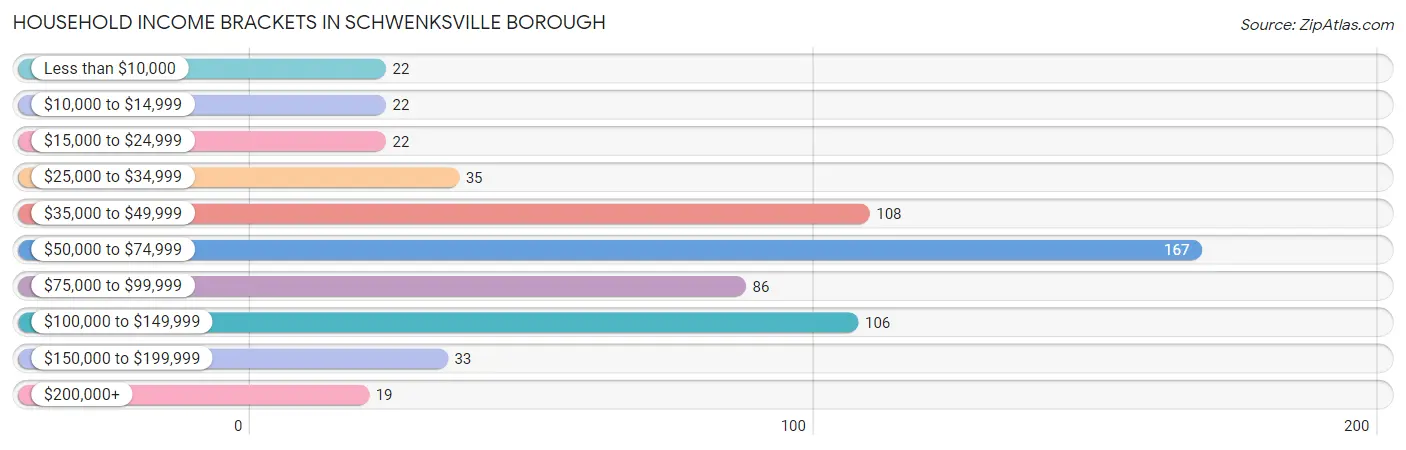
| Income Bracket | # Households | % Households |
| Less than $10,000 | 22 | 3.5% |
| $10,000 to $14,999 | 22 | 3.5% |
| $15,000 to $24,999 | 22 | 3.5% |
| $25,000 to $34,999 | 35 | 5.6% |
| $35,000 to $49,999 | 108 | 17.4% |
| $50,000 to $74,999 | 167 | 26.9% |
| $75,000 to $99,999 | 86 | 13.9% |
| $100,000 to $149,999 | 106 | 17.1% |
| $150,000 to $199,999 | 33 | 5.3% |
| $200,000+ | 19 | 3.1% |
Household Income by Householder Age in Schwenksville borough
The median household income in Schwenksville borough is $65,962, with the highest median household income of $77,667 found in the 25 to 44 years age bracket for the primary householder. A total of 202 households (32.6%) fall into this category. Meanwhile, the 65+ years age bracket for the primary householder has the lowest median household income of $42,813, with 163 households (26.3%) in this group.
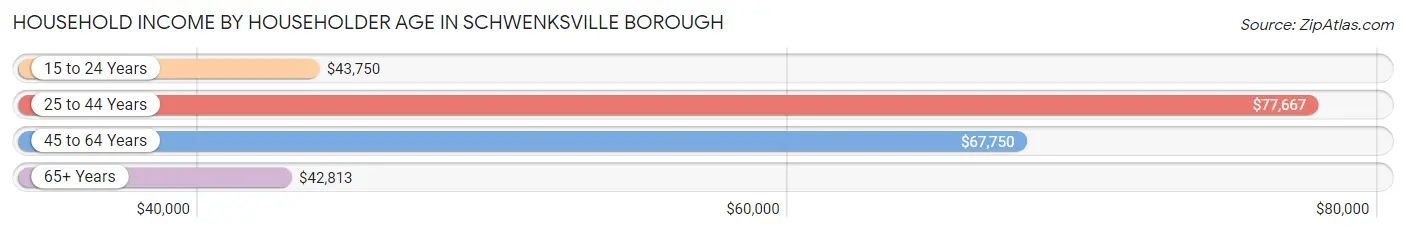
| Income Bracket | # Households | Median Income |
| 15 to 24 Years | 22 (3.5%) | $43,750 |
| 25 to 44 Years | 202 (32.6%) | $77,667 |
| 45 to 64 Years | 233 (37.6%) | $67,750 |
| 65+ Years | 163 (26.3%) | $42,813 |
| Total | 620 (100.0%) | $65,962 |
Poverty in Schwenksville borough
Income Below Poverty by Sex and Age in Schwenksville borough
With 11.2% poverty level for males and 14.9% for females among the residents of Schwenksville borough, 6 to 11 year old males and under 5 year old females are the most vulnerable to poverty, with 22 males (24.7%) and 13 females (35.1%) in their respective age groups living below the poverty level.
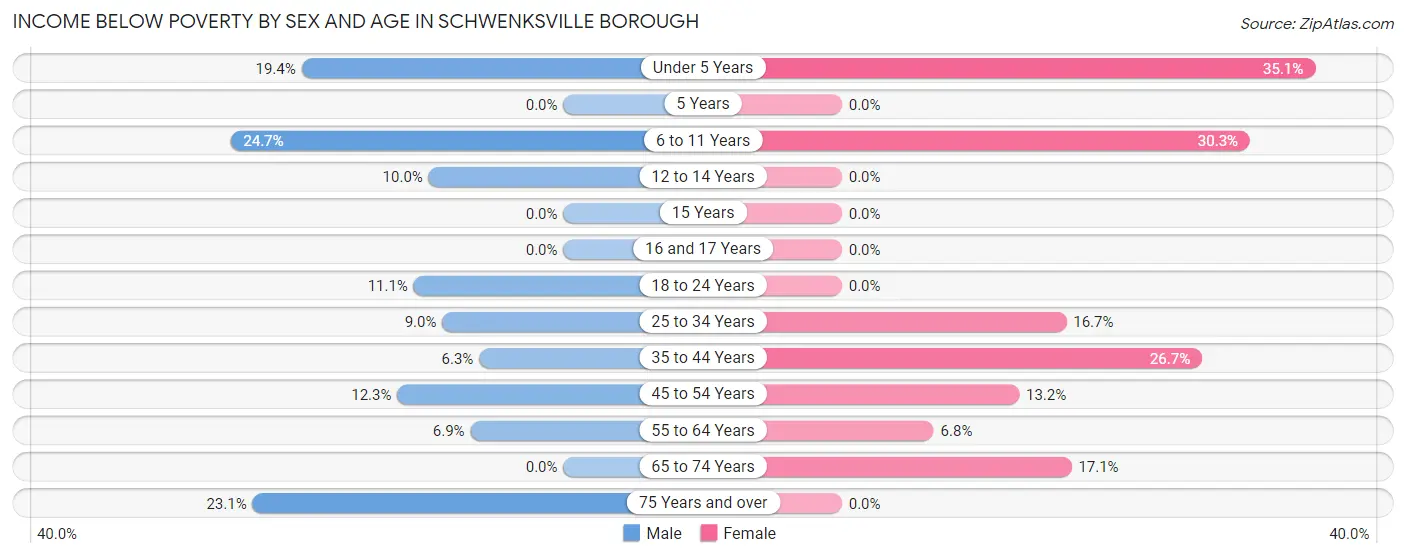
| Age Bracket | Male | Female |
| Under 5 Years | 7 (19.4%) | 13 (35.1%) |
| 5 Years | 0 (0.0%) | 0 (0.0%) |
| 6 to 11 Years | 22 (24.7%) | 20 (30.3%) |
| 12 to 14 Years | 4 (10.0%) | 0 (0.0%) |
| 15 Years | 0 (0.0%) | 0 (0.0%) |
| 16 and 17 Years | 0 (0.0%) | 0 (0.0%) |
| 18 to 24 Years | 3 (11.1%) | 0 (0.0%) |
| 25 to 34 Years | 8 (9.0%) | 12 (16.7%) |
| 35 to 44 Years | 6 (6.2%) | 23 (26.7%) |
| 45 to 54 Years | 9 (12.3%) | 15 (13.2%) |
| 55 to 64 Years | 8 (6.9%) | 6 (6.8%) |
| 65 to 74 Years | 0 (0.0%) | 15 (17.1%) |
| 75 Years and over | 3 (23.1%) | 0 (0.0%) |
| Total | 70 (11.2%) | 104 (14.9%) |
Income Above Poverty by Sex and Age in Schwenksville borough
According to the poverty statistics in Schwenksville borough, males aged 15 years and females aged 5 years are the age groups that are most secure financially, with 100.0% of males and 100.0% of females in these age groups living above the poverty line.
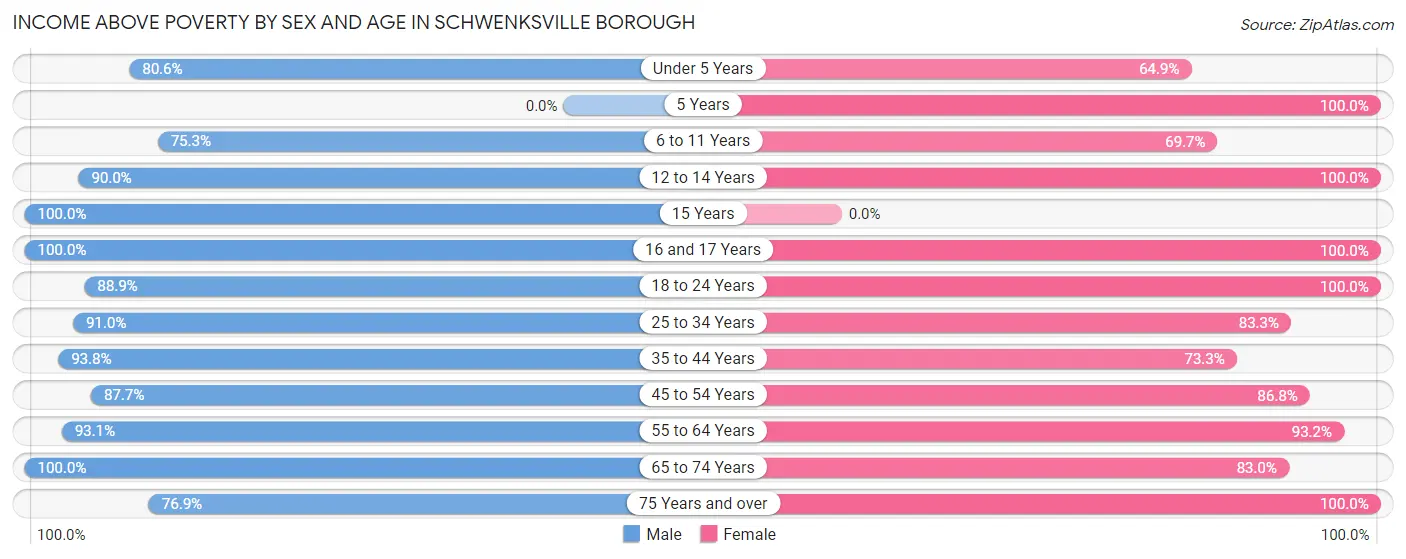
| Age Bracket | Male | Female |
| Under 5 Years | 29 (80.6%) | 24 (64.9%) |
| 5 Years | 0 (0.0%) | 5 (100.0%) |
| 6 to 11 Years | 67 (75.3%) | 46 (69.7%) |
| 12 to 14 Years | 36 (90.0%) | 38 (100.0%) |
| 15 Years | 6 (100.0%) | 0 (0.0%) |
| 16 and 17 Years | 4 (100.0%) | 3 (100.0%) |
| 18 to 24 Years | 24 (88.9%) | 48 (100.0%) |
| 25 to 34 Years | 81 (91.0%) | 60 (83.3%) |
| 35 to 44 Years | 90 (93.8%) | 63 (73.3%) |
| 45 to 54 Years | 64 (87.7%) | 99 (86.8%) |
| 55 to 64 Years | 108 (93.1%) | 82 (93.2%) |
| 65 to 74 Years | 38 (100.0%) | 73 (83.0%) |
| 75 Years and over | 10 (76.9%) | 53 (100.0%) |
| Total | 557 (88.8%) | 594 (85.1%) |
Income Below Poverty Among Married-Couple Families in Schwenksville borough
The poverty statistics for married-couple families in Schwenksville borough show that 6.6% or 12 of the total 183 families live below the poverty line. Families with 3 or 4 children have the highest poverty rate of 20.0%, comprising of 8 families. On the other hand, families with 1 or 2 children have the lowest poverty rate of 0.0%, which includes 0 families.
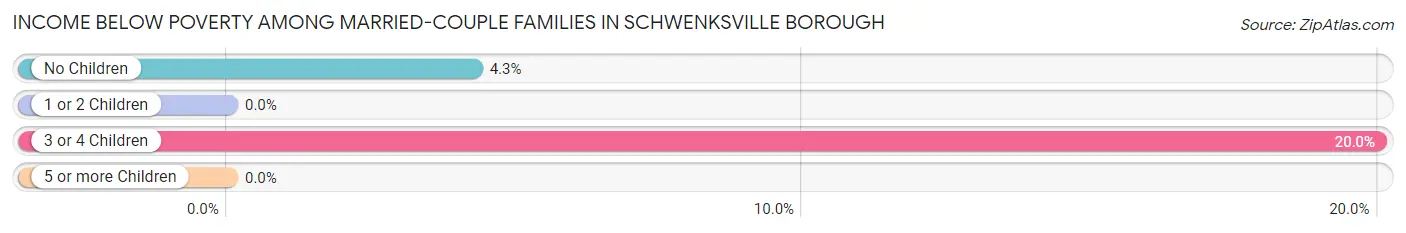
| Children | Above Poverty | Below Poverty |
| No Children | 90 (95.7%) | 4 (4.3%) |
| 1 or 2 Children | 49 (100.0%) | 0 (0.0%) |
| 3 or 4 Children | 32 (80.0%) | 8 (20.0%) |
| 5 or more Children | 0 (0.0%) | 0 (0.0%) |
| Total | 171 (93.4%) | 12 (6.6%) |
Income Below Poverty Among Single-Parent Households in Schwenksville borough
According to the poverty data in Schwenksville borough, 22.2% or 4 single-father households and 31.0% or 31 single-mother households are living below the poverty line. Among single-father households, those with 1 or 2 children have the highest poverty rate, with 4 households (25.0%) experiencing poverty. Likewise, among single-mother households, those with 3 or 4 children have the highest poverty rate, with 4 households (66.7%) falling below the poverty line.
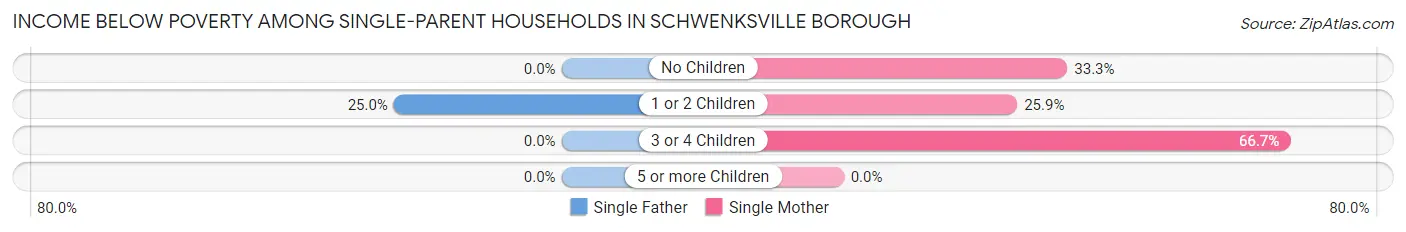
| Children | Single Father | Single Mother |
| No Children | 0 (0.0%) | 12 (33.3%) |
| 1 or 2 Children | 4 (25.0%) | 15 (25.9%) |
| 3 or 4 Children | 0 (0.0%) | 4 (66.7%) |
| 5 or more Children | 0 (0.0%) | 0 (0.0%) |
| Total | 4 (22.2%) | 31 (31.0%) |
Income Below Poverty Among Married-Couple vs Single-Parent Households in Schwenksville borough
The poverty data for Schwenksville borough shows that 12 of the married-couple family households (6.6%) and 35 of the single-parent households (29.7%) are living below the poverty level. Within the married-couple family households, those with 3 or 4 children have the highest poverty rate, with 8 households (20.0%) falling below the poverty line. Among the single-parent households, those with 3 or 4 children have the highest poverty rate, with 4 household (66.7%) living below poverty.
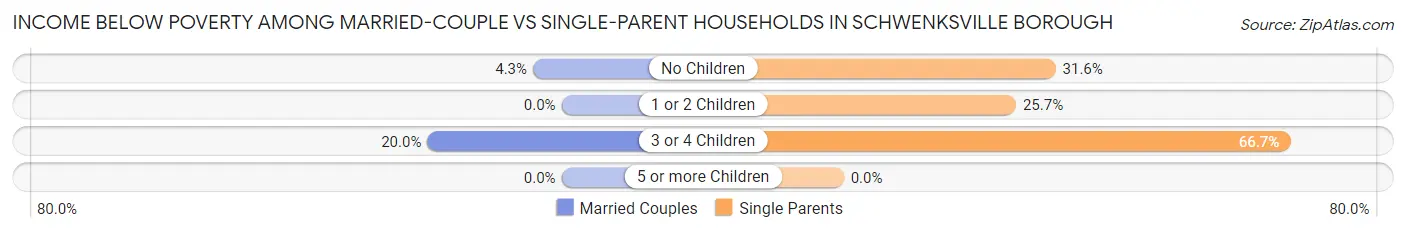
| Children | Married-Couple Families | Single-Parent Households |
| No Children | 4 (4.3%) | 12 (31.6%) |
| 1 or 2 Children | 0 (0.0%) | 19 (25.7%) |
| 3 or 4 Children | 8 (20.0%) | 4 (66.7%) |
| 5 or more Children | 0 (0.0%) | 0 (0.0%) |
| Total | 12 (6.6%) | 35 (29.7%) |
Race in Schwenksville borough
The most populous races in Schwenksville borough are White / Caucasian (1,193 | 87.3%), Black / African American (128 | 9.4%), and Two or more Races (35 | 2.6%).
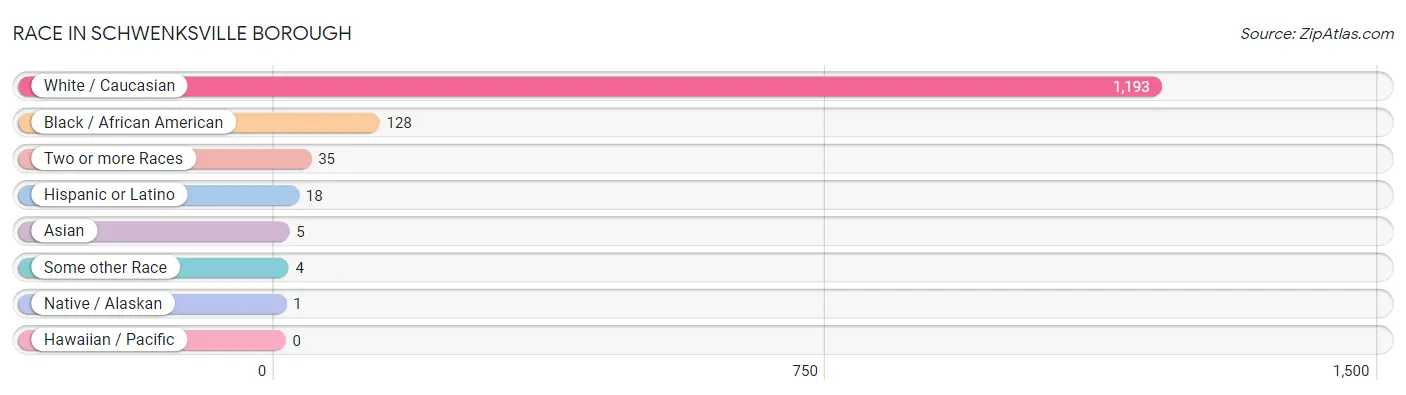
| Race | # Population | % Population |
| Asian | 5 | 0.4% |
| Black / African American | 128 | 9.4% |
| Hawaiian / Pacific | 0 | 0.0% |
| Hispanic or Latino | 18 | 1.3% |
| Native / Alaskan | 1 | 0.1% |
| White / Caucasian | 1,193 | 87.3% |
| Two or more Races | 35 | 2.6% |
| Some other Race | 4 | 0.3% |
| Total | 1,366 | 100.0% |
Ancestry in Schwenksville borough
The most populous ancestries reported in Schwenksville borough are Irish (378 | 27.7%), German (359 | 26.3%), Italian (191 | 14.0%), English (125 | 9.1%), and African (116 | 8.5%), together accounting for 85.6% of all Schwenksville borough residents.
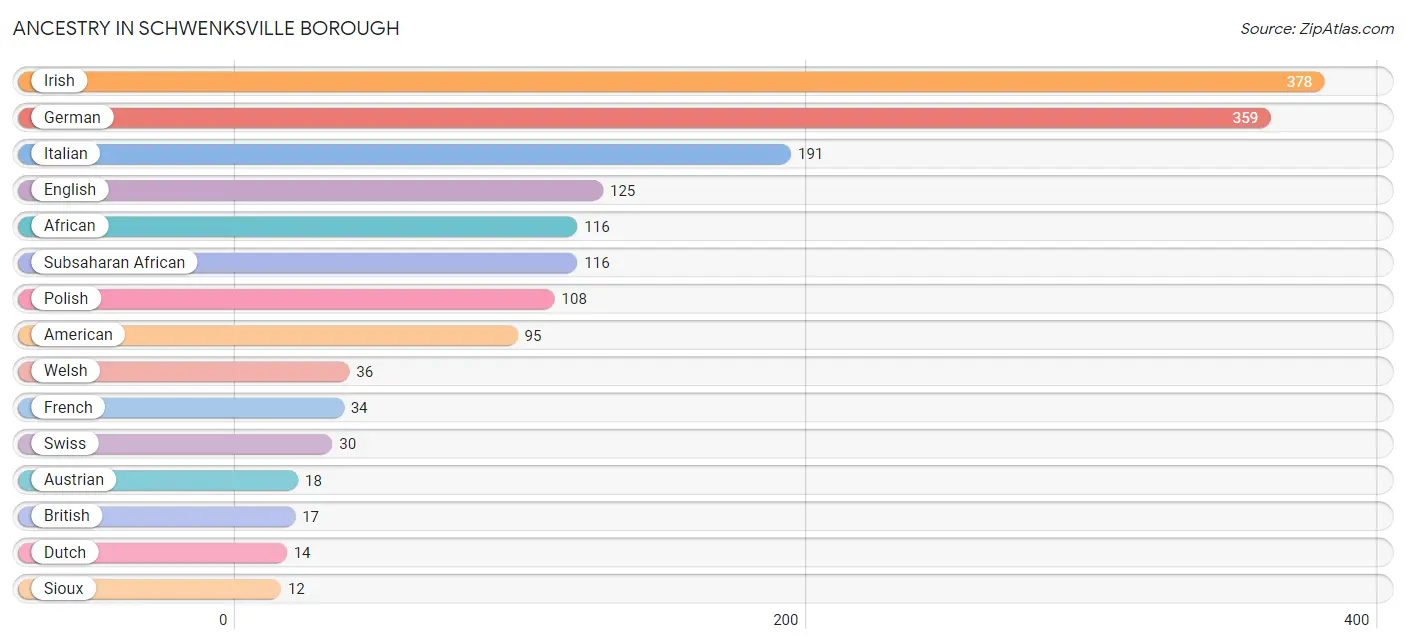
| Ancestry | # Population | % Population |
| African | 116 | 8.5% |
| American | 95 | 7.0% |
| Arab | 9 | 0.7% |
| Armenian | 6 | 0.4% |
| Austrian | 18 | 1.3% |
| Bhutanese | 5 | 0.4% |
| British | 17 | 1.2% |
| Colombian | 11 | 0.8% |
| Dutch | 14 | 1.0% |
| Eastern European | 8 | 0.6% |
| English | 125 | 9.1% |
| European | 4 | 0.3% |
| Filipino | 3 | 0.2% |
| French | 34 | 2.5% |
| French American Indian | 1 | 0.1% |
| French Canadian | 5 | 0.4% |
| German | 359 | 26.3% |
| Hungarian | 8 | 0.6% |
| Irish | 378 | 27.7% |
| Iroquois | 1 | 0.1% |
| Italian | 191 | 14.0% |
| Korean | 2 | 0.2% |
| Pennsylvania German | 11 | 0.8% |
| Polish | 108 | 7.9% |
| Puerto Rican | 7 | 0.5% |
| Romanian | 2 | 0.2% |
| Russian | 2 | 0.2% |
| Scotch-Irish | 8 | 0.6% |
| Scottish | 11 | 0.8% |
| Sioux | 12 | 0.9% |
| Slovak | 3 | 0.2% |
| South American | 11 | 0.8% |
| Subsaharan African | 116 | 8.5% |
| Swedish | 4 | 0.3% |
| Swiss | 30 | 2.2% |
| Syrian | 9 | 0.7% |
| Ukrainian | 8 | 0.6% |
| Welsh | 36 | 2.6% | View All 38 Rows |
Immigrants in Schwenksville borough
The most numerous immigrant groups reported in Schwenksville borough came from Africa (93 | 6.8%), Eastern Africa (74 | 5.4%), Zimbabwe (74 | 5.4%), South Africa (19 | 1.4%), and Europe (9 | 0.7%), together accounting for 19.7% of all Schwenksville borough residents.
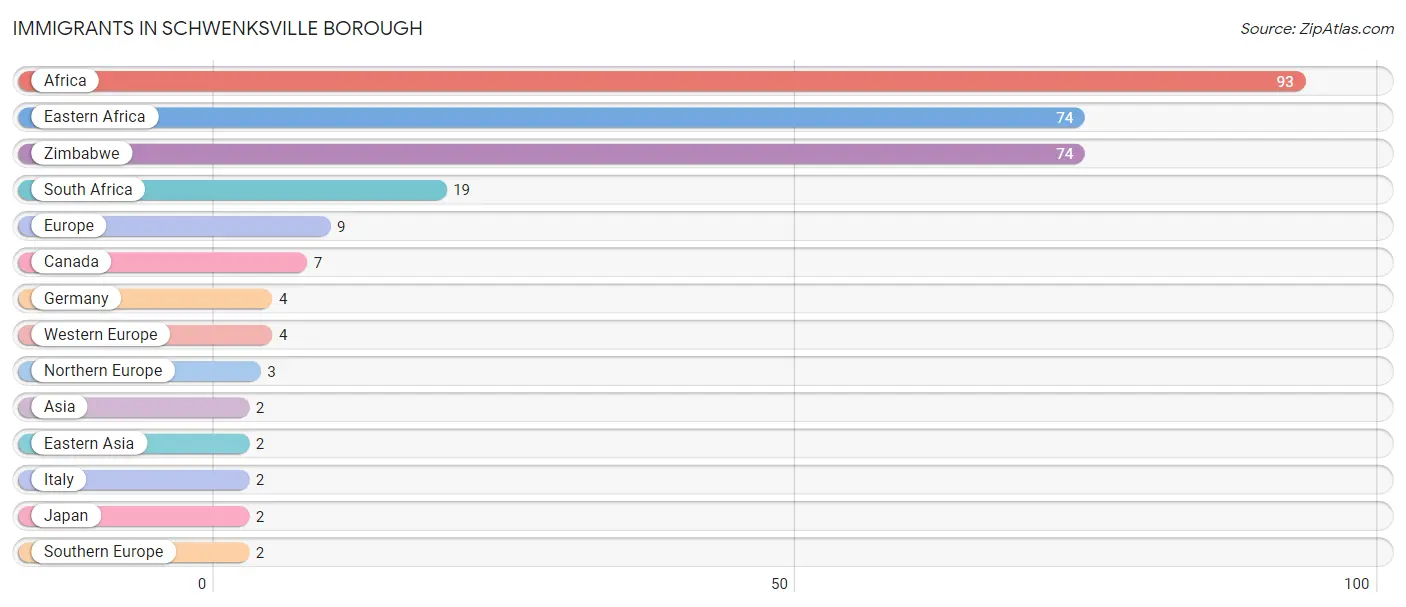
| Immigration Origin | # Population | % Population |
| Africa | 93 | 6.8% |
| Asia | 2 | 0.2% |
| Canada | 7 | 0.5% |
| Eastern Africa | 74 | 5.4% |
| Eastern Asia | 2 | 0.2% |
| Europe | 9 | 0.7% |
| Germany | 4 | 0.3% |
| Italy | 2 | 0.2% |
| Japan | 2 | 0.2% |
| Northern Europe | 3 | 0.2% |
| South Africa | 19 | 1.4% |
| Southern Europe | 2 | 0.2% |
| Western Europe | 4 | 0.3% |
| Zimbabwe | 74 | 5.4% | View All 14 Rows |
Sex and Age in Schwenksville borough
Sex and Age in Schwenksville borough
The most populous age groups in Schwenksville borough are 10 to 14 Years (74 | 11.5%) for men and 65 to 69 Years (80 | 11.1%) for women.
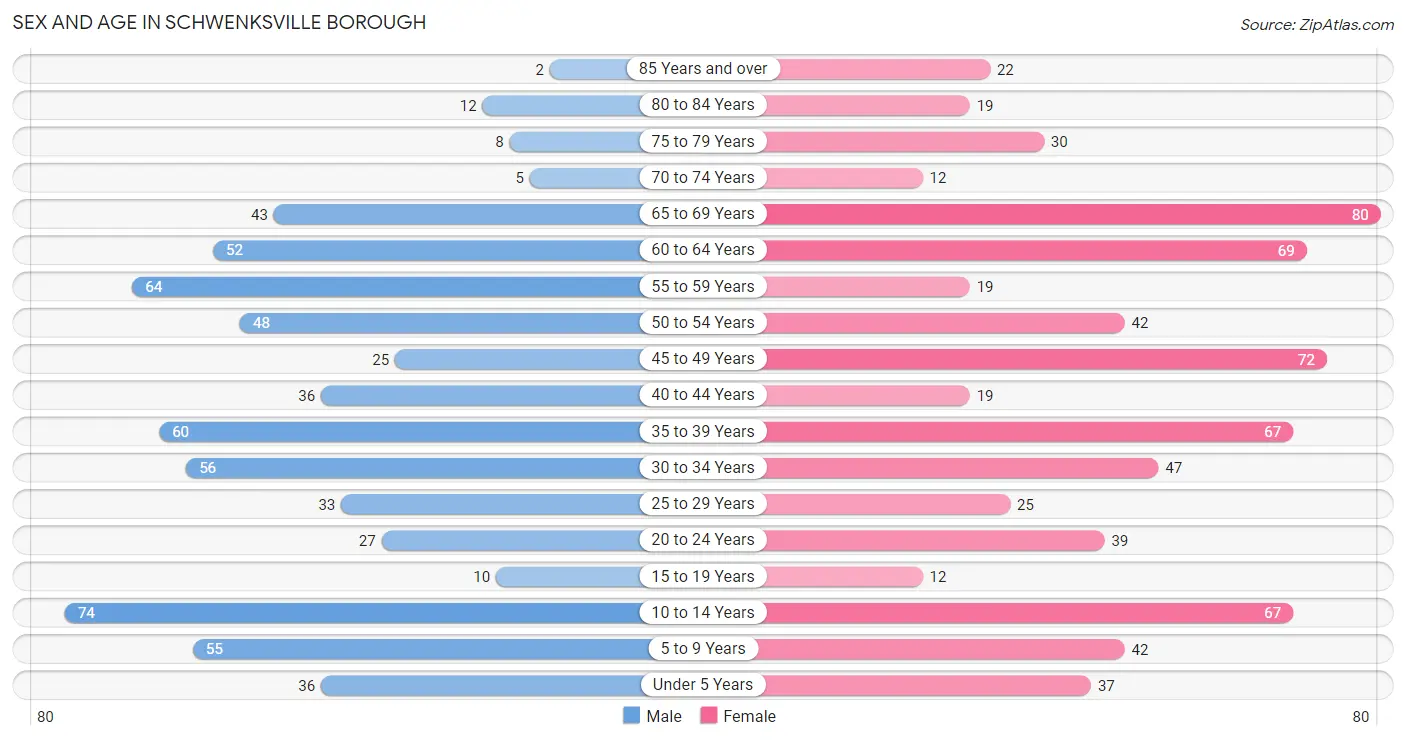
| Age Bracket | Male | Female |
| Under 5 Years | 36 (5.6%) | 37 (5.1%) |
| 5 to 9 Years | 55 (8.5%) | 42 (5.8%) |
| 10 to 14 Years | 74 (11.5%) | 67 (9.3%) |
| 15 to 19 Years | 10 (1.5%) | 12 (1.7%) |
| 20 to 24 Years | 27 (4.2%) | 39 (5.4%) |
| 25 to 29 Years | 33 (5.1%) | 25 (3.5%) |
| 30 to 34 Years | 56 (8.7%) | 47 (6.5%) |
| 35 to 39 Years | 60 (9.3%) | 67 (9.3%) |
| 40 to 44 Years | 36 (5.6%) | 19 (2.6%) |
| 45 to 49 Years | 25 (3.9%) | 72 (10.0%) |
| 50 to 54 Years | 48 (7.4%) | 42 (5.8%) |
| 55 to 59 Years | 64 (9.9%) | 19 (2.6%) |
| 60 to 64 Years | 52 (8.1%) | 69 (9.6%) |
| 65 to 69 Years | 43 (6.7%) | 80 (11.1%) |
| 70 to 74 Years | 5 (0.8%) | 12 (1.7%) |
| 75 to 79 Years | 8 (1.2%) | 30 (4.2%) |
| 80 to 84 Years | 12 (1.9%) | 19 (2.6%) |
| 85 Years and over | 2 (0.3%) | 22 (3.1%) |
| Total | 646 (100.0%) | 720 (100.0%) |
Families and Households in Schwenksville borough
Median Family Size in Schwenksville borough
The median family size in Schwenksville borough is 3.05 persons per family, with married-couple families (183 | 60.8%) accounting for the largest median family size of 3.38 persons per family. On the other hand, single male/father families (18 | 6.0%) represent the smallest median family size with 2.22 persons per family.
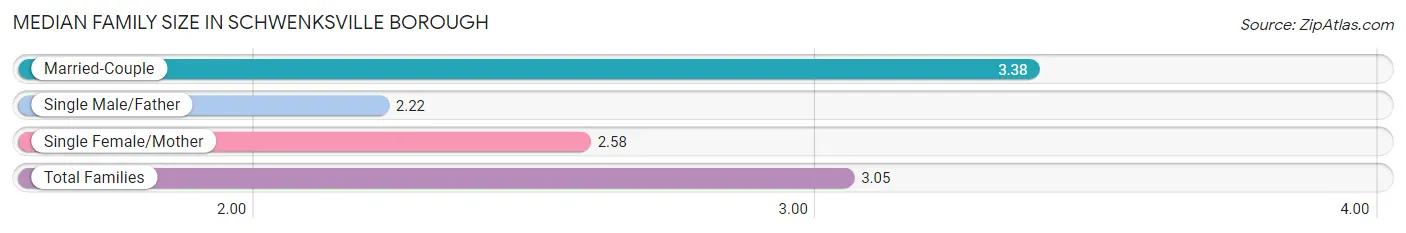
| Family Type | # Families | Family Size |
| Married-Couple | 183 (60.8%) | 3.38 |
| Single Male/Father | 18 (6.0%) | 2.22 |
| Single Female/Mother | 100 (33.2%) | 2.58 |
| Total Families | 301 (100.0%) | 3.05 |
Median Household Size in Schwenksville borough
The median household size in Schwenksville borough is 2.14 persons per household, with married-couple households (183 | 29.5%) accounting for the largest median household size of 3.4 persons per household. non-family households (319 | 51.4%) represent the smallest median household size with 1.15 persons per household.
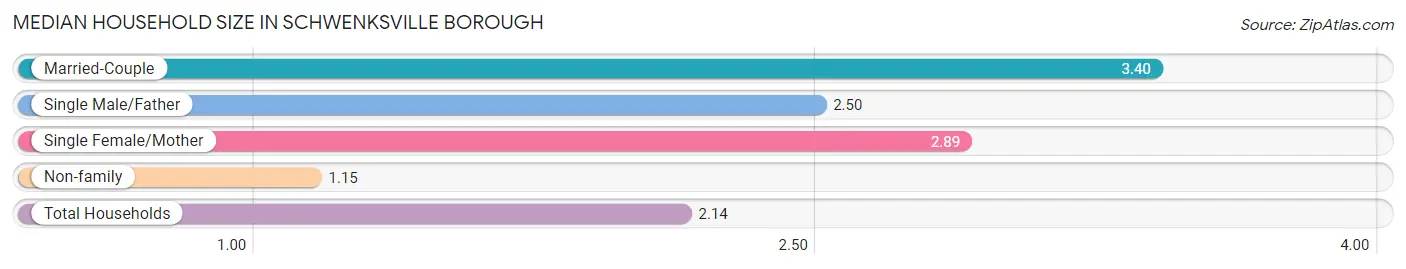
| Household Type | # Households | Household Size |
| Married-Couple | 183 (29.5%) | 3.40 |
| Single Male/Father | 18 (2.9%) | 2.50 |
| Single Female/Mother | 100 (16.1%) | 2.89 |
| Non-family | 319 (51.4%) | 1.15 |
| Total Households | 620 (100.0%) | 2.14 |
Household Size by Marriage Status in Schwenksville borough
Out of a total of 620 households in Schwenksville borough, 301 (48.5%) are family households, while 319 (51.4%) are nonfamily households. The most numerous type of family households are 2-person households, comprising 106, and the most common type of nonfamily households are 1-person households, comprising 269.
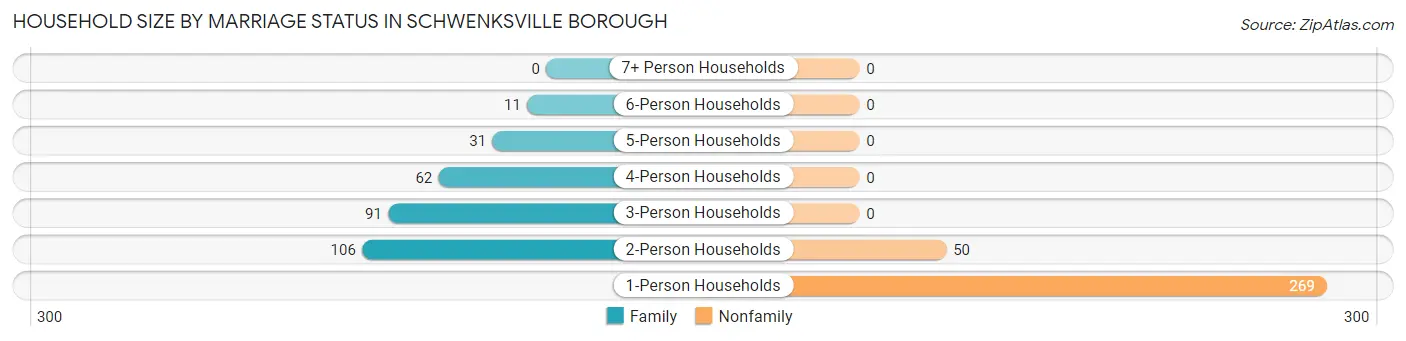
| Household Size | Family Households | Nonfamily Households |
| 1-Person Households | - | 269 (43.4%) |
| 2-Person Households | 106 (17.1%) | 50 (8.1%) |
| 3-Person Households | 91 (14.7%) | 0 (0.0%) |
| 4-Person Households | 62 (10.0%) | 0 (0.0%) |
| 5-Person Households | 31 (5.0%) | 0 (0.0%) |
| 6-Person Households | 11 (1.8%) | 0 (0.0%) |
| 7+ Person Households | 0 (0.0%) | 0 (0.0%) |
| Total | 301 (48.5%) | 319 (51.4%) |
Female Fertility in Schwenksville borough
Fertility by Age in Schwenksville borough
Average fertility rate in Schwenksville borough is 31.0 births per 1,000 women. Women in the age bracket of 20 to 34 years have the highest fertility rate with 45.0 births per 1,000 women. Women in the age bracket of 20 to 34 years acount for 55.6% of all women with births.
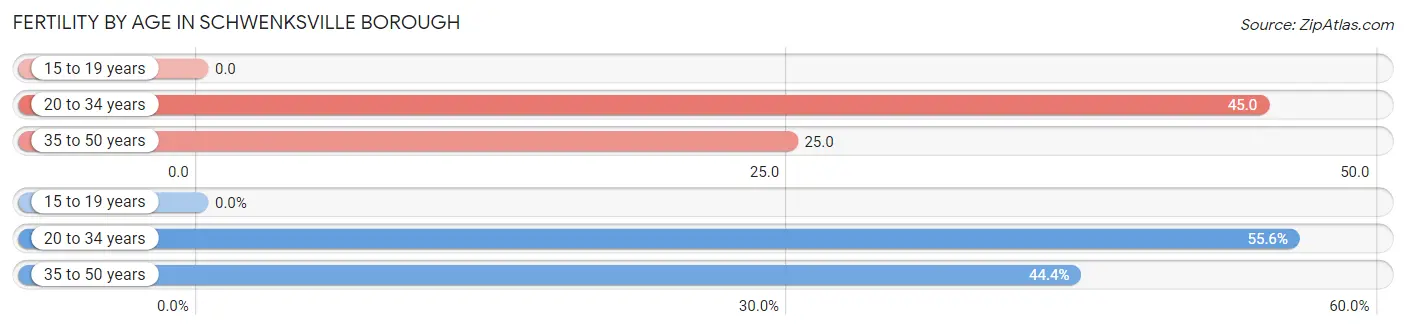
| Age Bracket | Women with Births | Births / 1,000 Women |
| 15 to 19 years | 0 (0.0%) | 0.0 |
| 20 to 34 years | 5 (55.6%) | 45.0 |
| 35 to 50 years | 4 (44.4%) | 25.0 |
| Total | 9 (100.0%) | 31.0 |
Fertility by Age by Marriage Status in Schwenksville borough
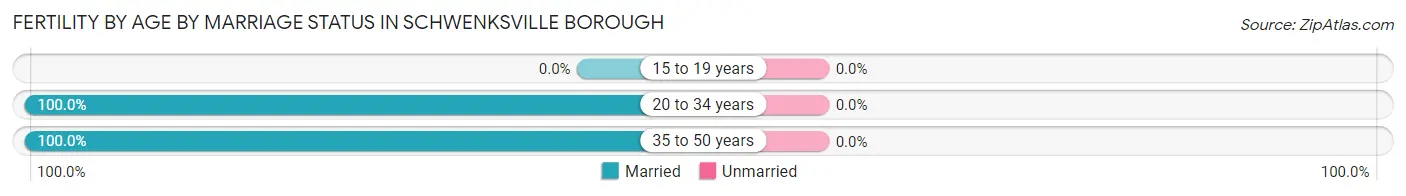
| Age Bracket | Married | Unmarried |
| 15 to 19 years | 0 (0.0%) | 0 (0.0%) |
| 20 to 34 years | 5 (100.0%) | 0 (0.0%) |
| 35 to 50 years | 4 (100.0%) | 0 (0.0%) |
| Total | 9 (100.0%) | 0 (0.0%) |
Fertility by Education in Schwenksville borough
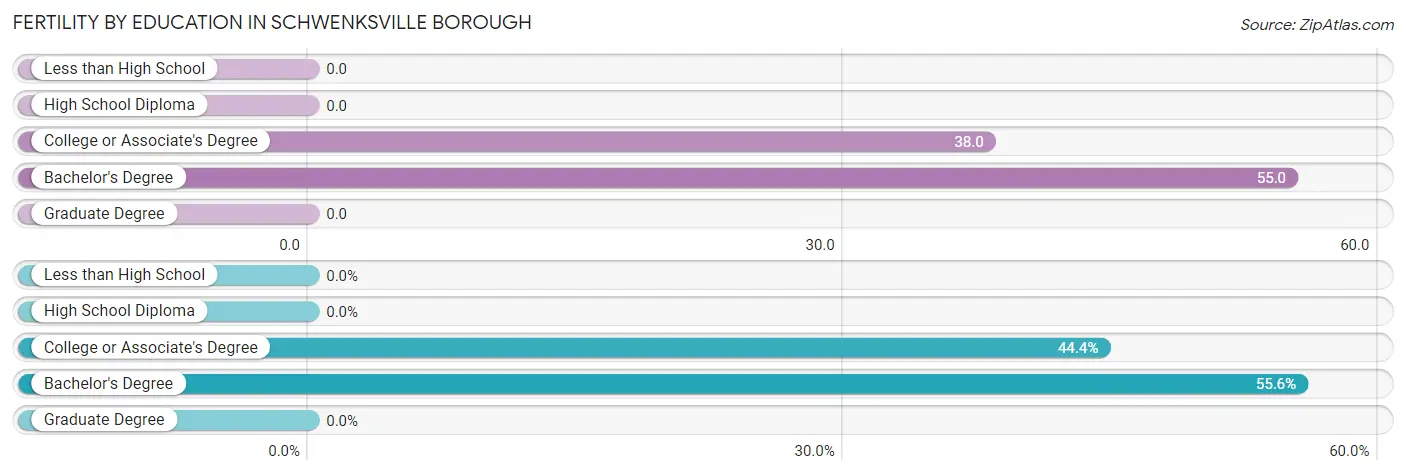
| Educational Attainment | Women with Births | Births / 1,000 Women |
| Less than High School | 0 (0.0%) | 0.0 |
| High School Diploma | 0 (0.0%) | 0.0 |
| College or Associate's Degree | 4 (44.4%) | 38.0 |
| Bachelor's Degree | 5 (55.6%) | 55.0 |
| Graduate Degree | 0 (0.0%) | 0.0 |
| Total | 9 (100.0%) | 31.0 |
Fertility by Education by Marriage Status in Schwenksville borough
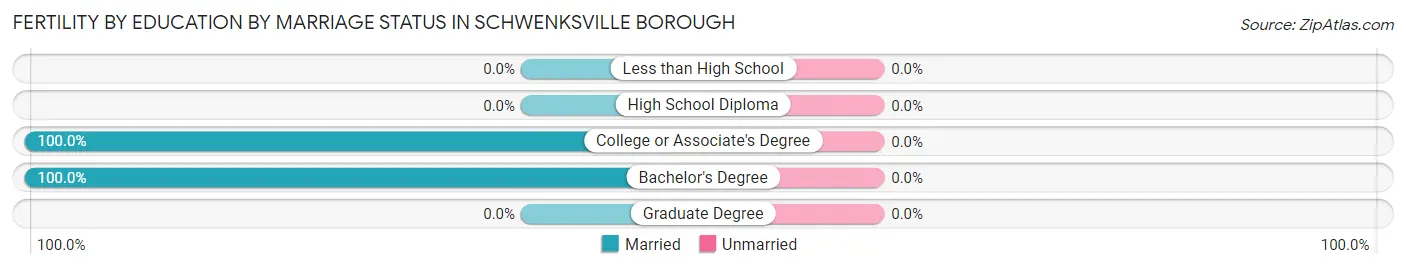
| Educational Attainment | Married | Unmarried |
| Less than High School | 0 (0.0%) | 0 (0.0%) |
| High School Diploma | 0 (0.0%) | 0 (0.0%) |
| College or Associate's Degree | 4 (100.0%) | 0 (0.0%) |
| Bachelor's Degree | 5 (100.0%) | 0 (0.0%) |
| Graduate Degree | 0 (0.0%) | 0 (0.0%) |
| Total | 9 (100.0%) | 0 (0.0%) |
Employment Characteristics in Schwenksville borough
Employment by Class of Employer in Schwenksville borough
Among the 731 employed individuals in Schwenksville borough, private company employees (536 | 73.3%), not-for-profit organizations (86 | 11.8%), and self-employed (not incorporated) (42 | 5.8%) make up the most common classes of employment.
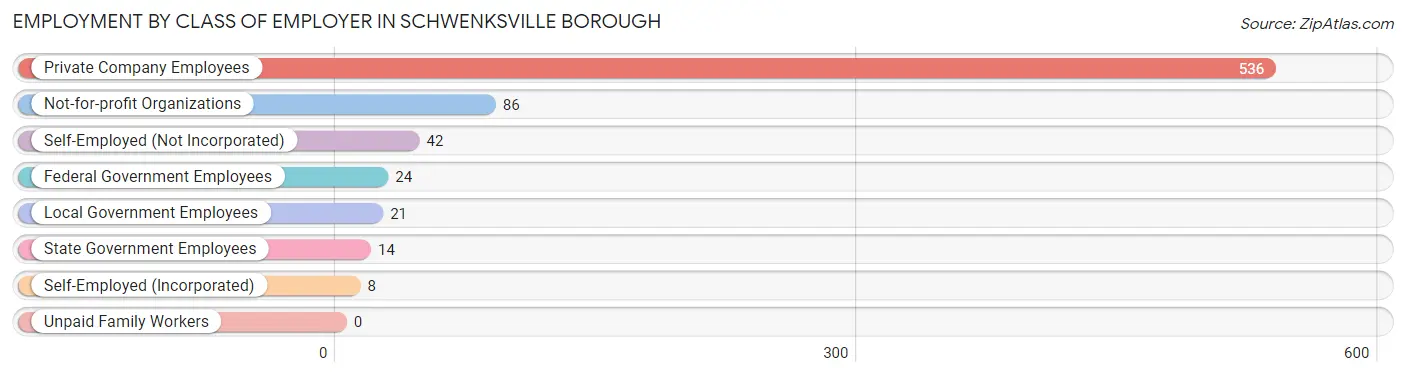
| Employer Class | # Employees | % Employees |
| Private Company Employees | 536 | 73.3% |
| Self-Employed (Incorporated) | 8 | 1.1% |
| Self-Employed (Not Incorporated) | 42 | 5.8% |
| Not-for-profit Organizations | 86 | 11.8% |
| Local Government Employees | 21 | 2.9% |
| State Government Employees | 14 | 1.9% |
| Federal Government Employees | 24 | 3.3% |
| Unpaid Family Workers | 0 | 0.0% |
| Total | 731 | 100.0% |
Employment Status by Age in Schwenksville borough
According to the labor force statistics for Schwenksville borough, out of the total population over 16 years of age (1,049), 73.3% or 769 individuals are in the labor force, with 4.1% or 32 of them unemployed. The age group with the highest labor force participation rate is 20 to 24 years, with 100.0% or 66 individuals in the labor force. Within the labor force, the 65 to 74 years age range has the highest percentage of unemployed individuals, with 11.5% or 7 of them being unemployed.
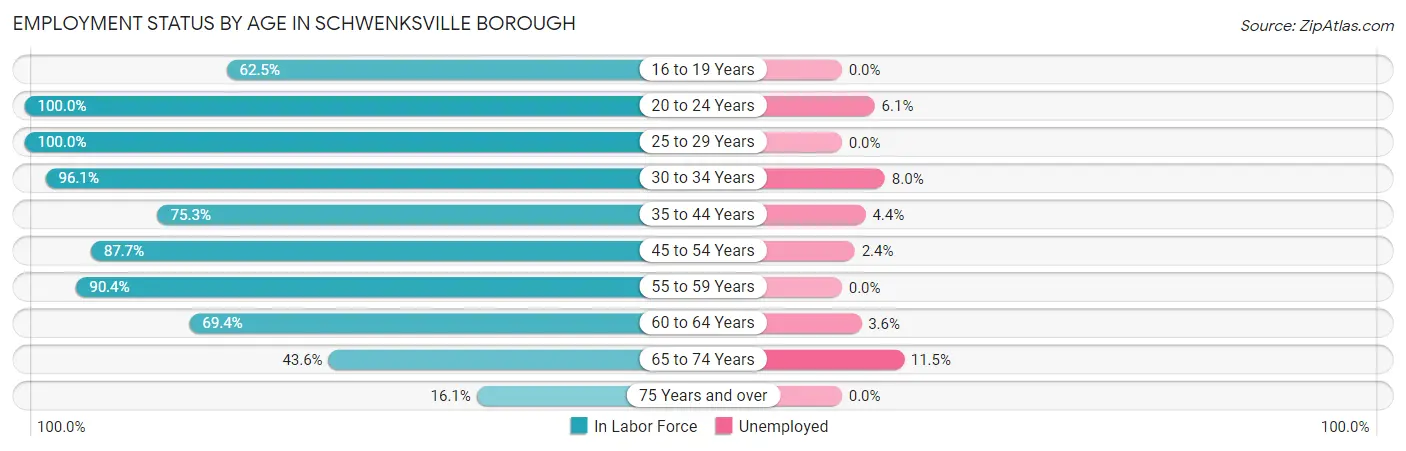
| Age Bracket | In Labor Force | Unemployed |
| 16 to 19 Years | 10 (62.5%) | 0 (0.0%) |
| 20 to 24 Years | 66 (100.0%) | 4 (6.1%) |
| 25 to 29 Years | 58 (100.0%) | 0 (0.0%) |
| 30 to 34 Years | 99 (96.1%) | 8 (8.0%) |
| 35 to 44 Years | 137 (75.3%) | 6 (4.4%) |
| 45 to 54 Years | 164 (87.7%) | 4 (2.4%) |
| 55 to 59 Years | 75 (90.4%) | 0 (0.0%) |
| 60 to 64 Years | 84 (69.4%) | 3 (3.6%) |
| 65 to 74 Years | 61 (43.6%) | 7 (11.5%) |
| 75 Years and over | 15 (16.1%) | 0 (0.0%) |
| Total | 769 (73.3%) | 32 (4.1%) |
Employment Status by Educational Attainment in Schwenksville borough
According to labor force statistics for Schwenksville borough, 84.1% of individuals (617) out of the total population between 25 and 64 years of age (734) are in the labor force, with 3.3% or 20 of them being unemployed. The group with the highest labor force participation rate are those with the educational attainment of less than high school, with 100.0% or 18 individuals in the labor force. Within the labor force, individuals with less than high school education have the highest percentage of unemployment, with 33.3% or 6 of them being unemployed.
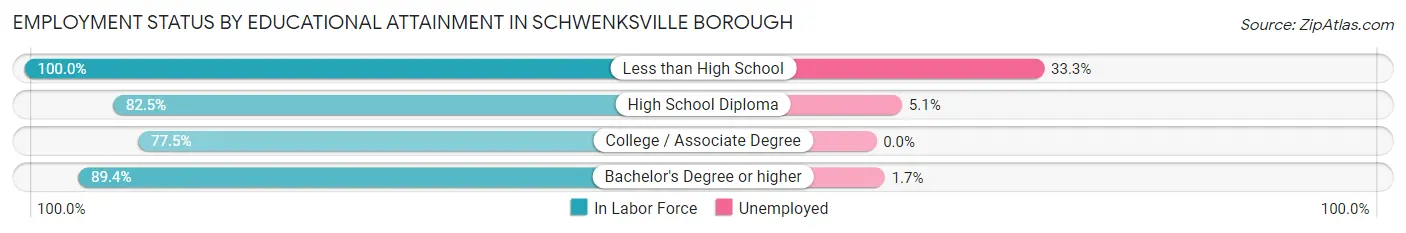
| Educational Attainment | In Labor Force | Unemployed |
| Less than High School | 18 (100.0%) | 6 (33.3%) |
| High School Diploma | 207 (82.5%) | 13 (5.1%) |
| College / Associate Degree | 155 (77.5%) | 0 (0.0%) |
| Bachelor's Degree or higher | 237 (89.4%) | 5 (1.7%) |
| Total | 617 (84.1%) | 24 (3.3%) |
Employment Occupations by Sex in Schwenksville borough
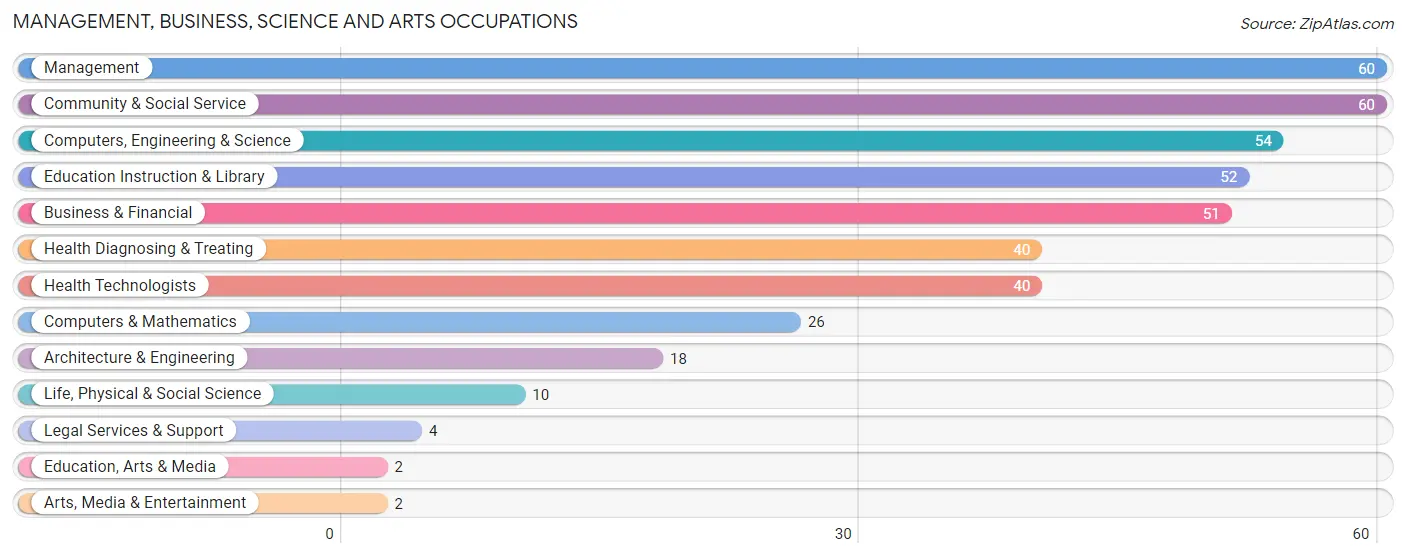
Management, Business, Science and Arts Occupations
The most common Management, Business, Science and Arts occupations in Schwenksville borough are Management (60 | 8.3%), Community & Social Service (60 | 8.3%), Computers, Engineering & Science (54 | 7.4%), Education Instruction & Library (52 | 7.1%), and Business & Financial (51 | 7.0%).
Management, Business, Science and Arts Occupations by Sex
Within the Management, Business, Science and Arts occupations in Schwenksville borough, the most male-oriented occupations are Legal Services & Support (100.0%), Architecture & Engineering (66.7%), and Life, Physical & Social Science (60.0%), while the most female-oriented occupations are Education, Arts & Media (100.0%), Arts, Media & Entertainment (100.0%), and Health Diagnosing & Treating (92.5%).
| Occupation | Male | Female |
| Management | 20 (33.3%) | 40 (66.7%) |
| Business & Financial | 27 (52.9%) | 24 (47.1%) |
| Computers, Engineering & Science | 27 (50.0%) | 27 (50.0%) |
| Computers & Mathematics | 9 (34.6%) | 17 (65.4%) |
| Architecture & Engineering | 12 (66.7%) | 6 (33.3%) |
| Life, Physical & Social Science | 6 (60.0%) | 4 (40.0%) |
| Community & Social Service | 10 (16.7%) | 50 (83.3%) |
| Education, Arts & Media | 0 (0.0%) | 2 (100.0%) |
| Legal Services & Support | 4 (100.0%) | 0 (0.0%) |
| Education Instruction & Library | 6 (11.5%) | 46 (88.5%) |
| Arts, Media & Entertainment | 0 (0.0%) | 2 (100.0%) |
| Health Diagnosing & Treating | 3 (7.5%) | 37 (92.5%) |
| Health Technologists | 3 (7.5%) | 37 (92.5%) |
| Total (Category) | 87 (32.8%) | 178 (67.2%) |
| Total (Overall) | 359 (49.4%) | 368 (50.6%) |
Services Occupations
The most common Services occupations in Schwenksville borough are Healthcare Support (53 | 7.3%), Food Preparation & Serving (34 | 4.7%), Cleaning & Maintenance (30 | 4.1%), Personal Care & Service (21 | 2.9%), and Security & Protection (4 | 0.5%).
Services Occupations by Sex
Within the Services occupations in Schwenksville borough, the most male-oriented occupations are Security & Protection (100.0%), Law Enforcement (100.0%), and Cleaning & Maintenance (90.0%), while the most female-oriented occupations are Personal Care & Service (100.0%), Food Preparation & Serving (41.2%), and Healthcare Support (34.0%).
| Occupation | Male | Female |
| Healthcare Support | 35 (66.0%) | 18 (34.0%) |
| Security & Protection | 4 (100.0%) | 0 (0.0%) |
| Firefighting & Prevention | 0 (0.0%) | 0 (0.0%) |
| Law Enforcement | 4 (100.0%) | 0 (0.0%) |
| Food Preparation & Serving | 20 (58.8%) | 14 (41.2%) |
| Cleaning & Maintenance | 27 (90.0%) | 3 (10.0%) |
| Personal Care & Service | 0 (0.0%) | 21 (100.0%) |
| Total (Category) | 86 (60.6%) | 56 (39.4%) |
| Total (Overall) | 359 (49.4%) | 368 (50.6%) |
Sales and Office Occupations
The most common Sales and Office occupations in Schwenksville borough are Office & Administration (119 | 16.4%), and Sales & Related (51 | 7.0%).
Sales and Office Occupations by Sex
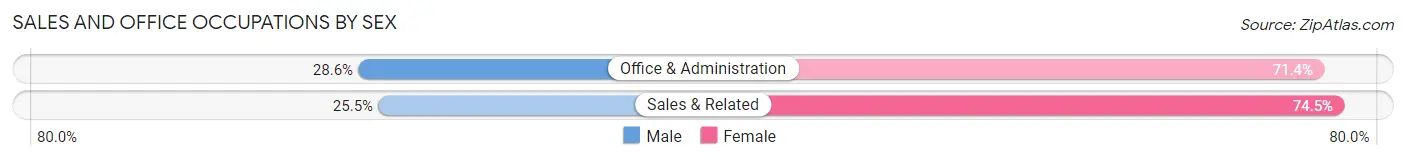
| Occupation | Male | Female |
| Sales & Related | 13 (25.5%) | 38 (74.5%) |
| Office & Administration | 34 (28.6%) | 85 (71.4%) |
| Total (Category) | 47 (27.7%) | 123 (72.4%) |
| Total (Overall) | 359 (49.4%) | 368 (50.6%) |
Natural Resources, Construction and Maintenance Occupations
The most common Natural Resources, Construction and Maintenance occupations in Schwenksville borough are Installation, Maintenance & Repair (31 | 4.3%), and Construction & Extraction (29 | 4.0%).
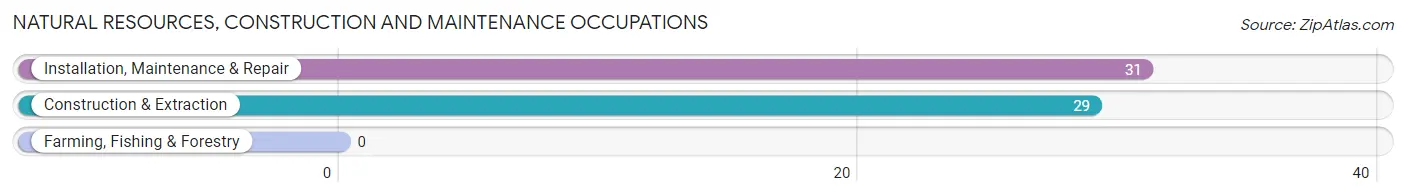
Natural Resources, Construction and Maintenance Occupations by Sex
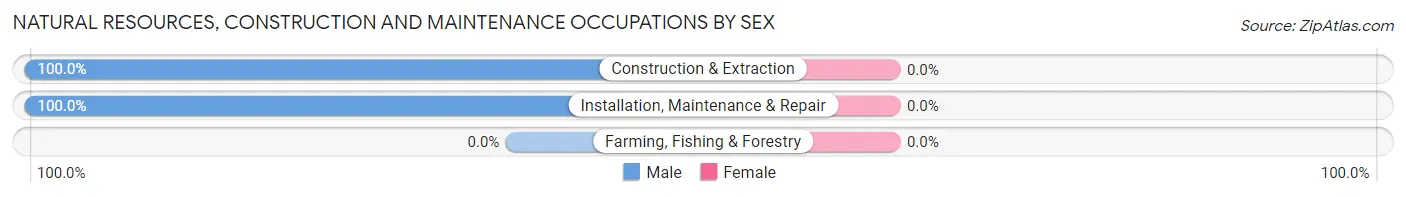
| Occupation | Male | Female |
| Farming, Fishing & Forestry | 0 (0.0%) | 0 (0.0%) |
| Construction & Extraction | 29 (100.0%) | 0 (0.0%) |
| Installation, Maintenance & Repair | 31 (100.0%) | 0 (0.0%) |
| Total (Category) | 60 (100.0%) | 0 (0.0%) |
| Total (Overall) | 359 (49.4%) | 368 (50.6%) |
Production, Transportation and Moving Occupations
The most common Production, Transportation and Moving occupations in Schwenksville borough are Material Moving (32 | 4.4%), Production (31 | 4.3%), and Transportation (27 | 3.7%).
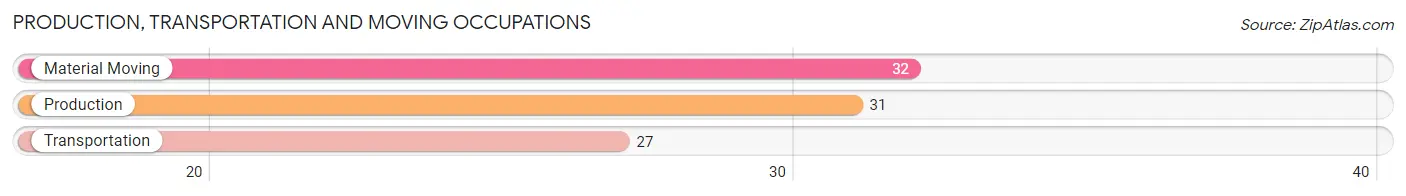
Production, Transportation and Moving Occupations by Sex
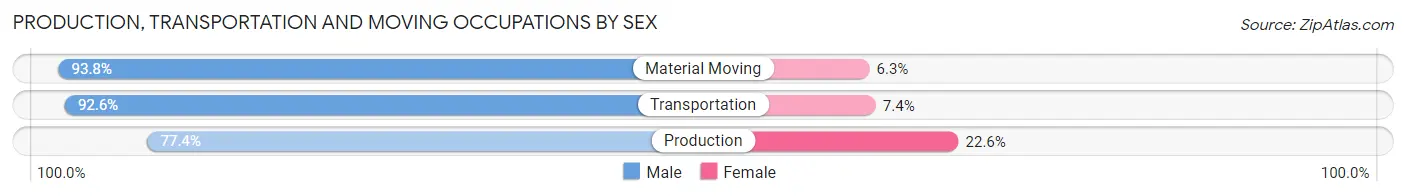
| Occupation | Male | Female |
| Production | 24 (77.4%) | 7 (22.6%) |
| Transportation | 25 (92.6%) | 2 (7.4%) |
| Material Moving | 30 (93.8%) | 2 (6.2%) |
| Total (Category) | 79 (87.8%) | 11 (12.2%) |
| Total (Overall) | 359 (49.4%) | 368 (50.6%) |
Employment Industries by Sex in Schwenksville borough
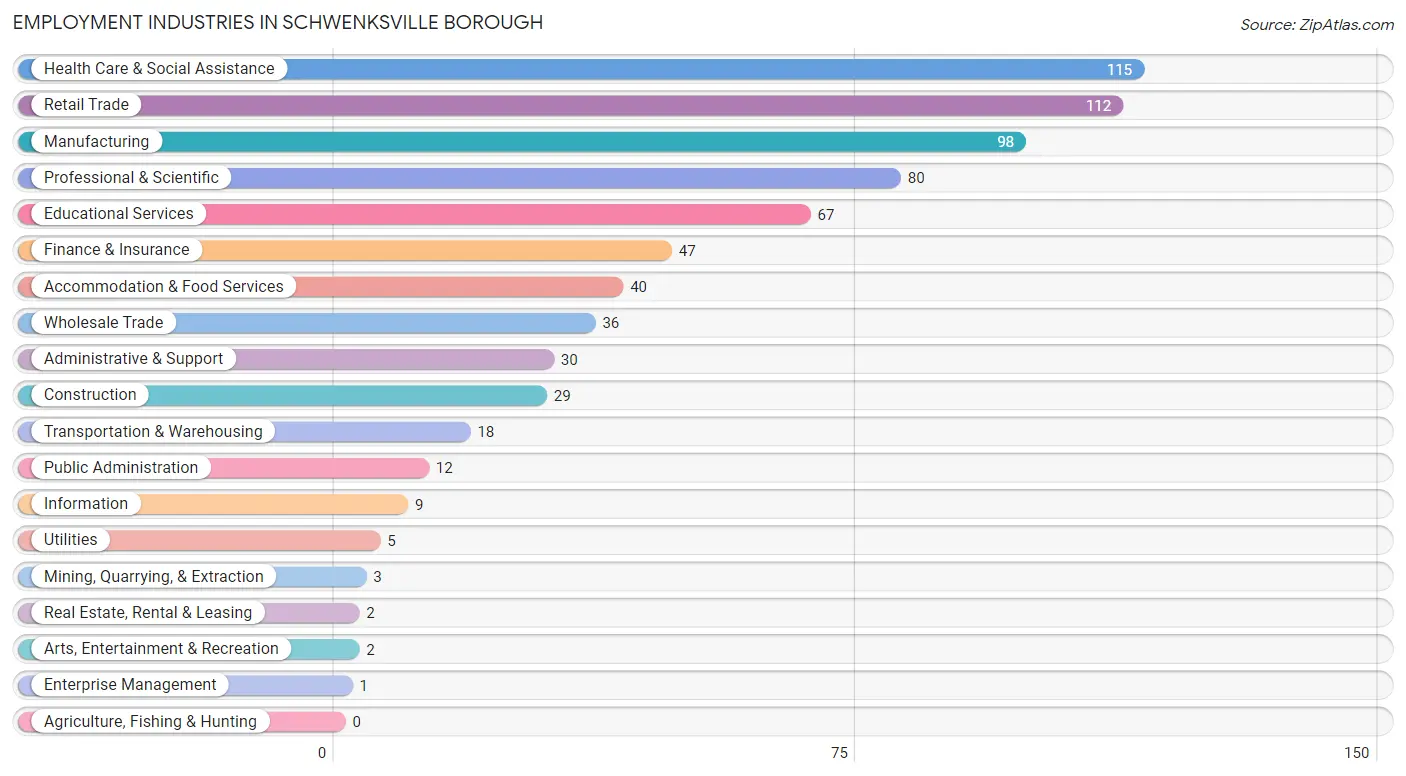
Employment Industries in Schwenksville borough
The major employment industries in Schwenksville borough include Health Care & Social Assistance (115 | 15.8%), Retail Trade (112 | 15.4%), Manufacturing (98 | 13.5%), Professional & Scientific (80 | 11.0%), and Educational Services (67 | 9.2%).
Employment Industries by Sex in Schwenksville borough
The Schwenksville borough industries that see more men than women are Mining, Quarrying, & Extraction (100.0%), Utilities (100.0%), and Information (100.0%), whereas the industries that tend to have a higher number of women are Enterprise Management (100.0%), Educational Services (79.1%), and Professional & Scientific (66.2%).
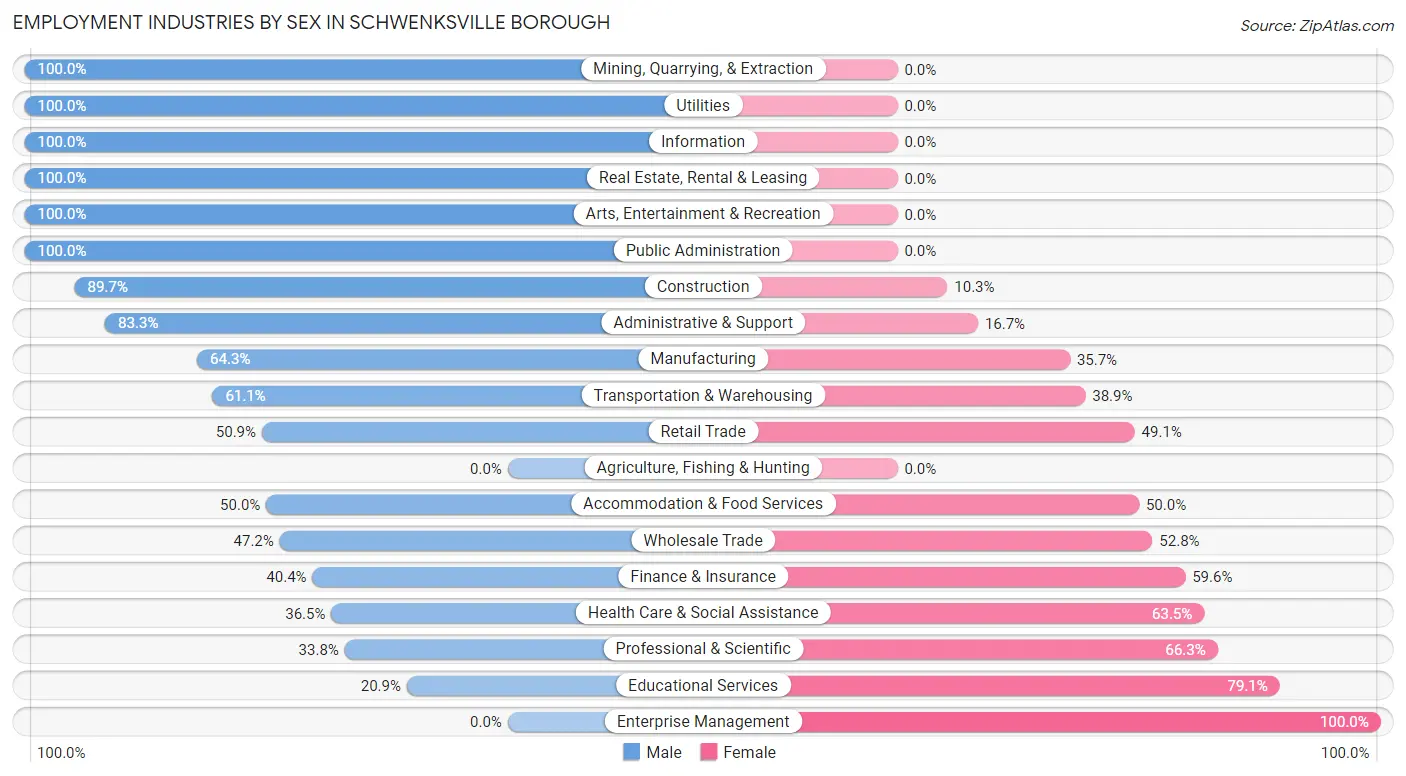
| Industry | Male | Female |
| Agriculture, Fishing & Hunting | 0 (0.0%) | 0 (0.0%) |
| Mining, Quarrying, & Extraction | 3 (100.0%) | 0 (0.0%) |
| Construction | 26 (89.7%) | 3 (10.3%) |
| Manufacturing | 63 (64.3%) | 35 (35.7%) |
| Wholesale Trade | 17 (47.2%) | 19 (52.8%) |
| Retail Trade | 57 (50.9%) | 55 (49.1%) |
| Transportation & Warehousing | 11 (61.1%) | 7 (38.9%) |
| Utilities | 5 (100.0%) | 0 (0.0%) |
| Information | 9 (100.0%) | 0 (0.0%) |
| Finance & Insurance | 19 (40.4%) | 28 (59.6%) |
| Real Estate, Rental & Leasing | 2 (100.0%) | 0 (0.0%) |
| Professional & Scientific | 27 (33.8%) | 53 (66.2%) |
| Enterprise Management | 0 (0.0%) | 1 (100.0%) |
| Administrative & Support | 25 (83.3%) | 5 (16.7%) |
| Educational Services | 14 (20.9%) | 53 (79.1%) |
| Health Care & Social Assistance | 42 (36.5%) | 73 (63.5%) |
| Arts, Entertainment & Recreation | 2 (100.0%) | 0 (0.0%) |
| Accommodation & Food Services | 20 (50.0%) | 20 (50.0%) |
| Public Administration | 12 (100.0%) | 0 (0.0%) |
| Total | 359 (49.4%) | 368 (50.6%) |
Education in Schwenksville borough
School Enrollment in Schwenksville borough
The most common levels of schooling among the 336 students in Schwenksville borough are middle school (100 | 29.8%), elementary school (92 | 27.4%), and college / undergraduate (64 | 19.1%).
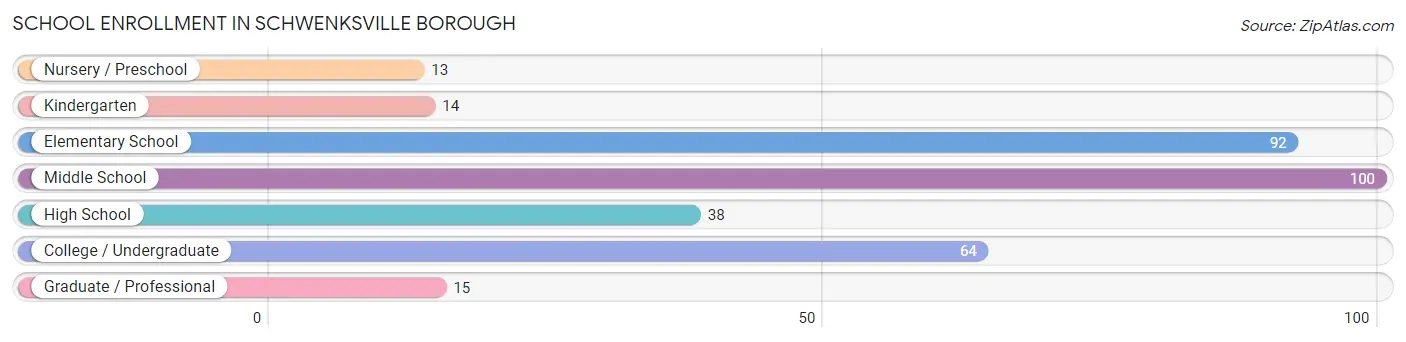
| School Level | # Students | % Students |
| Nursery / Preschool | 13 | 3.9% |
| Kindergarten | 14 | 4.2% |
| Elementary School | 92 | 27.4% |
| Middle School | 100 | 29.8% |
| High School | 38 | 11.3% |
| College / Undergraduate | 64 | 19.1% |
| Graduate / Professional | 15 | 4.5% |
| Total | 336 | 100.0% |
School Enrollment by Age by Funding Source in Schwenksville borough
Out of a total of 336 students who are enrolled in schools in Schwenksville borough, 40 (11.9%) attend a private institution, while the remaining 296 (88.1%) are enrolled in public schools. The age group of 25 to 34 year olds has the highest likelihood of being enrolled in private schools, with 6 (100.0% in the age bracket) enrolled. Conversely, the age group of 3 to 4 year olds has the lowest likelihood of being enrolled in a private school, with 13 (100.0% in the age bracket) attending a public institution.
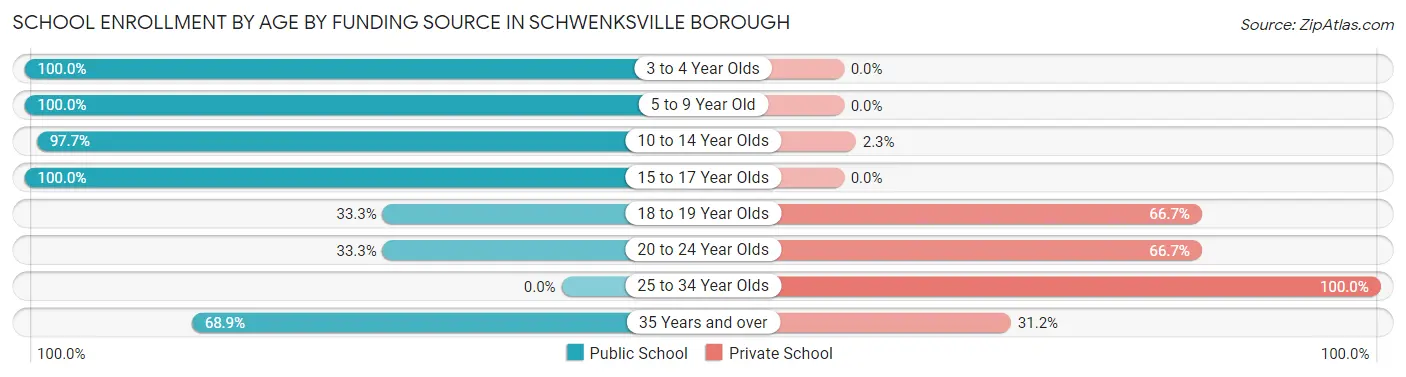
| Age Bracket | Public School | Private School |
| 3 to 4 Year Olds | 13 (100.0%) | 0 (0.0%) |
| 5 to 9 Year Old | 92 (100.0%) | 0 (0.0%) |
| 10 to 14 Year Olds | 130 (97.7%) | 3 (2.3%) |
| 15 to 17 Year Olds | 13 (100.0%) | 0 (0.0%) |
| 18 to 19 Year Olds | 3 (33.3%) | 6 (66.7%) |
| 20 to 24 Year Olds | 3 (33.3%) | 6 (66.7%) |
| 25 to 34 Year Olds | 0 (0.0%) | 6 (100.0%) |
| 35 Years and over | 42 (68.9%) | 19 (31.1%) |
| Total | 296 (88.1%) | 40 (11.9%) |
Educational Attainment by Field of Study in Schwenksville borough
Education (67 | 18.9%), business (56 | 15.8%), communications (51 | 14.4%), science & technology (49 | 13.8%), and bio, nature & agricultural (36 | 10.1%) are the most common fields of study among 355 individuals in Schwenksville borough who have obtained a bachelor's degree or higher.
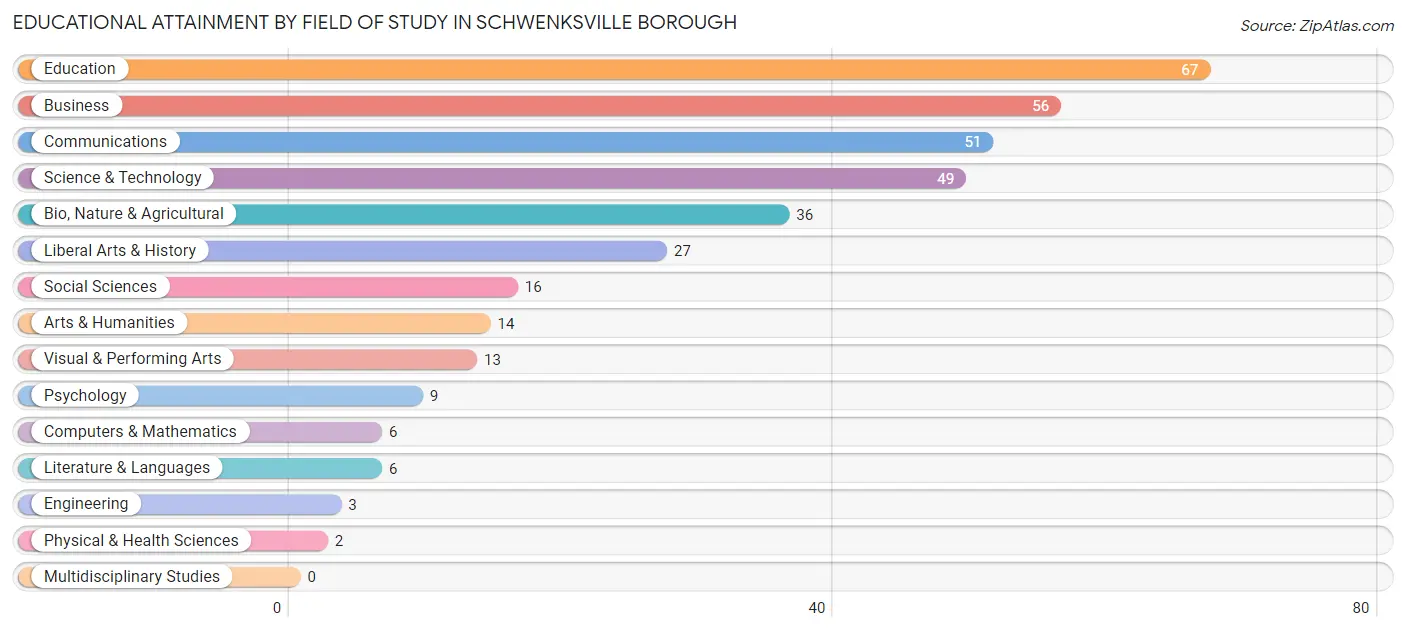
| Field of Study | # Graduates | % Graduates |
| Computers & Mathematics | 6 | 1.7% |
| Bio, Nature & Agricultural | 36 | 10.1% |
| Physical & Health Sciences | 2 | 0.6% |
| Psychology | 9 | 2.5% |
| Social Sciences | 16 | 4.5% |
| Engineering | 3 | 0.9% |
| Multidisciplinary Studies | 0 | 0.0% |
| Science & Technology | 49 | 13.8% |
| Business | 56 | 15.8% |
| Education | 67 | 18.9% |
| Literature & Languages | 6 | 1.7% |
| Liberal Arts & History | 27 | 7.6% |
| Visual & Performing Arts | 13 | 3.7% |
| Communications | 51 | 14.4% |
| Arts & Humanities | 14 | 3.9% |
| Total | 355 | 100.0% |
Transportation & Commute in Schwenksville borough
Vehicle Availability by Sex in Schwenksville borough
The most prevalent vehicle ownership categories in Schwenksville borough are males with 2 vehicles (160, accounting for 43.6%) and females with 2 vehicles (173, making up 44.0%).
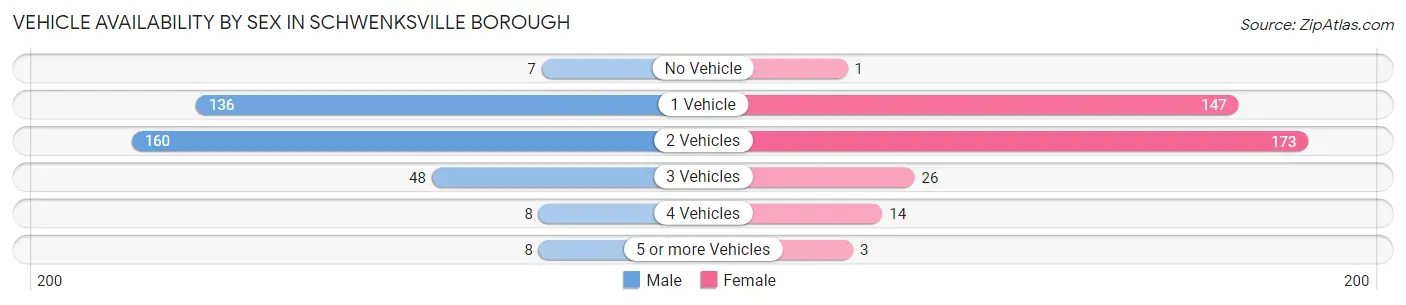
| Vehicles Available | Male | Female |
| No Vehicle | 7 (1.9%) | 1 (0.3%) |
| 1 Vehicle | 136 (37.1%) | 147 (40.4%) |
| 2 Vehicles | 160 (43.6%) | 173 (47.5%) |
| 3 Vehicles | 48 (13.1%) | 26 (7.1%) |
| 4 Vehicles | 8 (2.2%) | 14 (3.8%) |
| 5 or more Vehicles | 8 (2.2%) | 3 (0.8%) |
| Total | 367 (100.0%) | 364 (100.0%) |
Commute Time in Schwenksville borough
The most frequently occuring commute durations in Schwenksville borough are 30 to 34 minutes (112 commuters, 17.9%), 15 to 19 minutes (85 commuters, 13.6%), and 25 to 29 minutes (81 commuters, 13.0%).
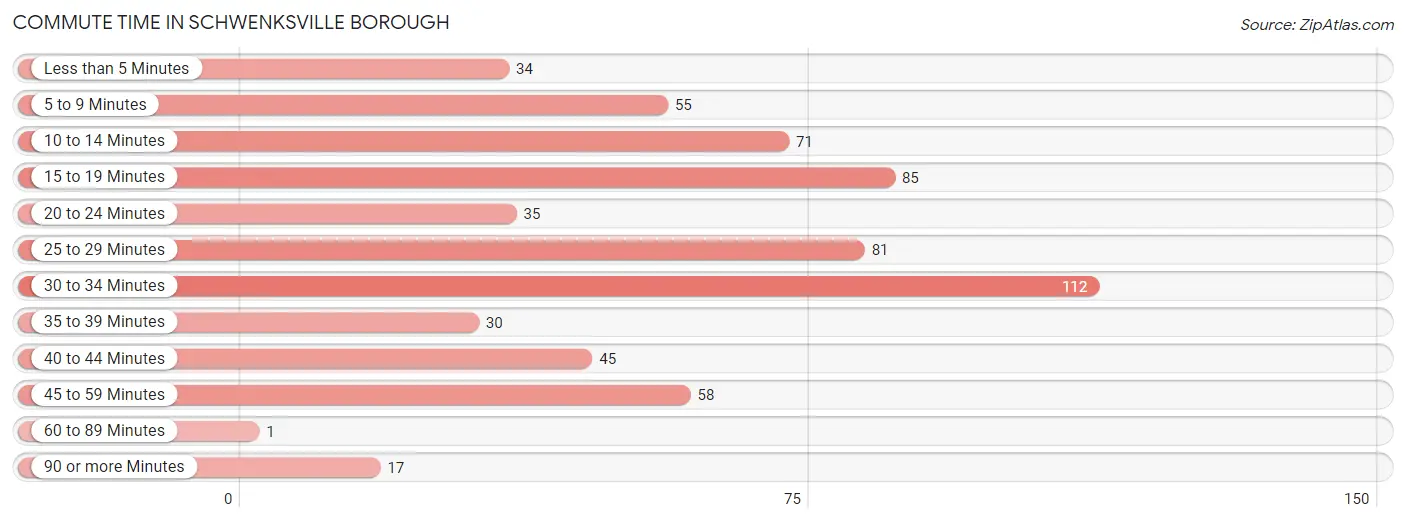
| Commute Time | # Commuters | % Commuters |
| Less than 5 Minutes | 34 | 5.4% |
| 5 to 9 Minutes | 55 | 8.8% |
| 10 to 14 Minutes | 71 | 11.4% |
| 15 to 19 Minutes | 85 | 13.6% |
| 20 to 24 Minutes | 35 | 5.6% |
| 25 to 29 Minutes | 81 | 13.0% |
| 30 to 34 Minutes | 112 | 17.9% |
| 35 to 39 Minutes | 30 | 4.8% |
| 40 to 44 Minutes | 45 | 7.2% |
| 45 to 59 Minutes | 58 | 9.3% |
| 60 to 89 Minutes | 1 | 0.2% |
| 90 or more Minutes | 17 | 2.7% |
Commute Time by Sex in Schwenksville borough
The most common commute times in Schwenksville borough are 30 to 34 minutes (60 commuters, 18.7%) for males and 30 to 34 minutes (52 commuters, 17.2%) for females.
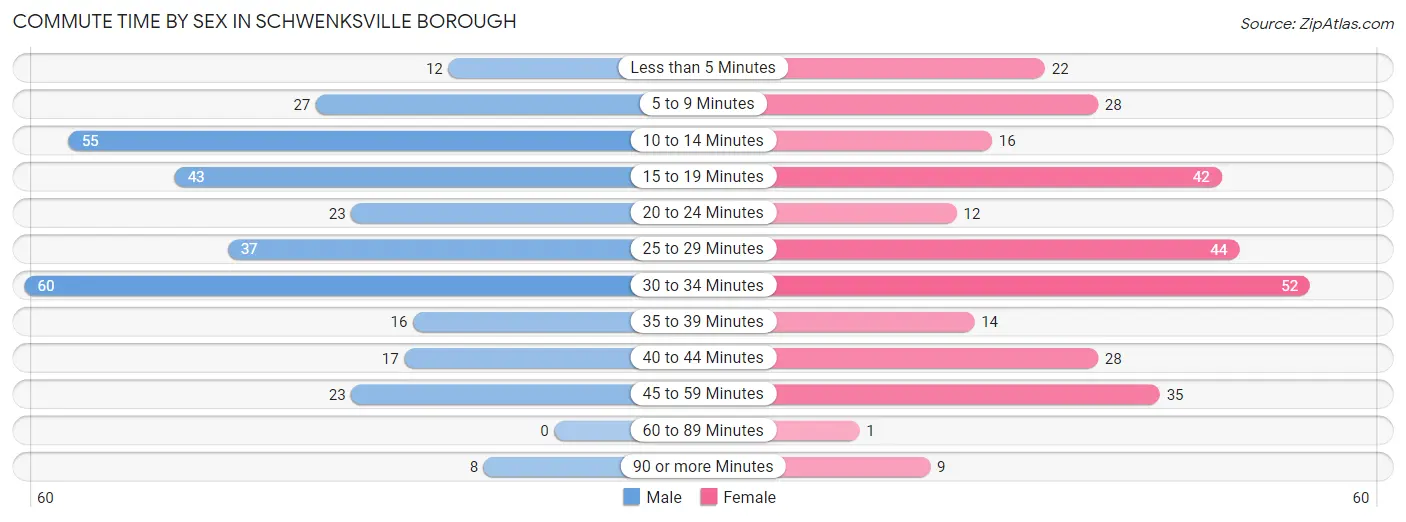
| Commute Time | Male | Female |
| Less than 5 Minutes | 12 (3.7%) | 22 (7.3%) |
| 5 to 9 Minutes | 27 (8.4%) | 28 (9.2%) |
| 10 to 14 Minutes | 55 (17.1%) | 16 (5.3%) |
| 15 to 19 Minutes | 43 (13.4%) | 42 (13.9%) |
| 20 to 24 Minutes | 23 (7.2%) | 12 (4.0%) |
| 25 to 29 Minutes | 37 (11.5%) | 44 (14.5%) |
| 30 to 34 Minutes | 60 (18.7%) | 52 (17.2%) |
| 35 to 39 Minutes | 16 (5.0%) | 14 (4.6%) |
| 40 to 44 Minutes | 17 (5.3%) | 28 (9.2%) |
| 45 to 59 Minutes | 23 (7.2%) | 35 (11.6%) |
| 60 to 89 Minutes | 0 (0.0%) | 1 (0.3%) |
| 90 or more Minutes | 8 (2.5%) | 9 (3.0%) |
Time of Departure to Work by Sex in Schwenksville borough
The most frequent times of departure to work in Schwenksville borough are 12:00 PM to 3:59 PM (75, 23.4%) for males and 8:00 AM to 8:29 AM (60, 19.8%) for females.
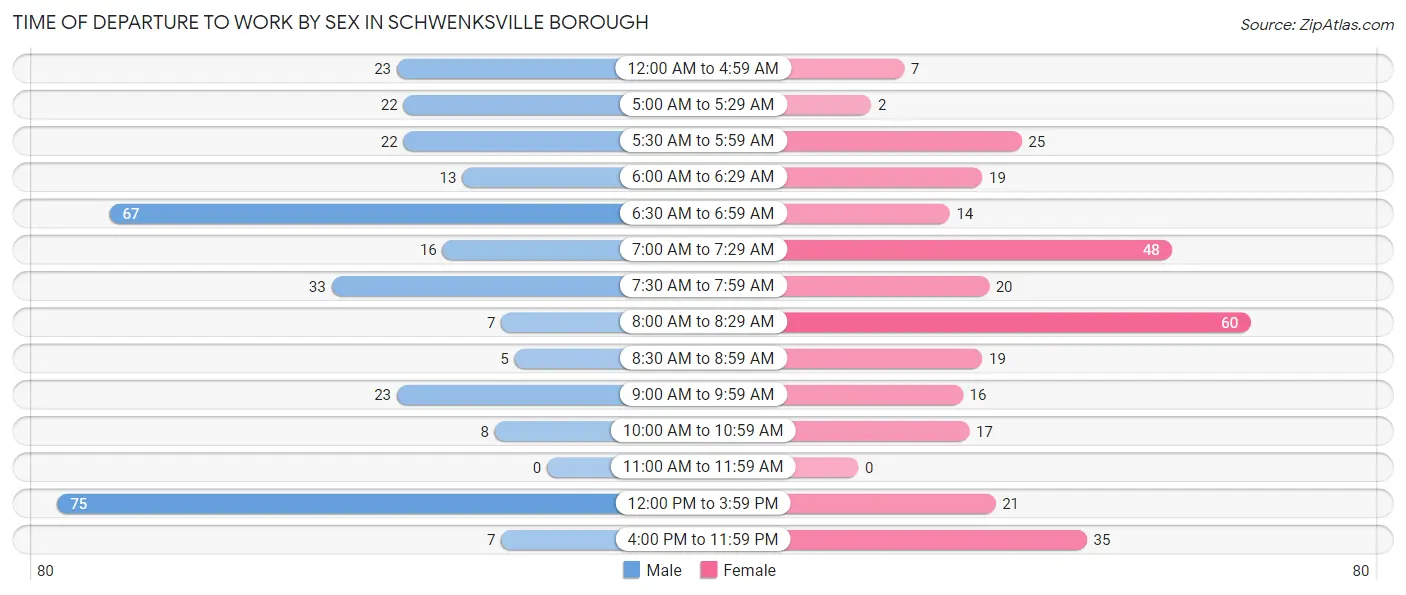
| Time of Departure | Male | Female |
| 12:00 AM to 4:59 AM | 23 (7.2%) | 7 (2.3%) |
| 5:00 AM to 5:29 AM | 22 (6.9%) | 2 (0.7%) |
| 5:30 AM to 5:59 AM | 22 (6.9%) | 25 (8.3%) |
| 6:00 AM to 6:29 AM | 13 (4.1%) | 19 (6.3%) |
| 6:30 AM to 6:59 AM | 67 (20.9%) | 14 (4.6%) |
| 7:00 AM to 7:29 AM | 16 (5.0%) | 48 (15.8%) |
| 7:30 AM to 7:59 AM | 33 (10.3%) | 20 (6.6%) |
| 8:00 AM to 8:29 AM | 7 (2.2%) | 60 (19.8%) |
| 8:30 AM to 8:59 AM | 5 (1.6%) | 19 (6.3%) |
| 9:00 AM to 9:59 AM | 23 (7.2%) | 16 (5.3%) |
| 10:00 AM to 10:59 AM | 8 (2.5%) | 17 (5.6%) |
| 11:00 AM to 11:59 AM | 0 (0.0%) | 0 (0.0%) |
| 12:00 PM to 3:59 PM | 75 (23.4%) | 21 (6.9%) |
| 4:00 PM to 11:59 PM | 7 (2.2%) | 35 (11.6%) |
| Total | 321 (100.0%) | 303 (100.0%) |
Housing Occupancy in Schwenksville borough
Occupancy by Ownership in Schwenksville borough
Of the total 620 dwellings in Schwenksville borough, owner-occupied units account for 405 (65.3%), while renter-occupied units make up 215 (34.7%).
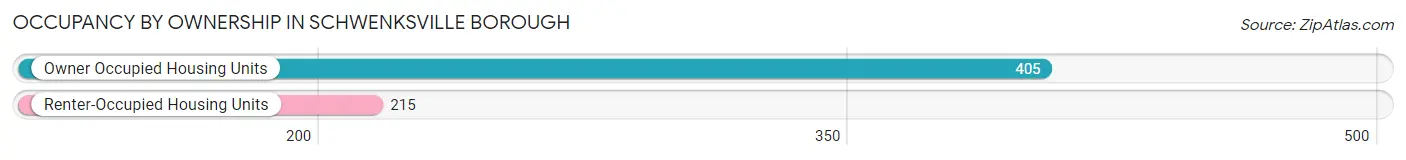
| Occupancy | # Housing Units | % Housing Units |
| Owner Occupied Housing Units | 405 | 65.3% |
| Renter-Occupied Housing Units | 215 | 34.7% |
| Total Occupied Housing Units | 620 | 100.0% |
Occupancy by Household Size in Schwenksville borough
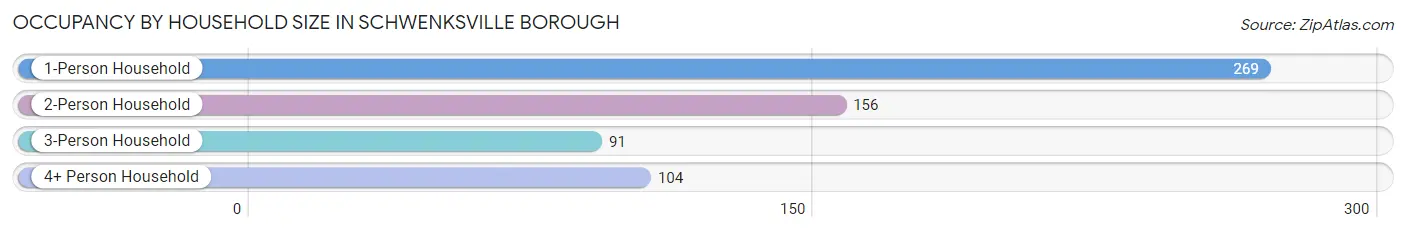
| Household Size | # Housing Units | % Housing Units |
| 1-Person Household | 269 | 43.4% |
| 2-Person Household | 156 | 25.2% |
| 3-Person Household | 91 | 14.7% |
| 4+ Person Household | 104 | 16.8% |
| Total Housing Units | 620 | 100.0% |
Occupancy by Ownership by Household Size in Schwenksville borough
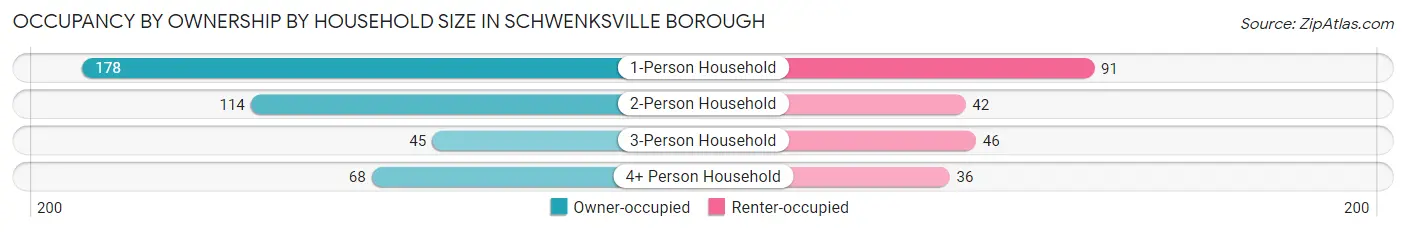
| Household Size | Owner-occupied | Renter-occupied |
| 1-Person Household | 178 (66.2%) | 91 (33.8%) |
| 2-Person Household | 114 (73.1%) | 42 (26.9%) |
| 3-Person Household | 45 (49.4%) | 46 (50.5%) |
| 4+ Person Household | 68 (65.4%) | 36 (34.6%) |
| Total Housing Units | 405 (65.3%) | 215 (34.7%) |
Occupancy by Educational Attainment in Schwenksville borough
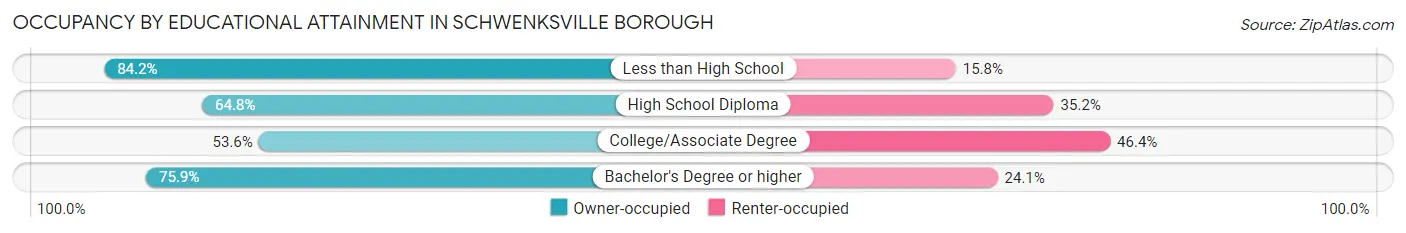
| Household Size | Owner-occupied | Renter-occupied |
| Less than High School | 16 (84.2%) | 3 (15.8%) |
| High School Diploma | 140 (64.8%) | 76 (35.2%) |
| College/Associate Degree | 104 (53.6%) | 90 (46.4%) |
| Bachelor's Degree or higher | 145 (75.9%) | 46 (24.1%) |
Occupancy by Age of Householder in Schwenksville borough
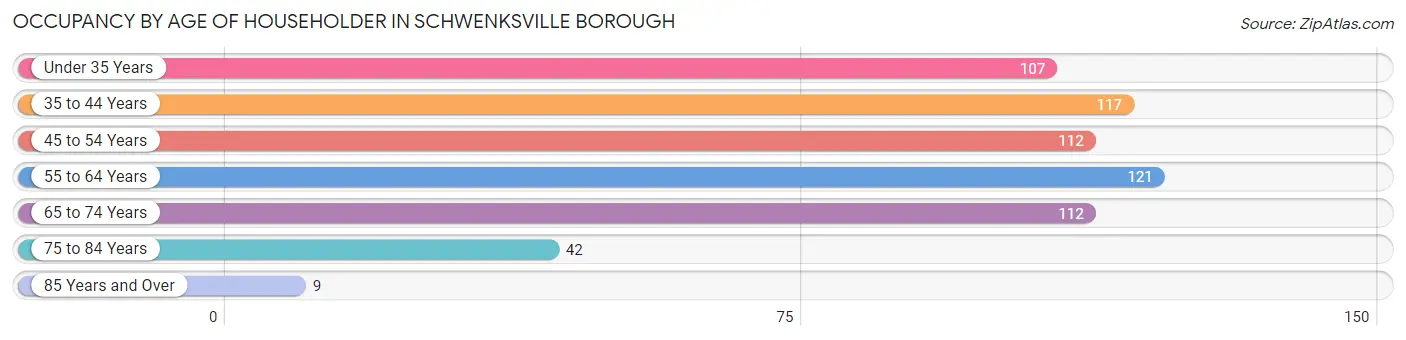
| Age Bracket | # Households | % Households |
| Under 35 Years | 107 | 17.3% |
| 35 to 44 Years | 117 | 18.9% |
| 45 to 54 Years | 112 | 18.1% |
| 55 to 64 Years | 121 | 19.5% |
| 65 to 74 Years | 112 | 18.1% |
| 75 to 84 Years | 42 | 6.8% |
| 85 Years and Over | 9 | 1.5% |
| Total | 620 | 100.0% |
Housing Finances in Schwenksville borough
Median Income by Occupancy in Schwenksville borough
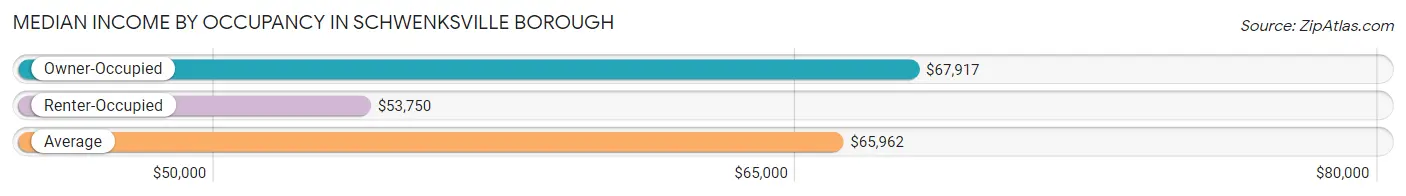
| Occupancy Type | # Households | Median Income |
| Owner-Occupied | 405 (65.3%) | $67,917 |
| Renter-Occupied | 215 (34.7%) | $53,750 |
| Average | 620 (100.0%) | $65,962 |
Occupancy by Householder Income Bracket in Schwenksville borough
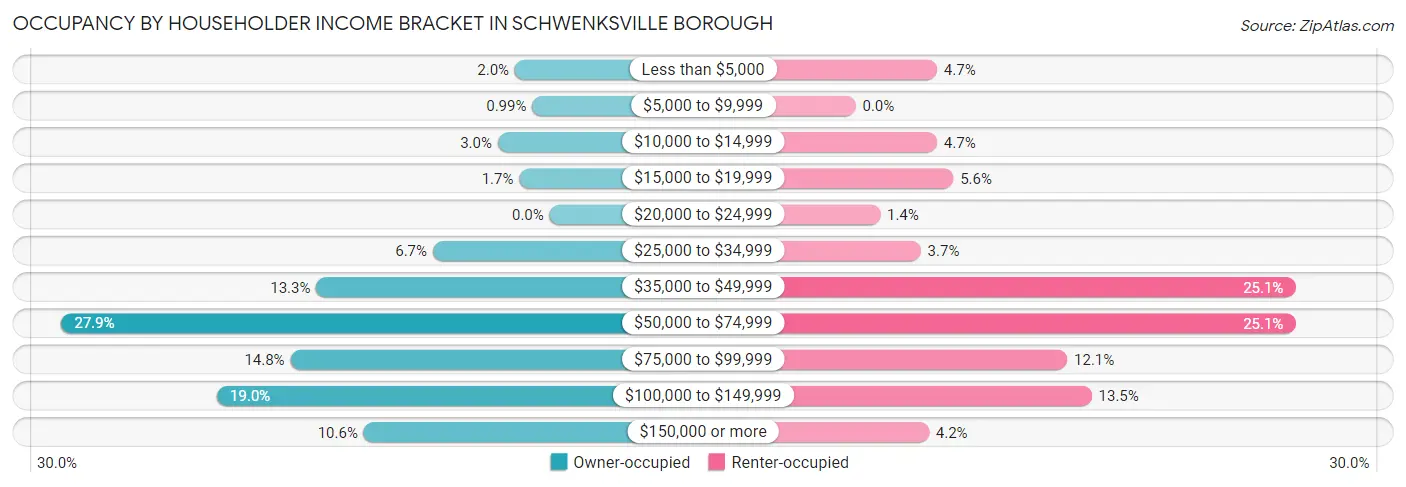
| Income Bracket | Owner-occupied | Renter-occupied |
| Less than $5,000 | 8 (2.0%) | 10 (4.6%) |
| $5,000 to $9,999 | 4 (1.0%) | 0 (0.0%) |
| $10,000 to $14,999 | 12 (3.0%) | 10 (4.6%) |
| $15,000 to $19,999 | 7 (1.7%) | 12 (5.6%) |
| $20,000 to $24,999 | 0 (0.0%) | 3 (1.4%) |
| $25,000 to $34,999 | 27 (6.7%) | 8 (3.7%) |
| $35,000 to $49,999 | 54 (13.3%) | 54 (25.1%) |
| $50,000 to $74,999 | 113 (27.9%) | 54 (25.1%) |
| $75,000 to $99,999 | 60 (14.8%) | 26 (12.1%) |
| $100,000 to $149,999 | 77 (19.0%) | 29 (13.5%) |
| $150,000 or more | 43 (10.6%) | 9 (4.2%) |
| Total | 405 (100.0%) | 215 (100.0%) |
Monthly Housing Cost Tiers in Schwenksville borough
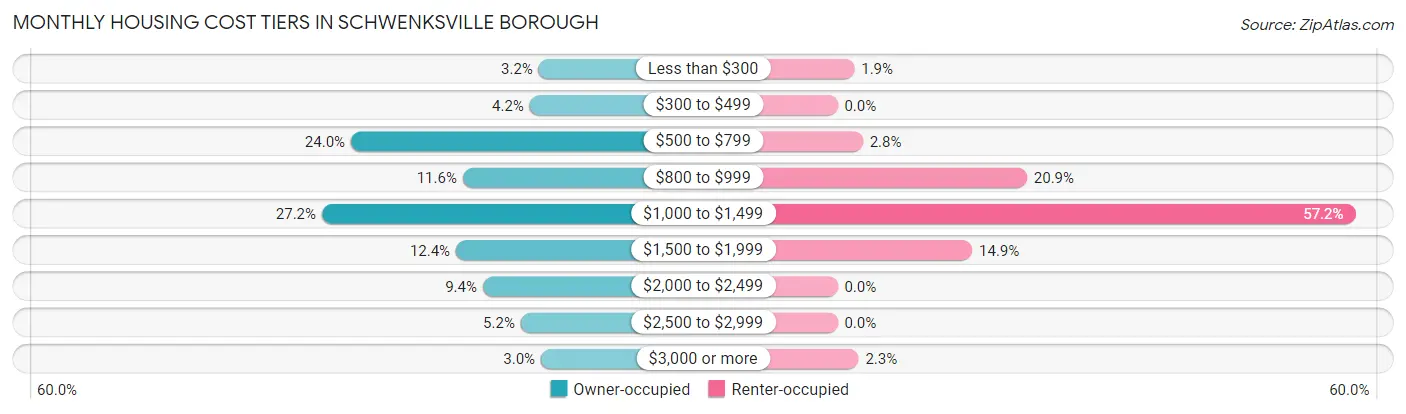
| Monthly Cost | Owner-occupied | Renter-occupied |
| Less than $300 | 13 (3.2%) | 4 (1.9%) |
| $300 to $499 | 17 (4.2%) | 0 (0.0%) |
| $500 to $799 | 97 (23.9%) | 6 (2.8%) |
| $800 to $999 | 47 (11.6%) | 45 (20.9%) |
| $1,000 to $1,499 | 110 (27.2%) | 123 (57.2%) |
| $1,500 to $1,999 | 50 (12.3%) | 32 (14.9%) |
| $2,000 to $2,499 | 38 (9.4%) | 0 (0.0%) |
| $2,500 to $2,999 | 21 (5.2%) | 0 (0.0%) |
| $3,000 or more | 12 (3.0%) | 5 (2.3%) |
| Total | 405 (100.0%) | 215 (100.0%) |
Physical Housing Characteristics in Schwenksville borough
Housing Structures in Schwenksville borough
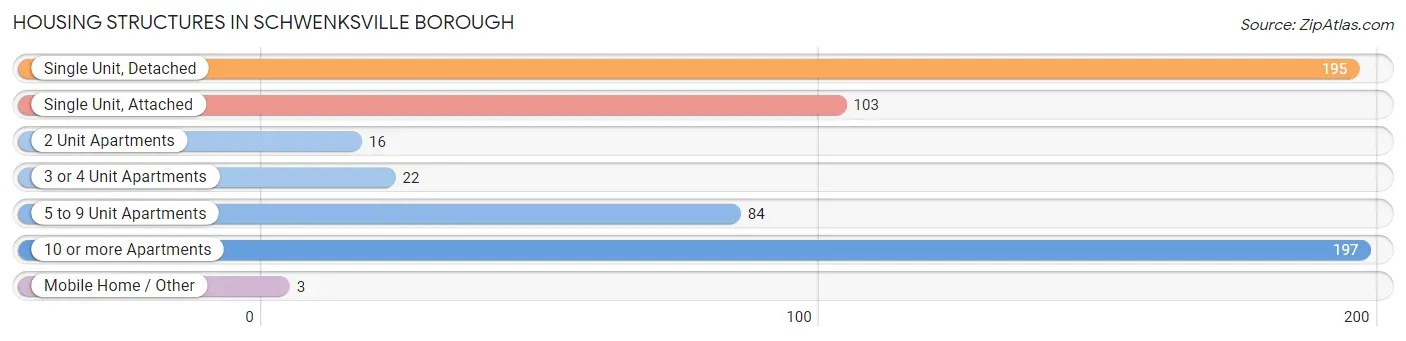
| Structure Type | # Housing Units | % Housing Units |
| Single Unit, Detached | 195 | 31.5% |
| Single Unit, Attached | 103 | 16.6% |
| 2 Unit Apartments | 16 | 2.6% |
| 3 or 4 Unit Apartments | 22 | 3.5% |
| 5 to 9 Unit Apartments | 84 | 13.6% |
| 10 or more Apartments | 197 | 31.8% |
| Mobile Home / Other | 3 | 0.5% |
| Total | 620 | 100.0% |
Housing Structures by Occupancy in Schwenksville borough
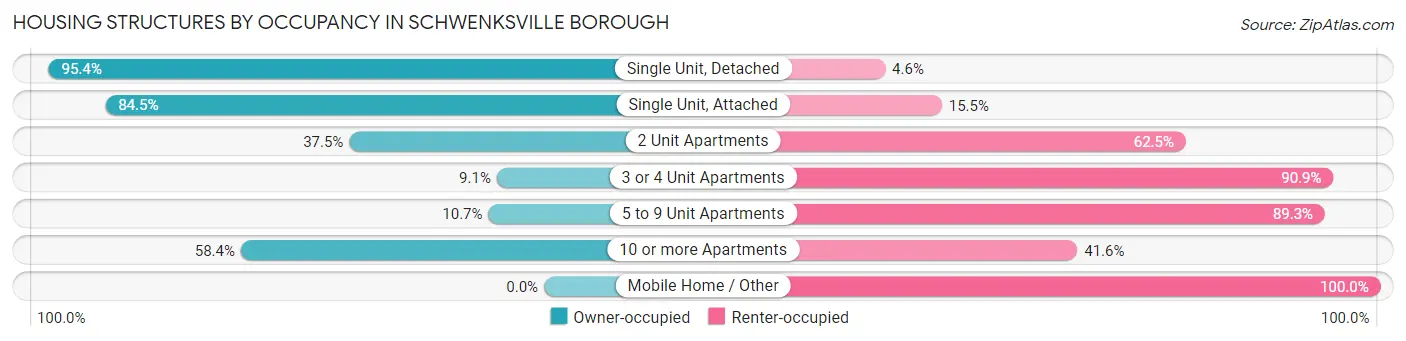
| Structure Type | Owner-occupied | Renter-occupied |
| Single Unit, Detached | 186 (95.4%) | 9 (4.6%) |
| Single Unit, Attached | 87 (84.5%) | 16 (15.5%) |
| 2 Unit Apartments | 6 (37.5%) | 10 (62.5%) |
| 3 or 4 Unit Apartments | 2 (9.1%) | 20 (90.9%) |
| 5 to 9 Unit Apartments | 9 (10.7%) | 75 (89.3%) |
| 10 or more Apartments | 115 (58.4%) | 82 (41.6%) |
| Mobile Home / Other | 0 (0.0%) | 3 (100.0%) |
| Total | 405 (65.3%) | 215 (34.7%) |
Housing Structures by Number of Rooms in Schwenksville borough
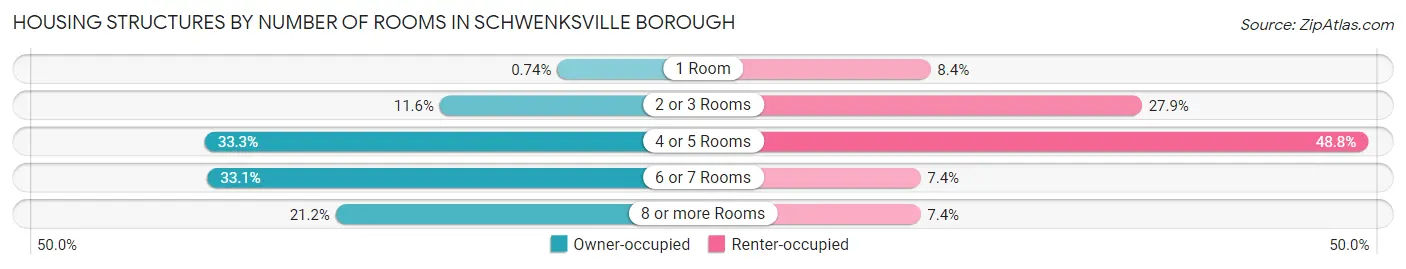
| Number of Rooms | Owner-occupied | Renter-occupied |
| 1 Room | 3 (0.7%) | 18 (8.4%) |
| 2 or 3 Rooms | 47 (11.6%) | 60 (27.9%) |
| 4 or 5 Rooms | 135 (33.3%) | 105 (48.8%) |
| 6 or 7 Rooms | 134 (33.1%) | 16 (7.4%) |
| 8 or more Rooms | 86 (21.2%) | 16 (7.4%) |
| Total | 405 (100.0%) | 215 (100.0%) |
Housing Structure by Heating Type in Schwenksville borough
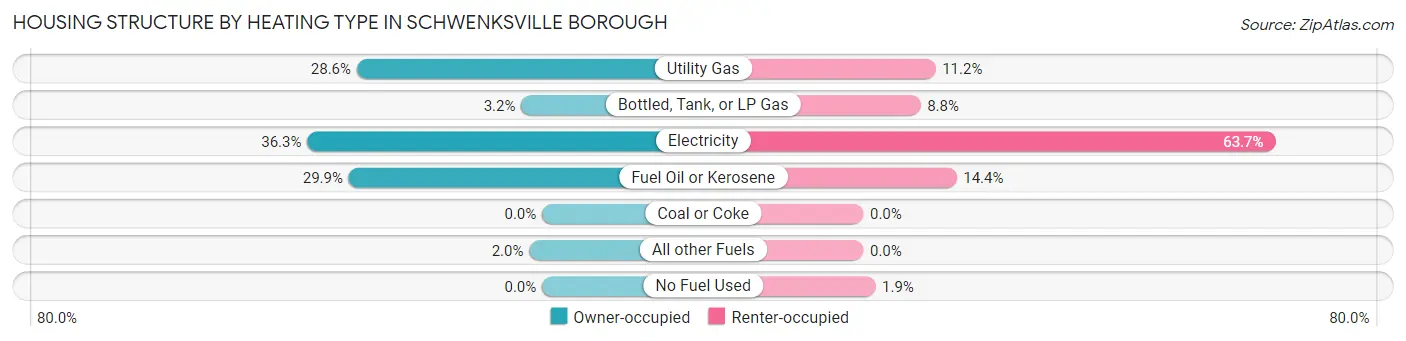
| Heating Type | Owner-occupied | Renter-occupied |
| Utility Gas | 116 (28.6%) | 24 (11.2%) |
| Bottled, Tank, or LP Gas | 13 (3.2%) | 19 (8.8%) |
| Electricity | 147 (36.3%) | 137 (63.7%) |
| Fuel Oil or Kerosene | 121 (29.9%) | 31 (14.4%) |
| Coal or Coke | 0 (0.0%) | 0 (0.0%) |
| All other Fuels | 8 (2.0%) | 0 (0.0%) |
| No Fuel Used | 0 (0.0%) | 4 (1.9%) |
| Total | 405 (100.0%) | 215 (100.0%) |
Household Vehicle Usage in Schwenksville borough
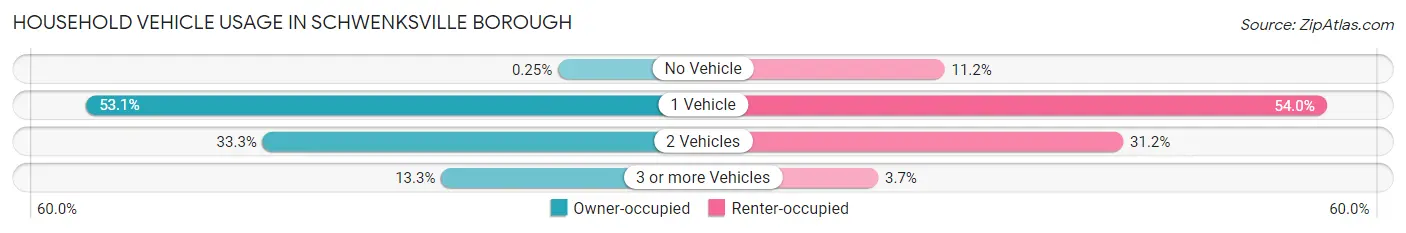
| Vehicles per Household | Owner-occupied | Renter-occupied |
| No Vehicle | 1 (0.3%) | 24 (11.2%) |
| 1 Vehicle | 215 (53.1%) | 116 (53.9%) |
| 2 Vehicles | 135 (33.3%) | 67 (31.2%) |
| 3 or more Vehicles | 54 (13.3%) | 8 (3.7%) |
| Total | 405 (100.0%) | 215 (100.0%) |
Real Estate & Mortgages in Schwenksville borough
Real Estate and Mortgage Overview in Schwenksville borough
| Characteristic | Without Mortgage | With Mortgage |
| Housing Units | 154 | 251 |
| Median Property Value | $228,900 | $171,500 |
| Median Household Income | $61,000 | $33 |
| Monthly Housing Costs | $685 | $12 |
| Real Estate Taxes | $3,087 | $0 |
Property Value by Mortgage Status in Schwenksville borough
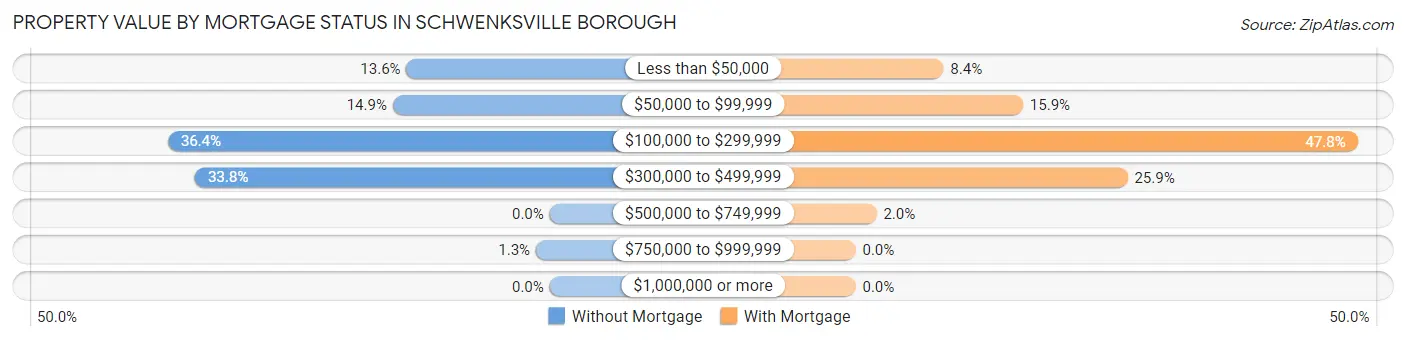
| Property Value | Without Mortgage | With Mortgage |
| Less than $50,000 | 21 (13.6%) | 21 (8.4%) |
| $50,000 to $99,999 | 23 (14.9%) | 40 (15.9%) |
| $100,000 to $299,999 | 56 (36.4%) | 120 (47.8%) |
| $300,000 to $499,999 | 52 (33.8%) | 65 (25.9%) |
| $500,000 to $749,999 | 0 (0.0%) | 5 (2.0%) |
| $750,000 to $999,999 | 2 (1.3%) | 0 (0.0%) |
| $1,000,000 or more | 0 (0.0%) | 0 (0.0%) |
| Total | 154 (100.0%) | 251 (100.0%) |
Household Income by Mortgage Status in Schwenksville borough
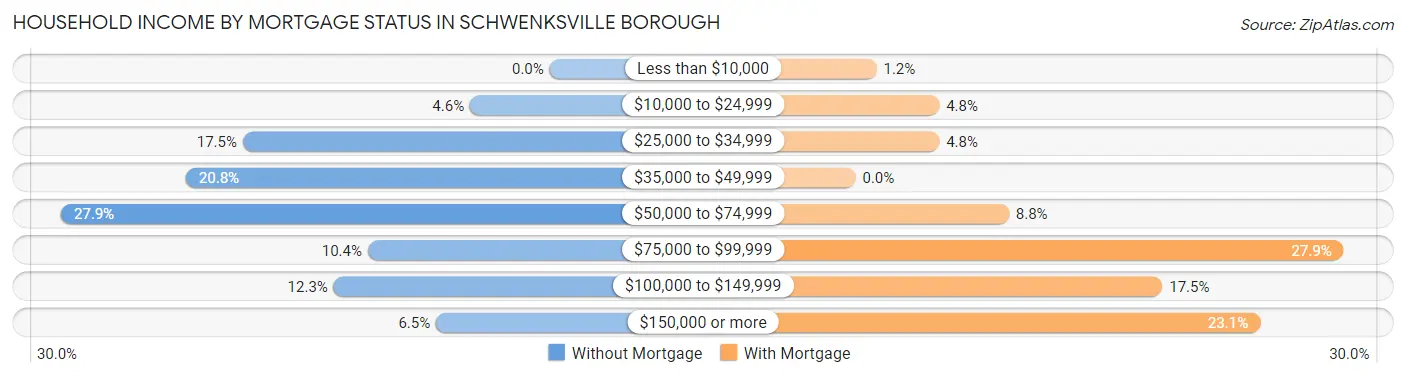
| Household Income | Without Mortgage | With Mortgage |
| Less than $10,000 | 0 (0.0%) | 3 (1.2%) |
| $10,000 to $24,999 | 7 (4.5%) | 12 (4.8%) |
| $25,000 to $34,999 | 27 (17.5%) | 12 (4.8%) |
| $35,000 to $49,999 | 32 (20.8%) | 0 (0.0%) |
| $50,000 to $74,999 | 43 (27.9%) | 22 (8.8%) |
| $75,000 to $99,999 | 16 (10.4%) | 70 (27.9%) |
| $100,000 to $149,999 | 19 (12.3%) | 44 (17.5%) |
| $150,000 or more | 10 (6.5%) | 58 (23.1%) |
| Total | 154 (100.0%) | 251 (100.0%) |
Property Value to Household Income Ratio in Schwenksville borough
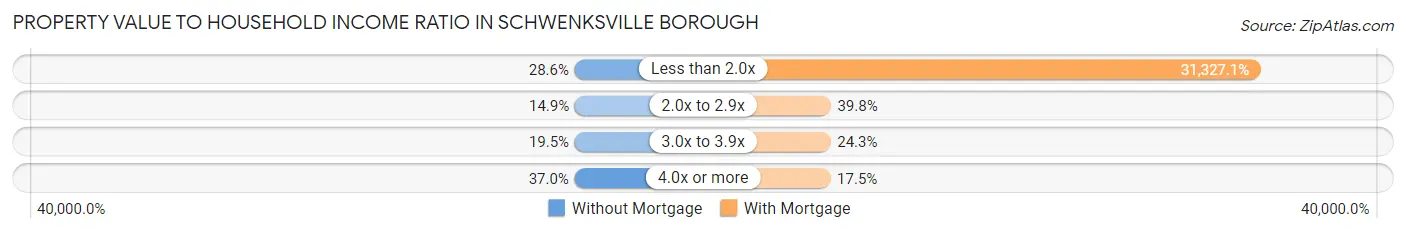
| Value-to-Income Ratio | Without Mortgage | With Mortgage |
| Less than 2.0x | 44 (28.6%) | 78,631 (31,327.1%) |
| 2.0x to 2.9x | 23 (14.9%) | 100 (39.8%) |
| 3.0x to 3.9x | 30 (19.5%) | 61 (24.3%) |
| 4.0x or more | 57 (37.0%) | 44 (17.5%) |
| Total | 154 (100.0%) | 251 (100.0%) |
Real Estate Taxes by Mortgage Status in Schwenksville borough
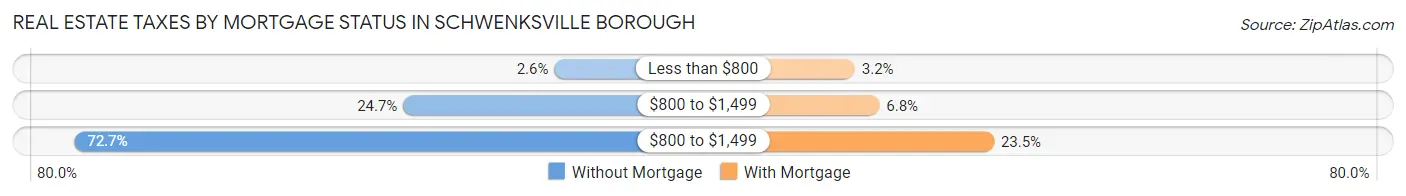
| Property Taxes | Without Mortgage | With Mortgage |
| Less than $800 | 4 (2.6%) | 8 (3.2%) |
| $800 to $1,499 | 38 (24.7%) | 17 (6.8%) |
| $800 to $1,499 | 112 (72.7%) | 59 (23.5%) |
| Total | 154 (100.0%) | 251 (100.0%) |
Health & Disability in Schwenksville borough
Health Insurance Coverage by Age in Schwenksville borough
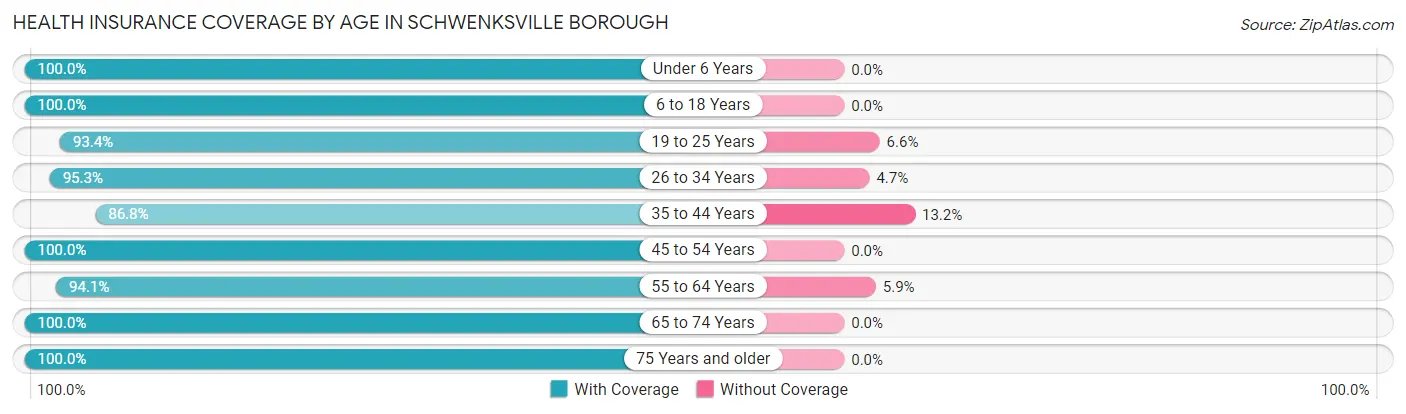
| Age Bracket | With Coverage | Without Coverage |
| Under 6 Years | 78 (100.0%) | 0 (0.0%) |
| 6 to 18 Years | 252 (100.0%) | 0 (0.0%) |
| 19 to 25 Years | 85 (93.4%) | 6 (6.6%) |
| 26 to 34 Years | 122 (95.3%) | 6 (4.7%) |
| 35 to 44 Years | 158 (86.8%) | 24 (13.2%) |
| 45 to 54 Years | 187 (100.0%) | 0 (0.0%) |
| 55 to 64 Years | 192 (94.1%) | 12 (5.9%) |
| 65 to 74 Years | 126 (100.0%) | 0 (0.0%) |
| 75 Years and older | 66 (100.0%) | 0 (0.0%) |
| Total | 1,266 (96.4%) | 48 (3.6%) |
Health Insurance Coverage by Citizenship Status in Schwenksville borough
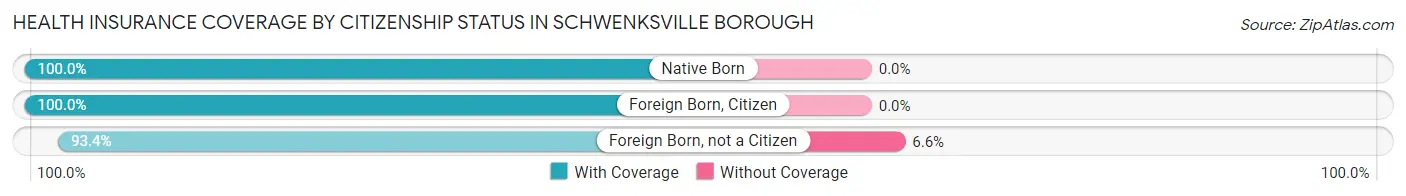
| Citizenship Status | With Coverage | Without Coverage |
| Native Born | 78 (100.0%) | 0 (0.0%) |
| Foreign Born, Citizen | 252 (100.0%) | 0 (0.0%) |
| Foreign Born, not a Citizen | 85 (93.4%) | 6 (6.6%) |
Health Insurance Coverage by Household Income in Schwenksville borough
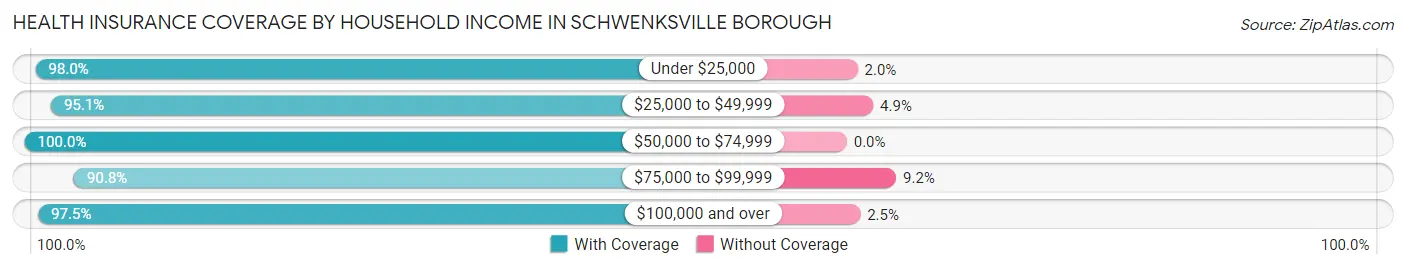
| Household Income | With Coverage | Without Coverage |
| Under $25,000 | 145 (98.0%) | 3 (2.0%) |
| $25,000 to $49,999 | 231 (95.1%) | 12 (4.9%) |
| $50,000 to $74,999 | 248 (100.0%) | 0 (0.0%) |
| $75,000 to $99,999 | 216 (90.8%) | 22 (9.2%) |
| $100,000 and over | 426 (97.5%) | 11 (2.5%) |
Public vs Private Health Insurance Coverage by Age in Schwenksville borough
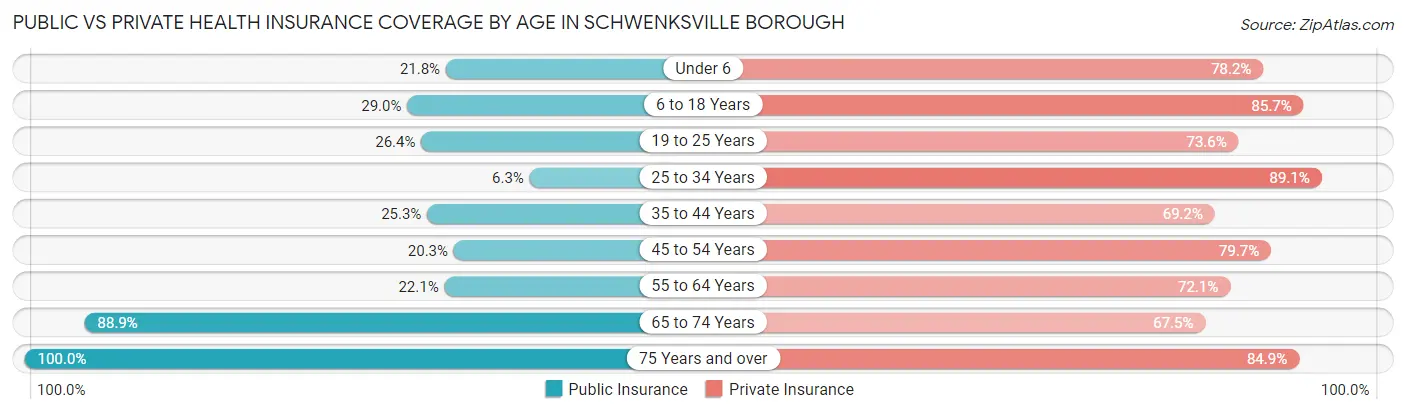
| Age Bracket | Public Insurance | Private Insurance |
| Under 6 | 17 (21.8%) | 61 (78.2%) |
| 6 to 18 Years | 73 (29.0%) | 216 (85.7%) |
| 19 to 25 Years | 24 (26.4%) | 67 (73.6%) |
| 25 to 34 Years | 8 (6.2%) | 114 (89.1%) |
| 35 to 44 Years | 46 (25.3%) | 126 (69.2%) |
| 45 to 54 Years | 38 (20.3%) | 149 (79.7%) |
| 55 to 64 Years | 45 (22.1%) | 147 (72.1%) |
| 65 to 74 Years | 112 (88.9%) | 85 (67.5%) |
| 75 Years and over | 66 (100.0%) | 56 (84.9%) |
| Total | 429 (32.7%) | 1,021 (77.7%) |
Disability Status by Sex by Age in Schwenksville borough
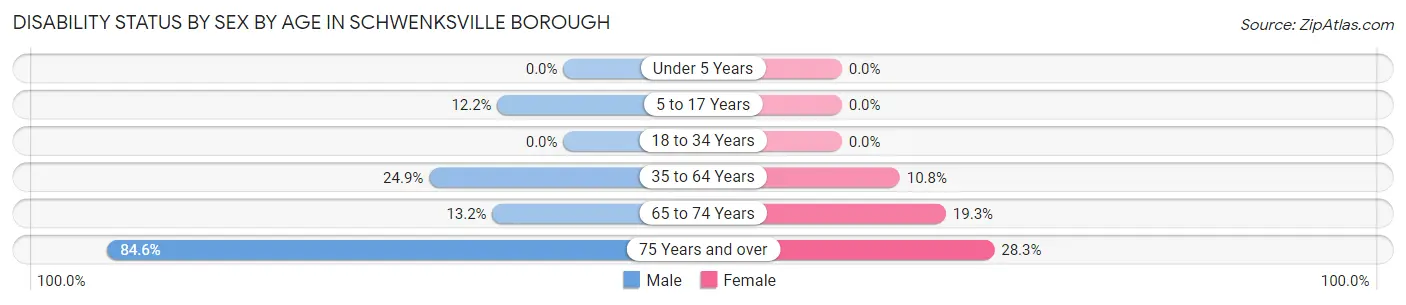
| Age Bracket | Male | Female |
| Under 5 Years | 0 (0.0%) | 0 (0.0%) |
| 5 to 17 Years | 17 (12.2%) | 0 (0.0%) |
| 18 to 34 Years | 0 (0.0%) | 0 (0.0%) |
| 35 to 64 Years | 71 (24.9%) | 31 (10.8%) |
| 65 to 74 Years | 5 (13.2%) | 17 (19.3%) |
| 75 Years and over | 11 (84.6%) | 15 (28.3%) |
Disability Class by Sex by Age in Schwenksville borough
Disability Class: Hearing Difficulty
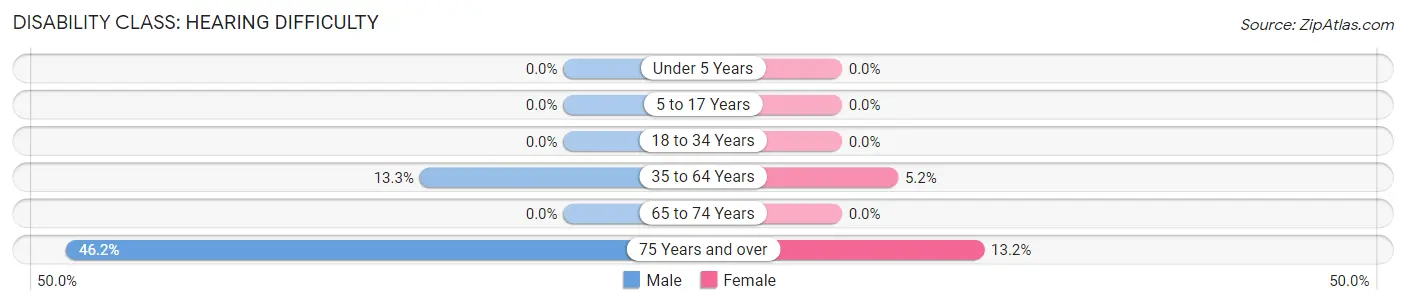
| Age Bracket | Male | Female |
| Under 5 Years | 0 (0.0%) | 0 (0.0%) |
| 5 to 17 Years | 0 (0.0%) | 0 (0.0%) |
| 18 to 34 Years | 0 (0.0%) | 0 (0.0%) |
| 35 to 64 Years | 38 (13.3%) | 15 (5.2%) |
| 65 to 74 Years | 0 (0.0%) | 0 (0.0%) |
| 75 Years and over | 6 (46.2%) | 7 (13.2%) |
Disability Class: Vision Difficulty
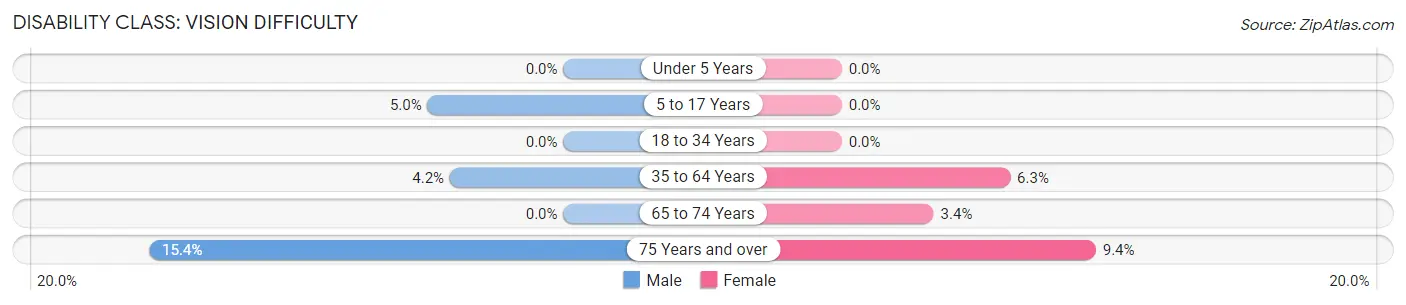
| Age Bracket | Male | Female |
| Under 5 Years | 0 (0.0%) | 0 (0.0%) |
| 5 to 17 Years | 7 (5.0%) | 0 (0.0%) |
| 18 to 34 Years | 0 (0.0%) | 0 (0.0%) |
| 35 to 64 Years | 12 (4.2%) | 18 (6.2%) |
| 65 to 74 Years | 0 (0.0%) | 3 (3.4%) |
| 75 Years and over | 2 (15.4%) | 5 (9.4%) |
Disability Class: Cognitive Difficulty
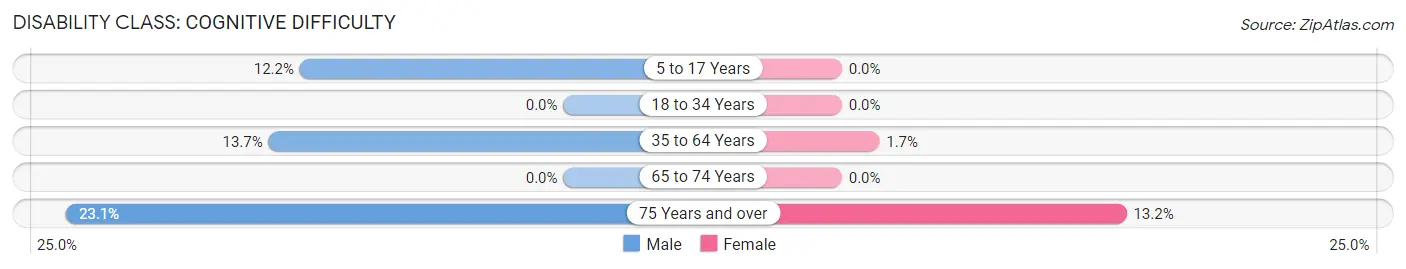
| Age Bracket | Male | Female |
| 5 to 17 Years | 17 (12.2%) | 0 (0.0%) |
| 18 to 34 Years | 0 (0.0%) | 0 (0.0%) |
| 35 to 64 Years | 39 (13.7%) | 5 (1.7%) |
| 65 to 74 Years | 0 (0.0%) | 0 (0.0%) |
| 75 Years and over | 3 (23.1%) | 7 (13.2%) |
Disability Class: Ambulatory Difficulty
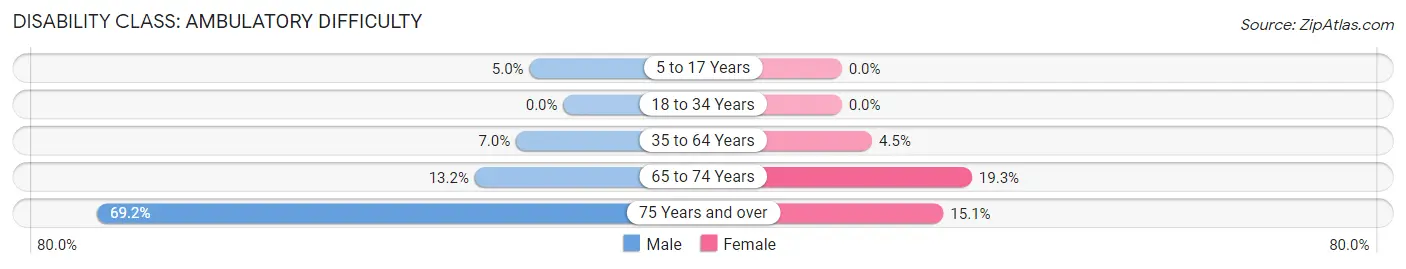
| Age Bracket | Male | Female |
| 5 to 17 Years | 7 (5.0%) | 0 (0.0%) |
| 18 to 34 Years | 0 (0.0%) | 0 (0.0%) |
| 35 to 64 Years | 20 (7.0%) | 13 (4.5%) |
| 65 to 74 Years | 5 (13.2%) | 17 (19.3%) |
| 75 Years and over | 9 (69.2%) | 8 (15.1%) |
Disability Class: Self-Care Difficulty
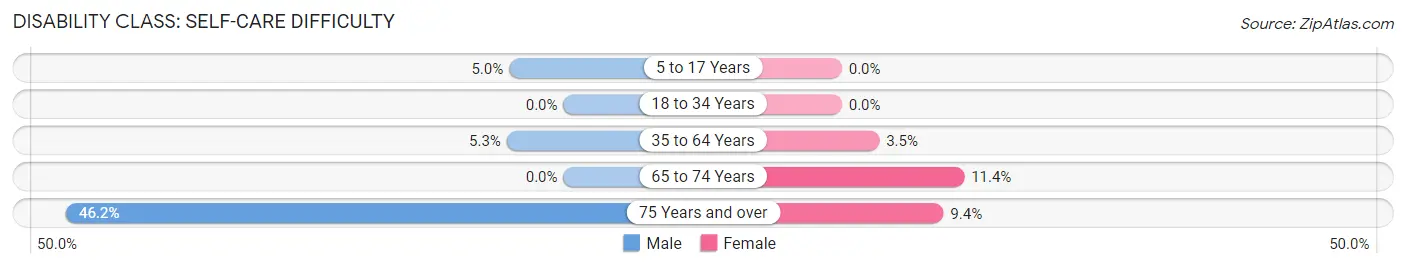
| Age Bracket | Male | Female |
| 5 to 17 Years | 7 (5.0%) | 0 (0.0%) |
| 18 to 34 Years | 0 (0.0%) | 0 (0.0%) |
| 35 to 64 Years | 15 (5.3%) | 10 (3.5%) |
| 65 to 74 Years | 0 (0.0%) | 10 (11.4%) |
| 75 Years and over | 6 (46.2%) | 5 (9.4%) |
Technology Access in Schwenksville borough
Computing Device Access in Schwenksville borough
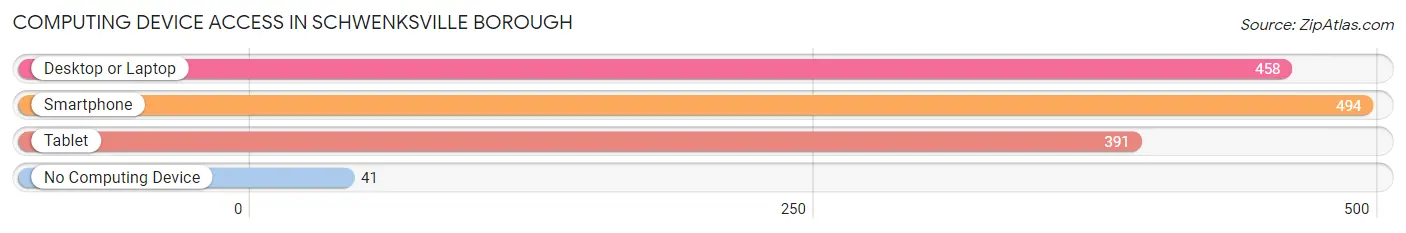
| Device Type | # Households | % Households |
| Desktop or Laptop | 458 | 73.9% |
| Smartphone | 494 | 79.7% |
| Tablet | 391 | 63.1% |
| No Computing Device | 41 | 6.6% |
| Total | 620 | 100.0% |
Internet Access in Schwenksville borough
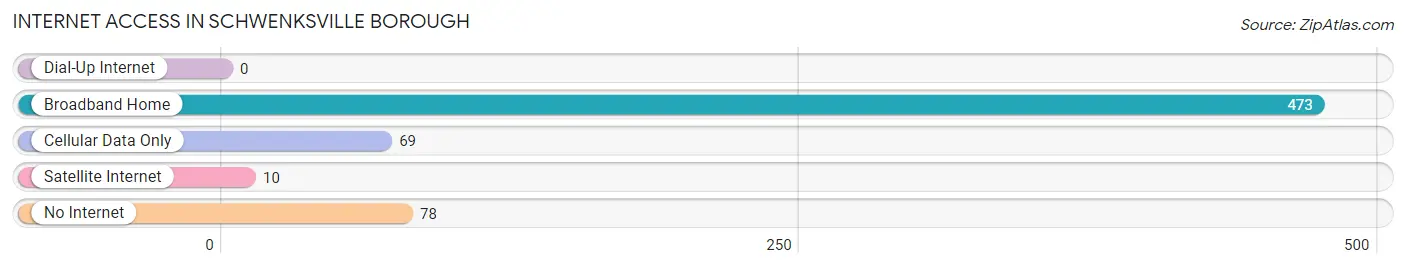
| Internet Type | # Households | % Households |
| Dial-Up Internet | 0 | 0.0% |
| Broadband Home | 473 | 76.3% |
| Cellular Data Only | 69 | 11.1% |
| Satellite Internet | 10 | 1.6% |
| No Internet | 78 | 12.6% |
| Total | 620 | 100.0% |
Schwenksville borough Summary
Schwenksville Borough is a small borough located in Montgomery County, Pennsylvania. It is situated in the southeastern part of the county, approximately 25 miles northwest of Philadelphia. The borough is bordered by the townships of Upper Frederick, Lower Frederick, and Perkiomen. As of the 2010 census, the population of Schwenksville was 2,311.
History
Schwenksville was founded in 1720 by John Schwenk, a German immigrant. The borough was originally known as “Schwenk’s Mill” and was a small farming community. In 1845, the borough was officially incorporated as Schwenksville.
The borough was home to a number of industries throughout its history, including a paper mill, a grist mill, a saw mill, and a tannery. The paper mill was the largest employer in the borough and operated until the early 20th century.
Geography
Schwenksville is located at 40°14'N 75°25'W. It has a total area of 1.2 square miles, all of which is land. The borough is situated in the Perkiomen Valley, which is part of the Great Valley region of southeastern Pennsylvania.
The borough is located in the Perkiomen Creek watershed and is surrounded by rolling hills and forests. The borough is home to several parks, including the Perkiomen Trail, which is a popular hiking and biking trail.
Economy
The economy of Schwenksville is largely based on tourism and small businesses. The borough is home to several small businesses, including restaurants, shops, and galleries. The borough is also home to a number of historic sites, including the Schwenksville Historic District, which is listed on the National Register of Historic Places.
The borough is also home to a number of educational institutions, including Ursinus College, which is located just outside of the borough. The college is a private liberal arts college and is one of the oldest institutions of higher learning in the United States.
Demographics
As of the 2010 census, the population of Schwenksville was 2,311. The racial makeup of the borough was 94.3% White, 2.2% African American, 0.3% Native American, 1.2% Asian, 0.1% Pacific Islander, 0.7% from other races, and 1.3% from two or more races. Hispanic or Latino of any race were 2.2% of the population.
The median income for a household in the borough was $60,938, and the median income for a family was $71,250. The per capita income for the borough was $27,945. About 4.2% of families and 5.7% of the population were below the poverty line, including 6.3% of those under age 18 and 4.2% of those age 65 or over.
Common Questions
What is Per Capita Income in Schwenksville borough?
Per Capita income in Schwenksville borough is $35,778.
What is the Median Family Income in Schwenksville borough?
Median Family Income in Schwenksville borough is $83,194.
What is the Median Household income in Schwenksville borough?
Median Household Income in Schwenksville borough is $65,962.
What is Income or Wage Gap in Schwenksville borough?
Income or Wage Gap in Schwenksville borough is 5.0%.
Women in Schwenksville borough earn 95.0 cents for every dollar earned by a man.
What is Inequality or Gini Index in Schwenksville borough?
Inequality or Gini Index in Schwenksville borough is 0.37.
What is the Total Population of Schwenksville borough?
Total Population of Schwenksville borough is 1,366.
What is the Total Male Population of Schwenksville borough?
Total Male Population of Schwenksville borough is 646.
What is the Total Female Population of Schwenksville borough?
Total Female Population of Schwenksville borough is 720.
What is the Ratio of Males per 100 Females in Schwenksville borough?
There are 89.72 Males per 100 Females in Schwenksville borough.
What is the Ratio of Females per 100 Males in Schwenksville borough?
There are 111.46 Females per 100 Males in Schwenksville borough.
What is the Median Population Age in Schwenksville borough?
Median Population Age in Schwenksville borough is 39.9 Years.
What is the Average Family Size in Schwenksville borough
Average Family Size in Schwenksville borough is 3.0 People.
What is the Average Household Size in Schwenksville borough
Average Household Size in Schwenksville borough is 2.1 People.
How Large is the Labor Force in Schwenksville borough?
There are 769 People in the Labor Forcein in Schwenksville borough.
What is the Percentage of People in the Labor Force in Schwenksville borough?
73.3% of People are in the Labor Force in Schwenksville borough.
What is the Unemployment Rate in Schwenksville borough?
Unemployment Rate in Schwenksville borough is 4.1%.