Drexel Hill, PA Map & Demographics
Drexel Hill Map
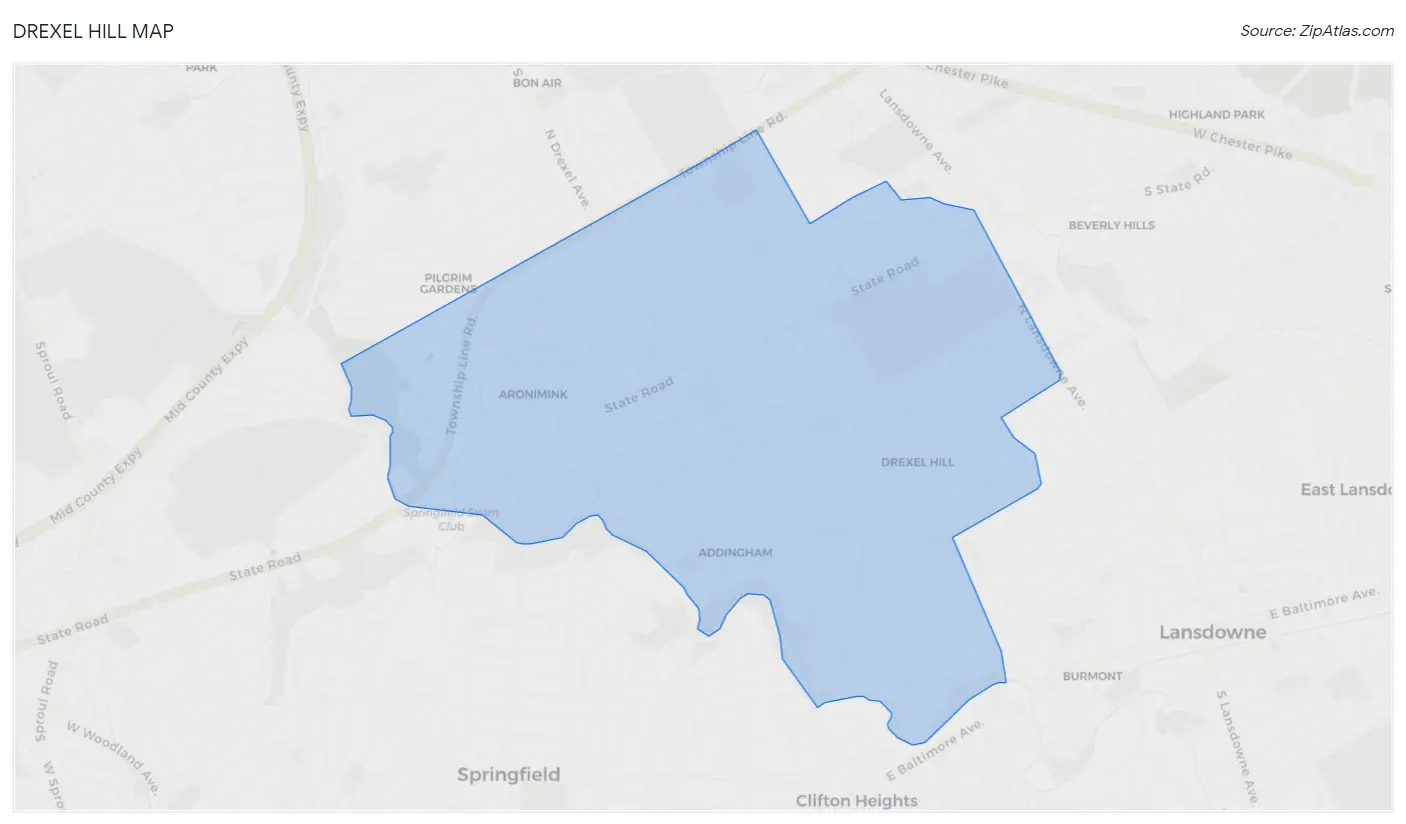
Drexel Hill Overview
$43,061
PER CAPITA INCOME
$100,808
AVG FAMILY INCOME
$82,777
AVG HOUSEHOLD INCOME
13.1%
WAGE / INCOME GAP [ % ]
86.9¢/ $1
WAGE / INCOME GAP [ $ ]
0.41
INEQUALITY / GINI INDEX
29,231
TOTAL POPULATION
14,129
MALE POPULATION
15,102
FEMALE POPULATION
93.56
MALES / 100 FEMALES
106.89
FEMALES / 100 MALES
37.0
MEDIAN AGE
3.0
AVG FAMILY SIZE
2.4
AVG HOUSEHOLD SIZE
17,648
LABOR FORCE [ PEOPLE ]
73.8%
PERCENT IN LABOR FORCE
8.7%
UNEMPLOYMENT RATE
Drexel Hill Zip Codes
Income in Drexel Hill
Income Overview in Drexel Hill
Per Capita Income in Drexel Hill is $43,061, while median incomes of families and households are $100,808 and $82,777 respectively.
| Characteristic | Number | Measure |
| Per Capita Income | 29,231 | $43,061 |
| Median Family Income | 7,766 | $100,808 |
| Mean Family Income | 7,766 | $120,550 |
| Median Household Income | 11,999 | $82,777 |
| Mean Household Income | 11,999 | $102,620 |
| Income Deficit | 7,766 | $0 |
| Wage / Income Gap (%) | 29,231 | 13.14% |
| Wage / Income Gap ($) | 29,231 | 86.86¢ per $1 |
| Gini / Inequality Index | 29,231 | 0.41 |
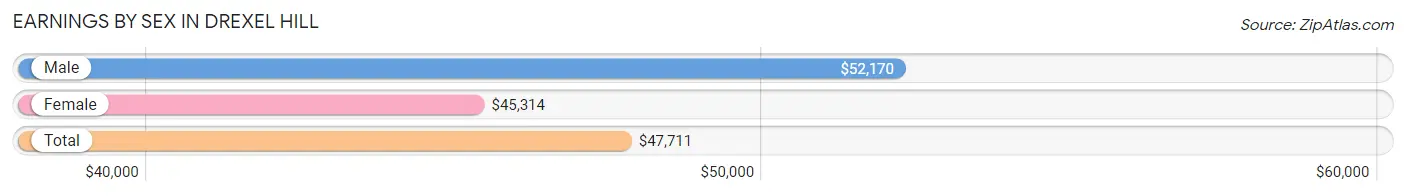
Earnings by Sex in Drexel Hill
Average Earnings in Drexel Hill are $47,711, $52,170 for men and $45,314 for women, a difference of 13.1%.
| Sex | Number | Average Earnings |
| Male | 8,911 (50.2%) | $52,170 |
| Female | 8,826 (49.8%) | $45,314 |
| Total | 17,737 (100.0%) | $47,711 |
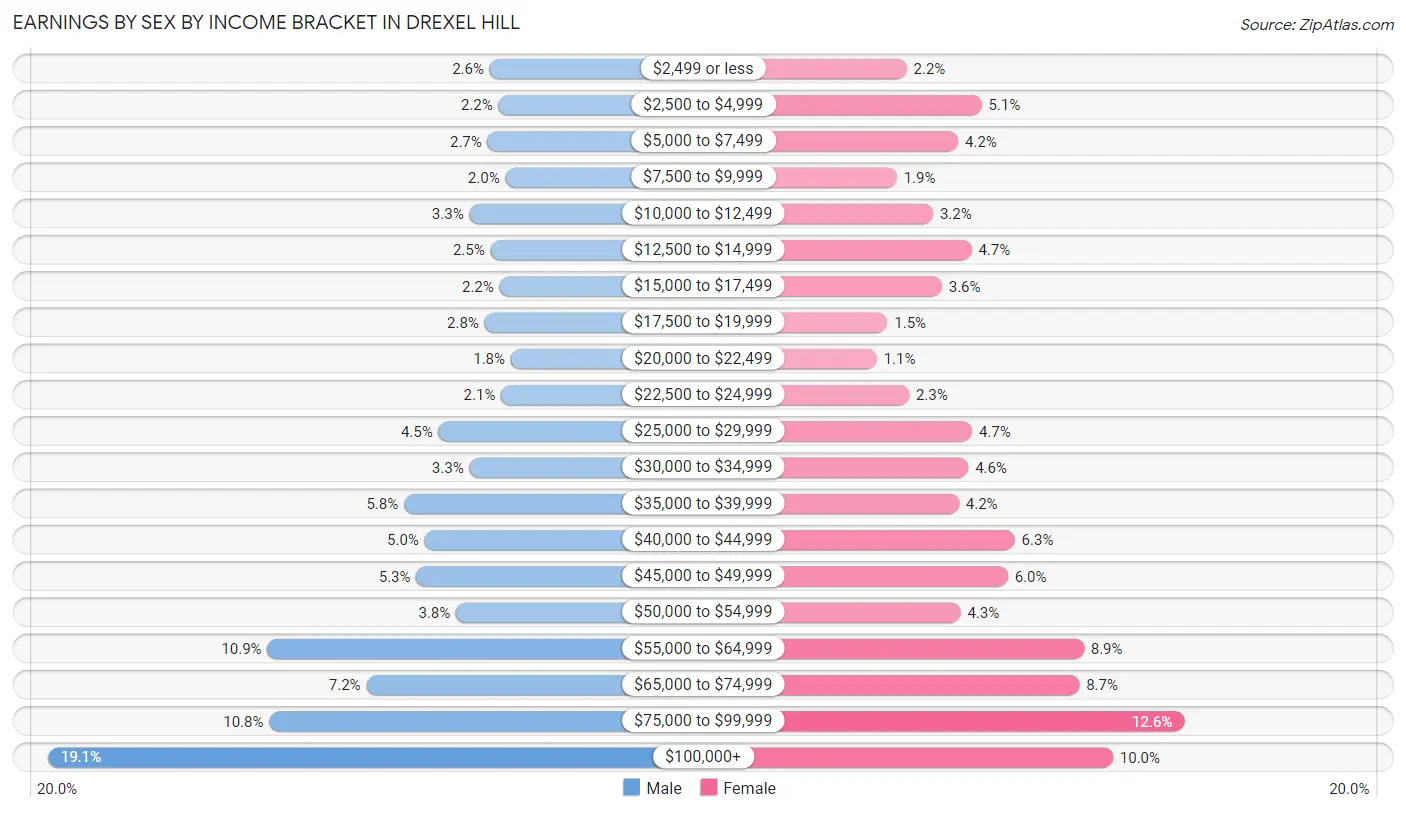
Earnings by Sex by Income Bracket in Drexel Hill
The most common earnings brackets in Drexel Hill are $100,000+ for men (1,705 | 19.1%) and $75,000 to $99,999 for women (1,116 | 12.6%).
| Income | Male | Female |
| $2,499 or less | 229 (2.6%) | 198 (2.2%) |
| $2,500 to $4,999 | 200 (2.2%) | 446 (5.1%) |
| $5,000 to $7,499 | 236 (2.6%) | 368 (4.2%) |
| $7,500 to $9,999 | 176 (2.0%) | 165 (1.9%) |
| $10,000 to $12,499 | 297 (3.3%) | 285 (3.2%) |
| $12,500 to $14,999 | 226 (2.5%) | 412 (4.7%) |
| $15,000 to $17,499 | 196 (2.2%) | 314 (3.6%) |
| $17,500 to $19,999 | 246 (2.8%) | 134 (1.5%) |
| $20,000 to $22,499 | 159 (1.8%) | 99 (1.1%) |
| $22,500 to $24,999 | 191 (2.1%) | 206 (2.3%) |
| $25,000 to $29,999 | 400 (4.5%) | 414 (4.7%) |
| $30,000 to $34,999 | 297 (3.3%) | 402 (4.5%) |
| $35,000 to $39,999 | 515 (5.8%) | 371 (4.2%) |
| $40,000 to $44,999 | 446 (5.0%) | 555 (6.3%) |
| $45,000 to $49,999 | 474 (5.3%) | 532 (6.0%) |
| $50,000 to $54,999 | 341 (3.8%) | 376 (4.3%) |
| $55,000 to $64,999 | 971 (10.9%) | 784 (8.9%) |
| $65,000 to $74,999 | 641 (7.2%) | 769 (8.7%) |
| $75,000 to $99,999 | 965 (10.8%) | 1,116 (12.6%) |
| $100,000+ | 1,705 (19.1%) | 880 (10.0%) |
| Total | 8,911 (100.0%) | 8,826 (100.0%) |
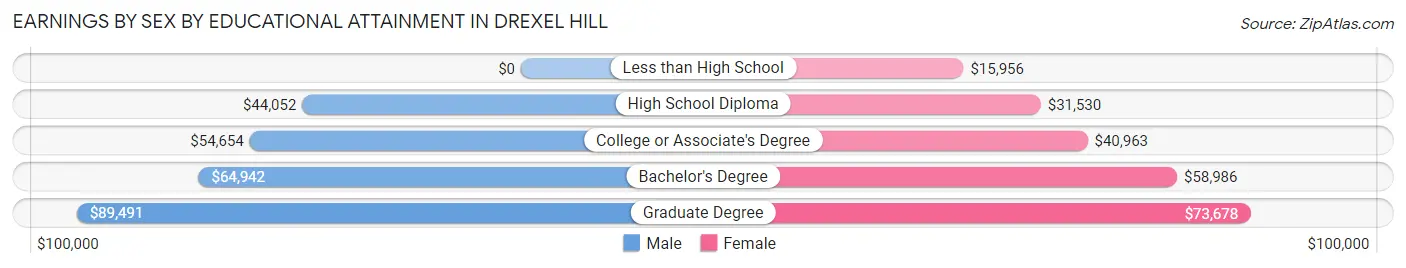
Earnings by Sex by Educational Attainment in Drexel Hill
Average earnings in Drexel Hill are $58,620 for men and $49,349 for women, a difference of 15.8%. Men with an educational attainment of graduate degree enjoy the highest average annual earnings of $89,491, while those with high school diploma education earn the least with $44,052. Women with an educational attainment of graduate degree earn the most with the average annual earnings of $73,678, while those with less than high school education have the smallest earnings of $15,956.
| Educational Attainment | Male Income | Female Income |
| Less than High School | - | - |
| High School Diploma | $44,052 | $31,530 |
| College or Associate's Degree | $54,654 | $40,963 |
| Bachelor's Degree | $64,942 | $58,986 |
| Graduate Degree | $89,491 | $73,678 |
| Total | $58,620 | $49,349 |
Family Income in Drexel Hill
Family Income Brackets in Drexel Hill
According to the Drexel Hill family income data, there are 1,747 families falling into the $100,000 to $149,999 income range, which is the most common income bracket and makes up 22.5% of all families. Conversely, the $10,000 to $14,999 income bracket is the least frequent group with only 31 families (0.4%) belonging to this category.
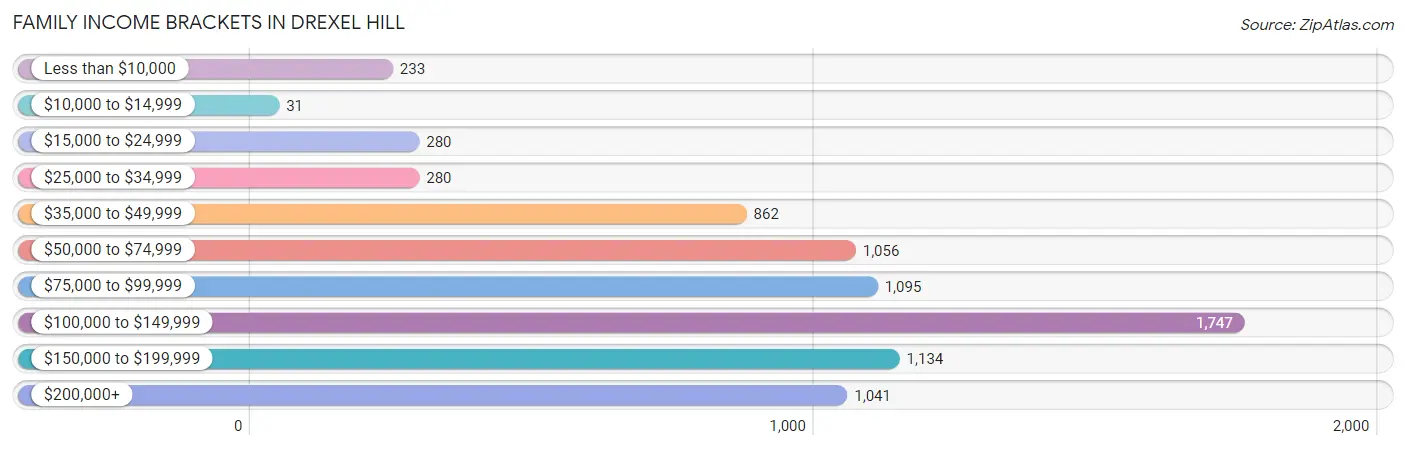
| Income Bracket | # Families | % Families |
| Less than $10,000 | 233 | 3.0% |
| $10,000 to $14,999 | 31 | 0.4% |
| $15,000 to $24,999 | 280 | 3.6% |
| $25,000 to $34,999 | 280 | 3.6% |
| $35,000 to $49,999 | 862 | 11.1% |
| $50,000 to $74,999 | 1,056 | 13.6% |
| $75,000 to $99,999 | 1,095 | 14.1% |
| $100,000 to $149,999 | 1,747 | 22.5% |
| $150,000 to $199,999 | 1,134 | 14.6% |
| $200,000+ | 1,041 | 13.4% |
Family Income by Famaliy Size in Drexel Hill
5-person families (482 | 6.2%) account for the highest median family income in Drexel Hill with $175,302 per family, while 2-person families (3,857 | 49.7%) have the highest median income of $43,626 per family member.
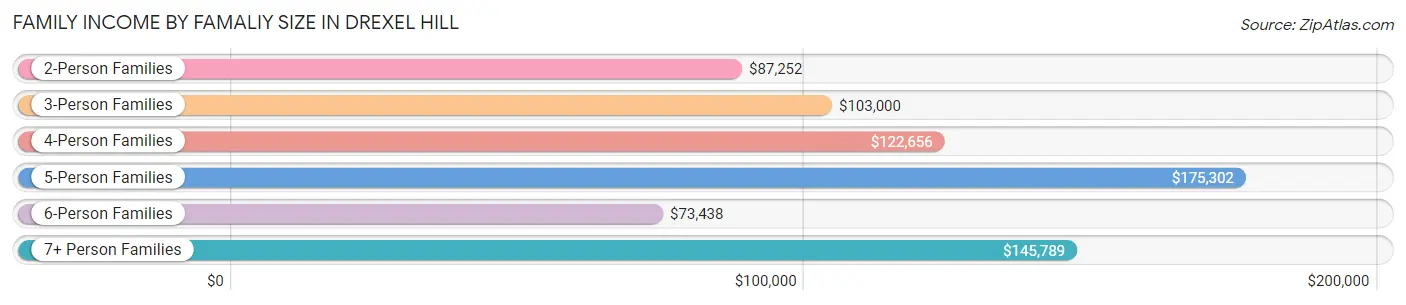
| Income Bracket | # Families | Median Income |
| 2-Person Families | 3,857 (49.7%) | $87,252 |
| 3-Person Families | 1,752 (22.6%) | $103,000 |
| 4-Person Families | 1,513 (19.5%) | $122,656 |
| 5-Person Families | 482 (6.2%) | $175,302 |
| 6-Person Families | 112 (1.4%) | $73,438 |
| 7+ Person Families | 50 (0.6%) | $145,789 |
| Total | 7,766 (100.0%) | $100,808 |
Family Income by Number of Earners in Drexel Hill
The median family income in Drexel Hill is $100,808, with families comprising 3+ earners (1,135) having the highest median family income of $172,621, while families with no earners (898) have the lowest median family income of $37,267, accounting for 14.6% and 11.6% of families, respectively.
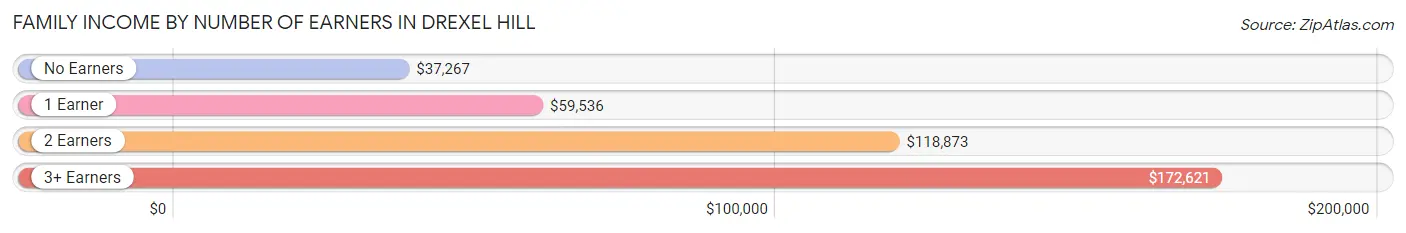
| Number of Earners | # Families | Median Income |
| No Earners | 898 (11.6%) | $37,267 |
| 1 Earner | 2,216 (28.5%) | $59,536 |
| 2 Earners | 3,517 (45.3%) | $118,873 |
| 3+ Earners | 1,135 (14.6%) | $172,621 |
| Total | 7,766 (100.0%) | $100,808 |
Household Income in Drexel Hill
Household Income Brackets in Drexel Hill
With 2,364 households falling in the category, the $100,000 to $149,999 income range is the most frequent in Drexel Hill, accounting for 19.7% of all households. In contrast, only 240 households (2.0%) fall into the $10,000 to $14,999 income bracket, making it the least populous group.
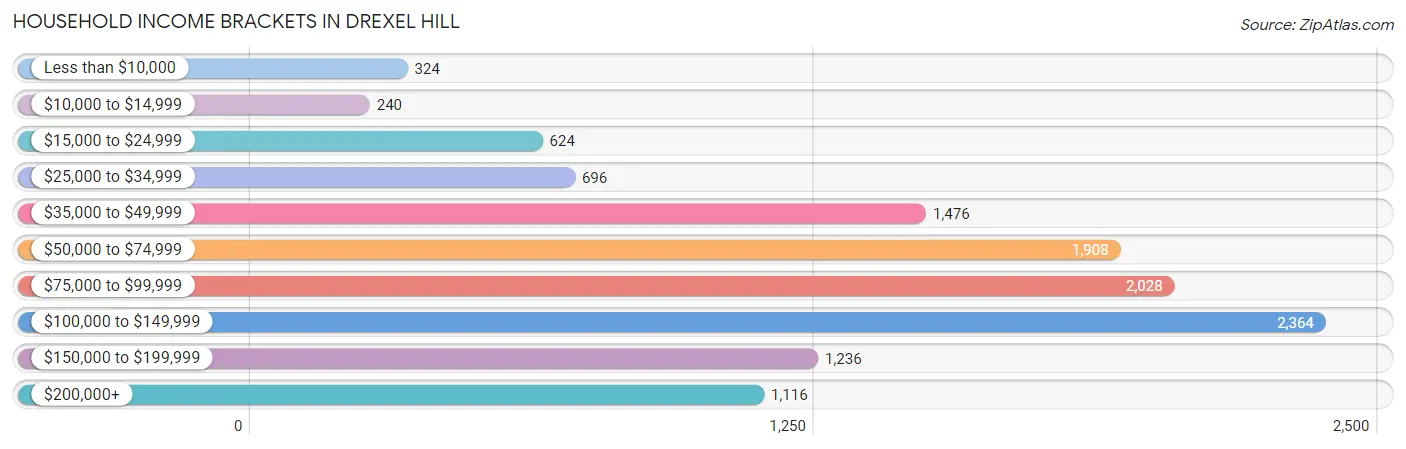
| Income Bracket | # Households | % Households |
| Less than $10,000 | 324 | 2.7% |
| $10,000 to $14,999 | 240 | 2.0% |
| $15,000 to $24,999 | 624 | 5.2% |
| $25,000 to $34,999 | 696 | 5.8% |
| $35,000 to $49,999 | 1,476 | 12.3% |
| $50,000 to $74,999 | 1,908 | 15.9% |
| $75,000 to $99,999 | 2,028 | 16.9% |
| $100,000 to $149,999 | 2,364 | 19.7% |
| $150,000 to $199,999 | 1,236 | 10.3% |
| $200,000+ | 1,116 | 9.3% |
Household Income by Householder Age in Drexel Hill
The median household income in Drexel Hill is $82,777, with the highest median household income of $99,984 found in the 45 to 64 years age bracket for the primary householder. A total of 4,151 households (34.6%) fall into this category. Meanwhile, the 15 to 24 years age bracket for the primary householder has the lowest median household income of $45,481, with 274 households (2.3%) in this group.
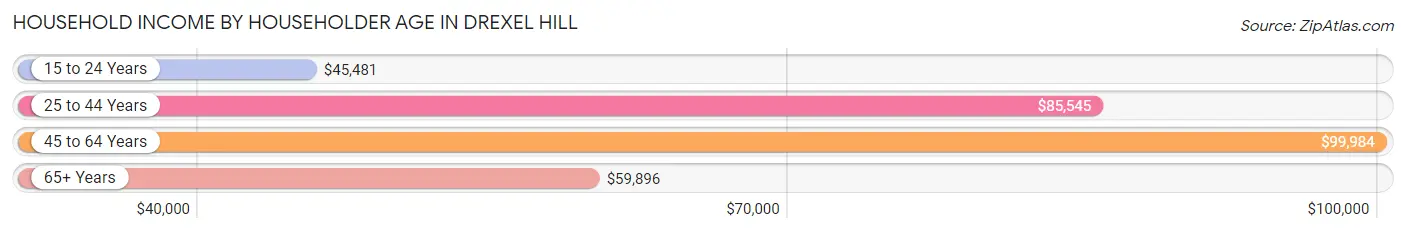
| Income Bracket | # Households | Median Income |
| 15 to 24 Years | 274 (2.3%) | $45,481 |
| 25 to 44 Years | 4,448 (37.1%) | $85,545 |
| 45 to 64 Years | 4,151 (34.6%) | $99,984 |
| 65+ Years | 3,126 (26.1%) | $59,896 |
| Total | 11,999 (100.0%) | $82,777 |
Poverty in Drexel Hill
Income Below Poverty by Sex and Age in Drexel Hill
With 7.5% poverty level for males and 9.0% for females among the residents of Drexel Hill, 12 to 14 year old males and 18 to 24 year old females are the most vulnerable to poverty, with 86 males (19.5%) and 338 females (26.5%) in their respective age groups living below the poverty level.
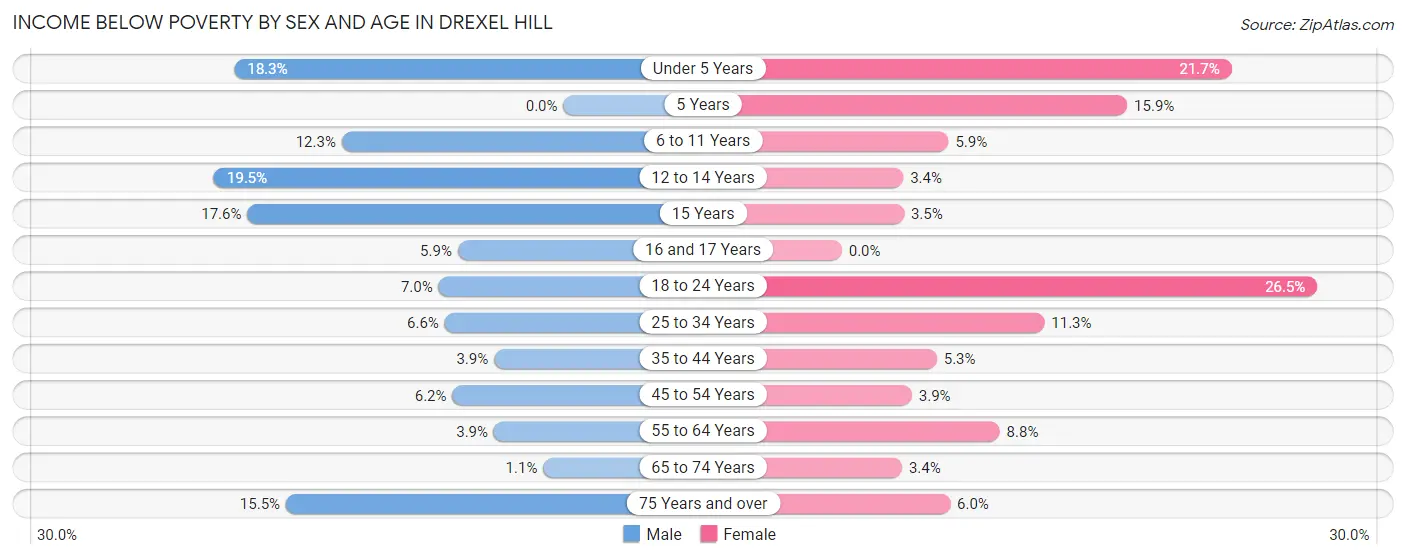
| Age Bracket | Male | Female |
| Under 5 Years | 194 (18.3%) | 151 (21.7%) |
| 5 Years | 0 (0.0%) | 17 (15.9%) |
| 6 to 11 Years | 119 (12.3%) | 53 (5.9%) |
| 12 to 14 Years | 86 (19.5%) | 16 (3.4%) |
| 15 Years | 47 (17.6%) | 8 (3.5%) |
| 16 and 17 Years | 11 (5.9%) | 0 (0.0%) |
| 18 to 24 Years | 83 (7.0%) | 338 (26.5%) |
| 25 to 34 Years | 156 (6.6%) | 297 (11.3%) |
| 35 to 44 Years | 80 (3.9%) | 109 (5.3%) |
| 45 to 54 Years | 102 (6.2%) | 62 (3.9%) |
| 55 to 64 Years | 64 (3.9%) | 186 (8.8%) |
| 65 to 74 Years | 17 (1.1%) | 58 (3.4%) |
| 75 Years and over | 95 (15.4%) | 57 (6.0%) |
| Total | 1,054 (7.5%) | 1,352 (9.0%) |
Income Above Poverty by Sex and Age in Drexel Hill
According to the poverty statistics in Drexel Hill, males aged 5 years and females aged 16 and 17 years are the age groups that are most secure financially, with 100.0% of males and 100.0% of females in these age groups living above the poverty line.
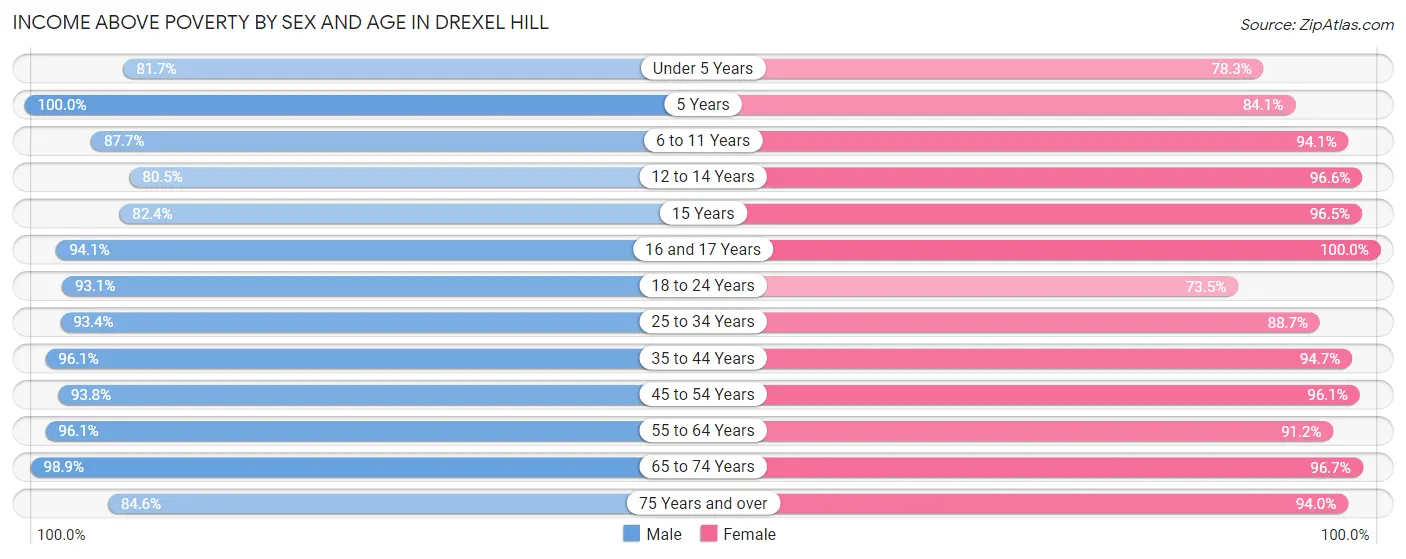
| Age Bracket | Male | Female |
| Under 5 Years | 865 (81.7%) | 545 (78.3%) |
| 5 Years | 116 (100.0%) | 90 (84.1%) |
| 6 to 11 Years | 845 (87.7%) | 839 (94.1%) |
| 12 to 14 Years | 356 (80.5%) | 452 (96.6%) |
| 15 Years | 220 (82.4%) | 223 (96.5%) |
| 16 and 17 Years | 176 (94.1%) | 319 (100.0%) |
| 18 to 24 Years | 1,112 (93.0%) | 939 (73.5%) |
| 25 to 34 Years | 2,203 (93.4%) | 2,336 (88.7%) |
| 35 to 44 Years | 1,991 (96.1%) | 1,950 (94.7%) |
| 45 to 54 Years | 1,549 (93.8%) | 1,527 (96.1%) |
| 55 to 64 Years | 1,588 (96.1%) | 1,929 (91.2%) |
| 65 to 74 Years | 1,499 (98.9%) | 1,672 (96.7%) |
| 75 Years and over | 520 (84.6%) | 888 (94.0%) |
| Total | 13,040 (92.5%) | 13,709 (91.0%) |
Income Below Poverty Among Married-Couple Families in Drexel Hill
The poverty statistics for married-couple families in Drexel Hill show that 2.6% or 143 of the total 5,416 families live below the poverty line. Families with 1 or 2 children have the highest poverty rate of 3.1%, comprising of 58 families. On the other hand, families with 3 or 4 children have the lowest poverty rate of 0.0%, which includes 0 families.
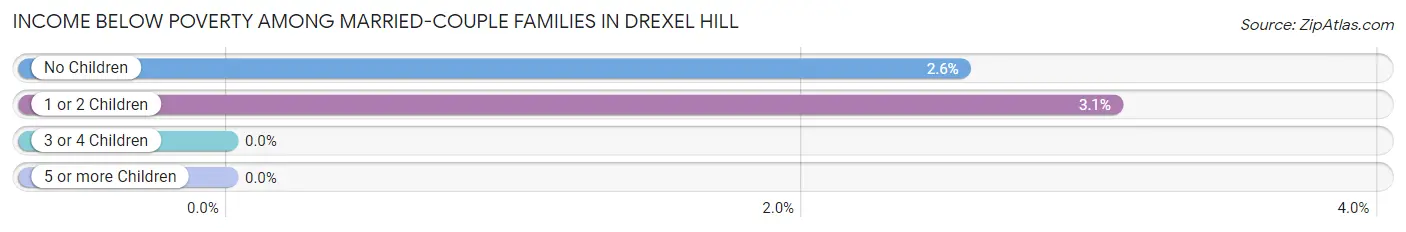
| Children | Above Poverty | Below Poverty |
| No Children | 3,247 (97.5%) | 85 (2.5%) |
| 1 or 2 Children | 1,827 (96.9%) | 58 (3.1%) |
| 3 or 4 Children | 161 (100.0%) | 0 (0.0%) |
| 5 or more Children | 38 (100.0%) | 0 (0.0%) |
| Total | 5,273 (97.4%) | 143 (2.6%) |
Income Below Poverty Among Single-Parent Households in Drexel Hill
According to the poverty data in Drexel Hill, 2.2% or 13 single-father households and 21.6% or 381 single-mother households are living below the poverty line. Among single-father households, those with no children have the highest poverty rate, with 13 households (4.8%) experiencing poverty. Likewise, among single-mother households, those with 3 or 4 children have the highest poverty rate, with 42 households (42.4%) falling below the poverty line.
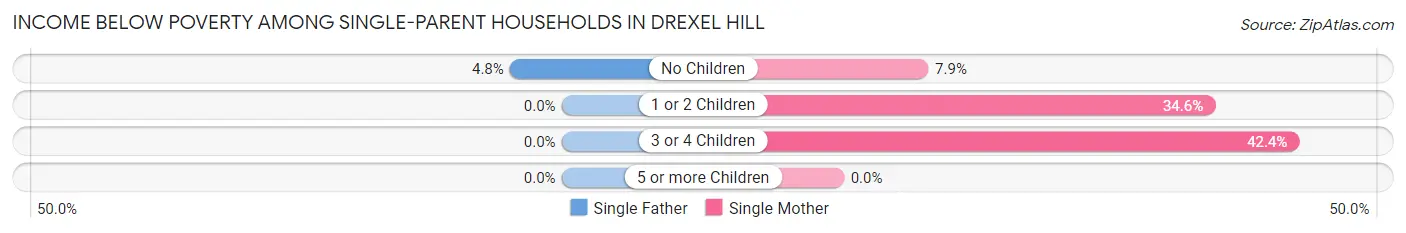
| Children | Single Father | Single Mother |
| No Children | 13 (4.8%) | 70 (7.9%) |
| 1 or 2 Children | 0 (0.0%) | 269 (34.6%) |
| 3 or 4 Children | 0 (0.0%) | 42 (42.4%) |
| 5 or more Children | 0 (0.0%) | 0 (0.0%) |
| Total | 13 (2.2%) | 381 (21.6%) |
Income Below Poverty Among Married-Couple vs Single-Parent Households in Drexel Hill
The poverty data for Drexel Hill shows that 143 of the married-couple family households (2.6%) and 394 of the single-parent households (16.8%) are living below the poverty level. Within the married-couple family households, those with 1 or 2 children have the highest poverty rate, with 58 households (3.1%) falling below the poverty line. Among the single-parent households, those with 3 or 4 children have the highest poverty rate, with 42 household (40.4%) living below poverty.
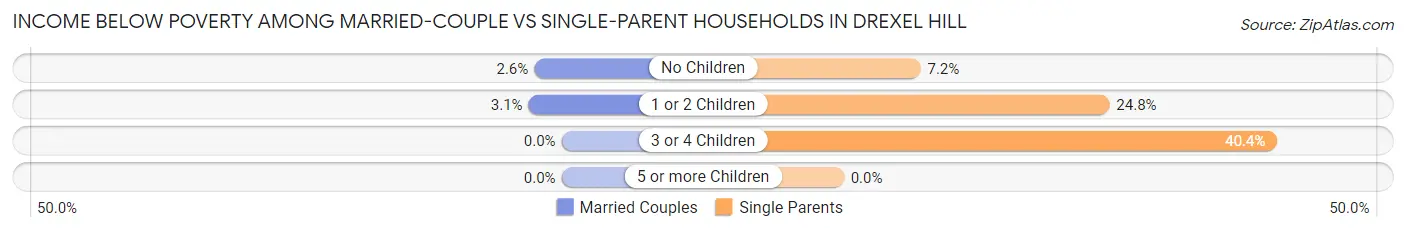
| Children | Married-Couple Families | Single-Parent Households |
| No Children | 85 (2.5%) | 83 (7.2%) |
| 1 or 2 Children | 58 (3.1%) | 269 (24.7%) |
| 3 or 4 Children | 0 (0.0%) | 42 (40.4%) |
| 5 or more Children | 0 (0.0%) | 0 (0.0%) |
| Total | 143 (2.6%) | 394 (16.8%) |
Race in Drexel Hill
The most populous races in Drexel Hill are White / Caucasian (19,667 | 67.3%), Black / African American (5,867 | 20.1%), and Two or more Races (1,843 | 6.3%).
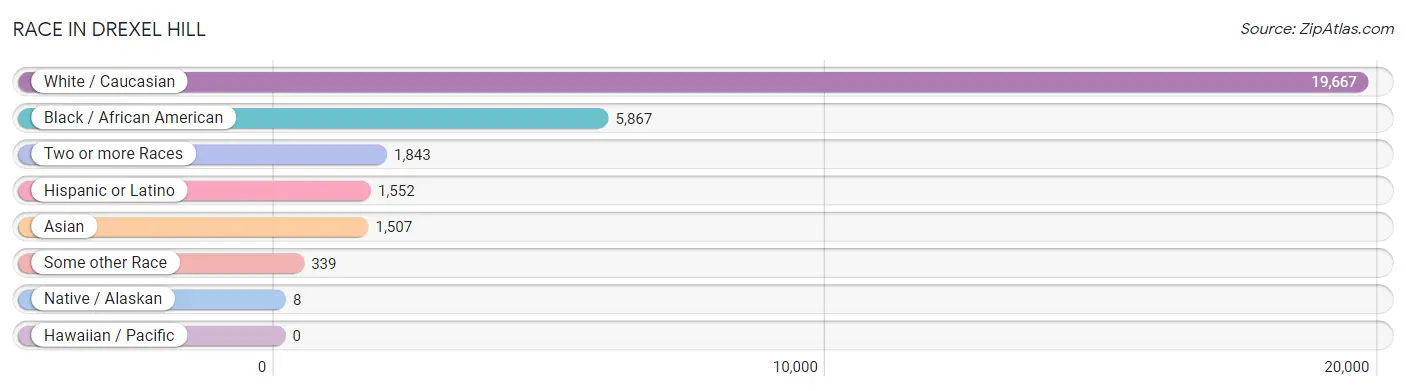
| Race | # Population | % Population |
| Asian | 1,507 | 5.2% |
| Black / African American | 5,867 | 20.1% |
| Hawaiian / Pacific | 0 | 0.0% |
| Hispanic or Latino | 1,552 | 5.3% |
| Native / Alaskan | 8 | 0.0% |
| White / Caucasian | 19,667 | 67.3% |
| Two or more Races | 1,843 | 6.3% |
| Some other Race | 339 | 1.2% |
| Total | 29,231 | 100.0% |
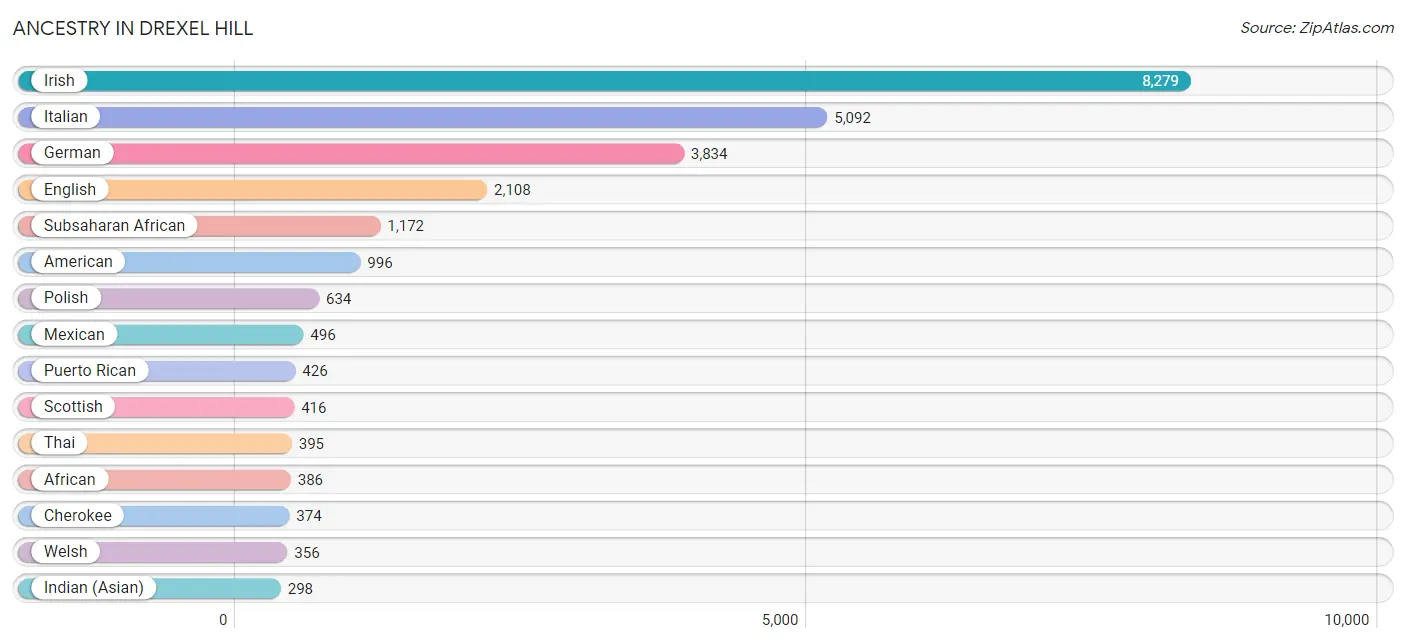
Ancestry in Drexel Hill
The most populous ancestries reported in Drexel Hill are Irish (8,279 | 28.3%), Italian (5,092 | 17.4%), German (3,834 | 13.1%), English (2,108 | 7.2%), and Subsaharan African (1,172 | 4.0%), together accounting for 70.1% of all Drexel Hill residents.
| Ancestry | # Population | % Population |
| Afghan | 12 | 0.0% |
| African | 386 | 1.3% |
| Albanian | 48 | 0.2% |
| American | 996 | 3.4% |
| Arab | 276 | 0.9% |
| Argentinean | 39 | 0.1% |
| Armenian | 199 | 0.7% |
| Austrian | 74 | 0.3% |
| Barbadian | 12 | 0.0% |
| Bhutanese | 183 | 0.6% |
| British | 153 | 0.5% |
| British West Indian | 23 | 0.1% |
| Burmese | 147 | 0.5% |
| Canadian | 28 | 0.1% |
| Central American | 130 | 0.4% |
| Cherokee | 374 | 1.3% |
| Choctaw | 10 | 0.0% |
| Colombian | 32 | 0.1% |
| Croatian | 7 | 0.0% |
| Cuban | 33 | 0.1% |
| Czech | 21 | 0.1% |
| Czechoslovakian | 32 | 0.1% |
| Danish | 106 | 0.4% |
| Delaware | 56 | 0.2% |
| Dominican | 37 | 0.1% |
| Dutch | 162 | 0.5% |
| Eastern European | 55 | 0.2% |
| Ecuadorian | 157 | 0.5% |
| Egyptian | 40 | 0.1% |
| English | 2,108 | 7.2% |
| European | 262 | 0.9% |
| Finnish | 19 | 0.1% |
| French | 202 | 0.7% |
| French Canadian | 38 | 0.1% |
| German | 3,834 | 13.1% |
| Ghanaian | 61 | 0.2% |
| Greek | 270 | 0.9% |
| Guatemalan | 13 | 0.0% |
| Haitian | 105 | 0.4% |
| Honduran | 28 | 0.1% |
| Hungarian | 75 | 0.3% |
| Indian (Asian) | 298 | 1.0% |
| Iranian | 42 | 0.1% |
| Irish | 8,279 | 28.3% |
| Italian | 5,092 | 17.4% |
| Jamaican | 204 | 0.7% |
| Japanese | 144 | 0.5% |
| Korean | 197 | 0.7% |
| Latvian | 9 | 0.0% |
| Lebanese | 71 | 0.2% |
| Liberian | 150 | 0.5% |
| Lithuanian | 78 | 0.3% |
| Macedonian | 10 | 0.0% |
| Mexican | 496 | 1.7% |
| Mexican American Indian | 8 | 0.0% |
| Moroccan | 116 | 0.4% |
| Native Hawaiian | 23 | 0.1% |
| Nicaraguan | 18 | 0.1% |
| Nigerian | 160 | 0.5% |
| Northern European | 14 | 0.1% |
| Norwegian | 92 | 0.3% |
| Pakistani | 36 | 0.1% |
| Panamanian | 45 | 0.2% |
| Pennsylvania German | 278 | 0.9% |
| Peruvian | 17 | 0.1% |
| Polish | 634 | 2.2% |
| Portuguese | 37 | 0.1% |
| Puerto Rican | 426 | 1.5% |
| Romanian | 78 | 0.3% |
| Russian | 143 | 0.5% |
| Salvadoran | 26 | 0.1% |
| Scandinavian | 26 | 0.1% |
| Scotch-Irish | 276 | 0.9% |
| Scottish | 416 | 1.4% |
| Senegalese | 35 | 0.1% |
| Serbian | 62 | 0.2% |
| Sierra Leonean | 138 | 0.5% |
| Slavic | 10 | 0.0% |
| Slovak | 99 | 0.3% |
| South American | 292 | 1.0% |
| Spaniard | 56 | 0.2% |
| Sri Lankan | 289 | 1.0% |
| Subsaharan African | 1,172 | 4.0% |
| Swedish | 127 | 0.4% |
| Swiss | 61 | 0.2% |
| Syrian | 49 | 0.2% |
| Thai | 395 | 1.3% |
| Trinidadian and Tobagonian | 29 | 0.1% |
| Turkish | 15 | 0.1% |
| Ugandan | 11 | 0.0% |
| Ukrainian | 201 | 0.7% |
| Venezuelan | 47 | 0.2% |
| Vietnamese | 17 | 0.1% |
| Welsh | 356 | 1.2% |
| West Indian | 41 | 0.1% | View All 95 Rows |
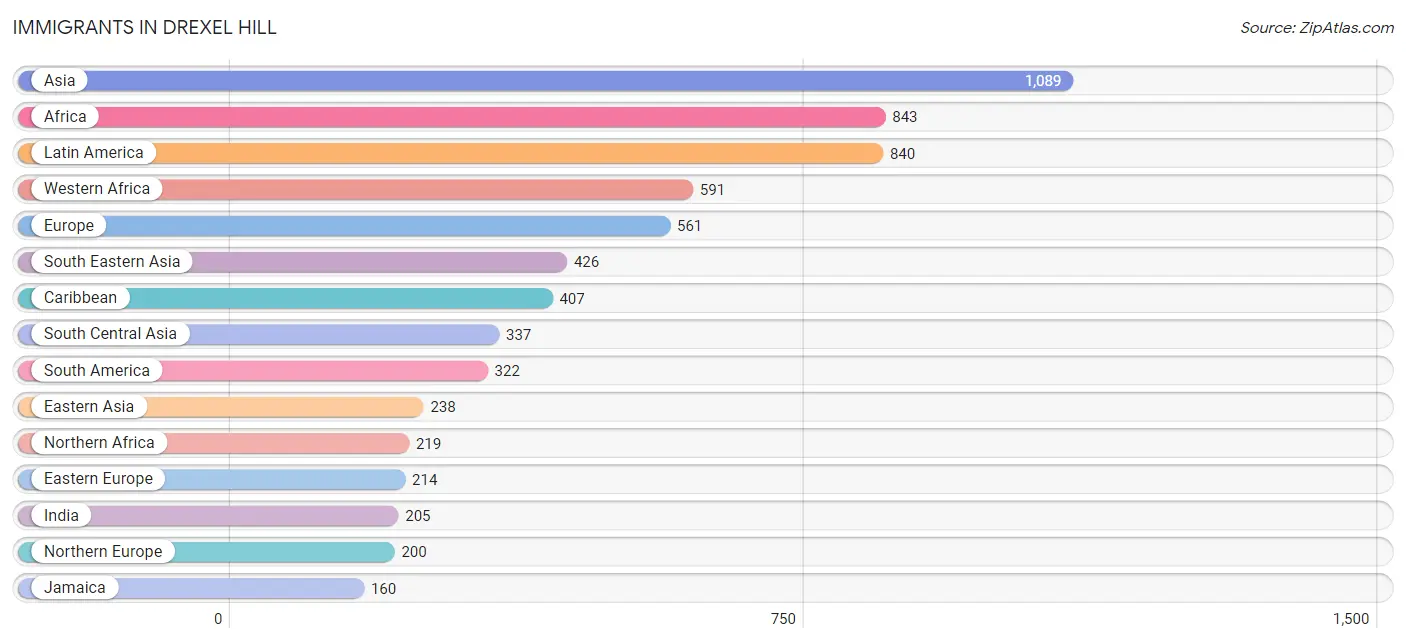
Immigrants in Drexel Hill
The most numerous immigrant groups reported in Drexel Hill came from Asia (1,089 | 3.7%), Africa (843 | 2.9%), Latin America (840 | 2.9%), Western Africa (591 | 2.0%), and Europe (561 | 1.9%), together accounting for 13.4% of all Drexel Hill residents.
| Immigration Origin | # Population | % Population |
| Afghanistan | 23 | 0.1% |
| Africa | 843 | 2.9% |
| Albania | 48 | 0.2% |
| Argentina | 21 | 0.1% |
| Asia | 1,089 | 3.7% |
| Brazil | 4 | 0.0% |
| Cambodia | 32 | 0.1% |
| Caribbean | 407 | 1.4% |
| Central America | 111 | 0.4% |
| China | 126 | 0.4% |
| Colombia | 46 | 0.2% |
| Croatia | 71 | 0.2% |
| Cuba | 18 | 0.1% |
| Dominican Republic | 42 | 0.1% |
| Eastern Africa | 11 | 0.0% |
| Eastern Asia | 238 | 0.8% |
| Eastern Europe | 214 | 0.7% |
| Ecuador | 112 | 0.4% |
| Egypt | 40 | 0.1% |
| England | 8 | 0.0% |
| Europe | 561 | 1.9% |
| Ghana | 49 | 0.2% |
| Greece | 76 | 0.3% |
| Guyana | 12 | 0.0% |
| Haiti | 61 | 0.2% |
| Honduras | 19 | 0.1% |
| India | 205 | 0.7% |
| Iran | 18 | 0.1% |
| Ireland | 33 | 0.1% |
| Israel | 16 | 0.1% |
| Italy | 58 | 0.2% |
| Jamaica | 160 | 0.5% |
| Japan | 17 | 0.1% |
| Korea | 95 | 0.3% |
| Laos | 19 | 0.1% |
| Latin America | 840 | 2.9% |
| Lebanon | 22 | 0.1% |
| Liberia | 120 | 0.4% |
| Mexico | 57 | 0.2% |
| Morocco | 106 | 0.4% |
| Nicaragua | 10 | 0.0% |
| Nigeria | 94 | 0.3% |
| Northern Africa | 219 | 0.7% |
| Northern Europe | 200 | 0.7% |
| Pakistan | 71 | 0.2% |
| Panama | 25 | 0.1% |
| Peru | 17 | 0.1% |
| Philippines | 148 | 0.5% |
| Poland | 2 | 0.0% |
| Romania | 42 | 0.1% |
| Scotland | 84 | 0.3% |
| Senegal | 18 | 0.1% |
| Sierra Leone | 148 | 0.5% |
| South America | 322 | 1.1% |
| South Central Asia | 337 | 1.1% |
| South Eastern Asia | 426 | 1.5% |
| Southern Europe | 147 | 0.5% |
| Spain | 13 | 0.0% |
| Sri Lanka | 20 | 0.1% |
| St. Vincent and the Grenadines | 7 | 0.0% |
| Sudan | 73 | 0.3% |
| Syria | 42 | 0.1% |
| Taiwan | 10 | 0.0% |
| Thailand | 67 | 0.2% |
| Trinidad and Tobago | 119 | 0.4% |
| Uganda | 11 | 0.0% |
| Ukraine | 41 | 0.1% |
| Venezuela | 110 | 0.4% |
| Vietnam | 160 | 0.5% |
| Western Africa | 591 | 2.0% |
| Western Asia | 88 | 0.3% | View All 71 Rows |
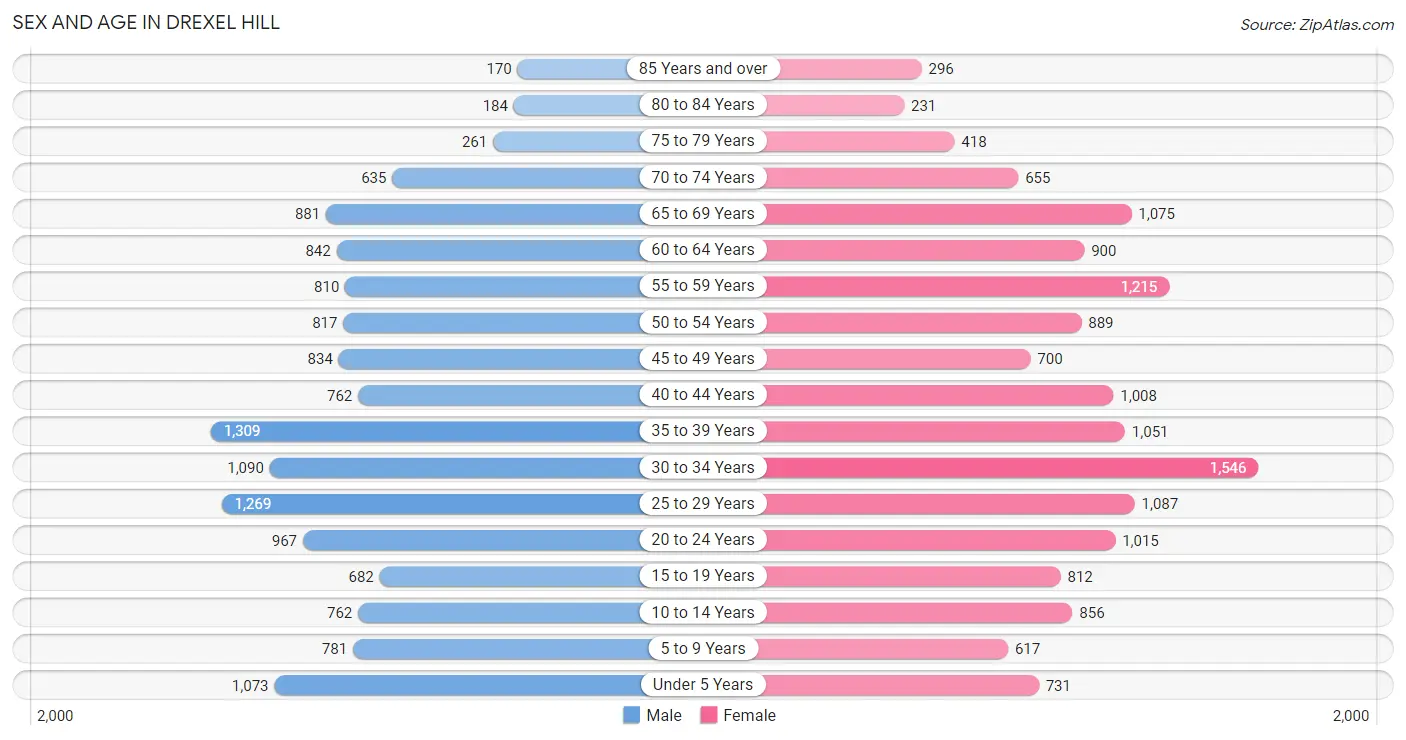
Sex and Age in Drexel Hill
Sex and Age in Drexel Hill
The most populous age groups in Drexel Hill are 35 to 39 Years (1,309 | 9.3%) for men and 30 to 34 Years (1,546 | 10.2%) for women.
| Age Bracket | Male | Female |
| Under 5 Years | 1,073 (7.6%) | 731 (4.8%) |
| 5 to 9 Years | 781 (5.5%) | 617 (4.1%) |
| 10 to 14 Years | 762 (5.4%) | 856 (5.7%) |
| 15 to 19 Years | 682 (4.8%) | 812 (5.4%) |
| 20 to 24 Years | 967 (6.8%) | 1,015 (6.7%) |
| 25 to 29 Years | 1,269 (9.0%) | 1,087 (7.2%) |
| 30 to 34 Years | 1,090 (7.7%) | 1,546 (10.2%) |
| 35 to 39 Years | 1,309 (9.3%) | 1,051 (7.0%) |
| 40 to 44 Years | 762 (5.4%) | 1,008 (6.7%) |
| 45 to 49 Years | 834 (5.9%) | 700 (4.6%) |
| 50 to 54 Years | 817 (5.8%) | 889 (5.9%) |
| 55 to 59 Years | 810 (5.7%) | 1,215 (8.1%) |
| 60 to 64 Years | 842 (6.0%) | 900 (6.0%) |
| 65 to 69 Years | 881 (6.2%) | 1,075 (7.1%) |
| 70 to 74 Years | 635 (4.5%) | 655 (4.3%) |
| 75 to 79 Years | 261 (1.8%) | 418 (2.8%) |
| 80 to 84 Years | 184 (1.3%) | 231 (1.5%) |
| 85 Years and over | 170 (1.2%) | 296 (2.0%) |
| Total | 14,129 (100.0%) | 15,102 (100.0%) |
Families and Households in Drexel Hill
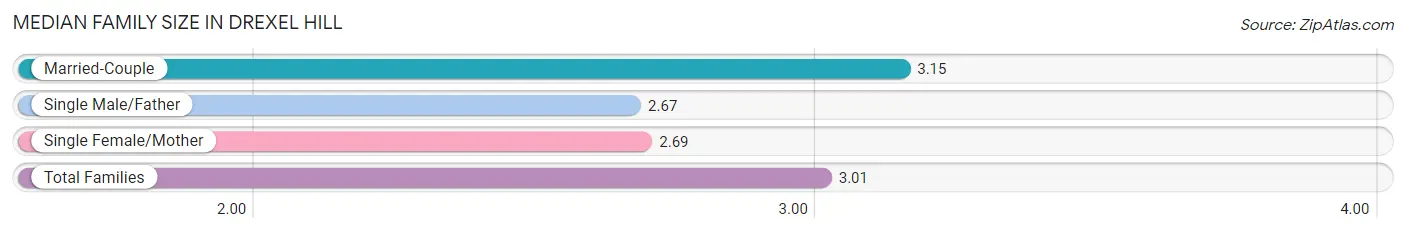
Median Family Size in Drexel Hill
The median family size in Drexel Hill is 3.01 persons per family, with married-couple families (5,416 | 69.7%) accounting for the largest median family size of 3.15 persons per family. On the other hand, single male/father families (583 | 7.5%) represent the smallest median family size with 2.67 persons per family.
| Family Type | # Families | Family Size |
| Married-Couple | 5,416 (69.7%) | 3.15 |
| Single Male/Father | 583 (7.5%) | 2.67 |
| Single Female/Mother | 1,767 (22.8%) | 2.69 |
| Total Families | 7,766 (100.0%) | 3.01 |
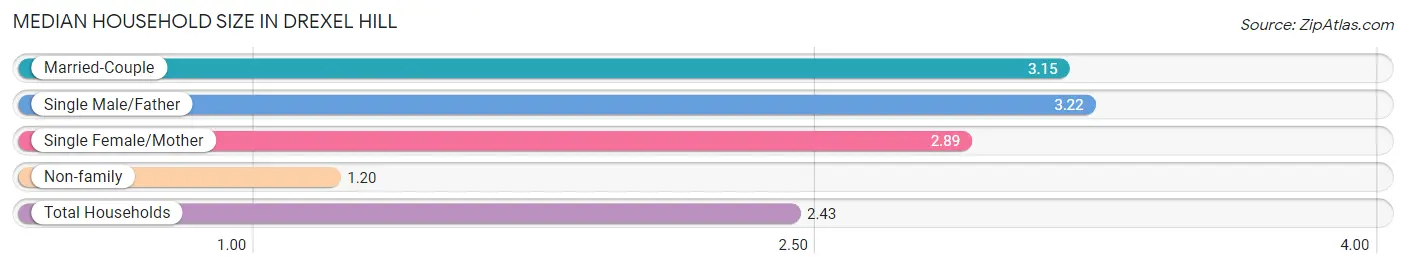
Median Household Size in Drexel Hill
The median household size in Drexel Hill is 2.43 persons per household, with single male/father households (583 | 4.9%) accounting for the largest median household size of 3.22 persons per household. non-family households (4,233 | 35.3%) represent the smallest median household size with 1.20 persons per household.
| Household Type | # Households | Household Size |
| Married-Couple | 5,416 (45.1%) | 3.15 |
| Single Male/Father | 583 (4.9%) | 3.22 |
| Single Female/Mother | 1,767 (14.7%) | 2.89 |
| Non-family | 4,233 (35.3%) | 1.20 |
| Total Households | 11,999 (100.0%) | 2.43 |
Household Size by Marriage Status in Drexel Hill
Out of a total of 11,999 households in Drexel Hill, 7,766 (64.7%) are family households, while 4,233 (35.3%) are nonfamily households. The most numerous type of family households are 2-person households, comprising 3,484, and the most common type of nonfamily households are 1-person households, comprising 3,431.
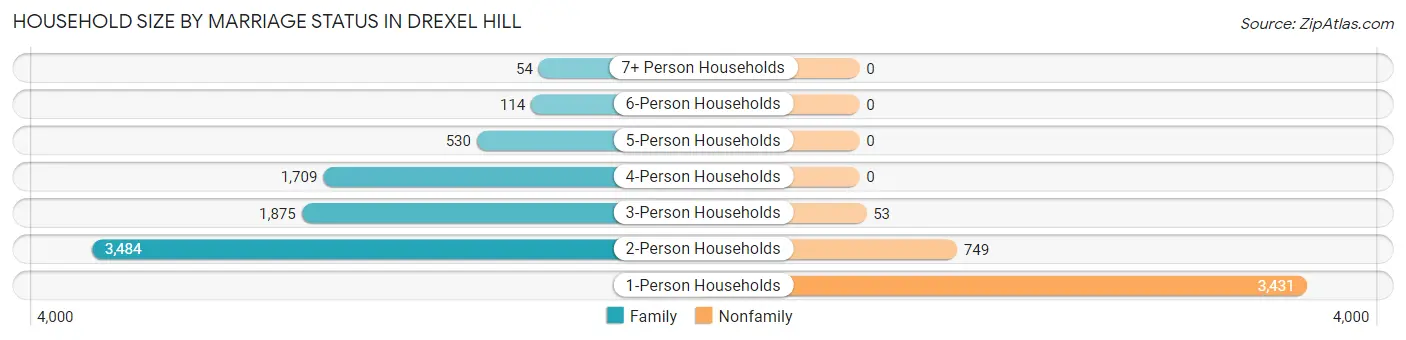
| Household Size | Family Households | Nonfamily Households |
| 1-Person Households | - | 3,431 (28.6%) |
| 2-Person Households | 3,484 (29.0%) | 749 (6.2%) |
| 3-Person Households | 1,875 (15.6%) | 53 (0.4%) |
| 4-Person Households | 1,709 (14.2%) | 0 (0.0%) |
| 5-Person Households | 530 (4.4%) | 0 (0.0%) |
| 6-Person Households | 114 (0.9%) | 0 (0.0%) |
| 7+ Person Households | 54 (0.4%) | 0 (0.0%) |
| Total | 7,766 (64.7%) | 4,233 (35.3%) |
Female Fertility in Drexel Hill
Fertility by Age in Drexel Hill
Average fertility rate in Drexel Hill is 84.0 births per 1,000 women. Women in the age bracket of 20 to 34 years have the highest fertility rate with 132.0 births per 1,000 women. Women in the age bracket of 20 to 34 years acount for 75.5% of all women with births.
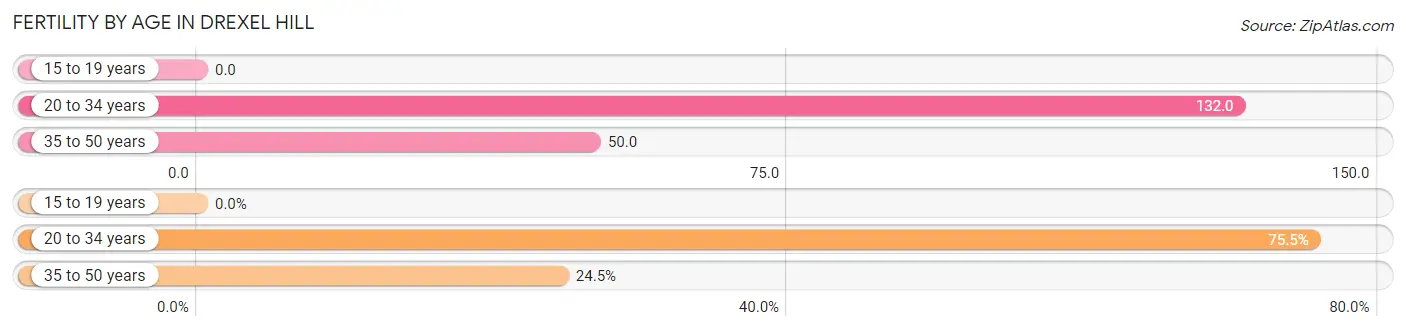
| Age Bracket | Women with Births | Births / 1,000 Women |
| 15 to 19 years | 0 (0.0%) | 0.0 |
| 20 to 34 years | 481 (75.5%) | 132.0 |
| 35 to 50 years | 156 (24.5%) | 50.0 |
| Total | 637 (100.0%) | 84.0 |
Fertility by Age by Marriage Status in Drexel Hill
27.6% of women with births (637) in Drexel Hill are married. The highest percentage of unmarried women with births falls into 20 to 34 years age bracket with 75.7% of them unmarried at the time of birth, while the lowest percentage of unmarried women with births belong to 35 to 50 years age bracket with 62.2% of them unmarried.
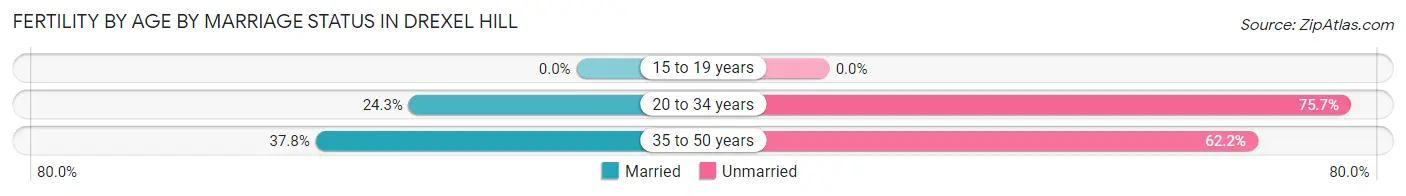
| Age Bracket | Married | Unmarried |
| 15 to 19 years | 0 (0.0%) | 0 (0.0%) |
| 20 to 34 years | 117 (24.3%) | 364 (75.7%) |
| 35 to 50 years | 59 (37.8%) | 97 (62.2%) |
| Total | 176 (27.6%) | 461 (72.4%) |
Fertility by Education in Drexel Hill
Average fertility rate in Drexel Hill is 84.0 births per 1,000 women. Women with the education attainment of graduate degree have the highest fertility rate of 183.0 births per 1,000 women, while women with the education attainment of less than high school have the lowest fertility at 11.0 births per 1,000 women. Women with the education attainment of graduate degree represent 36.3% of all women with births.
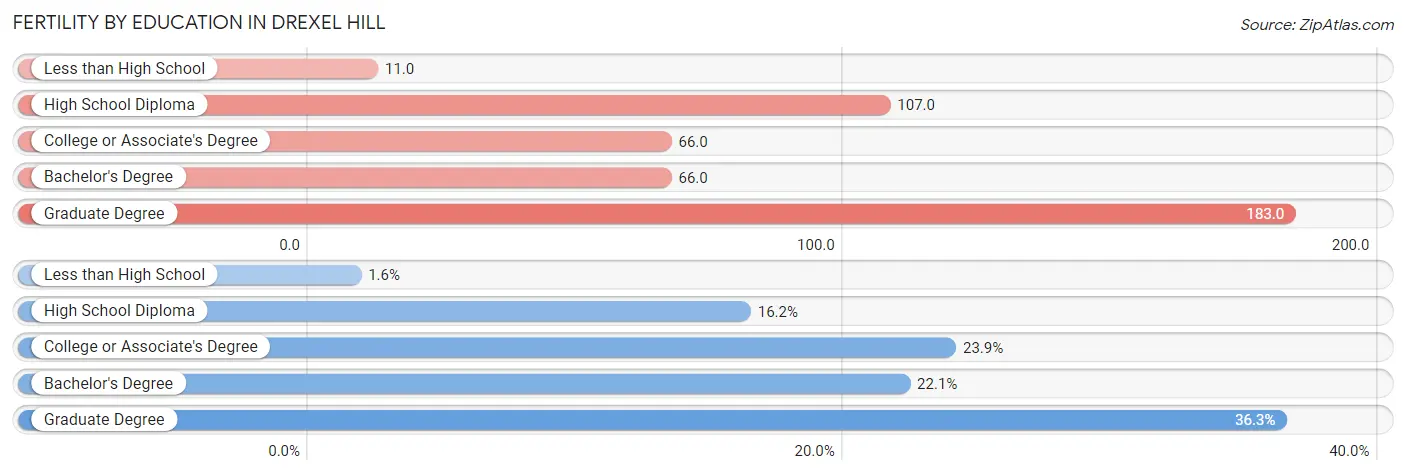
| Educational Attainment | Women with Births | Births / 1,000 Women |
| Less than High School | 10 (1.6%) | 11.0 |
| High School Diploma | 103 (16.2%) | 107.0 |
| College or Associate's Degree | 152 (23.9%) | 66.0 |
| Bachelor's Degree | 141 (22.1%) | 66.0 |
| Graduate Degree | 231 (36.3%) | 183.0 |
| Total | 637 (100.0%) | 84.0 |
Fertility by Education by Marriage Status in Drexel Hill
72.4% of women with births in Drexel Hill are unmarried. Women with the educational attainment of bachelor's degree are most likely to be married with 58.9% of them married at childbirth, while women with the educational attainment of less than high school are least likely to be married with 100.0% of them unmarried at childbirth.
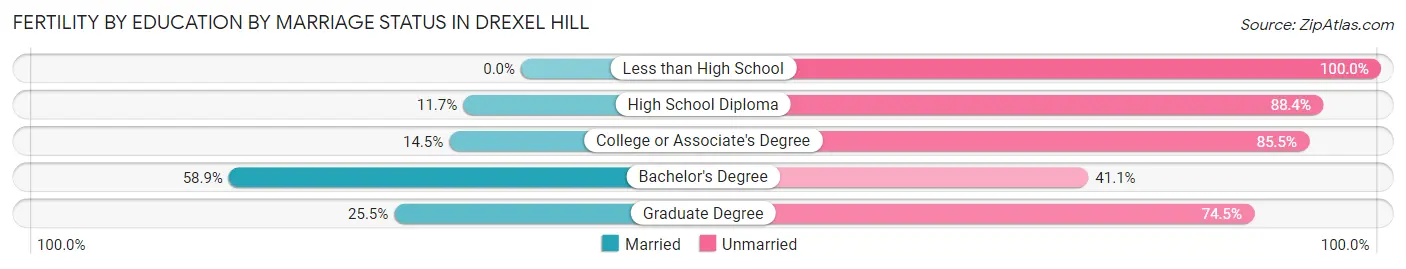
| Educational Attainment | Married | Unmarried |
| Less than High School | 0 (0.0%) | 10 (100.0%) |
| High School Diploma | 12 (11.7%) | 91 (88.3%) |
| College or Associate's Degree | 22 (14.5%) | 130 (85.5%) |
| Bachelor's Degree | 83 (58.9%) | 58 (41.1%) |
| Graduate Degree | 59 (25.5%) | 172 (74.5%) |
| Total | 176 (27.6%) | 461 (72.4%) |
Employment Characteristics in Drexel Hill
Employment by Class of Employer in Drexel Hill
Among the 15,790 employed individuals in Drexel Hill, private company employees (10,489 | 66.4%), not-for-profit organizations (2,044 | 12.9%), and local government employees (1,384 | 8.8%) make up the most common classes of employment.
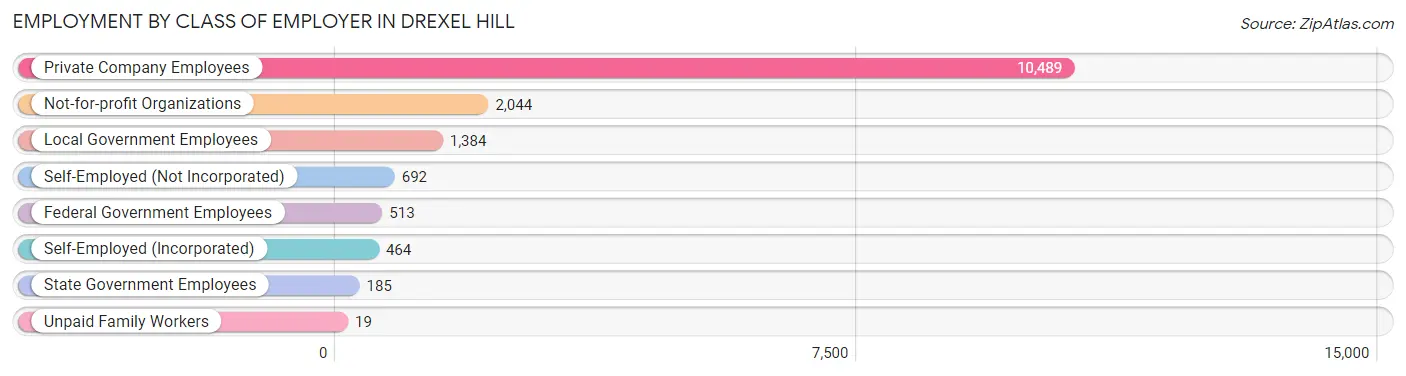
| Employer Class | # Employees | % Employees |
| Private Company Employees | 10,489 | 66.4% |
| Self-Employed (Incorporated) | 464 | 2.9% |
| Self-Employed (Not Incorporated) | 692 | 4.4% |
| Not-for-profit Organizations | 2,044 | 12.9% |
| Local Government Employees | 1,384 | 8.8% |
| State Government Employees | 185 | 1.2% |
| Federal Government Employees | 513 | 3.3% |
| Unpaid Family Workers | 19 | 0.1% |
| Total | 15,790 | 100.0% |
Employment Status by Age in Drexel Hill
According to the labor force statistics for Drexel Hill, out of the total population over 16 years of age (23,913), 73.8% or 17,648 individuals are in the labor force, with 8.7% or 1,535 of them unemployed. The age group with the highest labor force participation rate is 30 to 34 years, with 95.0% or 2,504 individuals in the labor force. Within the labor force, the 16 to 19 years age range has the highest percentage of unemployed individuals, with 36.1% or 139 of them being unemployed.
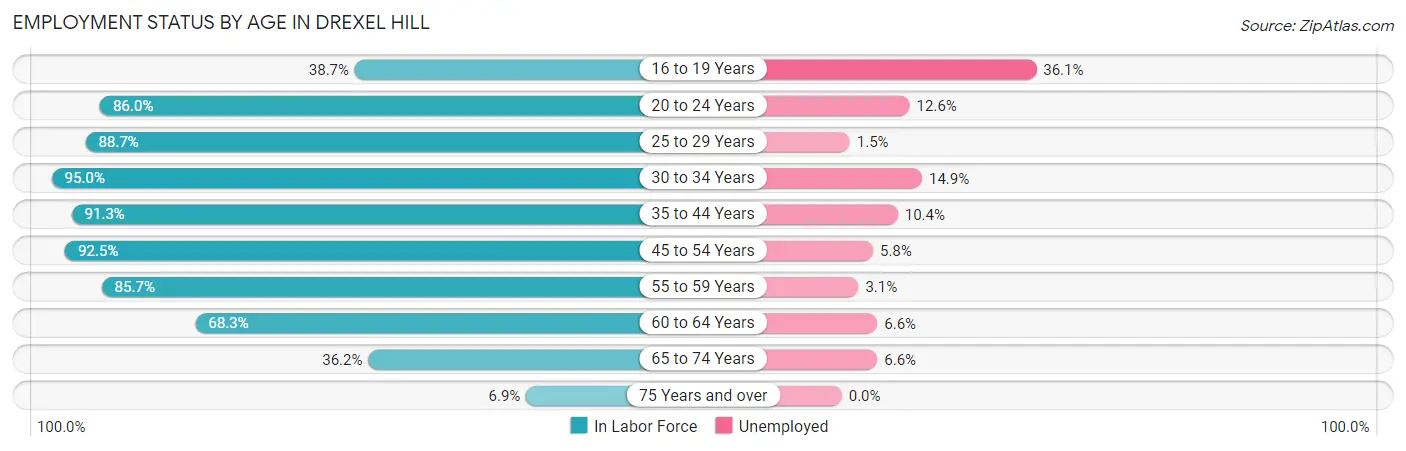
| Age Bracket | In Labor Force | Unemployed |
| 16 to 19 Years | 385 (38.7%) | 139 (36.1%) |
| 20 to 24 Years | 1,705 (86.0%) | 215 (12.6%) |
| 25 to 29 Years | 2,090 (88.7%) | 31 (1.5%) |
| 30 to 34 Years | 2,504 (95.0%) | 373 (14.9%) |
| 35 to 44 Years | 3,771 (91.3%) | 392 (10.4%) |
| 45 to 54 Years | 2,997 (92.5%) | 174 (5.8%) |
| 55 to 59 Years | 1,735 (85.7%) | 54 (3.1%) |
| 60 to 64 Years | 1,190 (68.3%) | 79 (6.6%) |
| 65 to 74 Years | 1,175 (36.2%) | 78 (6.6%) |
| 75 Years and over | 108 (6.9%) | 0 (0.0%) |
| Total | 17,648 (73.8%) | 1,535 (8.7%) |
Employment Status by Educational Attainment in Drexel Hill
According to labor force statistics for Drexel Hill, 88.6% of individuals (14,290) out of the total population between 25 and 64 years of age (16,129) are in the labor force, with 7.7% or 1,100 of them being unemployed. The group with the highest labor force participation rate are those with the educational attainment of bachelor's degree or higher, with 92.4% or 6,662 individuals in the labor force. Within the labor force, individuals with high school diploma education have the highest percentage of unemployment, with 16.1% or 396 of them being unemployed.
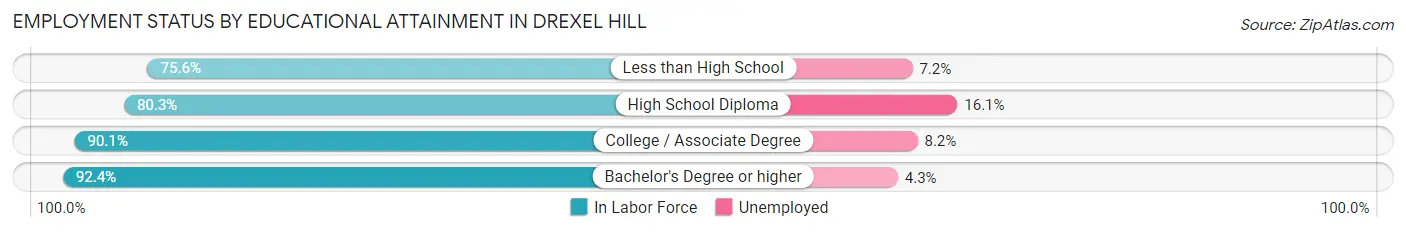
| Educational Attainment | In Labor Force | Unemployed |
| Less than High School | 580 (75.6%) | 55 (7.2%) |
| High School Diploma | 2,459 (80.3%) | 493 (16.1%) |
| College / Associate Degree | 4,586 (90.1%) | 417 (8.2%) |
| Bachelor's Degree or higher | 6,662 (92.4%) | 310 (4.3%) |
| Total | 14,290 (88.6%) | 1,242 (7.7%) |
Employment Occupations by Sex in Drexel Hill
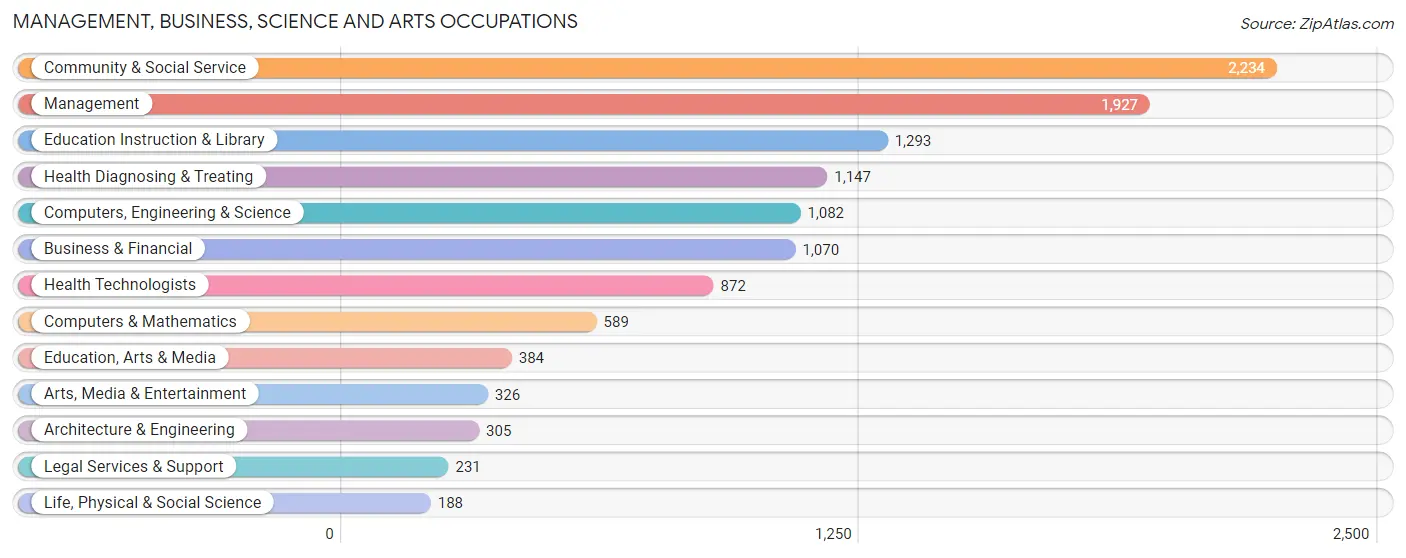
Management, Business, Science and Arts Occupations
The most common Management, Business, Science and Arts occupations in Drexel Hill are Community & Social Service (2,234 | 13.9%), Management (1,927 | 11.9%), Education Instruction & Library (1,293 | 8.0%), Health Diagnosing & Treating (1,147 | 7.1%), and Computers, Engineering & Science (1,082 | 6.7%).
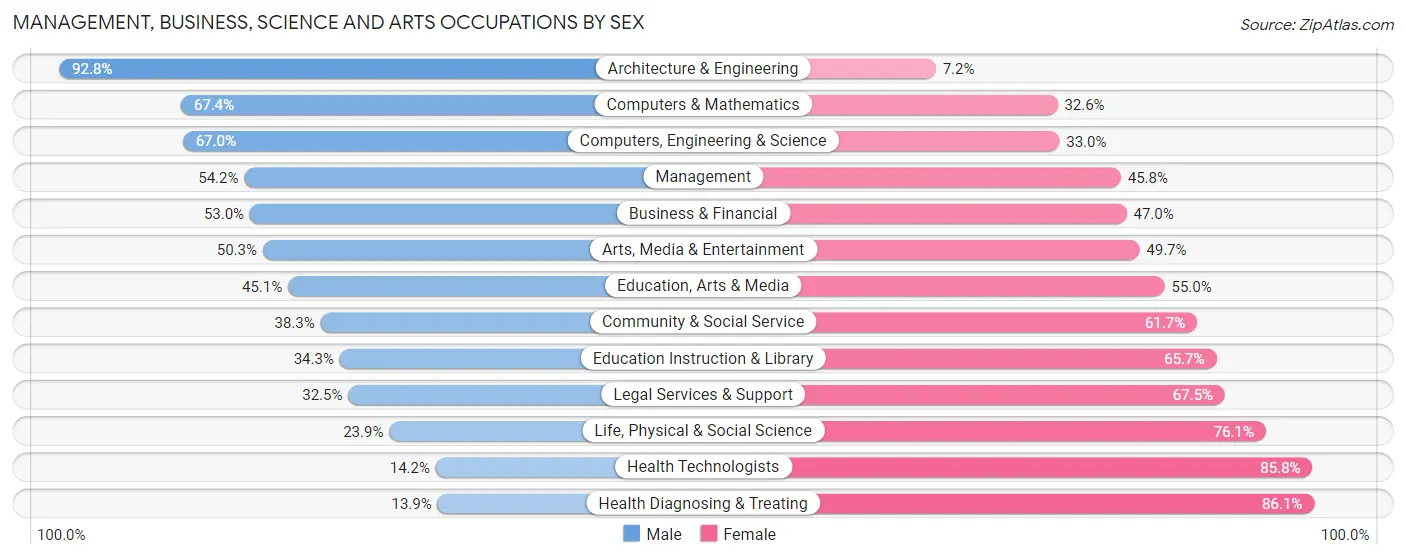
Management, Business, Science and Arts Occupations by Sex
Within the Management, Business, Science and Arts occupations in Drexel Hill, the most male-oriented occupations are Architecture & Engineering (92.8%), Computers & Mathematics (67.4%), and Computers, Engineering & Science (67.0%), while the most female-oriented occupations are Health Diagnosing & Treating (86.1%), Health Technologists (85.8%), and Life, Physical & Social Science (76.1%).
| Occupation | Male | Female |
| Management | 1,044 (54.2%) | 883 (45.8%) |
| Business & Financial | 567 (53.0%) | 503 (47.0%) |
| Computers, Engineering & Science | 725 (67.0%) | 357 (33.0%) |
| Computers & Mathematics | 397 (67.4%) | 192 (32.6%) |
| Architecture & Engineering | 283 (92.8%) | 22 (7.2%) |
| Life, Physical & Social Science | 45 (23.9%) | 143 (76.1%) |
| Community & Social Service | 855 (38.3%) | 1,379 (61.7%) |
| Education, Arts & Media | 173 (45.1%) | 211 (54.9%) |
| Legal Services & Support | 75 (32.5%) | 156 (67.5%) |
| Education Instruction & Library | 443 (34.3%) | 850 (65.7%) |
| Arts, Media & Entertainment | 164 (50.3%) | 162 (49.7%) |
| Health Diagnosing & Treating | 159 (13.9%) | 988 (86.1%) |
| Health Technologists | 124 (14.2%) | 748 (85.8%) |
| Total (Category) | 3,350 (44.9%) | 4,110 (55.1%) |
| Total (Overall) | 8,060 (50.0%) | 8,066 (50.0%) |
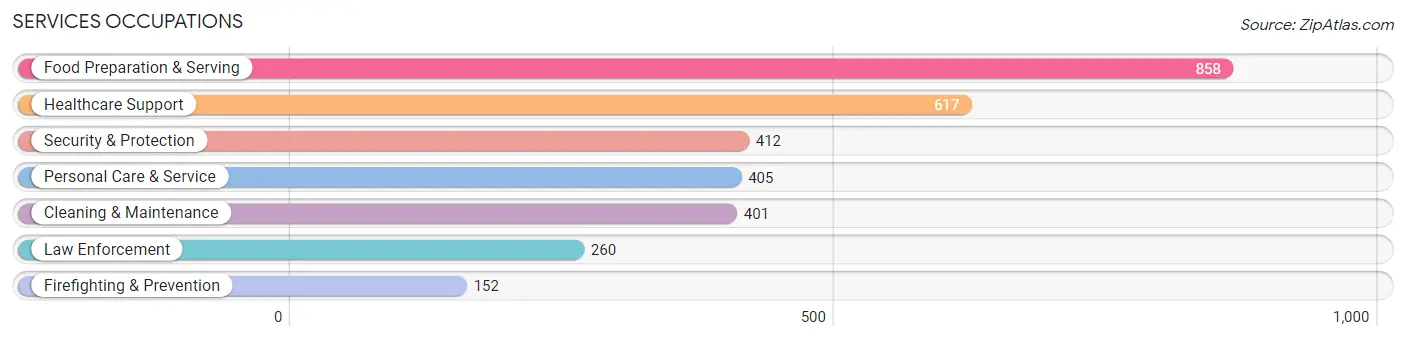
Services Occupations
The most common Services occupations in Drexel Hill are Food Preparation & Serving (858 | 5.3%), Healthcare Support (617 | 3.8%), Security & Protection (412 | 2.5%), Personal Care & Service (405 | 2.5%), and Cleaning & Maintenance (401 | 2.5%).
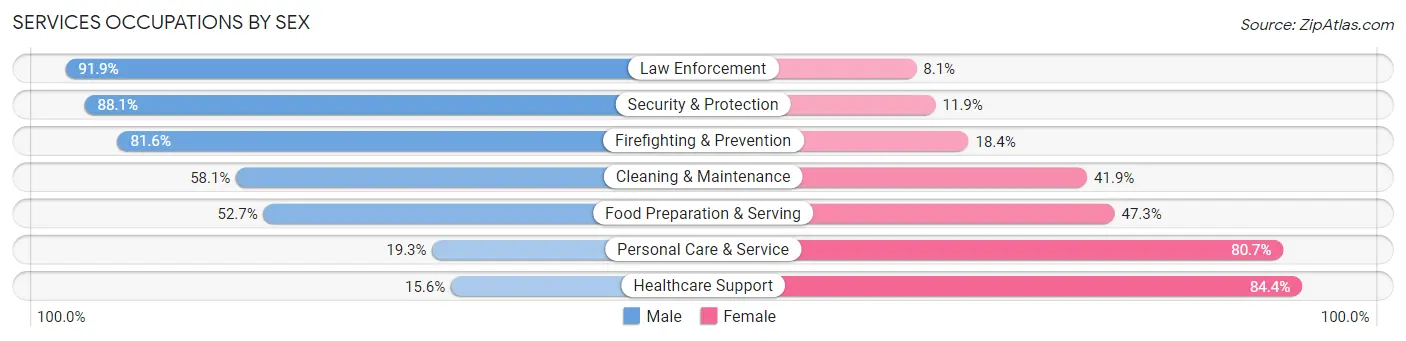
Services Occupations by Sex
Within the Services occupations in Drexel Hill, the most male-oriented occupations are Law Enforcement (91.9%), Security & Protection (88.1%), and Firefighting & Prevention (81.6%), while the most female-oriented occupations are Healthcare Support (84.4%), Personal Care & Service (80.7%), and Food Preparation & Serving (47.3%).
| Occupation | Male | Female |
| Healthcare Support | 96 (15.6%) | 521 (84.4%) |
| Security & Protection | 363 (88.1%) | 49 (11.9%) |
| Firefighting & Prevention | 124 (81.6%) | 28 (18.4%) |
| Law Enforcement | 239 (91.9%) | 21 (8.1%) |
| Food Preparation & Serving | 452 (52.7%) | 406 (47.3%) |
| Cleaning & Maintenance | 233 (58.1%) | 168 (41.9%) |
| Personal Care & Service | 78 (19.3%) | 327 (80.7%) |
| Total (Category) | 1,222 (45.4%) | 1,471 (54.6%) |
| Total (Overall) | 8,060 (50.0%) | 8,066 (50.0%) |
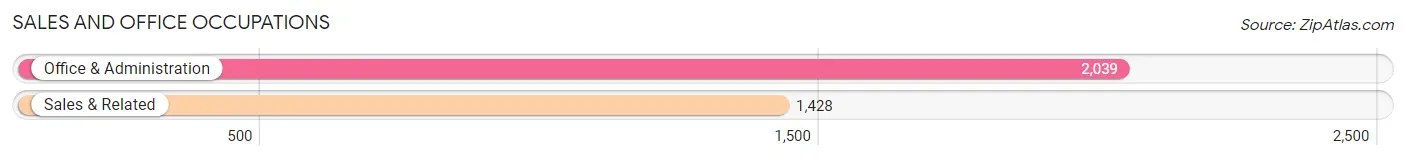
Sales and Office Occupations
The most common Sales and Office occupations in Drexel Hill are Office & Administration (2,039 | 12.6%), and Sales & Related (1,428 | 8.9%).
Sales and Office Occupations by Sex
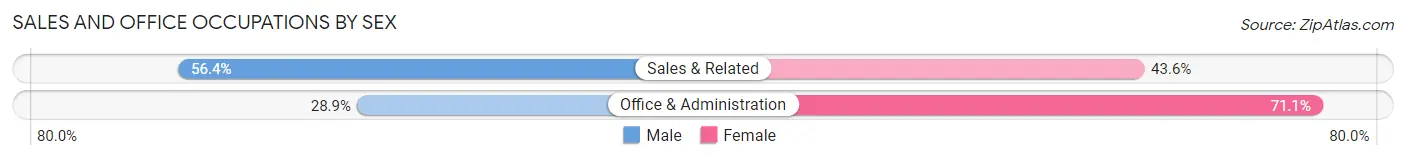
| Occupation | Male | Female |
| Sales & Related | 805 (56.4%) | 623 (43.6%) |
| Office & Administration | 589 (28.9%) | 1,450 (71.1%) |
| Total (Category) | 1,394 (40.2%) | 2,073 (59.8%) |
| Total (Overall) | 8,060 (50.0%) | 8,066 (50.0%) |
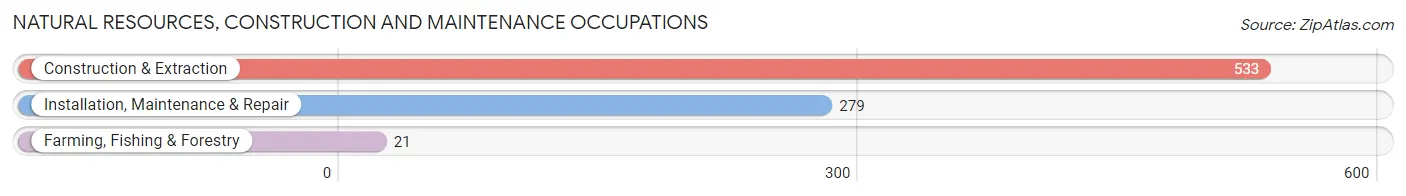
Natural Resources, Construction and Maintenance Occupations
The most common Natural Resources, Construction and Maintenance occupations in Drexel Hill are Construction & Extraction (533 | 3.3%), Installation, Maintenance & Repair (279 | 1.7%), and Farming, Fishing & Forestry (21 | 0.1%).
Natural Resources, Construction and Maintenance Occupations by Sex
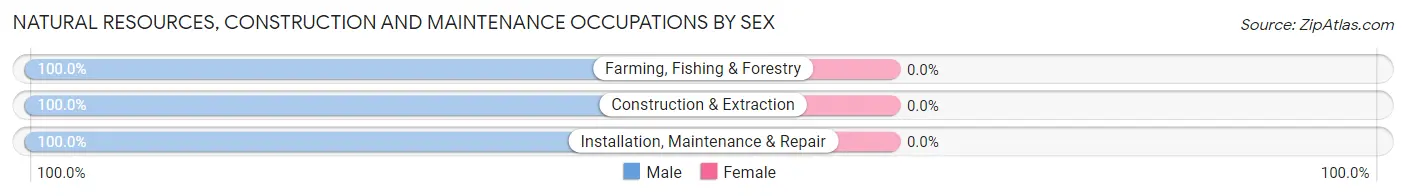
| Occupation | Male | Female |
| Farming, Fishing & Forestry | 21 (100.0%) | 0 (0.0%) |
| Construction & Extraction | 533 (100.0%) | 0 (0.0%) |
| Installation, Maintenance & Repair | 279 (100.0%) | 0 (0.0%) |
| Total (Category) | 833 (100.0%) | 0 (0.0%) |
| Total (Overall) | 8,060 (50.0%) | 8,066 (50.0%) |
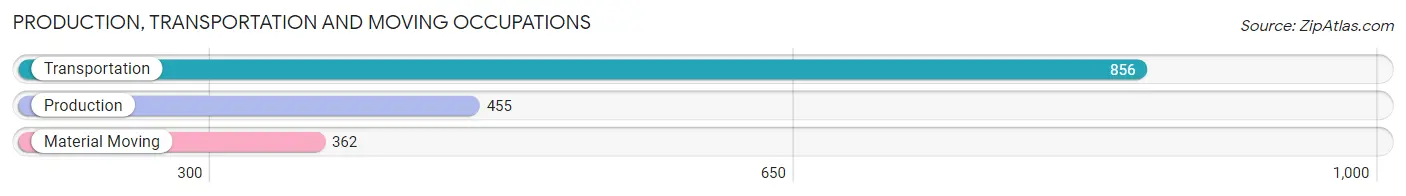
Production, Transportation and Moving Occupations
The most common Production, Transportation and Moving occupations in Drexel Hill are Transportation (856 | 5.3%), Production (455 | 2.8%), and Material Moving (362 | 2.2%).
Production, Transportation and Moving Occupations by Sex
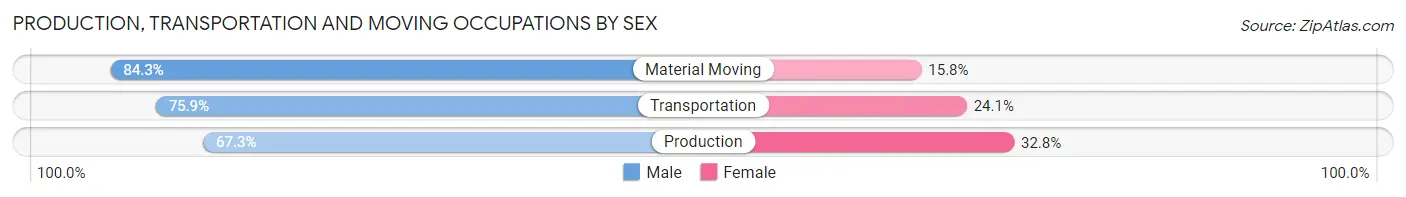
| Occupation | Male | Female |
| Production | 306 (67.2%) | 149 (32.8%) |
| Transportation | 650 (75.9%) | 206 (24.1%) |
| Material Moving | 305 (84.3%) | 57 (15.8%) |
| Total (Category) | 1,261 (75.4%) | 412 (24.6%) |
| Total (Overall) | 8,060 (50.0%) | 8,066 (50.0%) |
Employment Industries by Sex in Drexel Hill
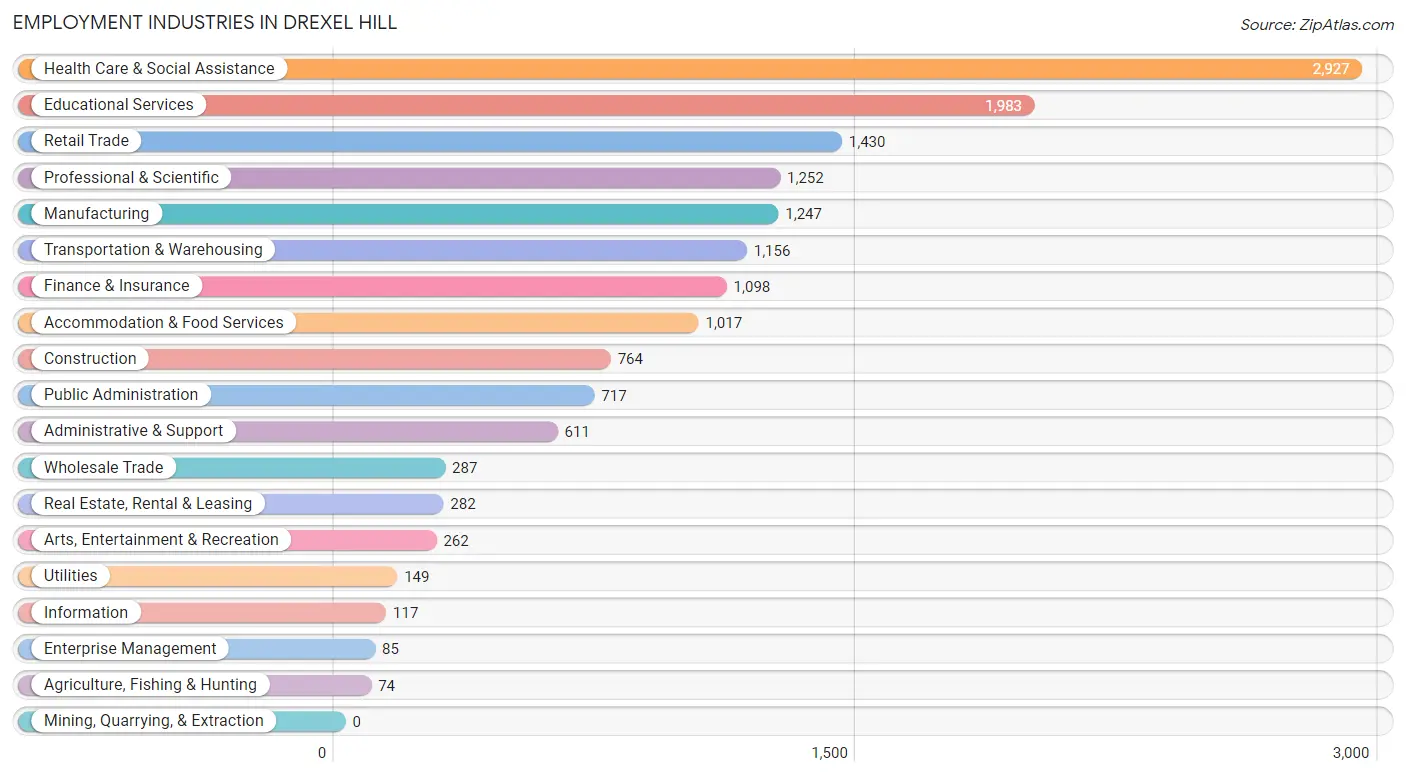
Employment Industries in Drexel Hill
The major employment industries in Drexel Hill include Health Care & Social Assistance (2,927 | 18.1%), Educational Services (1,983 | 12.3%), Retail Trade (1,430 | 8.9%), Professional & Scientific (1,252 | 7.8%), and Manufacturing (1,247 | 7.7%).
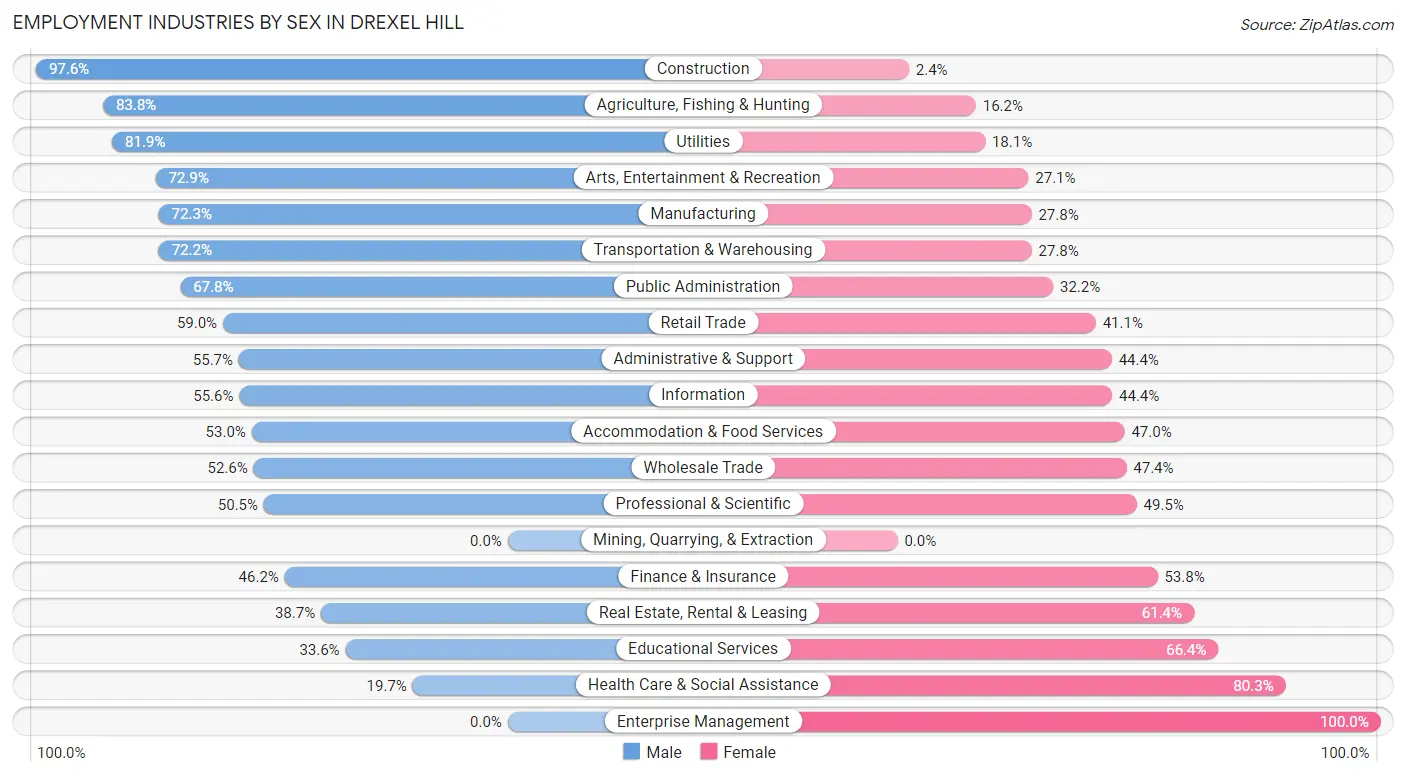
Employment Industries by Sex in Drexel Hill
The Drexel Hill industries that see more men than women are Construction (97.6%), Agriculture, Fishing & Hunting (83.8%), and Utilities (81.9%), whereas the industries that tend to have a higher number of women are Enterprise Management (100.0%), Health Care & Social Assistance (80.3%), and Educational Services (66.4%).
| Industry | Male | Female |
| Agriculture, Fishing & Hunting | 62 (83.8%) | 12 (16.2%) |
| Mining, Quarrying, & Extraction | 0 (0.0%) | 0 (0.0%) |
| Construction | 746 (97.6%) | 18 (2.4%) |
| Manufacturing | 901 (72.3%) | 346 (27.8%) |
| Wholesale Trade | 151 (52.6%) | 136 (47.4%) |
| Retail Trade | 843 (59.0%) | 587 (41.0%) |
| Transportation & Warehousing | 835 (72.2%) | 321 (27.8%) |
| Utilities | 122 (81.9%) | 27 (18.1%) |
| Information | 65 (55.6%) | 52 (44.4%) |
| Finance & Insurance | 507 (46.2%) | 591 (53.8%) |
| Real Estate, Rental & Leasing | 109 (38.7%) | 173 (61.4%) |
| Professional & Scientific | 632 (50.5%) | 620 (49.5%) |
| Enterprise Management | 0 (0.0%) | 85 (100.0%) |
| Administrative & Support | 340 (55.6%) | 271 (44.4%) |
| Educational Services | 666 (33.6%) | 1,317 (66.4%) |
| Health Care & Social Assistance | 576 (19.7%) | 2,351 (80.3%) |
| Arts, Entertainment & Recreation | 191 (72.9%) | 71 (27.1%) |
| Accommodation & Food Services | 539 (53.0%) | 478 (47.0%) |
| Public Administration | 486 (67.8%) | 231 (32.2%) |
| Total | 8,060 (50.0%) | 8,066 (50.0%) |
Education in Drexel Hill
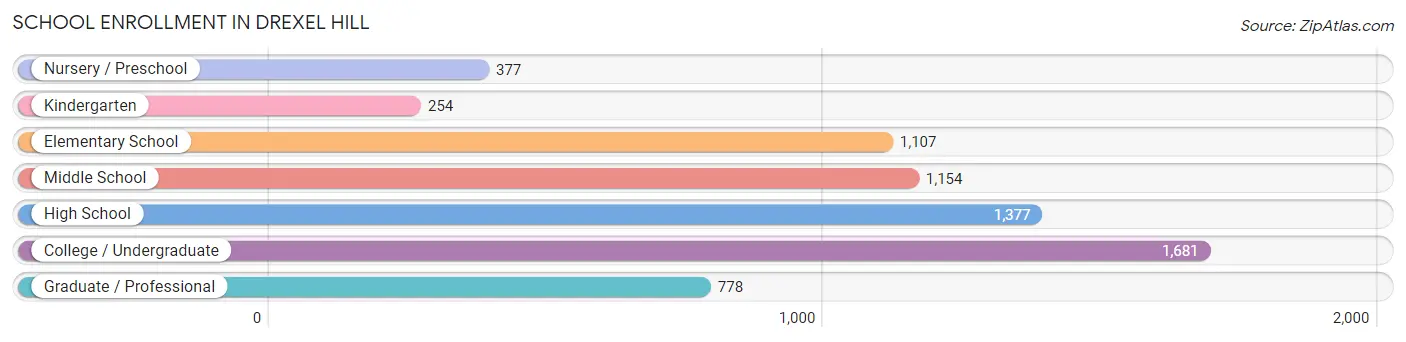
School Enrollment in Drexel Hill
The most common levels of schooling among the 6,728 students in Drexel Hill are college / undergraduate (1,681 | 25.0%), high school (1,377 | 20.5%), and middle school (1,154 | 17.2%).
| School Level | # Students | % Students |
| Nursery / Preschool | 377 | 5.6% |
| Kindergarten | 254 | 3.8% |
| Elementary School | 1,107 | 16.5% |
| Middle School | 1,154 | 17.2% |
| High School | 1,377 | 20.5% |
| College / Undergraduate | 1,681 | 25.0% |
| Graduate / Professional | 778 | 11.6% |
| Total | 6,728 | 100.0% |
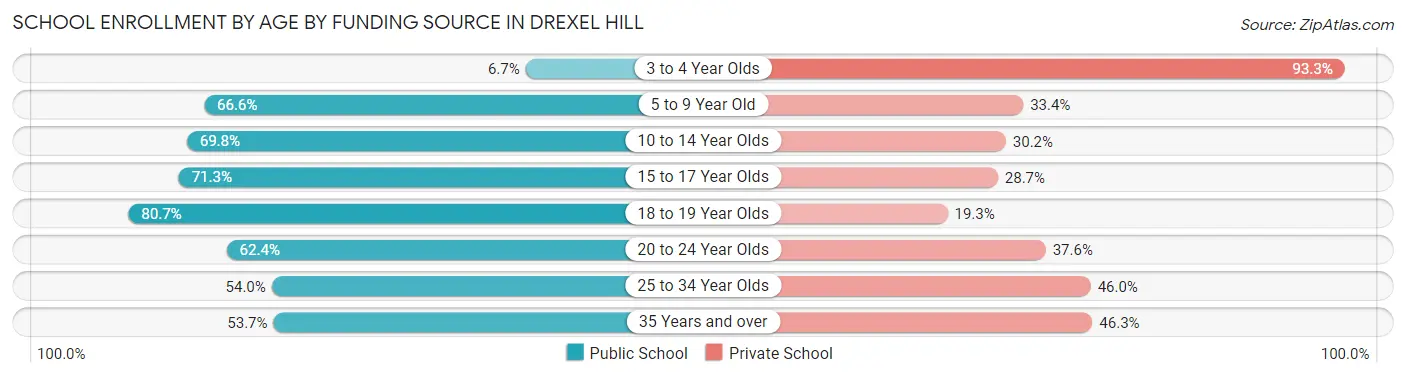
School Enrollment by Age by Funding Source in Drexel Hill
Out of a total of 6,728 students who are enrolled in schools in Drexel Hill, 2,476 (36.8%) attend a private institution, while the remaining 4,252 (63.2%) are enrolled in public schools. The age group of 3 to 4 year olds has the highest likelihood of being enrolled in private schools, with 251 (93.3% in the age bracket) enrolled. Conversely, the age group of 18 to 19 year olds has the lowest likelihood of being enrolled in a private school, with 317 (80.7% in the age bracket) attending a public institution.
| Age Bracket | Public School | Private School |
| 3 to 4 Year Olds | 18 (6.7%) | 251 (93.3%) |
| 5 to 9 Year Old | 852 (66.6%) | 428 (33.4%) |
| 10 to 14 Year Olds | 1,086 (69.8%) | 470 (30.2%) |
| 15 to 17 Year Olds | 680 (71.3%) | 274 (28.7%) |
| 18 to 19 Year Olds | 317 (80.7%) | 76 (19.3%) |
| 20 to 24 Year Olds | 545 (62.4%) | 329 (37.6%) |
| 25 to 34 Year Olds | 433 (54.0%) | 369 (46.0%) |
| 35 Years and over | 322 (53.7%) | 278 (46.3%) |
| Total | 4,252 (63.2%) | 2,476 (36.8%) |
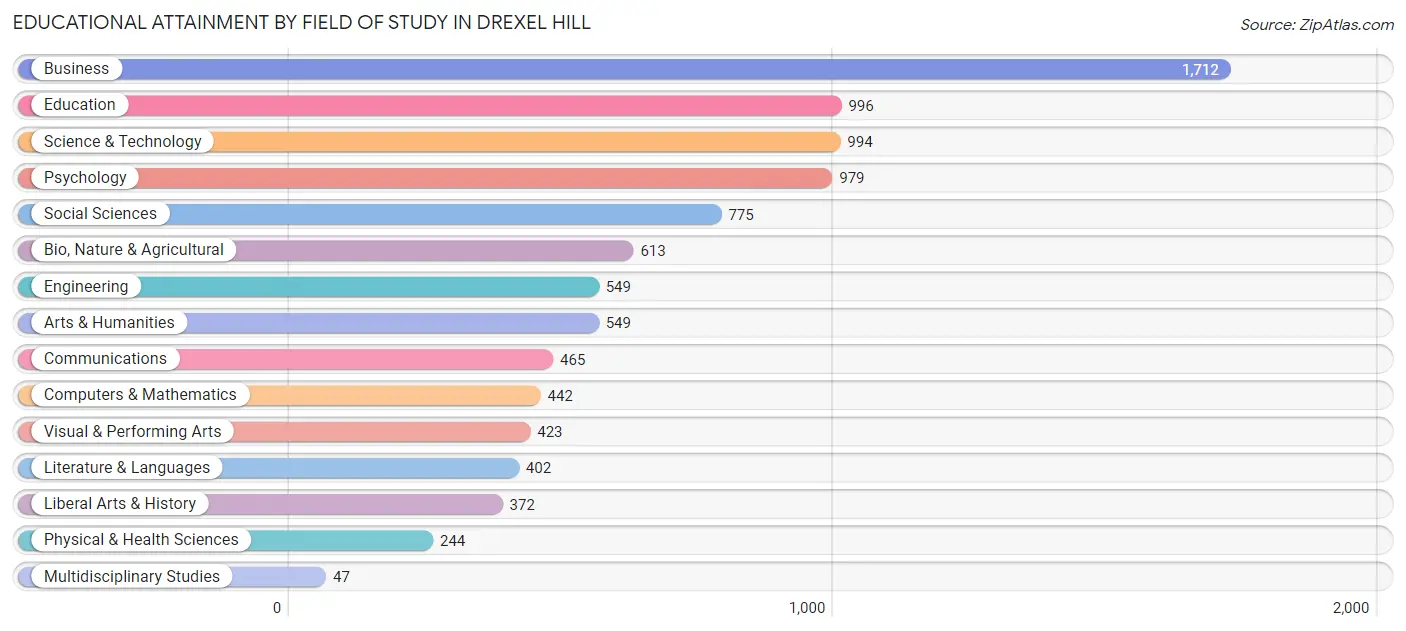
Educational Attainment by Field of Study in Drexel Hill
Business (1,712 | 17.9%), education (996 | 10.4%), science & technology (994 | 10.4%), psychology (979 | 10.2%), and social sciences (775 | 8.1%) are the most common fields of study among 9,562 individuals in Drexel Hill who have obtained a bachelor's degree or higher.
| Field of Study | # Graduates | % Graduates |
| Computers & Mathematics | 442 | 4.6% |
| Bio, Nature & Agricultural | 613 | 6.4% |
| Physical & Health Sciences | 244 | 2.5% |
| Psychology | 979 | 10.2% |
| Social Sciences | 775 | 8.1% |
| Engineering | 549 | 5.7% |
| Multidisciplinary Studies | 47 | 0.5% |
| Science & Technology | 994 | 10.4% |
| Business | 1,712 | 17.9% |
| Education | 996 | 10.4% |
| Literature & Languages | 402 | 4.2% |
| Liberal Arts & History | 372 | 3.9% |
| Visual & Performing Arts | 423 | 4.4% |
| Communications | 465 | 4.9% |
| Arts & Humanities | 549 | 5.7% |
| Total | 9,562 | 100.0% |
Transportation & Commute in Drexel Hill
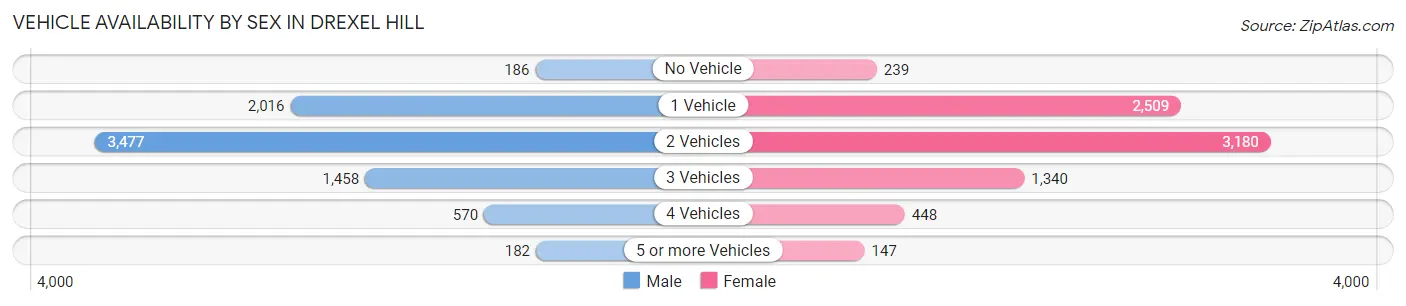
Vehicle Availability by Sex in Drexel Hill
The most prevalent vehicle ownership categories in Drexel Hill are males with 2 vehicles (3,477, accounting for 44.1%) and females with 2 vehicles (3,180, making up 44.2%).
| Vehicles Available | Male | Female |
| No Vehicle | 186 (2.4%) | 239 (3.0%) |
| 1 Vehicle | 2,016 (25.6%) | 2,509 (31.9%) |
| 2 Vehicles | 3,477 (44.1%) | 3,180 (40.4%) |
| 3 Vehicles | 1,458 (18.5%) | 1,340 (17.0%) |
| 4 Vehicles | 570 (7.2%) | 448 (5.7%) |
| 5 or more Vehicles | 182 (2.3%) | 147 (1.9%) |
| Total | 7,889 (100.0%) | 7,863 (100.0%) |
Commute Time in Drexel Hill
The most frequently occuring commute durations in Drexel Hill are 30 to 34 minutes (2,500 commuters, 18.3%), 20 to 24 minutes (1,886 commuters, 13.8%), and 45 to 59 minutes (1,845 commuters, 13.5%).
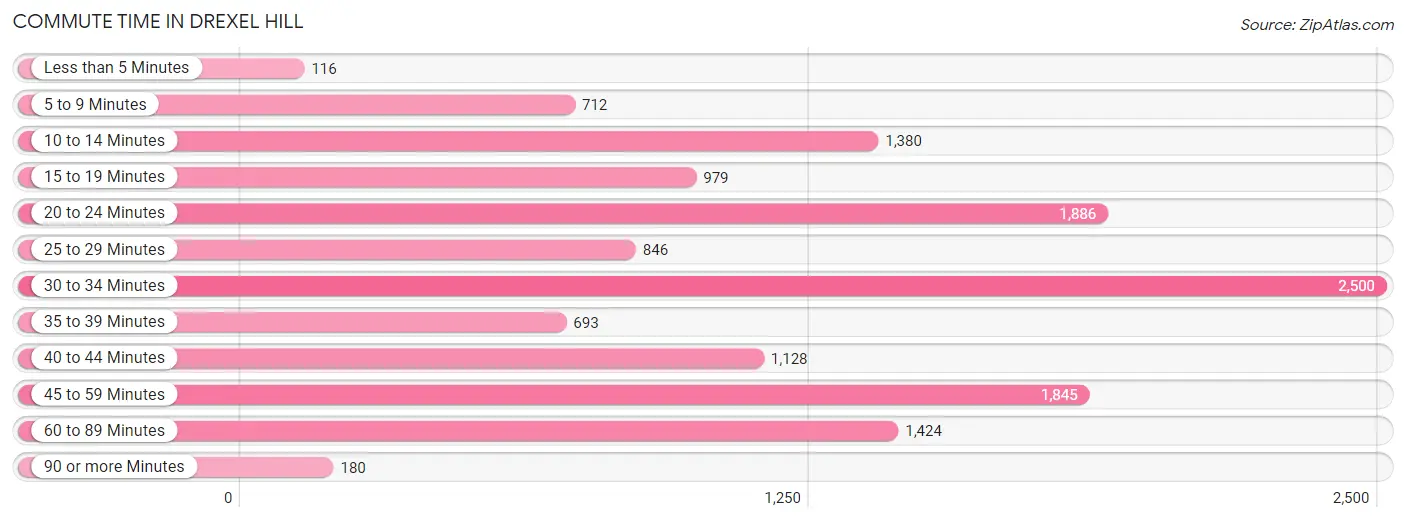
| Commute Time | # Commuters | % Commuters |
| Less than 5 Minutes | 116 | 0.9% |
| 5 to 9 Minutes | 712 | 5.2% |
| 10 to 14 Minutes | 1,380 | 10.1% |
| 15 to 19 Minutes | 979 | 7.1% |
| 20 to 24 Minutes | 1,886 | 13.8% |
| 25 to 29 Minutes | 846 | 6.2% |
| 30 to 34 Minutes | 2,500 | 18.3% |
| 35 to 39 Minutes | 693 | 5.1% |
| 40 to 44 Minutes | 1,128 | 8.2% |
| 45 to 59 Minutes | 1,845 | 13.5% |
| 60 to 89 Minutes | 1,424 | 10.4% |
| 90 or more Minutes | 180 | 1.3% |
Commute Time by Sex in Drexel Hill
The most common commute times in Drexel Hill are 30 to 34 minutes (1,366 commuters, 19.5%) for males and 30 to 34 minutes (1,134 commuters, 17.0%) for females.
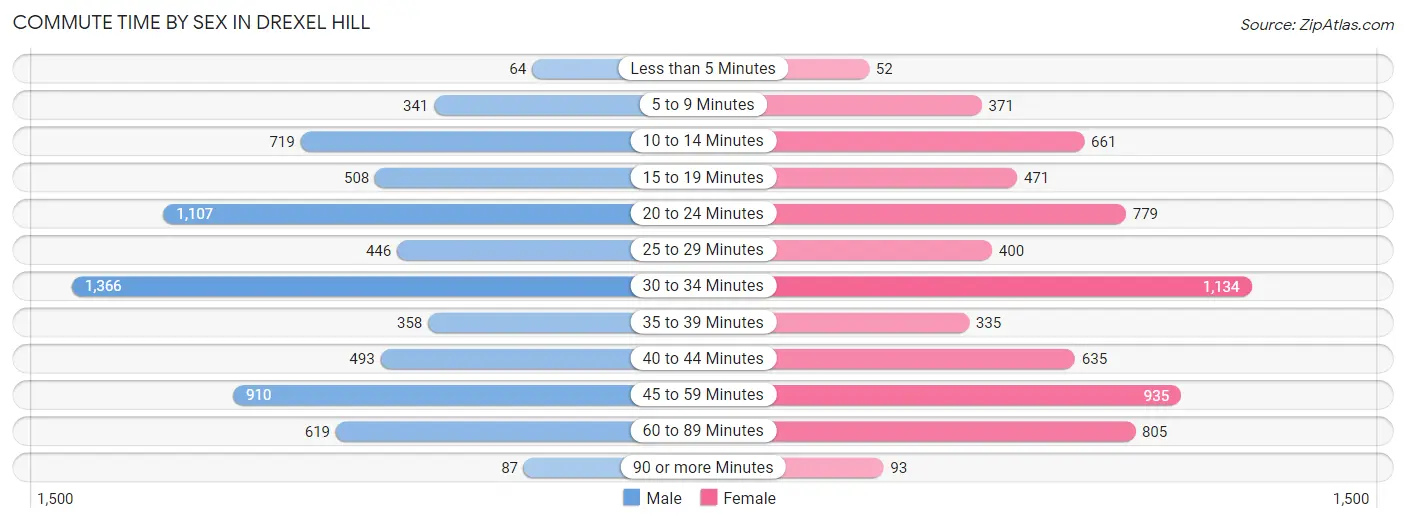
| Commute Time | Male | Female |
| Less than 5 Minutes | 64 (0.9%) | 52 (0.8%) |
| 5 to 9 Minutes | 341 (4.9%) | 371 (5.6%) |
| 10 to 14 Minutes | 719 (10.2%) | 661 (9.9%) |
| 15 to 19 Minutes | 508 (7.2%) | 471 (7.1%) |
| 20 to 24 Minutes | 1,107 (15.8%) | 779 (11.7%) |
| 25 to 29 Minutes | 446 (6.4%) | 400 (6.0%) |
| 30 to 34 Minutes | 1,366 (19.5%) | 1,134 (17.0%) |
| 35 to 39 Minutes | 358 (5.1%) | 335 (5.0%) |
| 40 to 44 Minutes | 493 (7.0%) | 635 (9.5%) |
| 45 to 59 Minutes | 910 (13.0%) | 935 (14.0%) |
| 60 to 89 Minutes | 619 (8.8%) | 805 (12.1%) |
| 90 or more Minutes | 87 (1.2%) | 93 (1.4%) |
Time of Departure to Work by Sex in Drexel Hill
The most frequent times of departure to work in Drexel Hill are 7:00 AM to 7:29 AM (1,178, 16.8%) for males and 8:00 AM to 8:29 AM (1,084, 16.3%) for females.
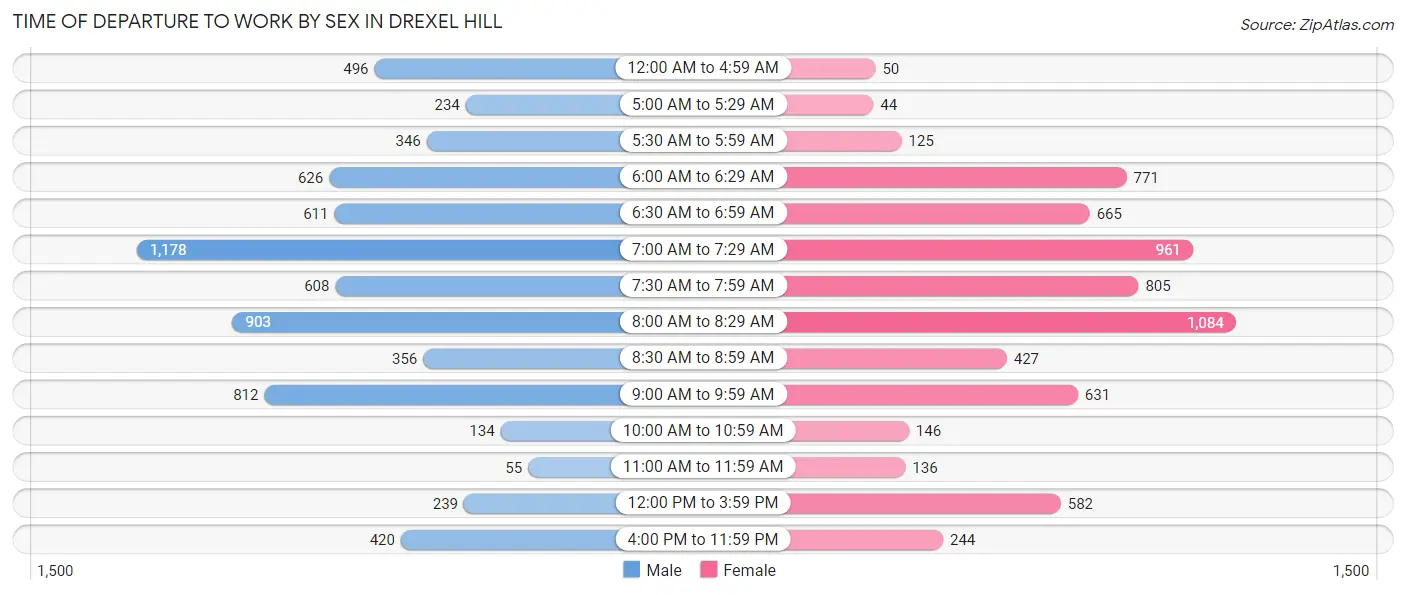
| Time of Departure | Male | Female |
| 12:00 AM to 4:59 AM | 496 (7.1%) | 50 (0.7%) |
| 5:00 AM to 5:29 AM | 234 (3.3%) | 44 (0.7%) |
| 5:30 AM to 5:59 AM | 346 (4.9%) | 125 (1.9%) |
| 6:00 AM to 6:29 AM | 626 (8.9%) | 771 (11.6%) |
| 6:30 AM to 6:59 AM | 611 (8.7%) | 665 (10.0%) |
| 7:00 AM to 7:29 AM | 1,178 (16.8%) | 961 (14.4%) |
| 7:30 AM to 7:59 AM | 608 (8.7%) | 805 (12.1%) |
| 8:00 AM to 8:29 AM | 903 (12.9%) | 1,084 (16.3%) |
| 8:30 AM to 8:59 AM | 356 (5.1%) | 427 (6.4%) |
| 9:00 AM to 9:59 AM | 812 (11.6%) | 631 (9.5%) |
| 10:00 AM to 10:59 AM | 134 (1.9%) | 146 (2.2%) |
| 11:00 AM to 11:59 AM | 55 (0.8%) | 136 (2.0%) |
| 12:00 PM to 3:59 PM | 239 (3.4%) | 582 (8.7%) |
| 4:00 PM to 11:59 PM | 420 (6.0%) | 244 (3.7%) |
| Total | 7,018 (100.0%) | 6,671 (100.0%) |
Housing Occupancy in Drexel Hill
Occupancy by Ownership in Drexel Hill
Of the total 11,999 dwellings in Drexel Hill, owner-occupied units account for 7,835 (65.3%), while renter-occupied units make up 4,164 (34.7%).
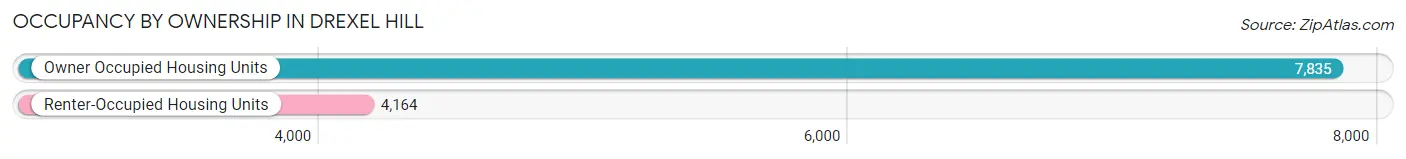
| Occupancy | # Housing Units | % Housing Units |
| Owner Occupied Housing Units | 7,835 | 65.3% |
| Renter-Occupied Housing Units | 4,164 | 34.7% |
| Total Occupied Housing Units | 11,999 | 100.0% |
Occupancy by Household Size in Drexel Hill
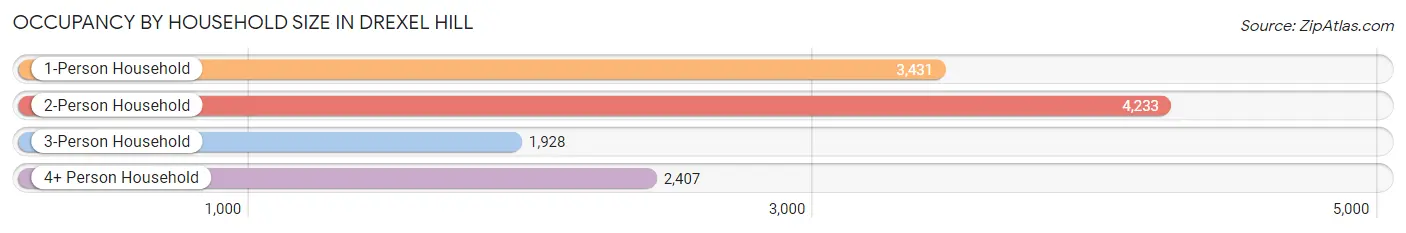
| Household Size | # Housing Units | % Housing Units |
| 1-Person Household | 3,431 | 28.6% |
| 2-Person Household | 4,233 | 35.3% |
| 3-Person Household | 1,928 | 16.1% |
| 4+ Person Household | 2,407 | 20.1% |
| Total Housing Units | 11,999 | 100.0% |
Occupancy by Ownership by Household Size in Drexel Hill
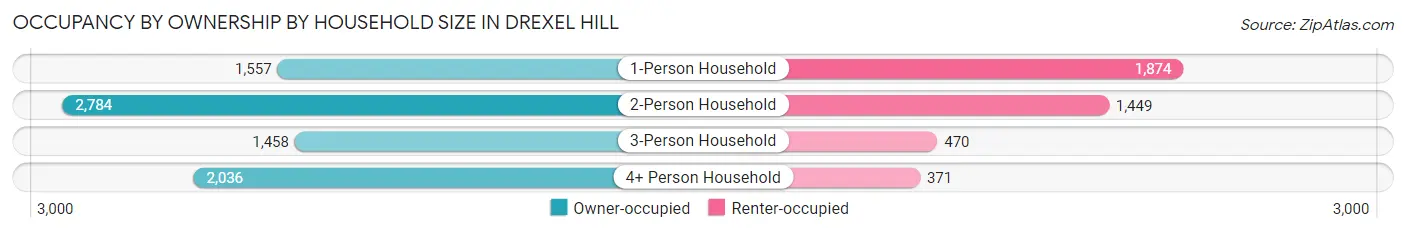
| Household Size | Owner-occupied | Renter-occupied |
| 1-Person Household | 1,557 (45.4%) | 1,874 (54.6%) |
| 2-Person Household | 2,784 (65.8%) | 1,449 (34.2%) |
| 3-Person Household | 1,458 (75.6%) | 470 (24.4%) |
| 4+ Person Household | 2,036 (84.6%) | 371 (15.4%) |
| Total Housing Units | 7,835 (65.3%) | 4,164 (34.7%) |
Occupancy by Educational Attainment in Drexel Hill
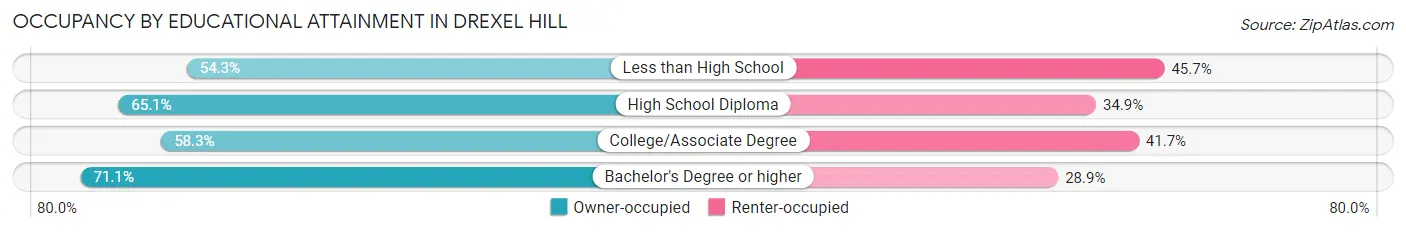
| Household Size | Owner-occupied | Renter-occupied |
| Less than High School | 286 (54.3%) | 241 (45.7%) |
| High School Diploma | 1,477 (65.1%) | 791 (34.9%) |
| College/Associate Degree | 2,163 (58.3%) | 1,545 (41.7%) |
| Bachelor's Degree or higher | 3,909 (71.1%) | 1,587 (28.9%) |
Occupancy by Age of Householder in Drexel Hill
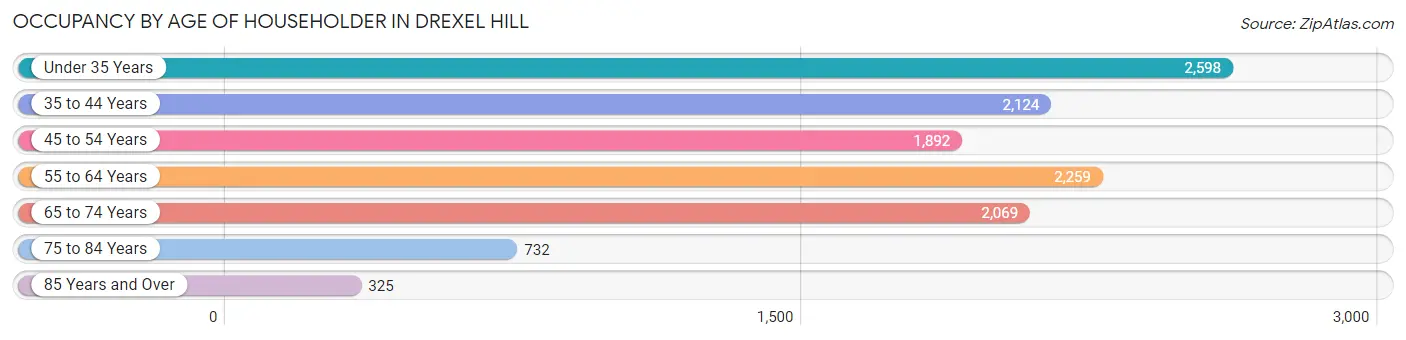
| Age Bracket | # Households | % Households |
| Under 35 Years | 2,598 | 21.6% |
| 35 to 44 Years | 2,124 | 17.7% |
| 45 to 54 Years | 1,892 | 15.8% |
| 55 to 64 Years | 2,259 | 18.8% |
| 65 to 74 Years | 2,069 | 17.2% |
| 75 to 84 Years | 732 | 6.1% |
| 85 Years and Over | 325 | 2.7% |
| Total | 11,999 | 100.0% |
Housing Finances in Drexel Hill
Median Income by Occupancy in Drexel Hill
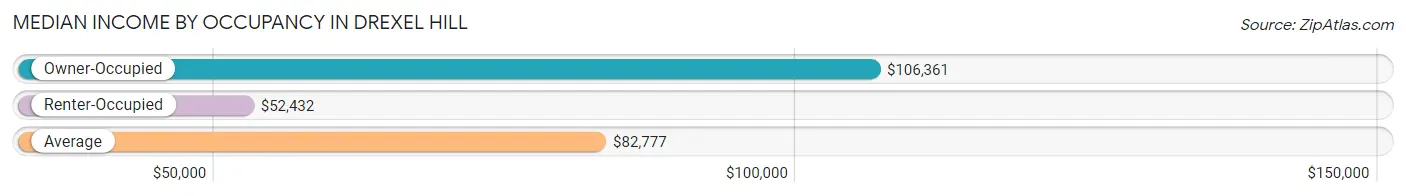
| Occupancy Type | # Households | Median Income |
| Owner-Occupied | 7,835 (65.3%) | $106,361 |
| Renter-Occupied | 4,164 (34.7%) | $52,432 |
| Average | 11,999 (100.0%) | $82,777 |
Occupancy by Householder Income Bracket in Drexel Hill
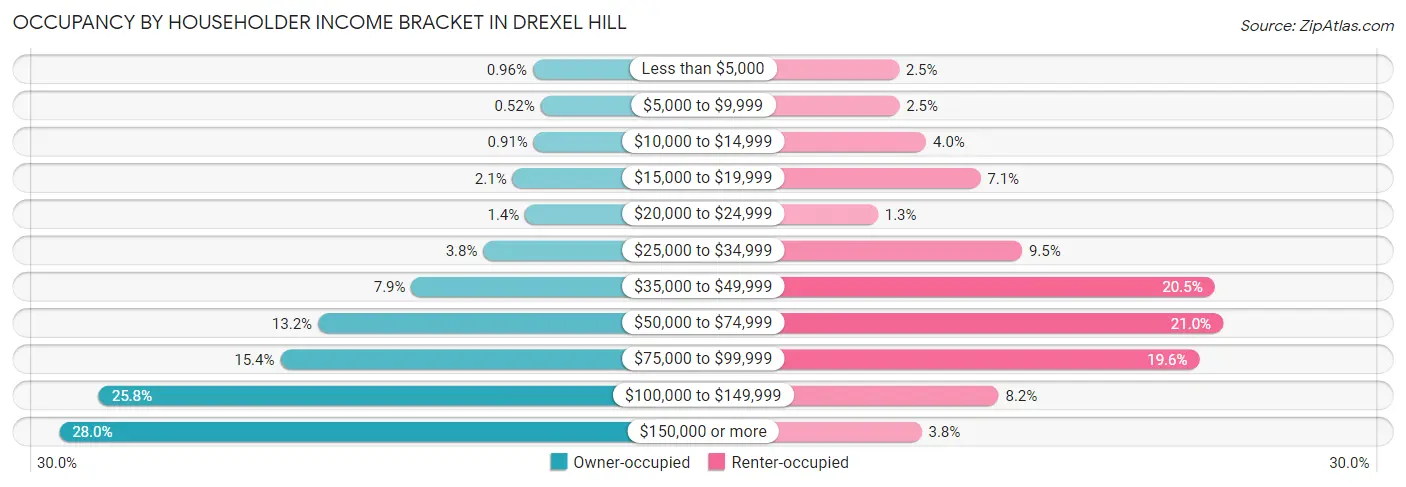
| Income Bracket | Owner-occupied | Renter-occupied |
| Less than $5,000 | 75 (1.0%) | 103 (2.5%) |
| $5,000 to $9,999 | 41 (0.5%) | 104 (2.5%) |
| $10,000 to $14,999 | 71 (0.9%) | 168 (4.0%) |
| $15,000 to $19,999 | 166 (2.1%) | 297 (7.1%) |
| $20,000 to $24,999 | 110 (1.4%) | 53 (1.3%) |
| $25,000 to $34,999 | 297 (3.8%) | 396 (9.5%) |
| $35,000 to $49,999 | 619 (7.9%) | 854 (20.5%) |
| $50,000 to $74,999 | 1,037 (13.2%) | 874 (21.0%) |
| $75,000 to $99,999 | 1,206 (15.4%) | 818 (19.6%) |
| $100,000 to $149,999 | 2,018 (25.8%) | 340 (8.2%) |
| $150,000 or more | 2,195 (28.0%) | 157 (3.8%) |
| Total | 7,835 (100.0%) | 4,164 (100.0%) |
Monthly Housing Cost Tiers in Drexel Hill
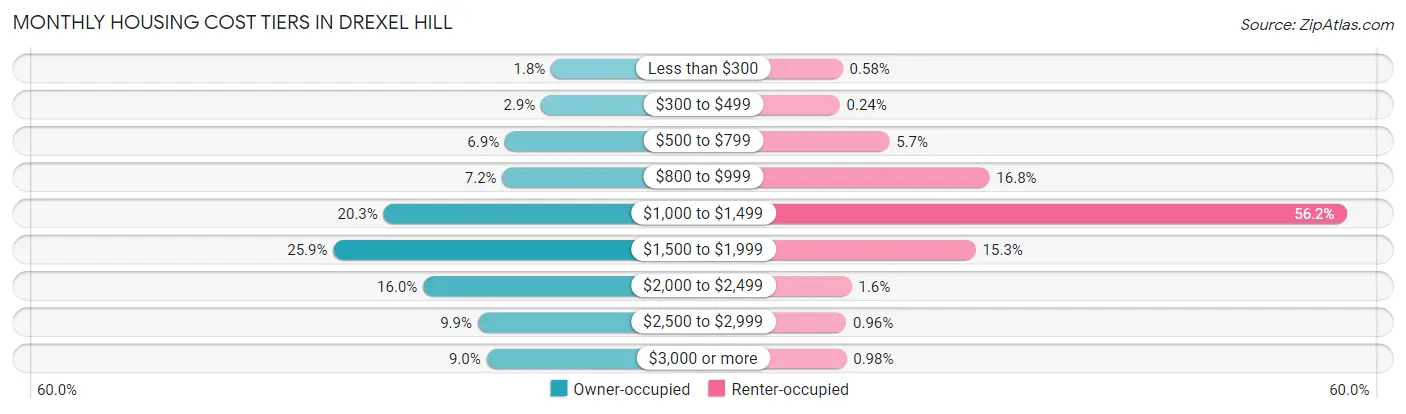
| Monthly Cost | Owner-occupied | Renter-occupied |
| Less than $300 | 143 (1.8%) | 24 (0.6%) |
| $300 to $499 | 230 (2.9%) | 10 (0.2%) |
| $500 to $799 | 543 (6.9%) | 238 (5.7%) |
| $800 to $999 | 565 (7.2%) | 699 (16.8%) |
| $1,000 to $1,499 | 1,594 (20.3%) | 2,341 (56.2%) |
| $1,500 to $1,999 | 2,029 (25.9%) | 636 (15.3%) |
| $2,000 to $2,499 | 1,251 (16.0%) | 65 (1.6%) |
| $2,500 to $2,999 | 778 (9.9%) | 40 (1.0%) |
| $3,000 or more | 702 (9.0%) | 41 (1.0%) |
| Total | 7,835 (100.0%) | 4,164 (100.0%) |
Physical Housing Characteristics in Drexel Hill
Housing Structures in Drexel Hill
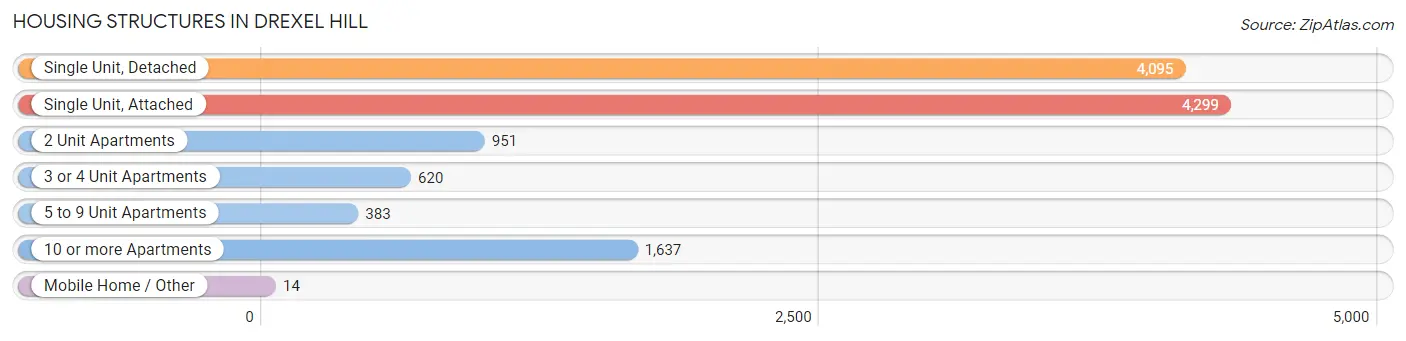
| Structure Type | # Housing Units | % Housing Units |
| Single Unit, Detached | 4,095 | 34.1% |
| Single Unit, Attached | 4,299 | 35.8% |
| 2 Unit Apartments | 951 | 7.9% |
| 3 or 4 Unit Apartments | 620 | 5.2% |
| 5 to 9 Unit Apartments | 383 | 3.2% |
| 10 or more Apartments | 1,637 | 13.6% |
| Mobile Home / Other | 14 | 0.1% |
| Total | 11,999 | 100.0% |
Housing Structures by Occupancy in Drexel Hill
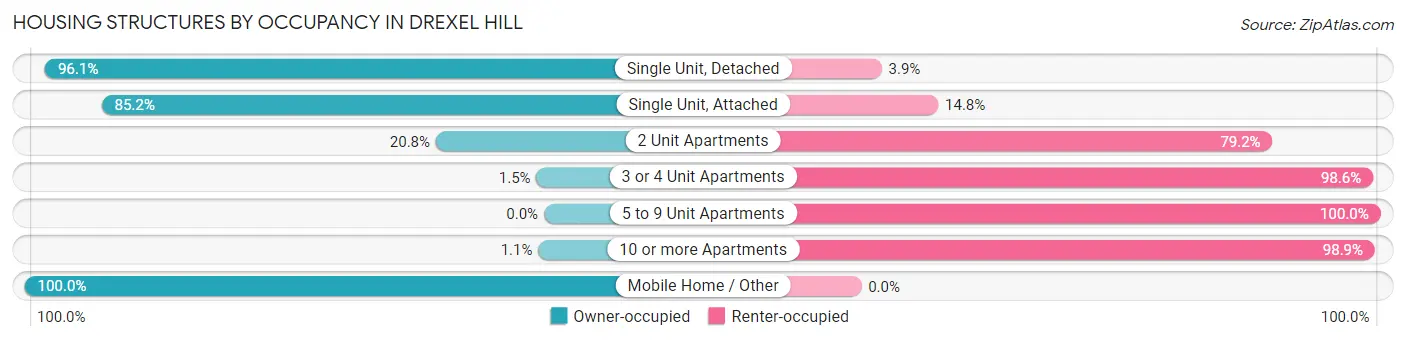
| Structure Type | Owner-occupied | Renter-occupied |
| Single Unit, Detached | 3,934 (96.1%) | 161 (3.9%) |
| Single Unit, Attached | 3,662 (85.2%) | 637 (14.8%) |
| 2 Unit Apartments | 198 (20.8%) | 753 (79.2%) |
| 3 or 4 Unit Apartments | 9 (1.5%) | 611 (98.6%) |
| 5 to 9 Unit Apartments | 0 (0.0%) | 383 (100.0%) |
| 10 or more Apartments | 18 (1.1%) | 1,619 (98.9%) |
| Mobile Home / Other | 14 (100.0%) | 0 (0.0%) |
| Total | 7,835 (65.3%) | 4,164 (34.7%) |
Housing Structures by Number of Rooms in Drexel Hill
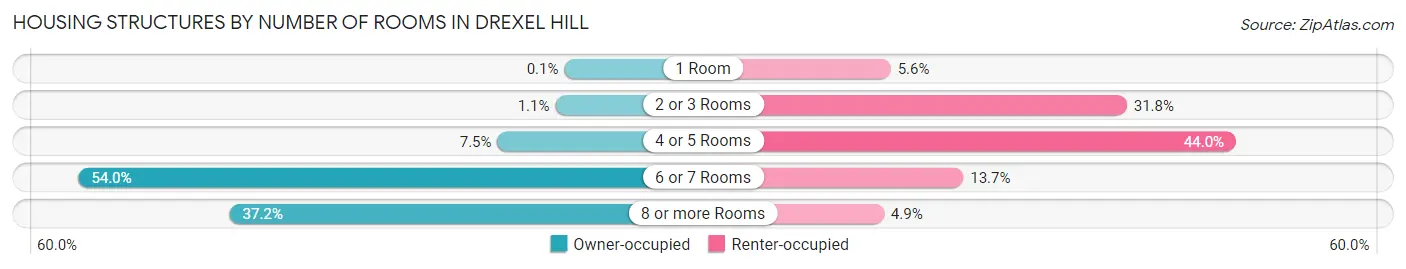
| Number of Rooms | Owner-occupied | Renter-occupied |
| 1 Room | 8 (0.1%) | 235 (5.6%) |
| 2 or 3 Rooms | 86 (1.1%) | 1,326 (31.8%) |
| 4 or 5 Rooms | 590 (7.5%) | 1,830 (44.0%) |
| 6 or 7 Rooms | 4,233 (54.0%) | 570 (13.7%) |
| 8 or more Rooms | 2,918 (37.2%) | 203 (4.9%) |
| Total | 7,835 (100.0%) | 4,164 (100.0%) |
Housing Structure by Heating Type in Drexel Hill
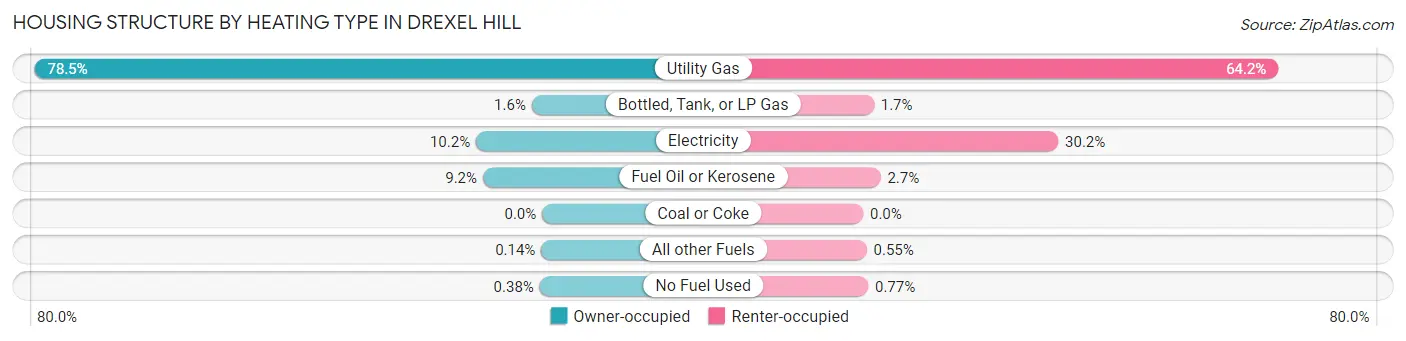
| Heating Type | Owner-occupied | Renter-occupied |
| Utility Gas | 6,150 (78.5%) | 2,672 (64.2%) |
| Bottled, Tank, or LP Gas | 125 (1.6%) | 69 (1.7%) |
| Electricity | 801 (10.2%) | 1,256 (30.2%) |
| Fuel Oil or Kerosene | 718 (9.2%) | 112 (2.7%) |
| Coal or Coke | 0 (0.0%) | 0 (0.0%) |
| All other Fuels | 11 (0.1%) | 23 (0.5%) |
| No Fuel Used | 30 (0.4%) | 32 (0.8%) |
| Total | 7,835 (100.0%) | 4,164 (100.0%) |
Household Vehicle Usage in Drexel Hill
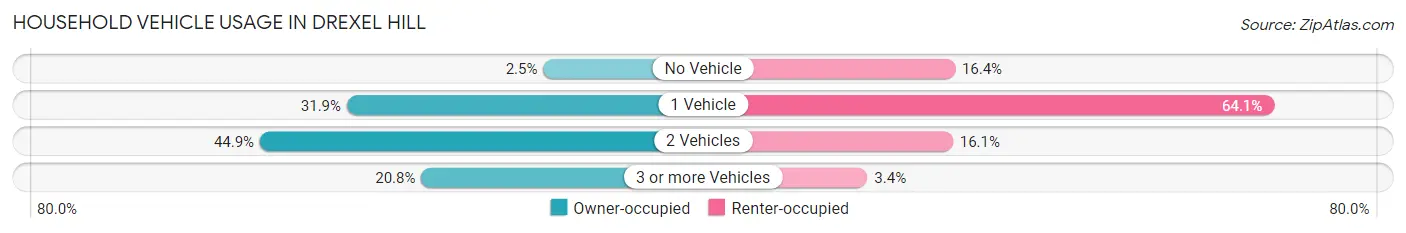
| Vehicles per Household | Owner-occupied | Renter-occupied |
| No Vehicle | 198 (2.5%) | 684 (16.4%) |
| 1 Vehicle | 2,497 (31.9%) | 2,669 (64.1%) |
| 2 Vehicles | 3,514 (44.9%) | 671 (16.1%) |
| 3 or more Vehicles | 1,626 (20.7%) | 140 (3.4%) |
| Total | 7,835 (100.0%) | 4,164 (100.0%) |
Real Estate & Mortgages in Drexel Hill
Real Estate and Mortgage Overview in Drexel Hill
| Characteristic | Without Mortgage | With Mortgage |
| Housing Units | 2,502 | 5,333 |
| Median Property Value | $223,800 | $220,900 |
| Median Household Income | $81,862 | $1,647 |
| Monthly Housing Costs | $947 | $702 |
| Real Estate Taxes | $6,619 | $54 |
Property Value by Mortgage Status in Drexel Hill
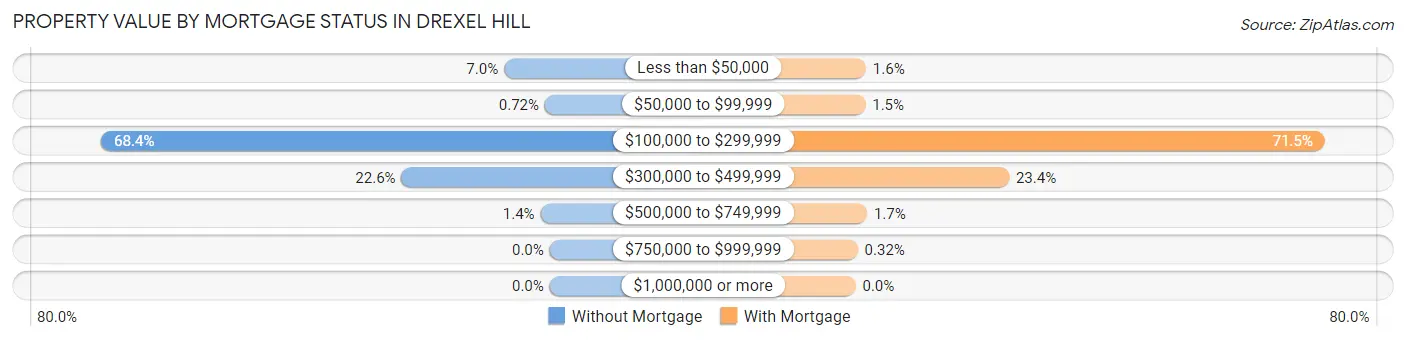
| Property Value | Without Mortgage | With Mortgage |
| Less than $50,000 | 174 (7.0%) | 84 (1.6%) |
| $50,000 to $99,999 | 18 (0.7%) | 79 (1.5%) |
| $100,000 to $299,999 | 1,710 (68.3%) | 3,813 (71.5%) |
| $300,000 to $499,999 | 565 (22.6%) | 1,247 (23.4%) |
| $500,000 to $749,999 | 35 (1.4%) | 93 (1.7%) |
| $750,000 to $999,999 | 0 (0.0%) | 17 (0.3%) |
| $1,000,000 or more | 0 (0.0%) | 0 (0.0%) |
| Total | 2,502 (100.0%) | 5,333 (100.0%) |
Household Income by Mortgage Status in Drexel Hill
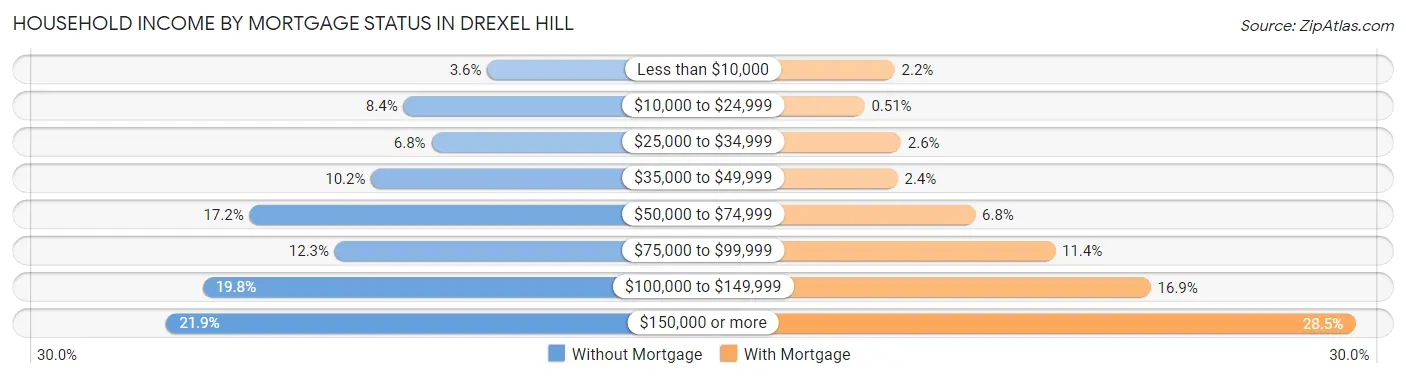
| Household Income | Without Mortgage | With Mortgage |
| Less than $10,000 | 89 (3.6%) | 119 (2.2%) |
| $10,000 to $24,999 | 209 (8.4%) | 27 (0.5%) |
| $25,000 to $34,999 | 169 (6.8%) | 138 (2.6%) |
| $35,000 to $49,999 | 255 (10.2%) | 128 (2.4%) |
| $50,000 to $74,999 | 429 (17.2%) | 364 (6.8%) |
| $75,000 to $99,999 | 307 (12.3%) | 608 (11.4%) |
| $100,000 to $149,999 | 496 (19.8%) | 899 (16.9%) |
| $150,000 or more | 548 (21.9%) | 1,522 (28.5%) |
| Total | 2,502 (100.0%) | 5,333 (100.0%) |
Property Value to Household Income Ratio in Drexel Hill
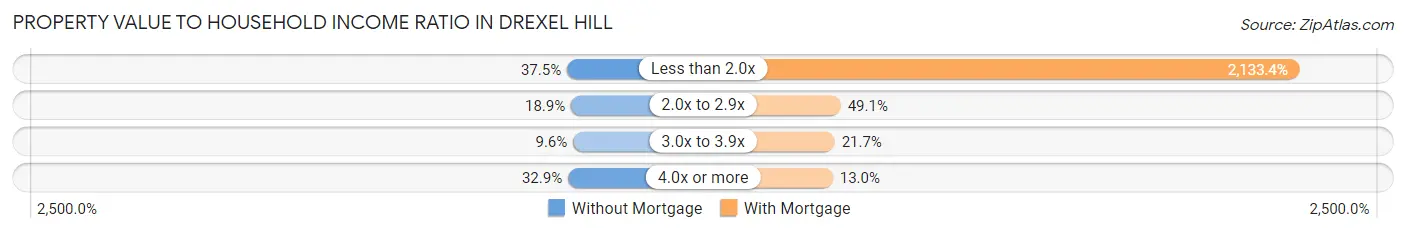
| Value-to-Income Ratio | Without Mortgage | With Mortgage |
| Less than 2.0x | 937 (37.4%) | 113,772 (2,133.4%) |
| 2.0x to 2.9x | 474 (18.9%) | 2,618 (49.1%) |
| 3.0x to 3.9x | 241 (9.6%) | 1,155 (21.7%) |
| 4.0x or more | 824 (32.9%) | 693 (13.0%) |
| Total | 2,502 (100.0%) | 5,333 (100.0%) |
Real Estate Taxes by Mortgage Status in Drexel Hill
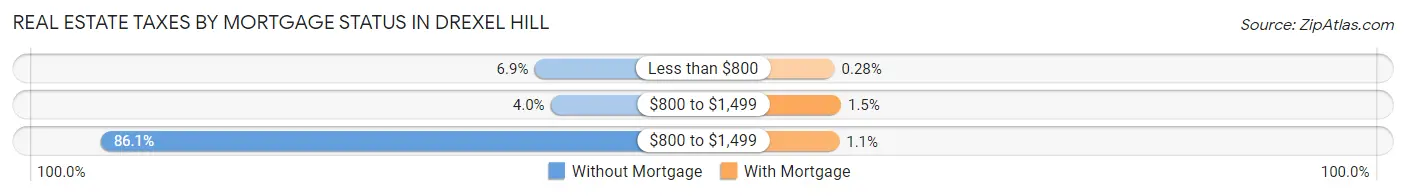
| Property Taxes | Without Mortgage | With Mortgage |
| Less than $800 | 173 (6.9%) | 15 (0.3%) |
| $800 to $1,499 | 99 (4.0%) | 78 (1.5%) |
| $800 to $1,499 | 2,154 (86.1%) | 61 (1.1%) |
| Total | 2,502 (100.0%) | 5,333 (100.0%) |
Health & Disability in Drexel Hill
Health Insurance Coverage by Age in Drexel Hill
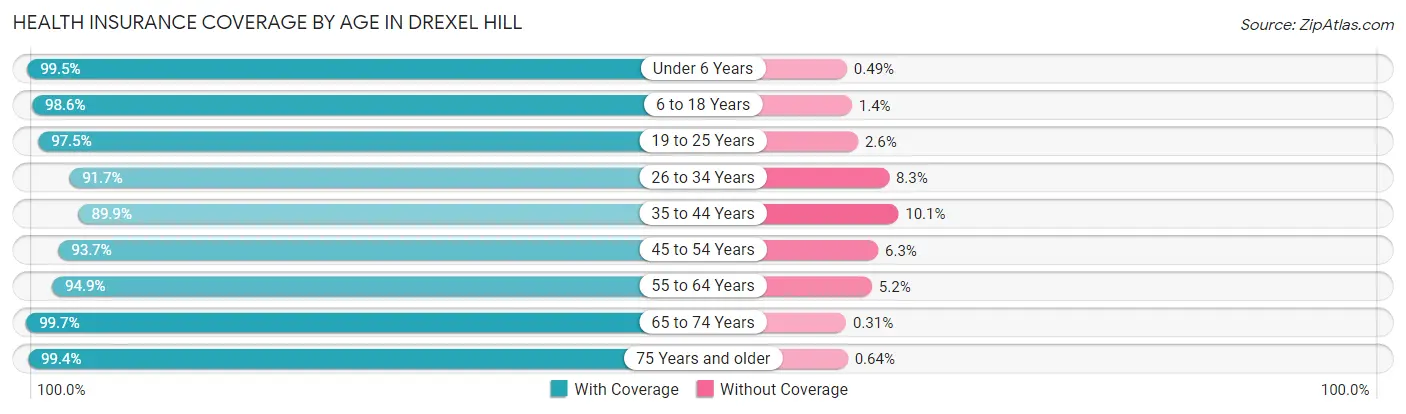
| Age Bracket | With Coverage | Without Coverage |
| Under 6 Years | 2,017 (99.5%) | 10 (0.5%) |
| 6 to 18 Years | 3,985 (98.6%) | 57 (1.4%) |
| 19 to 25 Years | 2,486 (97.5%) | 65 (2.5%) |
| 26 to 34 Years | 4,279 (91.7%) | 389 (8.3%) |
| 35 to 44 Years | 3,714 (89.9%) | 416 (10.1%) |
| 45 to 54 Years | 3,036 (93.7%) | 204 (6.3%) |
| 55 to 64 Years | 3,573 (94.9%) | 194 (5.1%) |
| 65 to 74 Years | 3,236 (99.7%) | 10 (0.3%) |
| 75 Years and older | 1,550 (99.4%) | 10 (0.6%) |
| Total | 27,876 (95.4%) | 1,355 (4.6%) |
Health Insurance Coverage by Citizenship Status in Drexel Hill
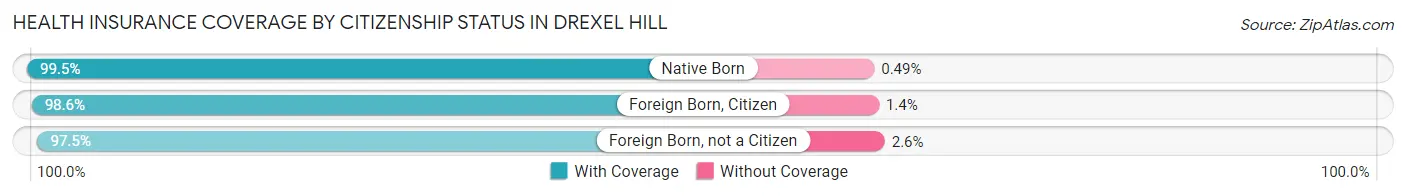
| Citizenship Status | With Coverage | Without Coverage |
| Native Born | 2,017 (99.5%) | 10 (0.5%) |
| Foreign Born, Citizen | 3,985 (98.6%) | 57 (1.4%) |
| Foreign Born, not a Citizen | 2,486 (97.5%) | 65 (2.5%) |
Health Insurance Coverage by Household Income in Drexel Hill
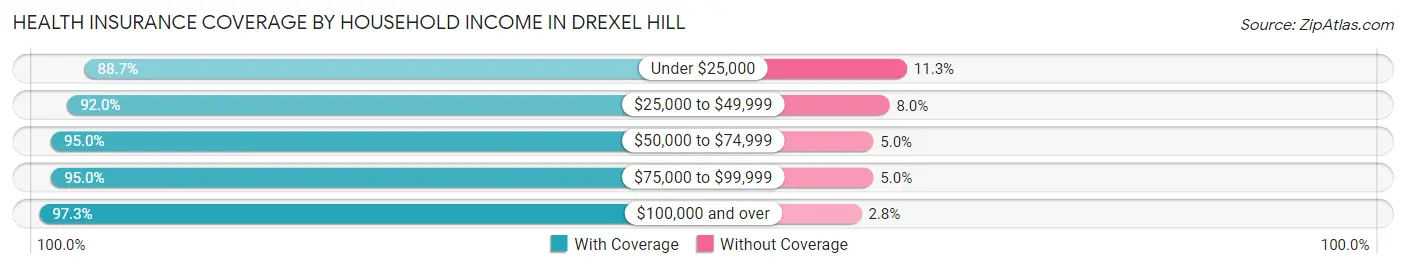
| Household Income | With Coverage | Without Coverage |
| Under $25,000 | 1,513 (88.7%) | 192 (11.3%) |
| $25,000 to $49,999 | 3,602 (92.0%) | 313 (8.0%) |
| $50,000 to $74,999 | 4,046 (95.0%) | 212 (5.0%) |
| $75,000 to $99,999 | 4,590 (95.0%) | 241 (5.0%) |
| $100,000 and over | 14,033 (97.3%) | 397 (2.8%) |
Public vs Private Health Insurance Coverage by Age in Drexel Hill
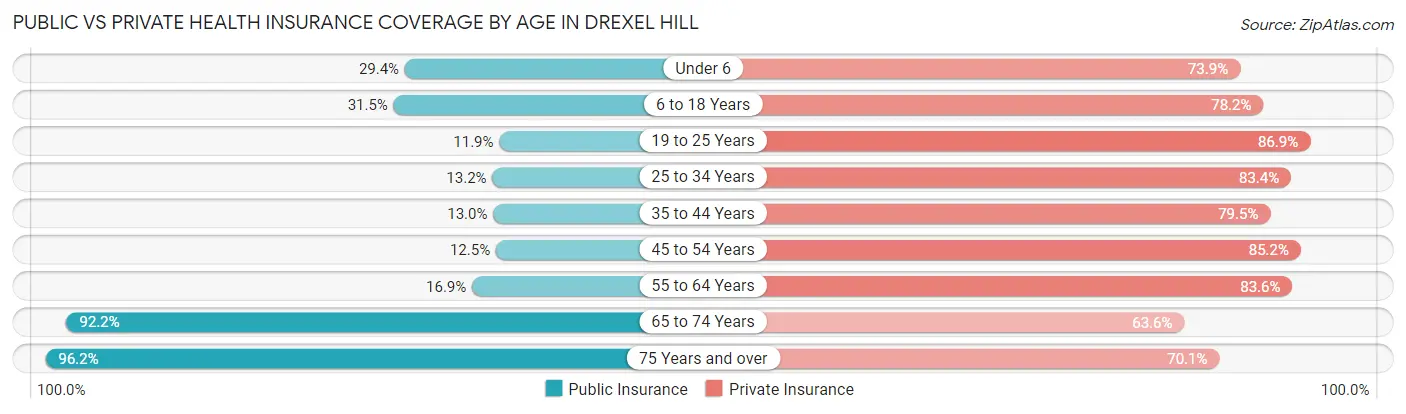
| Age Bracket | Public Insurance | Private Insurance |
| Under 6 | 596 (29.4%) | 1,498 (73.9%) |
| 6 to 18 Years | 1,273 (31.5%) | 3,162 (78.2%) |
| 19 to 25 Years | 303 (11.9%) | 2,217 (86.9%) |
| 25 to 34 Years | 615 (13.2%) | 3,892 (83.4%) |
| 35 to 44 Years | 537 (13.0%) | 3,284 (79.5%) |
| 45 to 54 Years | 405 (12.5%) | 2,760 (85.2%) |
| 55 to 64 Years | 638 (16.9%) | 3,150 (83.6%) |
| 65 to 74 Years | 2,994 (92.2%) | 2,063 (63.6%) |
| 75 Years and over | 1,500 (96.2%) | 1,093 (70.1%) |
| Total | 8,861 (30.3%) | 23,119 (79.1%) |
Disability Status by Sex by Age in Drexel Hill
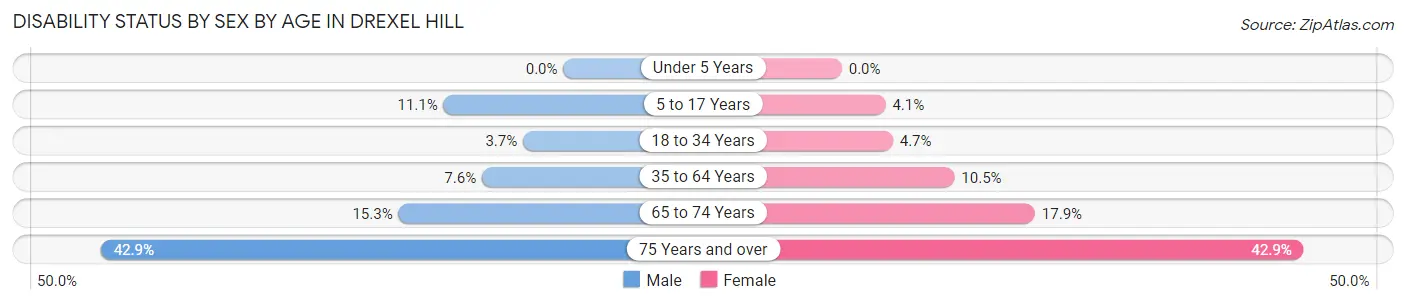
| Age Bracket | Male | Female |
| Under 5 Years | 0 (0.0%) | 0 (0.0%) |
| 5 to 17 Years | 222 (11.1%) | 82 (4.1%) |
| 18 to 34 Years | 133 (3.7%) | 185 (4.7%) |
| 35 to 64 Years | 406 (7.5%) | 602 (10.4%) |
| 65 to 74 Years | 232 (15.3%) | 310 (17.9%) |
| 75 Years and over | 264 (42.9%) | 405 (42.9%) |
Disability Class by Sex by Age in Drexel Hill
Disability Class: Hearing Difficulty
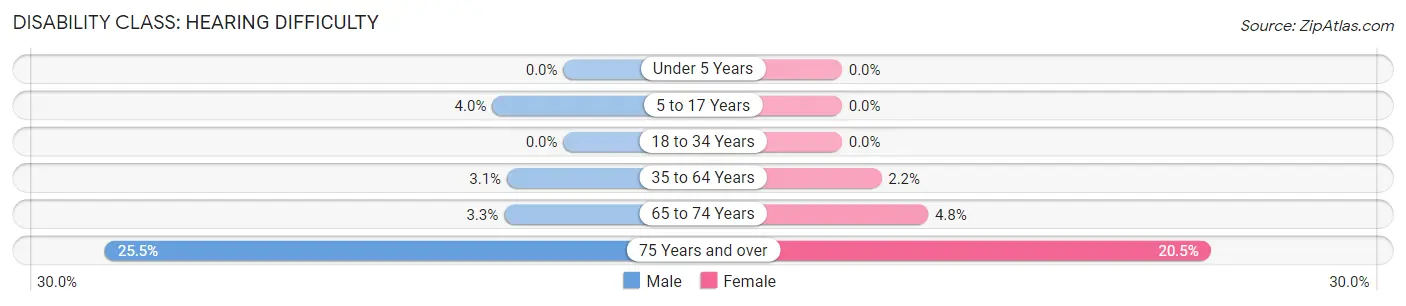
| Age Bracket | Male | Female |
| Under 5 Years | 0 (0.0%) | 0 (0.0%) |
| 5 to 17 Years | 79 (4.0%) | 0 (0.0%) |
| 18 to 34 Years | 0 (0.0%) | 0 (0.0%) |
| 35 to 64 Years | 169 (3.1%) | 127 (2.2%) |
| 65 to 74 Years | 50 (3.3%) | 83 (4.8%) |
| 75 Years and over | 157 (25.5%) | 194 (20.5%) |
Disability Class: Vision Difficulty
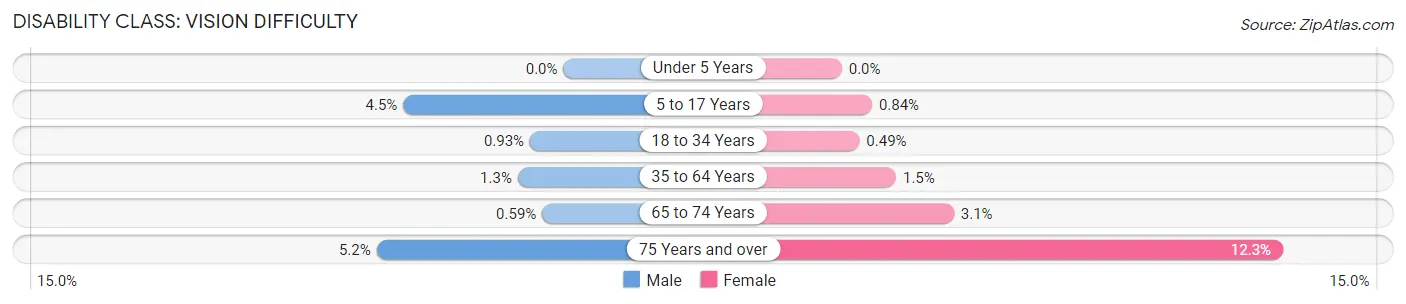
| Age Bracket | Male | Female |
| Under 5 Years | 0 (0.0%) | 0 (0.0%) |
| 5 to 17 Years | 89 (4.5%) | 17 (0.8%) |
| 18 to 34 Years | 33 (0.9%) | 19 (0.5%) |
| 35 to 64 Years | 68 (1.3%) | 87 (1.5%) |
| 65 to 74 Years | 9 (0.6%) | 54 (3.1%) |
| 75 Years and over | 32 (5.2%) | 116 (12.3%) |
Disability Class: Cognitive Difficulty
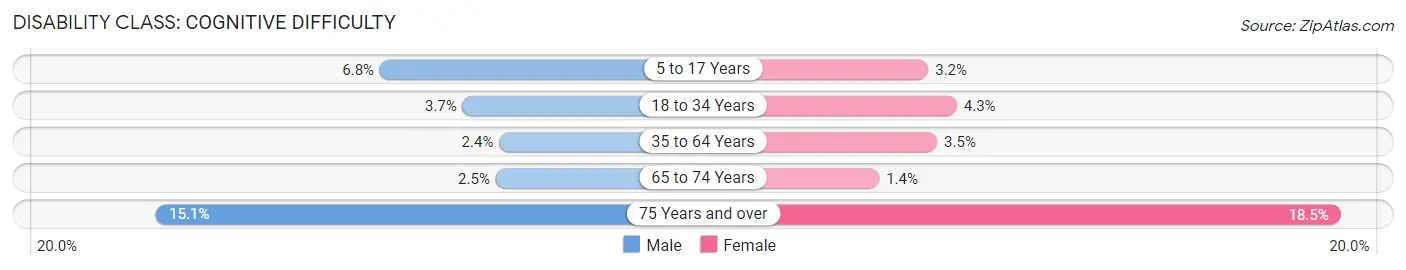
| Age Bracket | Male | Female |
| 5 to 17 Years | 136 (6.8%) | 65 (3.2%) |
| 18 to 34 Years | 133 (3.7%) | 167 (4.3%) |
| 35 to 64 Years | 128 (2.4%) | 204 (3.5%) |
| 65 to 74 Years | 38 (2.5%) | 24 (1.4%) |
| 75 Years and over | 93 (15.1%) | 175 (18.5%) |
Disability Class: Ambulatory Difficulty
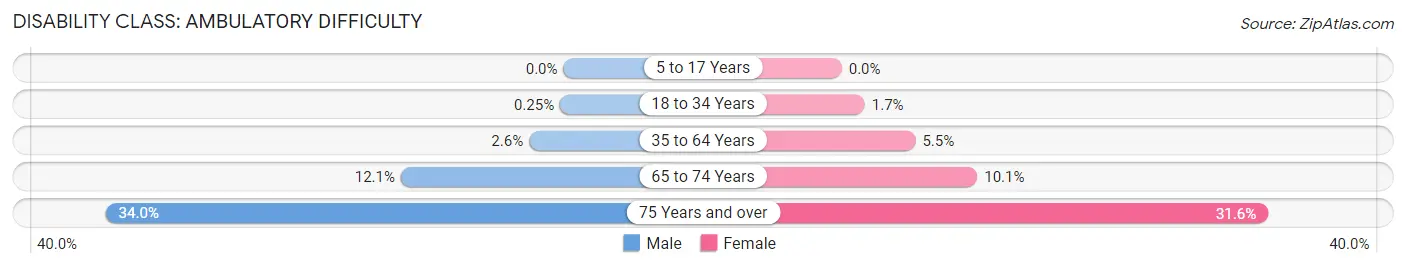
| Age Bracket | Male | Female |
| 5 to 17 Years | 0 (0.0%) | 0 (0.0%) |
| 18 to 34 Years | 9 (0.3%) | 67 (1.7%) |
| 35 to 64 Years | 137 (2.5%) | 315 (5.5%) |
| 65 to 74 Years | 183 (12.1%) | 174 (10.1%) |
| 75 Years and over | 209 (34.0%) | 299 (31.6%) |
Disability Class: Self-Care Difficulty
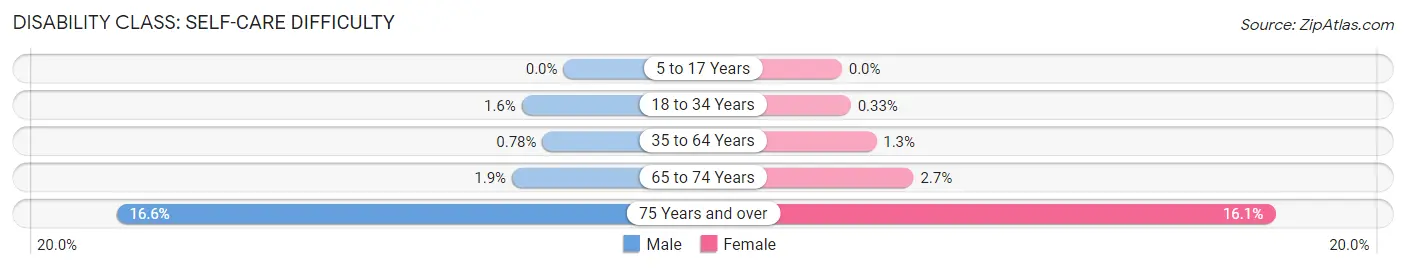
| Age Bracket | Male | Female |
| 5 to 17 Years | 0 (0.0%) | 0 (0.0%) |
| 18 to 34 Years | 55 (1.5%) | 13 (0.3%) |
| 35 to 64 Years | 42 (0.8%) | 74 (1.3%) |
| 65 to 74 Years | 29 (1.9%) | 46 (2.7%) |
| 75 Years and over | 102 (16.6%) | 152 (16.1%) |
Technology Access in Drexel Hill
Computing Device Access in Drexel Hill
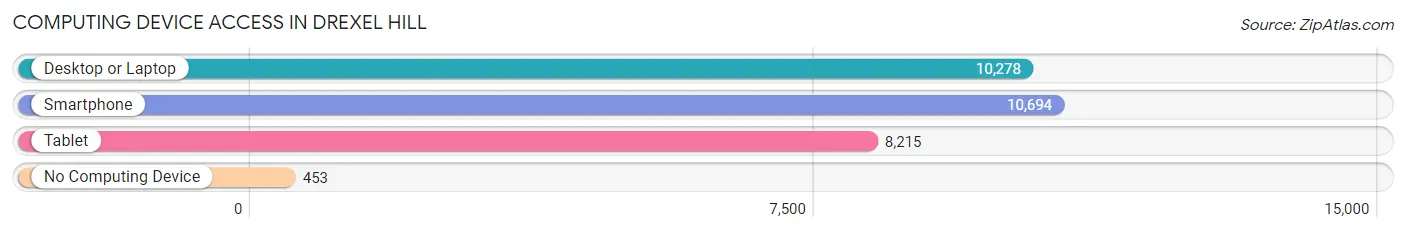
| Device Type | # Households | % Households |
| Desktop or Laptop | 10,278 | 85.7% |
| Smartphone | 10,694 | 89.1% |
| Tablet | 8,215 | 68.5% |
| No Computing Device | 453 | 3.8% |
| Total | 11,999 | 100.0% |
Internet Access in Drexel Hill
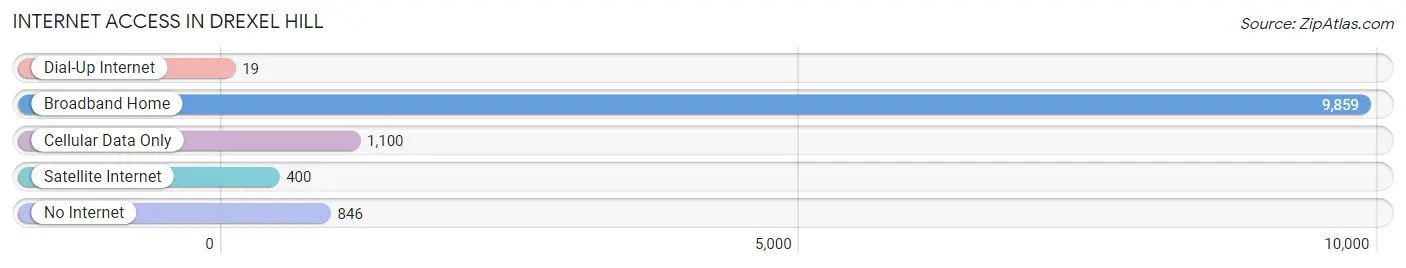
| Internet Type | # Households | % Households |
| Dial-Up Internet | 19 | 0.2% |
| Broadband Home | 9,859 | 82.2% |
| Cellular Data Only | 1,100 | 9.2% |
| Satellite Internet | 400 | 3.3% |
| No Internet | 846 | 7.0% |
| Total | 11,999 | 100.0% |
Drexel Hill Summary
Drexel Hill is a census-designated place (CDP) located in Upper Darby Township, Delaware County, Pennsylvania, United States. It is located approximately 7 miles west of Philadelphia. As of the 2010 census, the population of Drexel Hill was 28,043.
History
Drexel Hill was originally part of the land grant given to William Penn in 1681. The area was first settled in the late 1700s by the Drexel family, who owned a large estate in the area. The Drexel family gave their name to the area, which was originally known as Drexel Hill.
In the late 1800s, the area began to develop as a residential suburb of Philadelphia. The first homes were built in the area in the 1880s, and by the early 1900s, the area had become a popular residential area for middle-class families.
In the 1920s, the area began to experience rapid growth, as more and more people moved to the area. By the 1930s, the population had grown to over 10,000 people.
Geography
Drexel Hill is located at 39°56'45" North, 75°17'45" West (39.94583, -75.29583). It is located in Upper Darby Township, Delaware County, Pennsylvania, United States.
The total area of Drexel Hill is 2.7 square miles, of which 0.02 square miles is water. The terrain is mostly flat, with some hills in the northern part of the area.
Economy
Drexel Hill has a diverse economy, with a mix of retail, manufacturing, and service businesses. The largest employers in the area are the Upper Darby School District, the Upper Darby Township government, and the Drexel University Medical Center.
The area also has a number of small businesses including restaurants shops and other services
Demographics
As of the 2010 census, the population of Drexel Hill was 28,043. The racial makeup of the area was 79.3% White, 11.2% African American, 0.3% Native American, 3.2% Asian, and 4.9% from other races. Hispanic or Latino of any race were 8.2% of the population.
The median household income in Drexel Hill was $50,945, and the median family income was $62,917. The per capita income was $25,945. About 8.2% of families and 10.3% of the population were below the poverty line.
The population of Drexel Hill is well-educated, with over 90% of adults having at least a high school diploma and over 40% having a bachelor's degree or higher. The area is also home to a large number of college students, as it is located near several universities, including Drexel University, University of Pennsylvania, and Temple University.
Common Questions
What is Per Capita Income in Drexel Hill?
Per Capita income in Drexel Hill is $43,061.
What is the Median Family Income in Drexel Hill?
Median Family Income in Drexel Hill is $100,808.
What is the Median Household income in Drexel Hill?
Median Household Income in Drexel Hill is $82,777.
What is Income or Wage Gap in Drexel Hill?
Income or Wage Gap in Drexel Hill is 13.1%.
Women in Drexel Hill earn 86.9 cents for every dollar earned by a man.
What is Inequality or Gini Index in Drexel Hill?
Inequality or Gini Index in Drexel Hill is 0.41.
What is the Total Population of Drexel Hill?
Total Population of Drexel Hill is 29,231.
What is the Total Male Population of Drexel Hill?
Total Male Population of Drexel Hill is 14,129.
What is the Total Female Population of Drexel Hill?
Total Female Population of Drexel Hill is 15,102.
What is the Ratio of Males per 100 Females in Drexel Hill?
There are 93.56 Males per 100 Females in Drexel Hill.
What is the Ratio of Females per 100 Males in Drexel Hill?
There are 106.89 Females per 100 Males in Drexel Hill.
What is the Median Population Age in Drexel Hill?
Median Population Age in Drexel Hill is 37.0 Years.
What is the Average Family Size in Drexel Hill
Average Family Size in Drexel Hill is 3.0 People.
What is the Average Household Size in Drexel Hill
Average Household Size in Drexel Hill is 2.4 People.
How Large is the Labor Force in Drexel Hill?
There are 17,648 People in the Labor Forcein in Drexel Hill.
What is the Percentage of People in the Labor Force in Drexel Hill?
73.8% of People are in the Labor Force in Drexel Hill.
What is the Unemployment Rate in Drexel Hill?
Unemployment Rate in Drexel Hill is 8.7%.