Cornwells Heights, PA Map & Demographics
Cornwells Heights Map
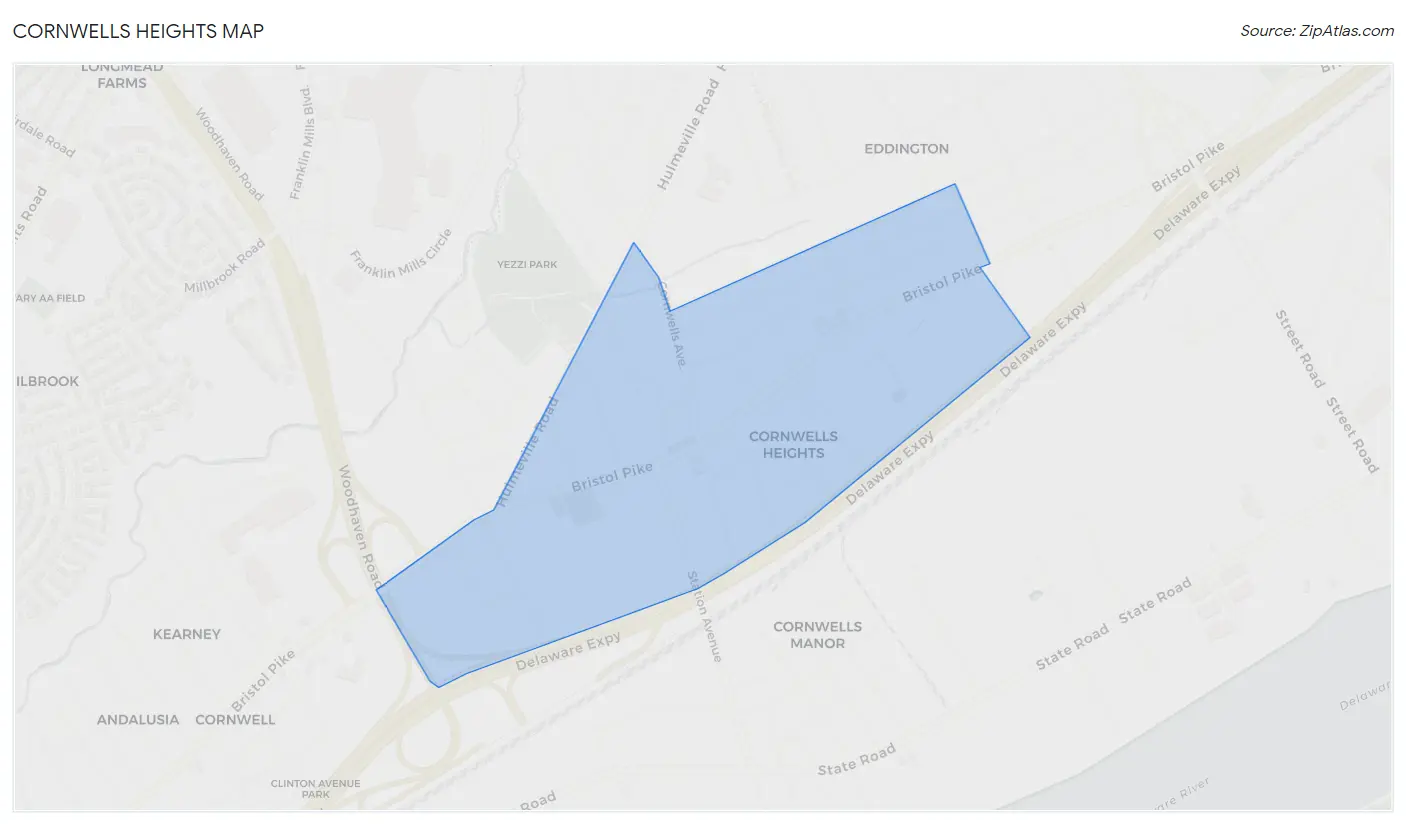
Cornwells Heights Overview
$52,171
PER CAPITA INCOME
$109,565
AVG FAMILY INCOME
$83,977
AVG HOUSEHOLD INCOME
11.3%
WAGE / INCOME GAP [ % ]
88.7¢/ $1
WAGE / INCOME GAP [ $ ]
0.43
INEQUALITY / GINI INDEX
1,339
TOTAL POPULATION
695
MALE POPULATION
644
FEMALE POPULATION
107.92
MALES / 100 FEMALES
92.66
FEMALES / 100 MALES
42.8
MEDIAN AGE
2.6
AVG FAMILY SIZE
2.1
AVG HOUSEHOLD SIZE
824
LABOR FORCE [ PEOPLE ]
71.2%
PERCENT IN LABOR FORCE
6.1%
UNEMPLOYMENT RATE
Income in Cornwells Heights
Income Overview in Cornwells Heights
Per Capita Income in Cornwells Heights is $52,171, while median incomes of families and households are $109,565 and $83,977 respectively.
| Characteristic | Number | Measure |
| Per Capita Income | 1,339 | $52,171 |
| Median Family Income | 360 | $109,565 |
| Mean Family Income | 360 | $144,082 |
| Median Household Income | 592 | $83,977 |
| Mean Household Income | 592 | $113,917 |
| Income Deficit | 360 | $0 |
| Wage / Income Gap (%) | 1,339 | 11.26% |
| Wage / Income Gap ($) | 1,339 | 88.74¢ per $1 |
| Gini / Inequality Index | 1,339 | 0.43 |
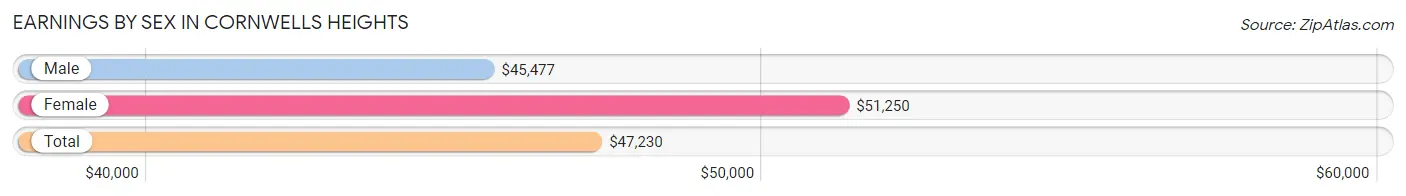
Earnings by Sex in Cornwells Heights
Average Earnings in Cornwells Heights are $47,230, $45,477 for men and $51,250 for women, a difference of 11.3%.
| Sex | Number | Average Earnings |
| Male | 445 (54.3%) | $45,477 |
| Female | 374 (45.7%) | $51,250 |
| Total | 819 (100.0%) | $47,230 |
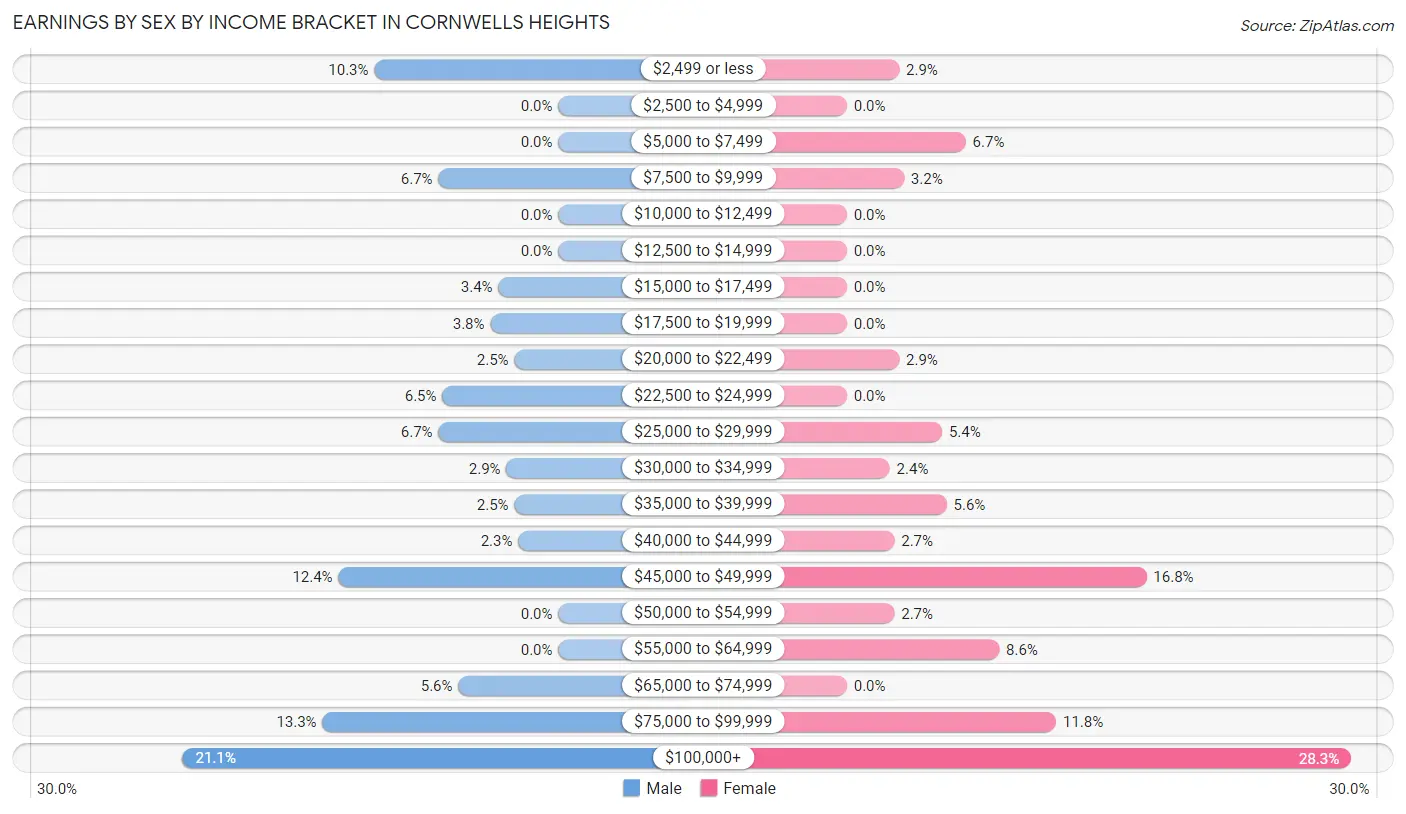
Earnings by Sex by Income Bracket in Cornwells Heights
The most common earnings brackets in Cornwells Heights are $100,000+ for men (94 | 21.1%) and $100,000+ for women (106 | 28.3%).
| Income | Male | Female |
| $2,499 or less | 46 (10.3%) | 11 (2.9%) |
| $2,500 to $4,999 | 0 (0.0%) | 0 (0.0%) |
| $5,000 to $7,499 | 0 (0.0%) | 25 (6.7%) |
| $7,500 to $9,999 | 30 (6.7%) | 12 (3.2%) |
| $10,000 to $12,499 | 0 (0.0%) | 0 (0.0%) |
| $12,500 to $14,999 | 0 (0.0%) | 0 (0.0%) |
| $15,000 to $17,499 | 15 (3.4%) | 0 (0.0%) |
| $17,500 to $19,999 | 17 (3.8%) | 0 (0.0%) |
| $20,000 to $22,499 | 11 (2.5%) | 11 (2.9%) |
| $22,500 to $24,999 | 29 (6.5%) | 0 (0.0%) |
| $25,000 to $29,999 | 30 (6.7%) | 20 (5.3%) |
| $30,000 to $34,999 | 13 (2.9%) | 9 (2.4%) |
| $35,000 to $39,999 | 11 (2.5%) | 21 (5.6%) |
| $40,000 to $44,999 | 10 (2.2%) | 10 (2.7%) |
| $45,000 to $49,999 | 55 (12.4%) | 63 (16.8%) |
| $50,000 to $54,999 | 0 (0.0%) | 10 (2.7%) |
| $55,000 to $64,999 | 0 (0.0%) | 32 (8.6%) |
| $65,000 to $74,999 | 25 (5.6%) | 0 (0.0%) |
| $75,000 to $99,999 | 59 (13.3%) | 44 (11.8%) |
| $100,000+ | 94 (21.1%) | 106 (28.3%) |
| Total | 445 (100.0%) | 374 (100.0%) |
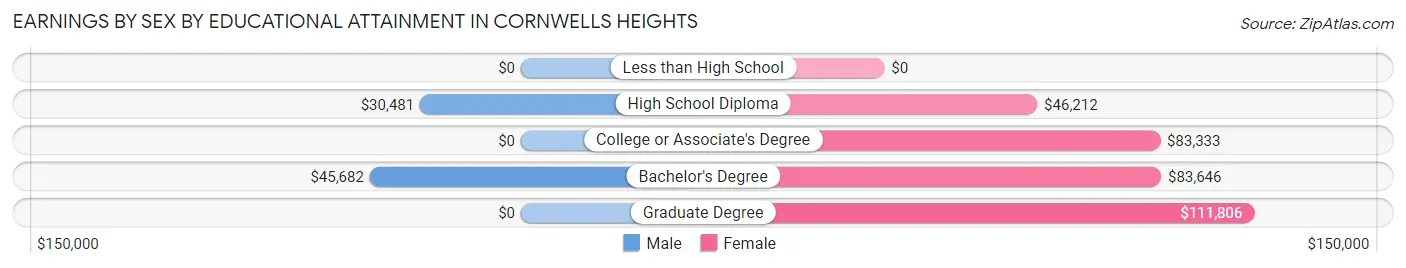
Earnings by Sex by Educational Attainment in Cornwells Heights
Average earnings in Cornwells Heights are $46,205 for men and $55,586 for women, a difference of 16.9%. Men with an educational attainment of bachelor's degree enjoy the highest average annual earnings of $45,682, while those with high school diploma education earn the least with $30,481. Women with an educational attainment of graduate degree earn the most with the average annual earnings of $111,806, while those with high school diploma education have the smallest earnings of $46,212.
| Educational Attainment | Male Income | Female Income |
| Less than High School | - | - |
| High School Diploma | $30,481 | $46,212 |
| College or Associate's Degree | - | - |
| Bachelor's Degree | $45,682 | $83,646 |
| Graduate Degree | - | - |
| Total | $46,205 | $55,586 |
Family Income in Cornwells Heights
Family Income Brackets in Cornwells Heights
According to the Cornwells Heights family income data, there are 125 families falling into the $200,000+ income range, which is the most common income bracket and makes up 34.7% of all families.
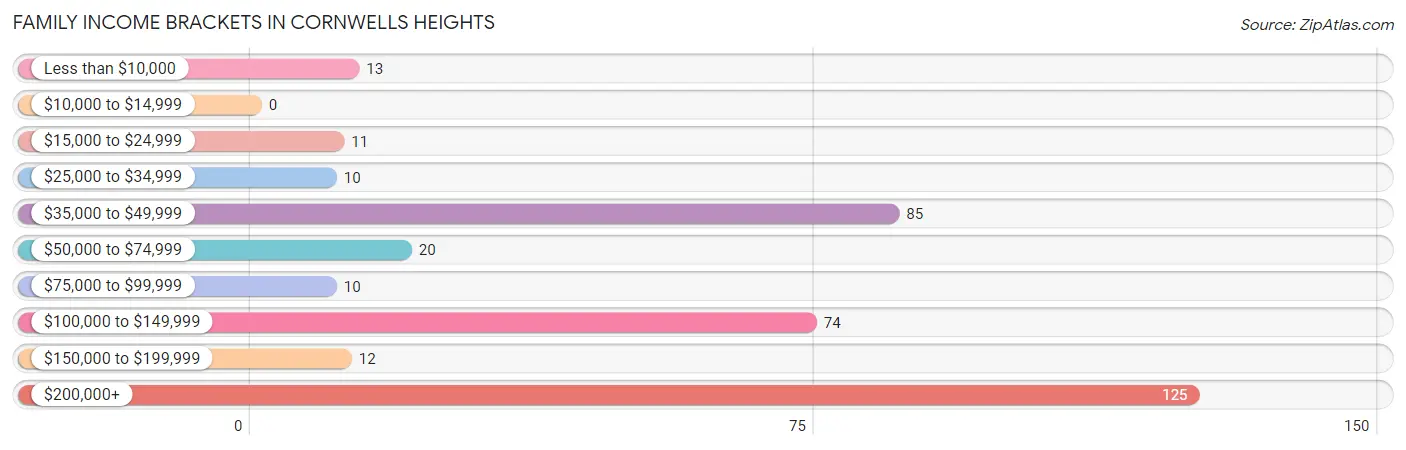
| Income Bracket | # Families | % Families |
| Less than $10,000 | 13 | 3.6% |
| $10,000 to $14,999 | 0 | 0.0% |
| $15,000 to $24,999 | 11 | 3.1% |
| $25,000 to $34,999 | 10 | 2.8% |
| $35,000 to $49,999 | 85 | 23.6% |
| $50,000 to $74,999 | 20 | 5.6% |
| $75,000 to $99,999 | 10 | 2.8% |
| $100,000 to $149,999 | 74 | 20.6% |
| $150,000 to $199,999 | 12 | 3.3% |
| $200,000+ | 125 | 34.7% |
Family Income by Famaliy Size in Cornwells Heights
3-person families (125 | 34.7%) account for the highest median family income in Cornwells Heights with $250,001 per family, while 3-person families (125 | 34.7%) have the highest median income of $83,334 per family member.
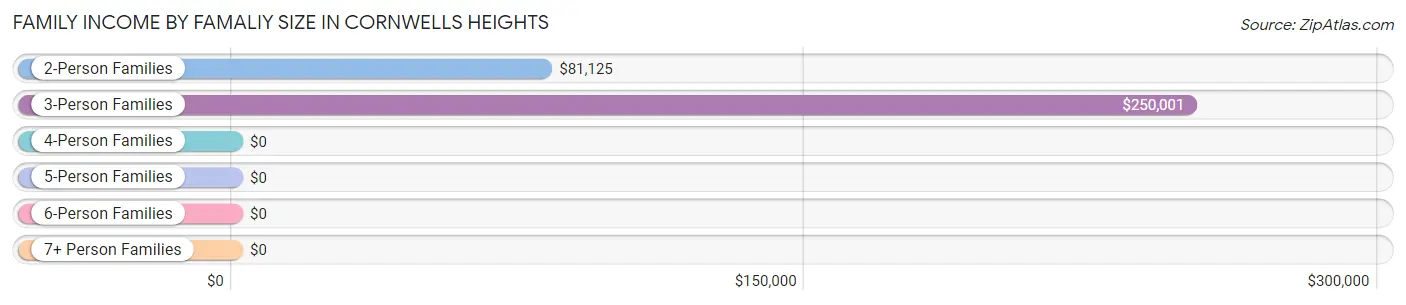
| Income Bracket | # Families | Median Income |
| 2-Person Families | 179 (49.7%) | $81,125 |
| 3-Person Families | 125 (34.7%) | $250,001 |
| 4-Person Families | 22 (6.1%) | $0 |
| 5-Person Families | 20 (5.6%) | $0 |
| 6-Person Families | 0 (0.0%) | $0 |
| 7+ Person Families | 14 (3.9%) | $0 |
| Total | 360 (100.0%) | $109,565 |
Family Income by Number of Earners in Cornwells Heights
The median family income in Cornwells Heights is $109,565, with families comprising 3+ earners (33) having the highest median family income of $204,306, while families with no earners (65) have the lowest median family income of $42,375, accounting for 9.2% and 18.1% of families, respectively.
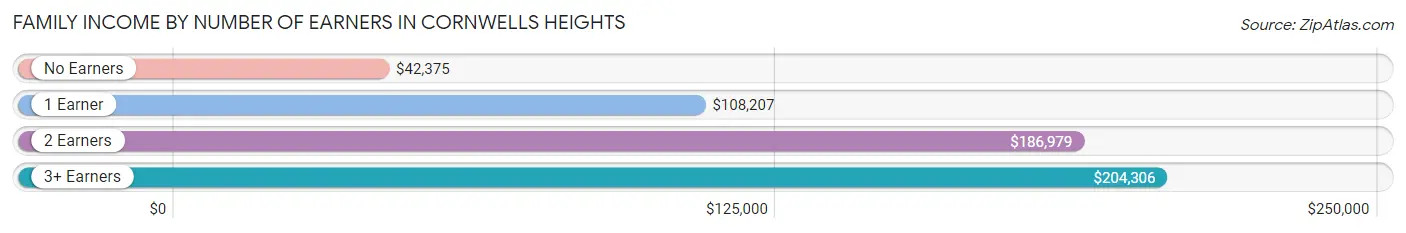
| Number of Earners | # Families | Median Income |
| No Earners | 65 (18.1%) | $42,375 |
| 1 Earner | 53 (14.7%) | $108,207 |
| 2 Earners | 209 (58.1%) | $186,979 |
| 3+ Earners | 33 (9.2%) | $204,306 |
| Total | 360 (100.0%) | $109,565 |
Household Income in Cornwells Heights
Household Income Brackets in Cornwells Heights
With 125 households falling in the category, the $200,000+ income range is the most frequent in Cornwells Heights, accounting for 21.1% of all households.
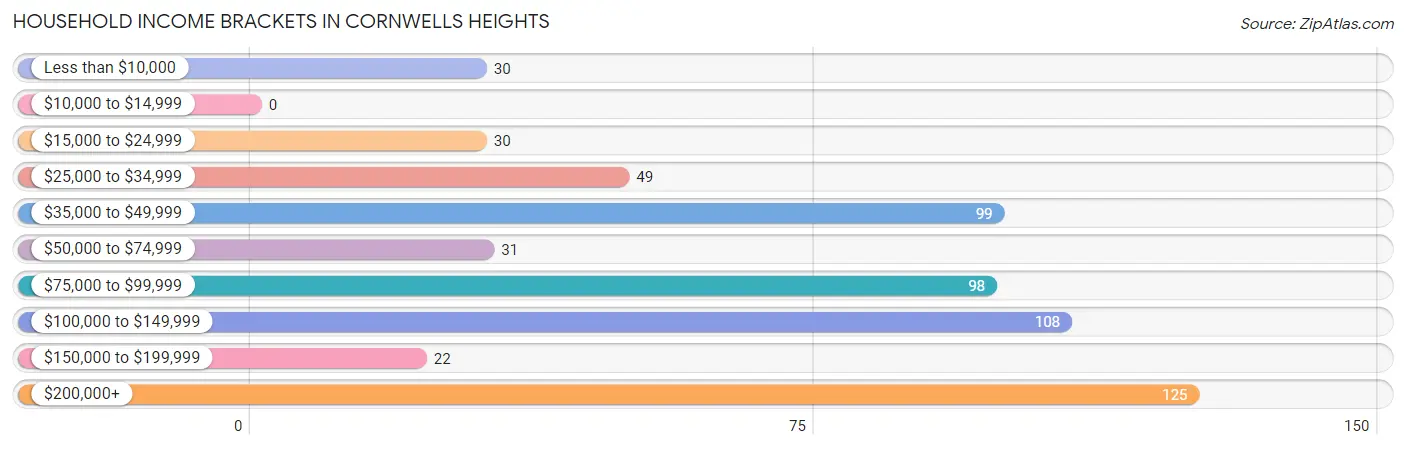
| Income Bracket | # Households | % Households |
| Less than $10,000 | 30 | 5.1% |
| $10,000 to $14,999 | 0 | 0.0% |
| $15,000 to $24,999 | 30 | 5.1% |
| $25,000 to $34,999 | 49 | 8.3% |
| $35,000 to $49,999 | 99 | 16.7% |
| $50,000 to $74,999 | 31 | 5.2% |
| $75,000 to $99,999 | 98 | 16.6% |
| $100,000 to $149,999 | 108 | 18.2% |
| $150,000 to $199,999 | 22 | 3.7% |
| $200,000+ | 125 | 21.1% |
Household Income by Householder Age in Cornwells Heights
The median household income in Cornwells Heights is $83,977, with the highest median household income of $122,802 found in the 25 to 44 years age bracket for the primary householder. A total of 267 households (45.1%) fall into this category.
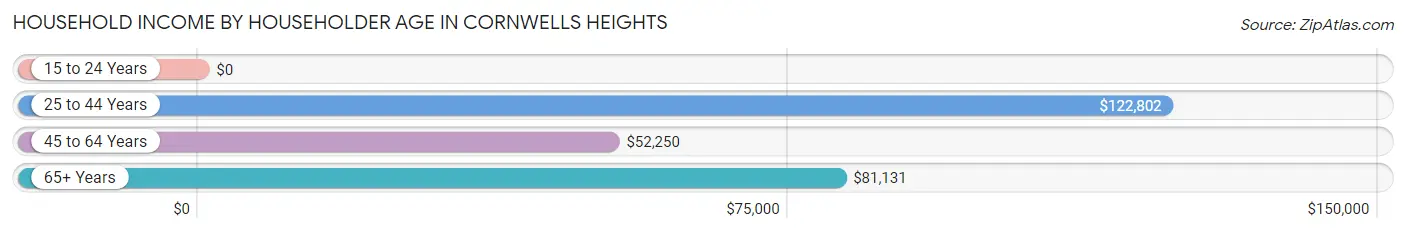
| Income Bracket | # Households | Median Income |
| 15 to 24 Years | 0 (0.0%) | $0 |
| 25 to 44 Years | 267 (45.1%) | $122,802 |
| 45 to 64 Years | 188 (31.8%) | $52,250 |
| 65+ Years | 137 (23.1%) | $81,131 |
| Total | 592 (100.0%) | $83,977 |
Poverty in Cornwells Heights
Income Below Poverty by Sex and Age in Cornwells Heights
With 13.2% poverty level for males and 16.4% for females among the residents of Cornwells Heights, under 5 year old males and 5 year old females are the most vulnerable to poverty, with 13 males (100.0%) and 12 females (100.0%) in their respective age groups living below the poverty level.
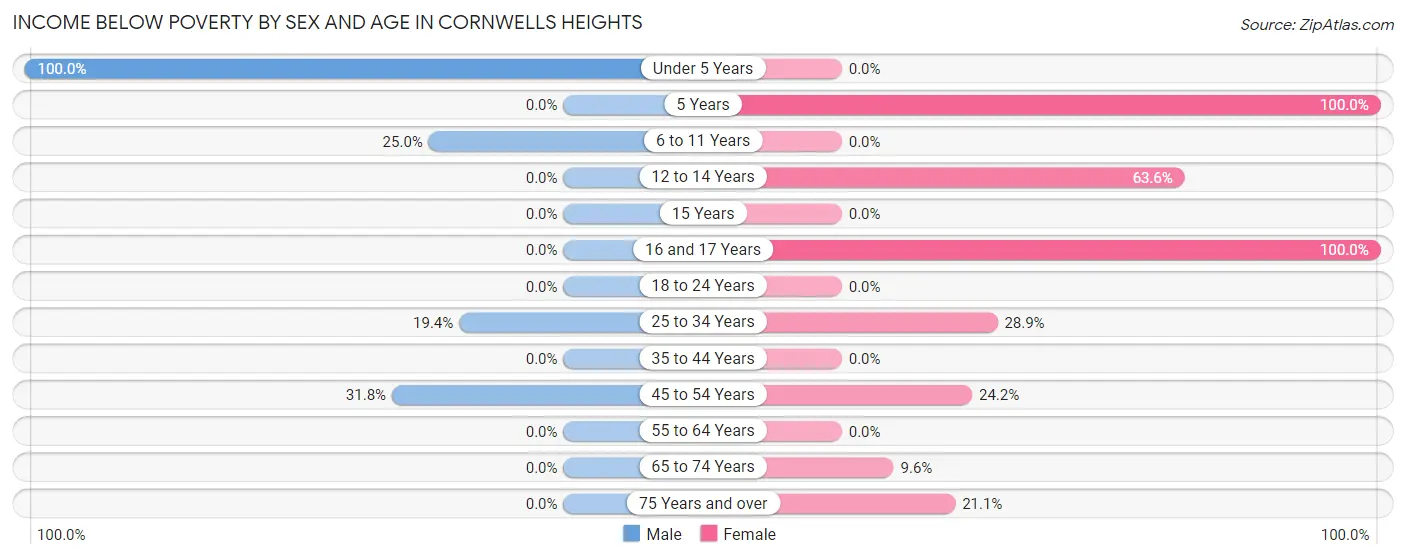
| Age Bracket | Male | Female |
| Under 5 Years | 13 (100.0%) | 0 (0.0%) |
| 5 Years | 0 (0.0%) | 12 (100.0%) |
| 6 to 11 Years | 11 (25.0%) | 0 (0.0%) |
| 12 to 14 Years | 0 (0.0%) | 21 (63.6%) |
| 15 Years | 0 (0.0%) | 0 (0.0%) |
| 16 and 17 Years | 0 (0.0%) | 11 (100.0%) |
| 18 to 24 Years | 0 (0.0%) | 0 (0.0%) |
| 25 to 34 Years | 30 (19.4%) | 13 (28.9%) |
| 35 to 44 Years | 0 (0.0%) | 0 (0.0%) |
| 45 to 54 Years | 35 (31.8%) | 29 (24.2%) |
| 55 to 64 Years | 0 (0.0%) | 0 (0.0%) |
| 65 to 74 Years | 0 (0.0%) | 10 (9.6%) |
| 75 Years and over | 0 (0.0%) | 8 (21.0%) |
| Total | 89 (13.2%) | 104 (16.4%) |
Income Above Poverty by Sex and Age in Cornwells Heights
According to the poverty statistics in Cornwells Heights, males aged 5 years and females aged under 5 years are the age groups that are most secure financially, with 100.0% of males and 100.0% of females in these age groups living above the poverty line.
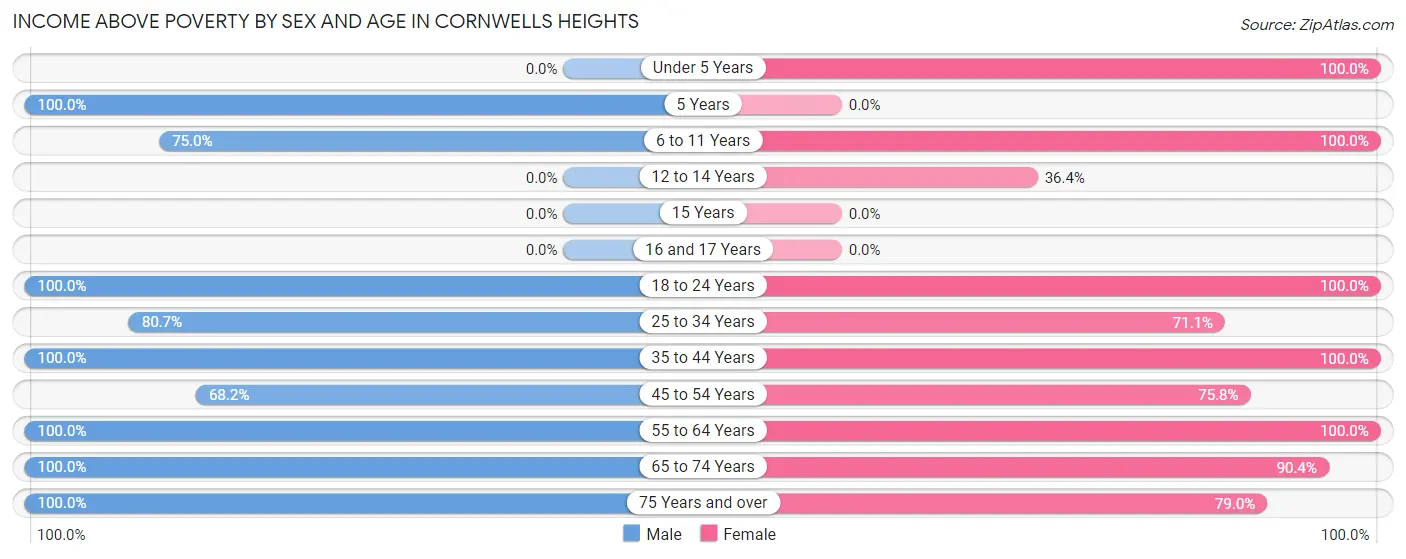
| Age Bracket | Male | Female |
| Under 5 Years | 0 (0.0%) | 48 (100.0%) |
| 5 Years | 12 (100.0%) | 0 (0.0%) |
| 6 to 11 Years | 33 (75.0%) | 12 (100.0%) |
| 12 to 14 Years | 0 (0.0%) | 12 (36.4%) |
| 15 Years | 0 (0.0%) | 0 (0.0%) |
| 16 and 17 Years | 0 (0.0%) | 0 (0.0%) |
| 18 to 24 Years | 32 (100.0%) | 25 (100.0%) |
| 25 to 34 Years | 125 (80.6%) | 32 (71.1%) |
| 35 to 44 Years | 150 (100.0%) | 80 (100.0%) |
| 45 to 54 Years | 75 (68.2%) | 91 (75.8%) |
| 55 to 64 Years | 81 (100.0%) | 108 (100.0%) |
| 65 to 74 Years | 42 (100.0%) | 94 (90.4%) |
| 75 Years and over | 37 (100.0%) | 30 (78.9%) |
| Total | 587 (86.8%) | 532 (83.7%) |
Income Below Poverty Among Married-Couple Families in Cornwells Heights
The poverty statistics for married-couple families in Cornwells Heights show that 4.4% or 11 of the total 252 families live below the poverty line. Families with 3 or 4 children have the highest poverty rate of 44.0%, comprising of 11 families. On the other hand, families with no children have the lowest poverty rate of 0.0%, which includes 0 families.
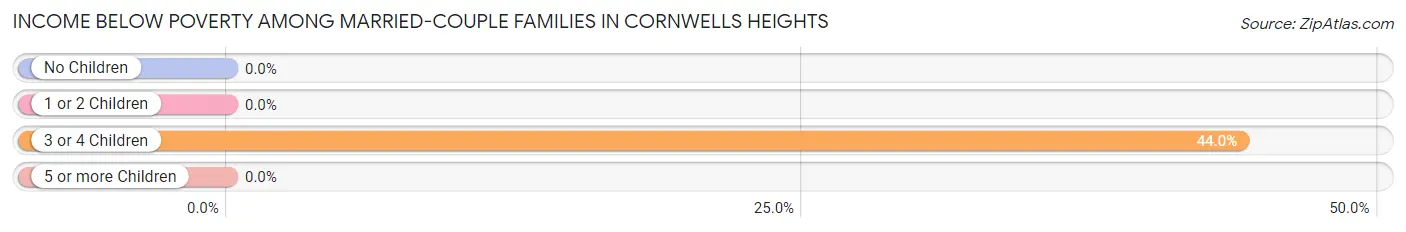
| Children | Above Poverty | Below Poverty |
| No Children | 133 (100.0%) | 0 (0.0%) |
| 1 or 2 Children | 94 (100.0%) | 0 (0.0%) |
| 3 or 4 Children | 14 (56.0%) | 11 (44.0%) |
| 5 or more Children | 0 (0.0%) | 0 (0.0%) |
| Total | 241 (95.6%) | 11 (4.4%) |
Income Below Poverty Among Single-Parent Households in Cornwells Heights
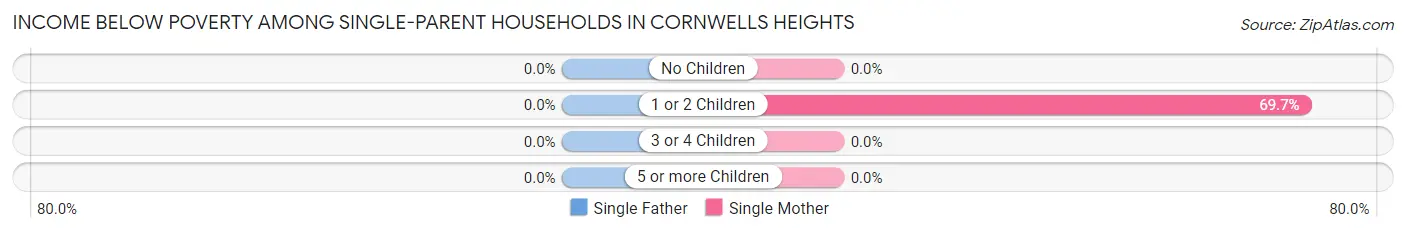
| Children | Single Father | Single Mother |
| No Children | 0 (0.0%) | 0 (0.0%) |
| 1 or 2 Children | 0 (0.0%) | 23 (69.7%) |
| 3 or 4 Children | 0 (0.0%) | 0 (0.0%) |
| 5 or more Children | 0 (0.0%) | 0 (0.0%) |
| Total | 0 (0.0%) | 23 (42.6%) |
Income Below Poverty Among Married-Couple vs Single-Parent Households in Cornwells Heights
The poverty data for Cornwells Heights shows that 11 of the married-couple family households (4.4%) and 23 of the single-parent households (21.3%) are living below the poverty level. Within the married-couple family households, those with 3 or 4 children have the highest poverty rate, with 11 households (44.0%) falling below the poverty line. Among the single-parent households, those with 1 or 2 children have the highest poverty rate, with 23 household (69.7%) living below poverty.
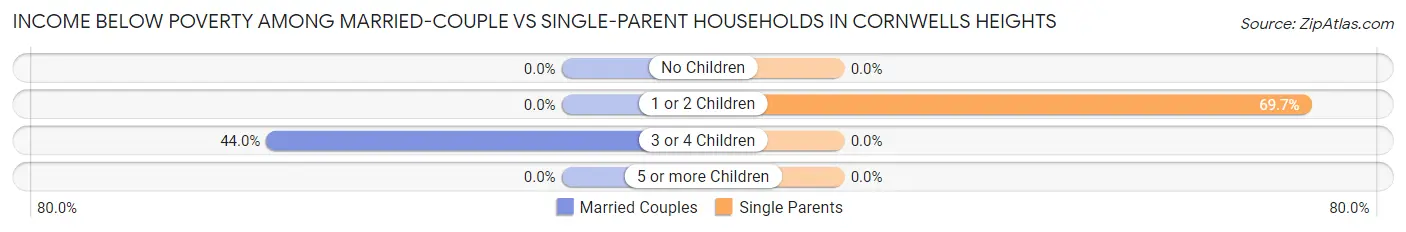
| Children | Married-Couple Families | Single-Parent Households |
| No Children | 0 (0.0%) | 0 (0.0%) |
| 1 or 2 Children | 0 (0.0%) | 23 (69.7%) |
| 3 or 4 Children | 11 (44.0%) | 0 (0.0%) |
| 5 or more Children | 0 (0.0%) | 0 (0.0%) |
| Total | 11 (4.4%) | 23 (21.3%) |
Race in Cornwells Heights
The most populous races in Cornwells Heights are White / Caucasian (1,056 | 78.9%), Asian (125 | 9.3%), and Hispanic or Latino (83 | 6.2%).
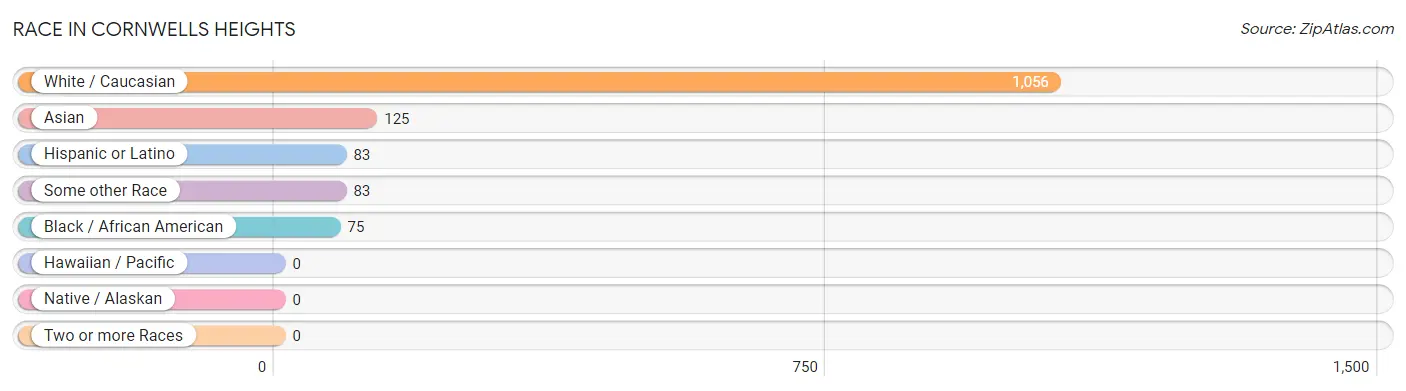
| Race | # Population | % Population |
| Asian | 125 | 9.3% |
| Black / African American | 75 | 5.6% |
| Hawaiian / Pacific | 0 | 0.0% |
| Hispanic or Latino | 83 | 6.2% |
| Native / Alaskan | 0 | 0.0% |
| White / Caucasian | 1,056 | 78.9% |
| Two or more Races | 0 | 0.0% |
| Some other Race | 83 | 6.2% |
| Total | 1,339 | 100.0% |
Ancestry in Cornwells Heights
The most populous ancestries reported in Cornwells Heights are Irish (260 | 19.4%), German (230 | 17.2%), Italian (177 | 13.2%), English (100 | 7.5%), and Sri Lankan (90 | 6.7%), together accounting for 64.0% of all Cornwells Heights residents.
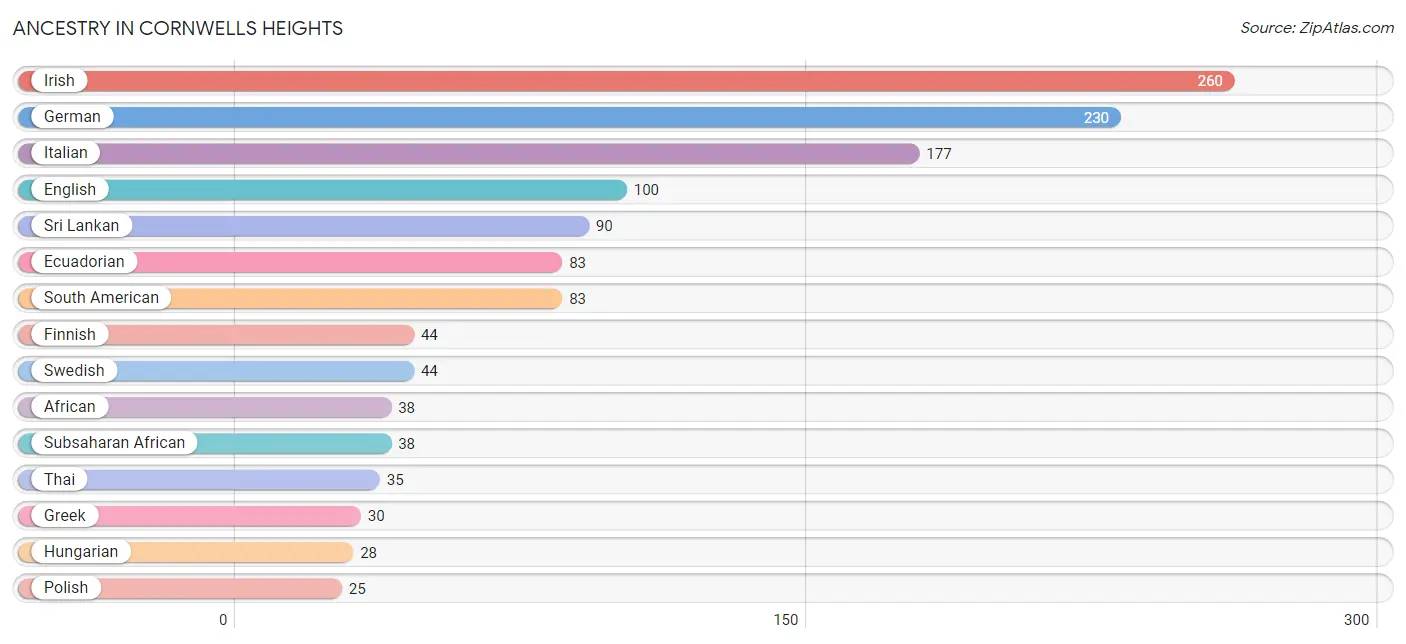
| Ancestry | # Population | % Population |
| African | 38 | 2.8% |
| American | 24 | 1.8% |
| Belgian | 9 | 0.7% |
| Czech | 10 | 0.7% |
| Ecuadorian | 83 | 6.2% |
| English | 100 | 7.5% |
| Finnish | 44 | 3.3% |
| German | 230 | 17.2% |
| Greek | 30 | 2.2% |
| Hungarian | 28 | 2.1% |
| Irish | 260 | 19.4% |
| Italian | 177 | 13.2% |
| Polish | 25 | 1.9% |
| Romanian | 10 | 0.7% |
| Scotch-Irish | 10 | 0.7% |
| Scottish | 20 | 1.5% |
| Slovak | 8 | 0.6% |
| South American | 83 | 6.2% |
| Sri Lankan | 90 | 6.7% |
| Subsaharan African | 38 | 2.8% |
| Swedish | 44 | 3.3% |
| Thai | 35 | 2.6% | View All 22 Rows |
Immigrants in Cornwells Heights
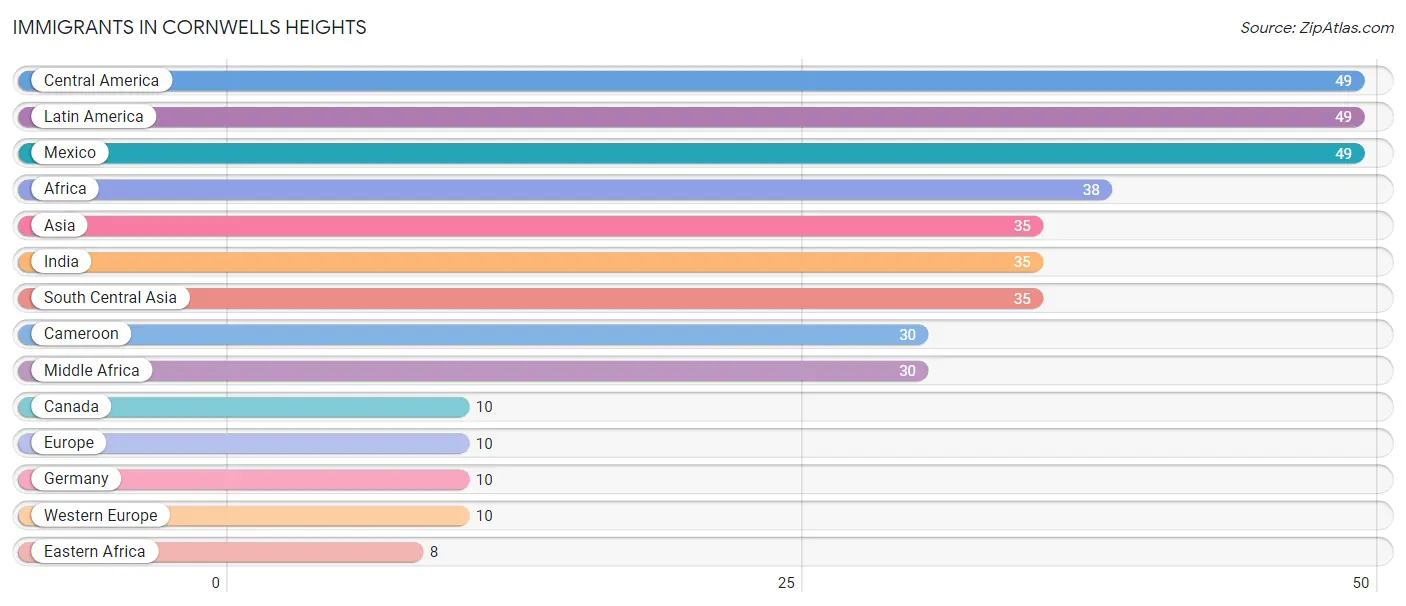
The most numerous immigrant groups reported in Cornwells Heights came from Central America (49 | 3.7%), Latin America (49 | 3.7%), Mexico (49 | 3.7%), Africa (38 | 2.8%), and Asia (35 | 2.6%), together accounting for 16.4% of all Cornwells Heights residents.
| Immigration Origin | # Population | % Population |
| Africa | 38 | 2.8% |
| Asia | 35 | 2.6% |
| Cameroon | 30 | 2.2% |
| Canada | 10 | 0.7% |
| Central America | 49 | 3.7% |
| Eastern Africa | 8 | 0.6% |
| Europe | 10 | 0.7% |
| Germany | 10 | 0.7% |
| India | 35 | 2.6% |
| Latin America | 49 | 3.7% |
| Mexico | 49 | 3.7% |
| Middle Africa | 30 | 2.2% |
| South Central Asia | 35 | 2.6% |
| Western Europe | 10 | 0.7% | View All 14 Rows |
Sex and Age in Cornwells Heights
Sex and Age in Cornwells Heights
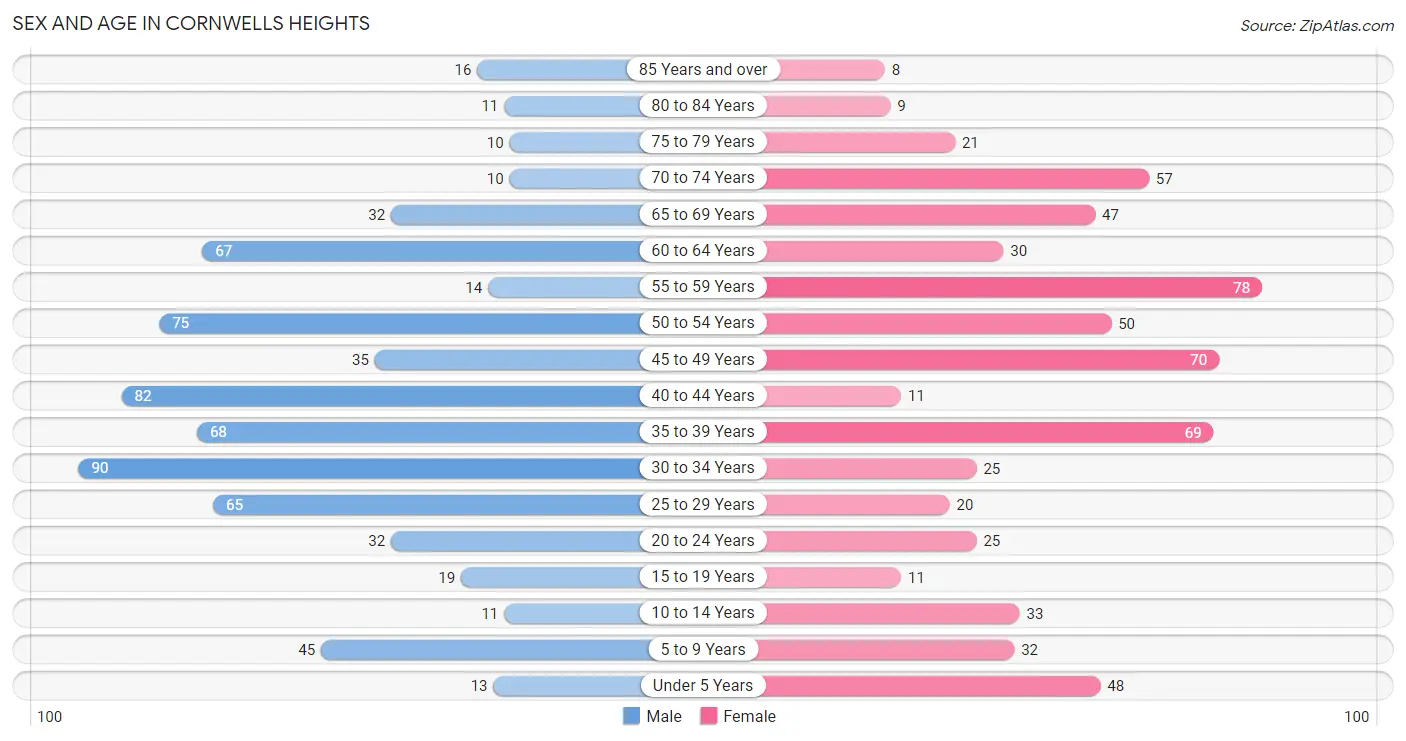
The most populous age groups in Cornwells Heights are 30 to 34 Years (90 | 13.0%) for men and 55 to 59 Years (78 | 12.1%) for women.
| Age Bracket | Male | Female |
| Under 5 Years | 13 (1.9%) | 48 (7.4%) |
| 5 to 9 Years | 45 (6.5%) | 32 (5.0%) |
| 10 to 14 Years | 11 (1.6%) | 33 (5.1%) |
| 15 to 19 Years | 19 (2.7%) | 11 (1.7%) |
| 20 to 24 Years | 32 (4.6%) | 25 (3.9%) |
| 25 to 29 Years | 65 (9.3%) | 20 (3.1%) |
| 30 to 34 Years | 90 (13.0%) | 25 (3.9%) |
| 35 to 39 Years | 68 (9.8%) | 69 (10.7%) |
| 40 to 44 Years | 82 (11.8%) | 11 (1.7%) |
| 45 to 49 Years | 35 (5.0%) | 70 (10.9%) |
| 50 to 54 Years | 75 (10.8%) | 50 (7.8%) |
| 55 to 59 Years | 14 (2.0%) | 78 (12.1%) |
| 60 to 64 Years | 67 (9.6%) | 30 (4.7%) |
| 65 to 69 Years | 32 (4.6%) | 47 (7.3%) |
| 70 to 74 Years | 10 (1.4%) | 57 (8.8%) |
| 75 to 79 Years | 10 (1.4%) | 21 (3.3%) |
| 80 to 84 Years | 11 (1.6%) | 9 (1.4%) |
| 85 Years and over | 16 (2.3%) | 8 (1.2%) |
| Total | 695 (100.0%) | 644 (100.0%) |
Families and Households in Cornwells Heights
Median Family Size in Cornwells Heights
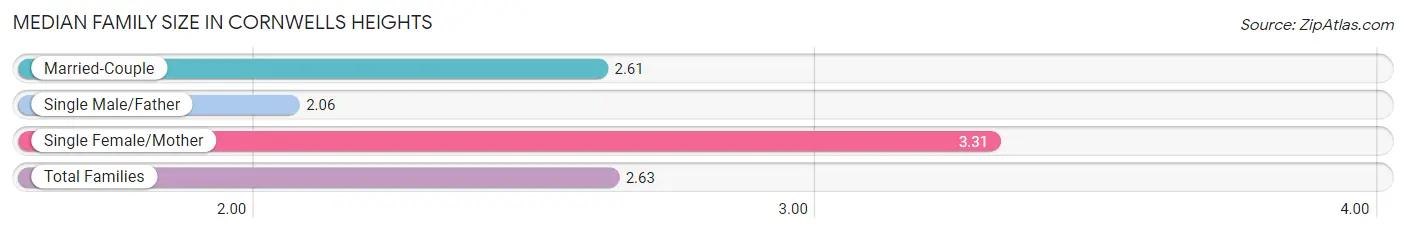
The median family size in Cornwells Heights is 2.63 persons per family, with single female/mother families (54 | 15.0%) accounting for the largest median family size of 3.31 persons per family. On the other hand, single male/father families (54 | 15.0%) represent the smallest median family size with 2.06 persons per family.
| Family Type | # Families | Family Size |
| Married-Couple | 252 (70.0%) | 2.61 |
| Single Male/Father | 54 (15.0%) | 2.06 |
| Single Female/Mother | 54 (15.0%) | 3.31 |
| Total Families | 360 (100.0%) | 2.63 |
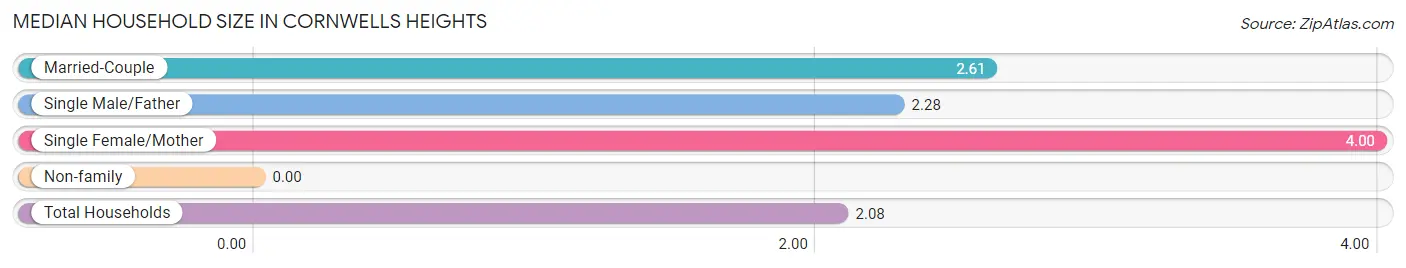
Median Household Size in Cornwells Heights
| Household Type | # Households | Household Size |
| Married-Couple | 252 (42.6%) | 2.61 |
| Single Male/Father | 54 (9.1%) | 2.28 |
| Single Female/Mother | 54 (9.1%) | 4.00 |
| Non-family | 232 (39.2%) | - |
| Total Households | 592 (100.0%) | 2.08 |
Household Size by Marriage Status in Cornwells Heights
Out of a total of 592 households in Cornwells Heights, 360 (60.8%) are family households, while 232 (39.2%) are nonfamily households. The most numerous type of family households are 2-person households, comprising 158, and the most common type of nonfamily households are 1-person households, comprising 232.
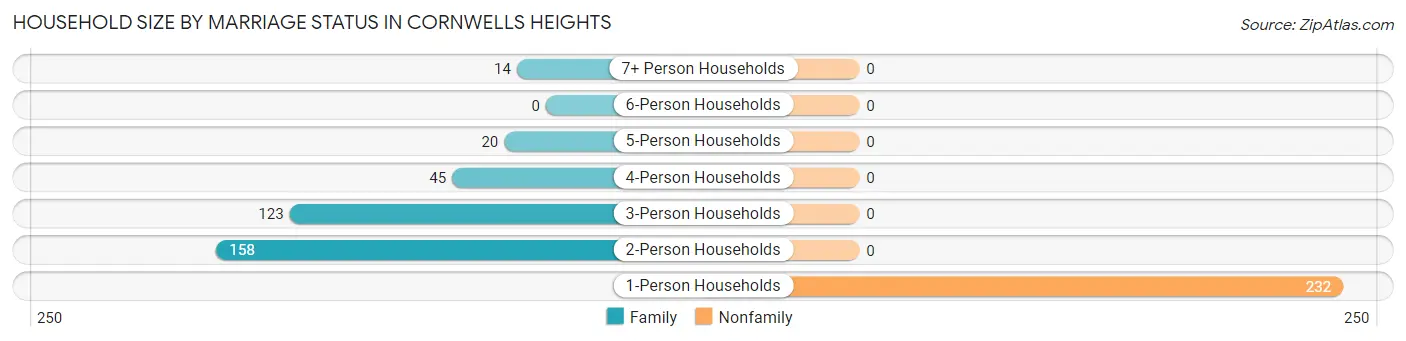
| Household Size | Family Households | Nonfamily Households |
| 1-Person Households | - | 232 (39.2%) |
| 2-Person Households | 158 (26.7%) | 0 (0.0%) |
| 3-Person Households | 123 (20.8%) | 0 (0.0%) |
| 4-Person Households | 45 (7.6%) | 0 (0.0%) |
| 5-Person Households | 20 (3.4%) | 0 (0.0%) |
| 6-Person Households | 0 (0.0%) | 0 (0.0%) |
| 7+ Person Households | 14 (2.4%) | 0 (0.0%) |
| Total | 360 (60.8%) | 232 (39.2%) |
Female Fertility in Cornwells Heights
Fertility by Age in Cornwells Heights
| Age Bracket | Women with Births | Births / 1,000 Women |
| 15 to 19 years | 0 (0.0%) | 0.0 |
| 20 to 34 years | 0 (0.0%) | 0.0 |
| 35 to 50 years | 0 (0.0%) | 0.0 |
| Total | 0 (0.0%) | 0.0 |
Fertility by Age by Marriage Status in Cornwells Heights
| Age Bracket | Married | Unmarried |
| 15 to 19 years | 0 (0.0%) | 0 (0.0%) |
| 20 to 34 years | 0 (0.0%) | 0 (0.0%) |
| 35 to 50 years | 0 (0.0%) | 0 (0.0%) |
| Total | 0 (0.0%) | 0 (0.0%) |
Fertility by Education in Cornwells Heights
| Educational Attainment | Women with Births | Births / 1,000 Women |
| Less than High School | 0 (0.0%) | 0.0 |
| High School Diploma | 0 (0.0%) | 0.0 |
| College or Associate's Degree | 0 (0.0%) | 0.0 |
| Bachelor's Degree | 0 (0.0%) | 0.0 |
| Graduate Degree | 0 (0.0%) | 0.0 |
| Total | 0 (0.0%) | 0.0 |
Fertility by Education by Marriage Status in Cornwells Heights
| Educational Attainment | Married | Unmarried |
| Less than High School | 0 (0.0%) | 0 (0.0%) |
| High School Diploma | 0 (0.0%) | 0 (0.0%) |
| College or Associate's Degree | 0 (0.0%) | 0 (0.0%) |
| Bachelor's Degree | 0 (0.0%) | 0 (0.0%) |
| Graduate Degree | 0 (0.0%) | 0 (0.0%) |
| Total | 0 (0.0%) | 0 (0.0%) |
Employment Characteristics in Cornwells Heights
Employment by Class of Employer in Cornwells Heights
Among the 747 employed individuals in Cornwells Heights, private company employees (481 | 64.4%), not-for-profit organizations (82 | 11.0%), and federal government employees (58 | 7.8%) make up the most common classes of employment.
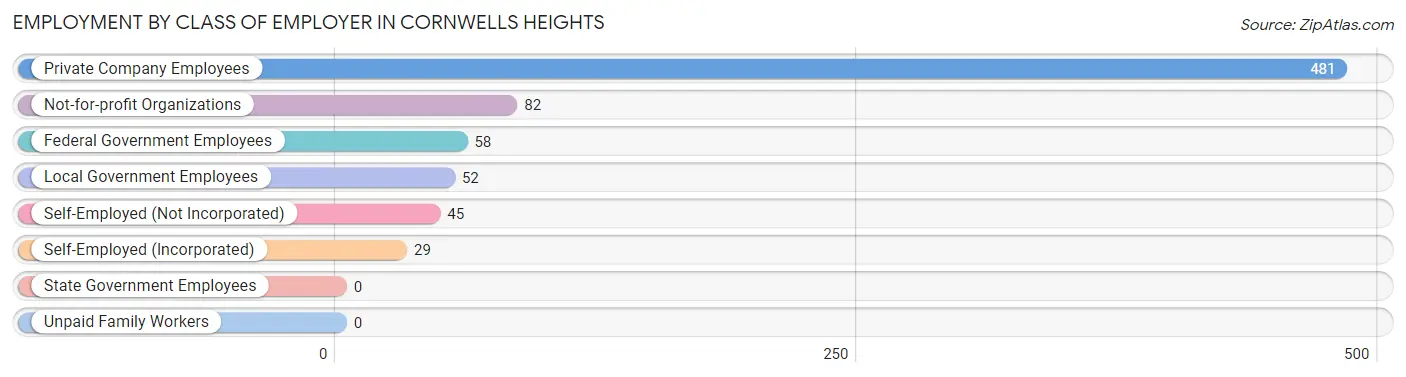
| Employer Class | # Employees | % Employees |
| Private Company Employees | 481 | 64.4% |
| Self-Employed (Incorporated) | 29 | 3.9% |
| Self-Employed (Not Incorporated) | 45 | 6.0% |
| Not-for-profit Organizations | 82 | 11.0% |
| Local Government Employees | 52 | 7.0% |
| State Government Employees | 0 | 0.0% |
| Federal Government Employees | 58 | 7.8% |
| Unpaid Family Workers | 0 | 0.0% |
| Total | 747 | 100.0% |
Employment Status by Age in Cornwells Heights
According to the labor force statistics for Cornwells Heights, out of the total population over 16 years of age (1,157), 71.2% or 824 individuals are in the labor force, with 6.1% or 50 of them unemployed. The age group with the highest labor force participation rate is 20 to 24 years, with 100.0% or 57 individuals in the labor force. Within the labor force, the 60 to 64 years age range has the highest percentage of unemployed individuals, with 32.5% or 25 of them being unemployed.
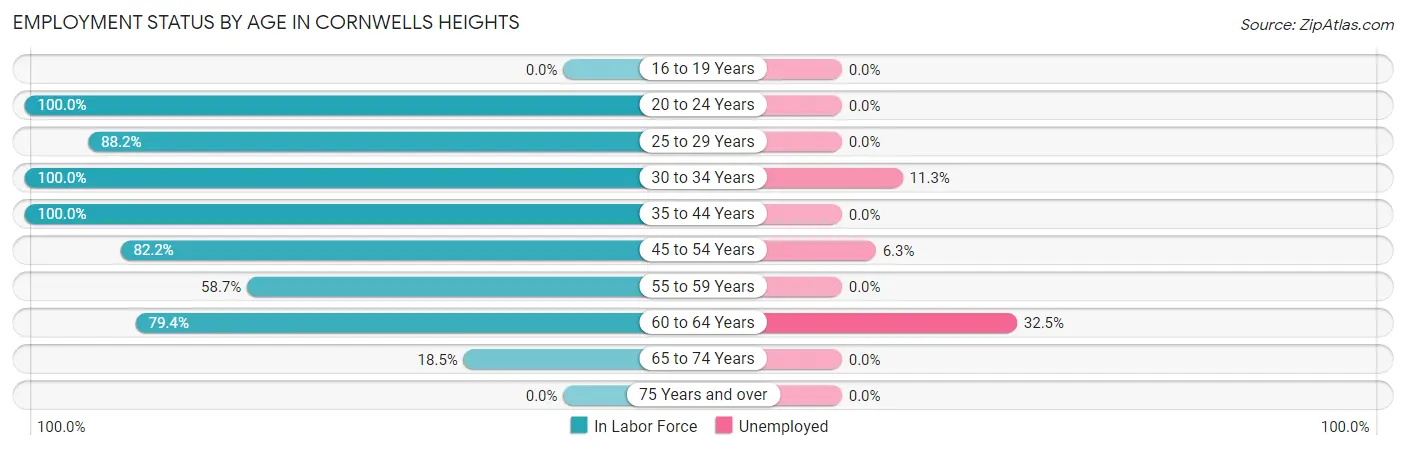
| Age Bracket | In Labor Force | Unemployed |
| 16 to 19 Years | 0 (0.0%) | 0 (0.0%) |
| 20 to 24 Years | 57 (100.0%) | 0 (0.0%) |
| 25 to 29 Years | 75 (88.2%) | 0 (0.0%) |
| 30 to 34 Years | 115 (100.0%) | 13 (11.3%) |
| 35 to 44 Years | 230 (100.0%) | 0 (0.0%) |
| 45 to 54 Years | 189 (82.2%) | 12 (6.3%) |
| 55 to 59 Years | 54 (58.7%) | 0 (0.0%) |
| 60 to 64 Years | 77 (79.4%) | 25 (32.5%) |
| 65 to 74 Years | 27 (18.5%) | 0 (0.0%) |
| 75 Years and over | 0 (0.0%) | 0 (0.0%) |
| Total | 824 (71.2%) | 50 (6.1%) |
Employment Status by Educational Attainment in Cornwells Heights
According to labor force statistics for Cornwells Heights, 87.2% of individuals (740) out of the total population between 25 and 64 years of age (849) are in the labor force, with 6.8% or 50 of them being unemployed. The group with the highest labor force participation rate are those with the educational attainment of less than high school, with 100.0% or 11 individuals in the labor force. Within the labor force, individuals with high school diploma education have the highest percentage of unemployment, with 22.0% or 50 of them being unemployed.
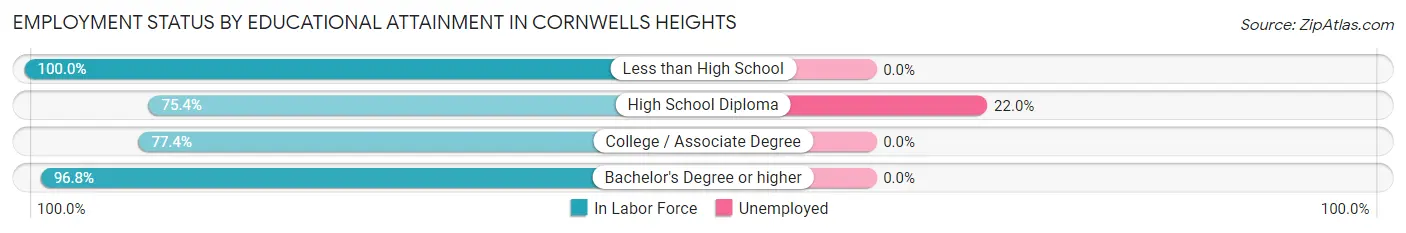
| Educational Attainment | In Labor Force | Unemployed |
| Less than High School | 11 (100.0%) | 0 (0.0%) |
| High School Diploma | 227 (75.4%) | 66 (22.0%) |
| College / Associate Degree | 72 (77.4%) | 0 (0.0%) |
| Bachelor's Degree or higher | 430 (96.8%) | 0 (0.0%) |
| Total | 740 (87.2%) | 58 (6.8%) |
Employment Occupations by Sex in Cornwells Heights
Management, Business, Science and Arts Occupations
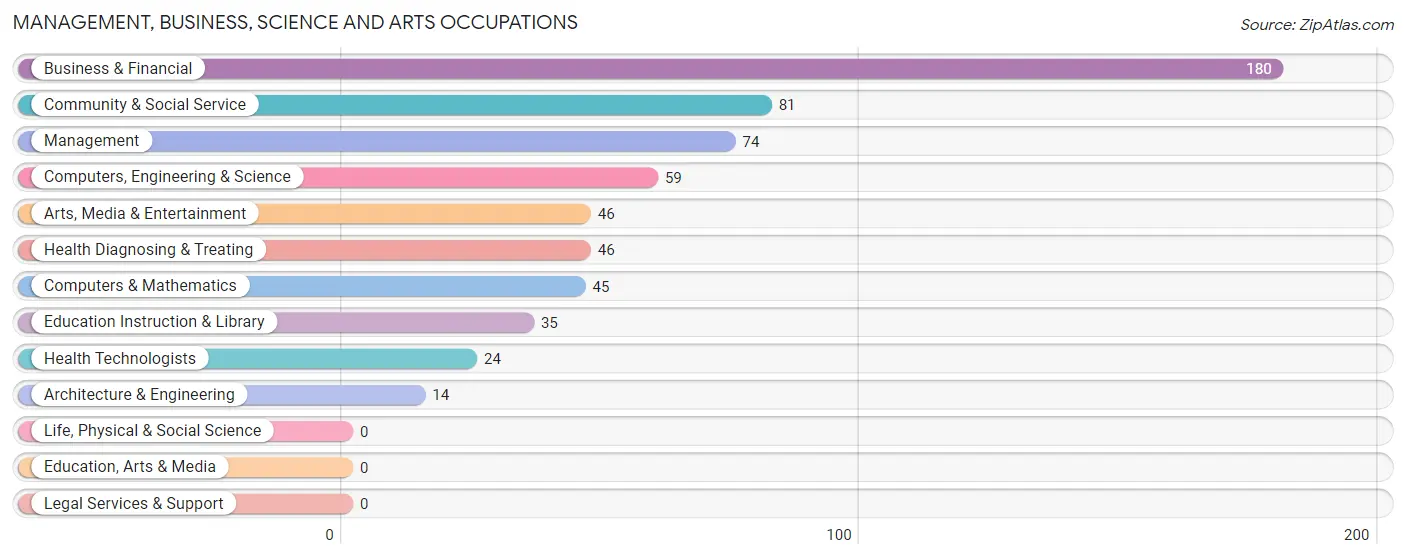
The most common Management, Business, Science and Arts occupations in Cornwells Heights are Business & Financial (180 | 23.3%), Community & Social Service (81 | 10.5%), Management (74 | 9.6%), Computers, Engineering & Science (59 | 7.6%), and Arts, Media & Entertainment (46 | 5.9%).
Management, Business, Science and Arts Occupations by Sex
Within the Management, Business, Science and Arts occupations in Cornwells Heights, the most male-oriented occupations are Architecture & Engineering (100.0%), Arts, Media & Entertainment (100.0%), and Computers, Engineering & Science (83.1%), while the most female-oriented occupations are Health Diagnosing & Treating (100.0%), Health Technologists (100.0%), and Education Instruction & Library (65.7%).
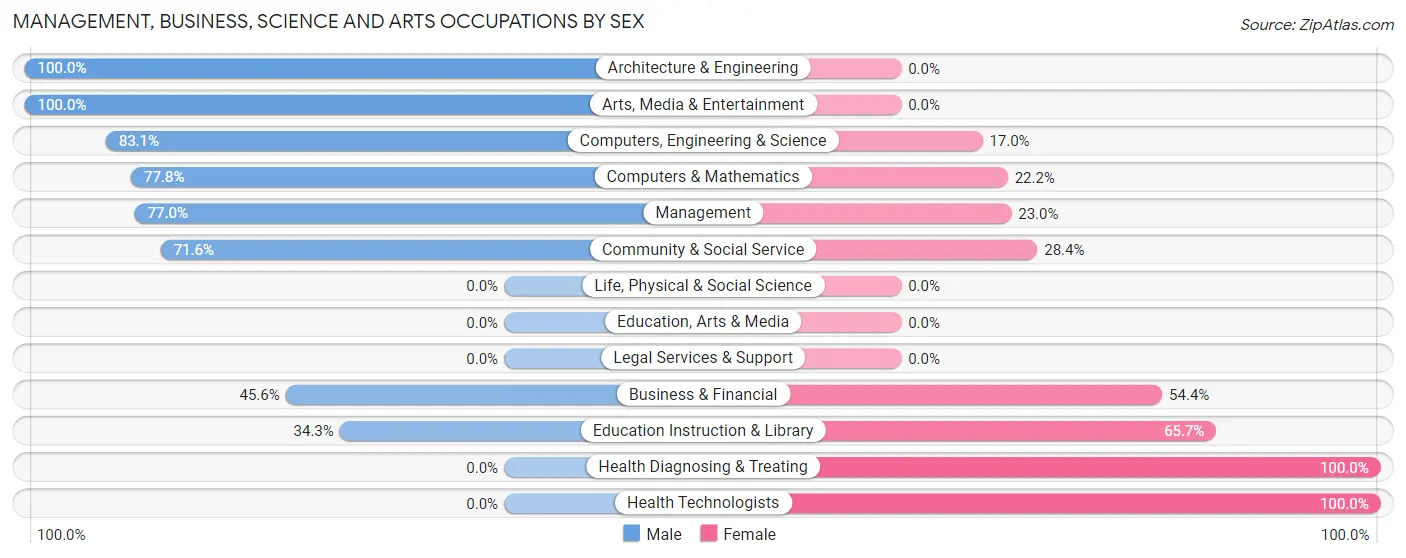
| Occupation | Male | Female |
| Management | 57 (77.0%) | 17 (23.0%) |
| Business & Financial | 82 (45.6%) | 98 (54.4%) |
| Computers, Engineering & Science | 49 (83.1%) | 10 (17.0%) |
| Computers & Mathematics | 35 (77.8%) | 10 (22.2%) |
| Architecture & Engineering | 14 (100.0%) | 0 (0.0%) |
| Life, Physical & Social Science | 0 (0.0%) | 0 (0.0%) |
| Community & Social Service | 58 (71.6%) | 23 (28.4%) |
| Education, Arts & Media | 0 (0.0%) | 0 (0.0%) |
| Legal Services & Support | 0 (0.0%) | 0 (0.0%) |
| Education Instruction & Library | 12 (34.3%) | 23 (65.7%) |
| Arts, Media & Entertainment | 46 (100.0%) | 0 (0.0%) |
| Health Diagnosing & Treating | 0 (0.0%) | 46 (100.0%) |
| Health Technologists | 0 (0.0%) | 24 (100.0%) |
| Total (Category) | 246 (55.9%) | 194 (44.1%) |
| Total (Overall) | 445 (57.5%) | 329 (42.5%) |
Services Occupations
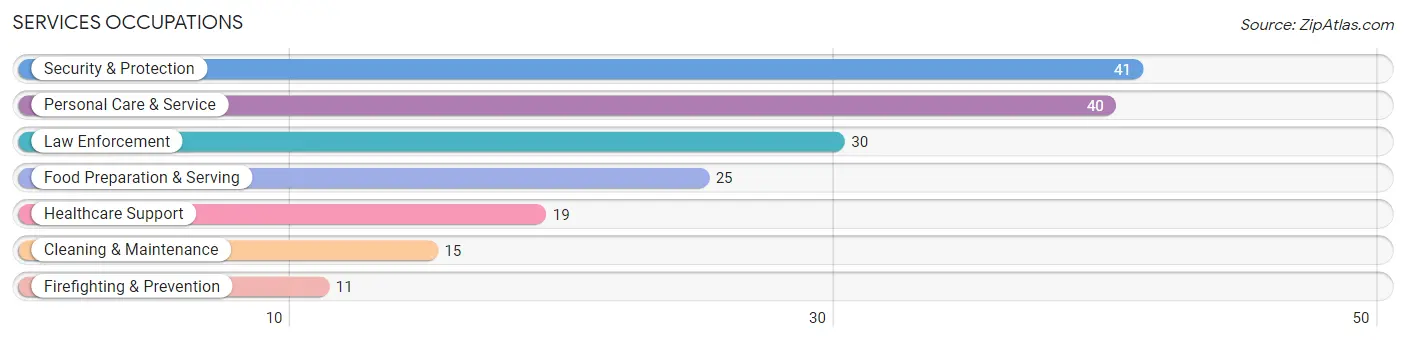
The most common Services occupations in Cornwells Heights are Security & Protection (41 | 5.3%), Personal Care & Service (40 | 5.2%), Law Enforcement (30 | 3.9%), Food Preparation & Serving (25 | 3.2%), and Healthcare Support (19 | 2.5%).
Services Occupations by Sex
Within the Services occupations in Cornwells Heights, the most male-oriented occupations are Law Enforcement (100.0%), Cleaning & Maintenance (100.0%), and Security & Protection (73.2%), while the most female-oriented occupations are Firefighting & Prevention (100.0%), Food Preparation & Serving (100.0%), and Personal Care & Service (100.0%).
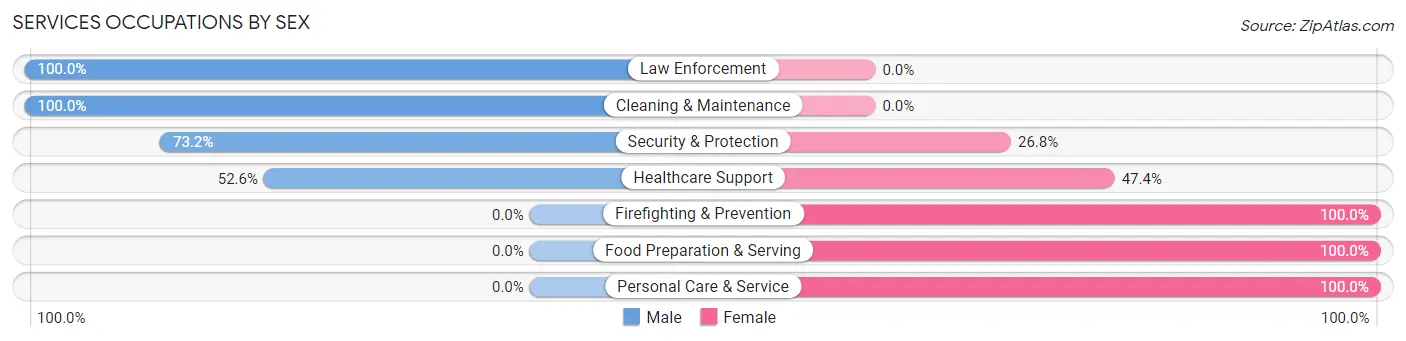
| Occupation | Male | Female |
| Healthcare Support | 10 (52.6%) | 9 (47.4%) |
| Security & Protection | 30 (73.2%) | 11 (26.8%) |
| Firefighting & Prevention | 0 (0.0%) | 11 (100.0%) |
| Law Enforcement | 30 (100.0%) | 0 (0.0%) |
| Food Preparation & Serving | 0 (0.0%) | 25 (100.0%) |
| Cleaning & Maintenance | 15 (100.0%) | 0 (0.0%) |
| Personal Care & Service | 0 (0.0%) | 40 (100.0%) |
| Total (Category) | 55 (39.3%) | 85 (60.7%) |
| Total (Overall) | 445 (57.5%) | 329 (42.5%) |
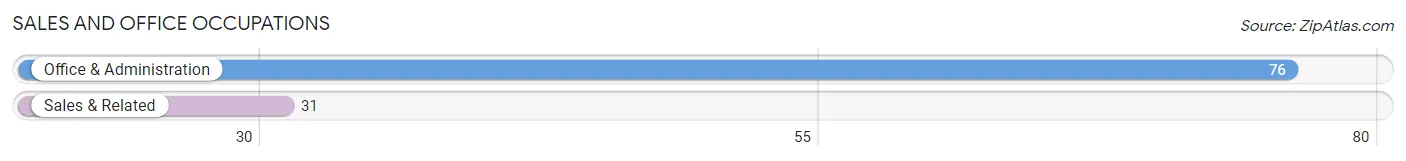
Sales and Office Occupations
The most common Sales and Office occupations in Cornwells Heights are Office & Administration (76 | 9.8%), and Sales & Related (31 | 4.0%).
Sales and Office Occupations by Sex
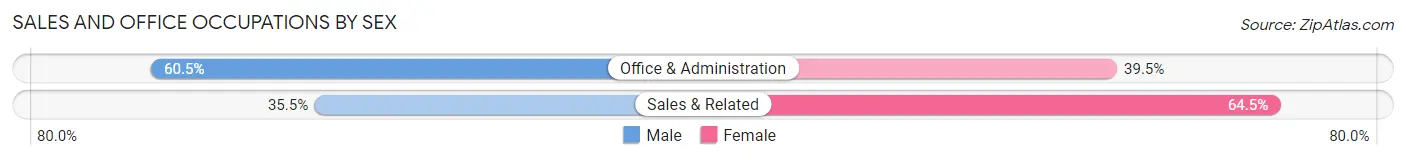
| Occupation | Male | Female |
| Sales & Related | 11 (35.5%) | 20 (64.5%) |
| Office & Administration | 46 (60.5%) | 30 (39.5%) |
| Total (Category) | 57 (53.3%) | 50 (46.7%) |
| Total (Overall) | 445 (57.5%) | 329 (42.5%) |
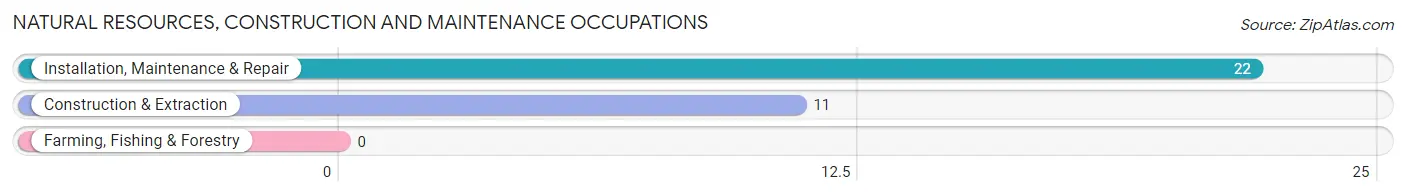
Natural Resources, Construction and Maintenance Occupations
The most common Natural Resources, Construction and Maintenance occupations in Cornwells Heights are Installation, Maintenance & Repair (22 | 2.8%), and Construction & Extraction (11 | 1.4%).
Natural Resources, Construction and Maintenance Occupations by Sex
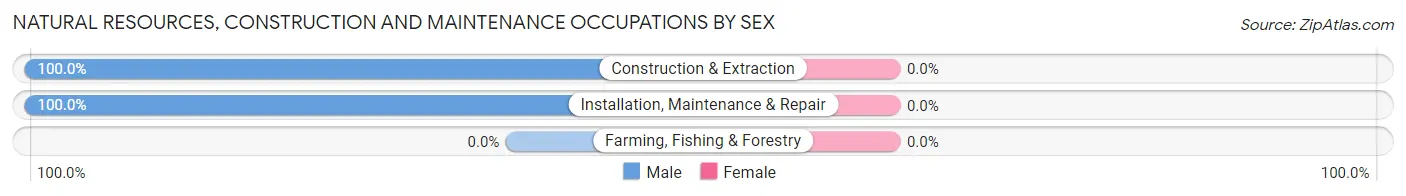
| Occupation | Male | Female |
| Farming, Fishing & Forestry | 0 (0.0%) | 0 (0.0%) |
| Construction & Extraction | 11 (100.0%) | 0 (0.0%) |
| Installation, Maintenance & Repair | 22 (100.0%) | 0 (0.0%) |
| Total (Category) | 33 (100.0%) | 0 (0.0%) |
| Total (Overall) | 445 (57.5%) | 329 (42.5%) |
Production, Transportation and Moving Occupations
The most common Production, Transportation and Moving occupations in Cornwells Heights are Material Moving (30 | 3.9%), Transportation (13 | 1.7%), and Production (11 | 1.4%).
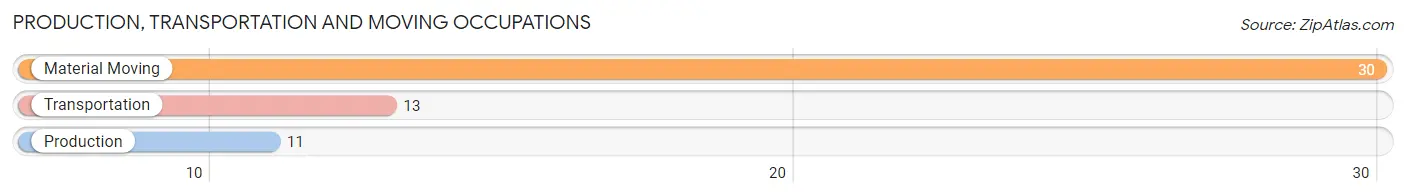
Production, Transportation and Moving Occupations by Sex
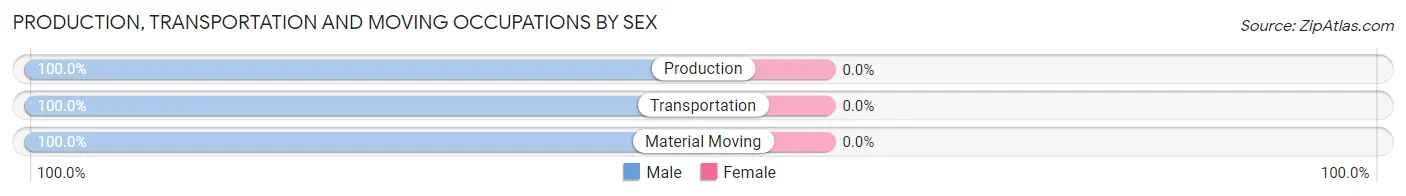
| Occupation | Male | Female |
| Production | 11 (100.0%) | 0 (0.0%) |
| Transportation | 13 (100.0%) | 0 (0.0%) |
| Material Moving | 30 (100.0%) | 0 (0.0%) |
| Total (Category) | 54 (100.0%) | 0 (0.0%) |
| Total (Overall) | 445 (57.5%) | 329 (42.5%) |
Employment Industries by Sex in Cornwells Heights
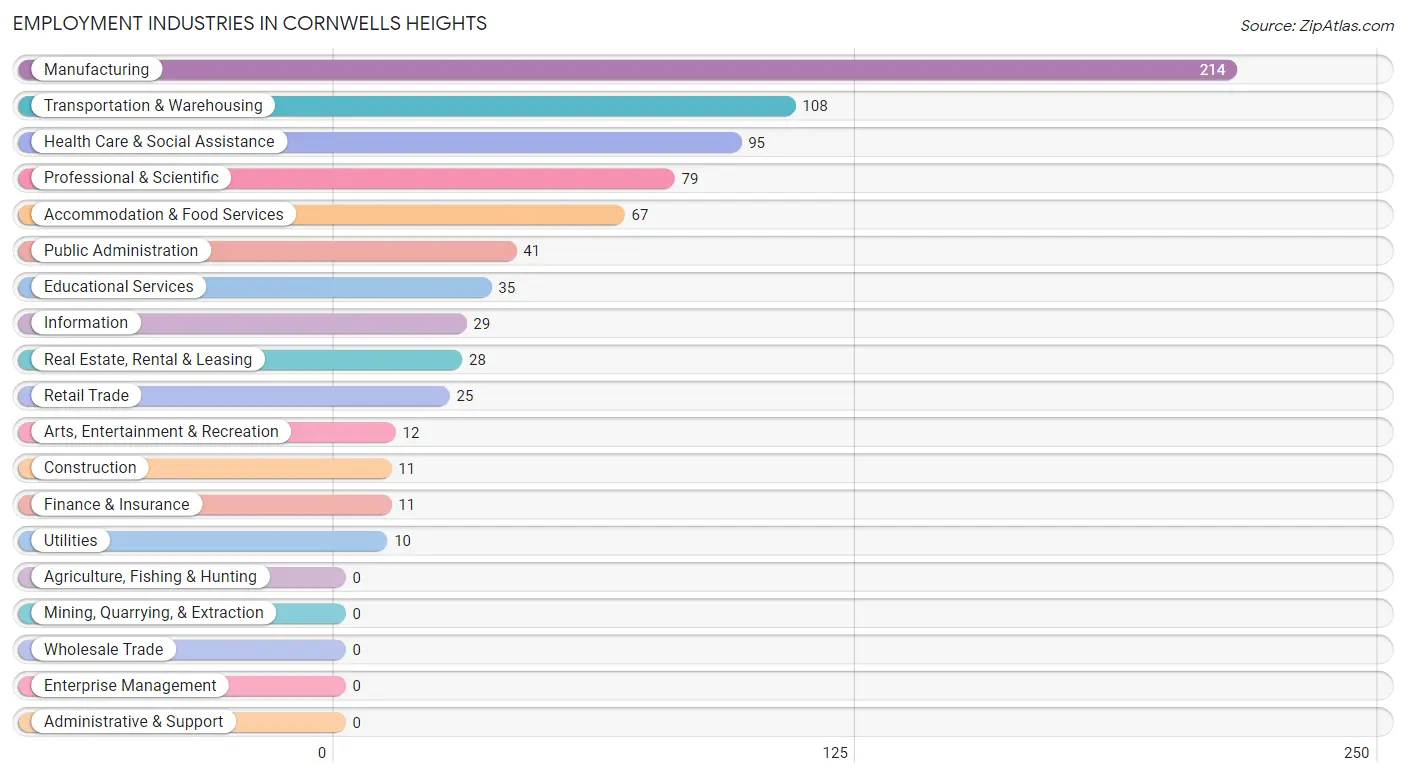
Employment Industries in Cornwells Heights
The major employment industries in Cornwells Heights include Manufacturing (214 | 27.7%), Transportation & Warehousing (108 | 14.0%), Health Care & Social Assistance (95 | 12.3%), Professional & Scientific (79 | 10.2%), and Accommodation & Food Services (67 | 8.7%).
Employment Industries by Sex in Cornwells Heights
The Cornwells Heights industries that see more men than women are Construction (100.0%), Information (100.0%), and Finance & Insurance (100.0%), whereas the industries that tend to have a higher number of women are Utilities (100.0%), Real Estate, Rental & Leasing (100.0%), and Health Care & Social Assistance (100.0%).
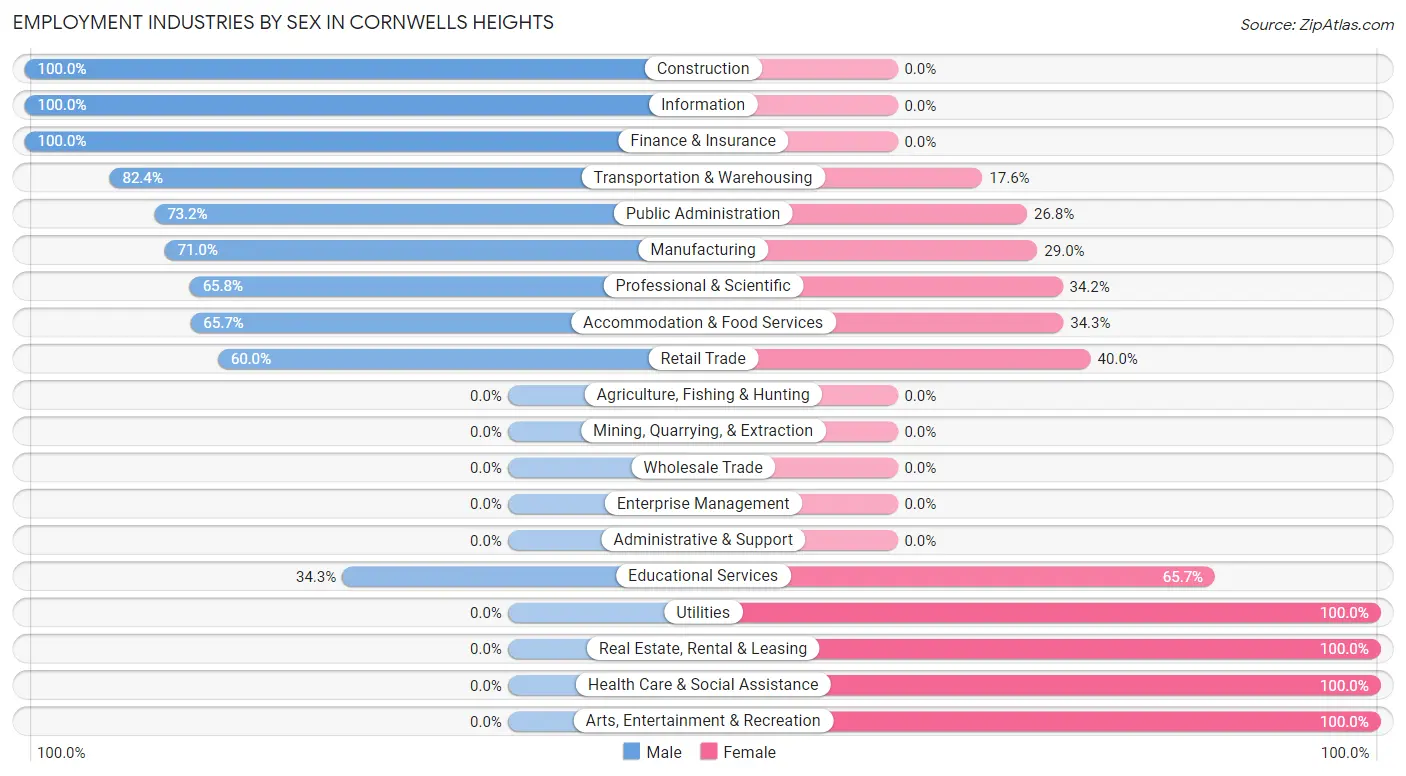
| Industry | Male | Female |
| Agriculture, Fishing & Hunting | 0 (0.0%) | 0 (0.0%) |
| Mining, Quarrying, & Extraction | 0 (0.0%) | 0 (0.0%) |
| Construction | 11 (100.0%) | 0 (0.0%) |
| Manufacturing | 152 (71.0%) | 62 (29.0%) |
| Wholesale Trade | 0 (0.0%) | 0 (0.0%) |
| Retail Trade | 15 (60.0%) | 10 (40.0%) |
| Transportation & Warehousing | 89 (82.4%) | 19 (17.6%) |
| Utilities | 0 (0.0%) | 10 (100.0%) |
| Information | 29 (100.0%) | 0 (0.0%) |
| Finance & Insurance | 11 (100.0%) | 0 (0.0%) |
| Real Estate, Rental & Leasing | 0 (0.0%) | 28 (100.0%) |
| Professional & Scientific | 52 (65.8%) | 27 (34.2%) |
| Enterprise Management | 0 (0.0%) | 0 (0.0%) |
| Administrative & Support | 0 (0.0%) | 0 (0.0%) |
| Educational Services | 12 (34.3%) | 23 (65.7%) |
| Health Care & Social Assistance | 0 (0.0%) | 95 (100.0%) |
| Arts, Entertainment & Recreation | 0 (0.0%) | 12 (100.0%) |
| Accommodation & Food Services | 44 (65.7%) | 23 (34.3%) |
| Public Administration | 30 (73.2%) | 11 (26.8%) |
| Total | 445 (57.5%) | 329 (42.5%) |
Education in Cornwells Heights
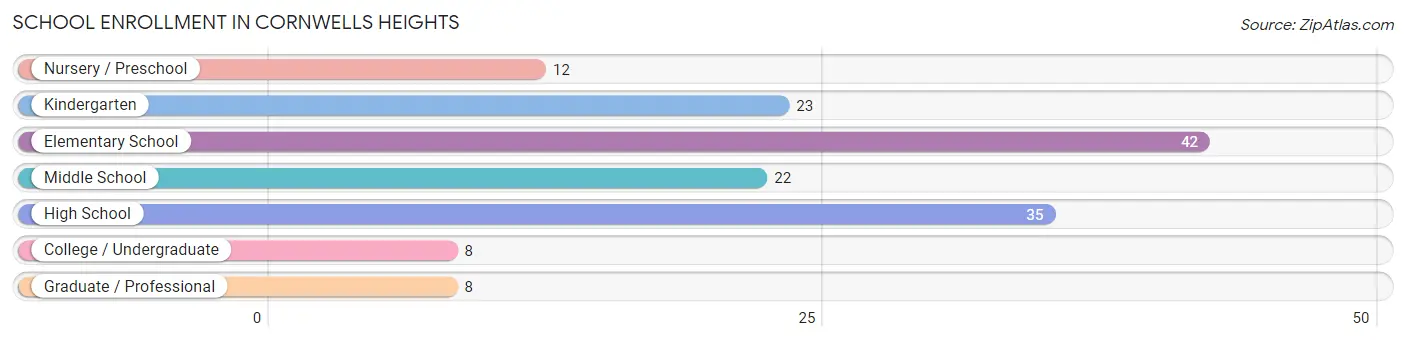
School Enrollment in Cornwells Heights
The most common levels of schooling among the 150 students in Cornwells Heights are elementary school (42 | 28.0%), high school (35 | 23.3%), and kindergarten (23 | 15.3%).
| School Level | # Students | % Students |
| Nursery / Preschool | 12 | 8.0% |
| Kindergarten | 23 | 15.3% |
| Elementary School | 42 | 28.0% |
| Middle School | 22 | 14.7% |
| High School | 35 | 23.3% |
| College / Undergraduate | 8 | 5.3% |
| Graduate / Professional | 8 | 5.3% |
| Total | 150 | 100.0% |
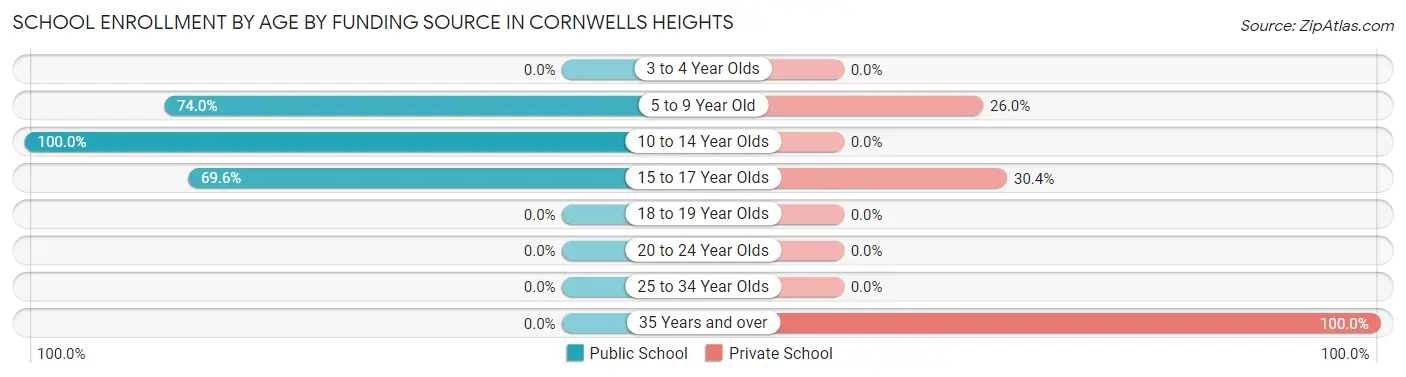
School Enrollment by Age by Funding Source in Cornwells Heights
Out of a total of 150 students who are enrolled in schools in Cornwells Heights, 43 (28.7%) attend a private institution, while the remaining 107 (71.3%) are enrolled in public schools. The age group of 35 years and over has the highest likelihood of being enrolled in private schools, with 16 (100.0% in the age bracket) enrolled. Conversely, the age group of 10 to 14 year olds has the lowest likelihood of being enrolled in a private school, with 34 (100.0% in the age bracket) attending a public institution.
| Age Bracket | Public School | Private School |
| 3 to 4 Year Olds | 0 (0.0%) | 0 (0.0%) |
| 5 to 9 Year Old | 57 (74.0%) | 20 (26.0%) |
| 10 to 14 Year Olds | 34 (100.0%) | 0 (0.0%) |
| 15 to 17 Year Olds | 16 (69.6%) | 7 (30.4%) |
| 18 to 19 Year Olds | 0 (0.0%) | 0 (0.0%) |
| 20 to 24 Year Olds | 0 (0.0%) | 0 (0.0%) |
| 25 to 34 Year Olds | 0 (0.0%) | 0 (0.0%) |
| 35 Years and over | 0 (0.0%) | 16 (100.0%) |
| Total | 107 (71.3%) | 43 (28.7%) |
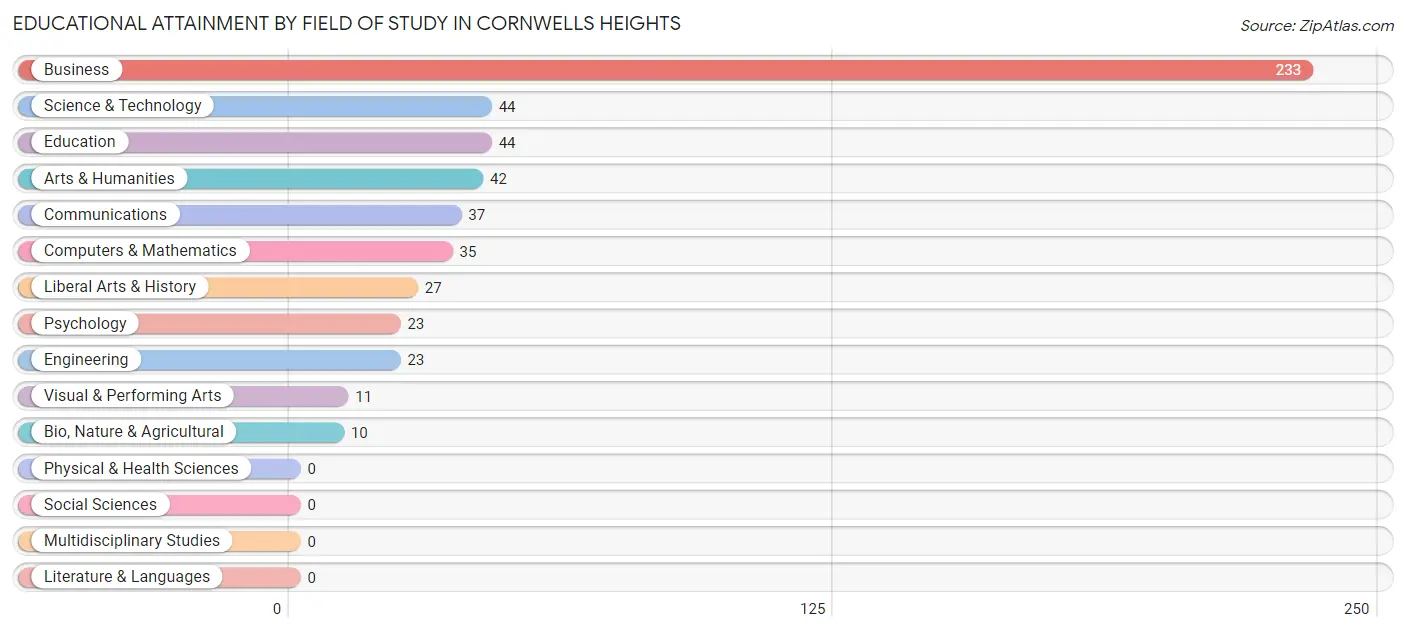
Educational Attainment by Field of Study in Cornwells Heights
Business (233 | 44.1%), science & technology (44 | 8.3%), education (44 | 8.3%), arts & humanities (42 | 7.9%), and communications (37 | 7.0%) are the most common fields of study among 529 individuals in Cornwells Heights who have obtained a bachelor's degree or higher.
| Field of Study | # Graduates | % Graduates |
| Computers & Mathematics | 35 | 6.6% |
| Bio, Nature & Agricultural | 10 | 1.9% |
| Physical & Health Sciences | 0 | 0.0% |
| Psychology | 23 | 4.3% |
| Social Sciences | 0 | 0.0% |
| Engineering | 23 | 4.3% |
| Multidisciplinary Studies | 0 | 0.0% |
| Science & Technology | 44 | 8.3% |
| Business | 233 | 44.1% |
| Education | 44 | 8.3% |
| Literature & Languages | 0 | 0.0% |
| Liberal Arts & History | 27 | 5.1% |
| Visual & Performing Arts | 11 | 2.1% |
| Communications | 37 | 7.0% |
| Arts & Humanities | 42 | 7.9% |
| Total | 529 | 100.0% |
Transportation & Commute in Cornwells Heights
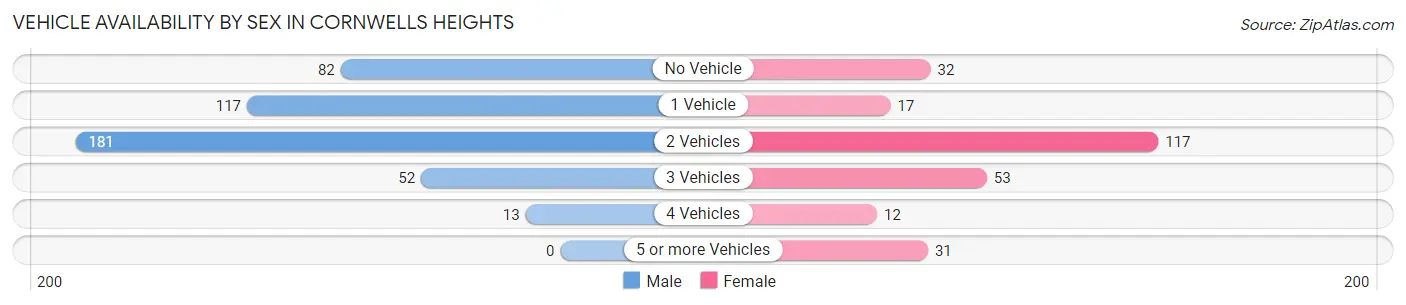
Vehicle Availability by Sex in Cornwells Heights
The most prevalent vehicle ownership categories in Cornwells Heights are males with 2 vehicles (181, accounting for 40.7%) and females with 2 vehicles (117, making up 69.1%).
| Vehicles Available | Male | Female |
| No Vehicle | 82 (18.4%) | 32 (12.2%) |
| 1 Vehicle | 117 (26.3%) | 17 (6.5%) |
| 2 Vehicles | 181 (40.7%) | 117 (44.7%) |
| 3 Vehicles | 52 (11.7%) | 53 (20.2%) |
| 4 Vehicles | 13 (2.9%) | 12 (4.6%) |
| 5 or more Vehicles | 0 (0.0%) | 31 (11.8%) |
| Total | 445 (100.0%) | 262 (100.0%) |
Commute Time in Cornwells Heights
The most frequently occuring commute durations in Cornwells Heights are 30 to 34 minutes (165 commuters, 23.9%), 10 to 14 minutes (114 commuters, 16.5%), and 15 to 19 minutes (102 commuters, 14.8%).
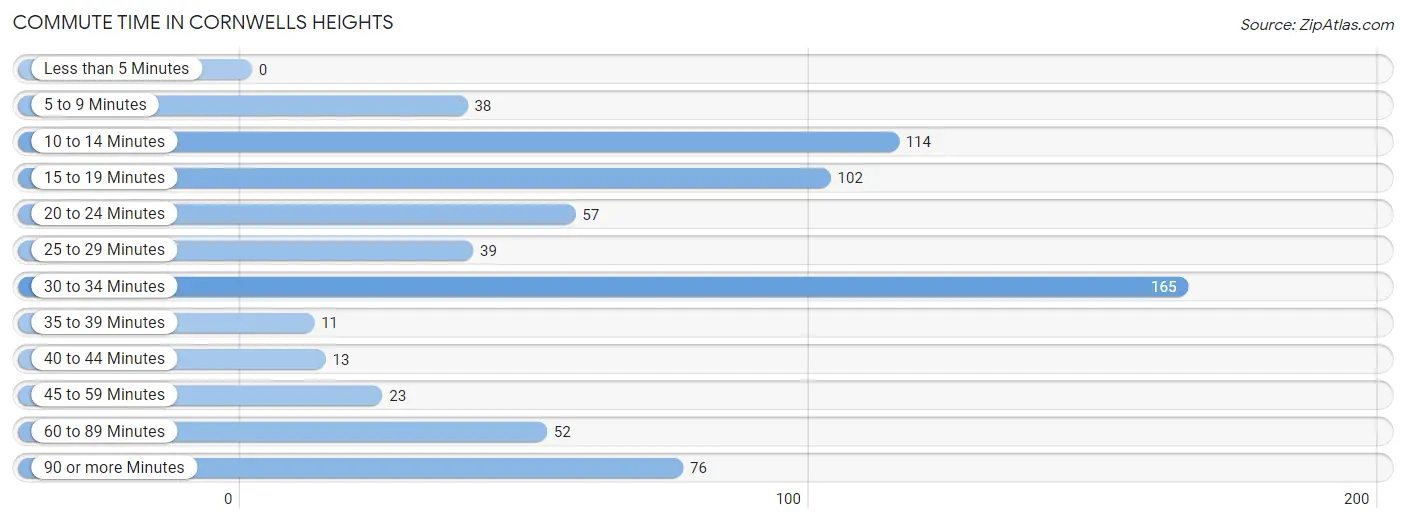
| Commute Time | # Commuters | % Commuters |
| Less than 5 Minutes | 0 | 0.0% |
| 5 to 9 Minutes | 38 | 5.5% |
| 10 to 14 Minutes | 114 | 16.5% |
| 15 to 19 Minutes | 102 | 14.8% |
| 20 to 24 Minutes | 57 | 8.3% |
| 25 to 29 Minutes | 39 | 5.7% |
| 30 to 34 Minutes | 165 | 23.9% |
| 35 to 39 Minutes | 11 | 1.6% |
| 40 to 44 Minutes | 13 | 1.9% |
| 45 to 59 Minutes | 23 | 3.3% |
| 60 to 89 Minutes | 52 | 7.5% |
| 90 or more Minutes | 76 | 11.0% |
Commute Time by Sex in Cornwells Heights
The most common commute times in Cornwells Heights are 30 to 34 minutes (165 commuters, 38.6%) for males and 15 to 19 minutes (67 commuters, 25.6%) for females.
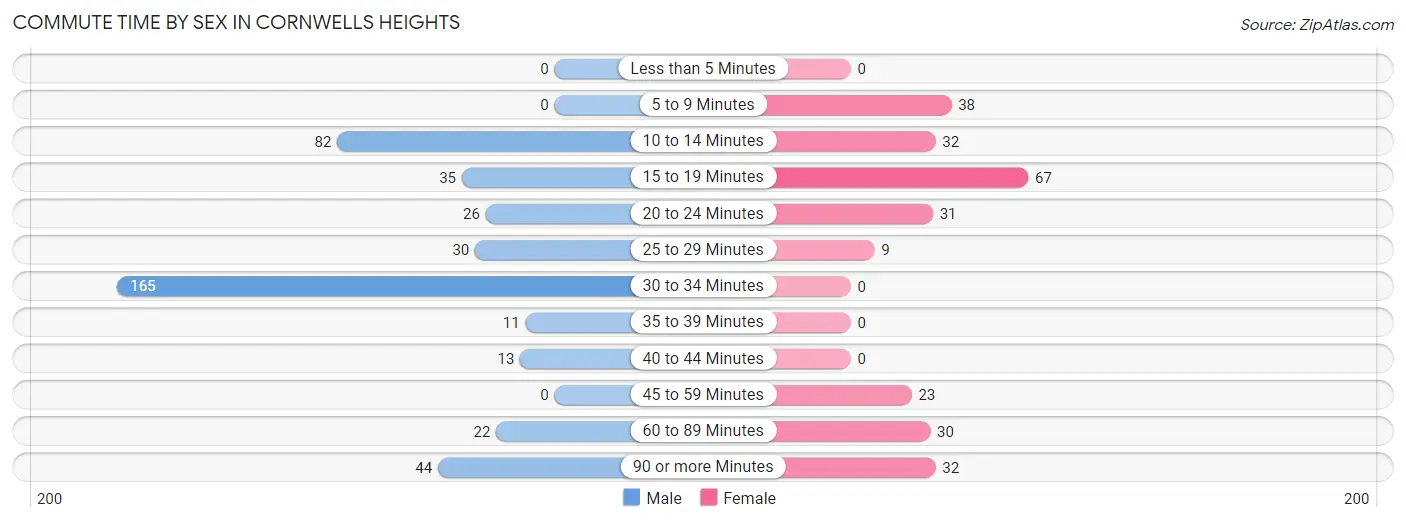
| Commute Time | Male | Female |
| Less than 5 Minutes | 0 (0.0%) | 0 (0.0%) |
| 5 to 9 Minutes | 0 (0.0%) | 38 (14.5%) |
| 10 to 14 Minutes | 82 (19.2%) | 32 (12.2%) |
| 15 to 19 Minutes | 35 (8.2%) | 67 (25.6%) |
| 20 to 24 Minutes | 26 (6.1%) | 31 (11.8%) |
| 25 to 29 Minutes | 30 (7.0%) | 9 (3.4%) |
| 30 to 34 Minutes | 165 (38.6%) | 0 (0.0%) |
| 35 to 39 Minutes | 11 (2.6%) | 0 (0.0%) |
| 40 to 44 Minutes | 13 (3.0%) | 0 (0.0%) |
| 45 to 59 Minutes | 0 (0.0%) | 23 (8.8%) |
| 60 to 89 Minutes | 22 (5.1%) | 30 (11.5%) |
| 90 or more Minutes | 44 (10.3%) | 32 (12.2%) |
Time of Departure to Work by Sex in Cornwells Heights
The most frequent times of departure to work in Cornwells Heights are 6:00 AM to 6:29 AM (166, 38.8%) for males and 8:00 AM to 8:29 AM (71, 27.1%) for females.
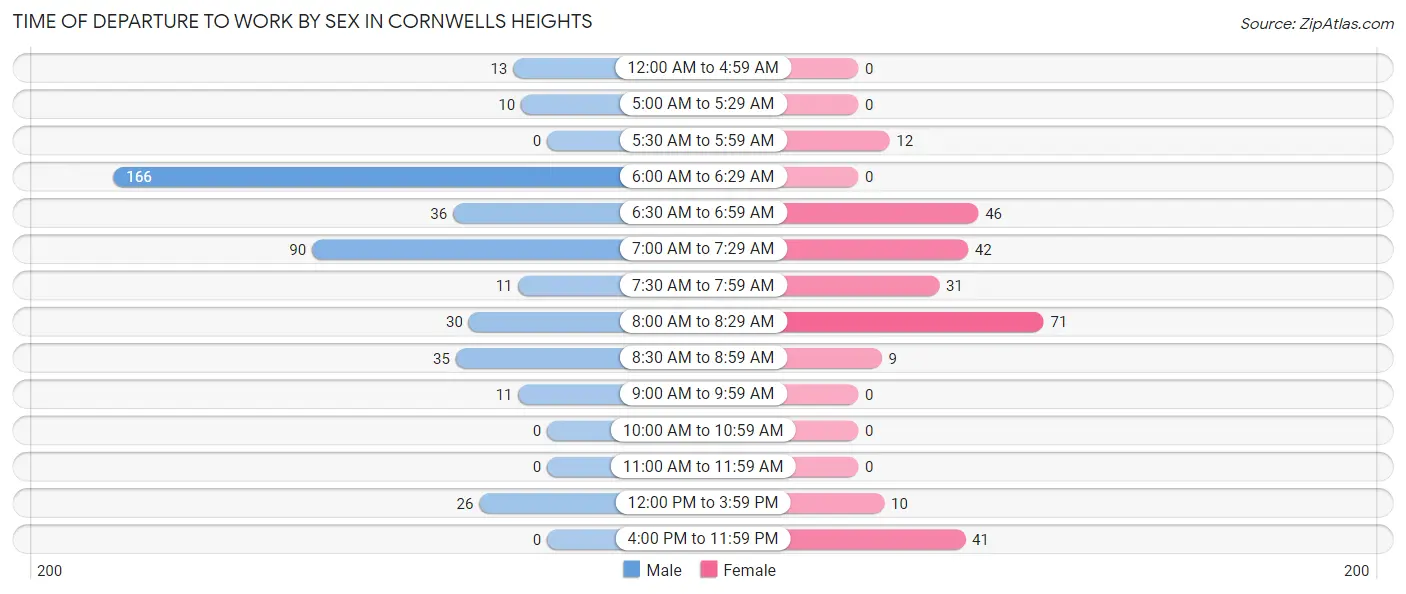
| Time of Departure | Male | Female |
| 12:00 AM to 4:59 AM | 13 (3.0%) | 0 (0.0%) |
| 5:00 AM to 5:29 AM | 10 (2.3%) | 0 (0.0%) |
| 5:30 AM to 5:59 AM | 0 (0.0%) | 12 (4.6%) |
| 6:00 AM to 6:29 AM | 166 (38.8%) | 0 (0.0%) |
| 6:30 AM to 6:59 AM | 36 (8.4%) | 46 (17.6%) |
| 7:00 AM to 7:29 AM | 90 (21.0%) | 42 (16.0%) |
| 7:30 AM to 7:59 AM | 11 (2.6%) | 31 (11.8%) |
| 8:00 AM to 8:29 AM | 30 (7.0%) | 71 (27.1%) |
| 8:30 AM to 8:59 AM | 35 (8.2%) | 9 (3.4%) |
| 9:00 AM to 9:59 AM | 11 (2.6%) | 0 (0.0%) |
| 10:00 AM to 10:59 AM | 0 (0.0%) | 0 (0.0%) |
| 11:00 AM to 11:59 AM | 0 (0.0%) | 0 (0.0%) |
| 12:00 PM to 3:59 PM | 26 (6.1%) | 10 (3.8%) |
| 4:00 PM to 11:59 PM | 0 (0.0%) | 41 (15.7%) |
| Total | 428 (100.0%) | 262 (100.0%) |
Housing Occupancy in Cornwells Heights
Occupancy by Ownership in Cornwells Heights
Of the total 592 dwellings in Cornwells Heights, owner-occupied units account for 374 (63.2%), while renter-occupied units make up 218 (36.8%).
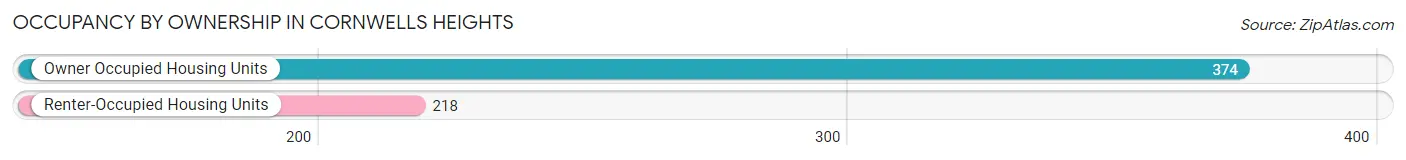
| Occupancy | # Housing Units | % Housing Units |
| Owner Occupied Housing Units | 374 | 63.2% |
| Renter-Occupied Housing Units | 218 | 36.8% |
| Total Occupied Housing Units | 592 | 100.0% |
Occupancy by Household Size in Cornwells Heights
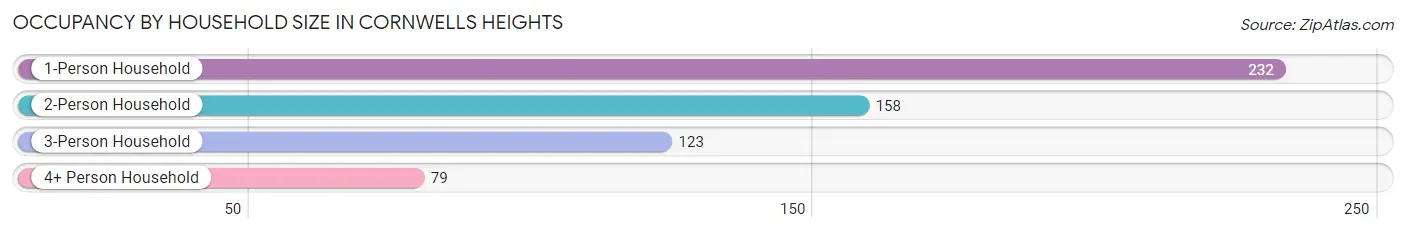
| Household Size | # Housing Units | % Housing Units |
| 1-Person Household | 232 | 39.2% |
| 2-Person Household | 158 | 26.7% |
| 3-Person Household | 123 | 20.8% |
| 4+ Person Household | 79 | 13.3% |
| Total Housing Units | 592 | 100.0% |
Occupancy by Ownership by Household Size in Cornwells Heights
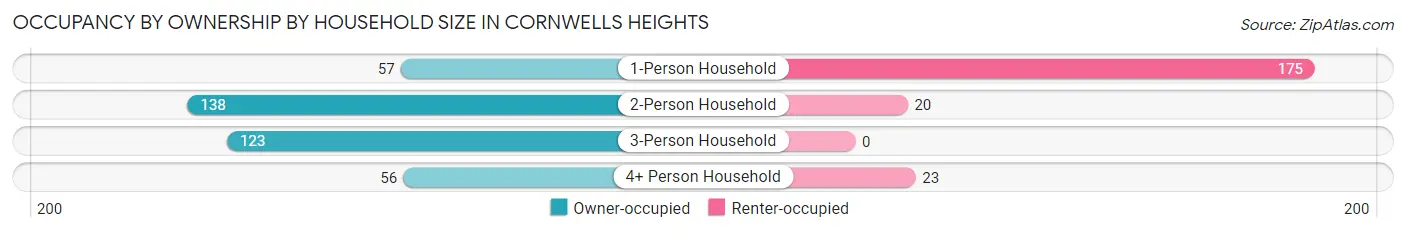
| Household Size | Owner-occupied | Renter-occupied |
| 1-Person Household | 57 (24.6%) | 175 (75.4%) |
| 2-Person Household | 138 (87.3%) | 20 (12.7%) |
| 3-Person Household | 123 (100.0%) | 0 (0.0%) |
| 4+ Person Household | 56 (70.9%) | 23 (29.1%) |
| Total Housing Units | 374 (63.2%) | 218 (36.8%) |
Occupancy by Educational Attainment in Cornwells Heights
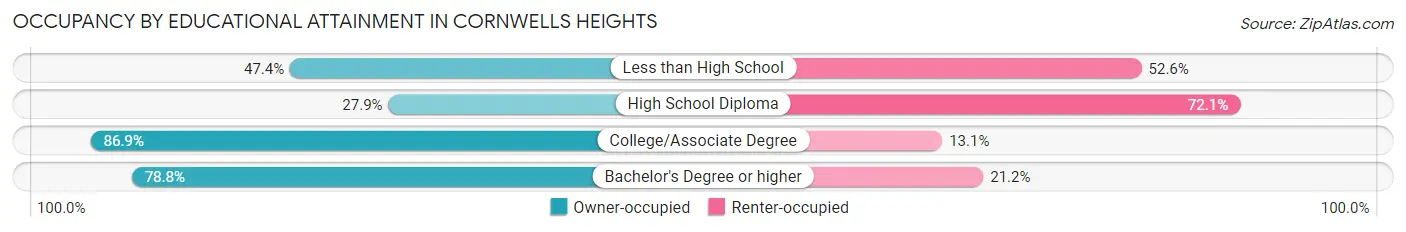
| Household Size | Owner-occupied | Renter-occupied |
| Less than High School | 9 (47.4%) | 10 (52.6%) |
| High School Diploma | 51 (27.9%) | 132 (72.1%) |
| College/Associate Degree | 73 (86.9%) | 11 (13.1%) |
| Bachelor's Degree or higher | 241 (78.8%) | 65 (21.2%) |
Occupancy by Age of Householder in Cornwells Heights
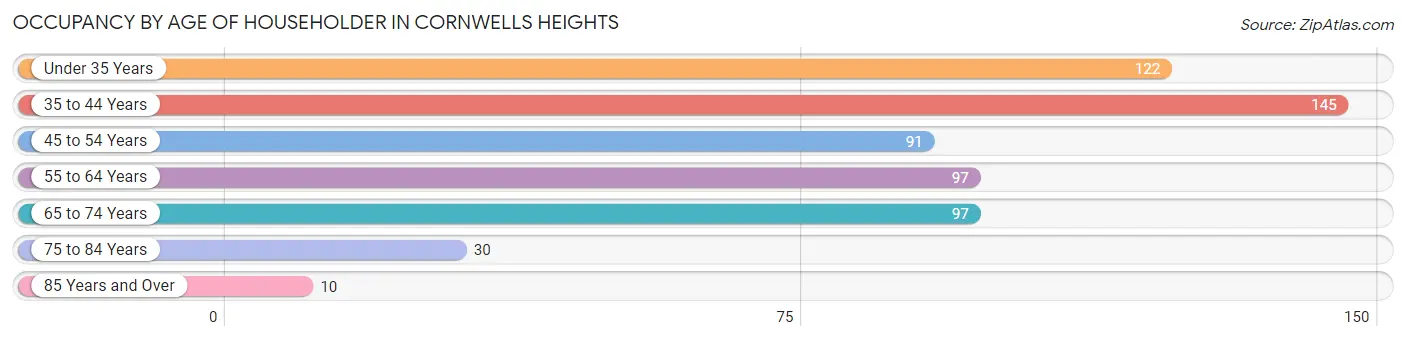
| Age Bracket | # Households | % Households |
| Under 35 Years | 122 | 20.6% |
| 35 to 44 Years | 145 | 24.5% |
| 45 to 54 Years | 91 | 15.4% |
| 55 to 64 Years | 97 | 16.4% |
| 65 to 74 Years | 97 | 16.4% |
| 75 to 84 Years | 30 | 5.1% |
| 85 Years and Over | 10 | 1.7% |
| Total | 592 | 100.0% |
Housing Finances in Cornwells Heights
Median Income by Occupancy in Cornwells Heights
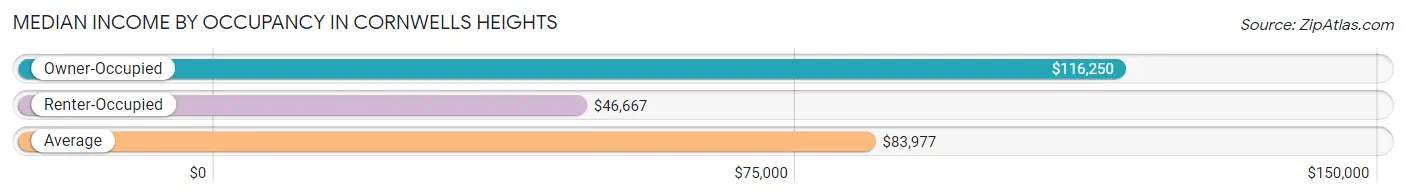
| Occupancy Type | # Households | Median Income |
| Owner-Occupied | 374 (63.2%) | $116,250 |
| Renter-Occupied | 218 (36.8%) | $46,667 |
| Average | 592 (100.0%) | $83,977 |
Occupancy by Householder Income Bracket in Cornwells Heights
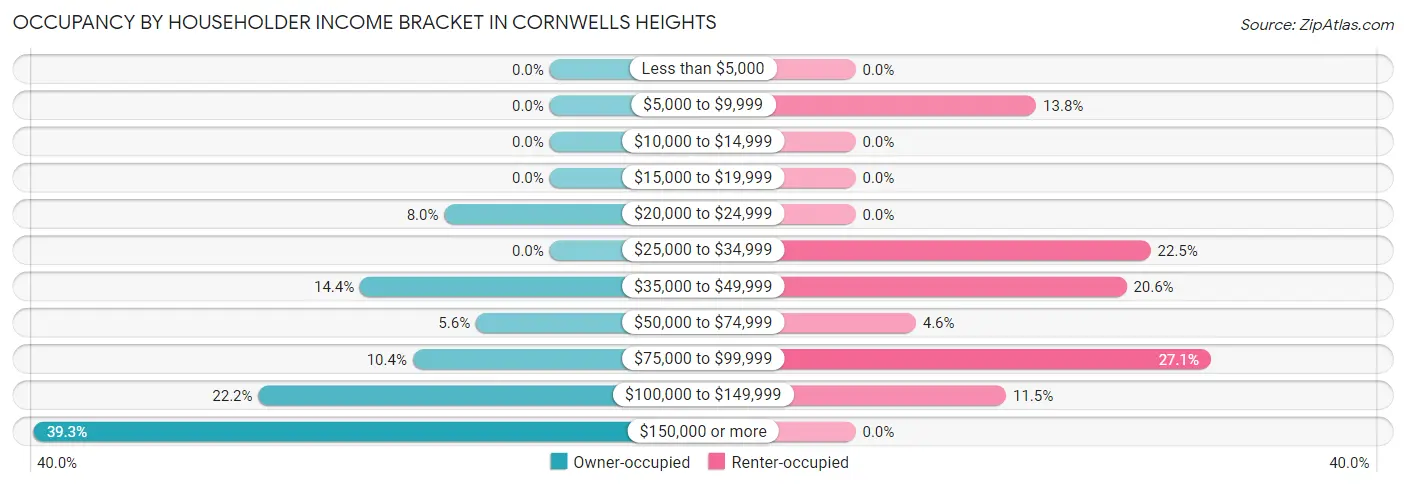
| Income Bracket | Owner-occupied | Renter-occupied |
| Less than $5,000 | 0 (0.0%) | 0 (0.0%) |
| $5,000 to $9,999 | 0 (0.0%) | 30 (13.8%) |
| $10,000 to $14,999 | 0 (0.0%) | 0 (0.0%) |
| $15,000 to $19,999 | 0 (0.0%) | 0 (0.0%) |
| $20,000 to $24,999 | 30 (8.0%) | 0 (0.0%) |
| $25,000 to $34,999 | 0 (0.0%) | 49 (22.5%) |
| $35,000 to $49,999 | 54 (14.4%) | 45 (20.6%) |
| $50,000 to $74,999 | 21 (5.6%) | 10 (4.6%) |
| $75,000 to $99,999 | 39 (10.4%) | 59 (27.1%) |
| $100,000 to $149,999 | 83 (22.2%) | 25 (11.5%) |
| $150,000 or more | 147 (39.3%) | 0 (0.0%) |
| Total | 374 (100.0%) | 218 (100.0%) |
Monthly Housing Cost Tiers in Cornwells Heights
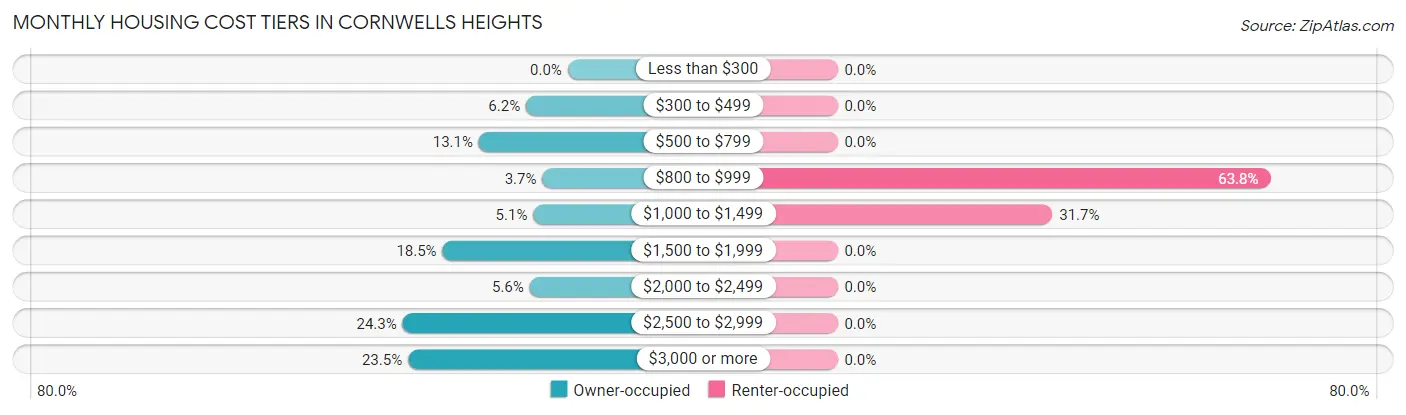
| Monthly Cost | Owner-occupied | Renter-occupied |
| Less than $300 | 0 (0.0%) | 0 (0.0%) |
| $300 to $499 | 23 (6.1%) | 0 (0.0%) |
| $500 to $799 | 49 (13.1%) | 0 (0.0%) |
| $800 to $999 | 14 (3.7%) | 139 (63.8%) |
| $1,000 to $1,499 | 19 (5.1%) | 69 (31.7%) |
| $1,500 to $1,999 | 69 (18.4%) | 0 (0.0%) |
| $2,000 to $2,499 | 21 (5.6%) | 0 (0.0%) |
| $2,500 to $2,999 | 91 (24.3%) | 0 (0.0%) |
| $3,000 or more | 88 (23.5%) | 0 (0.0%) |
| Total | 374 (100.0%) | 218 (100.0%) |
Physical Housing Characteristics in Cornwells Heights
Housing Structures in Cornwells Heights
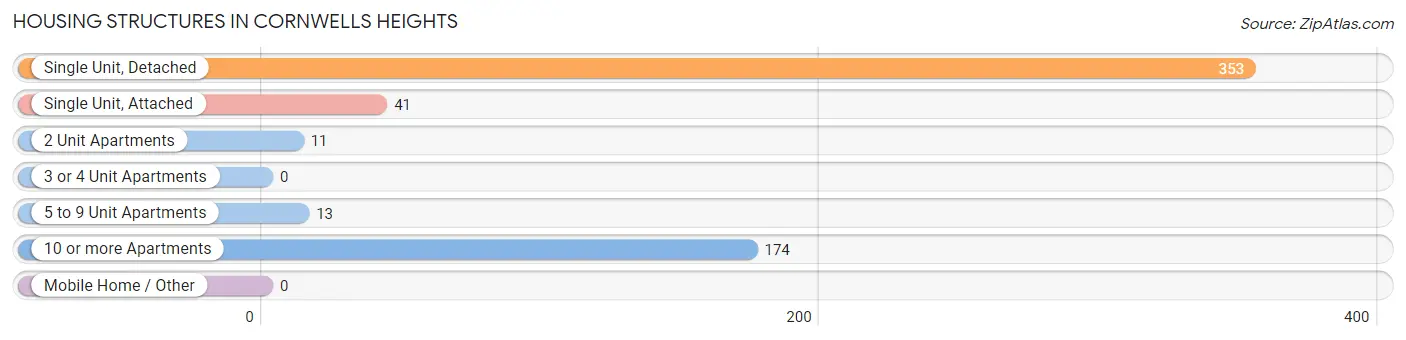
| Structure Type | # Housing Units | % Housing Units |
| Single Unit, Detached | 353 | 59.6% |
| Single Unit, Attached | 41 | 6.9% |
| 2 Unit Apartments | 11 | 1.9% |
| 3 or 4 Unit Apartments | 0 | 0.0% |
| 5 to 9 Unit Apartments | 13 | 2.2% |
| 10 or more Apartments | 174 | 29.4% |
| Mobile Home / Other | 0 | 0.0% |
| Total | 592 | 100.0% |
Housing Structures by Occupancy in Cornwells Heights
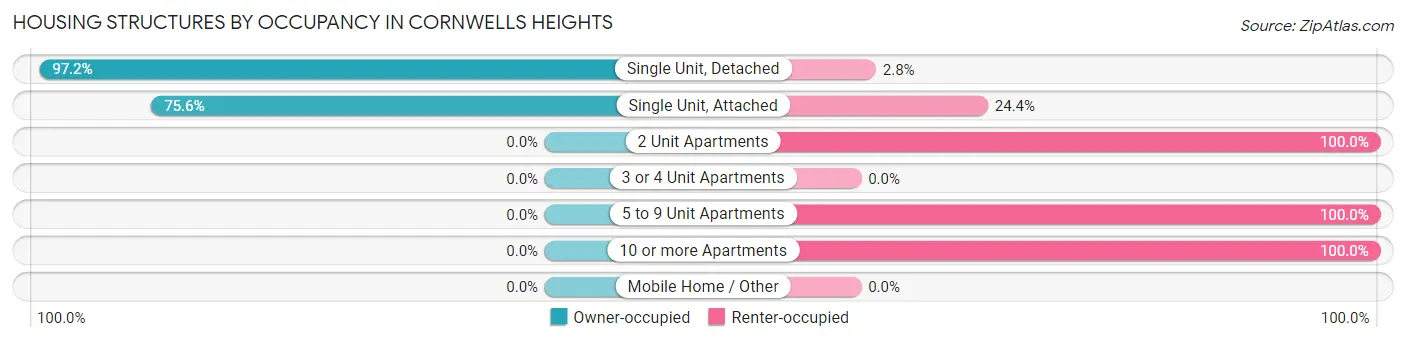
| Structure Type | Owner-occupied | Renter-occupied |
| Single Unit, Detached | 343 (97.2%) | 10 (2.8%) |
| Single Unit, Attached | 31 (75.6%) | 10 (24.4%) |
| 2 Unit Apartments | 0 (0.0%) | 11 (100.0%) |
| 3 or 4 Unit Apartments | 0 (0.0%) | 0 (0.0%) |
| 5 to 9 Unit Apartments | 0 (0.0%) | 13 (100.0%) |
| 10 or more Apartments | 0 (0.0%) | 174 (100.0%) |
| Mobile Home / Other | 0 (0.0%) | 0 (0.0%) |
| Total | 374 (63.2%) | 218 (36.8%) |
Housing Structures by Number of Rooms in Cornwells Heights
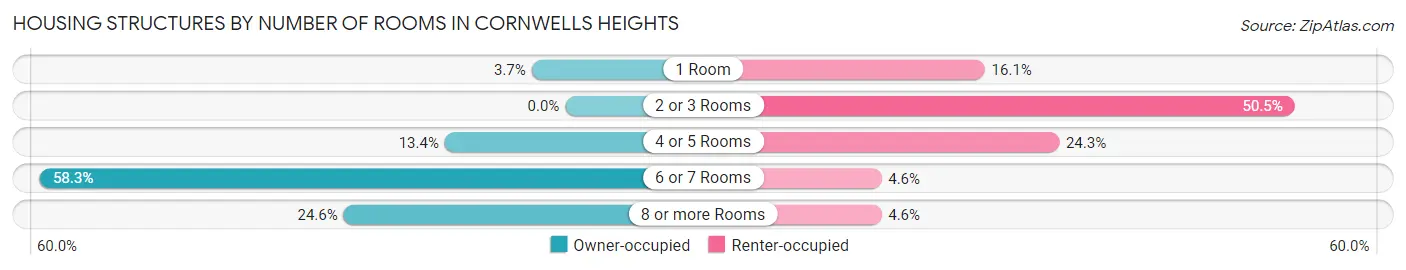
| Number of Rooms | Owner-occupied | Renter-occupied |
| 1 Room | 14 (3.7%) | 35 (16.1%) |
| 2 or 3 Rooms | 0 (0.0%) | 110 (50.5%) |
| 4 or 5 Rooms | 50 (13.4%) | 53 (24.3%) |
| 6 or 7 Rooms | 218 (58.3%) | 10 (4.6%) |
| 8 or more Rooms | 92 (24.6%) | 10 (4.6%) |
| Total | 374 (100.0%) | 218 (100.0%) |
Housing Structure by Heating Type in Cornwells Heights
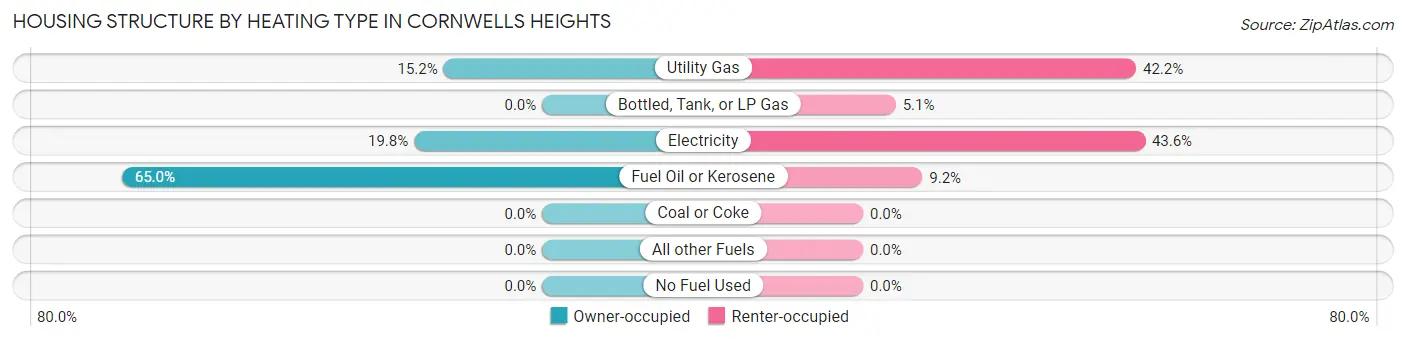
| Heating Type | Owner-occupied | Renter-occupied |
| Utility Gas | 57 (15.2%) | 92 (42.2%) |
| Bottled, Tank, or LP Gas | 0 (0.0%) | 11 (5.1%) |
| Electricity | 74 (19.8%) | 95 (43.6%) |
| Fuel Oil or Kerosene | 243 (65.0%) | 20 (9.2%) |
| Coal or Coke | 0 (0.0%) | 0 (0.0%) |
| All other Fuels | 0 (0.0%) | 0 (0.0%) |
| No Fuel Used | 0 (0.0%) | 0 (0.0%) |
| Total | 374 (100.0%) | 218 (100.0%) |
Household Vehicle Usage in Cornwells Heights
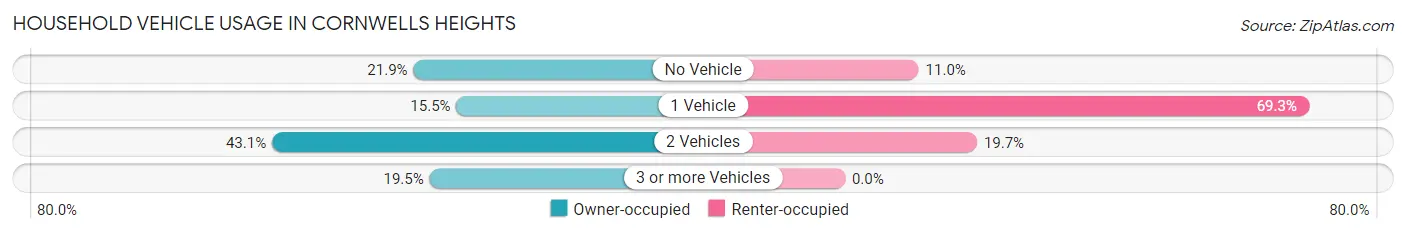
| Vehicles per Household | Owner-occupied | Renter-occupied |
| No Vehicle | 82 (21.9%) | 24 (11.0%) |
| 1 Vehicle | 58 (15.5%) | 151 (69.3%) |
| 2 Vehicles | 161 (43.0%) | 43 (19.7%) |
| 3 or more Vehicles | 73 (19.5%) | 0 (0.0%) |
| Total | 374 (100.0%) | 218 (100.0%) |
Real Estate & Mortgages in Cornwells Heights
Real Estate and Mortgage Overview in Cornwells Heights
| Characteristic | Without Mortgage | With Mortgage |
| Housing Units | 75 | 299 |
| Median Property Value | $296,100 | $394,600 |
| Median Household Income | - | - |
| Monthly Housing Costs | $682 | $88 |
| Real Estate Taxes | $3,500 | $10 |
Property Value by Mortgage Status in Cornwells Heights
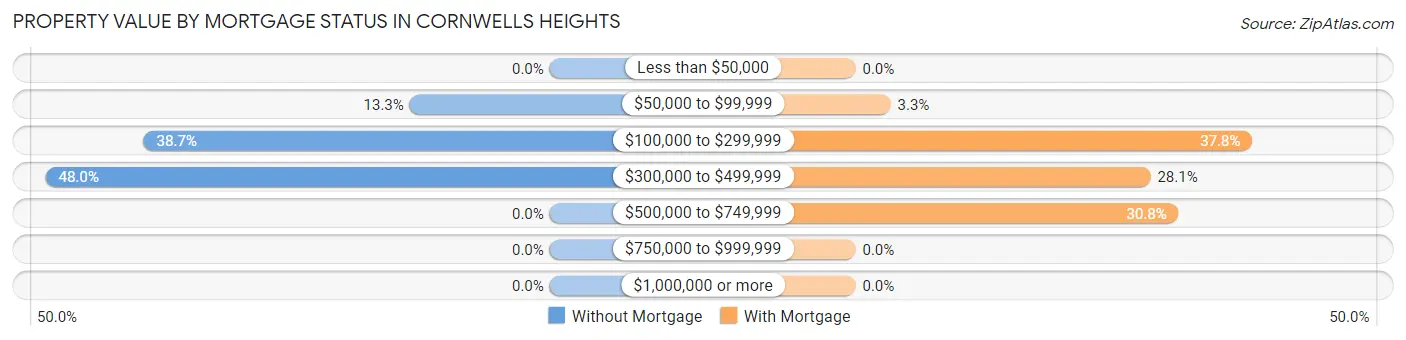
| Property Value | Without Mortgage | With Mortgage |
| Less than $50,000 | 0 (0.0%) | 0 (0.0%) |
| $50,000 to $99,999 | 10 (13.3%) | 10 (3.3%) |
| $100,000 to $299,999 | 29 (38.7%) | 113 (37.8%) |
| $300,000 to $499,999 | 36 (48.0%) | 84 (28.1%) |
| $500,000 to $749,999 | 0 (0.0%) | 92 (30.8%) |
| $750,000 to $999,999 | 0 (0.0%) | 0 (0.0%) |
| $1,000,000 or more | 0 (0.0%) | 0 (0.0%) |
| Total | 75 (100.0%) | 299 (100.0%) |
Household Income by Mortgage Status in Cornwells Heights
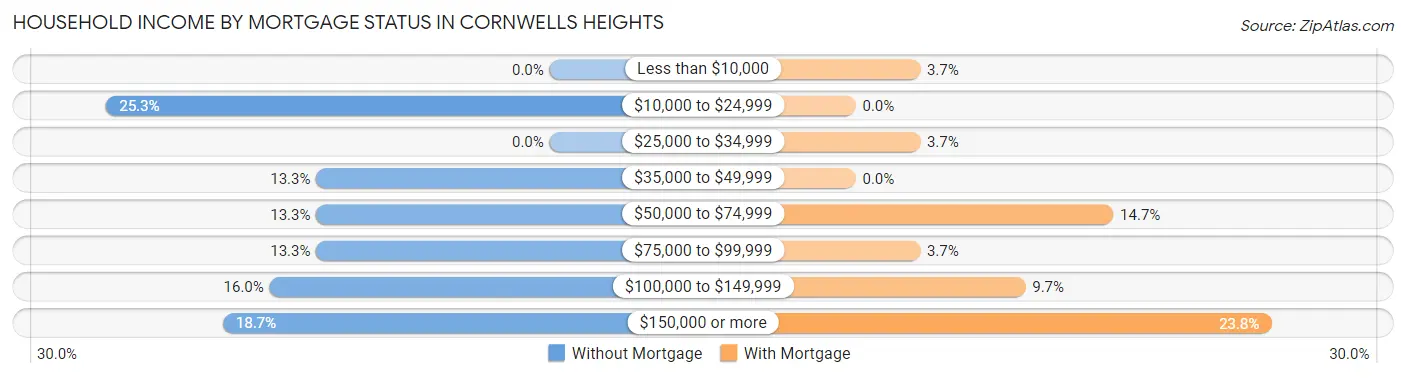
| Household Income | Without Mortgage | With Mortgage |
| Less than $10,000 | 0 (0.0%) | 11 (3.7%) |
| $10,000 to $24,999 | 19 (25.3%) | 0 (0.0%) |
| $25,000 to $34,999 | 0 (0.0%) | 11 (3.7%) |
| $35,000 to $49,999 | 10 (13.3%) | 0 (0.0%) |
| $50,000 to $74,999 | 10 (13.3%) | 44 (14.7%) |
| $75,000 to $99,999 | 10 (13.3%) | 11 (3.7%) |
| $100,000 to $149,999 | 12 (16.0%) | 29 (9.7%) |
| $150,000 or more | 14 (18.7%) | 71 (23.7%) |
| Total | 75 (100.0%) | 299 (100.0%) |
Property Value to Household Income Ratio in Cornwells Heights
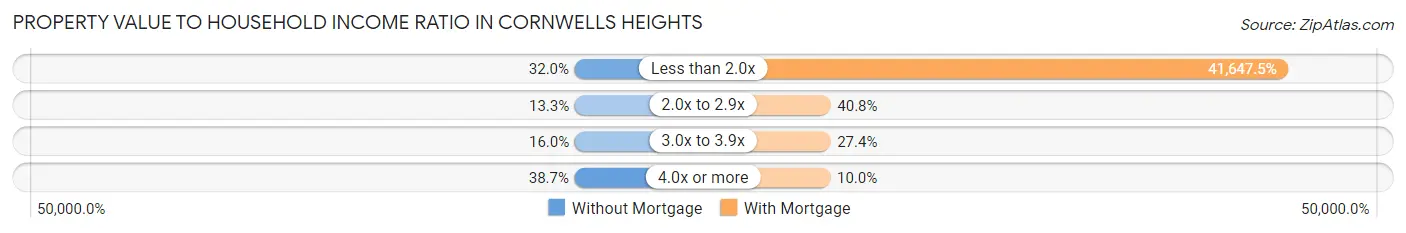
| Value-to-Income Ratio | Without Mortgage | With Mortgage |
| Less than 2.0x | 24 (32.0%) | 124,526 (41,647.5%) |
| 2.0x to 2.9x | 10 (13.3%) | 122 (40.8%) |
| 3.0x to 3.9x | 12 (16.0%) | 82 (27.4%) |
| 4.0x or more | 29 (38.7%) | 30 (10.0%) |
| Total | 75 (100.0%) | 299 (100.0%) |
Real Estate Taxes by Mortgage Status in Cornwells Heights
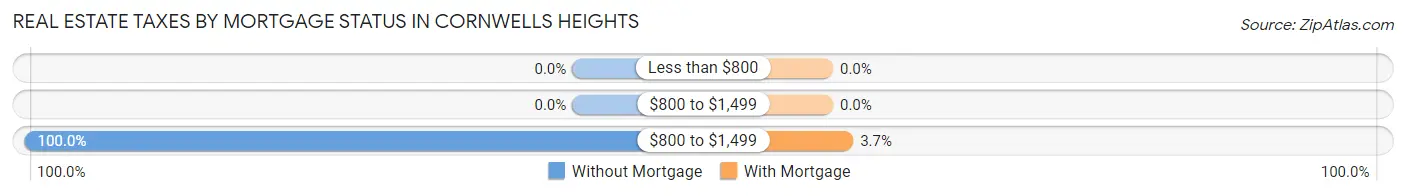
| Property Taxes | Without Mortgage | With Mortgage |
| Less than $800 | 0 (0.0%) | 0 (0.0%) |
| $800 to $1,499 | 0 (0.0%) | 0 (0.0%) |
| $800 to $1,499 | 75 (100.0%) | 11 (3.7%) |
| Total | 75 (100.0%) | 299 (100.0%) |
Health & Disability in Cornwells Heights
Health Insurance Coverage by Age in Cornwells Heights
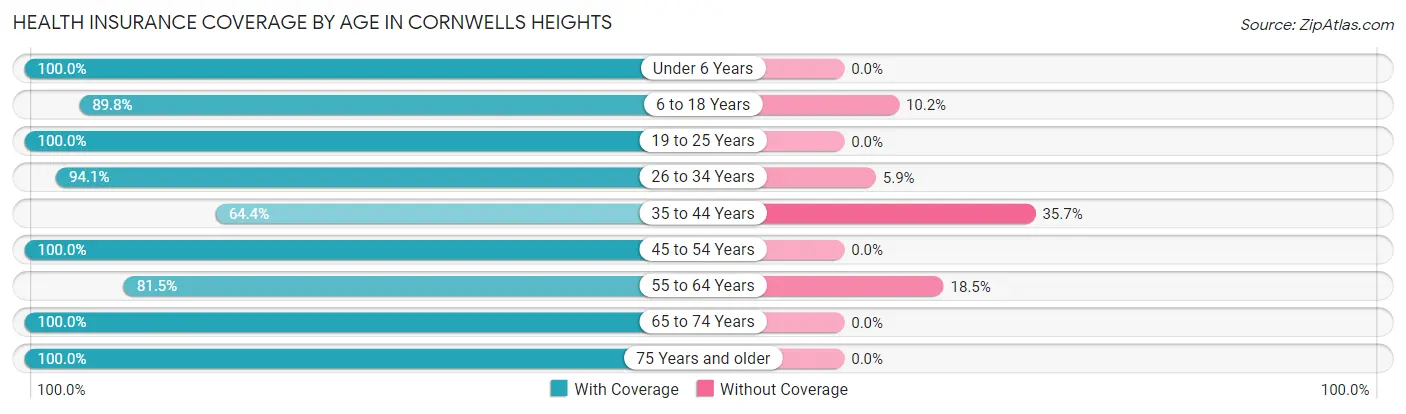
| Age Bracket | With Coverage | Without Coverage |
| Under 6 Years | 85 (100.0%) | 0 (0.0%) |
| 6 to 18 Years | 97 (89.8%) | 11 (10.2%) |
| 19 to 25 Years | 87 (100.0%) | 0 (0.0%) |
| 26 to 34 Years | 160 (94.1%) | 10 (5.9%) |
| 35 to 44 Years | 148 (64.3%) | 82 (35.6%) |
| 45 to 54 Years | 230 (100.0%) | 0 (0.0%) |
| 55 to 64 Years | 154 (81.5%) | 35 (18.5%) |
| 65 to 74 Years | 146 (100.0%) | 0 (0.0%) |
| 75 Years and older | 75 (100.0%) | 0 (0.0%) |
| Total | 1,182 (89.5%) | 138 (10.4%) |
Health Insurance Coverage by Citizenship Status in Cornwells Heights
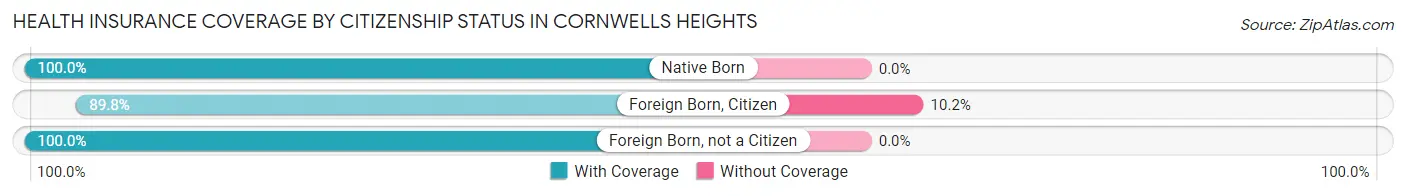
| Citizenship Status | With Coverage | Without Coverage |
| Native Born | 85 (100.0%) | 0 (0.0%) |
| Foreign Born, Citizen | 97 (89.8%) | 11 (10.2%) |
| Foreign Born, not a Citizen | 87 (100.0%) | 0 (0.0%) |
Health Insurance Coverage by Household Income in Cornwells Heights
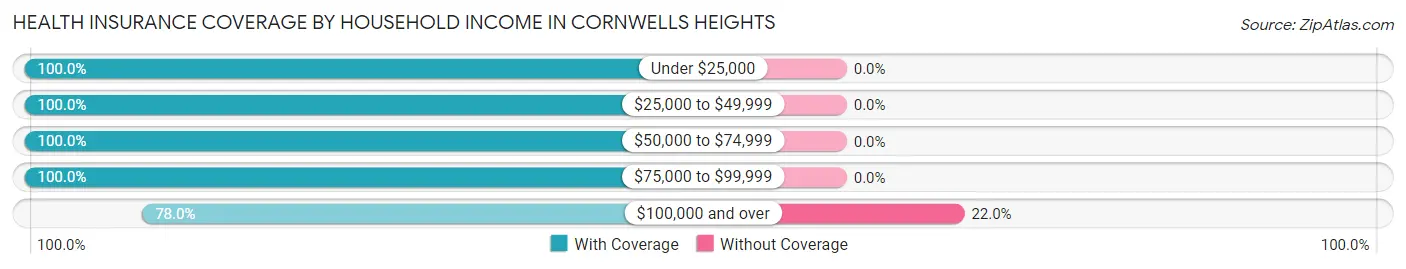
| Household Income | With Coverage | Without Coverage |
| Under $25,000 | 104 (100.0%) | 0 (0.0%) |
| $25,000 to $49,999 | 247 (100.0%) | 0 (0.0%) |
| $50,000 to $74,999 | 70 (100.0%) | 0 (0.0%) |
| $75,000 to $99,999 | 182 (100.0%) | 0 (0.0%) |
| $100,000 and over | 488 (78.0%) | 138 (22.0%) |
Public vs Private Health Insurance Coverage by Age in Cornwells Heights
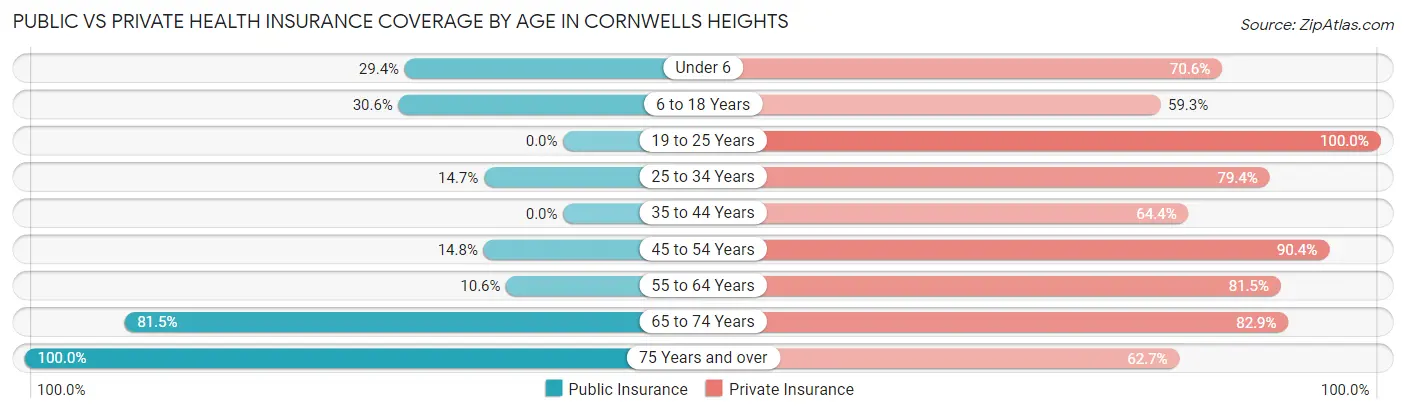
| Age Bracket | Public Insurance | Private Insurance |
| Under 6 | 25 (29.4%) | 60 (70.6%) |
| 6 to 18 Years | 33 (30.6%) | 64 (59.3%) |
| 19 to 25 Years | 0 (0.0%) | 87 (100.0%) |
| 25 to 34 Years | 25 (14.7%) | 135 (79.4%) |
| 35 to 44 Years | 0 (0.0%) | 148 (64.3%) |
| 45 to 54 Years | 34 (14.8%) | 208 (90.4%) |
| 55 to 64 Years | 20 (10.6%) | 154 (81.5%) |
| 65 to 74 Years | 119 (81.5%) | 121 (82.9%) |
| 75 Years and over | 75 (100.0%) | 47 (62.7%) |
| Total | 331 (25.1%) | 1,024 (77.6%) |
Disability Status by Sex by Age in Cornwells Heights
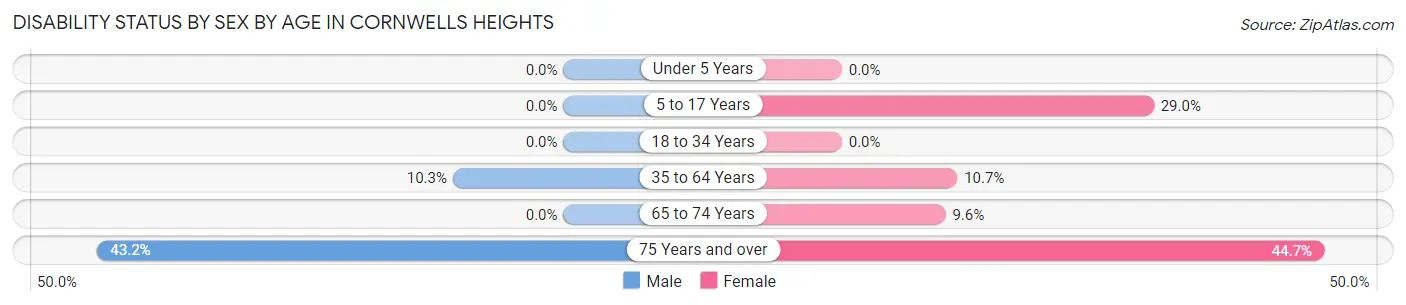
| Age Bracket | Male | Female |
| Under 5 Years | 0 (0.0%) | 0 (0.0%) |
| 5 to 17 Years | 0 (0.0%) | 22 (28.9%) |
| 18 to 34 Years | 0 (0.0%) | 0 (0.0%) |
| 35 to 64 Years | 35 (10.3%) | 33 (10.7%) |
| 65 to 74 Years | 0 (0.0%) | 10 (9.6%) |
| 75 Years and over | 16 (43.2%) | 17 (44.7%) |
Disability Class by Sex by Age in Cornwells Heights
Disability Class: Hearing Difficulty
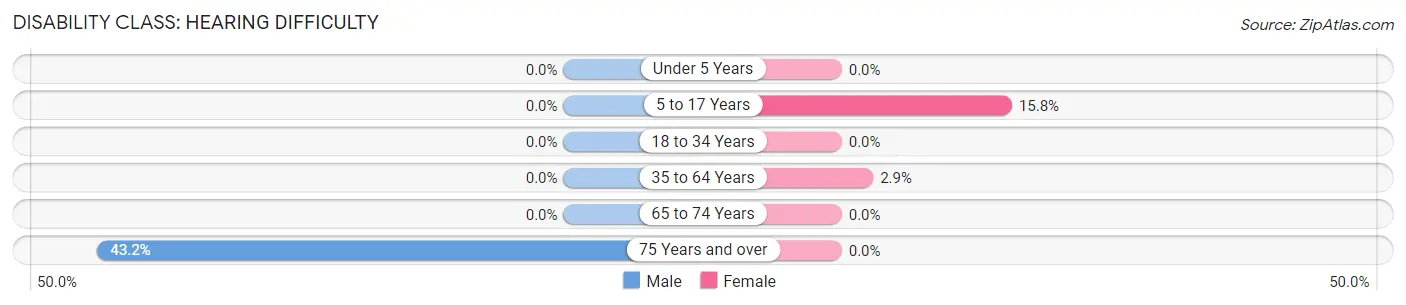
| Age Bracket | Male | Female |
| Under 5 Years | 0 (0.0%) | 0 (0.0%) |
| 5 to 17 Years | 0 (0.0%) | 12 (15.8%) |
| 18 to 34 Years | 0 (0.0%) | 0 (0.0%) |
| 35 to 64 Years | 0 (0.0%) | 9 (2.9%) |
| 65 to 74 Years | 0 (0.0%) | 0 (0.0%) |
| 75 Years and over | 16 (43.2%) | 0 (0.0%) |
Disability Class: Vision Difficulty
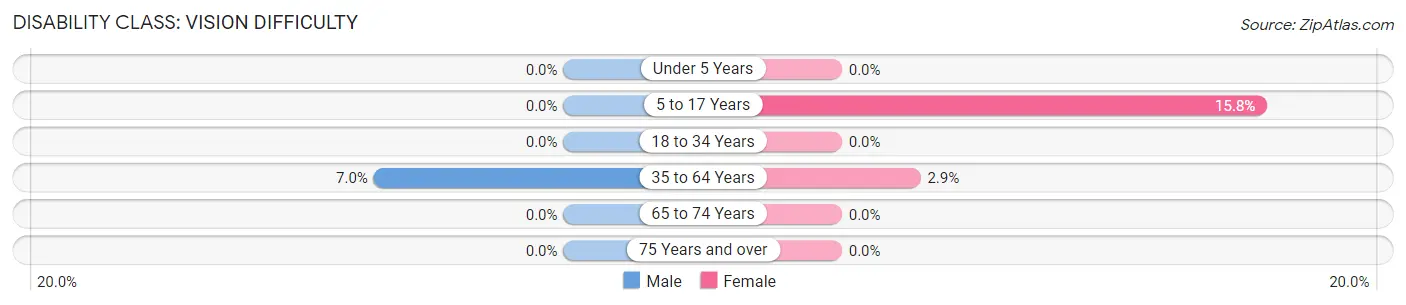
| Age Bracket | Male | Female |
| Under 5 Years | 0 (0.0%) | 0 (0.0%) |
| 5 to 17 Years | 0 (0.0%) | 12 (15.8%) |
| 18 to 34 Years | 0 (0.0%) | 0 (0.0%) |
| 35 to 64 Years | 24 (7.0%) | 9 (2.9%) |
| 65 to 74 Years | 0 (0.0%) | 0 (0.0%) |
| 75 Years and over | 0 (0.0%) | 0 (0.0%) |
Disability Class: Cognitive Difficulty
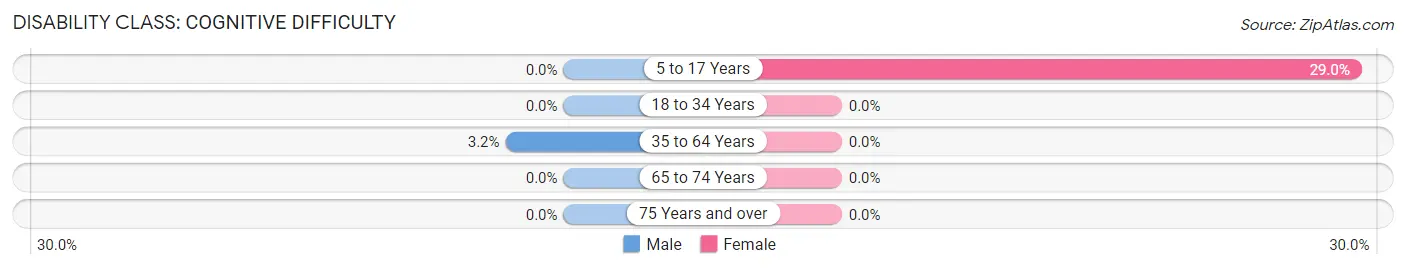
| Age Bracket | Male | Female |
| 5 to 17 Years | 0 (0.0%) | 22 (28.9%) |
| 18 to 34 Years | 0 (0.0%) | 0 (0.0%) |
| 35 to 64 Years | 11 (3.2%) | 0 (0.0%) |
| 65 to 74 Years | 0 (0.0%) | 0 (0.0%) |
| 75 Years and over | 0 (0.0%) | 0 (0.0%) |
Disability Class: Ambulatory Difficulty
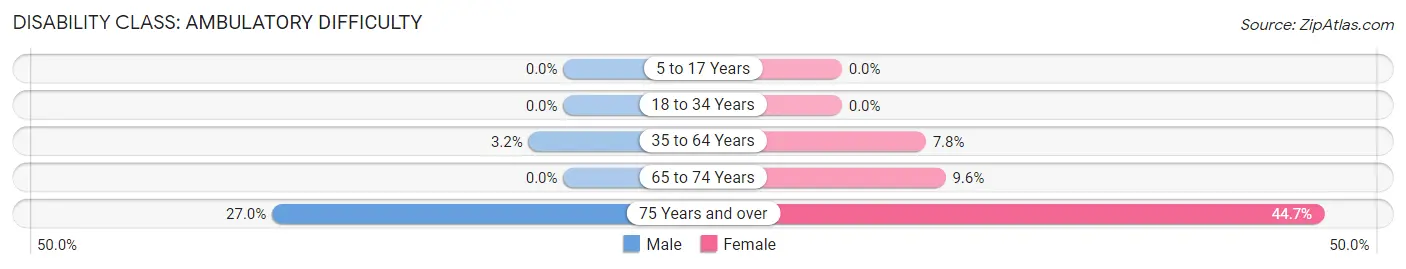
| Age Bracket | Male | Female |
| 5 to 17 Years | 0 (0.0%) | 0 (0.0%) |
| 18 to 34 Years | 0 (0.0%) | 0 (0.0%) |
| 35 to 64 Years | 11 (3.2%) | 24 (7.8%) |
| 65 to 74 Years | 0 (0.0%) | 10 (9.6%) |
| 75 Years and over | 10 (27.0%) | 17 (44.7%) |
Disability Class: Self-Care Difficulty
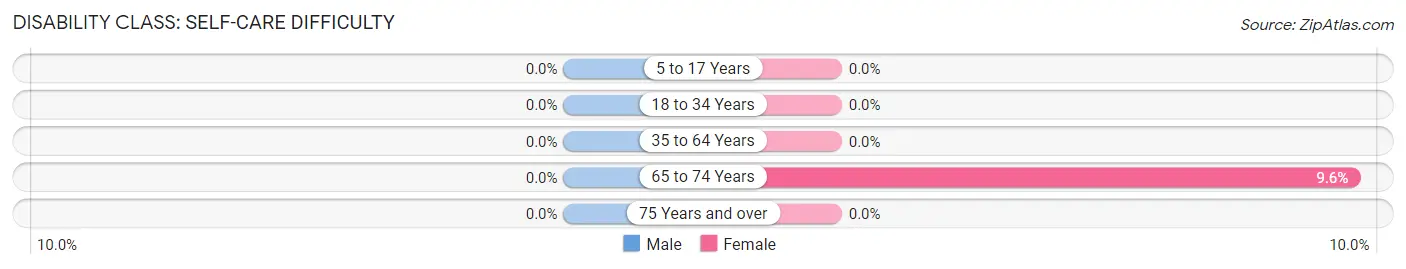
| Age Bracket | Male | Female |
| 5 to 17 Years | 0 (0.0%) | 0 (0.0%) |
| 18 to 34 Years | 0 (0.0%) | 0 (0.0%) |
| 35 to 64 Years | 0 (0.0%) | 0 (0.0%) |
| 65 to 74 Years | 0 (0.0%) | 10 (9.6%) |
| 75 Years and over | 0 (0.0%) | 0 (0.0%) |
Technology Access in Cornwells Heights
Computing Device Access in Cornwells Heights
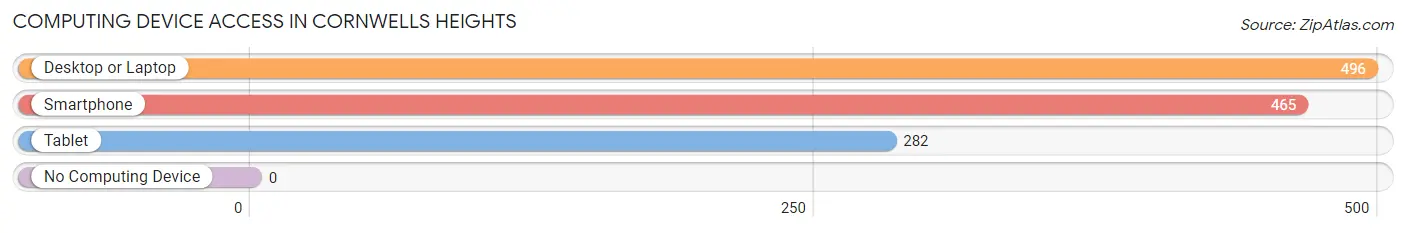
| Device Type | # Households | % Households |
| Desktop or Laptop | 496 | 83.8% |
| Smartphone | 465 | 78.5% |
| Tablet | 282 | 47.6% |
| No Computing Device | 0 | 0.0% |
| Total | 592 | 100.0% |
Internet Access in Cornwells Heights
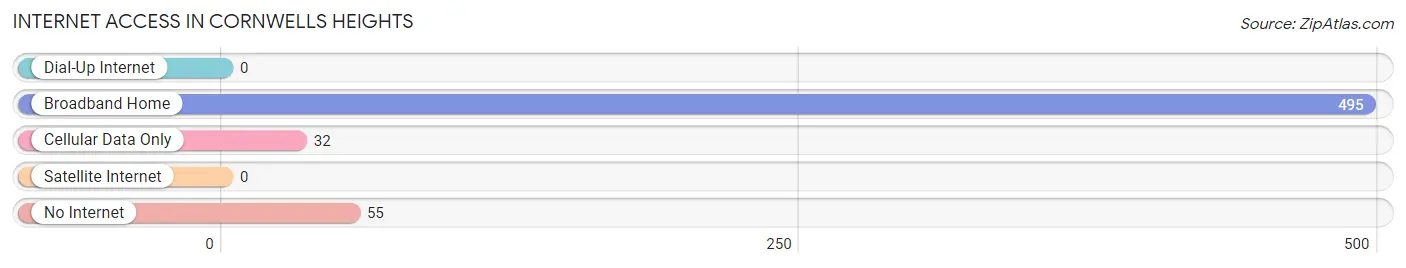
| Internet Type | # Households | % Households |
| Dial-Up Internet | 0 | 0.0% |
| Broadband Home | 495 | 83.6% |
| Cellular Data Only | 32 | 5.4% |
| Satellite Internet | 0 | 0.0% |
| No Internet | 55 | 9.3% |
| Total | 592 | 100.0% |
Cornwells Heights Summary
Cornwells Heights is a small borough located in Bucks County, Pennsylvania. It is situated along the Delaware River, just north of Philadelphia. The population of Cornwells Heights was 1,845 at the 2010 census.
History
Cornwells Heights was originally part of Bensalem Township, which was established in 1692. The area was first settled in the late 1700s by the Cornwell family, who owned a large tract of land in the area. The Cornwells built a grist mill and a saw mill on the banks of the Delaware River. The area was known as Cornwells Mills until 1876, when it was incorporated as the Borough of Cornwells Heights.
The borough was named after the Cornwell family, who were prominent in the area. The Cornwells were Quakers who had emigrated from England in the 1680s. They were active in the local community and were involved in the Underground Railroad, helping to free slaves from the South.
Geography
Cornwells Heights is located at 40°7′17″N 74°56′45″W (40.1214, -74.9457). It is situated along the Delaware River, just north of Philadelphia. The borough is bordered by Bensalem Township to the north, Bristol Township to the east, and Lower Southampton Township to the south and west.
The borough has a total area of 0.7 square miles, all of which is land. The terrain is mostly flat, with some rolling hills. The climate is humid subtropical, with hot, humid summers and cold, wet winters.
Economy
The economy of Cornwells Heights is largely based on manufacturing and retail. The borough is home to several factories, including a paper mill, a plastics factory, and a metal fabrication plant. There are also several retail stores in the area, including a grocery store, a hardware store, and a pharmacy.
The borough is also home to a number of small businesses, including restaurants, auto repair shops, and a variety of other services. The local economy is bolstered by its proximity to Philadelphia, which is just a short drive away.
Demographics
As of the 2010 census, the population of Cornwells Heights was 1,845. The racial makeup of the borough was 87.3% White, 8.2% African American, 0.7% Asian, 0.3% Native American, and 3.5% from other races. Hispanic or Latino of any race were 2.2% of the population.
The median household income in Cornwells Heights was $50,938, and the median family income was $60,938. The per capita income was $25,938. About 8.2% of families and 10.2% of the population were below the poverty line.
Common Questions
What is Per Capita Income in Cornwells Heights?
Per Capita income in Cornwells Heights is $52,171.
What is the Median Family Income in Cornwells Heights?
Median Family Income in Cornwells Heights is $109,565.
What is the Median Household income in Cornwells Heights?
Median Household Income in Cornwells Heights is $83,977.
What is Income or Wage Gap in Cornwells Heights?
Income or Wage Gap in Cornwells Heights is 11.3%.
Women in Cornwells Heights earn 88.7 cents for every dollar earned by a man.
What is Inequality or Gini Index in Cornwells Heights?
Inequality or Gini Index in Cornwells Heights is 0.43.
What is the Total Population of Cornwells Heights?
Total Population of Cornwells Heights is 1,339.
What is the Total Male Population of Cornwells Heights?
Total Male Population of Cornwells Heights is 695.
What is the Total Female Population of Cornwells Heights?
Total Female Population of Cornwells Heights is 644.
What is the Ratio of Males per 100 Females in Cornwells Heights?
There are 107.92 Males per 100 Females in Cornwells Heights.
What is the Ratio of Females per 100 Males in Cornwells Heights?
There are 92.66 Females per 100 Males in Cornwells Heights.
What is the Median Population Age in Cornwells Heights?
Median Population Age in Cornwells Heights is 42.8 Years.
What is the Average Family Size in Cornwells Heights
Average Family Size in Cornwells Heights is 2.6 People.
What is the Average Household Size in Cornwells Heights
Average Household Size in Cornwells Heights is 2.1 People.
How Large is the Labor Force in Cornwells Heights?
There are 824 People in the Labor Forcein in Cornwells Heights.
What is the Percentage of People in the Labor Force in Cornwells Heights?
71.2% of People are in the Labor Force in Cornwells Heights.
What is the Unemployment Rate in Cornwells Heights?
Unemployment Rate in Cornwells Heights is 6.1%.