Alleghenyville, PA Map & Demographics
Alleghenyville Map
Alleghenyville Overview
$50,386
PER CAPITA INCOME
$127,656
AVG FAMILY INCOME
$116,023
AVG HOUSEHOLD INCOME
23.7%
WAGE / INCOME GAP [ % ]
76.3¢/ $1
WAGE / INCOME GAP [ $ ]
0.37
INEQUALITY / GINI INDEX
849
TOTAL POPULATION
404
MALE POPULATION
445
FEMALE POPULATION
90.79
MALES / 100 FEMALES
110.15
FEMALES / 100 MALES
50.0
MEDIAN AGE
3.0
AVG FAMILY SIZE
2.8
AVG HOUSEHOLD SIZE
480
LABOR FORCE [ PEOPLE ]
68.3%
PERCENT IN LABOR FORCE
2.5%
UNEMPLOYMENT RATE
Income in Alleghenyville
Income Overview in Alleghenyville
Per Capita Income in Alleghenyville is $50,386, while median incomes of families and households are $127,656 and $116,023 respectively.
| Characteristic | Number | Measure |
| Per Capita Income | 849 | $50,386 |
| Median Family Income | 253 | $127,656 |
| Mean Family Income | 253 | $145,930 |
| Median Household Income | 305 | $116,023 |
| Mean Household Income | 305 | $137,103 |
| Income Deficit | 253 | $0 |
| Wage / Income Gap (%) | 849 | 23.73% |
| Wage / Income Gap ($) | 849 | 76.27¢ per $1 |
| Gini / Inequality Index | 849 | 0.37 |
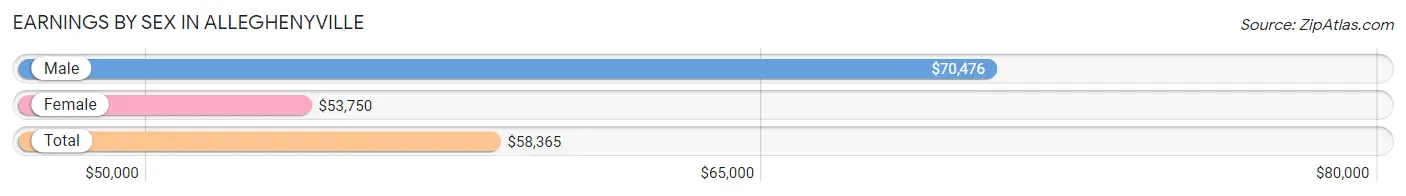
Earnings by Sex in Alleghenyville
Average Earnings in Alleghenyville are $58,365, $70,476 for men and $53,750 for women, a difference of 23.7%.
| Sex | Number | Average Earnings |
| Male | 266 (54.6%) | $70,476 |
| Female | 221 (45.4%) | $53,750 |
| Total | 487 (100.0%) | $58,365 |
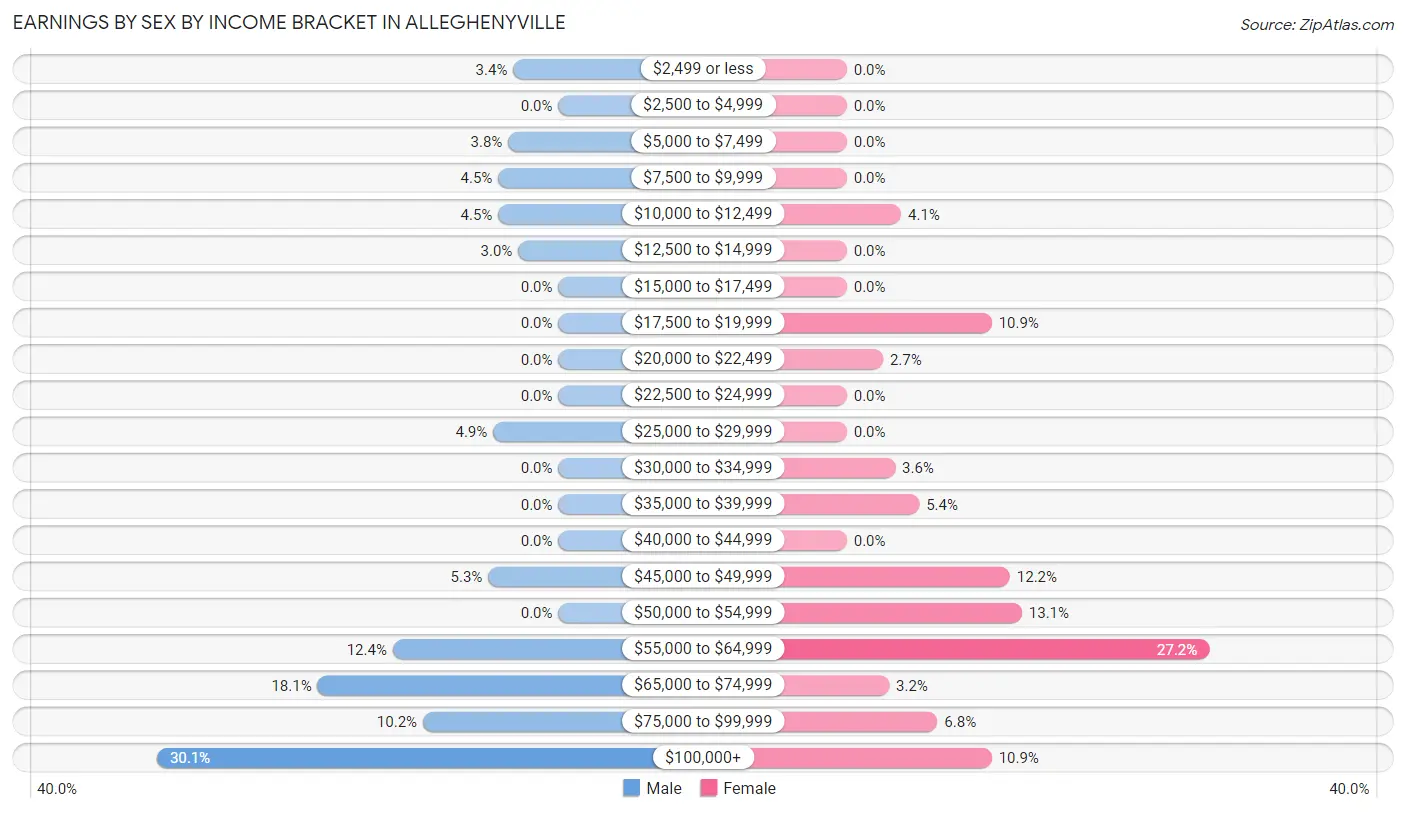
Earnings by Sex by Income Bracket in Alleghenyville
The most common earnings brackets in Alleghenyville are $100,000+ for men (80 | 30.1%) and $55,000 to $64,999 for women (60 | 27.2%).
| Income | Male | Female |
| $2,499 or less | 9 (3.4%) | 0 (0.0%) |
| $2,500 to $4,999 | 0 (0.0%) | 0 (0.0%) |
| $5,000 to $7,499 | 10 (3.8%) | 0 (0.0%) |
| $7,500 to $9,999 | 12 (4.5%) | 0 (0.0%) |
| $10,000 to $12,499 | 12 (4.5%) | 9 (4.1%) |
| $12,500 to $14,999 | 8 (3.0%) | 0 (0.0%) |
| $15,000 to $17,499 | 0 (0.0%) | 0 (0.0%) |
| $17,500 to $19,999 | 0 (0.0%) | 24 (10.9%) |
| $20,000 to $22,499 | 0 (0.0%) | 6 (2.7%) |
| $22,500 to $24,999 | 0 (0.0%) | 0 (0.0%) |
| $25,000 to $29,999 | 13 (4.9%) | 0 (0.0%) |
| $30,000 to $34,999 | 0 (0.0%) | 8 (3.6%) |
| $35,000 to $39,999 | 0 (0.0%) | 12 (5.4%) |
| $40,000 to $44,999 | 0 (0.0%) | 0 (0.0%) |
| $45,000 to $49,999 | 14 (5.3%) | 27 (12.2%) |
| $50,000 to $54,999 | 0 (0.0%) | 29 (13.1%) |
| $55,000 to $64,999 | 33 (12.4%) | 60 (27.2%) |
| $65,000 to $74,999 | 48 (18.0%) | 7 (3.2%) |
| $75,000 to $99,999 | 27 (10.2%) | 15 (6.8%) |
| $100,000+ | 80 (30.1%) | 24 (10.9%) |
| Total | 266 (100.0%) | 221 (100.0%) |
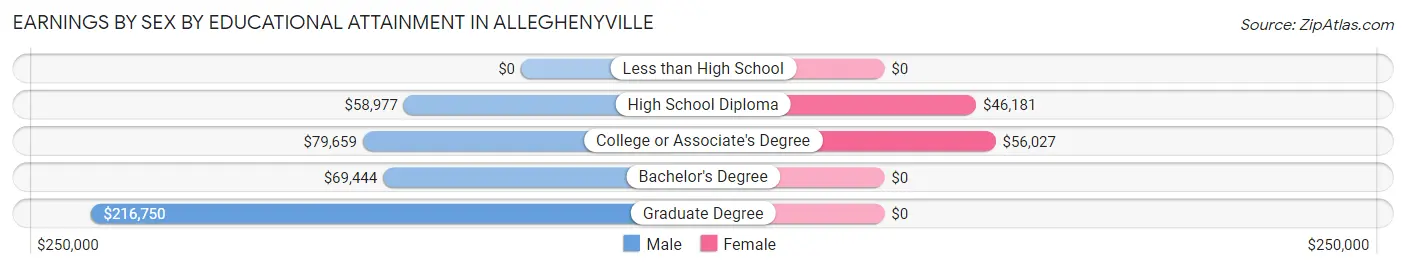
Earnings by Sex by Educational Attainment in Alleghenyville
Average earnings in Alleghenyville are $71,607 for men and $53,750 for women, a difference of 24.9%. Men with an educational attainment of graduate degree enjoy the highest average annual earnings of $216,750, while those with high school diploma education earn the least with $58,977. Women with an educational attainment of college or associate's degree earn the most with the average annual earnings of $56,027, while those with high school diploma education have the smallest earnings of $46,181.
| Educational Attainment | Male Income | Female Income |
| Less than High School | - | - |
| High School Diploma | $58,977 | $46,181 |
| College or Associate's Degree | $79,659 | $56,027 |
| Bachelor's Degree | $69,444 | $0 |
| Graduate Degree | $216,750 | $0 |
| Total | $71,607 | $53,750 |
Family Income in Alleghenyville
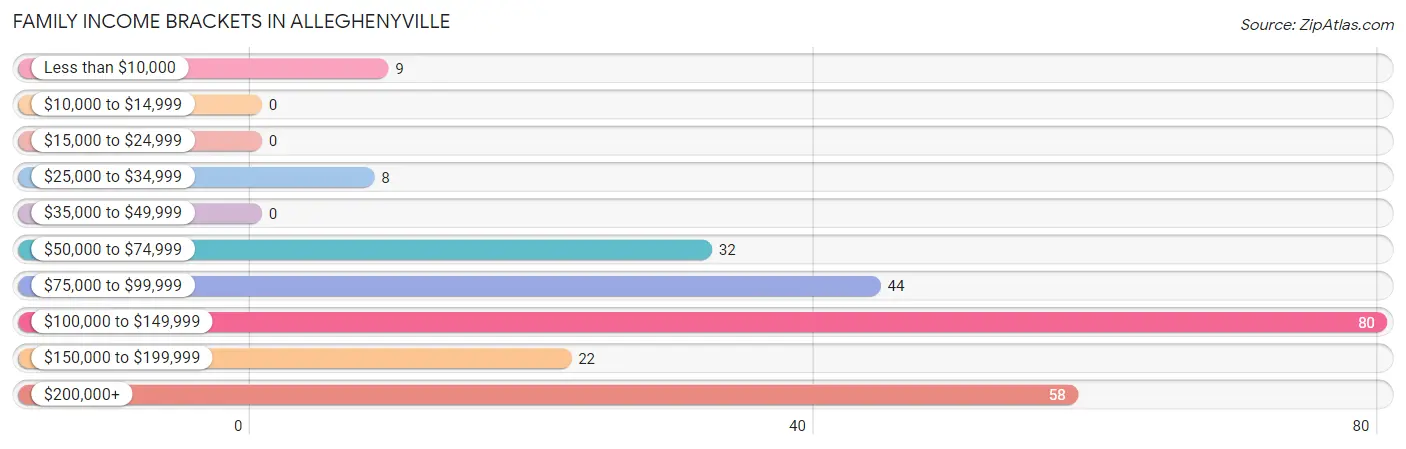
Family Income Brackets in Alleghenyville
According to the Alleghenyville family income data, there are 80 families falling into the $100,000 to $149,999 income range, which is the most common income bracket and makes up 31.6% of all families.
| Income Bracket | # Families | % Families |
| Less than $10,000 | 9 | 3.6% |
| $10,000 to $14,999 | 0 | 0.0% |
| $15,000 to $24,999 | 0 | 0.0% |
| $25,000 to $34,999 | 8 | 3.2% |
| $35,000 to $49,999 | 0 | 0.0% |
| $50,000 to $74,999 | 32 | 12.6% |
| $75,000 to $99,999 | 44 | 17.4% |
| $100,000 to $149,999 | 80 | 31.6% |
| $150,000 to $199,999 | 22 | 8.7% |
| $200,000+ | 58 | 22.9% |
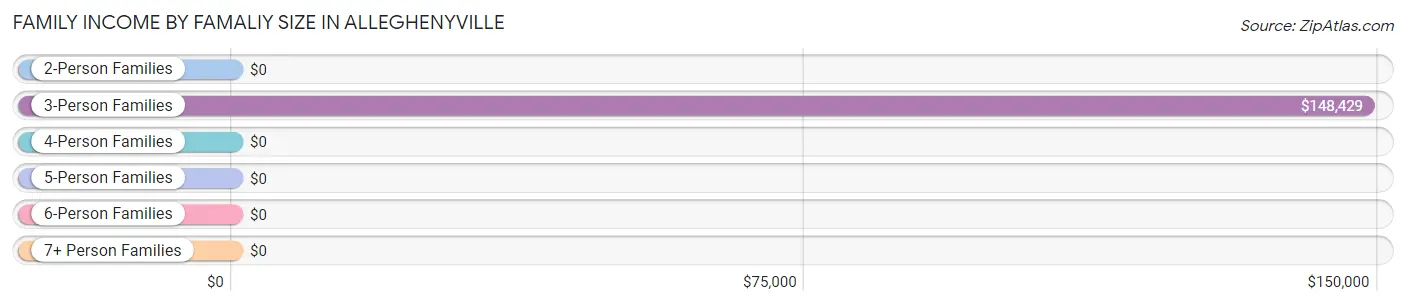
Family Income by Famaliy Size in Alleghenyville
3-person families (111 | 43.9%) account for the highest median family income in Alleghenyville with $148,429 per family, while 3-person families (111 | 43.9%) have the highest median income of $49,476 per family member.
| Income Bracket | # Families | Median Income |
| 2-Person Families | 88 (34.8%) | $0 |
| 3-Person Families | 111 (43.9%) | $148,429 |
| 4-Person Families | 54 (21.3%) | $0 |
| 5-Person Families | 0 (0.0%) | $0 |
| 6-Person Families | 0 (0.0%) | $0 |
| 7+ Person Families | 0 (0.0%) | $0 |
| Total | 253 (100.0%) | $127,656 |
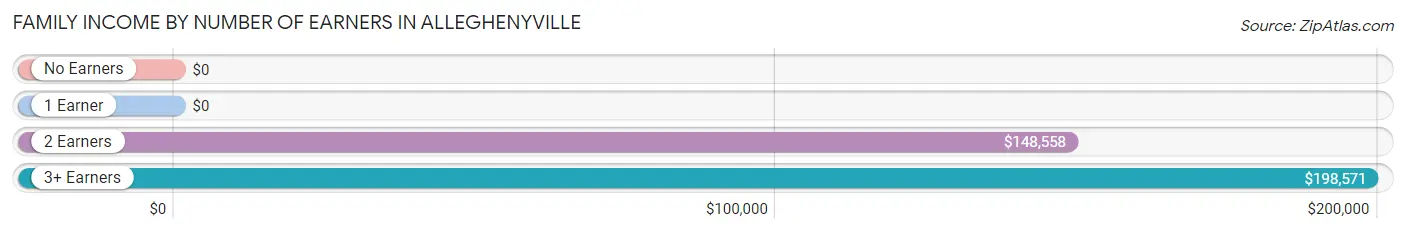
Family Income by Number of Earners in Alleghenyville
| Number of Earners | # Families | Median Income |
| No Earners | 38 (15.0%) | $0 |
| 1 Earner | 40 (15.8%) | $0 |
| 2 Earners | 153 (60.5%) | $148,558 |
| 3+ Earners | 22 (8.7%) | $198,571 |
| Total | 253 (100.0%) | $127,656 |
Household Income in Alleghenyville
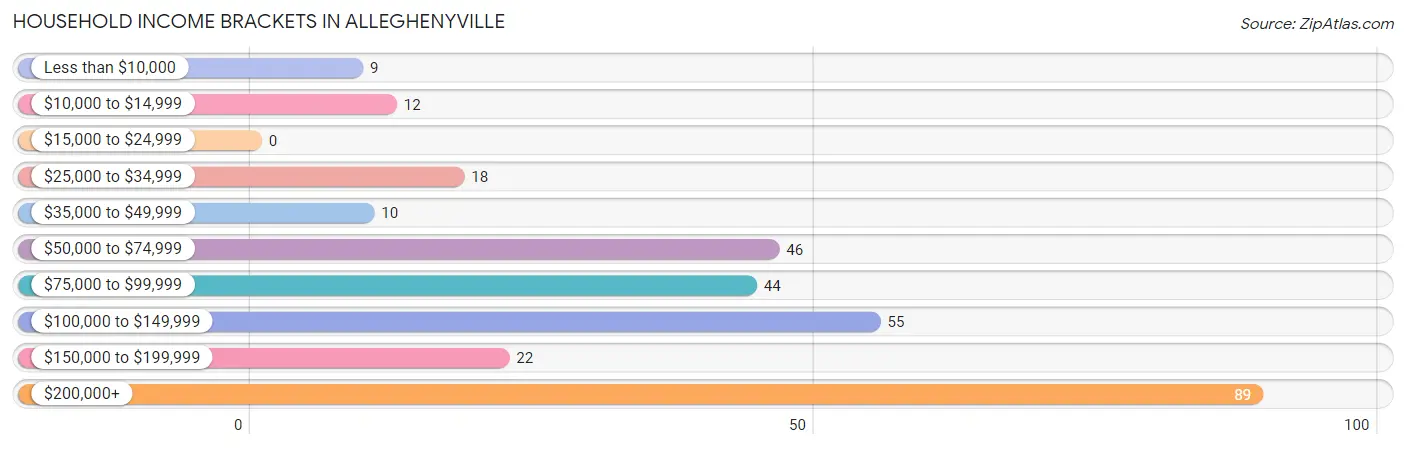
Household Income Brackets in Alleghenyville
With 89 households falling in the category, the $200,000+ income range is the most frequent in Alleghenyville, accounting for 29.2% of all households.
| Income Bracket | # Households | % Households |
| Less than $10,000 | 9 | 3.0% |
| $10,000 to $14,999 | 12 | 3.9% |
| $15,000 to $24,999 | 0 | 0.0% |
| $25,000 to $34,999 | 18 | 5.9% |
| $35,000 to $49,999 | 10 | 3.3% |
| $50,000 to $74,999 | 46 | 15.1% |
| $75,000 to $99,999 | 44 | 14.4% |
| $100,000 to $149,999 | 55 | 18.0% |
| $150,000 to $199,999 | 22 | 7.2% |
| $200,000+ | 89 | 29.2% |
Household Income by Householder Age in Alleghenyville
The median household income in Alleghenyville is $116,023, with the highest median household income of $195,208 found in the 45 to 64 years age bracket for the primary householder. A total of 135 households (44.3%) fall into this category.
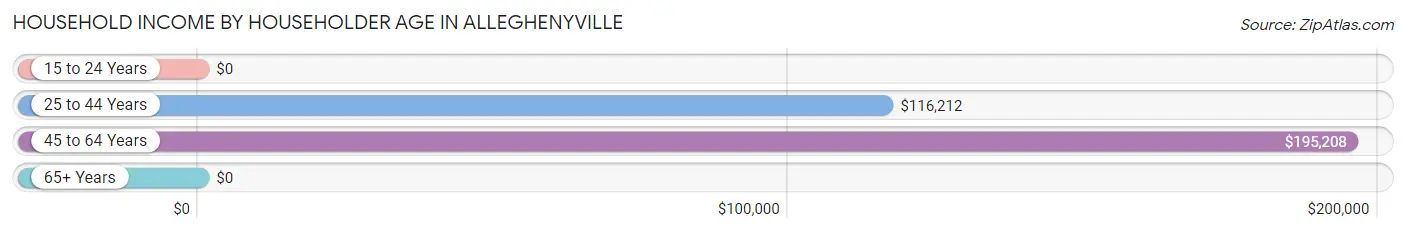
| Income Bracket | # Households | Median Income |
| 15 to 24 Years | 0 (0.0%) | $0 |
| 25 to 44 Years | 78 (25.6%) | $116,212 |
| 45 to 64 Years | 135 (44.3%) | $195,208 |
| 65+ Years | 92 (30.2%) | $0 |
| Total | 305 (100.0%) | $116,023 |
Poverty in Alleghenyville
Income Below Poverty by Sex and Age in Alleghenyville
With 6.9% poverty level for males and 2.0% for females among the residents of Alleghenyville, 55 to 64 year old males and 75 year old and over females are the most vulnerable to poverty, with 12 males (19.4%) and 9 females (19.6%) in their respective age groups living below the poverty level.
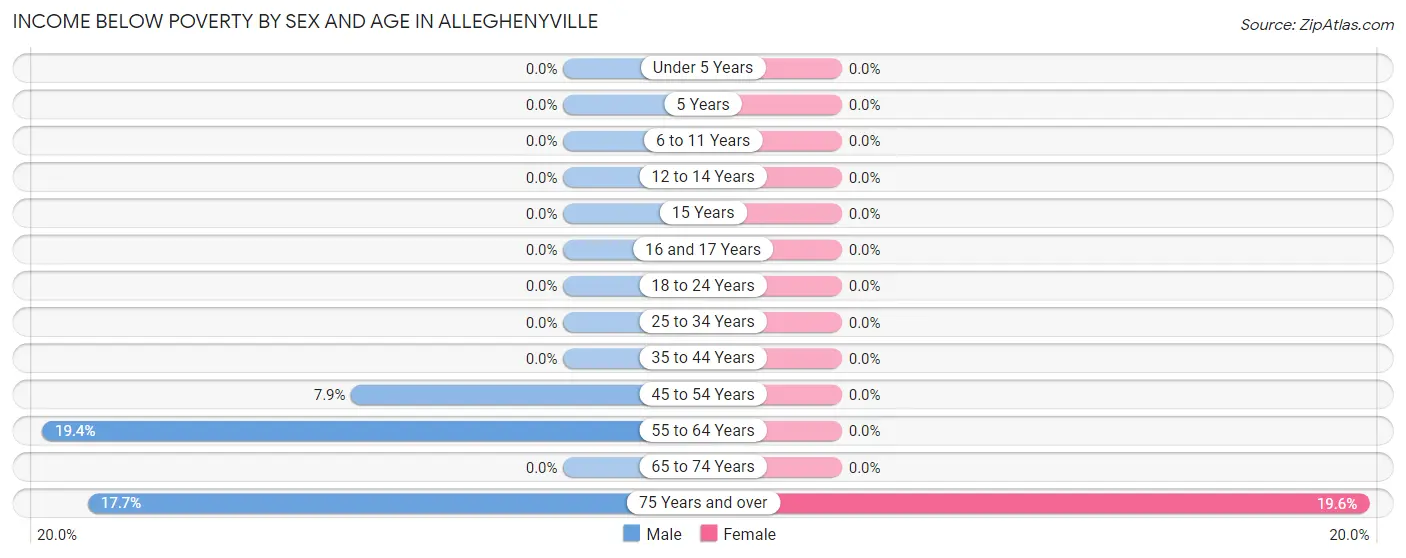
| Age Bracket | Male | Female |
| Under 5 Years | 0 (0.0%) | 0 (0.0%) |
| 5 Years | 0 (0.0%) | 0 (0.0%) |
| 6 to 11 Years | 0 (0.0%) | 0 (0.0%) |
| 12 to 14 Years | 0 (0.0%) | 0 (0.0%) |
| 15 Years | 0 (0.0%) | 0 (0.0%) |
| 16 and 17 Years | 0 (0.0%) | 0 (0.0%) |
| 18 to 24 Years | 0 (0.0%) | 0 (0.0%) |
| 25 to 34 Years | 0 (0.0%) | 0 (0.0%) |
| 35 to 44 Years | 0 (0.0%) | 0 (0.0%) |
| 45 to 54 Years | 7 (7.9%) | 0 (0.0%) |
| 55 to 64 Years | 12 (19.4%) | 0 (0.0%) |
| 65 to 74 Years | 0 (0.0%) | 0 (0.0%) |
| 75 Years and over | 9 (17.6%) | 9 (19.6%) |
| Total | 28 (6.9%) | 9 (2.0%) |
Income Above Poverty by Sex and Age in Alleghenyville
According to the poverty statistics in Alleghenyville, males aged 5 years and females aged under 5 years are the age groups that are most secure financially, with 100.0% of males and 100.0% of females in these age groups living above the poverty line.
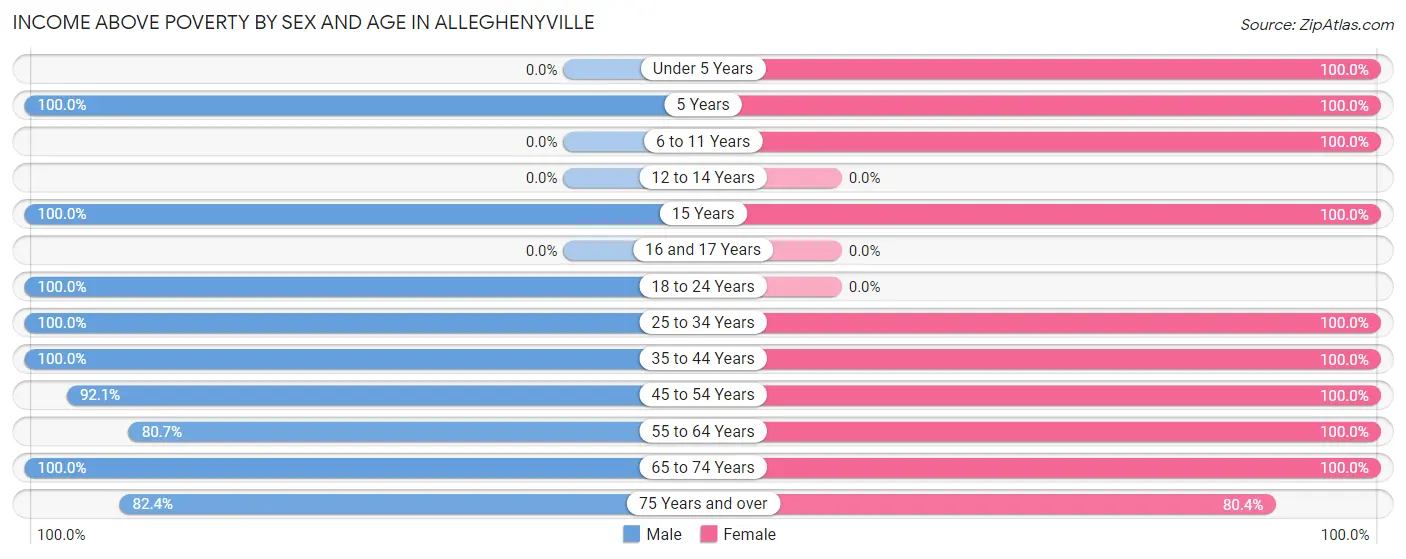
| Age Bracket | Male | Female |
| Under 5 Years | 0 (0.0%) | 37 (100.0%) |
| 5 Years | 46 (100.0%) | 11 (100.0%) |
| 6 to 11 Years | 0 (0.0%) | 19 (100.0%) |
| 12 to 14 Years | 0 (0.0%) | 0 (0.0%) |
| 15 Years | 11 (100.0%) | 22 (100.0%) |
| 16 and 17 Years | 0 (0.0%) | 0 (0.0%) |
| 18 to 24 Years | 25 (100.0%) | 0 (0.0%) |
| 25 to 34 Years | 10 (100.0%) | 30 (100.0%) |
| 35 to 44 Years | 69 (100.0%) | 84 (100.0%) |
| 45 to 54 Years | 82 (92.1%) | 59 (100.0%) |
| 55 to 64 Years | 50 (80.6%) | 98 (100.0%) |
| 65 to 74 Years | 41 (100.0%) | 39 (100.0%) |
| 75 Years and over | 42 (82.4%) | 37 (80.4%) |
| Total | 376 (93.1%) | 436 (98.0%) |
Income Below Poverty Among Married-Couple Families in Alleghenyville
The poverty statistics for married-couple families in Alleghenyville show that 3.6% or 9 of the total 253 families live below the poverty line. Families with no children have the highest poverty rate of 5.8%, comprising of 9 families. On the other hand, families with 1 or 2 children have the lowest poverty rate of 0.0%, which includes 0 families.
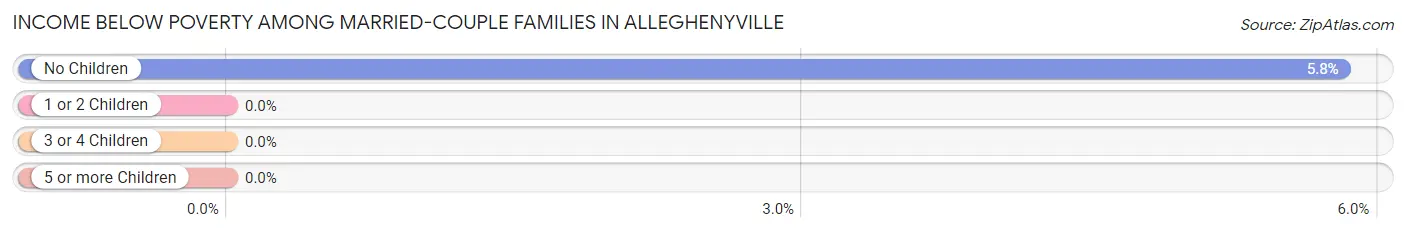
| Children | Above Poverty | Below Poverty |
| No Children | 146 (94.2%) | 9 (5.8%) |
| 1 or 2 Children | 98 (100.0%) | 0 (0.0%) |
| 3 or 4 Children | 0 (0.0%) | 0 (0.0%) |
| 5 or more Children | 0 (0.0%) | 0 (0.0%) |
| Total | 244 (96.4%) | 9 (3.6%) |
Income Below Poverty Among Single-Parent Households in Alleghenyville
| Children | Single Father | Single Mother |
| No Children | 0 (0.0%) | 0 (0.0%) |
| 1 or 2 Children | 0 (0.0%) | 0 (0.0%) |
| 3 or 4 Children | 0 (0.0%) | 0 (0.0%) |
| 5 or more Children | 0 (0.0%) | 0 (0.0%) |
| Total | 0 (0.0%) | 0 (0.0%) |
Income Below Poverty Among Married-Couple vs Single-Parent Households in Alleghenyville
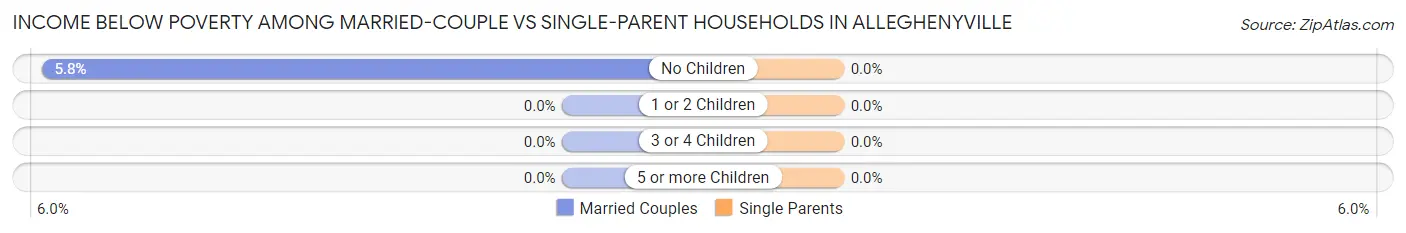
| Children | Married-Couple Families | Single-Parent Households |
| No Children | 9 (5.8%) | 0 (0.0%) |
| 1 or 2 Children | 0 (0.0%) | 0 (0.0%) |
| 3 or 4 Children | 0 (0.0%) | 0 (0.0%) |
| 5 or more Children | 0 (0.0%) | 0 (0.0%) |
| Total | 9 (3.6%) | 0 (0.0%) |
Race in Alleghenyville
The most populous races in Alleghenyville are White / Caucasian (811 | 95.5%), Two or more Races (22 | 2.6%), and Black / African American (10 | 1.2%).
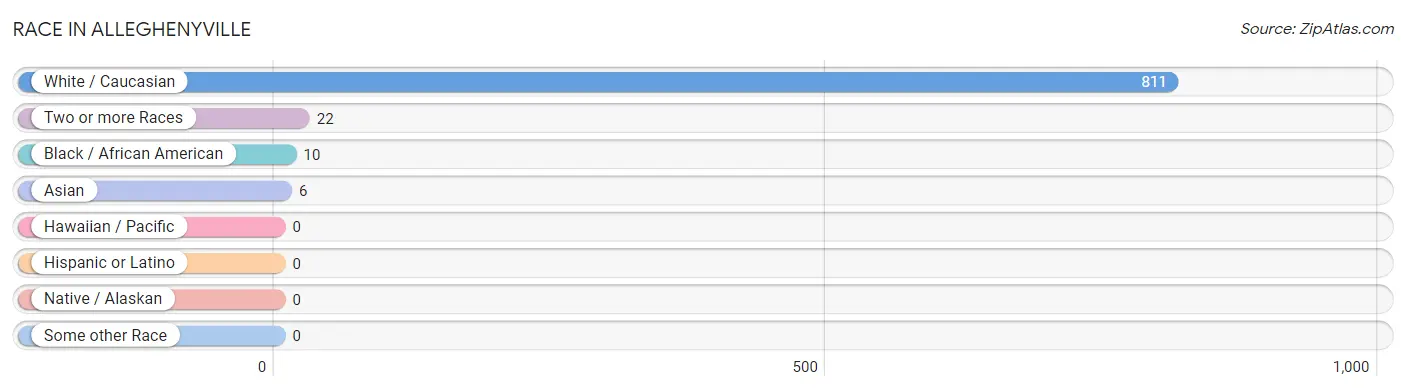
| Race | # Population | % Population |
| Asian | 6 | 0.7% |
| Black / African American | 10 | 1.2% |
| Hawaiian / Pacific | 0 | 0.0% |
| Hispanic or Latino | 0 | 0.0% |
| Native / Alaskan | 0 | 0.0% |
| White / Caucasian | 811 | 95.5% |
| Two or more Races | 22 | 2.6% |
| Some other Race | 0 | 0.0% |
| Total | 849 | 100.0% |
Ancestry in Alleghenyville
The most populous ancestries reported in Alleghenyville are German (323 | 38.0%), American (151 | 17.8%), Italian (143 | 16.8%), English (62 | 7.3%), and Scotch-Irish (37 | 4.4%), together accounting for 84.3% of all Alleghenyville residents.
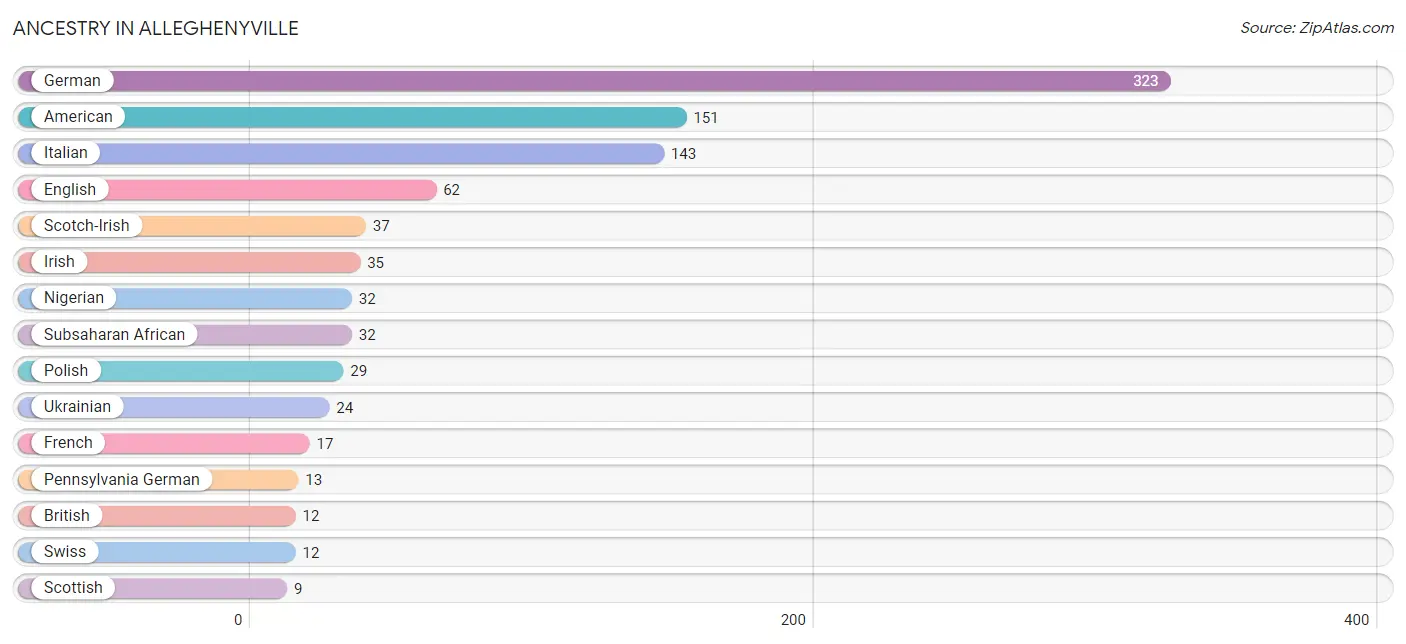
| Ancestry | # Population | % Population |
| American | 151 | 17.8% |
| British | 12 | 1.4% |
| English | 62 | 7.3% |
| French | 17 | 2.0% |
| German | 323 | 38.0% |
| Indian (Asian) | 6 | 0.7% |
| Irish | 35 | 4.1% |
| Italian | 143 | 16.8% |
| Nigerian | 32 | 3.8% |
| Pennsylvania German | 13 | 1.5% |
| Polish | 29 | 3.4% |
| Scotch-Irish | 37 | 4.4% |
| Scottish | 9 | 1.1% |
| Subsaharan African | 32 | 3.8% |
| Swiss | 12 | 1.4% |
| Ukrainian | 24 | 2.8% |
| Welsh | 9 | 1.1% | View All 17 Rows |
Immigrants in Alleghenyville
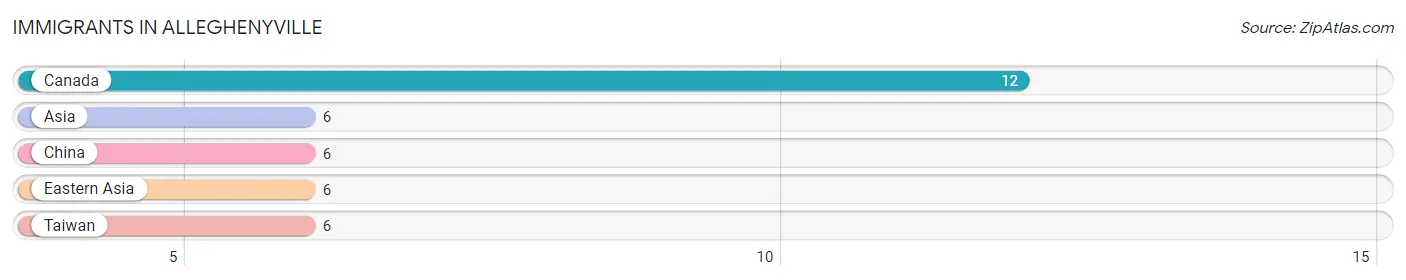
The most numerous immigrant groups reported in Alleghenyville came from Canada (12 | 1.4%), Asia (6 | 0.7%), China (6 | 0.7%), Eastern Asia (6 | 0.7%), and Taiwan (6 | 0.7%), together accounting for 4.3% of all Alleghenyville residents.
| Immigration Origin | # Population | % Population |
| Asia | 6 | 0.7% |
| Canada | 12 | 1.4% |
| China | 6 | 0.7% |
| Eastern Asia | 6 | 0.7% |
| Taiwan | 6 | 0.7% | View All 5 Rows |
Sex and Age in Alleghenyville
Sex and Age in Alleghenyville
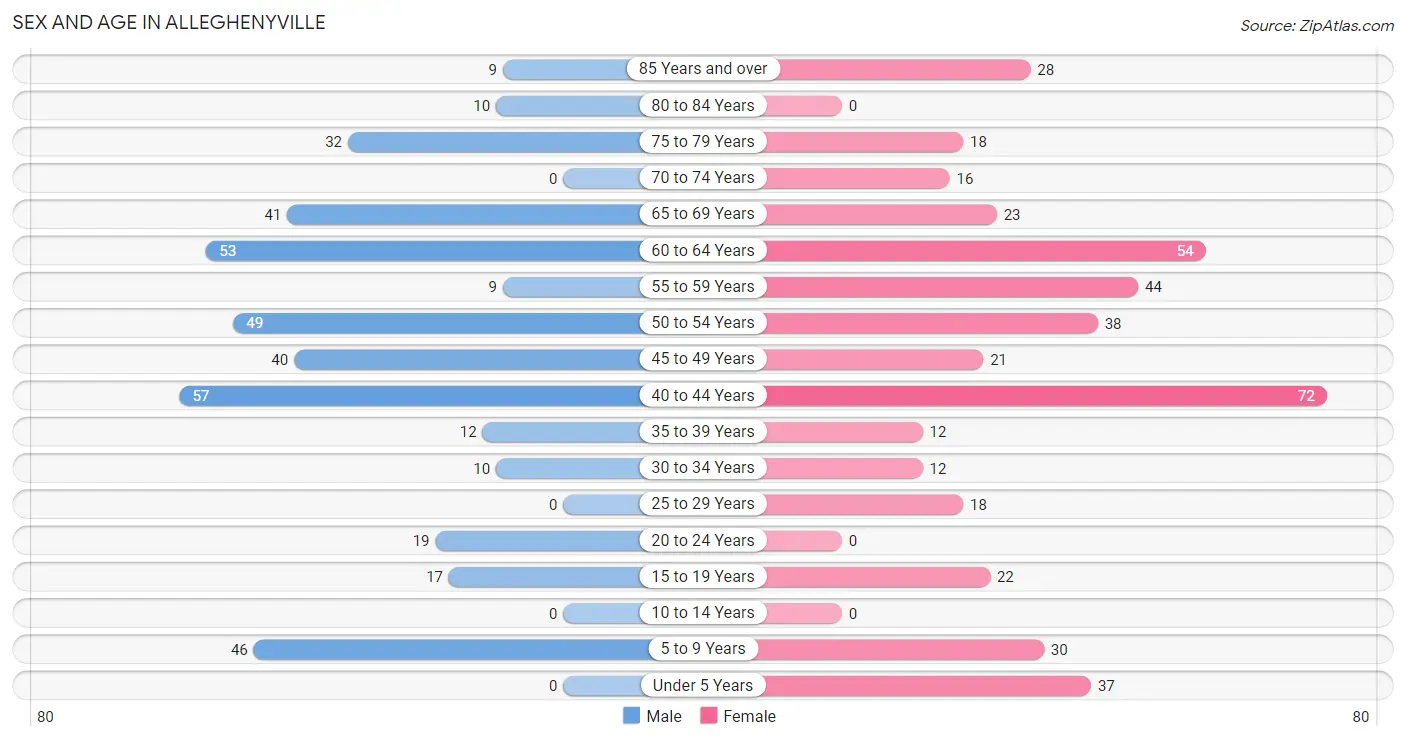
The most populous age groups in Alleghenyville are 40 to 44 Years (57 | 14.1%) for men and 40 to 44 Years (72 | 16.2%) for women.
| Age Bracket | Male | Female |
| Under 5 Years | 0 (0.0%) | 37 (8.3%) |
| 5 to 9 Years | 46 (11.4%) | 30 (6.7%) |
| 10 to 14 Years | 0 (0.0%) | 0 (0.0%) |
| 15 to 19 Years | 17 (4.2%) | 22 (4.9%) |
| 20 to 24 Years | 19 (4.7%) | 0 (0.0%) |
| 25 to 29 Years | 0 (0.0%) | 18 (4.0%) |
| 30 to 34 Years | 10 (2.5%) | 12 (2.7%) |
| 35 to 39 Years | 12 (3.0%) | 12 (2.7%) |
| 40 to 44 Years | 57 (14.1%) | 72 (16.2%) |
| 45 to 49 Years | 40 (9.9%) | 21 (4.7%) |
| 50 to 54 Years | 49 (12.1%) | 38 (8.5%) |
| 55 to 59 Years | 9 (2.2%) | 44 (9.9%) |
| 60 to 64 Years | 53 (13.1%) | 54 (12.1%) |
| 65 to 69 Years | 41 (10.2%) | 23 (5.2%) |
| 70 to 74 Years | 0 (0.0%) | 16 (3.6%) |
| 75 to 79 Years | 32 (7.9%) | 18 (4.0%) |
| 80 to 84 Years | 10 (2.5%) | 0 (0.0%) |
| 85 Years and over | 9 (2.2%) | 28 (6.3%) |
| Total | 404 (100.0%) | 445 (100.0%) |
Families and Households in Alleghenyville
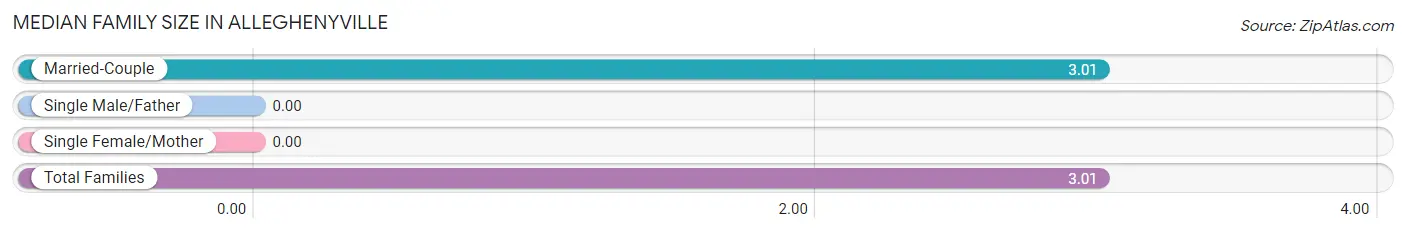
Median Family Size in Alleghenyville
| Family Type | # Families | Family Size |
| Married-Couple | 253 (100.0%) | 3.01 |
| Single Male/Father | 0 (0.0%) | - |
| Single Female/Mother | 0 (0.0%) | - |
| Total Families | 253 (100.0%) | 3.01 |
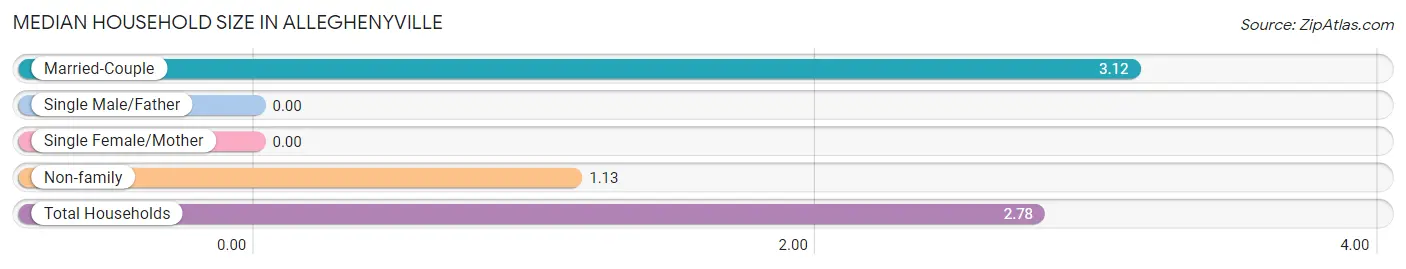
Median Household Size in Alleghenyville
| Household Type | # Households | Household Size |
| Married-Couple | 253 (83.0%) | 3.12 |
| Single Male/Father | 0 (0.0%) | - |
| Single Female/Mother | 0 (0.0%) | - |
| Non-family | 52 (17.1%) | 1.13 |
| Total Households | 305 (100.0%) | 2.78 |
Household Size by Marriage Status in Alleghenyville
Out of a total of 305 households in Alleghenyville, 253 (83.0%) are family households, while 52 (17.1%) are nonfamily households. The most numerous type of family households are 2-person households, comprising 88, and the most common type of nonfamily households are 1-person households, comprising 46.
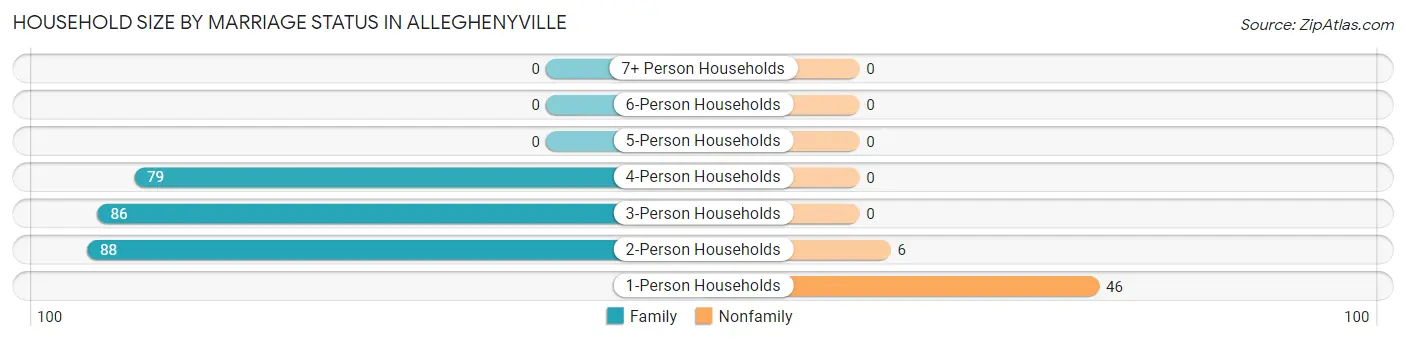
| Household Size | Family Households | Nonfamily Households |
| 1-Person Households | - | 46 (15.1%) |
| 2-Person Households | 88 (28.8%) | 6 (2.0%) |
| 3-Person Households | 86 (28.2%) | 0 (0.0%) |
| 4-Person Households | 79 (25.9%) | 0 (0.0%) |
| 5-Person Households | 0 (0.0%) | 0 (0.0%) |
| 6-Person Households | 0 (0.0%) | 0 (0.0%) |
| 7+ Person Households | 0 (0.0%) | 0 (0.0%) |
| Total | 253 (83.0%) | 52 (17.1%) |
Female Fertility in Alleghenyville
Fertility by Age in Alleghenyville
| Age Bracket | Women with Births | Births / 1,000 Women |
| 15 to 19 years | 0 (0.0%) | 0.0 |
| 20 to 34 years | 0 (0.0%) | 0.0 |
| 35 to 50 years | 0 (0.0%) | 0.0 |
| Total | 0 (0.0%) | 0.0 |
Fertility by Age by Marriage Status in Alleghenyville
| Age Bracket | Married | Unmarried |
| 15 to 19 years | 0 (0.0%) | 0 (0.0%) |
| 20 to 34 years | 0 (0.0%) | 0 (0.0%) |
| 35 to 50 years | 0 (0.0%) | 0 (0.0%) |
| Total | 0 (0.0%) | 0 (0.0%) |
Fertility by Education in Alleghenyville
| Educational Attainment | Women with Births | Births / 1,000 Women |
| Less than High School | 0 (0.0%) | 0.0 |
| High School Diploma | 0 (0.0%) | 0.0 |
| College or Associate's Degree | 0 (0.0%) | 0.0 |
| Bachelor's Degree | 0 (0.0%) | 0.0 |
| Graduate Degree | 0 (0.0%) | 0.0 |
| Total | 0 (0.0%) | 0.0 |
Fertility by Education by Marriage Status in Alleghenyville
| Educational Attainment | Married | Unmarried |
| Less than High School | 0 (0.0%) | 0 (0.0%) |
| High School Diploma | 0 (0.0%) | 0 (0.0%) |
| College or Associate's Degree | 0 (0.0%) | 0 (0.0%) |
| Bachelor's Degree | 0 (0.0%) | 0 (0.0%) |
| Graduate Degree | 0 (0.0%) | 0 (0.0%) |
| Total | 0 (0.0%) | 0 (0.0%) |
Employment Characteristics in Alleghenyville
Employment by Class of Employer in Alleghenyville
Among the 468 employed individuals in Alleghenyville, private company employees (345 | 73.7%), not-for-profit organizations (58 | 12.4%), and self-employed (incorporated) (24 | 5.1%) make up the most common classes of employment.
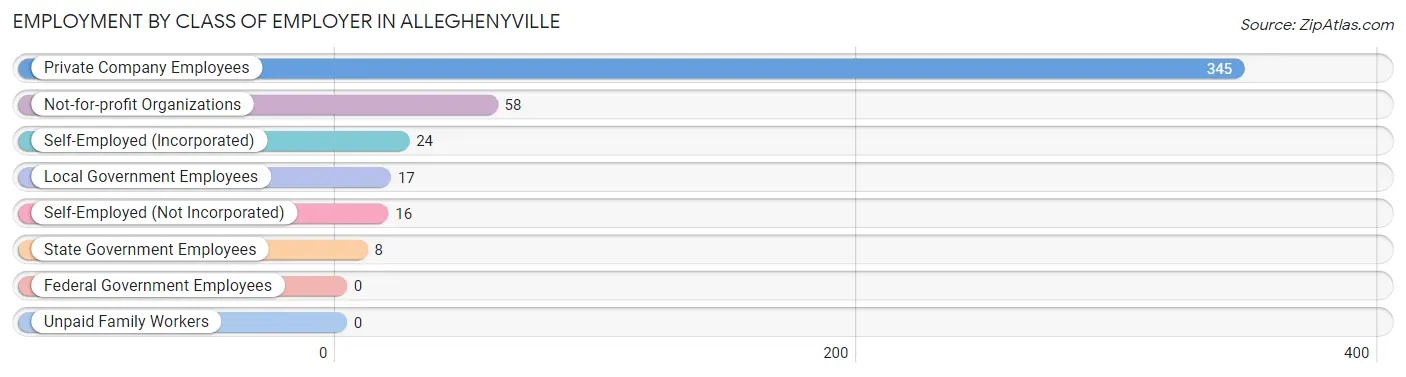
| Employer Class | # Employees | % Employees |
| Private Company Employees | 345 | 73.7% |
| Self-Employed (Incorporated) | 24 | 5.1% |
| Self-Employed (Not Incorporated) | 16 | 3.4% |
| Not-for-profit Organizations | 58 | 12.4% |
| Local Government Employees | 17 | 3.6% |
| State Government Employees | 8 | 1.7% |
| Federal Government Employees | 0 | 0.0% |
| Unpaid Family Workers | 0 | 0.0% |
| Total | 468 | 100.0% |
Employment Status by Age in Alleghenyville
According to the labor force statistics for Alleghenyville, out of the total population over 16 years of age (703), 68.3% or 480 individuals are in the labor force, with 2.5% or 12 of them unemployed. The age group with the highest labor force participation rate is 25 to 29 years, with 100.0% or 18 individuals in the labor force. Within the labor force, the 35 to 44 years age range has the highest percentage of unemployed individuals, with 8.4% or 12 of them being unemployed.
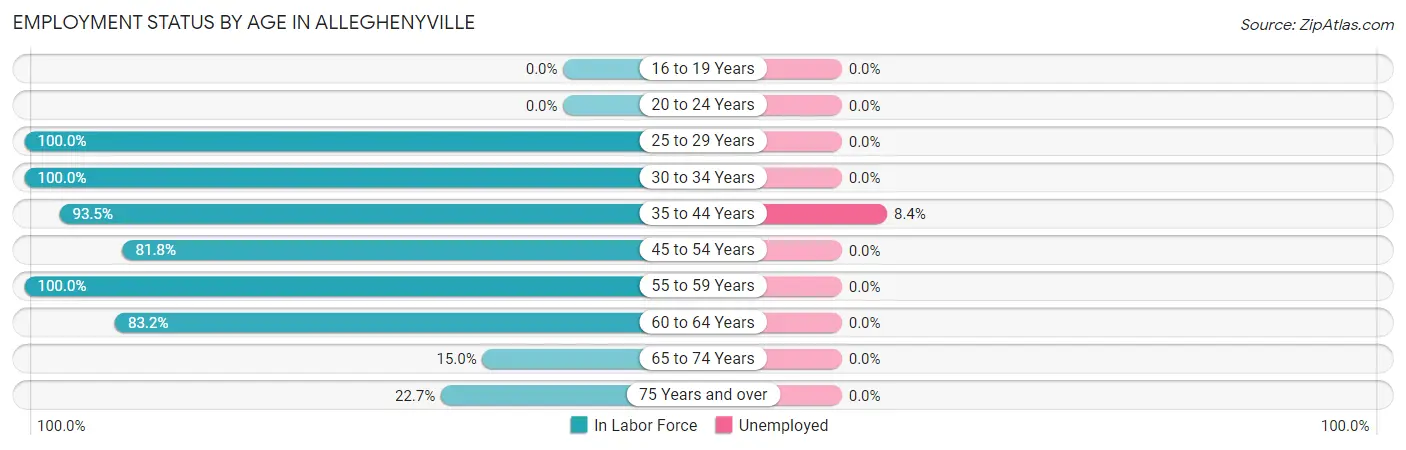
| Age Bracket | In Labor Force | Unemployed |
| 16 to 19 Years | 0 (0.0%) | 0 (0.0%) |
| 20 to 24 Years | 0 (0.0%) | 0 (0.0%) |
| 25 to 29 Years | 18 (100.0%) | 0 (0.0%) |
| 30 to 34 Years | 22 (100.0%) | 0 (0.0%) |
| 35 to 44 Years | 143 (93.5%) | 12 (8.4%) |
| 45 to 54 Years | 121 (81.8%) | 0 (0.0%) |
| 55 to 59 Years | 53 (100.0%) | 0 (0.0%) |
| 60 to 64 Years | 89 (83.2%) | 0 (0.0%) |
| 65 to 74 Years | 12 (15.0%) | 0 (0.0%) |
| 75 Years and over | 22 (22.7%) | 0 (0.0%) |
| Total | 480 (68.3%) | 12 (2.5%) |
Employment Status by Educational Attainment in Alleghenyville
According to labor force statistics for Alleghenyville, 89.0% of individuals (446) out of the total population between 25 and 64 years of age (501) are in the labor force, with 2.7% or 12 of them being unemployed. The group with the highest labor force participation rate are those with the educational attainment of less than high school, with 100.0% or 9 individuals in the labor force. Within the labor force, individuals with college / associate degree education have the highest percentage of unemployment, with 5.8% or 12 of them being unemployed.
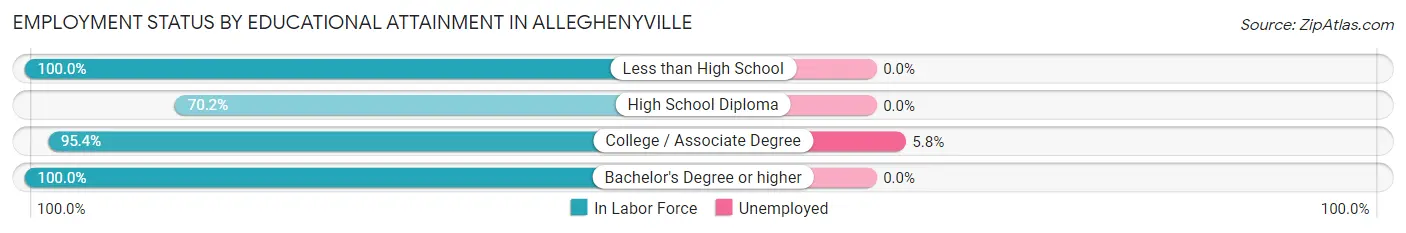
| Educational Attainment | In Labor Force | Unemployed |
| Less than High School | 9 (100.0%) | 0 (0.0%) |
| High School Diploma | 106 (70.2%) | 0 (0.0%) |
| College / Associate Degree | 208 (95.4%) | 13 (5.8%) |
| Bachelor's Degree or higher | 123 (100.0%) | 0 (0.0%) |
| Total | 446 (89.0%) | 14 (2.7%) |
Employment Occupations by Sex in Alleghenyville
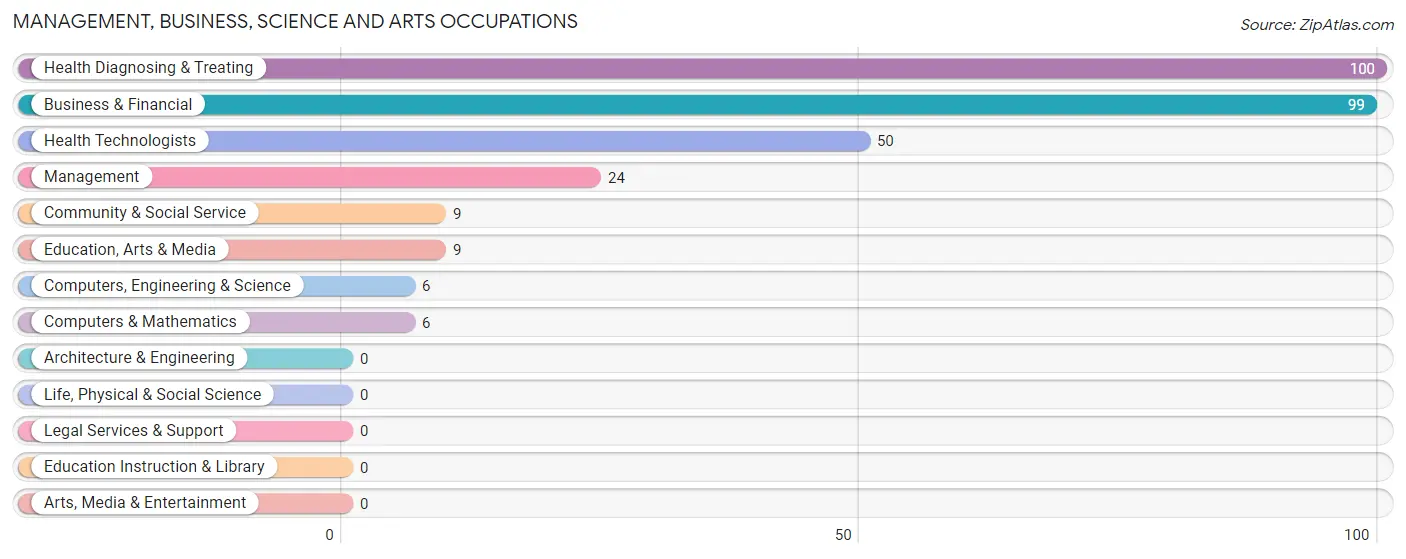
Management, Business, Science and Arts Occupations
The most common Management, Business, Science and Arts occupations in Alleghenyville are Health Diagnosing & Treating (100 | 21.4%), Business & Financial (99 | 21.1%), Health Technologists (50 | 10.7%), Management (24 | 5.1%), and Community & Social Service (9 | 1.9%).
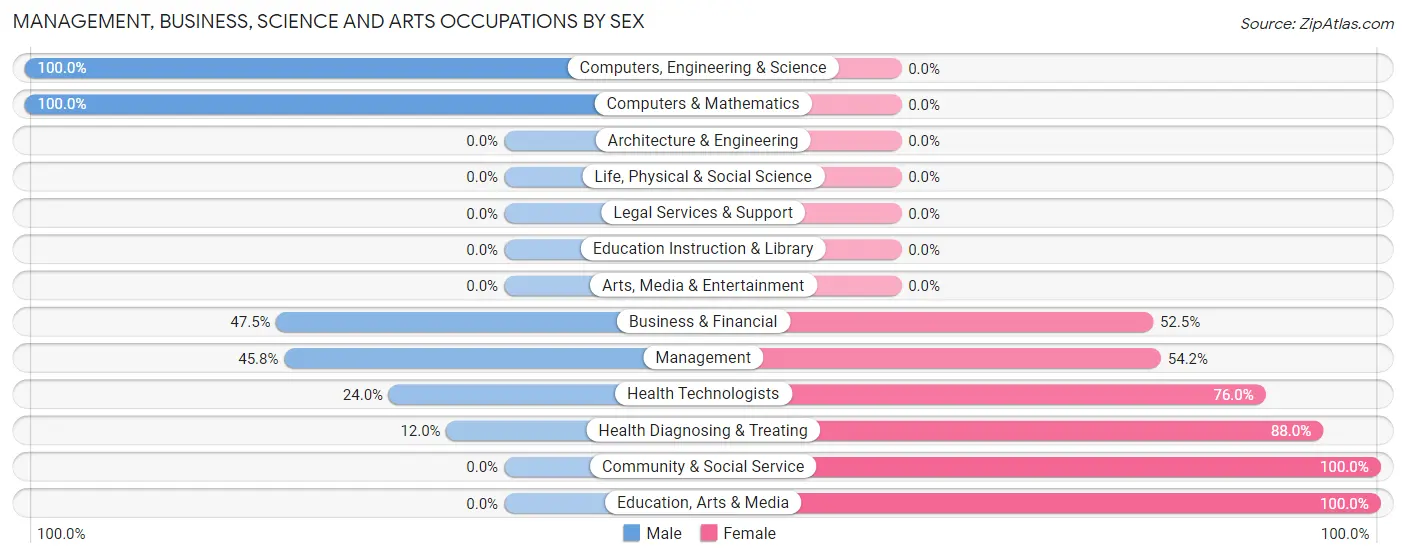
Management, Business, Science and Arts Occupations by Sex
Within the Management, Business, Science and Arts occupations in Alleghenyville, the most male-oriented occupations are Computers, Engineering & Science (100.0%), Computers & Mathematics (100.0%), and Business & Financial (47.5%), while the most female-oriented occupations are Community & Social Service (100.0%), Education, Arts & Media (100.0%), and Health Diagnosing & Treating (88.0%).
| Occupation | Male | Female |
| Management | 11 (45.8%) | 13 (54.2%) |
| Business & Financial | 47 (47.5%) | 52 (52.5%) |
| Computers, Engineering & Science | 6 (100.0%) | 0 (0.0%) |
| Computers & Mathematics | 6 (100.0%) | 0 (0.0%) |
| Architecture & Engineering | 0 (0.0%) | 0 (0.0%) |
| Life, Physical & Social Science | 0 (0.0%) | 0 (0.0%) |
| Community & Social Service | 0 (0.0%) | 9 (100.0%) |
| Education, Arts & Media | 0 (0.0%) | 9 (100.0%) |
| Legal Services & Support | 0 (0.0%) | 0 (0.0%) |
| Education Instruction & Library | 0 (0.0%) | 0 (0.0%) |
| Arts, Media & Entertainment | 0 (0.0%) | 0 (0.0%) |
| Health Diagnosing & Treating | 12 (12.0%) | 88 (88.0%) |
| Health Technologists | 12 (24.0%) | 38 (76.0%) |
| Total (Category) | 76 (31.9%) | 162 (68.1%) |
| Total (Overall) | 247 (52.8%) | 221 (47.2%) |
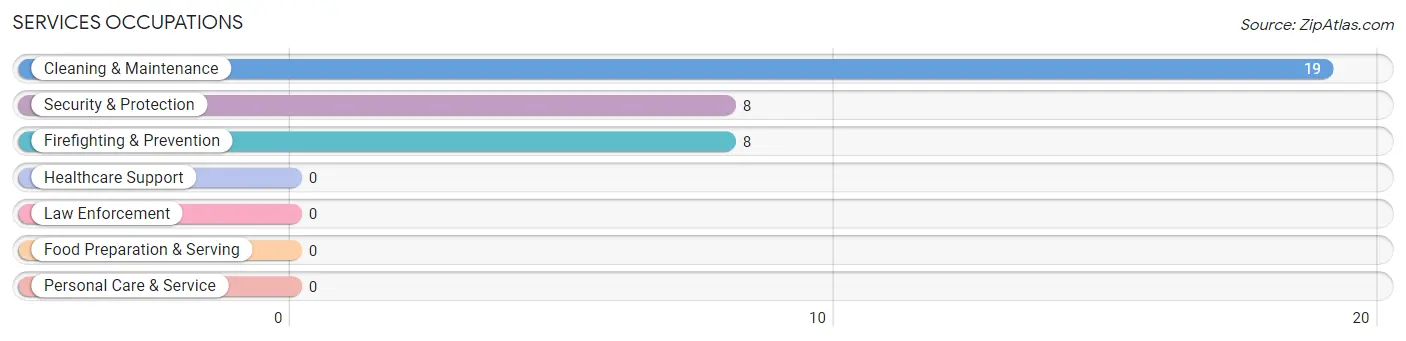
Services Occupations
The most common Services occupations in Alleghenyville are Cleaning & Maintenance (19 | 4.1%), Security & Protection (8 | 1.7%), and Firefighting & Prevention (8 | 1.7%).
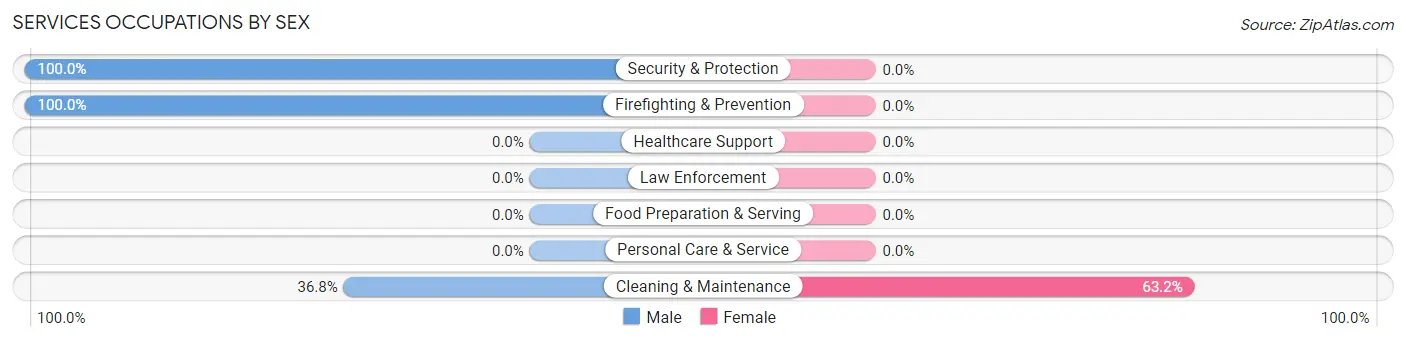
Services Occupations by Sex
| Occupation | Male | Female |
| Healthcare Support | 0 (0.0%) | 0 (0.0%) |
| Security & Protection | 8 (100.0%) | 0 (0.0%) |
| Firefighting & Prevention | 8 (100.0%) | 0 (0.0%) |
| Law Enforcement | 0 (0.0%) | 0 (0.0%) |
| Food Preparation & Serving | 0 (0.0%) | 0 (0.0%) |
| Cleaning & Maintenance | 7 (36.8%) | 12 (63.2%) |
| Personal Care & Service | 0 (0.0%) | 0 (0.0%) |
| Total (Category) | 15 (55.6%) | 12 (44.4%) |
| Total (Overall) | 247 (52.8%) | 221 (47.2%) |
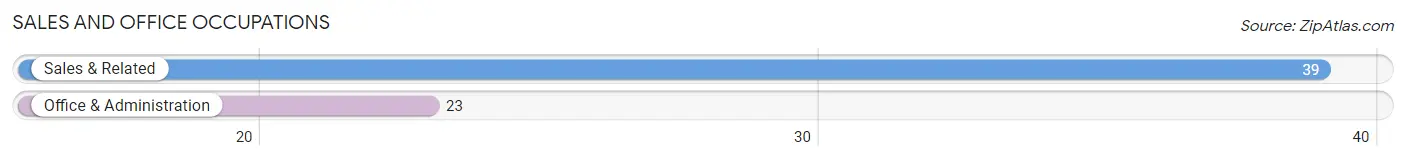
Sales and Office Occupations
The most common Sales and Office occupations in Alleghenyville are Sales & Related (39 | 8.3%), and Office & Administration (23 | 4.9%).
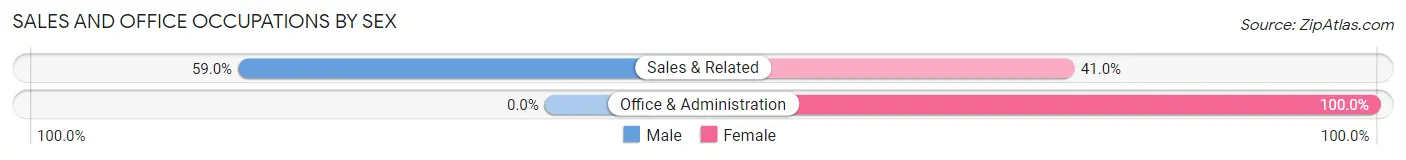
Sales and Office Occupations by Sex
| Occupation | Male | Female |
| Sales & Related | 23 (59.0%) | 16 (41.0%) |
| Office & Administration | 0 (0.0%) | 23 (100.0%) |
| Total (Category) | 23 (37.1%) | 39 (62.9%) |
| Total (Overall) | 247 (52.8%) | 221 (47.2%) |
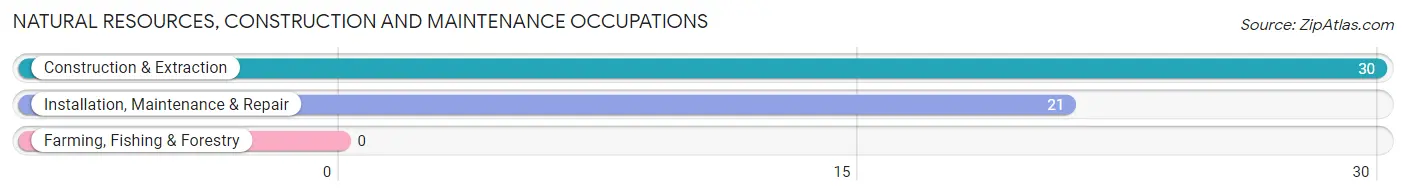
Natural Resources, Construction and Maintenance Occupations
The most common Natural Resources, Construction and Maintenance occupations in Alleghenyville are Construction & Extraction (30 | 6.4%), and Installation, Maintenance & Repair (21 | 4.5%).
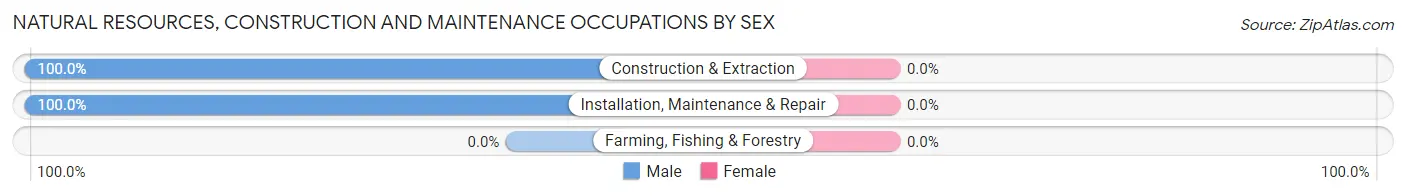
Natural Resources, Construction and Maintenance Occupations by Sex
| Occupation | Male | Female |
| Farming, Fishing & Forestry | 0 (0.0%) | 0 (0.0%) |
| Construction & Extraction | 30 (100.0%) | 0 (0.0%) |
| Installation, Maintenance & Repair | 21 (100.0%) | 0 (0.0%) |
| Total (Category) | 51 (100.0%) | 0 (0.0%) |
| Total (Overall) | 247 (52.8%) | 221 (47.2%) |
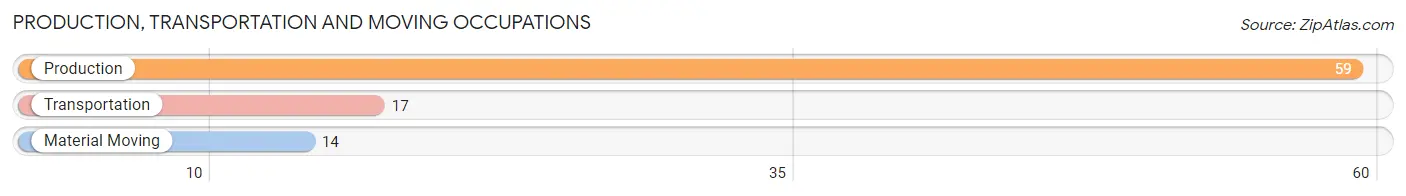
Production, Transportation and Moving Occupations
The most common Production, Transportation and Moving occupations in Alleghenyville are Production (59 | 12.6%), Transportation (17 | 3.6%), and Material Moving (14 | 3.0%).
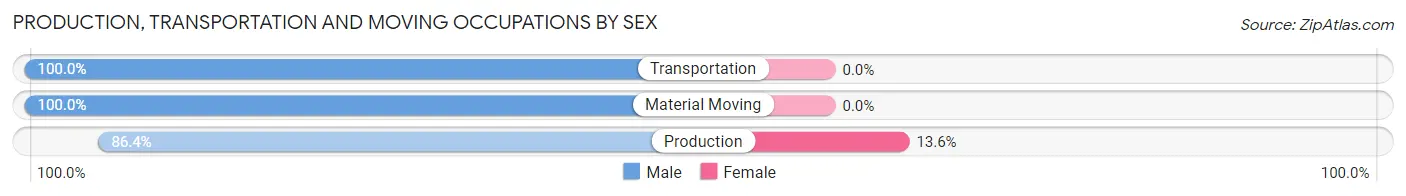
Production, Transportation and Moving Occupations by Sex
| Occupation | Male | Female |
| Production | 51 (86.4%) | 8 (13.6%) |
| Transportation | 17 (100.0%) | 0 (0.0%) |
| Material Moving | 14 (100.0%) | 0 (0.0%) |
| Total (Category) | 82 (91.1%) | 8 (8.9%) |
| Total (Overall) | 247 (52.8%) | 221 (47.2%) |
Employment Industries by Sex in Alleghenyville
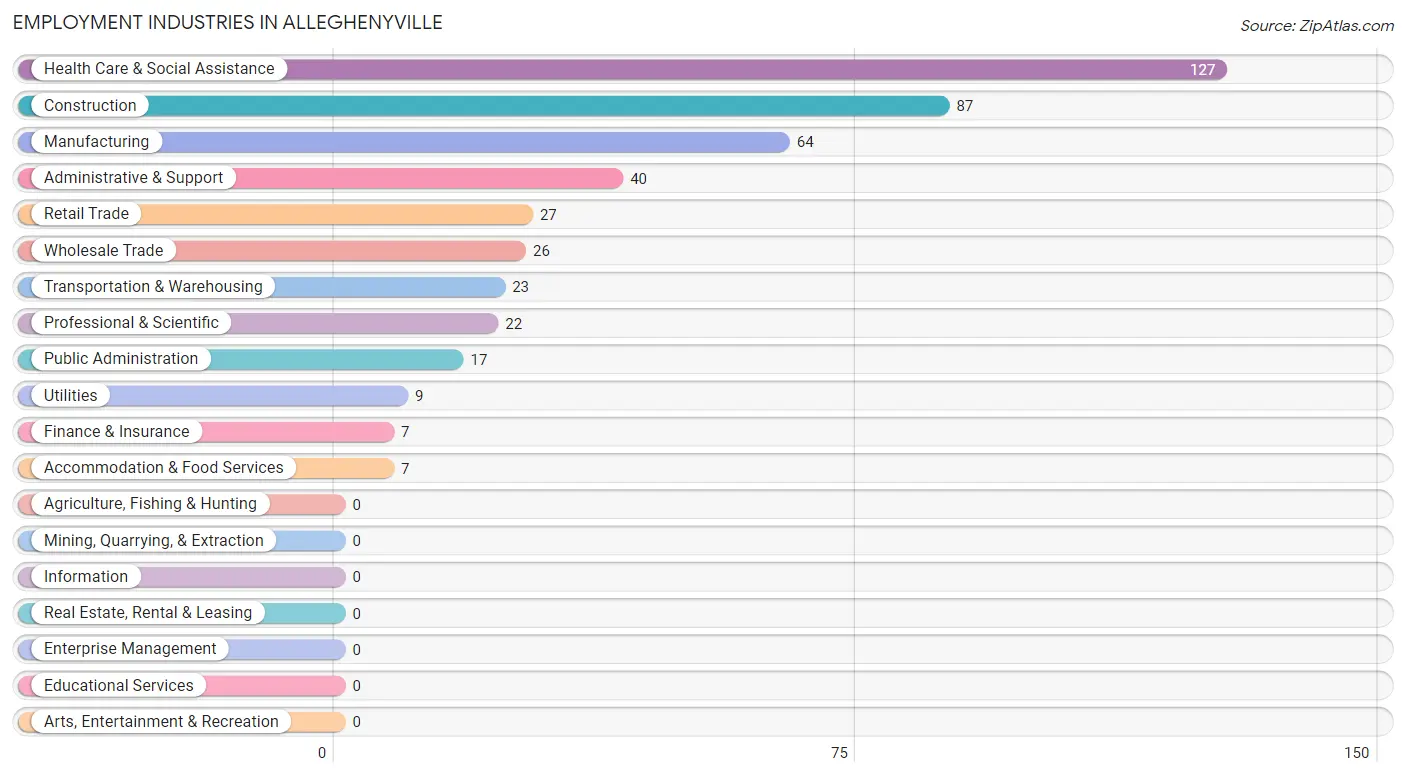
Employment Industries in Alleghenyville
The major employment industries in Alleghenyville include Health Care & Social Assistance (127 | 27.1%), Construction (87 | 18.6%), Manufacturing (64 | 13.7%), Administrative & Support (40 | 8.6%), and Retail Trade (27 | 5.8%).
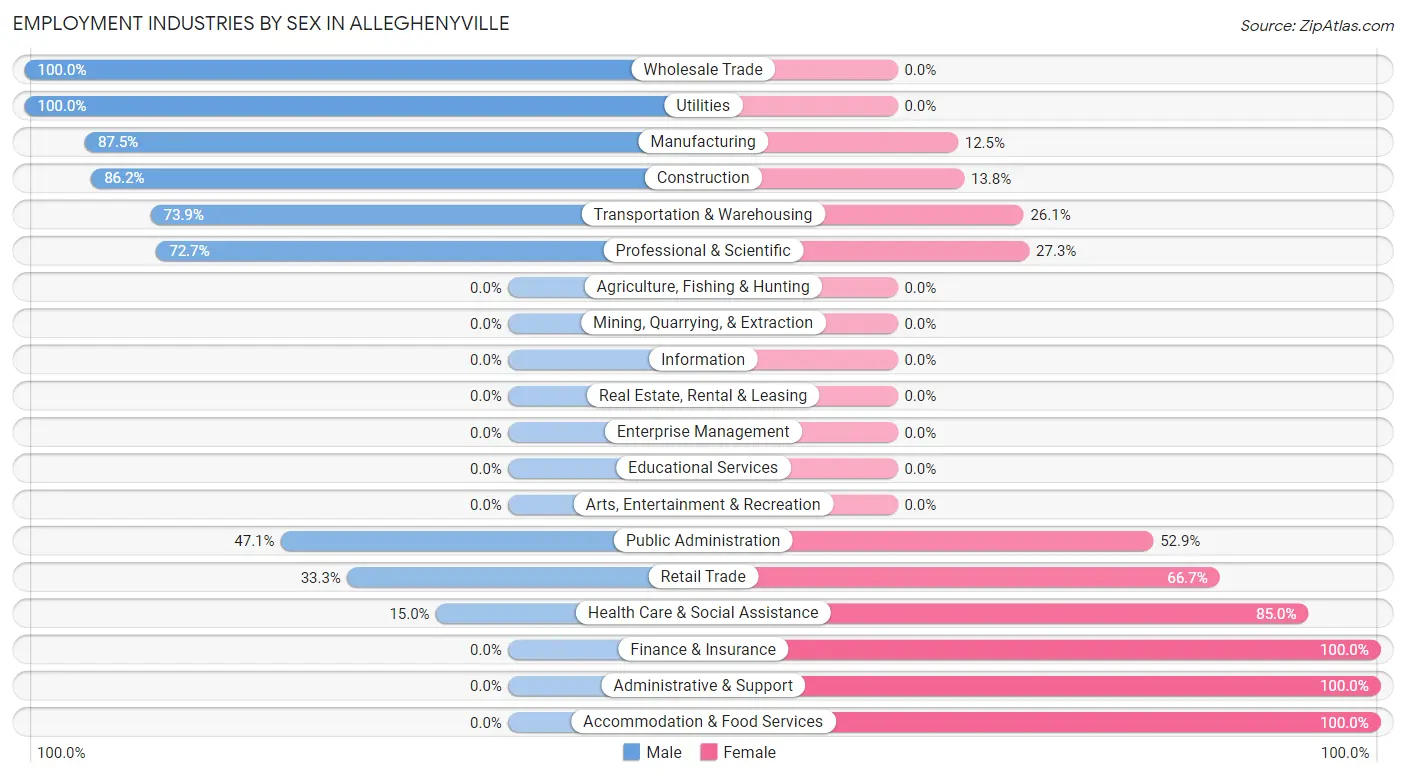
Employment Industries by Sex in Alleghenyville
The Alleghenyville industries that see more men than women are Wholesale Trade (100.0%), Utilities (100.0%), and Manufacturing (87.5%), whereas the industries that tend to have a higher number of women are Finance & Insurance (100.0%), Administrative & Support (100.0%), and Accommodation & Food Services (100.0%).
| Industry | Male | Female |
| Agriculture, Fishing & Hunting | 0 (0.0%) | 0 (0.0%) |
| Mining, Quarrying, & Extraction | 0 (0.0%) | 0 (0.0%) |
| Construction | 75 (86.2%) | 12 (13.8%) |
| Manufacturing | 56 (87.5%) | 8 (12.5%) |
| Wholesale Trade | 26 (100.0%) | 0 (0.0%) |
| Retail Trade | 9 (33.3%) | 18 (66.7%) |
| Transportation & Warehousing | 17 (73.9%) | 6 (26.1%) |
| Utilities | 9 (100.0%) | 0 (0.0%) |
| Information | 0 (0.0%) | 0 (0.0%) |
| Finance & Insurance | 0 (0.0%) | 7 (100.0%) |
| Real Estate, Rental & Leasing | 0 (0.0%) | 0 (0.0%) |
| Professional & Scientific | 16 (72.7%) | 6 (27.3%) |
| Enterprise Management | 0 (0.0%) | 0 (0.0%) |
| Administrative & Support | 0 (0.0%) | 40 (100.0%) |
| Educational Services | 0 (0.0%) | 0 (0.0%) |
| Health Care & Social Assistance | 19 (15.0%) | 108 (85.0%) |
| Arts, Entertainment & Recreation | 0 (0.0%) | 0 (0.0%) |
| Accommodation & Food Services | 0 (0.0%) | 7 (100.0%) |
| Public Administration | 8 (47.1%) | 9 (52.9%) |
| Total | 247 (52.8%) | 221 (47.2%) |
Education in Alleghenyville
School Enrollment in Alleghenyville
The most common levels of schooling among the 113 students in Alleghenyville are high school (39 | 34.5%), college / undergraduate (30 | 26.6%), and elementary school (19 | 16.8%).
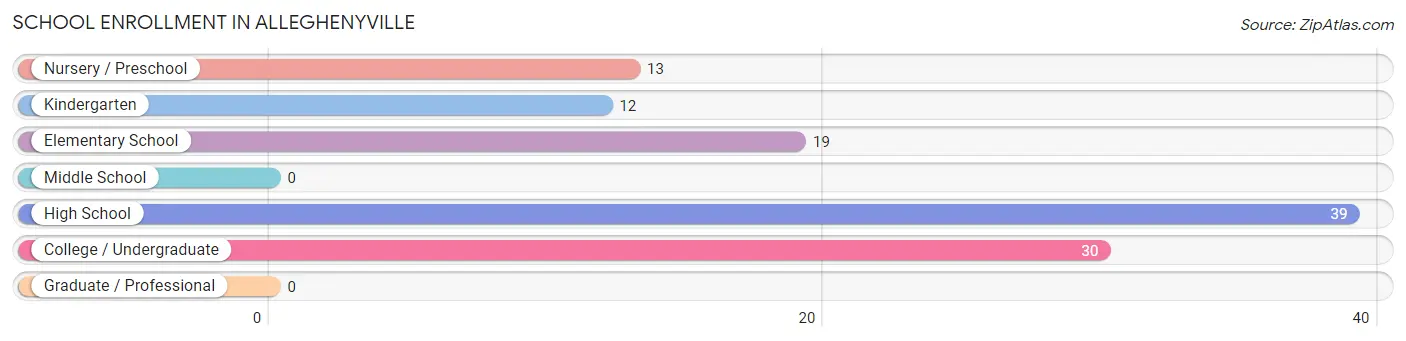
| School Level | # Students | % Students |
| Nursery / Preschool | 13 | 11.5% |
| Kindergarten | 12 | 10.6% |
| Elementary School | 19 | 16.8% |
| Middle School | 0 | 0.0% |
| High School | 39 | 34.5% |
| College / Undergraduate | 30 | 26.6% |
| Graduate / Professional | 0 | 0.0% |
| Total | 113 | 100.0% |
School Enrollment by Age by Funding Source in Alleghenyville
Out of a total of 113 students who are enrolled in schools in Alleghenyville, 33 (29.2%) attend a private institution, while the remaining 80 (70.8%) are enrolled in public schools. The age group of 3 to 4 year olds has the highest likelihood of being enrolled in private schools, with 13 (100.0% in the age bracket) enrolled. Conversely, the age group of 15 to 17 year olds has the lowest likelihood of being enrolled in a private school, with 33 (100.0% in the age bracket) attending a public institution.
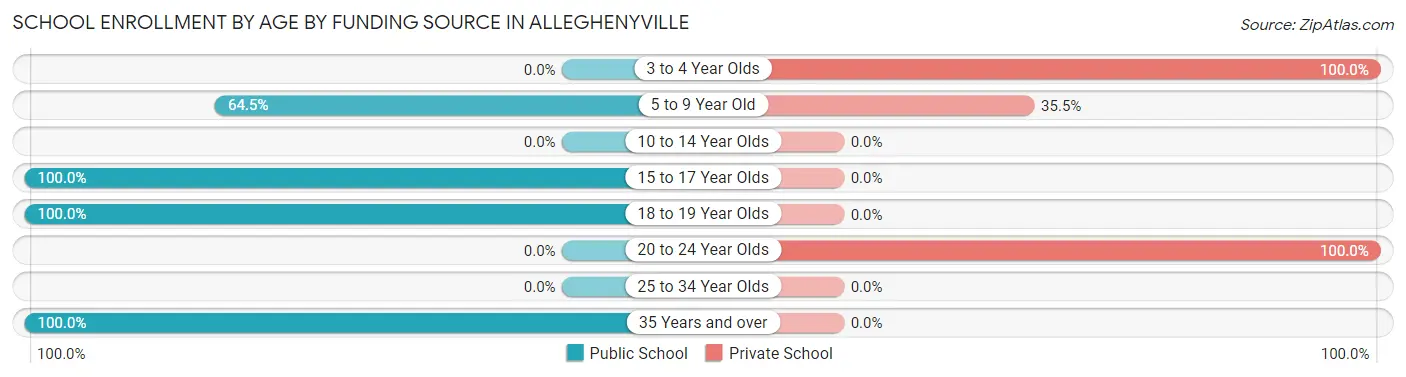
| Age Bracket | Public School | Private School |
| 3 to 4 Year Olds | 0 (0.0%) | 13 (100.0%) |
| 5 to 9 Year Old | 20 (64.5%) | 11 (35.5%) |
| 10 to 14 Year Olds | 0 (0.0%) | 0 (0.0%) |
| 15 to 17 Year Olds | 33 (100.0%) | 0 (0.0%) |
| 18 to 19 Year Olds | 6 (100.0%) | 0 (0.0%) |
| 20 to 24 Year Olds | 0 (0.0%) | 9 (100.0%) |
| 25 to 34 Year Olds | 0 (0.0%) | 0 (0.0%) |
| 35 Years and over | 21 (100.0%) | 0 (0.0%) |
| Total | 80 (70.8%) | 33 (29.2%) |
Educational Attainment by Field of Study in Alleghenyville
Education (63 | 32.1%), literature & languages (37 | 18.9%), business (34 | 17.3%), psychology (19 | 9.7%), and arts & humanities (18 | 9.2%) are the most common fields of study among 196 individuals in Alleghenyville who have obtained a bachelor's degree or higher.
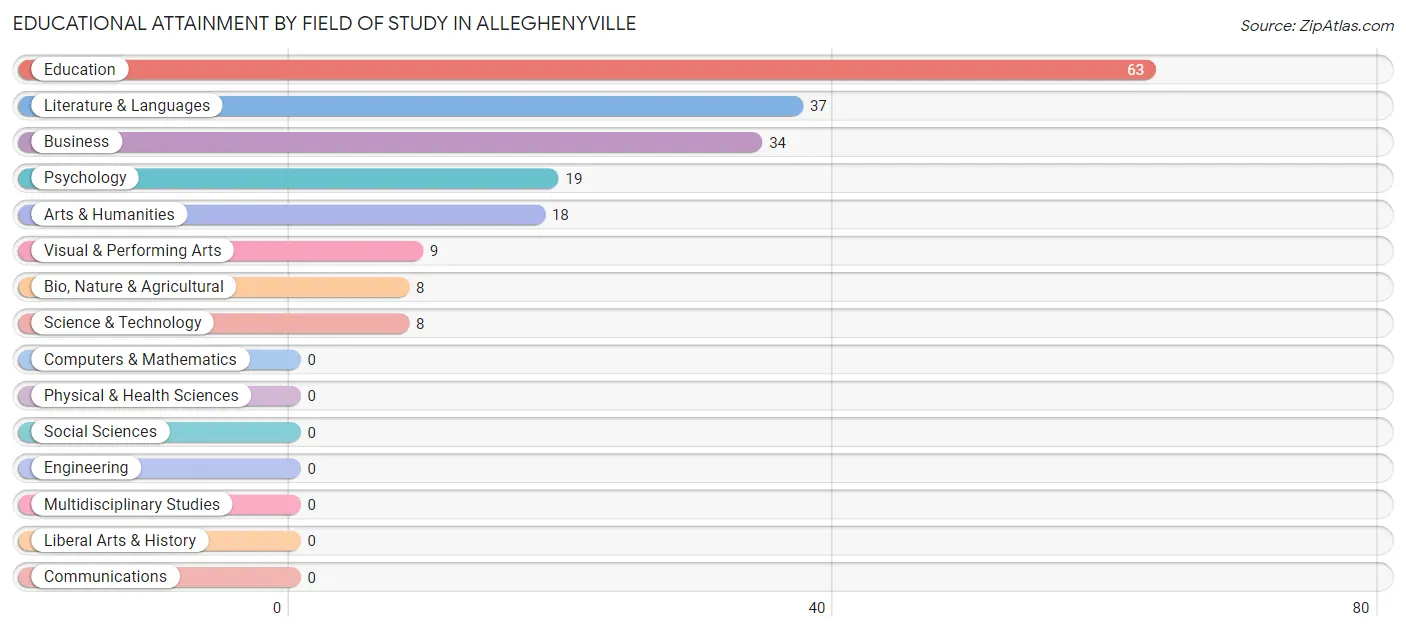
| Field of Study | # Graduates | % Graduates |
| Computers & Mathematics | 0 | 0.0% |
| Bio, Nature & Agricultural | 8 | 4.1% |
| Physical & Health Sciences | 0 | 0.0% |
| Psychology | 19 | 9.7% |
| Social Sciences | 0 | 0.0% |
| Engineering | 0 | 0.0% |
| Multidisciplinary Studies | 0 | 0.0% |
| Science & Technology | 8 | 4.1% |
| Business | 34 | 17.3% |
| Education | 63 | 32.1% |
| Literature & Languages | 37 | 18.9% |
| Liberal Arts & History | 0 | 0.0% |
| Visual & Performing Arts | 9 | 4.6% |
| Communications | 0 | 0.0% |
| Arts & Humanities | 18 | 9.2% |
| Total | 196 | 100.0% |
Transportation & Commute in Alleghenyville
Vehicle Availability by Sex in Alleghenyville
The most prevalent vehicle ownership categories in Alleghenyville are males with 2 vehicles (80, accounting for 32.4%) and females with 2 vehicles (64, making up 36.2%).
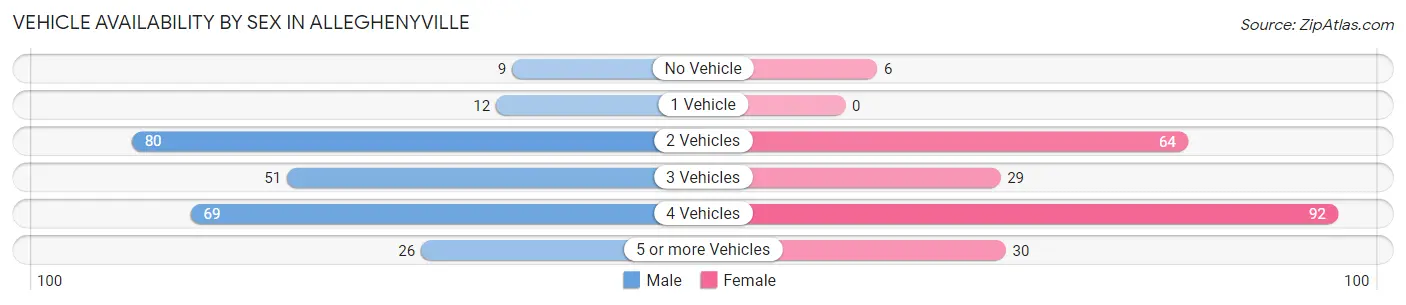
| Vehicles Available | Male | Female |
| No Vehicle | 9 (3.6%) | 6 (2.7%) |
| 1 Vehicle | 12 (4.9%) | 0 (0.0%) |
| 2 Vehicles | 80 (32.4%) | 64 (29.0%) |
| 3 Vehicles | 51 (20.6%) | 29 (13.1%) |
| 4 Vehicles | 69 (27.9%) | 92 (41.6%) |
| 5 or more Vehicles | 26 (10.5%) | 30 (13.6%) |
| Total | 247 (100.0%) | 221 (100.0%) |
Commute Time in Alleghenyville
The most frequently occuring commute durations in Alleghenyville are 10 to 14 minutes (79 commuters, 18.7%), 25 to 29 minutes (78 commuters, 18.5%), and 20 to 24 minutes (60 commuters, 14.2%).
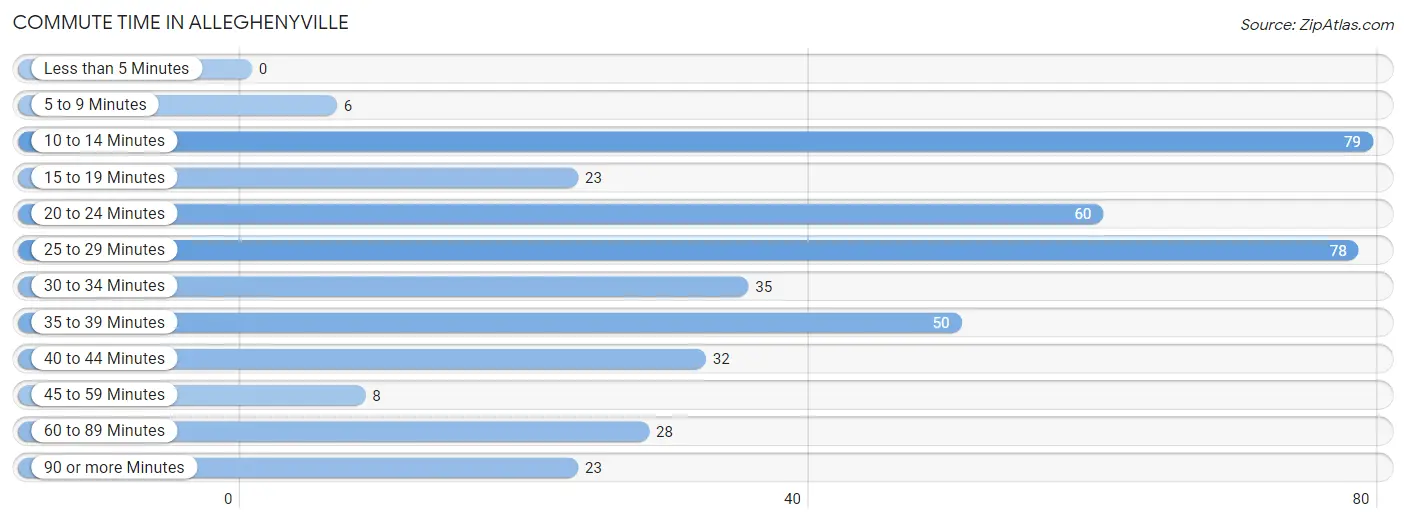
| Commute Time | # Commuters | % Commuters |
| Less than 5 Minutes | 0 | 0.0% |
| 5 to 9 Minutes | 6 | 1.4% |
| 10 to 14 Minutes | 79 | 18.7% |
| 15 to 19 Minutes | 23 | 5.4% |
| 20 to 24 Minutes | 60 | 14.2% |
| 25 to 29 Minutes | 78 | 18.5% |
| 30 to 34 Minutes | 35 | 8.3% |
| 35 to 39 Minutes | 50 | 11.8% |
| 40 to 44 Minutes | 32 | 7.6% |
| 45 to 59 Minutes | 8 | 1.9% |
| 60 to 89 Minutes | 28 | 6.6% |
| 90 or more Minutes | 23 | 5.4% |
Commute Time by Sex in Alleghenyville
The most common commute times in Alleghenyville are 25 to 29 minutes (46 commuters, 20.1%) for males and 10 to 14 minutes (51 commuters, 26.4%) for females.
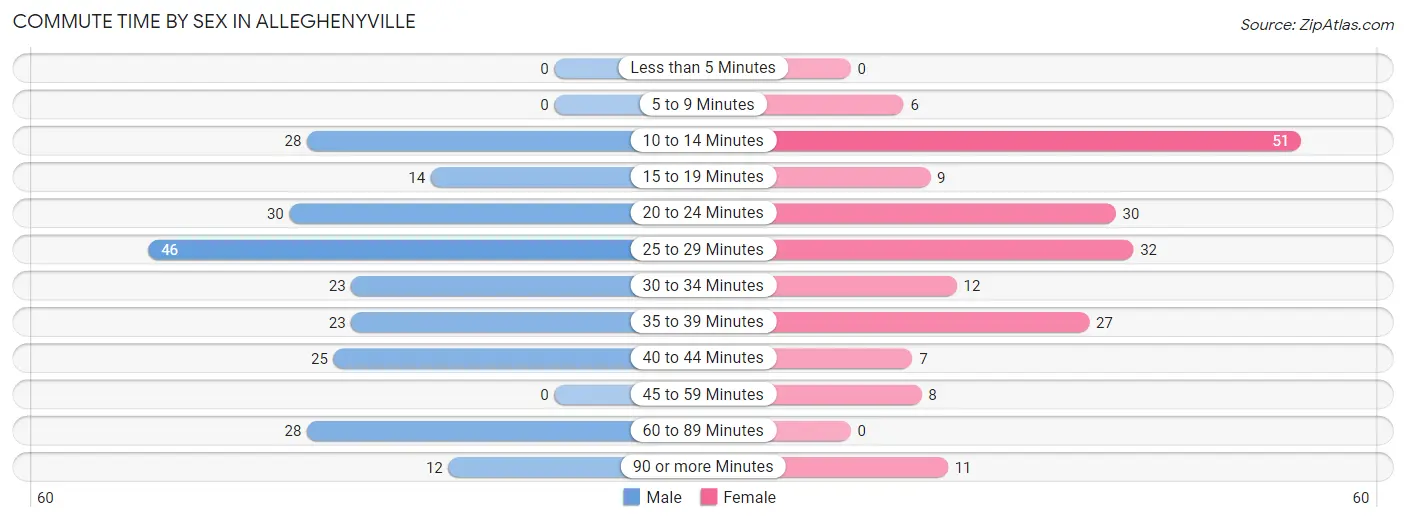
| Commute Time | Male | Female |
| Less than 5 Minutes | 0 (0.0%) | 0 (0.0%) |
| 5 to 9 Minutes | 0 (0.0%) | 6 (3.1%) |
| 10 to 14 Minutes | 28 (12.2%) | 51 (26.4%) |
| 15 to 19 Minutes | 14 (6.1%) | 9 (4.7%) |
| 20 to 24 Minutes | 30 (13.1%) | 30 (15.5%) |
| 25 to 29 Minutes | 46 (20.1%) | 32 (16.6%) |
| 30 to 34 Minutes | 23 (10.0%) | 12 (6.2%) |
| 35 to 39 Minutes | 23 (10.0%) | 27 (14.0%) |
| 40 to 44 Minutes | 25 (10.9%) | 7 (3.6%) |
| 45 to 59 Minutes | 0 (0.0%) | 8 (4.2%) |
| 60 to 89 Minutes | 28 (12.2%) | 0 (0.0%) |
| 90 or more Minutes | 12 (5.2%) | 11 (5.7%) |
Time of Departure to Work by Sex in Alleghenyville
The most frequent times of departure to work in Alleghenyville are 7:00 AM to 7:29 AM (64, 28.0%) for males and 7:30 AM to 7:59 AM (54, 28.0%) for females.
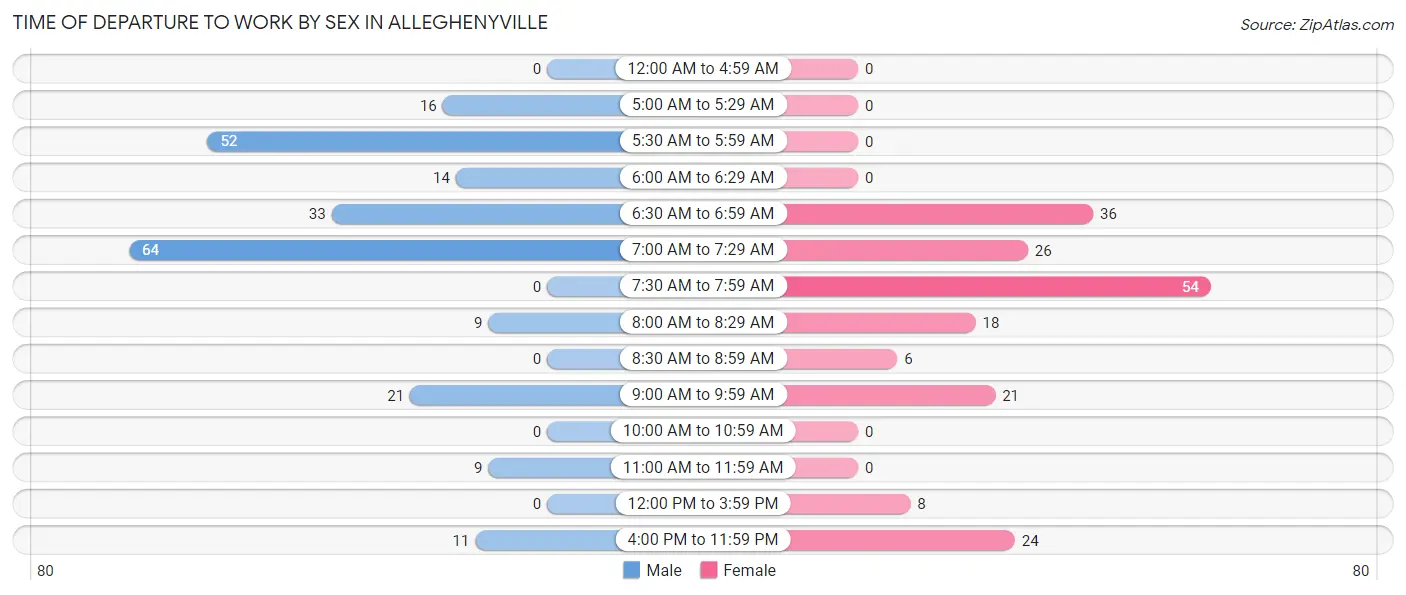
| Time of Departure | Male | Female |
| 12:00 AM to 4:59 AM | 0 (0.0%) | 0 (0.0%) |
| 5:00 AM to 5:29 AM | 16 (7.0%) | 0 (0.0%) |
| 5:30 AM to 5:59 AM | 52 (22.7%) | 0 (0.0%) |
| 6:00 AM to 6:29 AM | 14 (6.1%) | 0 (0.0%) |
| 6:30 AM to 6:59 AM | 33 (14.4%) | 36 (18.6%) |
| 7:00 AM to 7:29 AM | 64 (28.0%) | 26 (13.5%) |
| 7:30 AM to 7:59 AM | 0 (0.0%) | 54 (28.0%) |
| 8:00 AM to 8:29 AM | 9 (3.9%) | 18 (9.3%) |
| 8:30 AM to 8:59 AM | 0 (0.0%) | 6 (3.1%) |
| 9:00 AM to 9:59 AM | 21 (9.2%) | 21 (10.9%) |
| 10:00 AM to 10:59 AM | 0 (0.0%) | 0 (0.0%) |
| 11:00 AM to 11:59 AM | 9 (3.9%) | 0 (0.0%) |
| 12:00 PM to 3:59 PM | 0 (0.0%) | 8 (4.2%) |
| 4:00 PM to 11:59 PM | 11 (4.8%) | 24 (12.4%) |
| Total | 229 (100.0%) | 193 (100.0%) |
Housing Occupancy in Alleghenyville
Occupancy by Ownership in Alleghenyville
Of the total 305 dwellings in Alleghenyville, owner-occupied units account for 293 (96.1%), while renter-occupied units make up 12 (3.9%).
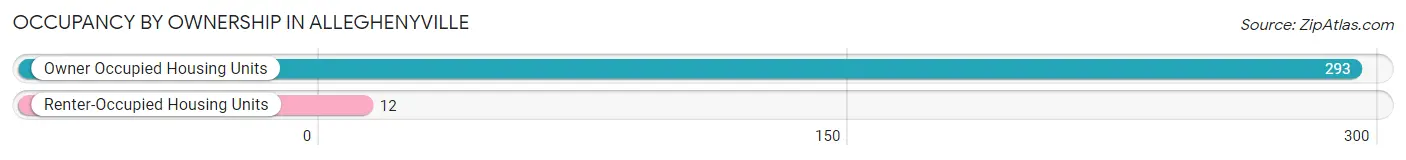
| Occupancy | # Housing Units | % Housing Units |
| Owner Occupied Housing Units | 293 | 96.1% |
| Renter-Occupied Housing Units | 12 | 3.9% |
| Total Occupied Housing Units | 305 | 100.0% |
Occupancy by Household Size in Alleghenyville
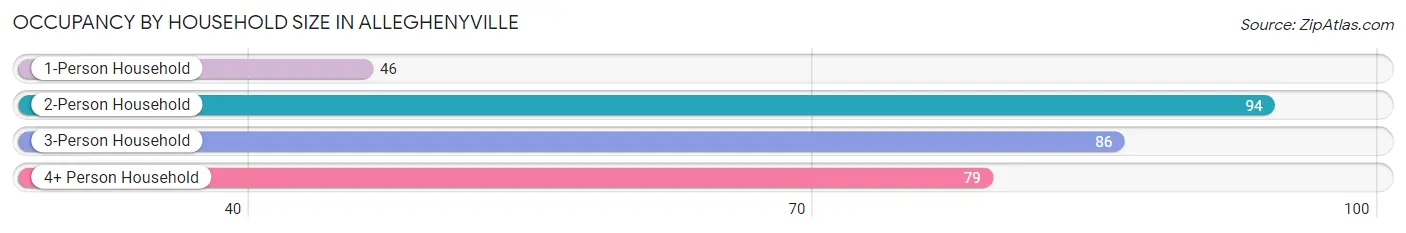
| Household Size | # Housing Units | % Housing Units |
| 1-Person Household | 46 | 15.1% |
| 2-Person Household | 94 | 30.8% |
| 3-Person Household | 86 | 28.2% |
| 4+ Person Household | 79 | 25.9% |
| Total Housing Units | 305 | 100.0% |
Occupancy by Ownership by Household Size in Alleghenyville
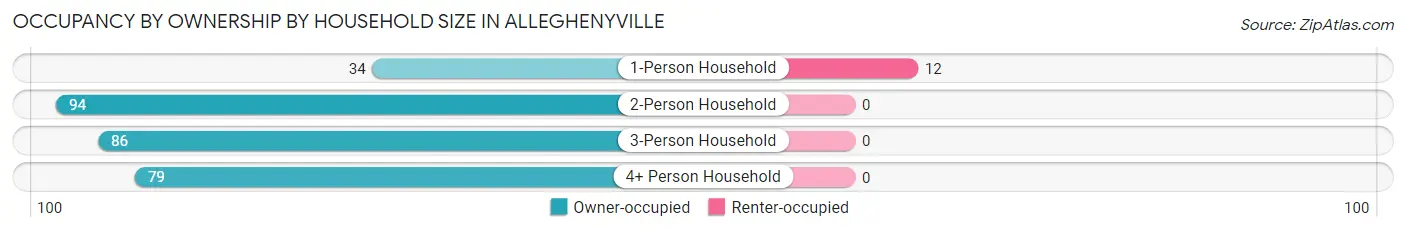
| Household Size | Owner-occupied | Renter-occupied |
| 1-Person Household | 34 (73.9%) | 12 (26.1%) |
| 2-Person Household | 94 (100.0%) | 0 (0.0%) |
| 3-Person Household | 86 (100.0%) | 0 (0.0%) |
| 4+ Person Household | 79 (100.0%) | 0 (0.0%) |
| Total Housing Units | 293 (96.1%) | 12 (3.9%) |
Occupancy by Educational Attainment in Alleghenyville
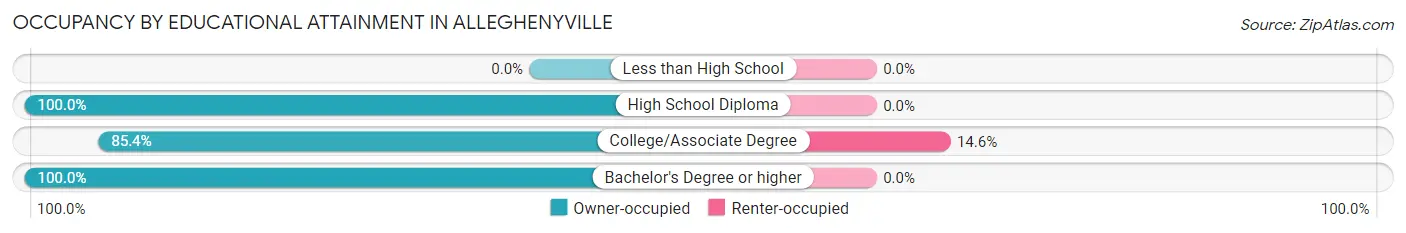
| Household Size | Owner-occupied | Renter-occupied |
| Less than High School | 0 (0.0%) | 0 (0.0%) |
| High School Diploma | 123 (100.0%) | 0 (0.0%) |
| College/Associate Degree | 70 (85.4%) | 12 (14.6%) |
| Bachelor's Degree or higher | 100 (100.0%) | 0 (0.0%) |
Occupancy by Age of Householder in Alleghenyville
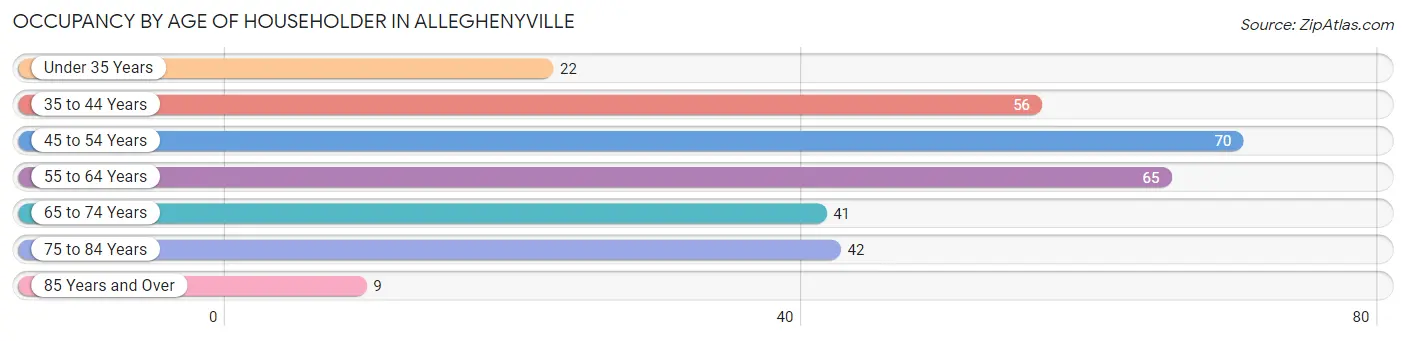
| Age Bracket | # Households | % Households |
| Under 35 Years | 22 | 7.2% |
| 35 to 44 Years | 56 | 18.4% |
| 45 to 54 Years | 70 | 23.0% |
| 55 to 64 Years | 65 | 21.3% |
| 65 to 74 Years | 41 | 13.4% |
| 75 to 84 Years | 42 | 13.8% |
| 85 Years and Over | 9 | 2.9% |
| Total | 305 | 100.0% |
Housing Finances in Alleghenyville
Median Income by Occupancy in Alleghenyville
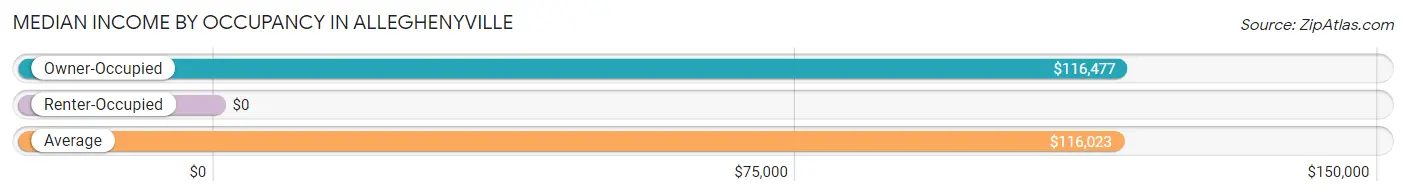
| Occupancy Type | # Households | Median Income |
| Owner-Occupied | 293 (96.1%) | $116,477 |
| Renter-Occupied | 12 (3.9%) | $0 |
| Average | 305 (100.0%) | $116,023 |
Occupancy by Householder Income Bracket in Alleghenyville
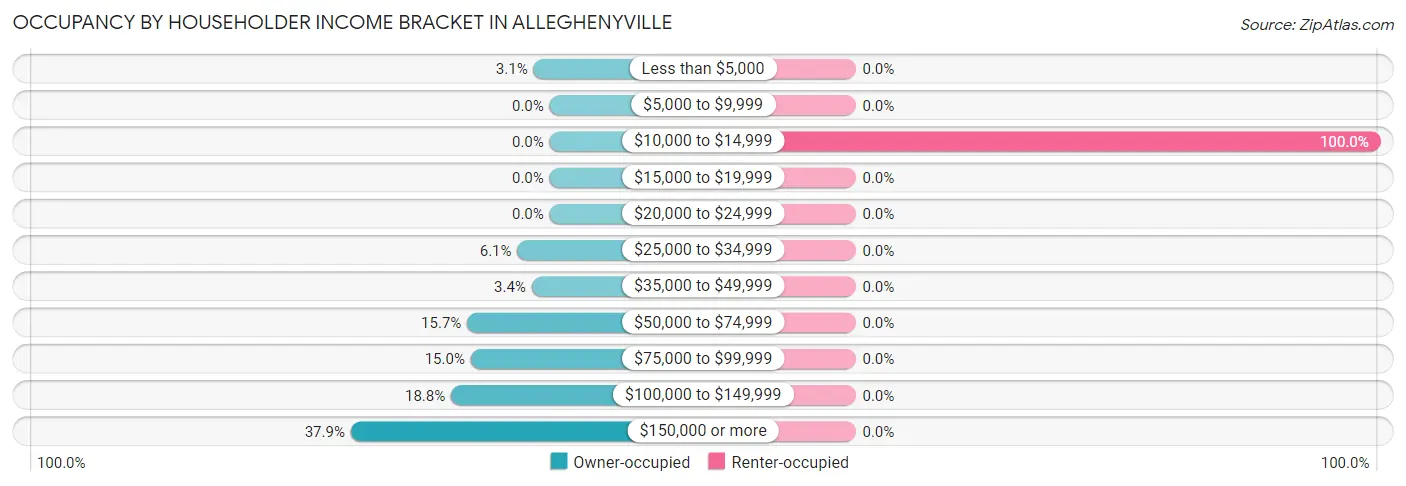
| Income Bracket | Owner-occupied | Renter-occupied |
| Less than $5,000 | 9 (3.1%) | 0 (0.0%) |
| $5,000 to $9,999 | 0 (0.0%) | 0 (0.0%) |
| $10,000 to $14,999 | 0 (0.0%) | 12 (100.0%) |
| $15,000 to $19,999 | 0 (0.0%) | 0 (0.0%) |
| $20,000 to $24,999 | 0 (0.0%) | 0 (0.0%) |
| $25,000 to $34,999 | 18 (6.1%) | 0 (0.0%) |
| $35,000 to $49,999 | 10 (3.4%) | 0 (0.0%) |
| $50,000 to $74,999 | 46 (15.7%) | 0 (0.0%) |
| $75,000 to $99,999 | 44 (15.0%) | 0 (0.0%) |
| $100,000 to $149,999 | 55 (18.8%) | 0 (0.0%) |
| $150,000 or more | 111 (37.9%) | 0 (0.0%) |
| Total | 293 (100.0%) | 12 (100.0%) |
Monthly Housing Cost Tiers in Alleghenyville
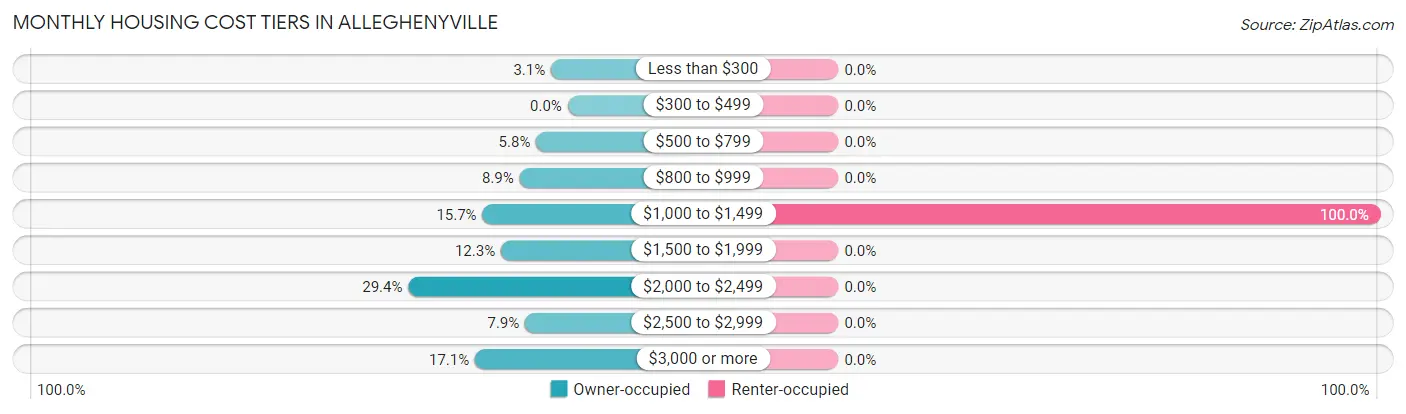
| Monthly Cost | Owner-occupied | Renter-occupied |
| Less than $300 | 9 (3.1%) | 0 (0.0%) |
| $300 to $499 | 0 (0.0%) | 0 (0.0%) |
| $500 to $799 | 17 (5.8%) | 0 (0.0%) |
| $800 to $999 | 26 (8.9%) | 0 (0.0%) |
| $1,000 to $1,499 | 46 (15.7%) | 12 (100.0%) |
| $1,500 to $1,999 | 36 (12.3%) | 0 (0.0%) |
| $2,000 to $2,499 | 86 (29.3%) | 0 (0.0%) |
| $2,500 to $2,999 | 23 (7.9%) | 0 (0.0%) |
| $3,000 or more | 50 (17.1%) | 0 (0.0%) |
| Total | 293 (100.0%) | 12 (100.0%) |
Physical Housing Characteristics in Alleghenyville
Housing Structures in Alleghenyville

| Structure Type | # Housing Units | % Housing Units |
| Single Unit, Detached | 305 | 100.0% |
| Single Unit, Attached | 0 | 0.0% |
| 2 Unit Apartments | 0 | 0.0% |
| 3 or 4 Unit Apartments | 0 | 0.0% |
| 5 to 9 Unit Apartments | 0 | 0.0% |
| 10 or more Apartments | 0 | 0.0% |
| Mobile Home / Other | 0 | 0.0% |
| Total | 305 | 100.0% |
Housing Structures by Occupancy in Alleghenyville
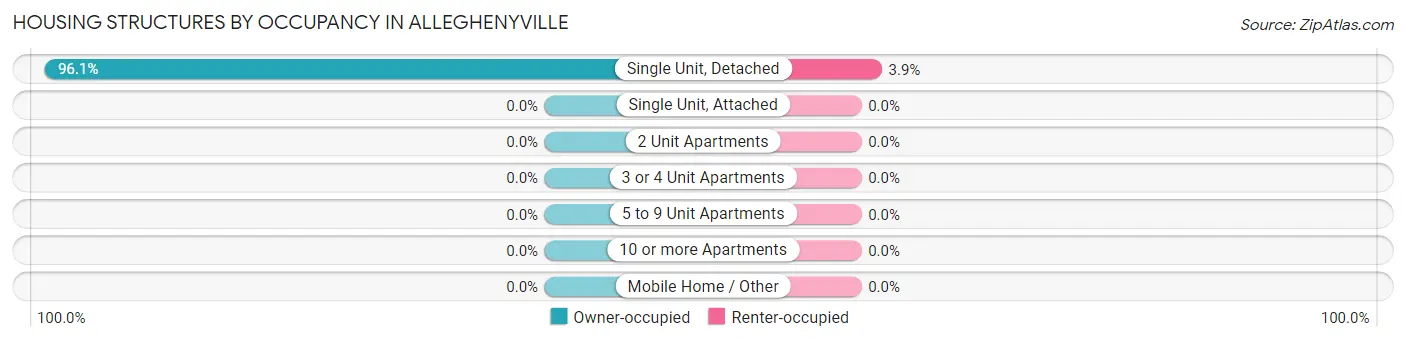
| Structure Type | Owner-occupied | Renter-occupied |
| Single Unit, Detached | 293 (96.1%) | 12 (3.9%) |
| Single Unit, Attached | 0 (0.0%) | 0 (0.0%) |
| 2 Unit Apartments | 0 (0.0%) | 0 (0.0%) |
| 3 or 4 Unit Apartments | 0 (0.0%) | 0 (0.0%) |
| 5 to 9 Unit Apartments | 0 (0.0%) | 0 (0.0%) |
| 10 or more Apartments | 0 (0.0%) | 0 (0.0%) |
| Mobile Home / Other | 0 (0.0%) | 0 (0.0%) |
| Total | 293 (96.1%) | 12 (3.9%) |
Housing Structures by Number of Rooms in Alleghenyville
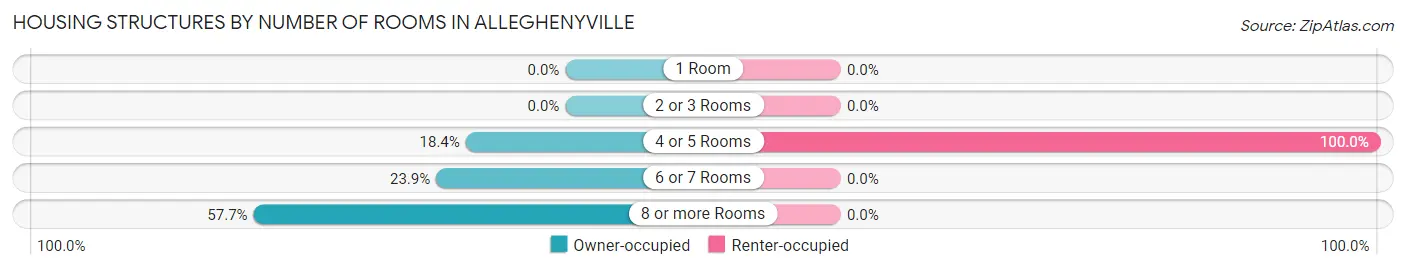
| Number of Rooms | Owner-occupied | Renter-occupied |
| 1 Room | 0 (0.0%) | 0 (0.0%) |
| 2 or 3 Rooms | 0 (0.0%) | 0 (0.0%) |
| 4 or 5 Rooms | 54 (18.4%) | 12 (100.0%) |
| 6 or 7 Rooms | 70 (23.9%) | 0 (0.0%) |
| 8 or more Rooms | 169 (57.7%) | 0 (0.0%) |
| Total | 293 (100.0%) | 12 (100.0%) |
Housing Structure by Heating Type in Alleghenyville
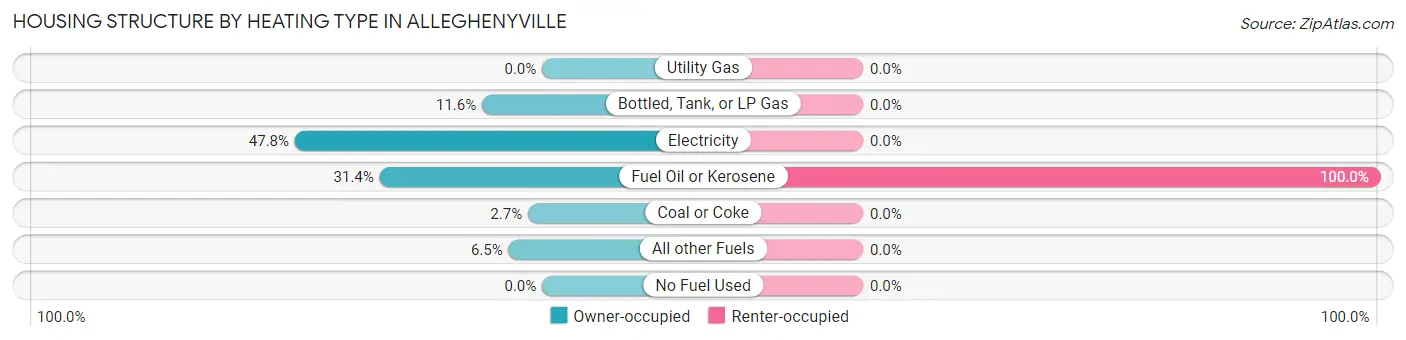
| Heating Type | Owner-occupied | Renter-occupied |
| Utility Gas | 0 (0.0%) | 0 (0.0%) |
| Bottled, Tank, or LP Gas | 34 (11.6%) | 0 (0.0%) |
| Electricity | 140 (47.8%) | 0 (0.0%) |
| Fuel Oil or Kerosene | 92 (31.4%) | 12 (100.0%) |
| Coal or Coke | 8 (2.7%) | 0 (0.0%) |
| All other Fuels | 19 (6.5%) | 0 (0.0%) |
| No Fuel Used | 0 (0.0%) | 0 (0.0%) |
| Total | 293 (100.0%) | 12 (100.0%) |
Household Vehicle Usage in Alleghenyville
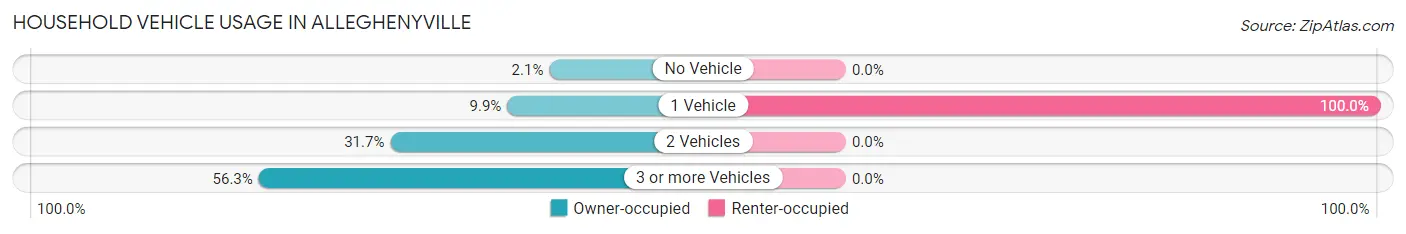
| Vehicles per Household | Owner-occupied | Renter-occupied |
| No Vehicle | 6 (2.1%) | 0 (0.0%) |
| 1 Vehicle | 29 (9.9%) | 12 (100.0%) |
| 2 Vehicles | 93 (31.7%) | 0 (0.0%) |
| 3 or more Vehicles | 165 (56.3%) | 0 (0.0%) |
| Total | 293 (100.0%) | 12 (100.0%) |
Real Estate & Mortgages in Alleghenyville
Real Estate and Mortgage Overview in Alleghenyville
| Characteristic | Without Mortgage | With Mortgage |
| Housing Units | 83 | 210 |
| Median Property Value | $359,600 | $335,400 |
| Median Household Income | $205,150 | $68 |
| Monthly Housing Costs | $860 | $50 |
| Real Estate Taxes | $7,708 | $0 |
Property Value by Mortgage Status in Alleghenyville
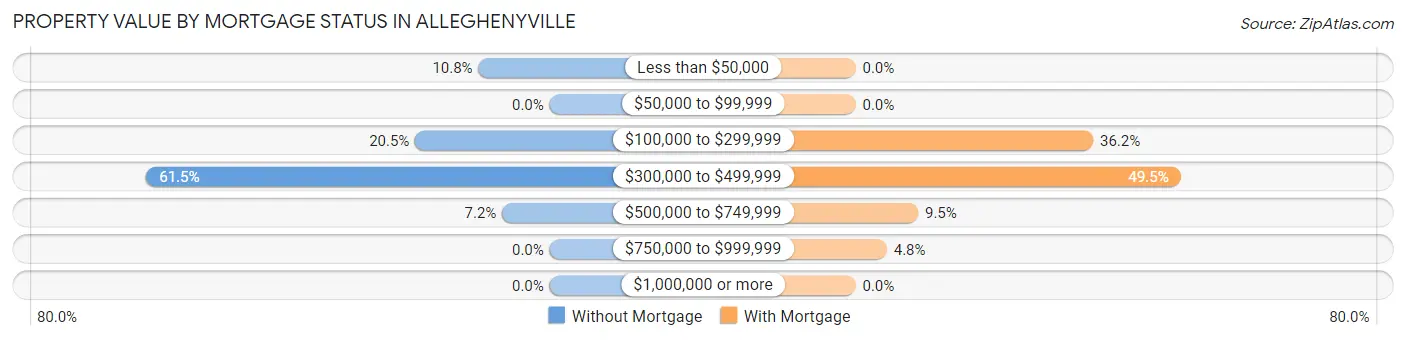
| Property Value | Without Mortgage | With Mortgage |
| Less than $50,000 | 9 (10.8%) | 0 (0.0%) |
| $50,000 to $99,999 | 0 (0.0%) | 0 (0.0%) |
| $100,000 to $299,999 | 17 (20.5%) | 76 (36.2%) |
| $300,000 to $499,999 | 51 (61.5%) | 104 (49.5%) |
| $500,000 to $749,999 | 6 (7.2%) | 20 (9.5%) |
| $750,000 to $999,999 | 0 (0.0%) | 10 (4.8%) |
| $1,000,000 or more | 0 (0.0%) | 0 (0.0%) |
| Total | 83 (100.0%) | 210 (100.0%) |
Household Income by Mortgage Status in Alleghenyville
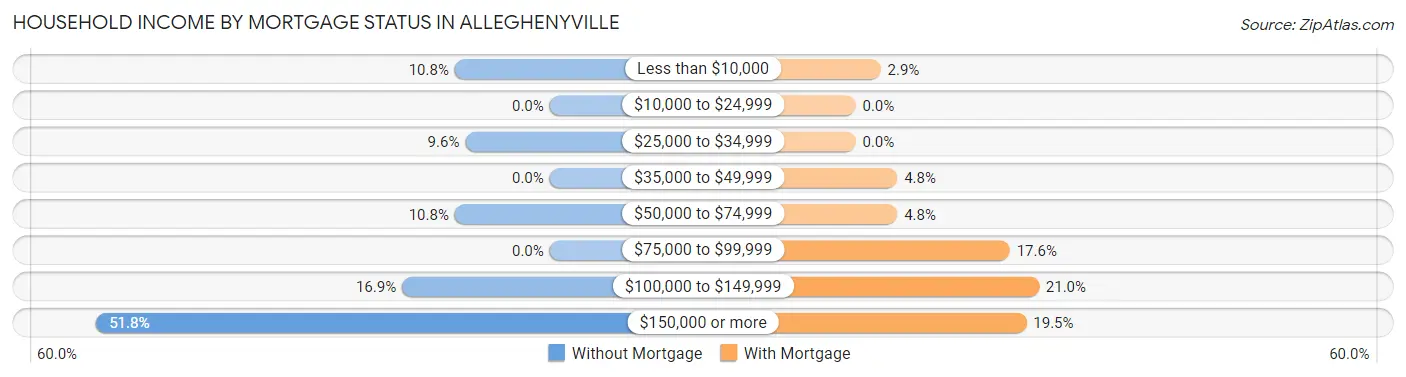
| Household Income | Without Mortgage | With Mortgage |
| Less than $10,000 | 9 (10.8%) | 6 (2.9%) |
| $10,000 to $24,999 | 0 (0.0%) | 0 (0.0%) |
| $25,000 to $34,999 | 8 (9.6%) | 0 (0.0%) |
| $35,000 to $49,999 | 0 (0.0%) | 10 (4.8%) |
| $50,000 to $74,999 | 9 (10.8%) | 10 (4.8%) |
| $75,000 to $99,999 | 0 (0.0%) | 37 (17.6%) |
| $100,000 to $149,999 | 14 (16.9%) | 44 (20.9%) |
| $150,000 or more | 43 (51.8%) | 41 (19.5%) |
| Total | 83 (100.0%) | 210 (100.0%) |
Property Value to Household Income Ratio in Alleghenyville
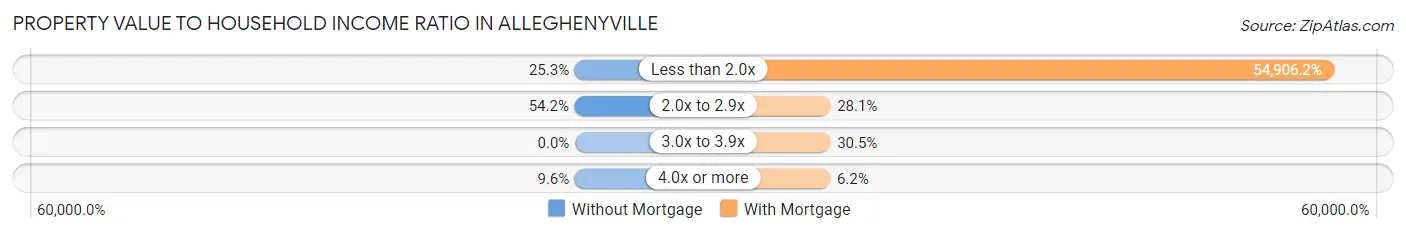
| Value-to-Income Ratio | Without Mortgage | With Mortgage |
| Less than 2.0x | 21 (25.3%) | 115,303 (54,906.2%) |
| 2.0x to 2.9x | 45 (54.2%) | 59 (28.1%) |
| 3.0x to 3.9x | 0 (0.0%) | 64 (30.5%) |
| 4.0x or more | 8 (9.6%) | 13 (6.2%) |
| Total | 83 (100.0%) | 210 (100.0%) |
Real Estate Taxes by Mortgage Status in Alleghenyville
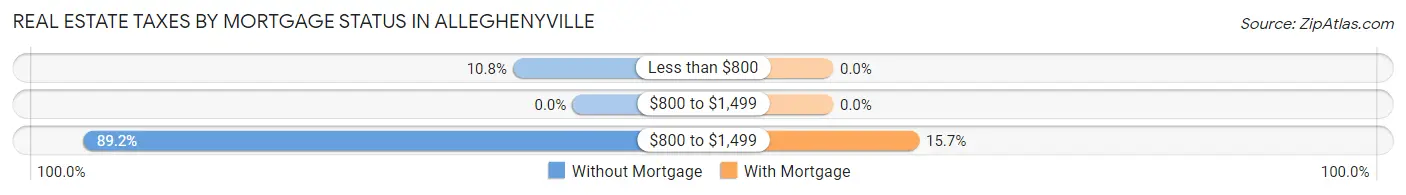
| Property Taxes | Without Mortgage | With Mortgage |
| Less than $800 | 9 (10.8%) | 0 (0.0%) |
| $800 to $1,499 | 0 (0.0%) | 0 (0.0%) |
| $800 to $1,499 | 74 (89.2%) | 33 (15.7%) |
| Total | 83 (100.0%) | 210 (100.0%) |
Health & Disability in Alleghenyville
Health Insurance Coverage by Age in Alleghenyville
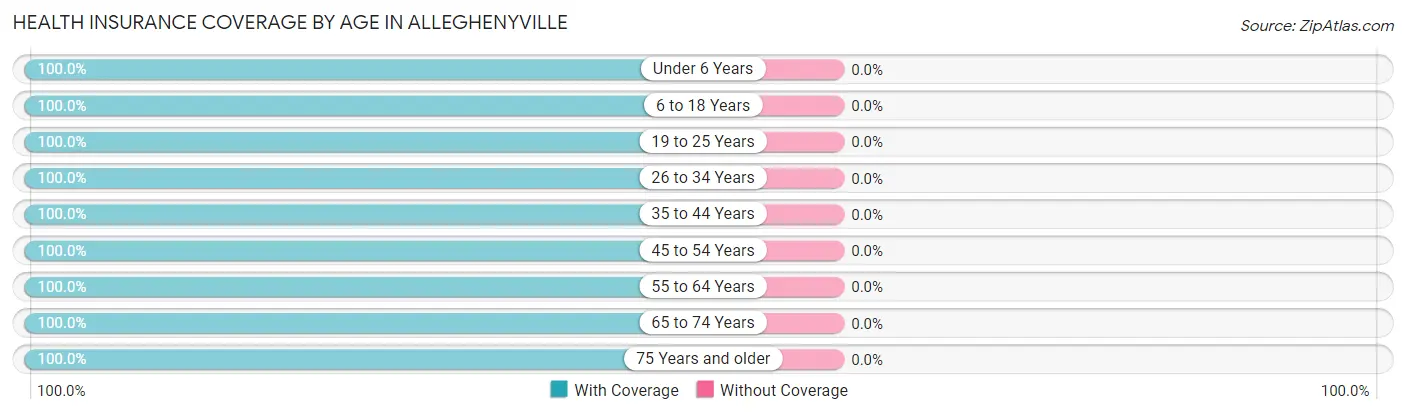
| Age Bracket | With Coverage | Without Coverage |
| Under 6 Years | 94 (100.0%) | 0 (0.0%) |
| 6 to 18 Years | 58 (100.0%) | 0 (0.0%) |
| 19 to 25 Years | 28 (100.0%) | 0 (0.0%) |
| 26 to 34 Years | 31 (100.0%) | 0 (0.0%) |
| 35 to 44 Years | 153 (100.0%) | 0 (0.0%) |
| 45 to 54 Years | 148 (100.0%) | 0 (0.0%) |
| 55 to 64 Years | 160 (100.0%) | 0 (0.0%) |
| 65 to 74 Years | 80 (100.0%) | 0 (0.0%) |
| 75 Years and older | 97 (100.0%) | 0 (0.0%) |
| Total | 849 (100.0%) | 0 (0.0%) |
Health Insurance Coverage by Citizenship Status in Alleghenyville
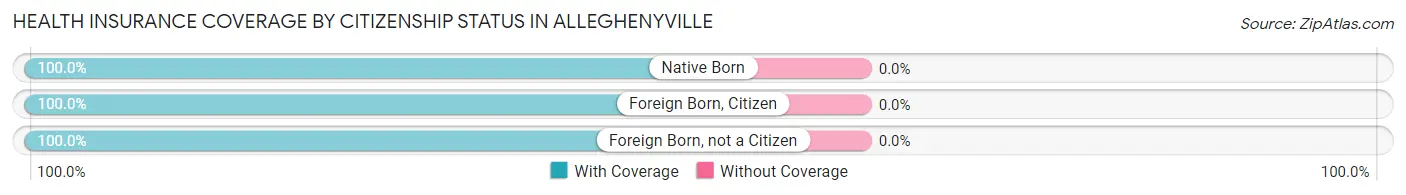
| Citizenship Status | With Coverage | Without Coverage |
| Native Born | 94 (100.0%) | 0 (0.0%) |
| Foreign Born, Citizen | 58 (100.0%) | 0 (0.0%) |
| Foreign Born, not a Citizen | 28 (100.0%) | 0 (0.0%) |
Health Insurance Coverage by Household Income in Alleghenyville
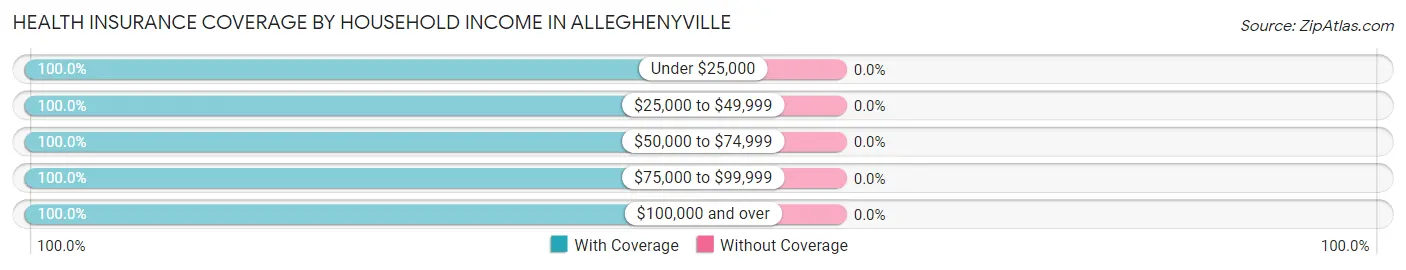
| Household Income | With Coverage | Without Coverage |
| Under $25,000 | 30 (100.0%) | 0 (0.0%) |
| $25,000 to $49,999 | 55 (100.0%) | 0 (0.0%) |
| $50,000 to $74,999 | 128 (100.0%) | 0 (0.0%) |
| $75,000 to $99,999 | 112 (100.0%) | 0 (0.0%) |
| $100,000 and over | 524 (100.0%) | 0 (0.0%) |
Public vs Private Health Insurance Coverage by Age in Alleghenyville
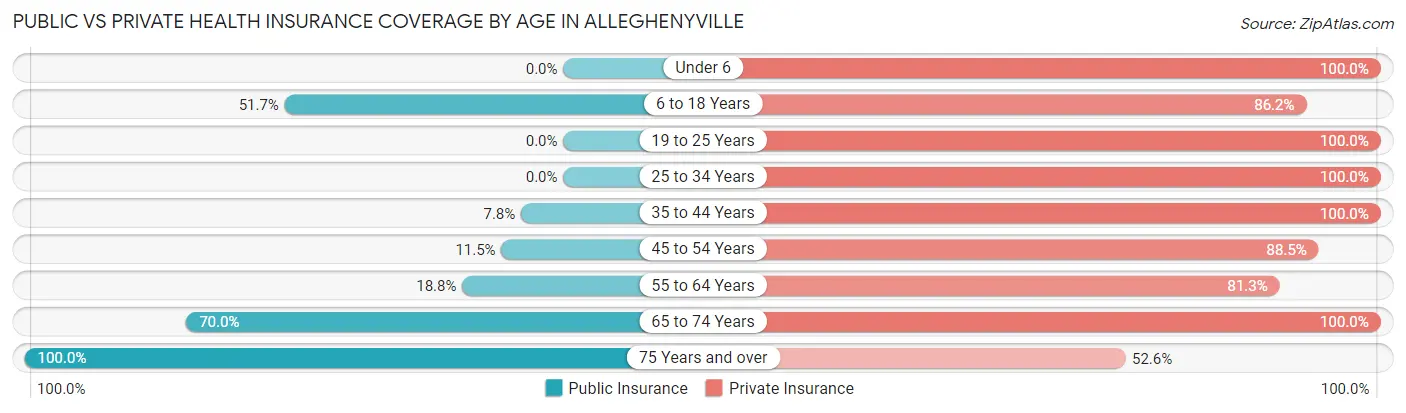
| Age Bracket | Public Insurance | Private Insurance |
| Under 6 | 0 (0.0%) | 94 (100.0%) |
| 6 to 18 Years | 30 (51.7%) | 50 (86.2%) |
| 19 to 25 Years | 0 (0.0%) | 28 (100.0%) |
| 25 to 34 Years | 0 (0.0%) | 31 (100.0%) |
| 35 to 44 Years | 12 (7.8%) | 153 (100.0%) |
| 45 to 54 Years | 17 (11.5%) | 131 (88.5%) |
| 55 to 64 Years | 30 (18.8%) | 130 (81.2%) |
| 65 to 74 Years | 56 (70.0%) | 80 (100.0%) |
| 75 Years and over | 97 (100.0%) | 51 (52.6%) |
| Total | 242 (28.5%) | 748 (88.1%) |
Disability Status by Sex by Age in Alleghenyville
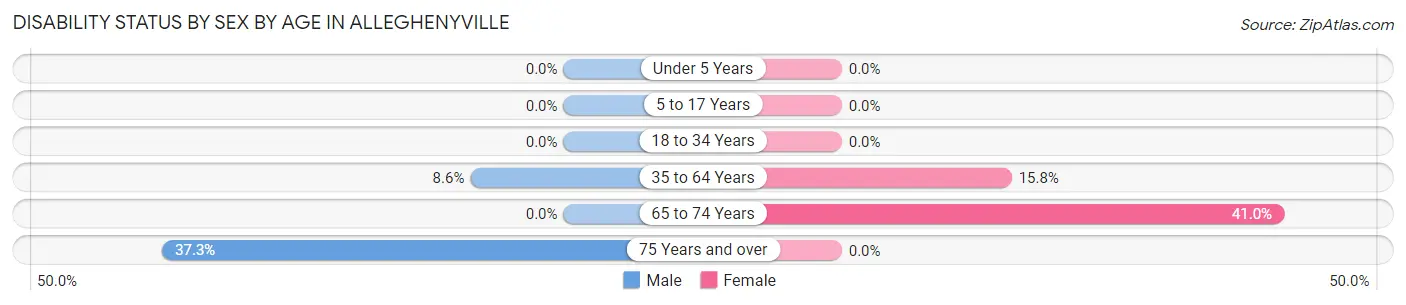
| Age Bracket | Male | Female |
| Under 5 Years | 0 (0.0%) | 0 (0.0%) |
| 5 to 17 Years | 0 (0.0%) | 0 (0.0%) |
| 18 to 34 Years | 0 (0.0%) | 0 (0.0%) |
| 35 to 64 Years | 19 (8.6%) | 38 (15.8%) |
| 65 to 74 Years | 0 (0.0%) | 16 (41.0%) |
| 75 Years and over | 19 (37.2%) | 0 (0.0%) |
Disability Class by Sex by Age in Alleghenyville
Disability Class: Hearing Difficulty
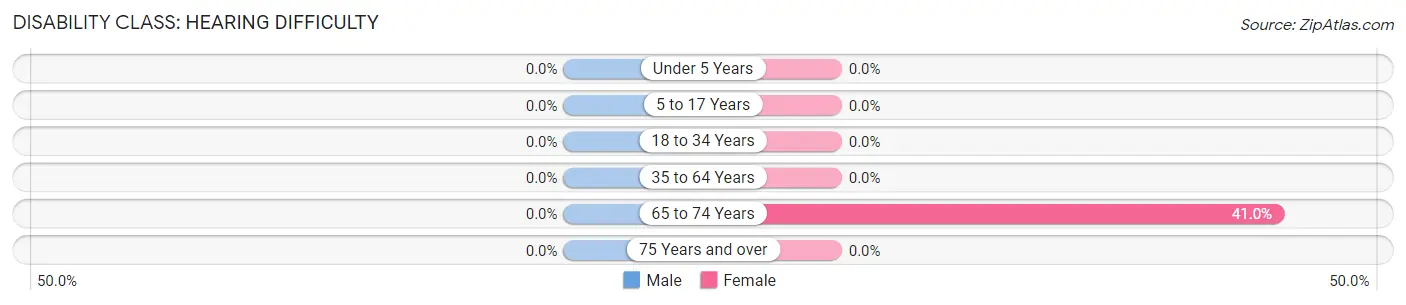
| Age Bracket | Male | Female |
| Under 5 Years | 0 (0.0%) | 0 (0.0%) |
| 5 to 17 Years | 0 (0.0%) | 0 (0.0%) |
| 18 to 34 Years | 0 (0.0%) | 0 (0.0%) |
| 35 to 64 Years | 0 (0.0%) | 0 (0.0%) |
| 65 to 74 Years | 0 (0.0%) | 16 (41.0%) |
| 75 Years and over | 0 (0.0%) | 0 (0.0%) |
Disability Class: Vision Difficulty
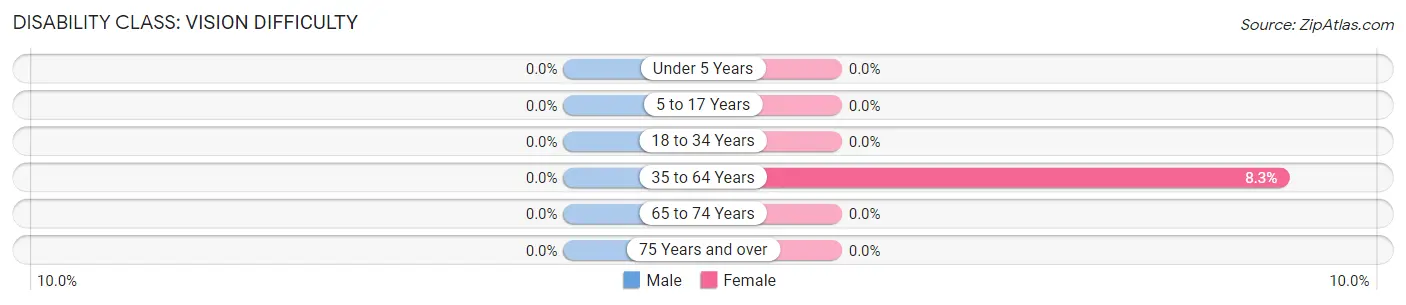
| Age Bracket | Male | Female |
| Under 5 Years | 0 (0.0%) | 0 (0.0%) |
| 5 to 17 Years | 0 (0.0%) | 0 (0.0%) |
| 18 to 34 Years | 0 (0.0%) | 0 (0.0%) |
| 35 to 64 Years | 0 (0.0%) | 20 (8.3%) |
| 65 to 74 Years | 0 (0.0%) | 0 (0.0%) |
| 75 Years and over | 0 (0.0%) | 0 (0.0%) |
Disability Class: Cognitive Difficulty
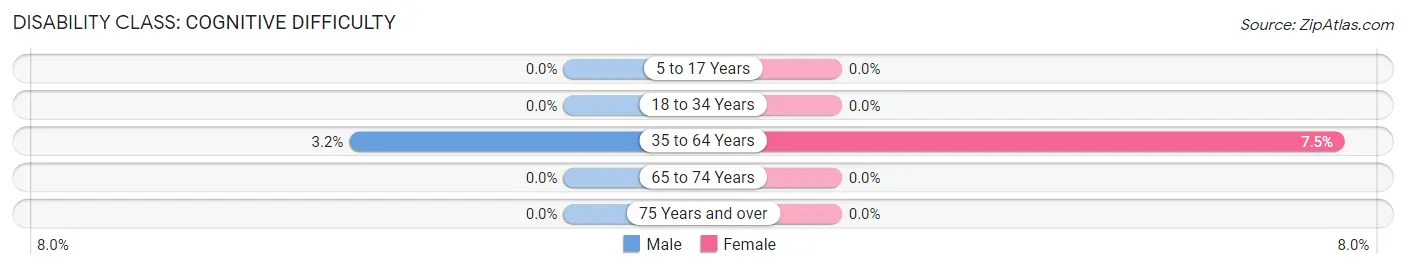
| Age Bracket | Male | Female |
| 5 to 17 Years | 0 (0.0%) | 0 (0.0%) |
| 18 to 34 Years | 0 (0.0%) | 0 (0.0%) |
| 35 to 64 Years | 7 (3.2%) | 18 (7.5%) |
| 65 to 74 Years | 0 (0.0%) | 0 (0.0%) |
| 75 Years and over | 0 (0.0%) | 0 (0.0%) |
Disability Class: Ambulatory Difficulty
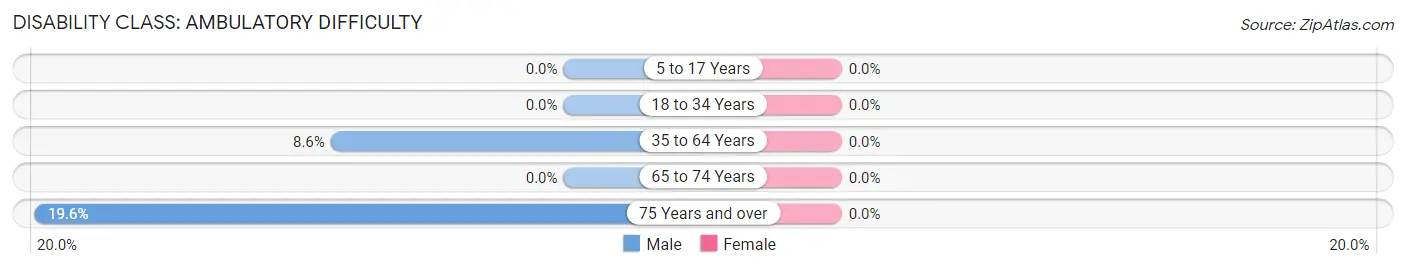
| Age Bracket | Male | Female |
| 5 to 17 Years | 0 (0.0%) | 0 (0.0%) |
| 18 to 34 Years | 0 (0.0%) | 0 (0.0%) |
| 35 to 64 Years | 19 (8.6%) | 0 (0.0%) |
| 65 to 74 Years | 0 (0.0%) | 0 (0.0%) |
| 75 Years and over | 10 (19.6%) | 0 (0.0%) |
Disability Class: Self-Care Difficulty
| Age Bracket | Male | Female |
| 5 to 17 Years | 0 (0.0%) | 0 (0.0%) |
| 18 to 34 Years | 0 (0.0%) | 0 (0.0%) |
| 35 to 64 Years | 0 (0.0%) | 0 (0.0%) |
| 65 to 74 Years | 0 (0.0%) | 0 (0.0%) |
| 75 Years and over | 0 (0.0%) | 0 (0.0%) |
Technology Access in Alleghenyville
Computing Device Access in Alleghenyville
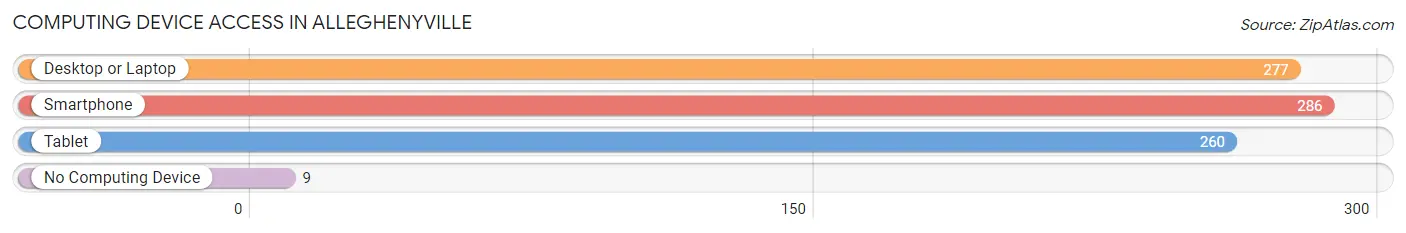
| Device Type | # Households | % Households |
| Desktop or Laptop | 277 | 90.8% |
| Smartphone | 286 | 93.8% |
| Tablet | 260 | 85.3% |
| No Computing Device | 9 | 2.9% |
| Total | 305 | 100.0% |
Internet Access in Alleghenyville
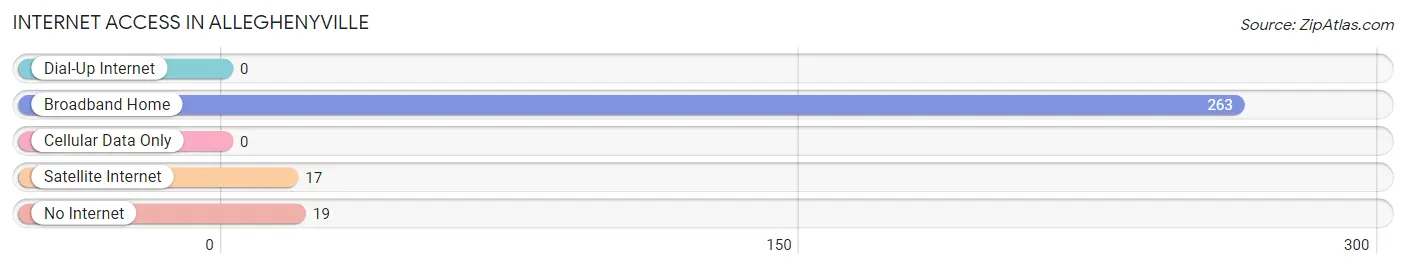
| Internet Type | # Households | % Households |
| Dial-Up Internet | 0 | 0.0% |
| Broadband Home | 263 | 86.2% |
| Cellular Data Only | 0 | 0.0% |
| Satellite Internet | 17 | 5.6% |
| No Internet | 19 | 6.2% |
| Total | 305 | 100.0% |
Alleghenyville Summary
Alleghenyville, Pennsylvania is a small borough located in Berks County, Pennsylvania. It is situated in the southeastern corner of the county, just north of the city of Reading. The borough is bordered by the Schuylkill River to the east, and the borough of Birdsboro to the west. The population of Alleghenyville was 1,845 at the 2010 census.
History
Alleghenyville was founded in 1790 by a group of German settlers who had migrated from the Allegheny Mountains in Pennsylvania. The settlers named the town after the mountain range, and it was incorporated as a borough in 1845.
The town was originally a farming community, but it soon developed into a manufacturing center. The first industry in Alleghenyville was a paper mill, which was established in 1820. This was followed by a woolen mill in 1825, and a tannery in 1835. The town also had a number of small businesses, such as a blacksmith shop, a general store, and a post office.
In the late 19th century, Alleghenyville became a popular tourist destination. The town was known for its scenic beauty, and it was a popular spot for fishing and hunting. The town also had a number of hotels and inns, which attracted visitors from all over the region.
Geography
Alleghenyville is located at 40°20'N 75°45'W (40.33, -75.75). It is situated in the southeastern corner of Berks County, just north of the city of Reading. The borough is bordered by the Schuylkill River to the east, and the borough of Birdsboro to the west.
The borough has a total area of 0.7 square miles, all of which is land. The terrain is mostly flat, with some rolling hills. The climate is humid continental, with hot summers and cold winters.
Economy
Alleghenyville's economy is largely based on manufacturing. The town is home to a number of factories, including a paper mill, a woolen mill, and a tannery. The town also has a number of small businesses, such as a general store, a post office, and a blacksmith shop.
The town is also home to a number of tourist attractions, including a historic district, a museum, and a number of parks. The town is also home to a number of festivals, such as the Alleghenyville Summer Festival and the Alleghenyville Fall Festival.
Demographics
As of the 2010 census, there were 1,845 people, 745 households, and 486 families residing in the borough. The population density was 2,637.3 people per square mile (1,017.2/km2). There were 809 housing units at an average density of 1,148.3 per square mile (443.2/km2). The racial makeup of the borough was 97.2% White, 0.9% African American, 0.2% Native American, 0.4% Asian, 0.2% from other races, and 1.1% from two or more races. Hispanic or Latino of any race were 1.3% of the population.
There were 745 households, out of which 28.2% had children under the age of 18 living with them, 48.2% were married couples living together, 11.2% had a female householder with no husband present, and 35.2% were non-families. 29.7% of all households were made up of individuals, and 13.2% had someone living alone who was 65 years of age or older. The average household size was 2.45 and the average family size was 3.04.
In the borough, the population was spread out, with 23.2% under the age of 18, 7.2% from 18 to 24, 28.2% from 25 to 44, 24.2% from 45 to 64, and 17.2% who were 65 years of age or older. The median age was 39 years. For every 100 females, there were 92.2 males. For every 100 females age 18 and over, there were 88.3 males.
The median income for a household in the borough was $41,250, and the median income for a family was $50,000. Males had a median income of $36,250 versus $25,000 for females. The per capita income for the borough was $20,845. About 5.2% of families and 7.2% of the population were below the poverty line, including 8.2% of those under age 18 and 8.2% of those age 65 or over.
Common Questions
What is Per Capita Income in Alleghenyville?
Per Capita income in Alleghenyville is $50,386.
What is the Median Family Income in Alleghenyville?
Median Family Income in Alleghenyville is $127,656.
What is the Median Household income in Alleghenyville?
Median Household Income in Alleghenyville is $116,023.
What is Income or Wage Gap in Alleghenyville?
Income or Wage Gap in Alleghenyville is 23.7%.
Women in Alleghenyville earn 76.3 cents for every dollar earned by a man.
What is Inequality or Gini Index in Alleghenyville?
Inequality or Gini Index in Alleghenyville is 0.37.
What is the Total Population of Alleghenyville?
Total Population of Alleghenyville is 849.
What is the Total Male Population of Alleghenyville?
Total Male Population of Alleghenyville is 404.
What is the Total Female Population of Alleghenyville?
Total Female Population of Alleghenyville is 445.
What is the Ratio of Males per 100 Females in Alleghenyville?
There are 90.79 Males per 100 Females in Alleghenyville.
What is the Ratio of Females per 100 Males in Alleghenyville?
There are 110.15 Females per 100 Males in Alleghenyville.
What is the Median Population Age in Alleghenyville?
Median Population Age in Alleghenyville is 50.0 Years.
What is the Average Family Size in Alleghenyville
Average Family Size in Alleghenyville is 3.0 People.
What is the Average Household Size in Alleghenyville
Average Household Size in Alleghenyville is 2.8 People.
How Large is the Labor Force in Alleghenyville?
There are 480 People in the Labor Forcein in Alleghenyville.
What is the Percentage of People in the Labor Force in Alleghenyville?
68.3% of People are in the Labor Force in Alleghenyville.
What is the Unemployment Rate in Alleghenyville?
Unemployment Rate in Alleghenyville is 2.5%.