Sun Valley, PA Map & Demographics
Sun Valley Map
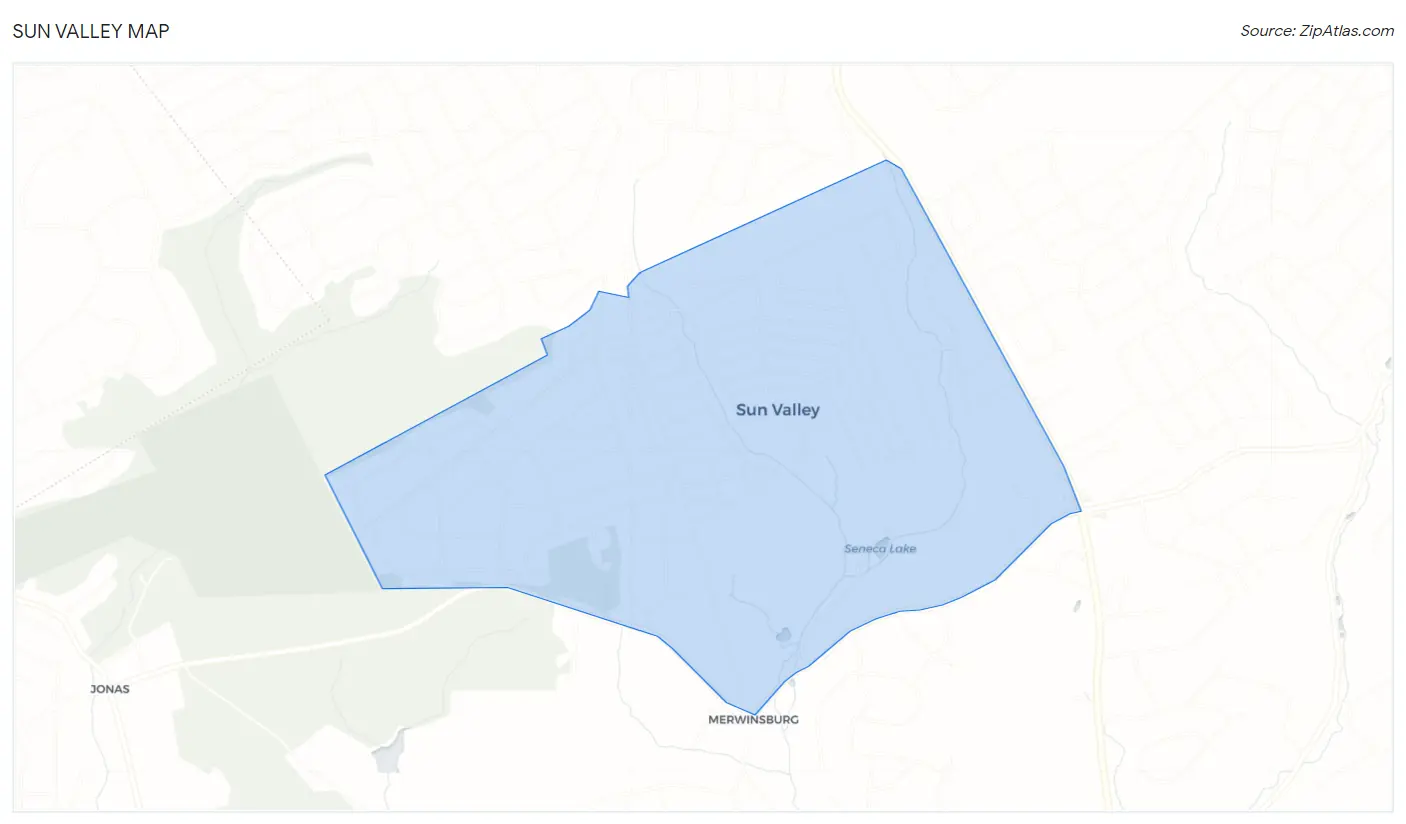
Sun Valley Overview
$30,138
PER CAPITA INCOME
$75,272
AVG FAMILY INCOME
$69,441
AVG HOUSEHOLD INCOME
43.5%
WAGE / INCOME GAP [ % ]
56.5¢/ $1
WAGE / INCOME GAP [ $ ]
0.30
INEQUALITY / GINI INDEX
2,206
TOTAL POPULATION
1,109
MALE POPULATION
1,097
FEMALE POPULATION
101.09
MALES / 100 FEMALES
98.92
FEMALES / 100 MALES
51.2
MEDIAN AGE
2.8
AVG FAMILY SIZE
2.4
AVG HOUSEHOLD SIZE
1,196
LABOR FORCE [ PEOPLE ]
64.1%
PERCENT IN LABOR FORCE
4.2%
UNEMPLOYMENT RATE
Income in Sun Valley
Income Overview in Sun Valley
Per Capita Income in Sun Valley is $30,138, while median incomes of families and households are $75,272 and $69,441 respectively.
| Characteristic | Number | Measure |
| Per Capita Income | 2,206 | $30,138 |
| Median Family Income | 663 | $75,272 |
| Mean Family Income | 663 | $79,843 |
| Median Household Income | 939 | $69,441 |
| Mean Household Income | 939 | $70,444 |
| Income Deficit | 663 | $0 |
| Wage / Income Gap (%) | 2,206 | 43.55% |
| Wage / Income Gap ($) | 2,206 | 56.45¢ per $1 |
| Gini / Inequality Index | 2,206 | 0.30 |
Earnings by Sex in Sun Valley
Average Earnings in Sun Valley are $38,780, $52,857 for men and $29,839 for women, a difference of 43.5%.
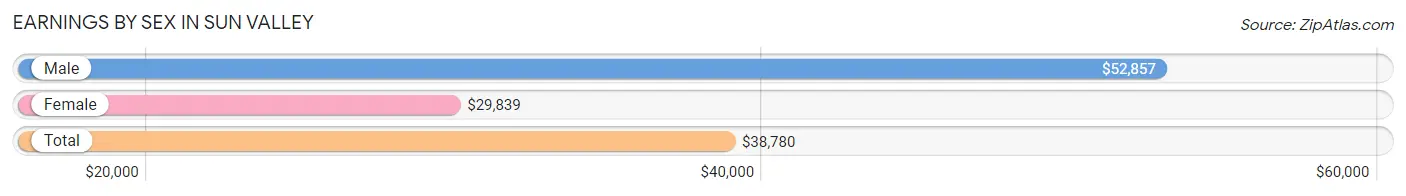
| Sex | Number | Average Earnings |
| Male | 580 (49.0%) | $52,857 |
| Female | 604 (51.0%) | $29,839 |
| Total | 1,184 (100.0%) | $38,780 |
Earnings by Sex by Income Bracket in Sun Valley
The most common earnings brackets in Sun Valley are $65,000 to $74,999 for men (109 | 18.8%) and $5,000 to $7,499 for women (117 | 19.4%).
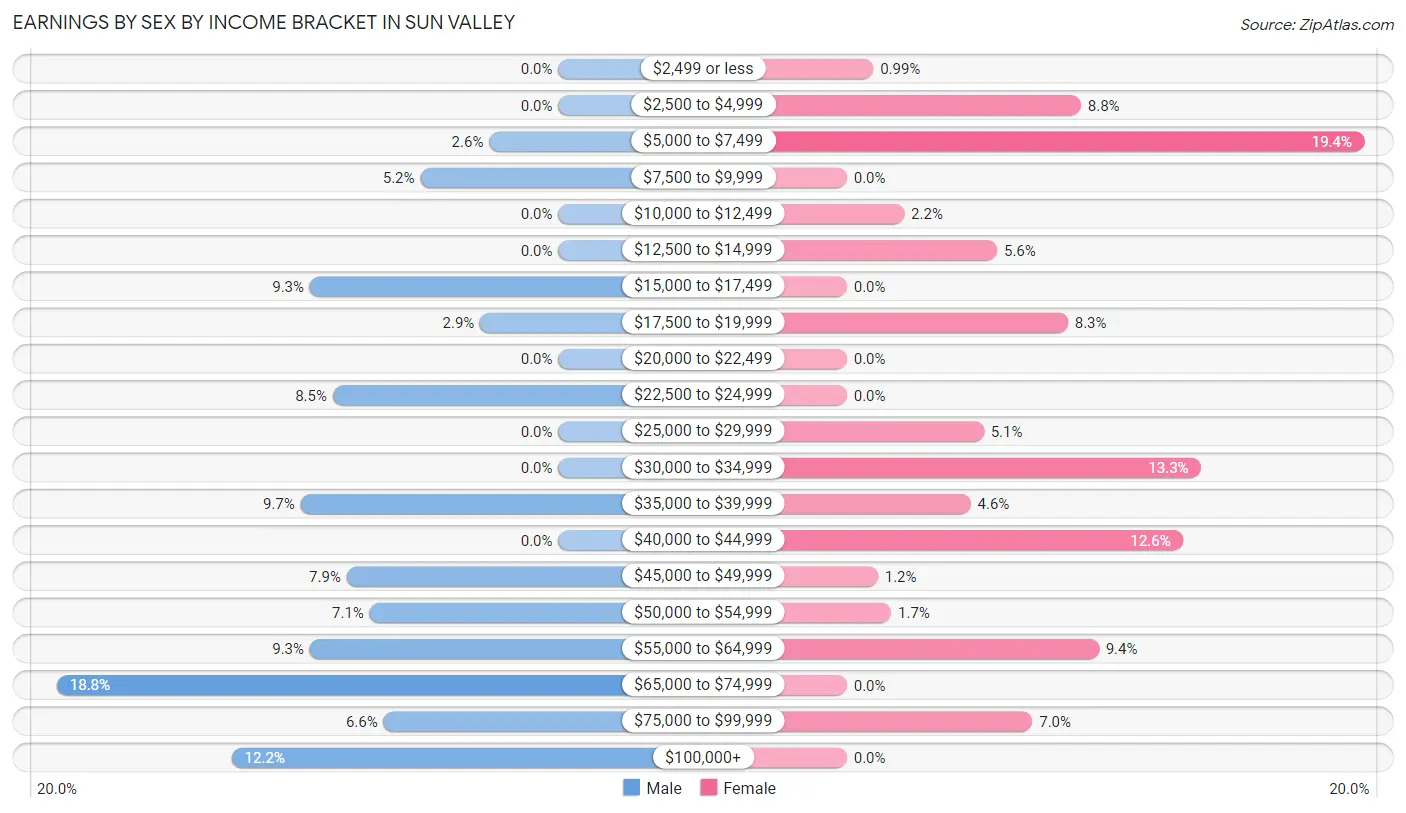
| Income | Male | Female |
| $2,499 or less | 0 (0.0%) | 6 (1.0%) |
| $2,500 to $4,999 | 0 (0.0%) | 53 (8.8%) |
| $5,000 to $7,499 | 15 (2.6%) | 117 (19.4%) |
| $7,500 to $9,999 | 30 (5.2%) | 0 (0.0%) |
| $10,000 to $12,499 | 0 (0.0%) | 13 (2.1%) |
| $12,500 to $14,999 | 0 (0.0%) | 34 (5.6%) |
| $15,000 to $17,499 | 54 (9.3%) | 0 (0.0%) |
| $17,500 to $19,999 | 17 (2.9%) | 50 (8.3%) |
| $20,000 to $22,499 | 0 (0.0%) | 0 (0.0%) |
| $22,500 to $24,999 | 49 (8.5%) | 0 (0.0%) |
| $25,000 to $29,999 | 0 (0.0%) | 31 (5.1%) |
| $30,000 to $34,999 | 0 (0.0%) | 80 (13.3%) |
| $35,000 to $39,999 | 56 (9.7%) | 28 (4.6%) |
| $40,000 to $44,999 | 0 (0.0%) | 76 (12.6%) |
| $45,000 to $49,999 | 46 (7.9%) | 7 (1.2%) |
| $50,000 to $54,999 | 41 (7.1%) | 10 (1.7%) |
| $55,000 to $64,999 | 54 (9.3%) | 57 (9.4%) |
| $65,000 to $74,999 | 109 (18.8%) | 0 (0.0%) |
| $75,000 to $99,999 | 38 (6.6%) | 42 (7.0%) |
| $100,000+ | 71 (12.2%) | 0 (0.0%) |
| Total | 580 (100.0%) | 604 (100.0%) |
Earnings by Sex by Educational Attainment in Sun Valley
Average earnings in Sun Valley are $58,036 for men and $31,629 for women, a difference of 45.5%. Men with an educational attainment of college or associate's degree enjoy the highest average annual earnings of $65,463, while those with high school diploma education earn the least with $47,292. Women with an educational attainment of bachelor's degree earn the most with the average annual earnings of $61,719, while those with college or associate's degree education have the smallest earnings of $37,589.
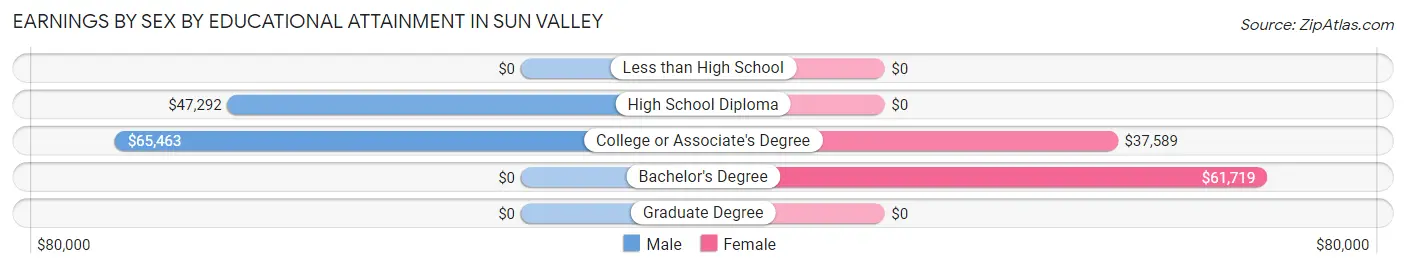
| Educational Attainment | Male Income | Female Income |
| Less than High School | - | - |
| High School Diploma | $47,292 | $0 |
| College or Associate's Degree | $65,463 | $37,589 |
| Bachelor's Degree | - | - |
| Graduate Degree | - | - |
| Total | $58,036 | $31,629 |
Family Income in Sun Valley
Family Income Brackets in Sun Valley
According to the Sun Valley family income data, there are 228 families falling into the $50,000 to $74,999 income range, which is the most common income bracket and makes up 34.4% of all families.
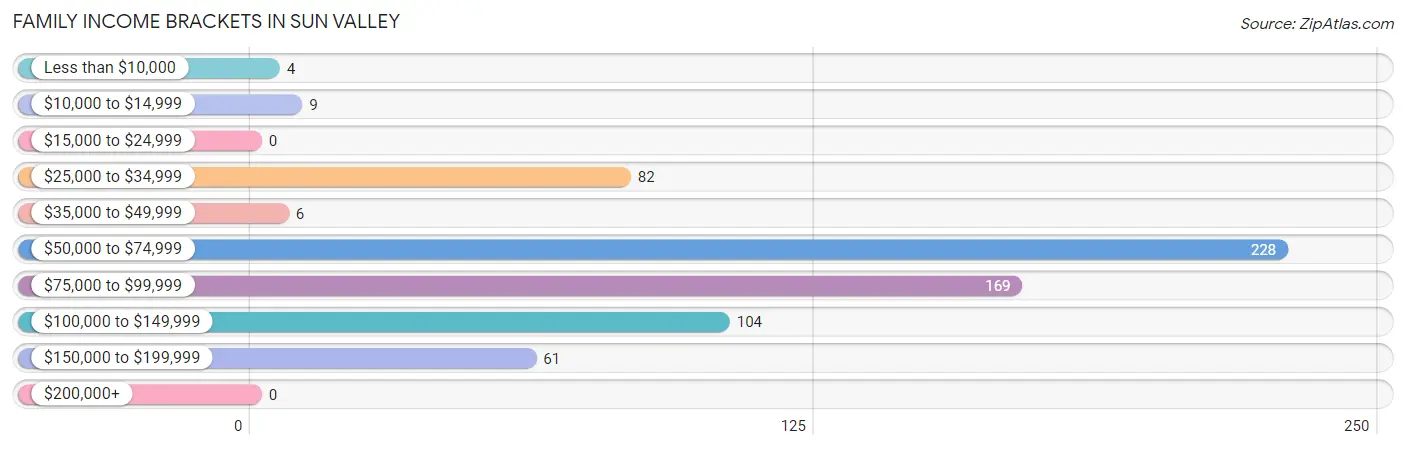
| Income Bracket | # Families | % Families |
| Less than $10,000 | 4 | 0.6% |
| $10,000 to $14,999 | 9 | 1.4% |
| $15,000 to $24,999 | 0 | 0.0% |
| $25,000 to $34,999 | 82 | 12.4% |
| $35,000 to $49,999 | 6 | 0.9% |
| $50,000 to $74,999 | 228 | 34.4% |
| $75,000 to $99,999 | 169 | 25.5% |
| $100,000 to $149,999 | 104 | 15.7% |
| $150,000 to $199,999 | 61 | 9.2% |
| $200,000+ | 0 | 0.0% |
Family Income by Famaliy Size in Sun Valley
3-person families (126 | 19.0%) account for the highest median family income in Sun Valley with $107,750 per family, while 3-person families (126 | 19.0%) have the highest median income of $35,917 per family member.
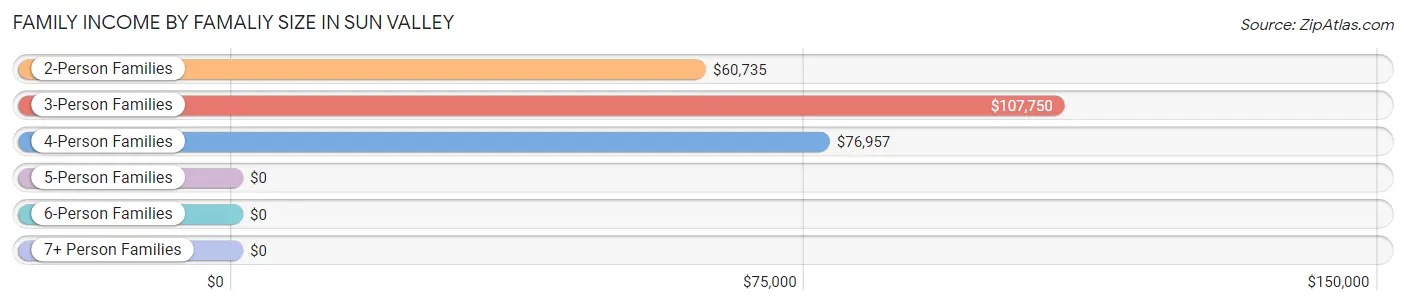
| Income Bracket | # Families | Median Income |
| 2-Person Families | 388 (58.5%) | $60,735 |
| 3-Person Families | 126 (19.0%) | $107,750 |
| 4-Person Families | 124 (18.7%) | $76,957 |
| 5-Person Families | 4 (0.6%) | $0 |
| 6-Person Families | 0 (0.0%) | $0 |
| 7+ Person Families | 21 (3.2%) | $0 |
| Total | 663 (100.0%) | $75,272 |
Family Income by Number of Earners in Sun Valley
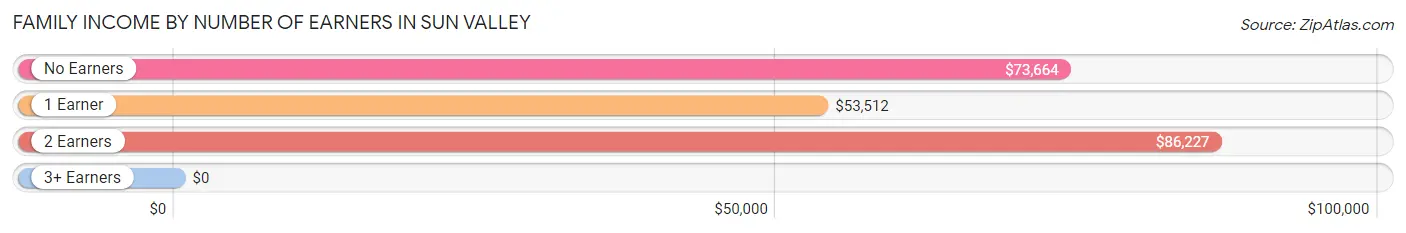
| Number of Earners | # Families | Median Income |
| No Earners | 59 (8.9%) | $73,664 |
| 1 Earner | 255 (38.5%) | $53,512 |
| 2 Earners | 327 (49.3%) | $86,227 |
| 3+ Earners | 22 (3.3%) | $0 |
| Total | 663 (100.0%) | $75,272 |
Household Income in Sun Valley
Household Income Brackets in Sun Valley
With 275 households falling in the category, the $50,000 to $74,999 income range is the most frequent in Sun Valley, accounting for 29.3% of all households.
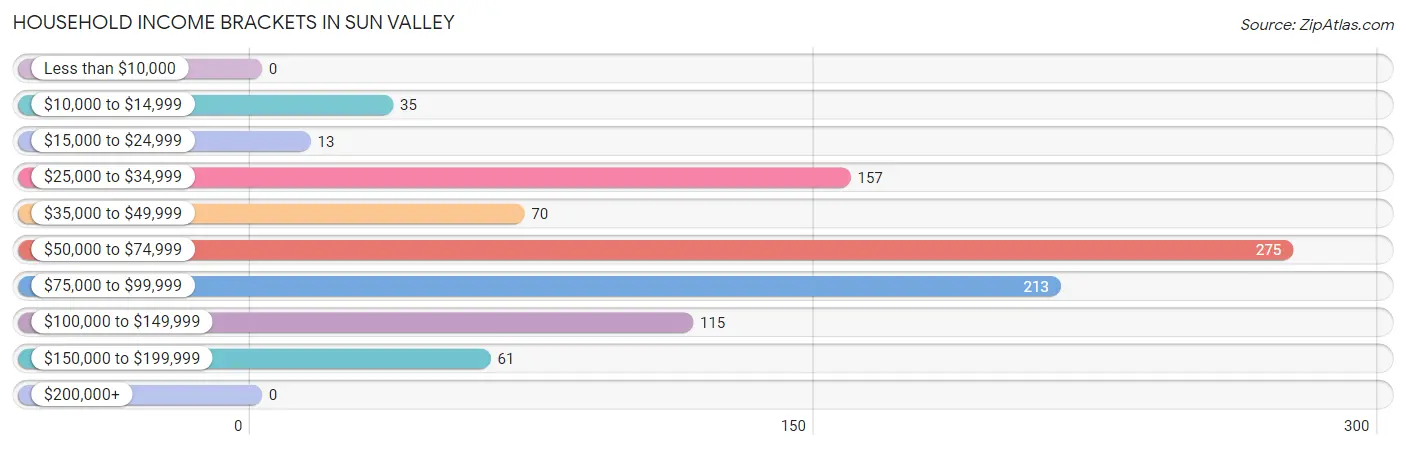
| Income Bracket | # Households | % Households |
| Less than $10,000 | 0 | 0.0% |
| $10,000 to $14,999 | 35 | 3.7% |
| $15,000 to $24,999 | 13 | 1.4% |
| $25,000 to $34,999 | 157 | 16.7% |
| $35,000 to $49,999 | 70 | 7.5% |
| $50,000 to $74,999 | 275 | 29.3% |
| $75,000 to $99,999 | 213 | 22.7% |
| $100,000 to $149,999 | 115 | 12.2% |
| $150,000 to $199,999 | 61 | 6.5% |
| $200,000+ | 0 | 0.0% |
Household Income by Householder Age in Sun Valley
The median household income in Sun Valley is $69,441, with the highest median household income of $85,774 found in the 25 to 44 years age bracket for the primary householder. A total of 151 households (16.1%) fall into this category.
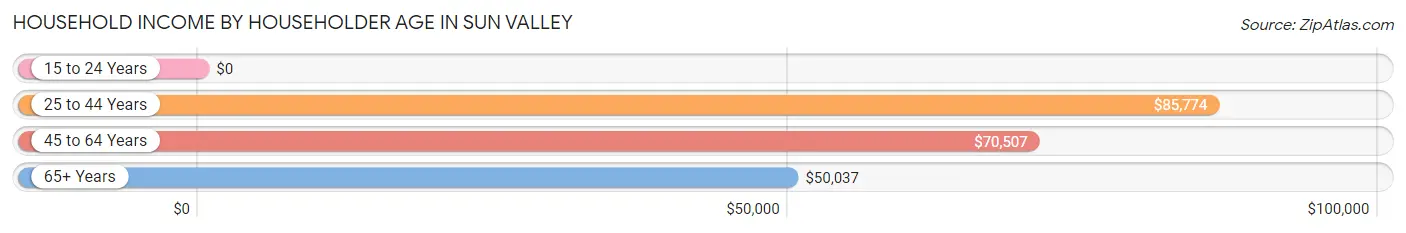
| Income Bracket | # Households | Median Income |
| 15 to 24 Years | 0 (0.0%) | $0 |
| 25 to 44 Years | 151 (16.1%) | $85,774 |
| 45 to 64 Years | 525 (55.9%) | $70,507 |
| 65+ Years | 263 (28.0%) | $50,037 |
| Total | 939 (100.0%) | $69,441 |
Poverty in Sun Valley
Income Below Poverty by Sex and Age in Sun Valley
With 3.9% poverty level for males and 8.6% for females among the residents of Sun Valley, 6 to 11 year old males and 16 and 17 year old females are the most vulnerable to poverty, with 22 males (42.3%) and 6 females (100.0%) in their respective age groups living below the poverty level.
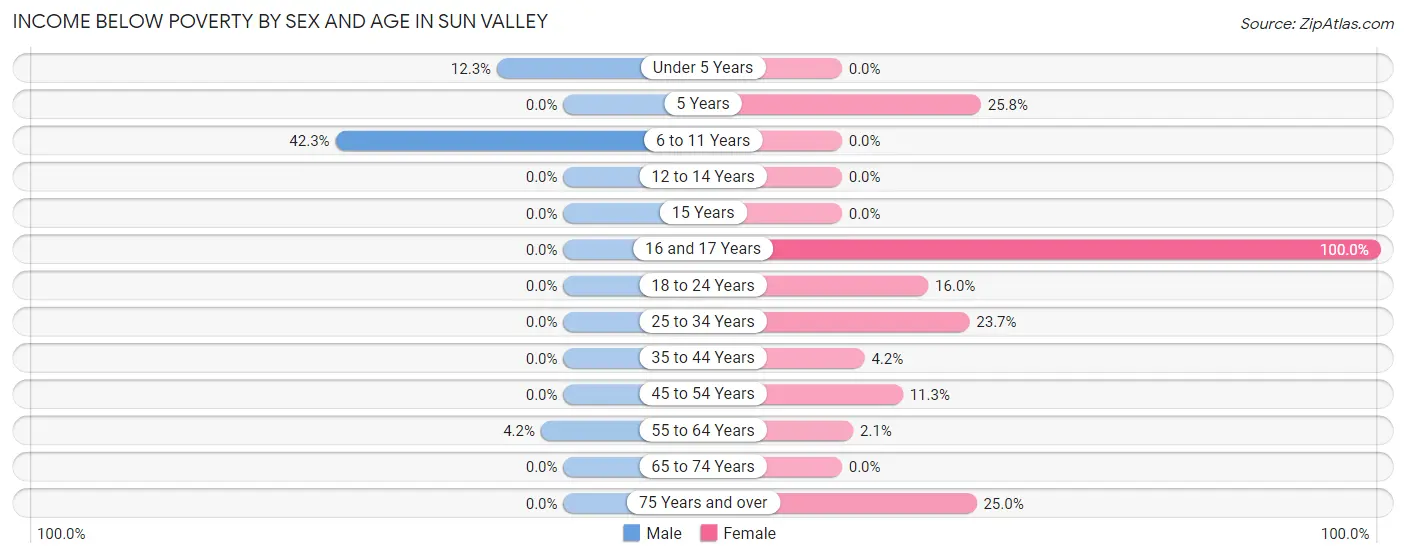
| Age Bracket | Male | Female |
| Under 5 Years | 9 (12.3%) | 0 (0.0%) |
| 5 Years | 0 (0.0%) | 8 (25.8%) |
| 6 to 11 Years | 22 (42.3%) | 0 (0.0%) |
| 12 to 14 Years | 0 (0.0%) | 0 (0.0%) |
| 15 Years | 0 (0.0%) | 0 (0.0%) |
| 16 and 17 Years | 0 (0.0%) | 6 (100.0%) |
| 18 to 24 Years | 0 (0.0%) | 21 (16.0%) |
| 25 to 34 Years | 0 (0.0%) | 9 (23.7%) |
| 35 to 44 Years | 0 (0.0%) | 4 (4.2%) |
| 45 to 54 Years | 0 (0.0%) | 32 (11.3%) |
| 55 to 64 Years | 12 (4.2%) | 5 (2.1%) |
| 65 to 74 Years | 0 (0.0%) | 0 (0.0%) |
| 75 Years and over | 0 (0.0%) | 9 (25.0%) |
| Total | 43 (3.9%) | 94 (8.6%) |
Income Above Poverty by Sex and Age in Sun Valley
According to the poverty statistics in Sun Valley, males aged 12 to 14 years and females aged under 5 years are the age groups that are most secure financially, with 100.0% of males and 100.0% of females in these age groups living above the poverty line.
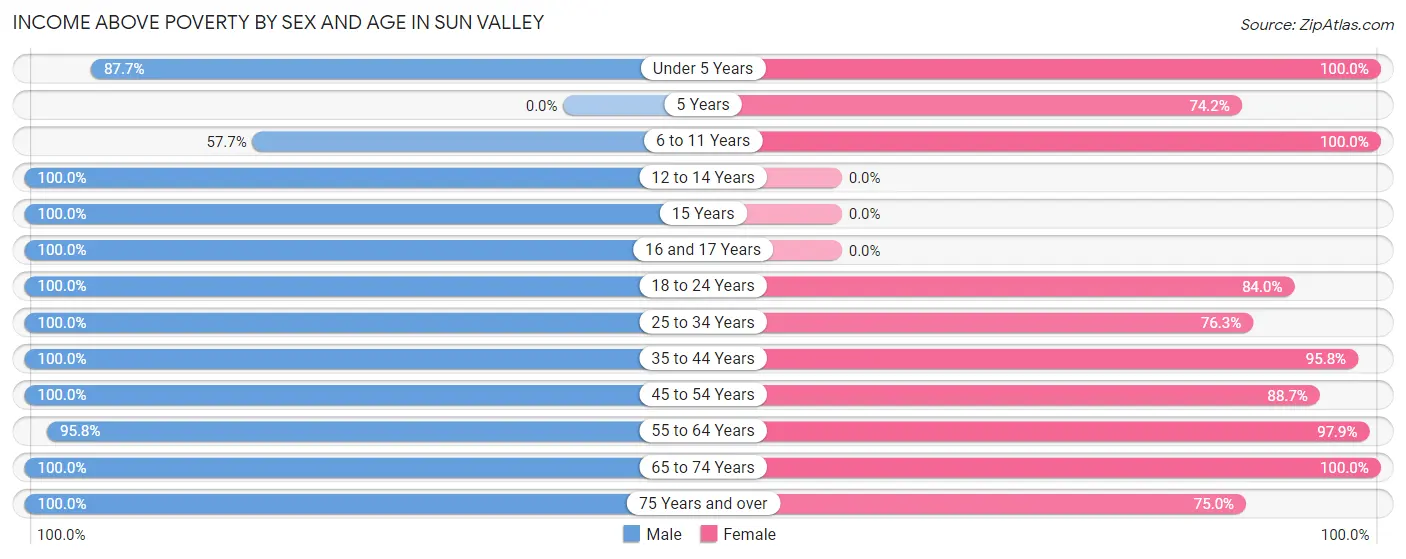
| Age Bracket | Male | Female |
| Under 5 Years | 64 (87.7%) | 37 (100.0%) |
| 5 Years | 0 (0.0%) | 23 (74.2%) |
| 6 to 11 Years | 30 (57.7%) | 42 (100.0%) |
| 12 to 14 Years | 59 (100.0%) | 0 (0.0%) |
| 15 Years | 46 (100.0%) | 0 (0.0%) |
| 16 and 17 Years | 54 (100.0%) | 0 (0.0%) |
| 18 to 24 Years | 21 (100.0%) | 110 (84.0%) |
| 25 to 34 Years | 34 (100.0%) | 29 (76.3%) |
| 35 to 44 Years | 152 (100.0%) | 91 (95.8%) |
| 45 to 54 Years | 157 (100.0%) | 251 (88.7%) |
| 55 to 64 Years | 275 (95.8%) | 233 (97.9%) |
| 65 to 74 Years | 134 (100.0%) | 160 (100.0%) |
| 75 Years and over | 40 (100.0%) | 27 (75.0%) |
| Total | 1,066 (96.1%) | 1,003 (91.4%) |
Income Below Poverty Among Married-Couple Families in Sun Valley
| Children | Above Poverty | Below Poverty |
| No Children | 327 (100.0%) | 0 (0.0%) |
| 1 or 2 Children | 164 (100.0%) | 0 (0.0%) |
| 3 or 4 Children | 21 (100.0%) | 0 (0.0%) |
| 5 or more Children | 0 (0.0%) | 0 (0.0%) |
| Total | 512 (100.0%) | 0 (0.0%) |
Income Below Poverty Among Single-Parent Households in Sun Valley
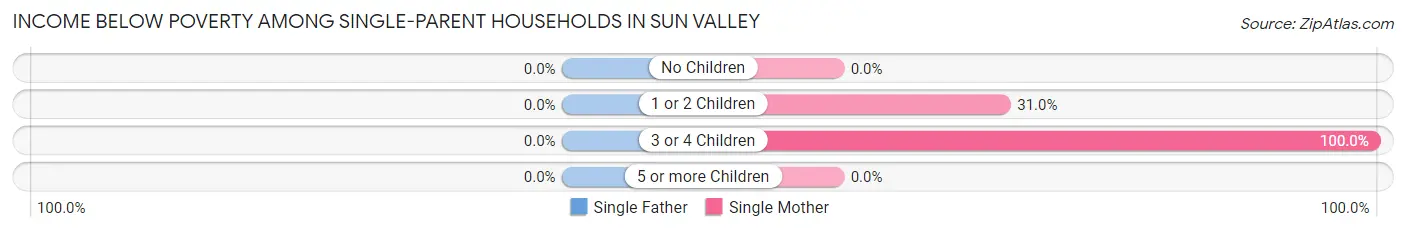
| Children | Single Father | Single Mother |
| No Children | 0 (0.0%) | 0 (0.0%) |
| 1 or 2 Children | 0 (0.0%) | 9 (31.0%) |
| 3 or 4 Children | 0 (0.0%) | 4 (100.0%) |
| 5 or more Children | 0 (0.0%) | 0 (0.0%) |
| Total | 0 (0.0%) | 13 (11.3%) |
Income Below Poverty Among Married-Couple vs Single-Parent Households in Sun Valley
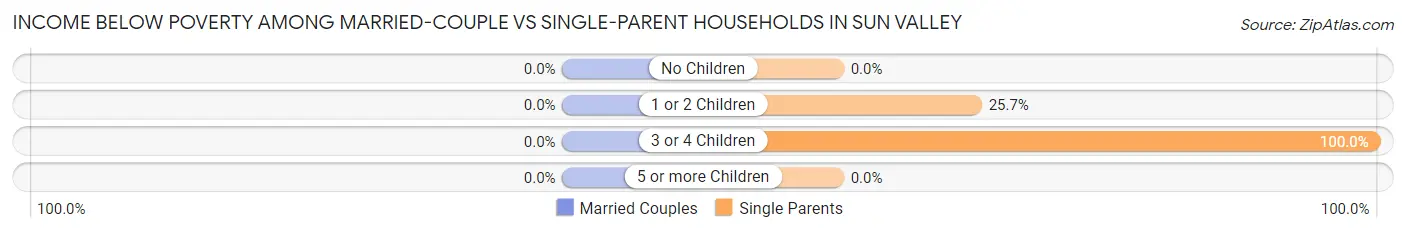
| Children | Married-Couple Families | Single-Parent Households |
| No Children | 0 (0.0%) | 0 (0.0%) |
| 1 or 2 Children | 0 (0.0%) | 9 (25.7%) |
| 3 or 4 Children | 0 (0.0%) | 4 (100.0%) |
| 5 or more Children | 0 (0.0%) | 0 (0.0%) |
| Total | 0 (0.0%) | 13 (8.6%) |
Race in Sun Valley
The most populous races in Sun Valley are White / Caucasian (1,759 | 79.7%), Black / African American (399 | 18.1%), and Hispanic or Latino (68 | 3.1%).
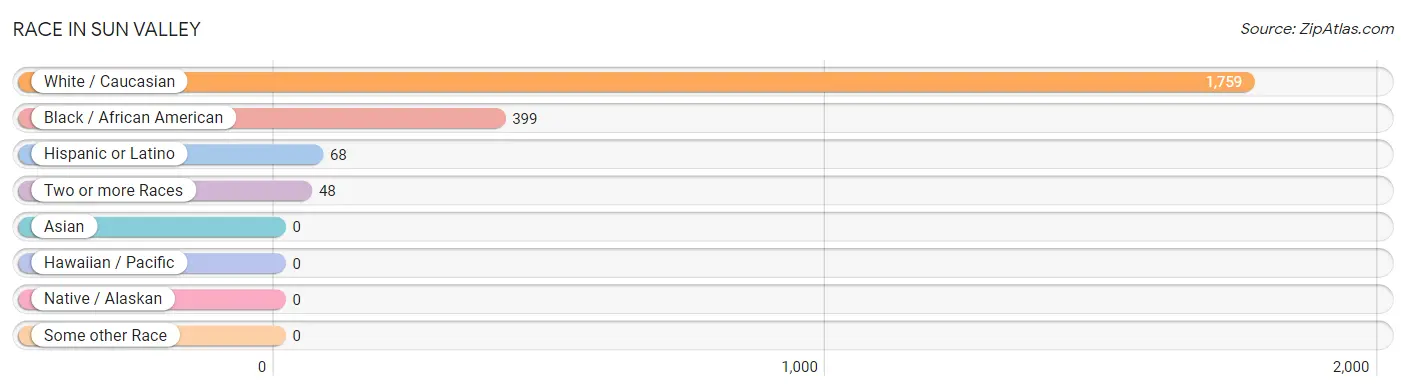
| Race | # Population | % Population |
| Asian | 0 | 0.0% |
| Black / African American | 399 | 18.1% |
| Hawaiian / Pacific | 0 | 0.0% |
| Hispanic or Latino | 68 | 3.1% |
| Native / Alaskan | 0 | 0.0% |
| White / Caucasian | 1,759 | 79.7% |
| Two or more Races | 48 | 2.2% |
| Some other Race | 0 | 0.0% |
| Total | 2,206 | 100.0% |
Ancestry in Sun Valley
The most populous ancestries reported in Sun Valley are Irish (477 | 21.6%), German (463 | 21.0%), Italian (409 | 18.5%), American (244 | 11.1%), and English (168 | 7.6%), together accounting for 79.8% of all Sun Valley residents.
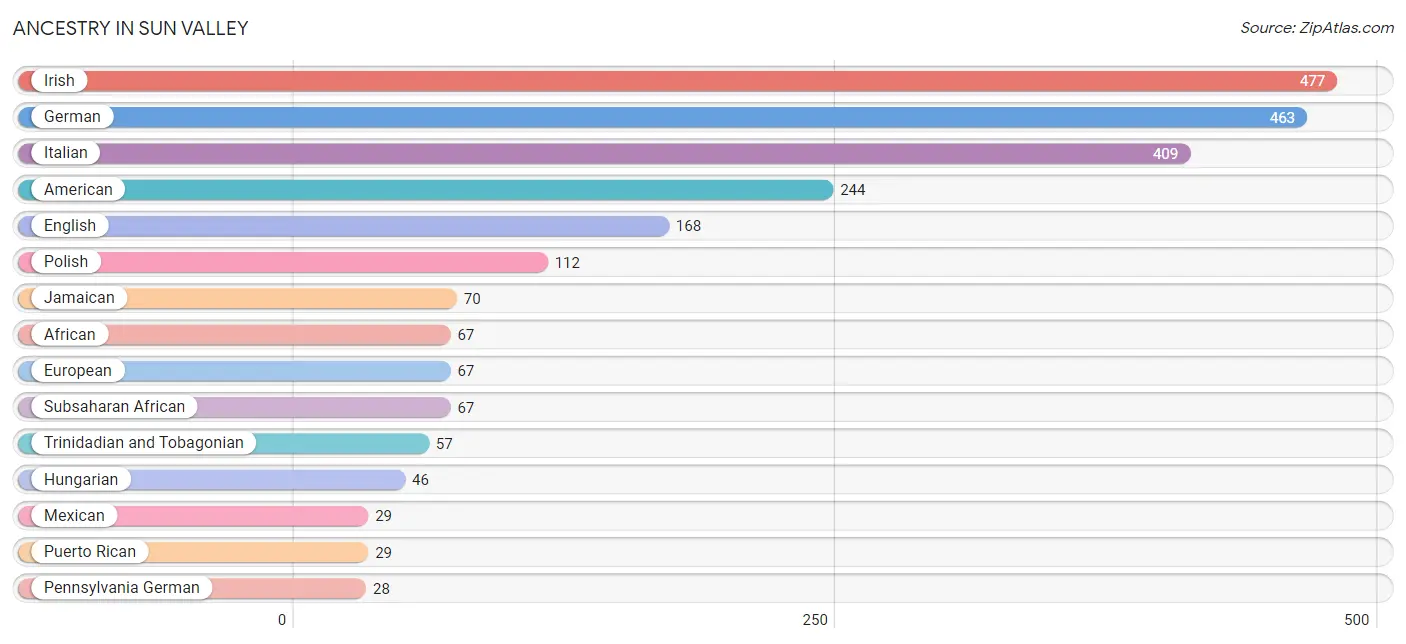
| Ancestry | # Population | % Population |
| African | 67 | 3.0% |
| American | 244 | 11.1% |
| Arab | 25 | 1.1% |
| Austrian | 20 | 0.9% |
| Cherokee | 4 | 0.2% |
| Dutch | 18 | 0.8% |
| English | 168 | 7.6% |
| European | 67 | 3.0% |
| German | 463 | 21.0% |
| Hungarian | 46 | 2.1% |
| Irish | 477 | 21.6% |
| Italian | 409 | 18.5% |
| Jamaican | 70 | 3.2% |
| Mexican | 29 | 1.3% |
| Norwegian | 5 | 0.2% |
| Pennsylvania German | 28 | 1.3% |
| Polish | 112 | 5.1% |
| Puerto Rican | 29 | 1.3% |
| Scottish | 25 | 1.1% |
| Sioux | 5 | 0.2% |
| Slovak | 28 | 1.3% |
| South American | 10 | 0.4% |
| Subsaharan African | 67 | 3.0% |
| Syrian | 25 | 1.1% |
| Trinidadian and Tobagonian | 57 | 2.6% |
| Ukrainian | 23 | 1.0% |
| Venezuelan | 10 | 0.4% |
| Welsh | 6 | 0.3% | View All 28 Rows |
Immigrants in Sun Valley
The most numerous immigrant groups reported in Sun Valley came from Africa (72 | 3.3%), Ghana (72 | 3.3%), Western Africa (72 | 3.3%), Latin America (63 | 2.9%), and Caribbean (53 | 2.4%), together accounting for 15.0% of all Sun Valley residents.
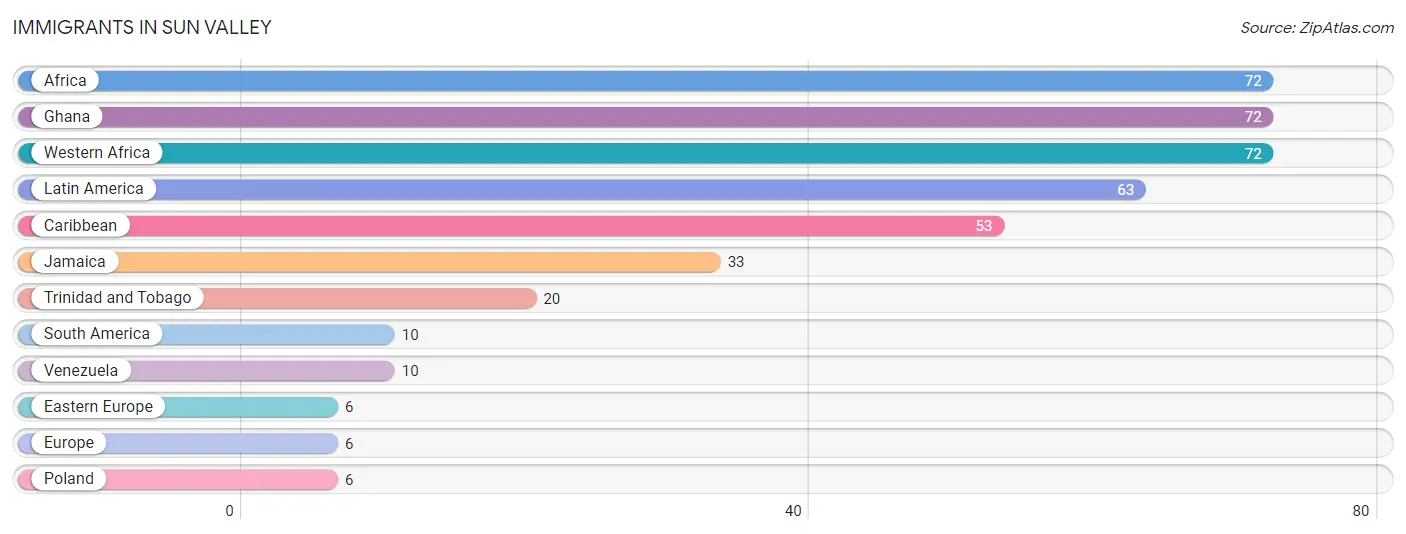
| Immigration Origin | # Population | % Population |
| Africa | 72 | 3.3% |
| Caribbean | 53 | 2.4% |
| Eastern Europe | 6 | 0.3% |
| Europe | 6 | 0.3% |
| Ghana | 72 | 3.3% |
| Jamaica | 33 | 1.5% |
| Latin America | 63 | 2.9% |
| Poland | 6 | 0.3% |
| South America | 10 | 0.4% |
| Trinidad and Tobago | 20 | 0.9% |
| Venezuela | 10 | 0.4% |
| Western Africa | 72 | 3.3% | View All 12 Rows |
Sex and Age in Sun Valley
Sex and Age in Sun Valley
The most populous age groups in Sun Valley are 60 to 64 Years (209 | 18.9%) for men and 50 to 54 Years (230 | 21.0%) for women.
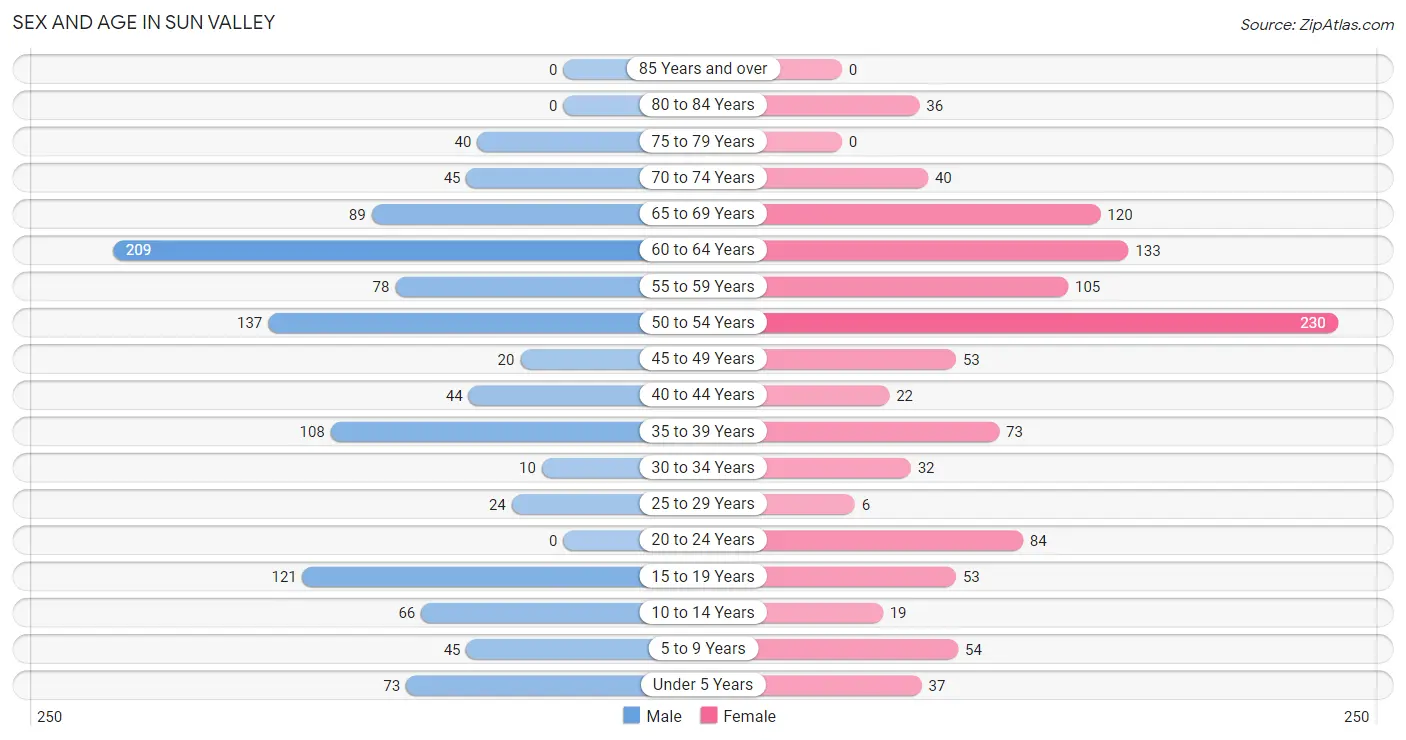
| Age Bracket | Male | Female |
| Under 5 Years | 73 (6.6%) | 37 (3.4%) |
| 5 to 9 Years | 45 (4.1%) | 54 (4.9%) |
| 10 to 14 Years | 66 (5.9%) | 19 (1.7%) |
| 15 to 19 Years | 121 (10.9%) | 53 (4.8%) |
| 20 to 24 Years | 0 (0.0%) | 84 (7.7%) |
| 25 to 29 Years | 24 (2.2%) | 6 (0.5%) |
| 30 to 34 Years | 10 (0.9%) | 32 (2.9%) |
| 35 to 39 Years | 108 (9.7%) | 73 (6.7%) |
| 40 to 44 Years | 44 (4.0%) | 22 (2.0%) |
| 45 to 49 Years | 20 (1.8%) | 53 (4.8%) |
| 50 to 54 Years | 137 (12.3%) | 230 (21.0%) |
| 55 to 59 Years | 78 (7.0%) | 105 (9.6%) |
| 60 to 64 Years | 209 (18.9%) | 133 (12.1%) |
| 65 to 69 Years | 89 (8.0%) | 120 (10.9%) |
| 70 to 74 Years | 45 (4.1%) | 40 (3.6%) |
| 75 to 79 Years | 40 (3.6%) | 0 (0.0%) |
| 80 to 84 Years | 0 (0.0%) | 36 (3.3%) |
| 85 Years and over | 0 (0.0%) | 0 (0.0%) |
| Total | 1,109 (100.0%) | 1,097 (100.0%) |
Families and Households in Sun Valley
Median Family Size in Sun Valley
The median family size in Sun Valley is 2.81 persons per family, with single female/mother families (115 | 17.3%) accounting for the largest median family size of 2.9 persons per family. On the other hand, single male/father families (36 | 5.4%) represent the smallest median family size with 2.47 persons per family.
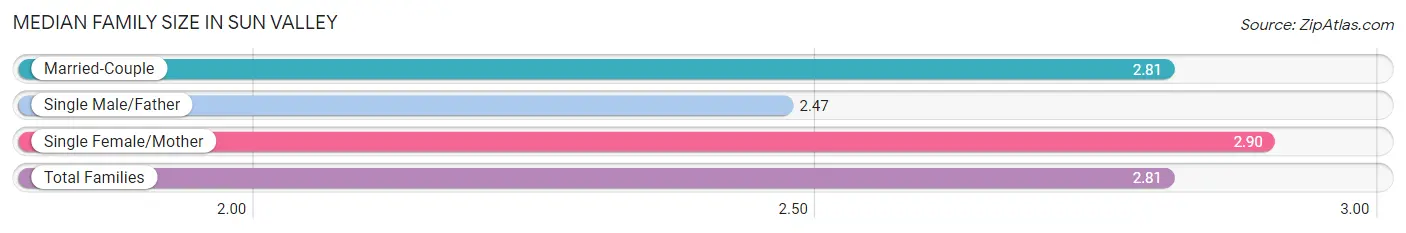
| Family Type | # Families | Family Size |
| Married-Couple | 512 (77.2%) | 2.81 |
| Single Male/Father | 36 (5.4%) | 2.47 |
| Single Female/Mother | 115 (17.3%) | 2.90 |
| Total Families | 663 (100.0%) | 2.81 |
Median Household Size in Sun Valley
The median household size in Sun Valley is 2.35 persons per household, with single female/mother households (115 | 12.2%) accounting for the largest median household size of 3.08 persons per household. non-family households (276 | 29.4%) represent the smallest median household size with 1.14 persons per household.
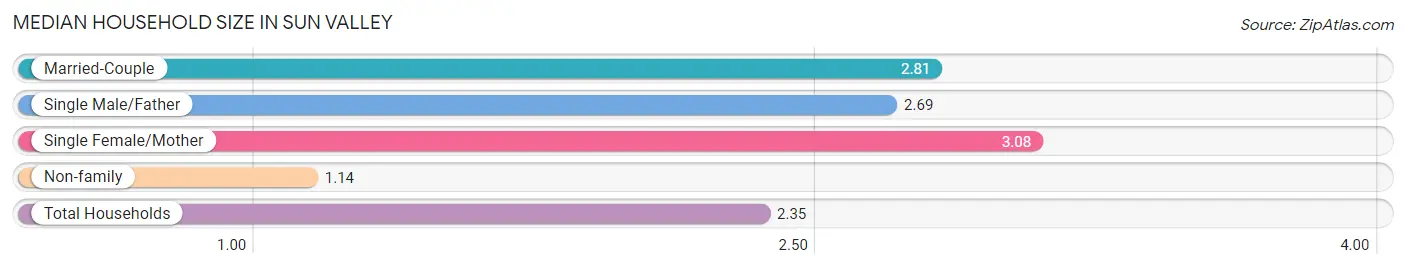
| Household Type | # Households | Household Size |
| Married-Couple | 512 (54.5%) | 2.81 |
| Single Male/Father | 36 (3.8%) | 2.69 |
| Single Female/Mother | 115 (12.2%) | 3.08 |
| Non-family | 276 (29.4%) | 1.14 |
| Total Households | 939 (100.0%) | 2.35 |
Household Size by Marriage Status in Sun Valley
Out of a total of 939 households in Sun Valley, 663 (70.6%) are family households, while 276 (29.4%) are nonfamily households. The most numerous type of family households are 2-person households, comprising 373, and the most common type of nonfamily households are 1-person households, comprising 232.
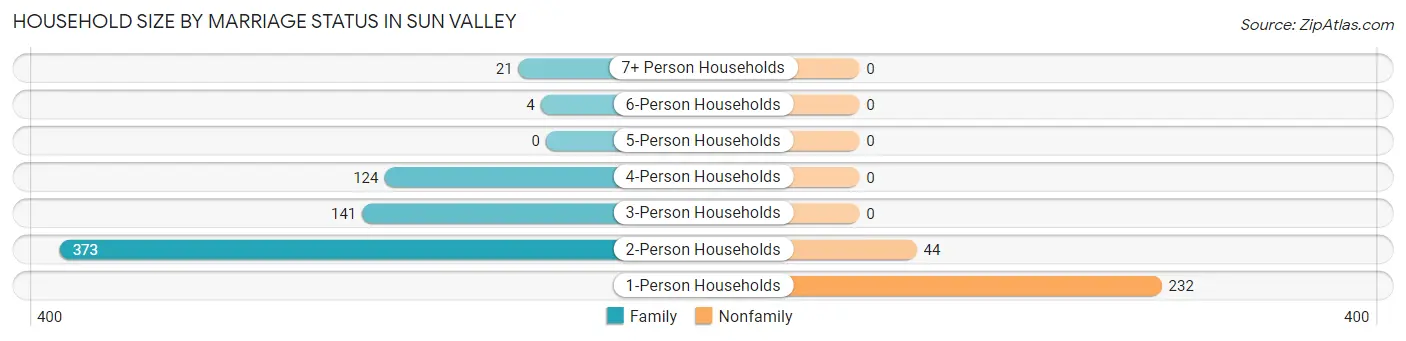
| Household Size | Family Households | Nonfamily Households |
| 1-Person Households | - | 232 (24.7%) |
| 2-Person Households | 373 (39.7%) | 44 (4.7%) |
| 3-Person Households | 141 (15.0%) | 0 (0.0%) |
| 4-Person Households | 124 (13.2%) | 0 (0.0%) |
| 5-Person Households | 0 (0.0%) | 0 (0.0%) |
| 6-Person Households | 4 (0.4%) | 0 (0.0%) |
| 7+ Person Households | 21 (2.2%) | 0 (0.0%) |
| Total | 663 (70.6%) | 276 (29.4%) |
Female Fertility in Sun Valley
Fertility by Age in Sun Valley
Average fertility rate in Sun Valley is 111.0 births per 1,000 women. Women in the age bracket of 15 to 19 years have the highest fertility rate with 642.0 births per 1,000 women. Women in the age bracket of 15 to 19 years acount for 69.4% of all women with births.
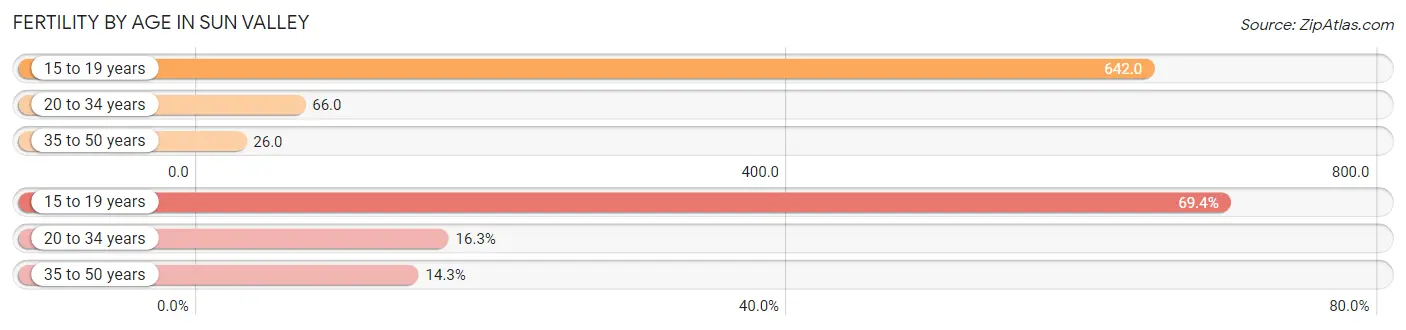
| Age Bracket | Women with Births | Births / 1,000 Women |
| 15 to 19 years | 34 (69.4%) | 642.0 |
| 20 to 34 years | 8 (16.3%) | 66.0 |
| 35 to 50 years | 7 (14.3%) | 26.0 |
| Total | 49 (100.0%) | 111.0 |
Fertility by Age by Marriage Status in Sun Valley
14.3% of women with births (49) in Sun Valley are married. The highest percentage of unmarried women with births falls into 15 to 19 years age bracket with 100.0% of them unmarried at the time of birth, while the lowest percentage of unmarried women with births belong to 35 to 50 years age bracket with 0.0% of them unmarried.
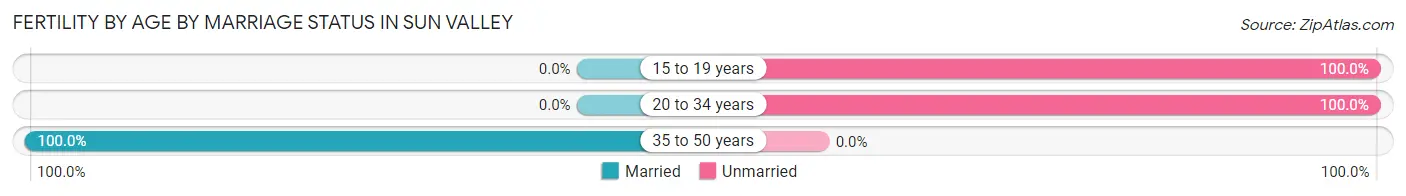
| Age Bracket | Married | Unmarried |
| 15 to 19 years | 0 (0.0%) | 34 (100.0%) |
| 20 to 34 years | 0 (0.0%) | 8 (100.0%) |
| 35 to 50 years | 7 (100.0%) | 0 (0.0%) |
| Total | 7 (14.3%) | 42 (85.7%) |
Fertility by Education in Sun Valley
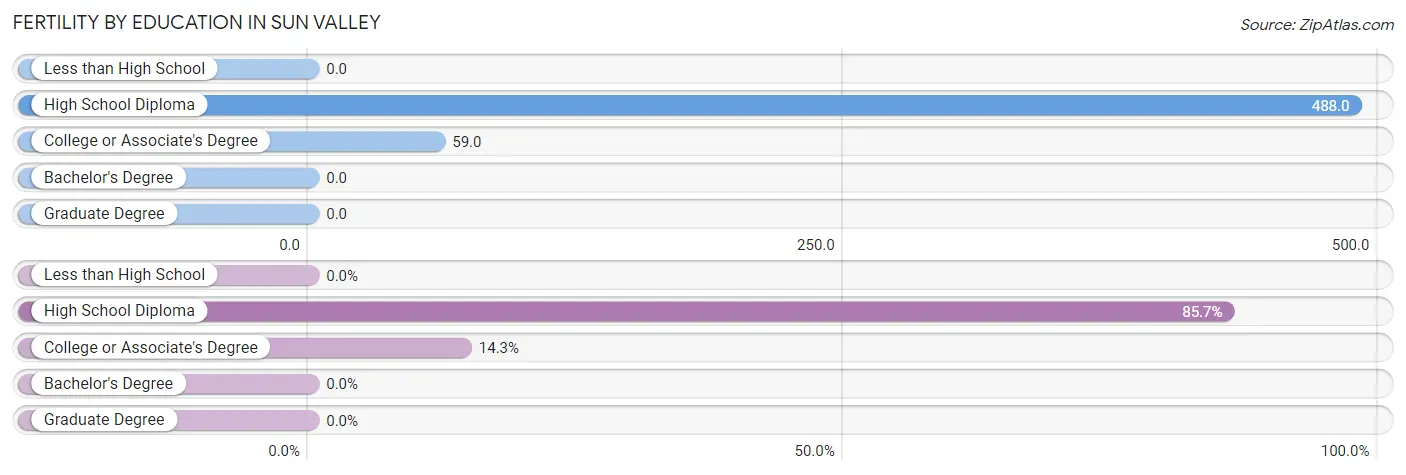
| Educational Attainment | Women with Births | Births / 1,000 Women |
| Less than High School | 0 (0.0%) | 0.0 |
| High School Diploma | 42 (85.7%) | 488.0 |
| College or Associate's Degree | 7 (14.3%) | 59.0 |
| Bachelor's Degree | 0 (0.0%) | 0.0 |
| Graduate Degree | 0 (0.0%) | 0.0 |
| Total | 49 (100.0%) | 111.0 |
Fertility by Education by Marriage Status in Sun Valley
85.7% of women with births in Sun Valley are unmarried. Women with the educational attainment of college or associate's degree are most likely to be married with 100.0% of them married at childbirth, while women with the educational attainment of high school diploma are least likely to be married with 100.0% of them unmarried at childbirth.
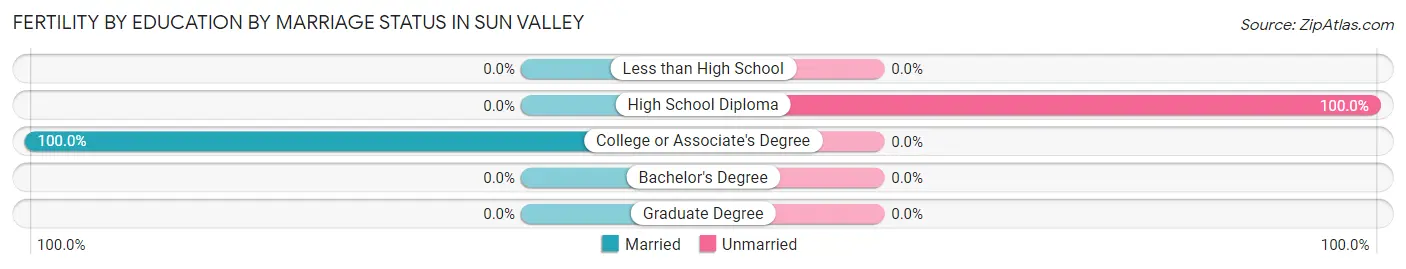
| Educational Attainment | Married | Unmarried |
| Less than High School | 0 (0.0%) | 0 (0.0%) |
| High School Diploma | 0 (0.0%) | 42 (100.0%) |
| College or Associate's Degree | 7 (100.0%) | 0 (0.0%) |
| Bachelor's Degree | 0 (0.0%) | 0 (0.0%) |
| Graduate Degree | 0 (0.0%) | 0 (0.0%) |
| Total | 7 (14.3%) | 42 (85.7%) |
Employment Characteristics in Sun Valley
Employment by Class of Employer in Sun Valley
Among the 1,127 employed individuals in Sun Valley, private company employees (873 | 77.5%), self-employed (not incorporated) (142 | 12.6%), and state government employees (83 | 7.4%) make up the most common classes of employment.
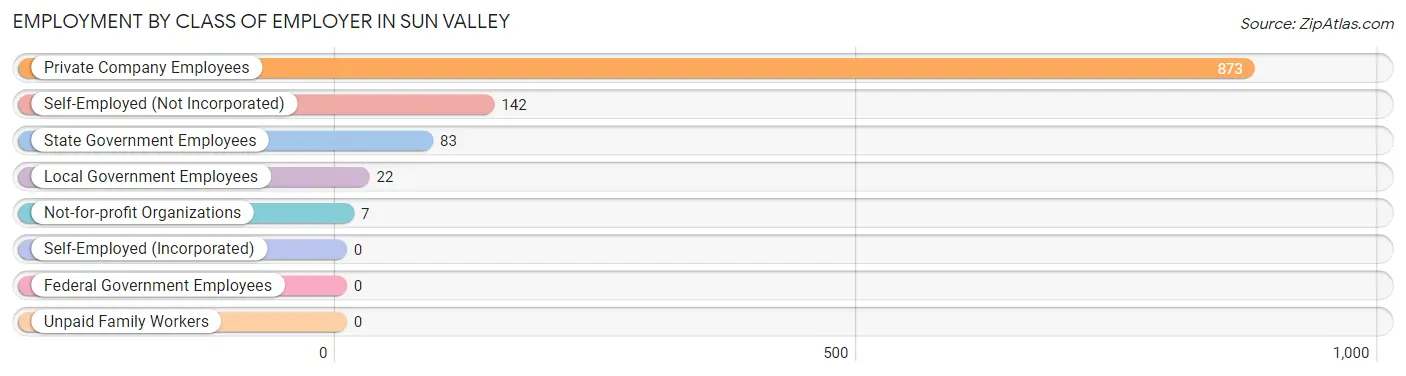
| Employer Class | # Employees | % Employees |
| Private Company Employees | 873 | 77.5% |
| Self-Employed (Incorporated) | 0 | 0.0% |
| Self-Employed (Not Incorporated) | 142 | 12.6% |
| Not-for-profit Organizations | 7 | 0.6% |
| Local Government Employees | 22 | 1.9% |
| State Government Employees | 83 | 7.4% |
| Federal Government Employees | 0 | 0.0% |
| Unpaid Family Workers | 0 | 0.0% |
| Total | 1,127 | 100.0% |
Employment Status by Age in Sun Valley
According to the labor force statistics for Sun Valley, out of the total population over 16 years of age (1,866), 64.1% or 1,196 individuals are in the labor force, with 4.2% or 50 of them unemployed. The age group with the highest labor force participation rate is 25 to 29 years, with 100.0% or 30 individuals in the labor force. Within the labor force, the 16 to 19 years age range has the highest percentage of unemployed individuals, with 25.0% or 13 of them being unemployed.
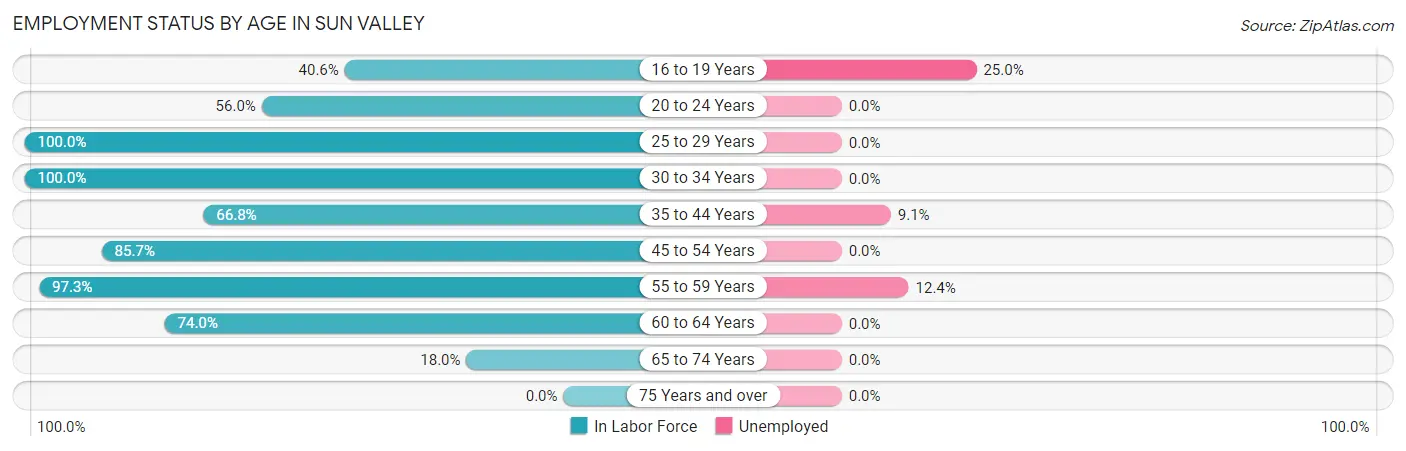
| Age Bracket | In Labor Force | Unemployed |
| 16 to 19 Years | 52 (40.6%) | 13 (25.0%) |
| 20 to 24 Years | 47 (56.0%) | 0 (0.0%) |
| 25 to 29 Years | 30 (100.0%) | 0 (0.0%) |
| 30 to 34 Years | 42 (100.0%) | 0 (0.0%) |
| 35 to 44 Years | 165 (66.8%) | 15 (9.1%) |
| 45 to 54 Years | 377 (85.7%) | 0 (0.0%) |
| 55 to 59 Years | 178 (97.3%) | 22 (12.4%) |
| 60 to 64 Years | 253 (74.0%) | 0 (0.0%) |
| 65 to 74 Years | 53 (18.0%) | 0 (0.0%) |
| 75 Years and over | 0 (0.0%) | 0 (0.0%) |
| Total | 1,196 (64.1%) | 50 (4.2%) |
Employment Status by Educational Attainment in Sun Valley
According to labor force statistics for Sun Valley, 81.4% of individuals (1,045) out of the total population between 25 and 64 years of age (1,284) are in the labor force, with 3.5% or 37 of them being unemployed. The group with the highest labor force participation rate are those with the educational attainment of bachelor's degree or higher, with 100.0% or 345 individuals in the labor force. Within the labor force, individuals with high school diploma education have the highest percentage of unemployment, with 8.0% or 25 of them being unemployed.
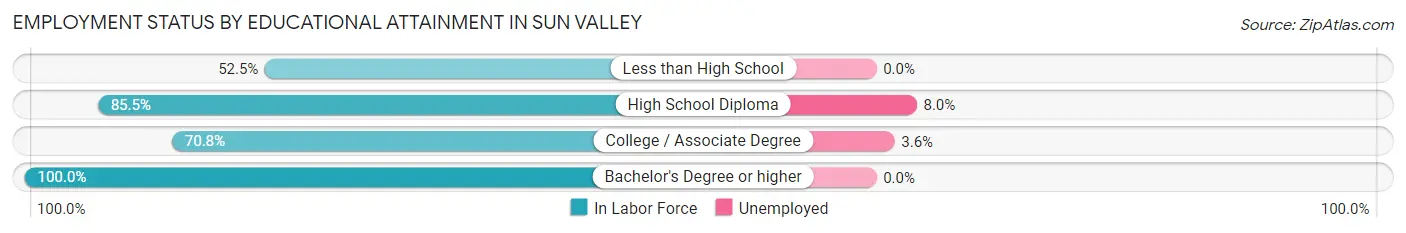
| Educational Attainment | In Labor Force | Unemployed |
| Less than High School | 53 (52.5%) | 0 (0.0%) |
| High School Diploma | 313 (85.5%) | 29 (8.0%) |
| College / Associate Degree | 334 (70.8%) | 17 (3.6%) |
| Bachelor's Degree or higher | 345 (100.0%) | 0 (0.0%) |
| Total | 1,045 (81.4%) | 45 (3.5%) |
Employment Occupations by Sex in Sun Valley
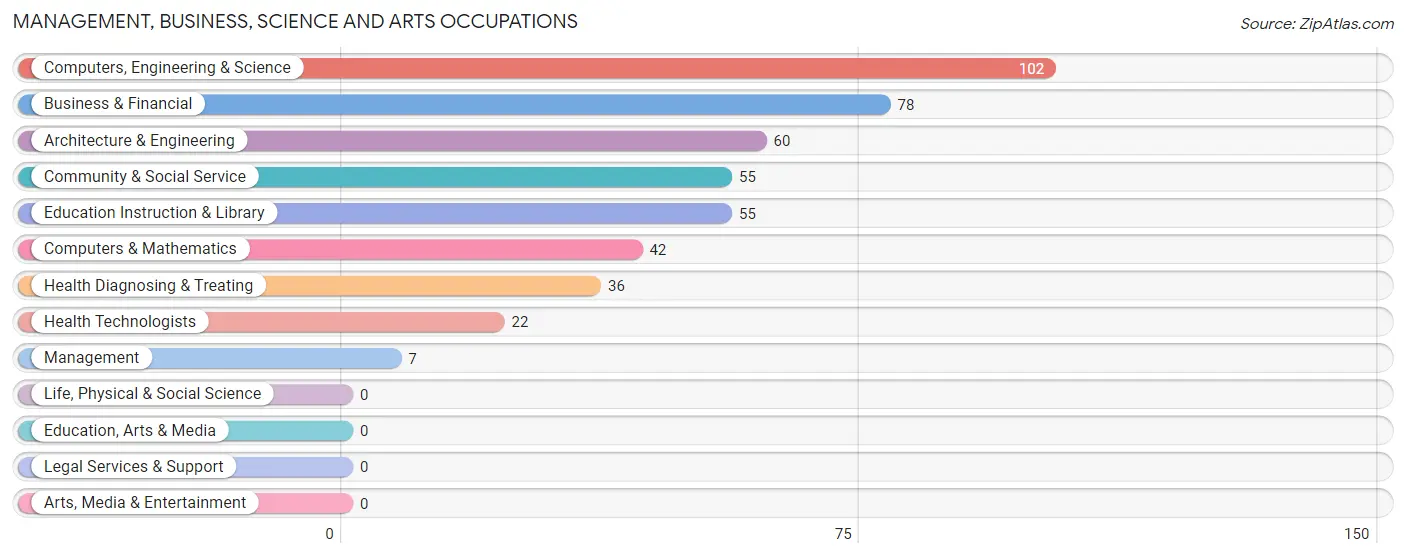
Management, Business, Science and Arts Occupations
The most common Management, Business, Science and Arts occupations in Sun Valley are Computers, Engineering & Science (102 | 8.9%), Business & Financial (78 | 6.8%), Architecture & Engineering (60 | 5.2%), Community & Social Service (55 | 4.8%), and Education Instruction & Library (55 | 4.8%).
Management, Business, Science and Arts Occupations by Sex
Within the Management, Business, Science and Arts occupations in Sun Valley, the most male-oriented occupations are Architecture & Engineering (100.0%), Computers, Engineering & Science (58.8%), and Community & Social Service (41.8%), while the most female-oriented occupations are Management (100.0%), Computers & Mathematics (100.0%), and Health Diagnosing & Treating (100.0%).
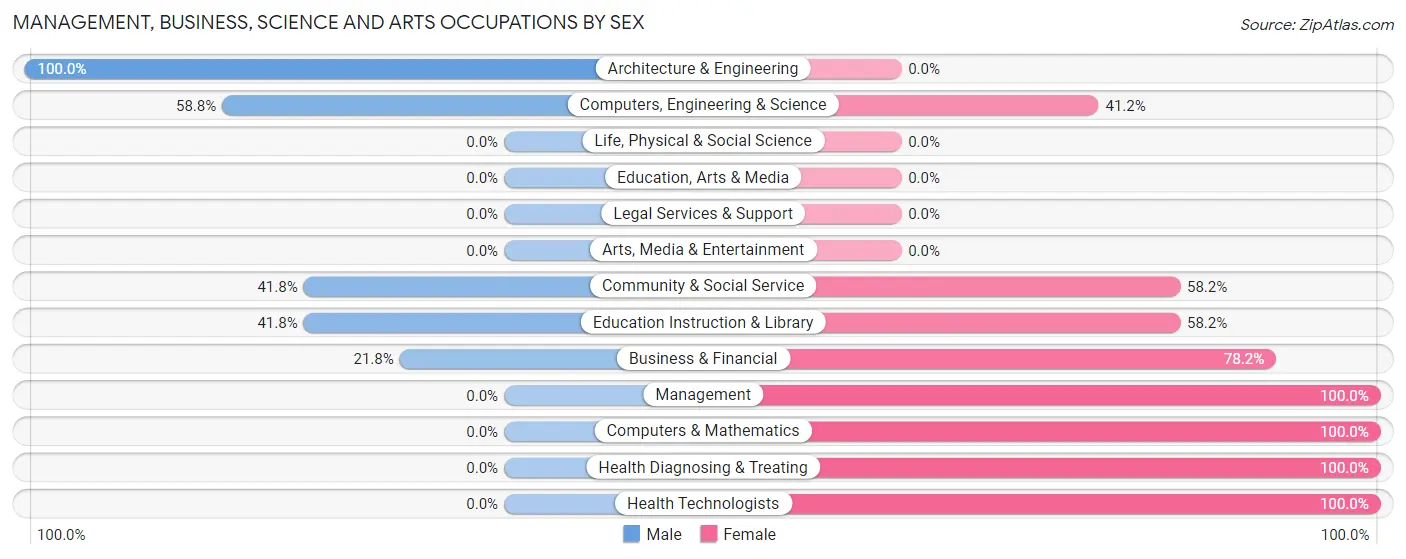
| Occupation | Male | Female |
| Management | 0 (0.0%) | 7 (100.0%) |
| Business & Financial | 17 (21.8%) | 61 (78.2%) |
| Computers, Engineering & Science | 60 (58.8%) | 42 (41.2%) |
| Computers & Mathematics | 0 (0.0%) | 42 (100.0%) |
| Architecture & Engineering | 60 (100.0%) | 0 (0.0%) |
| Life, Physical & Social Science | 0 (0.0%) | 0 (0.0%) |
| Community & Social Service | 23 (41.8%) | 32 (58.2%) |
| Education, Arts & Media | 0 (0.0%) | 0 (0.0%) |
| Legal Services & Support | 0 (0.0%) | 0 (0.0%) |
| Education Instruction & Library | 23 (41.8%) | 32 (58.2%) |
| Arts, Media & Entertainment | 0 (0.0%) | 0 (0.0%) |
| Health Diagnosing & Treating | 0 (0.0%) | 36 (100.0%) |
| Health Technologists | 0 (0.0%) | 22 (100.0%) |
| Total (Category) | 100 (36.0%) | 178 (64.0%) |
| Total (Overall) | 553 (48.2%) | 594 (51.8%) |
Services Occupations
The most common Services occupations in Sun Valley are Personal Care & Service (50 | 4.4%), Healthcare Support (48 | 4.2%), Food Preparation & Serving (45 | 3.9%), Security & Protection (21 | 1.8%), and Firefighting & Prevention (21 | 1.8%).
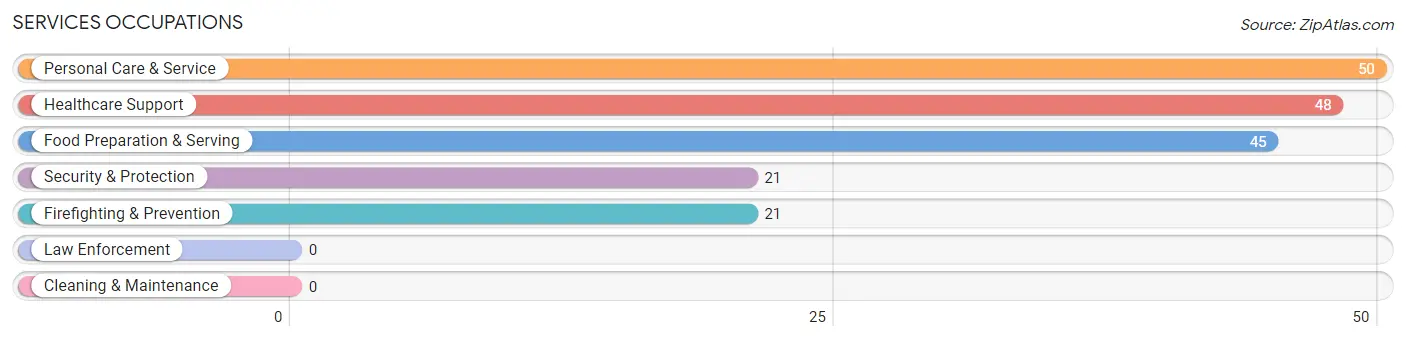
Services Occupations by Sex
Within the Services occupations in Sun Valley, the most male-oriented occupations are Security & Protection (100.0%), Firefighting & Prevention (100.0%), and Food Preparation & Serving (86.7%), while the most female-oriented occupations are Healthcare Support (100.0%), Personal Care & Service (100.0%), and Food Preparation & Serving (13.3%).
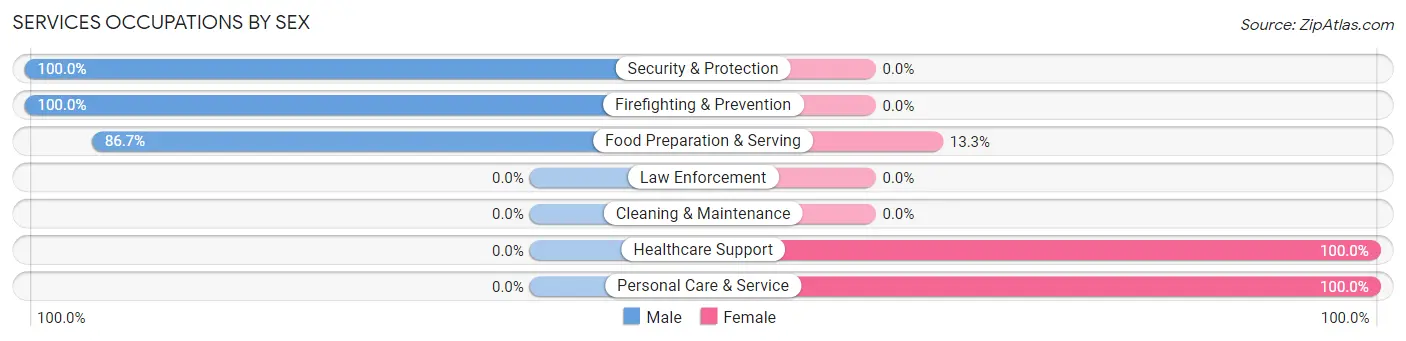
| Occupation | Male | Female |
| Healthcare Support | 0 (0.0%) | 48 (100.0%) |
| Security & Protection | 21 (100.0%) | 0 (0.0%) |
| Firefighting & Prevention | 21 (100.0%) | 0 (0.0%) |
| Law Enforcement | 0 (0.0%) | 0 (0.0%) |
| Food Preparation & Serving | 39 (86.7%) | 6 (13.3%) |
| Cleaning & Maintenance | 0 (0.0%) | 0 (0.0%) |
| Personal Care & Service | 0 (0.0%) | 50 (100.0%) |
| Total (Category) | 60 (36.6%) | 104 (63.4%) |
| Total (Overall) | 553 (48.2%) | 594 (51.8%) |
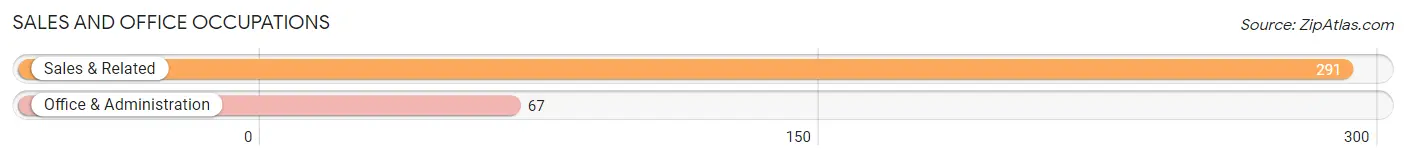
Sales and Office Occupations
The most common Sales and Office occupations in Sun Valley are Sales & Related (291 | 25.4%), and Office & Administration (67 | 5.8%).
Sales and Office Occupations by Sex
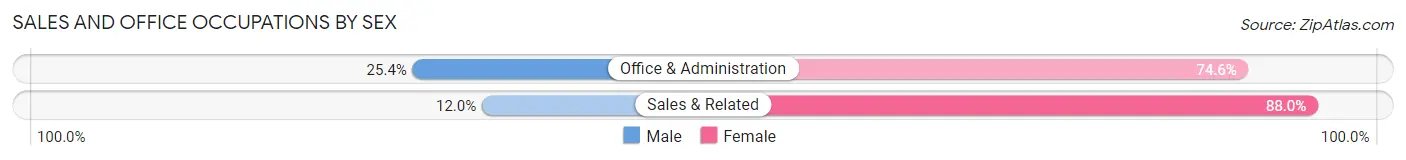
| Occupation | Male | Female |
| Sales & Related | 35 (12.0%) | 256 (88.0%) |
| Office & Administration | 17 (25.4%) | 50 (74.6%) |
| Total (Category) | 52 (14.5%) | 306 (85.5%) |
| Total (Overall) | 553 (48.2%) | 594 (51.8%) |
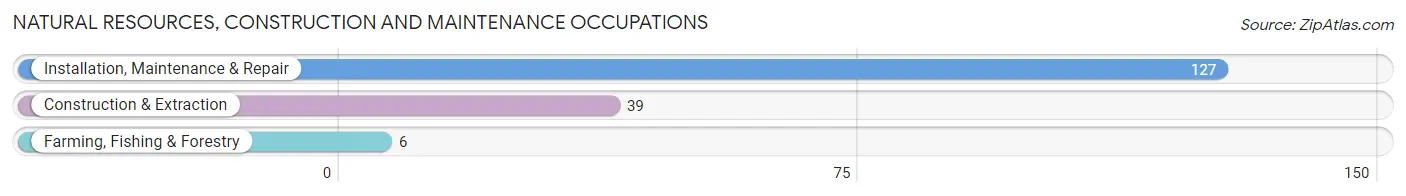
Natural Resources, Construction and Maintenance Occupations
The most common Natural Resources, Construction and Maintenance occupations in Sun Valley are Installation, Maintenance & Repair (127 | 11.1%), Construction & Extraction (39 | 3.4%), and Farming, Fishing & Forestry (6 | 0.5%).
Natural Resources, Construction and Maintenance Occupations by Sex
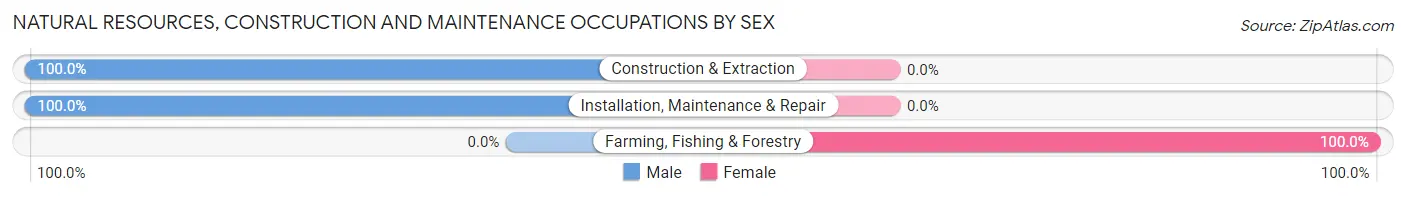
| Occupation | Male | Female |
| Farming, Fishing & Forestry | 0 (0.0%) | 6 (100.0%) |
| Construction & Extraction | 39 (100.0%) | 0 (0.0%) |
| Installation, Maintenance & Repair | 127 (100.0%) | 0 (0.0%) |
| Total (Category) | 166 (96.5%) | 6 (3.5%) |
| Total (Overall) | 553 (48.2%) | 594 (51.8%) |
Production, Transportation and Moving Occupations
The most common Production, Transportation and Moving occupations in Sun Valley are Production (143 | 12.5%), and Transportation (32 | 2.8%).
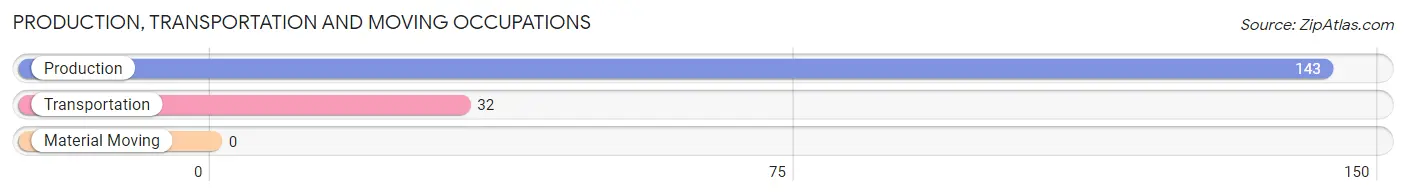
Production, Transportation and Moving Occupations by Sex
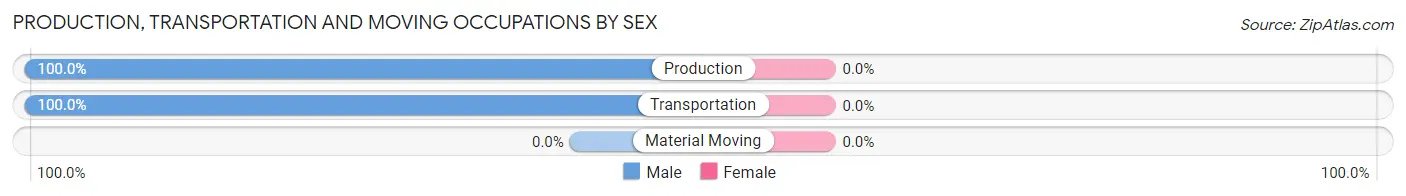
| Occupation | Male | Female |
| Production | 143 (100.0%) | 0 (0.0%) |
| Transportation | 32 (100.0%) | 0 (0.0%) |
| Material Moving | 0 (0.0%) | 0 (0.0%) |
| Total (Category) | 175 (100.0%) | 0 (0.0%) |
| Total (Overall) | 553 (48.2%) | 594 (51.8%) |
Employment Industries by Sex in Sun Valley
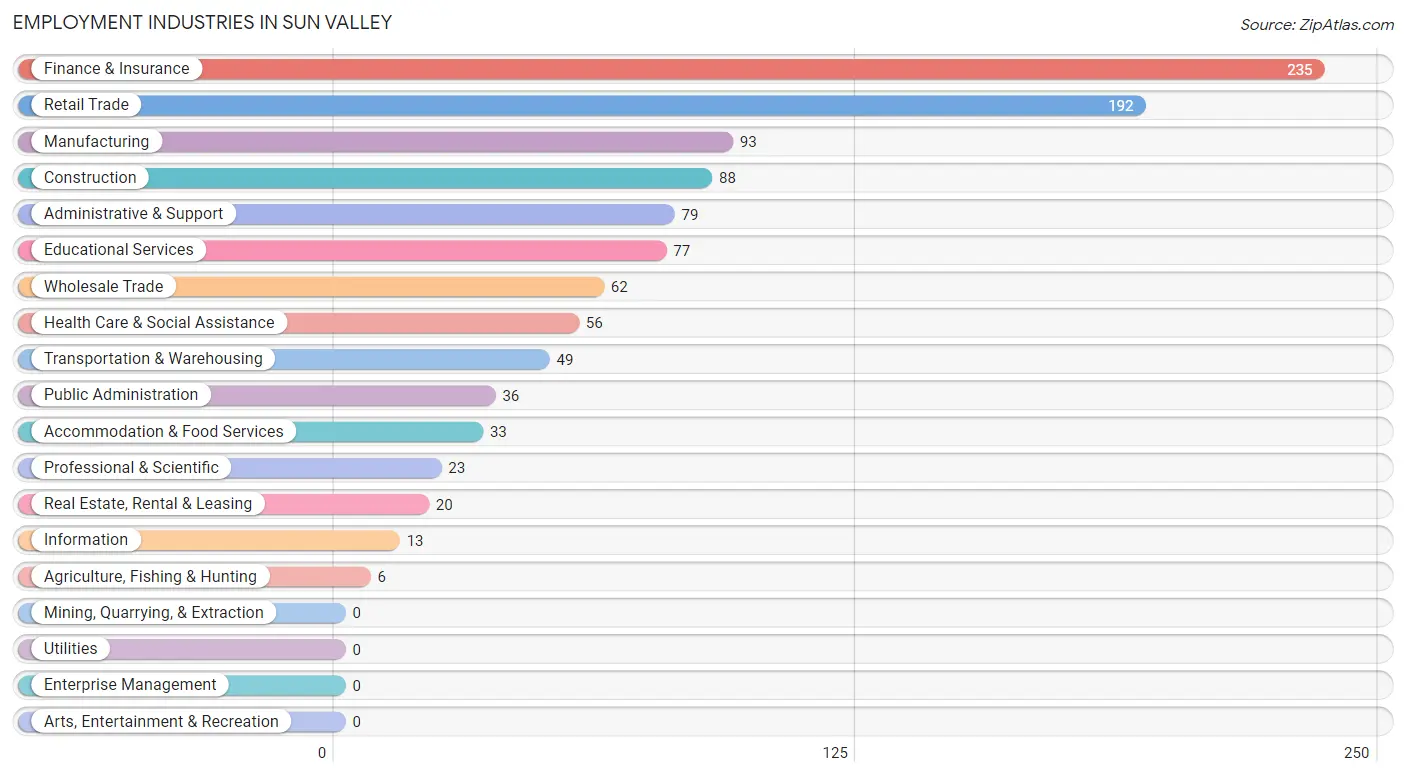
Employment Industries in Sun Valley
The major employment industries in Sun Valley include Finance & Insurance (235 | 20.5%), Retail Trade (192 | 16.7%), Manufacturing (93 | 8.1%), Construction (88 | 7.7%), and Administrative & Support (79 | 6.9%).
Employment Industries by Sex in Sun Valley
The Sun Valley industries that see more men than women are Construction (100.0%), Transportation & Warehousing (100.0%), and Manufacturing (92.5%), whereas the industries that tend to have a higher number of women are Agriculture, Fishing & Hunting (100.0%), Information (100.0%), and Real Estate, Rental & Leasing (100.0%).
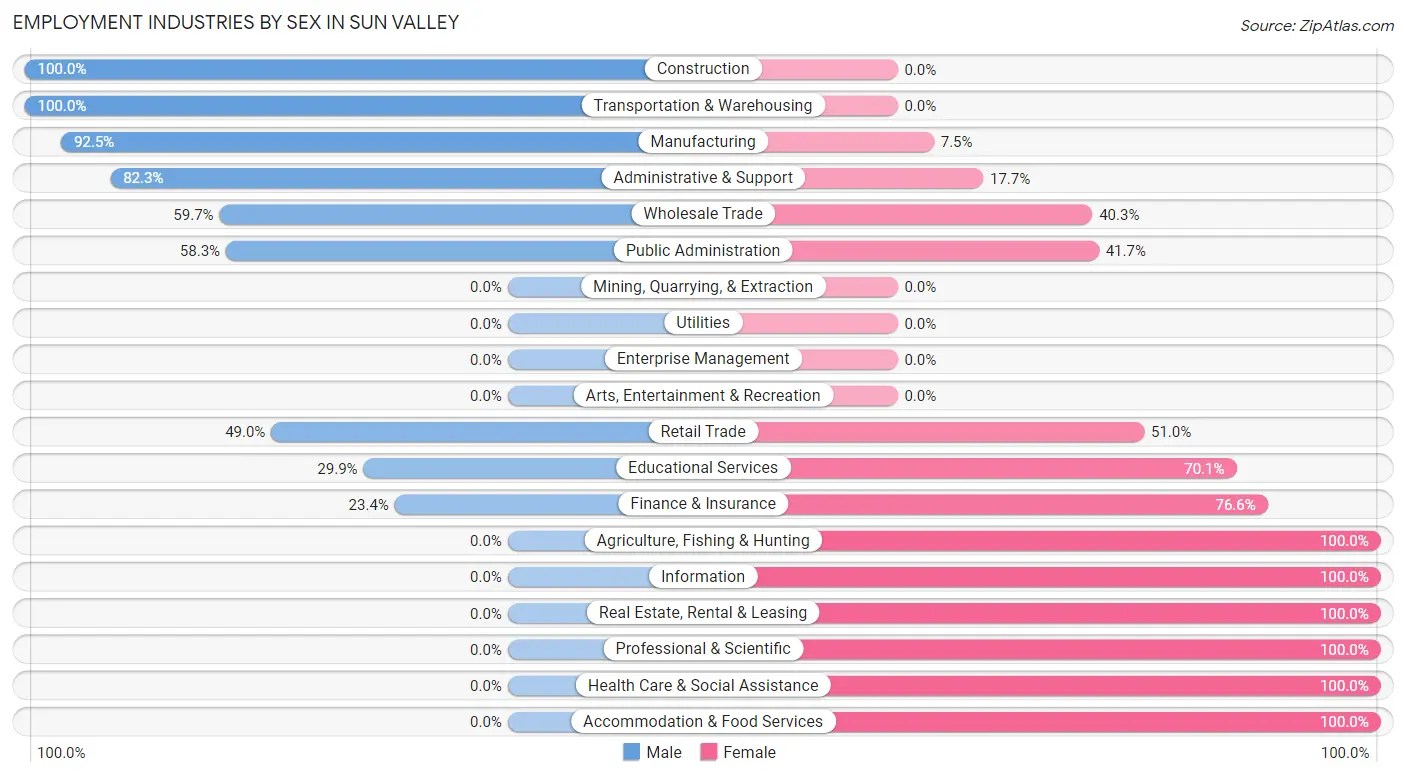
| Industry | Male | Female |
| Agriculture, Fishing & Hunting | 0 (0.0%) | 6 (100.0%) |
| Mining, Quarrying, & Extraction | 0 (0.0%) | 0 (0.0%) |
| Construction | 88 (100.0%) | 0 (0.0%) |
| Manufacturing | 86 (92.5%) | 7 (7.5%) |
| Wholesale Trade | 37 (59.7%) | 25 (40.3%) |
| Retail Trade | 94 (49.0%) | 98 (51.0%) |
| Transportation & Warehousing | 49 (100.0%) | 0 (0.0%) |
| Utilities | 0 (0.0%) | 0 (0.0%) |
| Information | 0 (0.0%) | 13 (100.0%) |
| Finance & Insurance | 55 (23.4%) | 180 (76.6%) |
| Real Estate, Rental & Leasing | 0 (0.0%) | 20 (100.0%) |
| Professional & Scientific | 0 (0.0%) | 23 (100.0%) |
| Enterprise Management | 0 (0.0%) | 0 (0.0%) |
| Administrative & Support | 65 (82.3%) | 14 (17.7%) |
| Educational Services | 23 (29.9%) | 54 (70.1%) |
| Health Care & Social Assistance | 0 (0.0%) | 56 (100.0%) |
| Arts, Entertainment & Recreation | 0 (0.0%) | 0 (0.0%) |
| Accommodation & Food Services | 0 (0.0%) | 33 (100.0%) |
| Public Administration | 21 (58.3%) | 15 (41.7%) |
| Total | 553 (48.2%) | 594 (51.8%) |
Education in Sun Valley
School Enrollment in Sun Valley
The most common levels of schooling among the 353 students in Sun Valley are high school (140 | 39.7%), middle school (78 | 22.1%), and elementary school (67 | 19.0%).
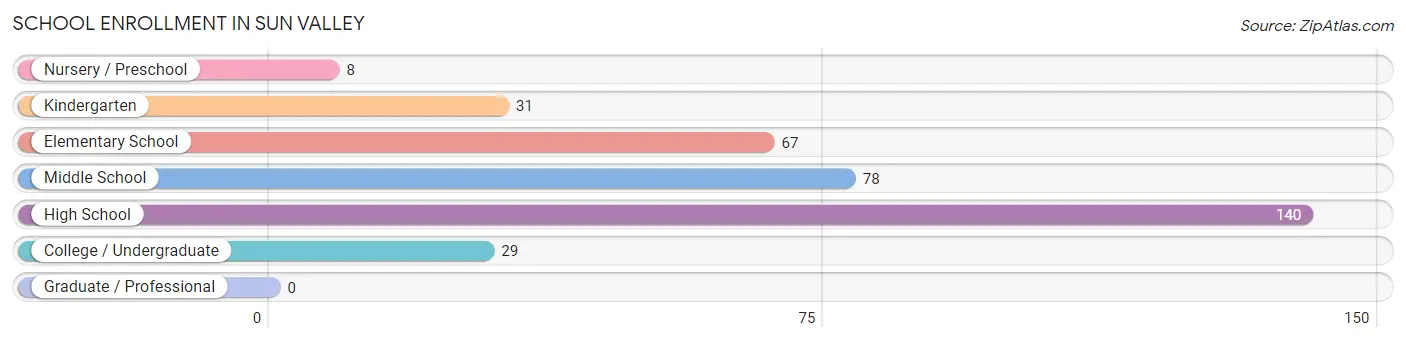
| School Level | # Students | % Students |
| Nursery / Preschool | 8 | 2.3% |
| Kindergarten | 31 | 8.8% |
| Elementary School | 67 | 19.0% |
| Middle School | 78 | 22.1% |
| High School | 140 | 39.7% |
| College / Undergraduate | 29 | 8.2% |
| Graduate / Professional | 0 | 0.0% |
| Total | 353 | 100.0% |
School Enrollment by Age by Funding Source in Sun Valley

| Age Bracket | Public School | Private School |
| 3 to 4 Year Olds | 0 (0.0%) | 0 (0.0%) |
| 5 to 9 Year Old | 99 (100.0%) | 0 (0.0%) |
| 10 to 14 Year Olds | 85 (100.0%) | 0 (0.0%) |
| 15 to 17 Year Olds | 106 (100.0%) | 0 (0.0%) |
| 18 to 19 Year Olds | 34 (100.0%) | 0 (0.0%) |
| 20 to 24 Year Olds | 29 (100.0%) | 0 (0.0%) |
| 25 to 34 Year Olds | 0 (0.0%) | 0 (0.0%) |
| 35 Years and over | 0 (0.0%) | 0 (0.0%) |
| Total | 353 (100.0%) | 0 (0.0%) |
Educational Attainment by Field of Study in Sun Valley
Business (161 | 36.3%), communications (67 | 15.1%), education (39 | 8.8%), psychology (38 | 8.6%), and engineering (37 | 8.3%) are the most common fields of study among 444 individuals in Sun Valley who have obtained a bachelor's degree or higher.
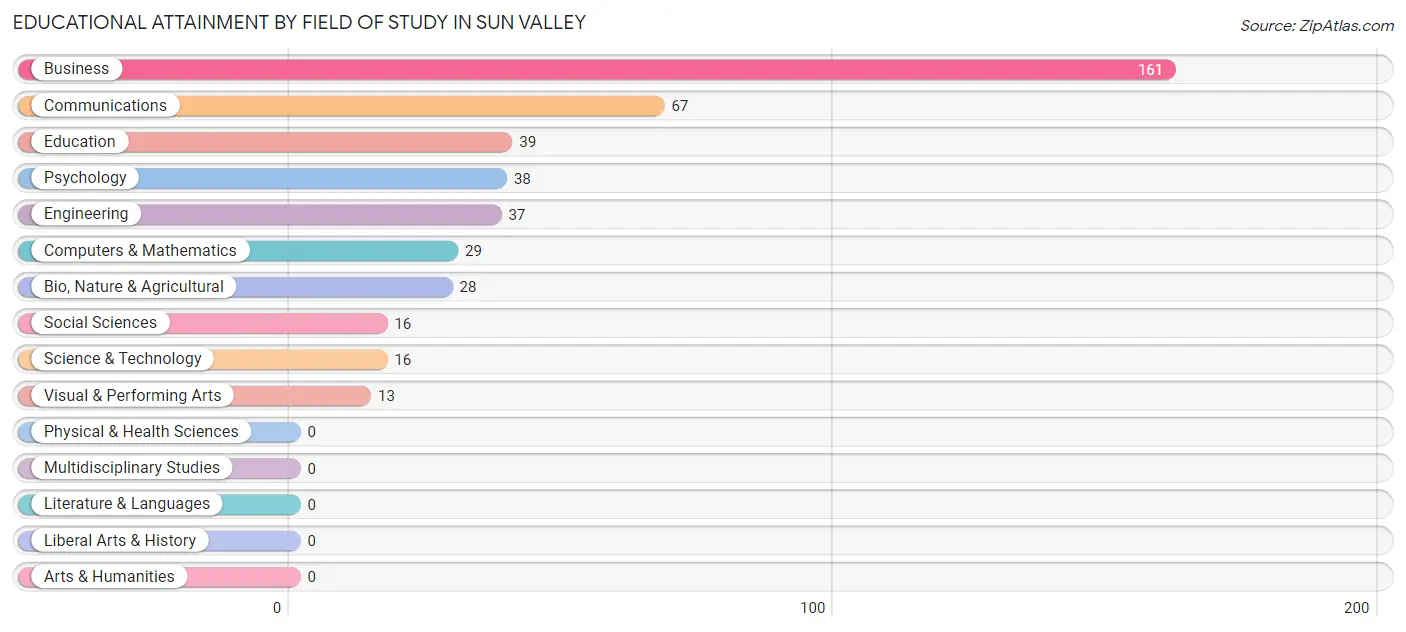
| Field of Study | # Graduates | % Graduates |
| Computers & Mathematics | 29 | 6.5% |
| Bio, Nature & Agricultural | 28 | 6.3% |
| Physical & Health Sciences | 0 | 0.0% |
| Psychology | 38 | 8.6% |
| Social Sciences | 16 | 3.6% |
| Engineering | 37 | 8.3% |
| Multidisciplinary Studies | 0 | 0.0% |
| Science & Technology | 16 | 3.6% |
| Business | 161 | 36.3% |
| Education | 39 | 8.8% |
| Literature & Languages | 0 | 0.0% |
| Liberal Arts & History | 0 | 0.0% |
| Visual & Performing Arts | 13 | 2.9% |
| Communications | 67 | 15.1% |
| Arts & Humanities | 0 | 0.0% |
| Total | 444 | 100.0% |
Transportation & Commute in Sun Valley
Vehicle Availability by Sex in Sun Valley
The most prevalent vehicle ownership categories in Sun Valley are males with 2 vehicles (161, accounting for 29.1%) and females with 2 vehicles (279, making up 28.1%).
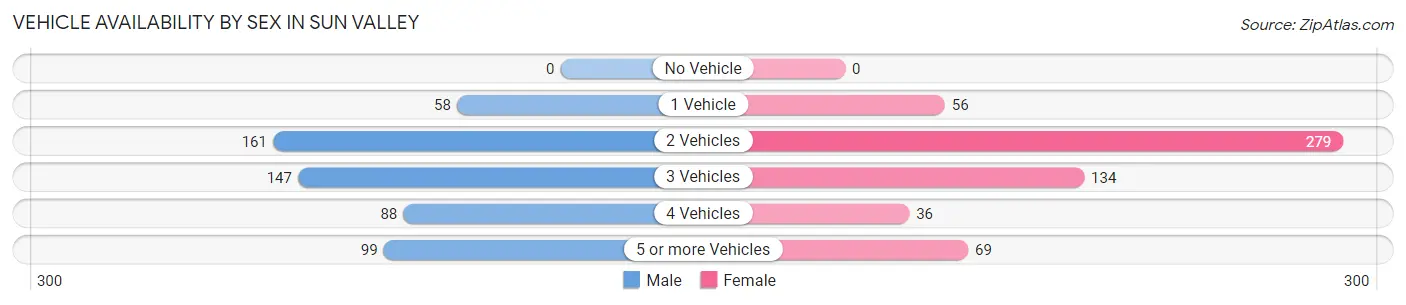
| Vehicles Available | Male | Female |
| No Vehicle | 0 (0.0%) | 0 (0.0%) |
| 1 Vehicle | 58 (10.5%) | 56 (9.8%) |
| 2 Vehicles | 161 (29.1%) | 279 (48.6%) |
| 3 Vehicles | 147 (26.6%) | 134 (23.3%) |
| 4 Vehicles | 88 (15.9%) | 36 (6.3%) |
| 5 or more Vehicles | 99 (17.9%) | 69 (12.0%) |
| Total | 553 (100.0%) | 574 (100.0%) |
Commute Time in Sun Valley
The most frequently occuring commute durations in Sun Valley are 45 to 59 minutes (214 commuters, 21.0%), 30 to 34 minutes (176 commuters, 17.3%), and 20 to 24 minutes (153 commuters, 15.0%).
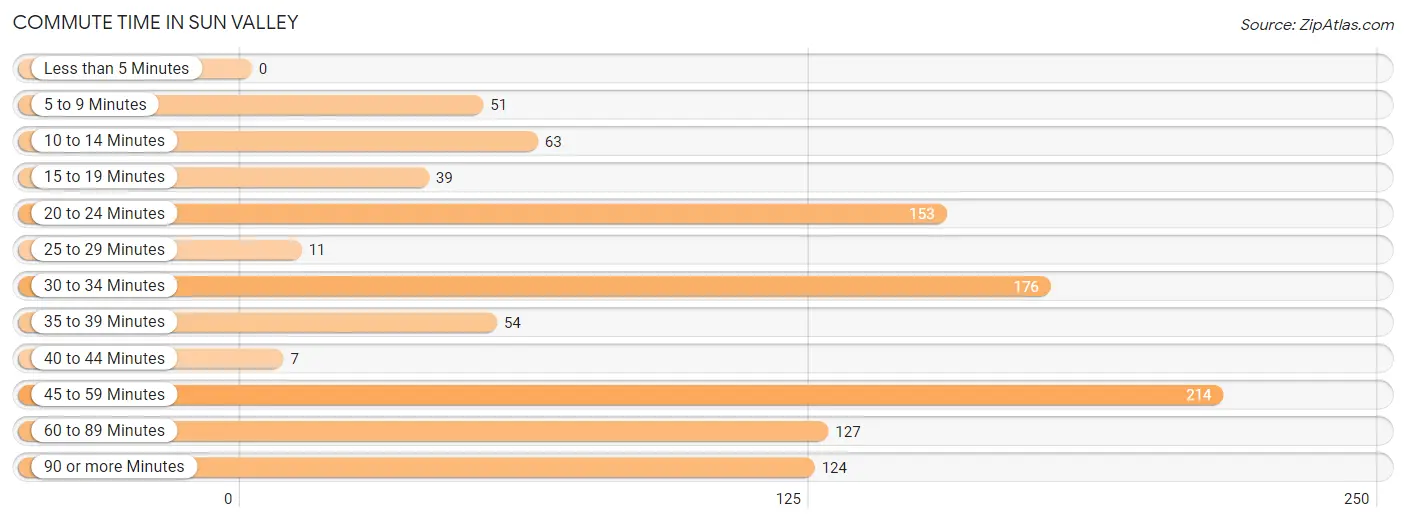
| Commute Time | # Commuters | % Commuters |
| Less than 5 Minutes | 0 | 0.0% |
| 5 to 9 Minutes | 51 | 5.0% |
| 10 to 14 Minutes | 63 | 6.2% |
| 15 to 19 Minutes | 39 | 3.8% |
| 20 to 24 Minutes | 153 | 15.0% |
| 25 to 29 Minutes | 11 | 1.1% |
| 30 to 34 Minutes | 176 | 17.3% |
| 35 to 39 Minutes | 54 | 5.3% |
| 40 to 44 Minutes | 7 | 0.7% |
| 45 to 59 Minutes | 214 | 21.0% |
| 60 to 89 Minutes | 127 | 12.5% |
| 90 or more Minutes | 124 | 12.2% |
Commute Time by Sex in Sun Valley
The most common commute times in Sun Valley are 30 to 34 minutes (99 commuters, 19.5%) for males and 20 to 24 minutes (132 commuters, 25.9%) for females.
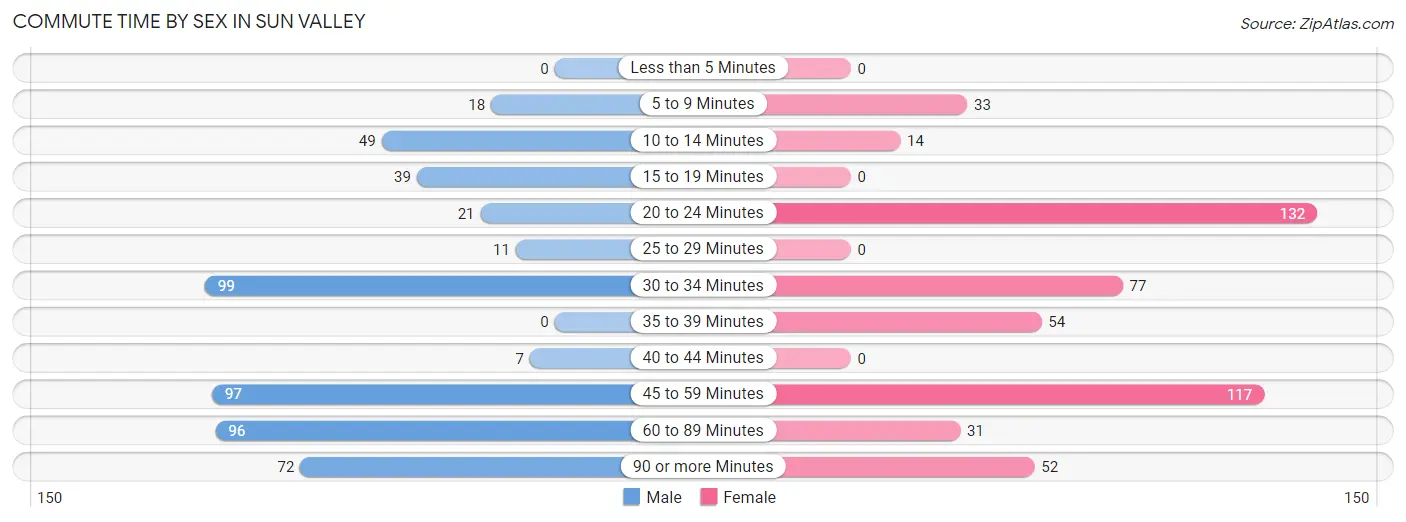
| Commute Time | Male | Female |
| Less than 5 Minutes | 0 (0.0%) | 0 (0.0%) |
| 5 to 9 Minutes | 18 (3.5%) | 33 (6.5%) |
| 10 to 14 Minutes | 49 (9.6%) | 14 (2.8%) |
| 15 to 19 Minutes | 39 (7.7%) | 0 (0.0%) |
| 20 to 24 Minutes | 21 (4.1%) | 132 (25.9%) |
| 25 to 29 Minutes | 11 (2.2%) | 0 (0.0%) |
| 30 to 34 Minutes | 99 (19.5%) | 77 (15.1%) |
| 35 to 39 Minutes | 0 (0.0%) | 54 (10.6%) |
| 40 to 44 Minutes | 7 (1.4%) | 0 (0.0%) |
| 45 to 59 Minutes | 97 (19.1%) | 117 (22.9%) |
| 60 to 89 Minutes | 96 (18.9%) | 31 (6.1%) |
| 90 or more Minutes | 72 (14.1%) | 52 (10.2%) |
Time of Departure to Work by Sex in Sun Valley
The most frequent times of departure to work in Sun Valley are 6:00 AM to 6:29 AM (119, 23.4%) for males and 8:00 AM to 8:29 AM (197, 38.6%) for females.
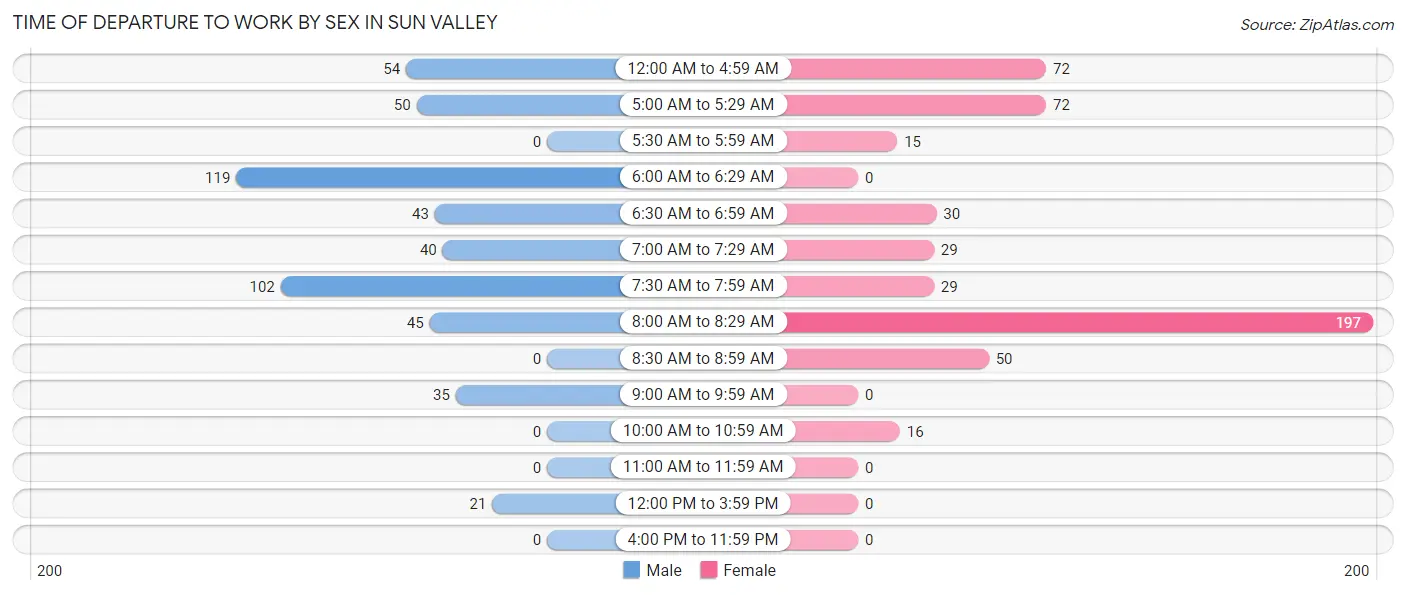
| Time of Departure | Male | Female |
| 12:00 AM to 4:59 AM | 54 (10.6%) | 72 (14.1%) |
| 5:00 AM to 5:29 AM | 50 (9.8%) | 72 (14.1%) |
| 5:30 AM to 5:59 AM | 0 (0.0%) | 15 (2.9%) |
| 6:00 AM to 6:29 AM | 119 (23.4%) | 0 (0.0%) |
| 6:30 AM to 6:59 AM | 43 (8.5%) | 30 (5.9%) |
| 7:00 AM to 7:29 AM | 40 (7.9%) | 29 (5.7%) |
| 7:30 AM to 7:59 AM | 102 (20.0%) | 29 (5.7%) |
| 8:00 AM to 8:29 AM | 45 (8.8%) | 197 (38.6%) |
| 8:30 AM to 8:59 AM | 0 (0.0%) | 50 (9.8%) |
| 9:00 AM to 9:59 AM | 35 (6.9%) | 0 (0.0%) |
| 10:00 AM to 10:59 AM | 0 (0.0%) | 16 (3.1%) |
| 11:00 AM to 11:59 AM | 0 (0.0%) | 0 (0.0%) |
| 12:00 PM to 3:59 PM | 21 (4.1%) | 0 (0.0%) |
| 4:00 PM to 11:59 PM | 0 (0.0%) | 0 (0.0%) |
| Total | 509 (100.0%) | 510 (100.0%) |
Housing Occupancy in Sun Valley
Occupancy by Ownership in Sun Valley
Of the total 939 dwellings in Sun Valley, owner-occupied units account for 904 (96.3%), while renter-occupied units make up 35 (3.7%).
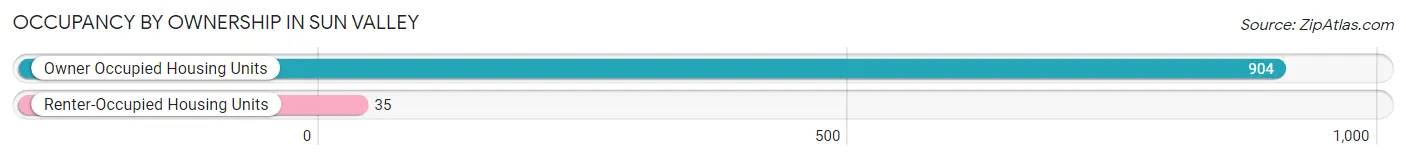
| Occupancy | # Housing Units | % Housing Units |
| Owner Occupied Housing Units | 904 | 96.3% |
| Renter-Occupied Housing Units | 35 | 3.7% |
| Total Occupied Housing Units | 939 | 100.0% |
Occupancy by Household Size in Sun Valley
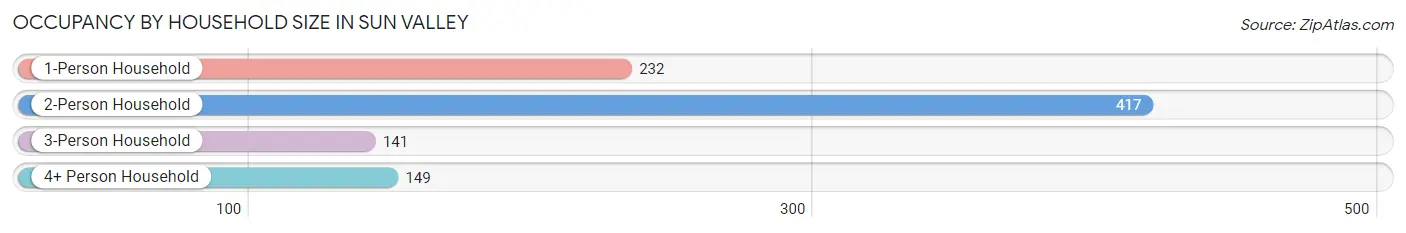
| Household Size | # Housing Units | % Housing Units |
| 1-Person Household | 232 | 24.7% |
| 2-Person Household | 417 | 44.4% |
| 3-Person Household | 141 | 15.0% |
| 4+ Person Household | 149 | 15.9% |
| Total Housing Units | 939 | 100.0% |
Occupancy by Ownership by Household Size in Sun Valley
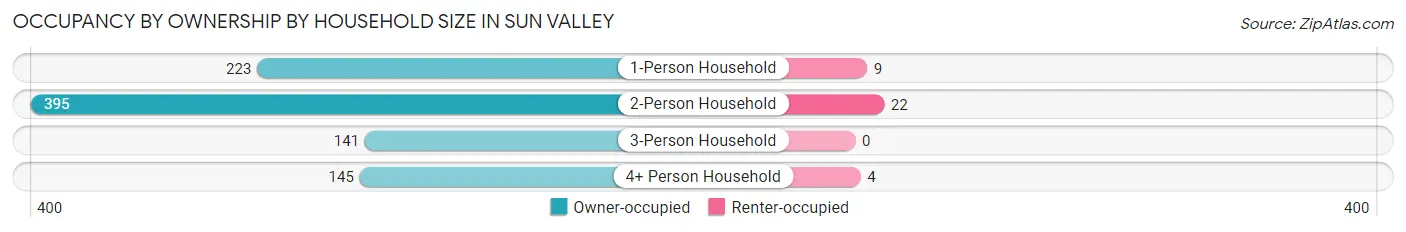
| Household Size | Owner-occupied | Renter-occupied |
| 1-Person Household | 223 (96.1%) | 9 (3.9%) |
| 2-Person Household | 395 (94.7%) | 22 (5.3%) |
| 3-Person Household | 141 (100.0%) | 0 (0.0%) |
| 4+ Person Household | 145 (97.3%) | 4 (2.7%) |
| Total Housing Units | 904 (96.3%) | 35 (3.7%) |
Occupancy by Educational Attainment in Sun Valley
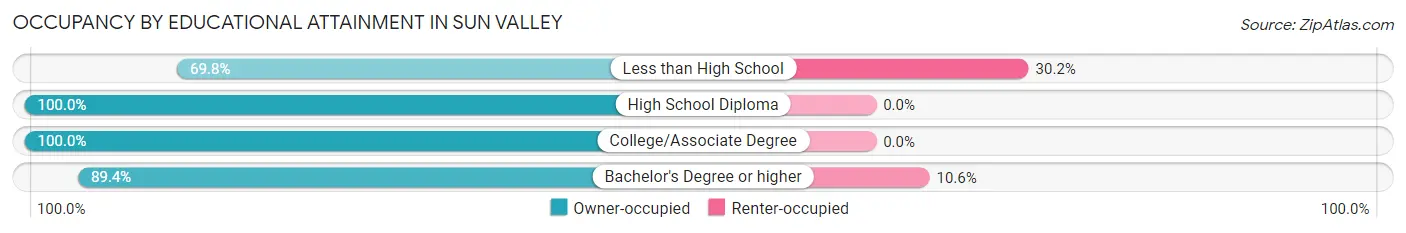
| Household Size | Owner-occupied | Renter-occupied |
| Less than High School | 30 (69.8%) | 13 (30.2%) |
| High School Diploma | 199 (100.0%) | 0 (0.0%) |
| College/Associate Degree | 489 (100.0%) | 0 (0.0%) |
| Bachelor's Degree or higher | 186 (89.4%) | 22 (10.6%) |
Occupancy by Age of Householder in Sun Valley
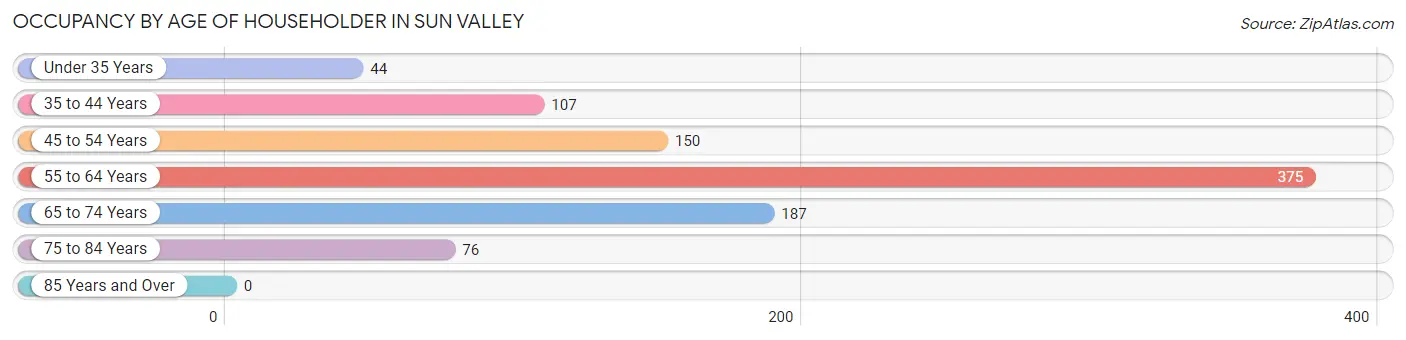
| Age Bracket | # Households | % Households |
| Under 35 Years | 44 | 4.7% |
| 35 to 44 Years | 107 | 11.4% |
| 45 to 54 Years | 150 | 16.0% |
| 55 to 64 Years | 375 | 39.9% |
| 65 to 74 Years | 187 | 19.9% |
| 75 to 84 Years | 76 | 8.1% |
| 85 Years and Over | 0 | 0.0% |
| Total | 939 | 100.0% |
Housing Finances in Sun Valley
Median Income by Occupancy in Sun Valley
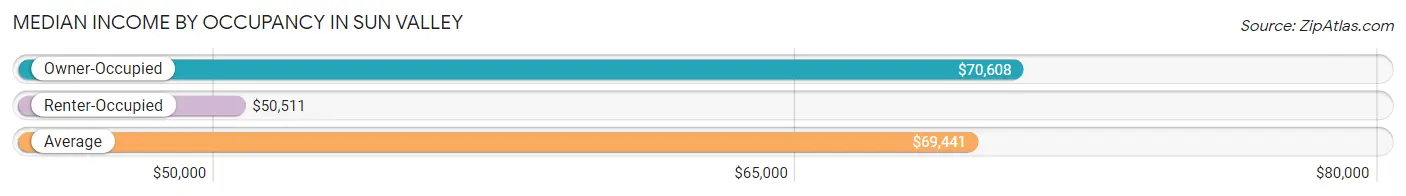
| Occupancy Type | # Households | Median Income |
| Owner-Occupied | 904 (96.3%) | $70,608 |
| Renter-Occupied | 35 (3.7%) | $50,511 |
| Average | 939 (100.0%) | $69,441 |
Occupancy by Householder Income Bracket in Sun Valley
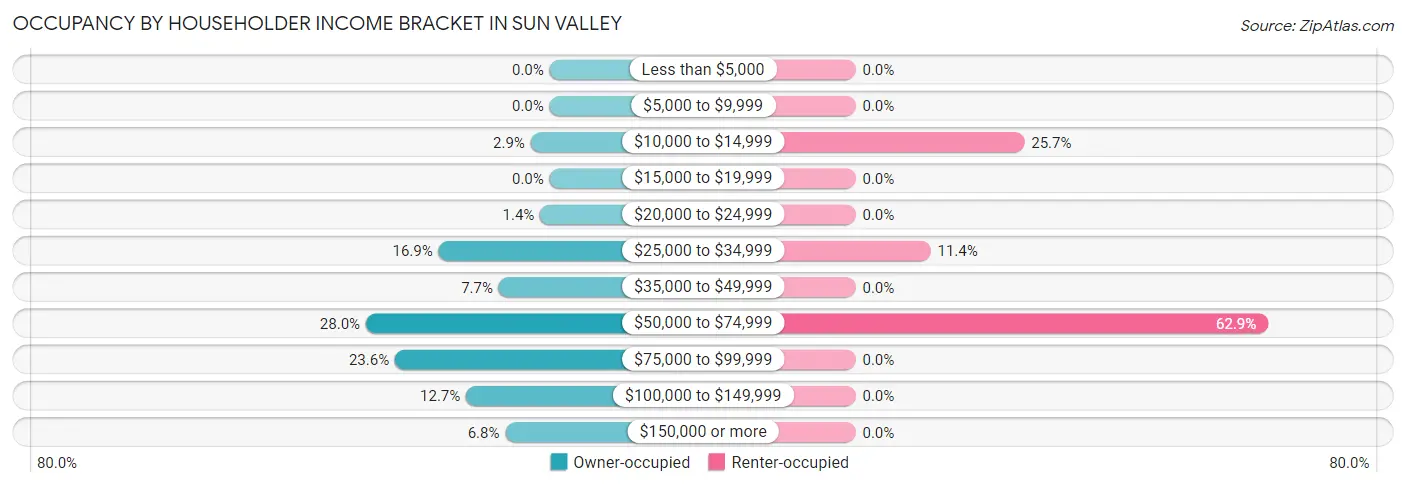
| Income Bracket | Owner-occupied | Renter-occupied |
| Less than $5,000 | 0 (0.0%) | 0 (0.0%) |
| $5,000 to $9,999 | 0 (0.0%) | 0 (0.0%) |
| $10,000 to $14,999 | 26 (2.9%) | 9 (25.7%) |
| $15,000 to $19,999 | 0 (0.0%) | 0 (0.0%) |
| $20,000 to $24,999 | 13 (1.4%) | 0 (0.0%) |
| $25,000 to $34,999 | 153 (16.9%) | 4 (11.4%) |
| $35,000 to $49,999 | 70 (7.7%) | 0 (0.0%) |
| $50,000 to $74,999 | 253 (28.0%) | 22 (62.9%) |
| $75,000 to $99,999 | 213 (23.6%) | 0 (0.0%) |
| $100,000 to $149,999 | 115 (12.7%) | 0 (0.0%) |
| $150,000 or more | 61 (6.8%) | 0 (0.0%) |
| Total | 904 (100.0%) | 35 (100.0%) |
Monthly Housing Cost Tiers in Sun Valley
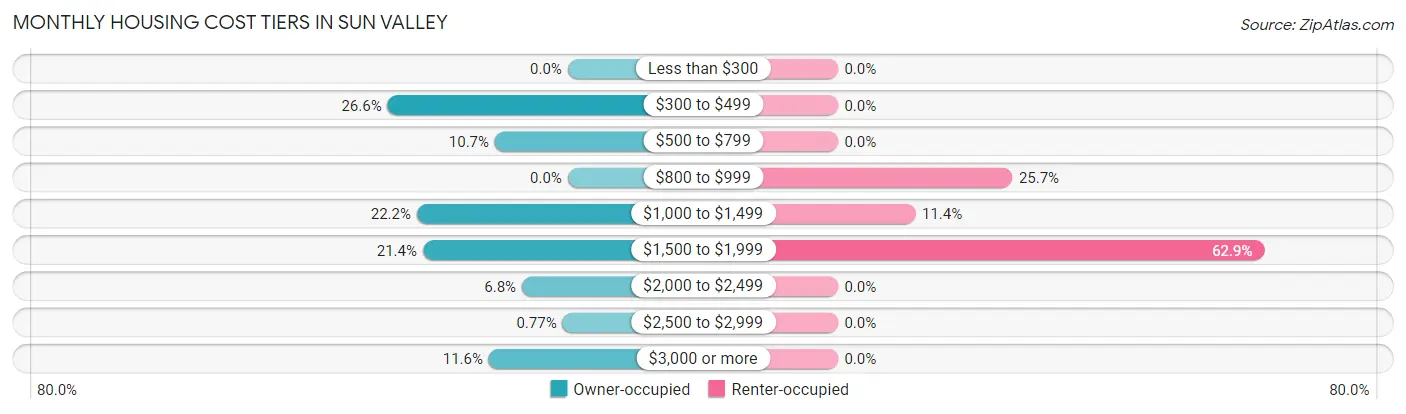
| Monthly Cost | Owner-occupied | Renter-occupied |
| Less than $300 | 0 (0.0%) | 0 (0.0%) |
| $300 to $499 | 240 (26.6%) | 0 (0.0%) |
| $500 to $799 | 97 (10.7%) | 0 (0.0%) |
| $800 to $999 | 0 (0.0%) | 9 (25.7%) |
| $1,000 to $1,499 | 201 (22.2%) | 4 (11.4%) |
| $1,500 to $1,999 | 193 (21.3%) | 22 (62.9%) |
| $2,000 to $2,499 | 61 (6.8%) | 0 (0.0%) |
| $2,500 to $2,999 | 7 (0.8%) | 0 (0.0%) |
| $3,000 or more | 105 (11.6%) | 0 (0.0%) |
| Total | 904 (100.0%) | 35 (100.0%) |
Physical Housing Characteristics in Sun Valley
Housing Structures in Sun Valley
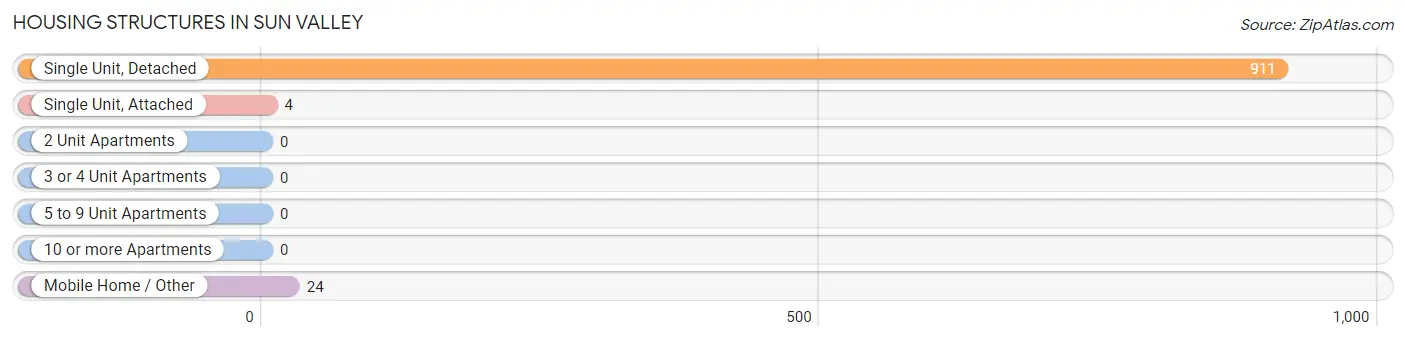
| Structure Type | # Housing Units | % Housing Units |
| Single Unit, Detached | 911 | 97.0% |
| Single Unit, Attached | 4 | 0.4% |
| 2 Unit Apartments | 0 | 0.0% |
| 3 or 4 Unit Apartments | 0 | 0.0% |
| 5 to 9 Unit Apartments | 0 | 0.0% |
| 10 or more Apartments | 0 | 0.0% |
| Mobile Home / Other | 24 | 2.6% |
| Total | 939 | 100.0% |
Housing Structures by Occupancy in Sun Valley
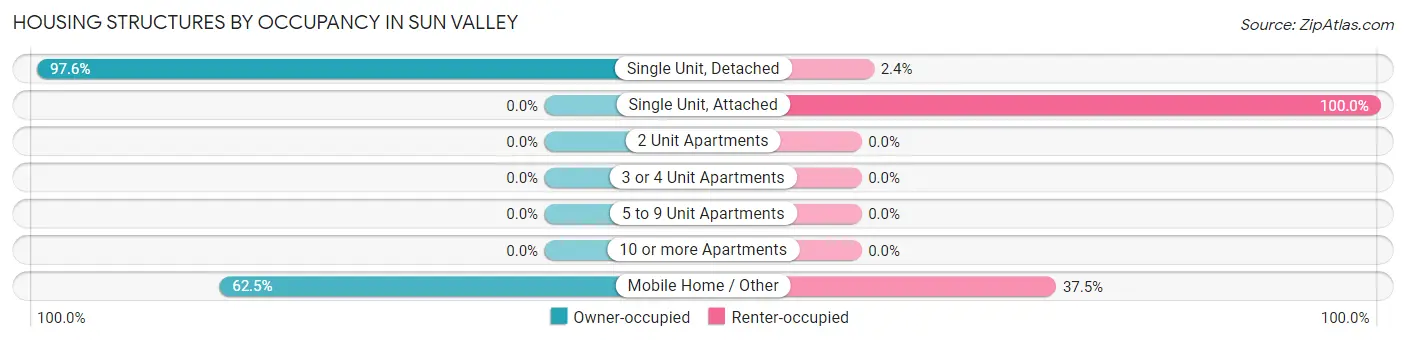
| Structure Type | Owner-occupied | Renter-occupied |
| Single Unit, Detached | 889 (97.6%) | 22 (2.4%) |
| Single Unit, Attached | 0 (0.0%) | 4 (100.0%) |
| 2 Unit Apartments | 0 (0.0%) | 0 (0.0%) |
| 3 or 4 Unit Apartments | 0 (0.0%) | 0 (0.0%) |
| 5 to 9 Unit Apartments | 0 (0.0%) | 0 (0.0%) |
| 10 or more Apartments | 0 (0.0%) | 0 (0.0%) |
| Mobile Home / Other | 15 (62.5%) | 9 (37.5%) |
| Total | 904 (96.3%) | 35 (3.7%) |
Housing Structures by Number of Rooms in Sun Valley
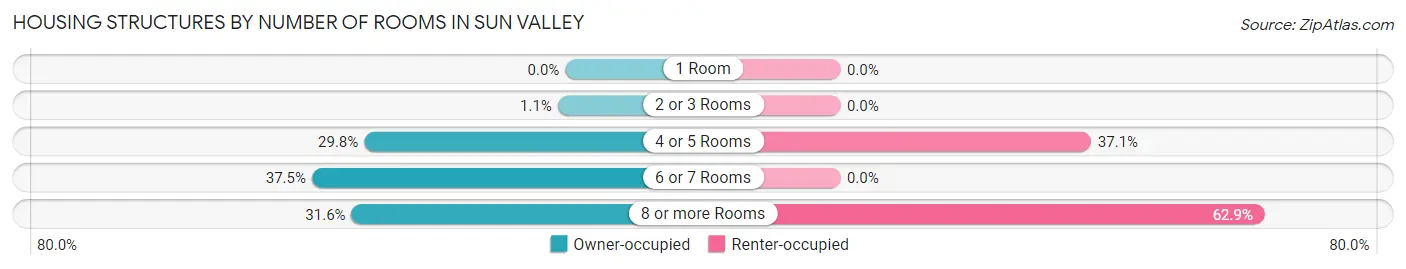
| Number of Rooms | Owner-occupied | Renter-occupied |
| 1 Room | 0 (0.0%) | 0 (0.0%) |
| 2 or 3 Rooms | 10 (1.1%) | 0 (0.0%) |
| 4 or 5 Rooms | 269 (29.8%) | 13 (37.1%) |
| 6 or 7 Rooms | 339 (37.5%) | 0 (0.0%) |
| 8 or more Rooms | 286 (31.6%) | 22 (62.9%) |
| Total | 904 (100.0%) | 35 (100.0%) |
Housing Structure by Heating Type in Sun Valley
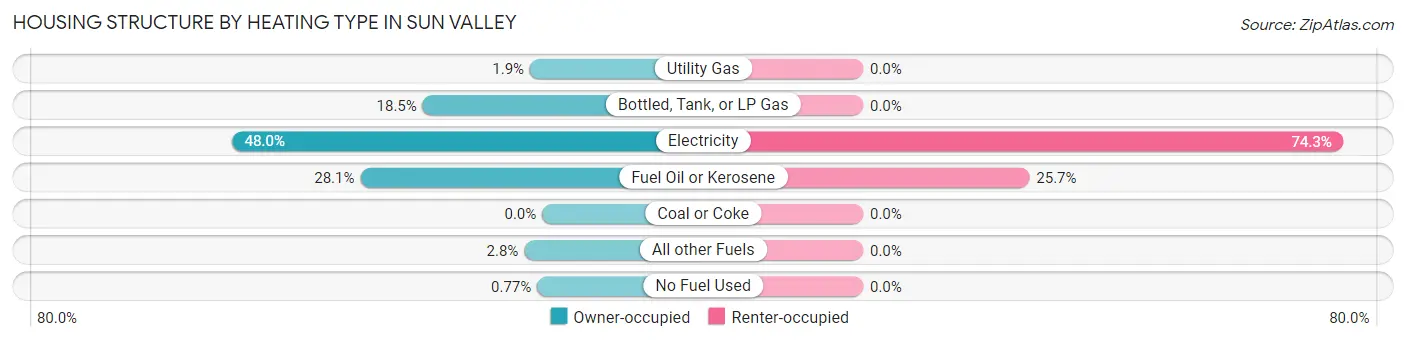
| Heating Type | Owner-occupied | Renter-occupied |
| Utility Gas | 17 (1.9%) | 0 (0.0%) |
| Bottled, Tank, or LP Gas | 167 (18.5%) | 0 (0.0%) |
| Electricity | 434 (48.0%) | 26 (74.3%) |
| Fuel Oil or Kerosene | 254 (28.1%) | 9 (25.7%) |
| Coal or Coke | 0 (0.0%) | 0 (0.0%) |
| All other Fuels | 25 (2.8%) | 0 (0.0%) |
| No Fuel Used | 7 (0.8%) | 0 (0.0%) |
| Total | 904 (100.0%) | 35 (100.0%) |
Household Vehicle Usage in Sun Valley
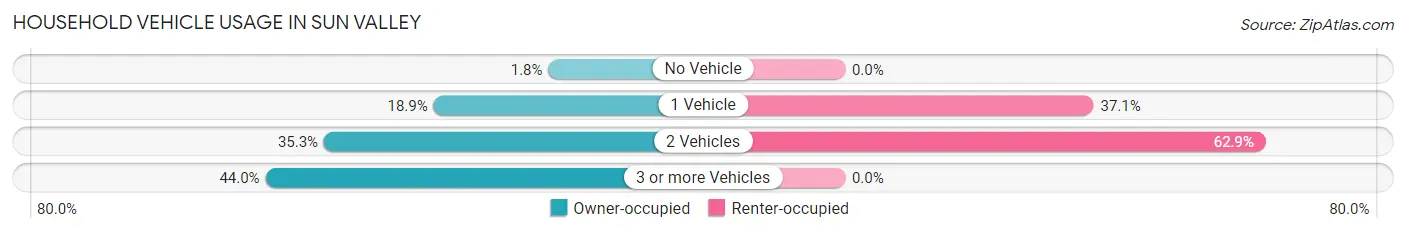
| Vehicles per Household | Owner-occupied | Renter-occupied |
| No Vehicle | 16 (1.8%) | 0 (0.0%) |
| 1 Vehicle | 171 (18.9%) | 13 (37.1%) |
| 2 Vehicles | 319 (35.3%) | 22 (62.9%) |
| 3 or more Vehicles | 398 (44.0%) | 0 (0.0%) |
| Total | 904 (100.0%) | 35 (100.0%) |
Real Estate & Mortgages in Sun Valley
Real Estate and Mortgage Overview in Sun Valley
| Characteristic | Without Mortgage | With Mortgage |
| Housing Units | 260 | 644 |
| Median Property Value | $138,800 | $222,900 |
| Median Household Income | $46,250 | $61 |
| Monthly Housing Costs | $456 | $105 |
| Real Estate Taxes | $2,590 | $0 |
Property Value by Mortgage Status in Sun Valley
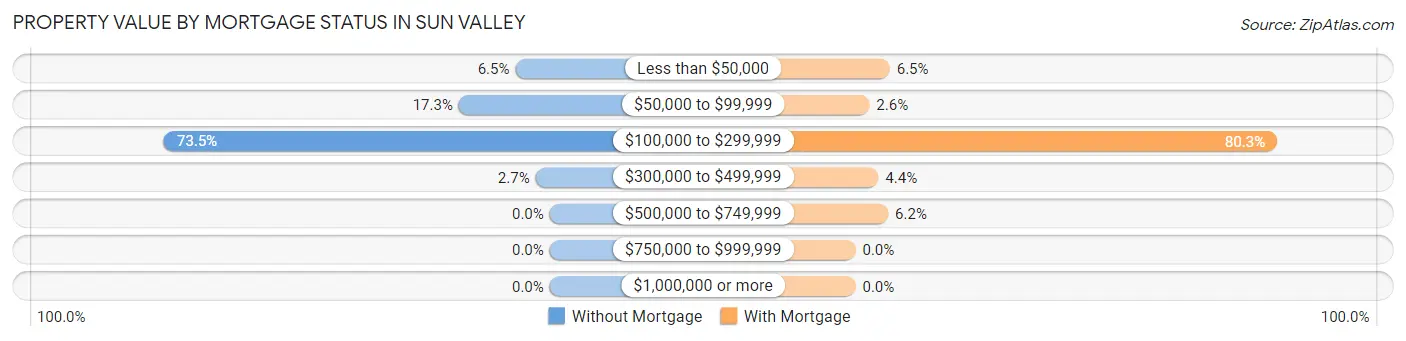
| Property Value | Without Mortgage | With Mortgage |
| Less than $50,000 | 17 (6.5%) | 42 (6.5%) |
| $50,000 to $99,999 | 45 (17.3%) | 17 (2.6%) |
| $100,000 to $299,999 | 191 (73.5%) | 517 (80.3%) |
| $300,000 to $499,999 | 7 (2.7%) | 28 (4.3%) |
| $500,000 to $749,999 | 0 (0.0%) | 40 (6.2%) |
| $750,000 to $999,999 | 0 (0.0%) | 0 (0.0%) |
| $1,000,000 or more | 0 (0.0%) | 0 (0.0%) |
| Total | 260 (100.0%) | 644 (100.0%) |
Household Income by Mortgage Status in Sun Valley
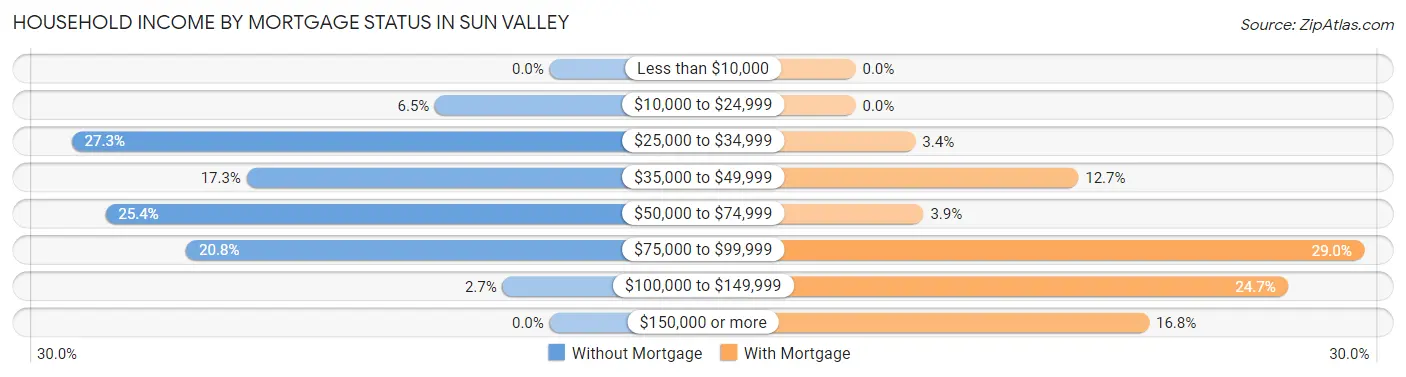
| Household Income | Without Mortgage | With Mortgage |
| Less than $10,000 | 0 (0.0%) | 0 (0.0%) |
| $10,000 to $24,999 | 17 (6.5%) | 0 (0.0%) |
| $25,000 to $34,999 | 71 (27.3%) | 22 (3.4%) |
| $35,000 to $49,999 | 45 (17.3%) | 82 (12.7%) |
| $50,000 to $74,999 | 66 (25.4%) | 25 (3.9%) |
| $75,000 to $99,999 | 54 (20.8%) | 187 (29.0%) |
| $100,000 to $149,999 | 7 (2.7%) | 159 (24.7%) |
| $150,000 or more | 0 (0.0%) | 108 (16.8%) |
| Total | 260 (100.0%) | 644 (100.0%) |
Property Value to Household Income Ratio in Sun Valley
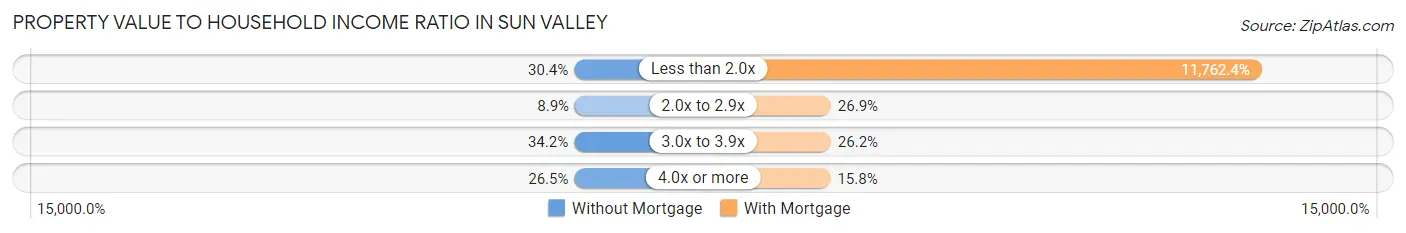
| Value-to-Income Ratio | Without Mortgage | With Mortgage |
| Less than 2.0x | 79 (30.4%) | 75,750 (11,762.4%) |
| 2.0x to 2.9x | 23 (8.8%) | 173 (26.9%) |
| 3.0x to 3.9x | 89 (34.2%) | 169 (26.2%) |
| 4.0x or more | 69 (26.5%) | 102 (15.8%) |
| Total | 260 (100.0%) | 644 (100.0%) |
Real Estate Taxes by Mortgage Status in Sun Valley
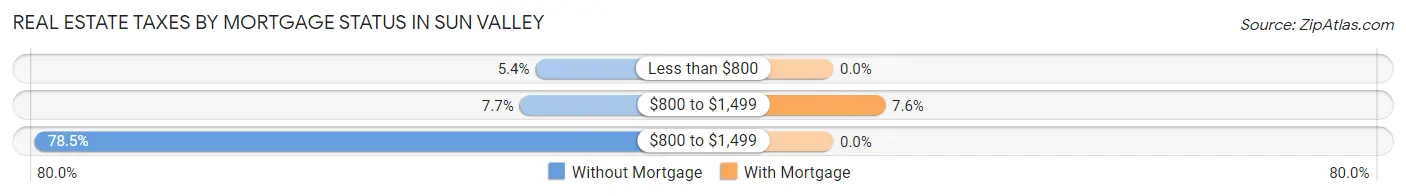
| Property Taxes | Without Mortgage | With Mortgage |
| Less than $800 | 14 (5.4%) | 0 (0.0%) |
| $800 to $1,499 | 20 (7.7%) | 49 (7.6%) |
| $800 to $1,499 | 204 (78.5%) | 0 (0.0%) |
| Total | 260 (100.0%) | 644 (100.0%) |
Health & Disability in Sun Valley
Health Insurance Coverage by Age in Sun Valley
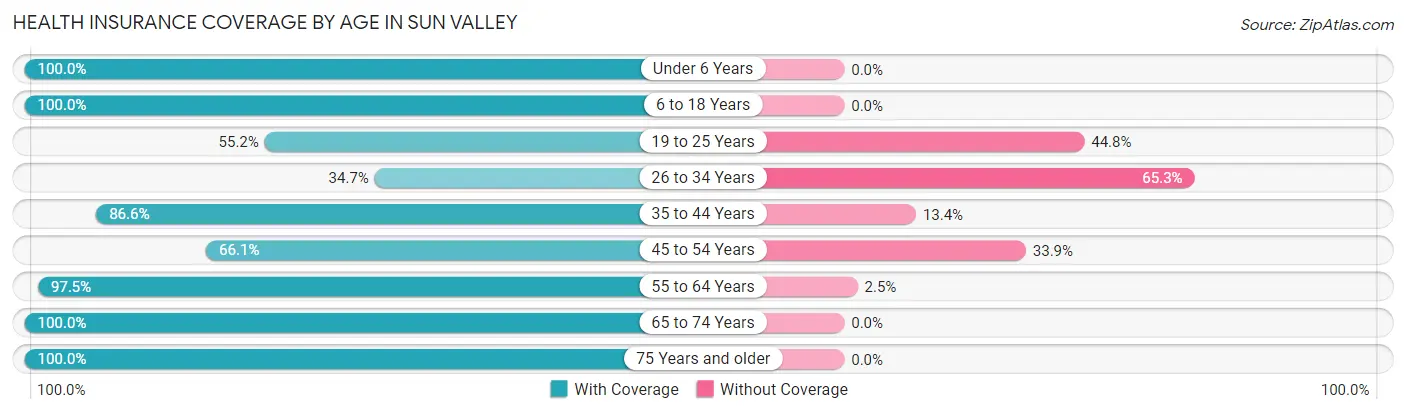
| Age Bracket | With Coverage | Without Coverage |
| Under 6 Years | 141 (100.0%) | 0 (0.0%) |
| 6 to 18 Years | 306 (100.0%) | 0 (0.0%) |
| 19 to 25 Years | 58 (55.2%) | 47 (44.8%) |
| 26 to 34 Years | 25 (34.7%) | 47 (65.3%) |
| 35 to 44 Years | 214 (86.6%) | 33 (13.4%) |
| 45 to 54 Years | 291 (66.1%) | 149 (33.9%) |
| 55 to 64 Years | 512 (97.5%) | 13 (2.5%) |
| 65 to 74 Years | 294 (100.0%) | 0 (0.0%) |
| 75 Years and older | 76 (100.0%) | 0 (0.0%) |
| Total | 1,917 (86.9%) | 289 (13.1%) |
Health Insurance Coverage by Citizenship Status in Sun Valley
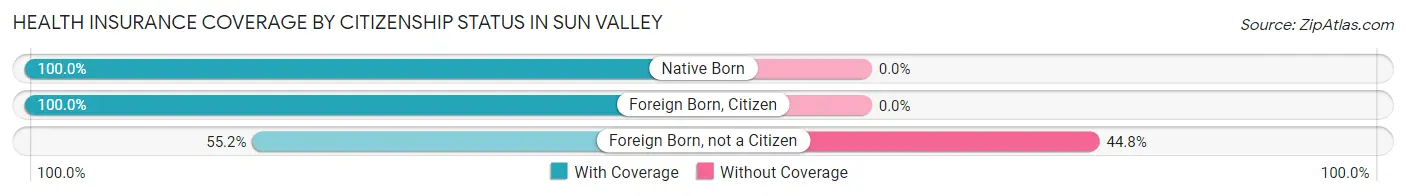
| Citizenship Status | With Coverage | Without Coverage |
| Native Born | 141 (100.0%) | 0 (0.0%) |
| Foreign Born, Citizen | 306 (100.0%) | 0 (0.0%) |
| Foreign Born, not a Citizen | 58 (55.2%) | 47 (44.8%) |
Health Insurance Coverage by Household Income in Sun Valley
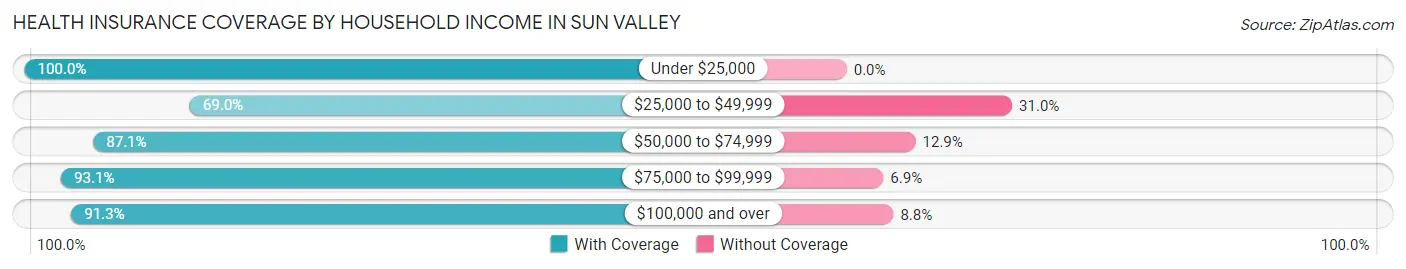
| Household Income | With Coverage | Without Coverage |
| Under $25,000 | 69 (100.0%) | 0 (0.0%) |
| $25,000 to $49,999 | 274 (69.0%) | 123 (31.0%) |
| $50,000 to $74,999 | 527 (87.1%) | 78 (12.9%) |
| $75,000 to $99,999 | 557 (93.1%) | 41 (6.9%) |
| $100,000 and over | 490 (91.2%) | 47 (8.7%) |
Public vs Private Health Insurance Coverage by Age in Sun Valley
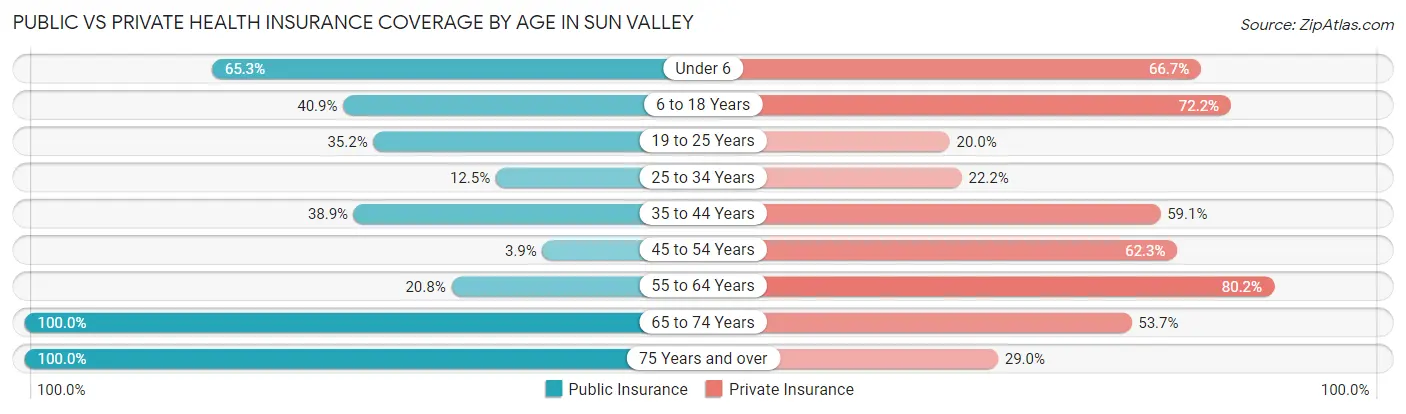
| Age Bracket | Public Insurance | Private Insurance |
| Under 6 | 92 (65.2%) | 94 (66.7%) |
| 6 to 18 Years | 125 (40.8%) | 221 (72.2%) |
| 19 to 25 Years | 37 (35.2%) | 21 (20.0%) |
| 25 to 34 Years | 9 (12.5%) | 16 (22.2%) |
| 35 to 44 Years | 96 (38.9%) | 146 (59.1%) |
| 45 to 54 Years | 17 (3.9%) | 274 (62.3%) |
| 55 to 64 Years | 109 (20.8%) | 421 (80.2%) |
| 65 to 74 Years | 294 (100.0%) | 158 (53.7%) |
| 75 Years and over | 76 (100.0%) | 22 (28.9%) |
| Total | 855 (38.8%) | 1,373 (62.2%) |
Disability Status by Sex by Age in Sun Valley
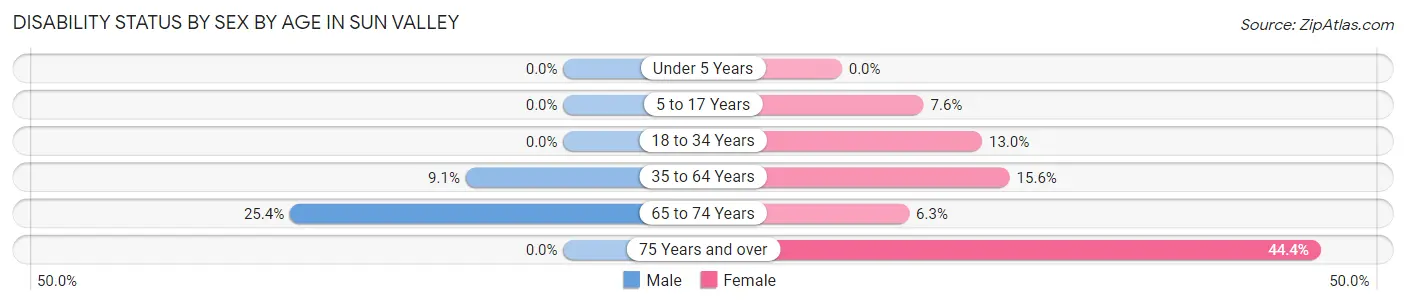
| Age Bracket | Male | Female |
| Under 5 Years | 0 (0.0%) | 0 (0.0%) |
| 5 to 17 Years | 0 (0.0%) | 6 (7.6%) |
| 18 to 34 Years | 0 (0.0%) | 22 (13.0%) |
| 35 to 64 Years | 54 (9.1%) | 96 (15.6%) |
| 65 to 74 Years | 34 (25.4%) | 10 (6.2%) |
| 75 Years and over | 0 (0.0%) | 16 (44.4%) |
Disability Class by Sex by Age in Sun Valley
Disability Class: Hearing Difficulty
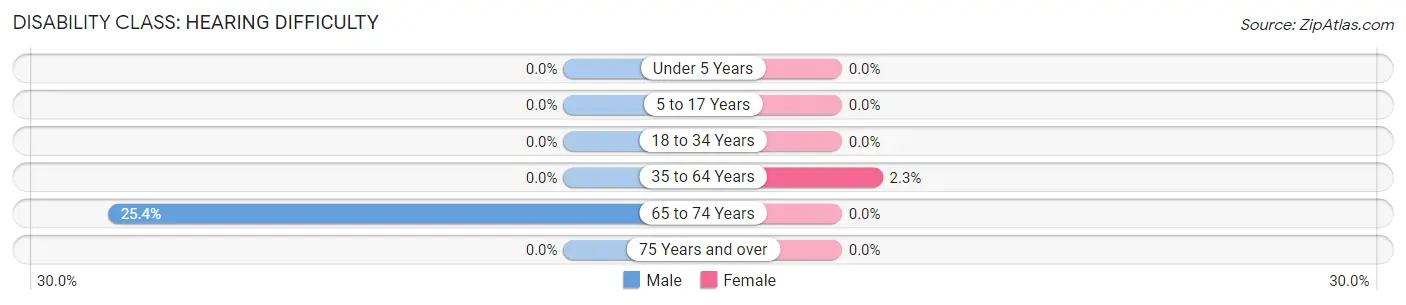
| Age Bracket | Male | Female |
| Under 5 Years | 0 (0.0%) | 0 (0.0%) |
| 5 to 17 Years | 0 (0.0%) | 0 (0.0%) |
| 18 to 34 Years | 0 (0.0%) | 0 (0.0%) |
| 35 to 64 Years | 0 (0.0%) | 14 (2.3%) |
| 65 to 74 Years | 34 (25.4%) | 0 (0.0%) |
| 75 Years and over | 0 (0.0%) | 0 (0.0%) |
Disability Class: Vision Difficulty
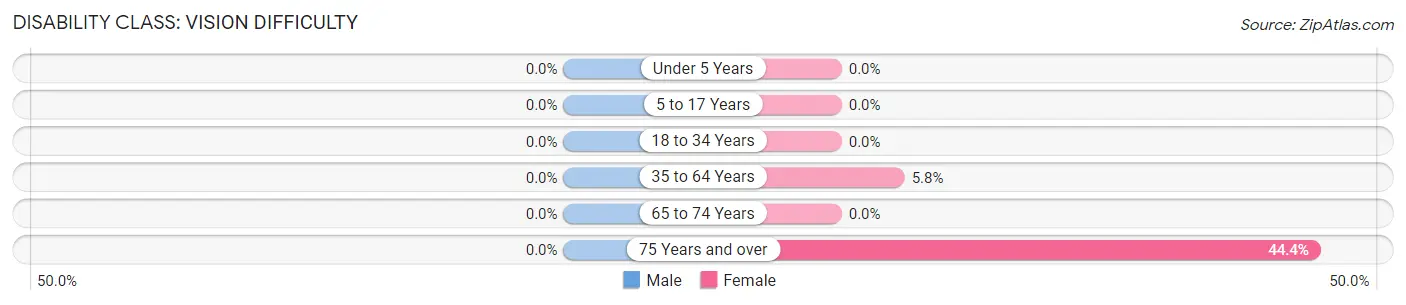
| Age Bracket | Male | Female |
| Under 5 Years | 0 (0.0%) | 0 (0.0%) |
| 5 to 17 Years | 0 (0.0%) | 0 (0.0%) |
| 18 to 34 Years | 0 (0.0%) | 0 (0.0%) |
| 35 to 64 Years | 0 (0.0%) | 36 (5.8%) |
| 65 to 74 Years | 0 (0.0%) | 0 (0.0%) |
| 75 Years and over | 0 (0.0%) | 16 (44.4%) |
Disability Class: Cognitive Difficulty
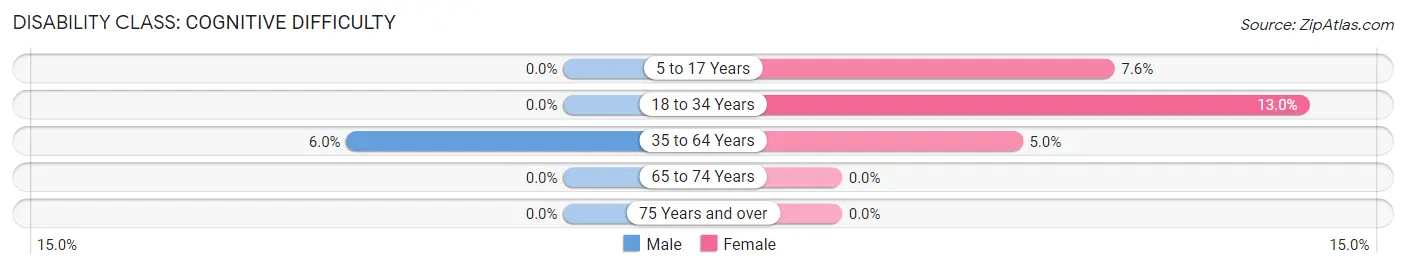
| Age Bracket | Male | Female |
| 5 to 17 Years | 0 (0.0%) | 6 (7.6%) |
| 18 to 34 Years | 0 (0.0%) | 22 (13.0%) |
| 35 to 64 Years | 36 (6.0%) | 31 (5.0%) |
| 65 to 74 Years | 0 (0.0%) | 0 (0.0%) |
| 75 Years and over | 0 (0.0%) | 0 (0.0%) |
Disability Class: Ambulatory Difficulty
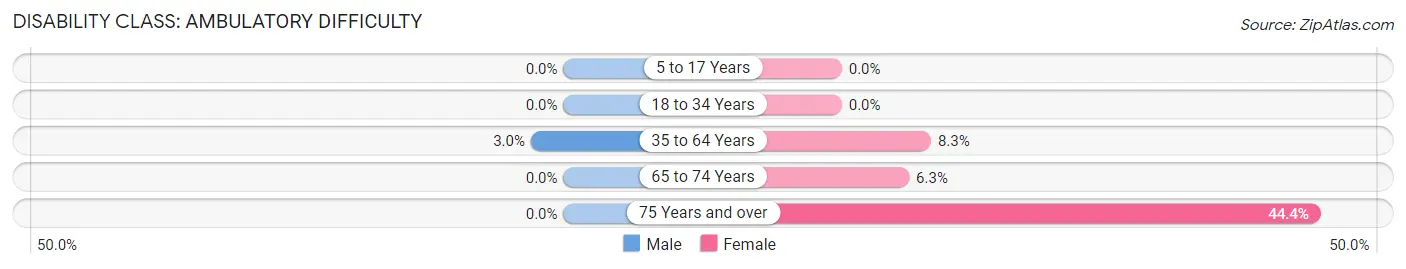
| Age Bracket | Male | Female |
| 5 to 17 Years | 0 (0.0%) | 0 (0.0%) |
| 18 to 34 Years | 0 (0.0%) | 0 (0.0%) |
| 35 to 64 Years | 18 (3.0%) | 51 (8.3%) |
| 65 to 74 Years | 0 (0.0%) | 10 (6.2%) |
| 75 Years and over | 0 (0.0%) | 16 (44.4%) |
Disability Class: Self-Care Difficulty
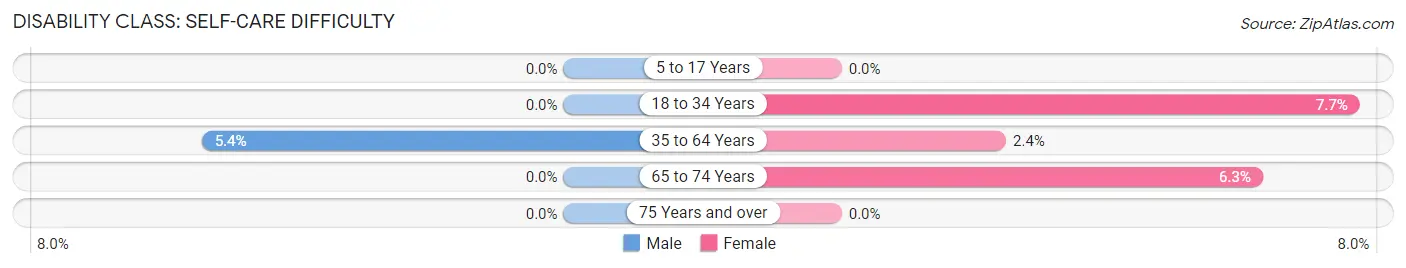
| Age Bracket | Male | Female |
| 5 to 17 Years | 0 (0.0%) | 0 (0.0%) |
| 18 to 34 Years | 0 (0.0%) | 13 (7.7%) |
| 35 to 64 Years | 32 (5.4%) | 15 (2.4%) |
| 65 to 74 Years | 0 (0.0%) | 10 (6.2%) |
| 75 Years and over | 0 (0.0%) | 0 (0.0%) |
Technology Access in Sun Valley
Computing Device Access in Sun Valley
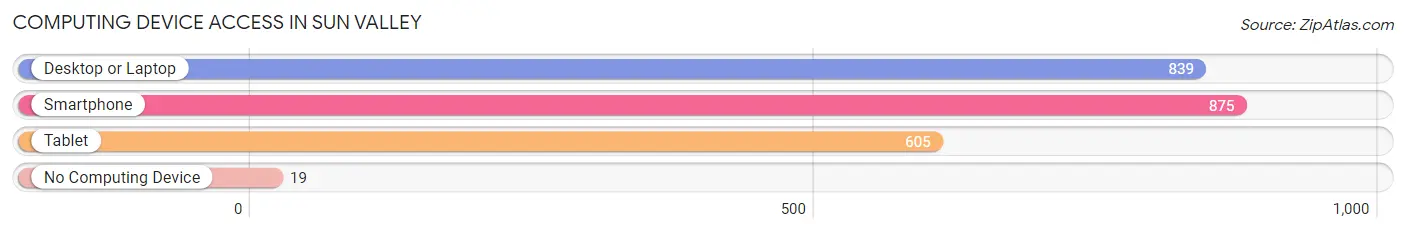
| Device Type | # Households | % Households |
| Desktop or Laptop | 839 | 89.3% |
| Smartphone | 875 | 93.2% |
| Tablet | 605 | 64.4% |
| No Computing Device | 19 | 2.0% |
| Total | 939 | 100.0% |
Internet Access in Sun Valley
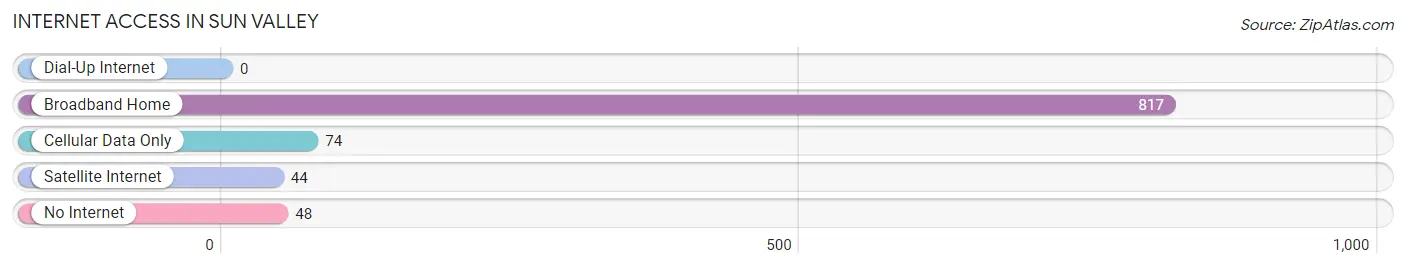
| Internet Type | # Households | % Households |
| Dial-Up Internet | 0 | 0.0% |
| Broadband Home | 817 | 87.0% |
| Cellular Data Only | 74 | 7.9% |
| Satellite Internet | 44 | 4.7% |
| No Internet | 48 | 5.1% |
| Total | 939 | 100.0% |
Sun Valley Summary
History
Sun Valley, Pennsylvania is a small borough located in Delaware County, Pennsylvania. It is situated in the southeastern corner of the county, just north of the city of Philadelphia. The area was first settled in the late 1700s by a group of Quakers who had migrated from England. The area was originally known as “Sunny Valley” and was part of the original Chester County. In 1844, the area was incorporated as the Borough of Sun Valley.
The area was primarily agricultural until the late 19th century when the Pennsylvania Railroad began to expand its lines through the area. This brought an influx of new residents and businesses to the area, and the population began to grow rapidly. By the early 20th century, Sun Valley had become a bustling community with a variety of businesses, including a number of factories and mills.
The area continued to grow throughout the 20th century, and by the year 2000, Sun Valley had a population of approximately 5,000 people. The borough is now home to a variety of businesses, including a number of small shops and restaurants.
Geography
Sun Valley is located in southeastern Delaware County, Pennsylvania. It is situated just north of the city of Philadelphia and is bordered by the boroughs of Ridley Park, Prospect Park, and Norwood. The borough is situated on the banks of the Delaware River and is part of the Philadelphia metropolitan area.
The borough covers an area of approximately 1.2 square miles and is mostly residential. The terrain is mostly flat, with some hills in the northern part of the borough. The climate is temperate, with hot summers and cold winters.
Economy
Sun Valley’s economy is primarily based on small businesses and retail. The borough is home to a variety of small shops and restaurants, as well as a number of factories and mills. The borough is also home to a number of professional services, such as accounting and legal firms.
The borough is also home to a number of educational institutions, including a community college and a number of public and private schools. The borough is also home to a number of parks and recreational facilities, including a public pool and a number of sports fields.
Demographics
As of the 2010 census, Sun Valley had a population of 5,072 people. The population is primarily white (90.2%), with a small percentage of African Americans (4.2%) and Hispanics (3.2%). The median household income is $50,945, and the median age is 40.7 years.
Sun Valley is a diverse community, with a variety of religious and ethnic backgrounds. The borough is home to a number of churches, including Catholic, Protestant, and Jewish congregations. The borough is also home to a number of cultural organizations, including a number of civic and social clubs.
Conclusion
Sun Valley, Pennsylvania is a small borough located in Delaware County, Pennsylvania. It is situated in the southeastern corner of the county, just north of the city of Philadelphia. The area was first settled in the late 1700s by a group of Quakers who had migrated from England. The area was primarily agricultural until the late 19th century when the Pennsylvania Railroad began to expand its lines through the area. This brought an influx of new residents and businesses to the area, and the population began to grow rapidly. By the year 2000, Sun Valley had a population of approximately 5,000 people. The borough is now home to a variety of businesses, including a number of small shops and restaurants. The economy is primarily based on small businesses and retail, and the population is primarily white (90.2%), with a small percentage of African Americans (4.2%) and Hispanics (3.2%). Sun Valley is a diverse community, with a variety of religious and ethnic backgrounds.
Common Questions
What is Per Capita Income in Sun Valley?
Per Capita income in Sun Valley is $30,138.
What is the Median Family Income in Sun Valley?
Median Family Income in Sun Valley is $75,272.
What is the Median Household income in Sun Valley?
Median Household Income in Sun Valley is $69,441.
What is Income or Wage Gap in Sun Valley?
Income or Wage Gap in Sun Valley is 43.5%.
Women in Sun Valley earn 56.5 cents for every dollar earned by a man.
What is Inequality or Gini Index in Sun Valley?
Inequality or Gini Index in Sun Valley is 0.30.
What is the Total Population of Sun Valley?
Total Population of Sun Valley is 2,206.
What is the Total Male Population of Sun Valley?
Total Male Population of Sun Valley is 1,109.
What is the Total Female Population of Sun Valley?
Total Female Population of Sun Valley is 1,097.
What is the Ratio of Males per 100 Females in Sun Valley?
There are 101.09 Males per 100 Females in Sun Valley.
What is the Ratio of Females per 100 Males in Sun Valley?
There are 98.92 Females per 100 Males in Sun Valley.
What is the Median Population Age in Sun Valley?
Median Population Age in Sun Valley is 51.2 Years.
What is the Average Family Size in Sun Valley
Average Family Size in Sun Valley is 2.8 People.
What is the Average Household Size in Sun Valley
Average Household Size in Sun Valley is 2.4 People.
How Large is the Labor Force in Sun Valley?
There are 1,196 People in the Labor Forcein in Sun Valley.
What is the Percentage of People in the Labor Force in Sun Valley?
64.1% of People are in the Labor Force in Sun Valley.
What is the Unemployment Rate in Sun Valley?
Unemployment Rate in Sun Valley is 4.2%.