Dryville, PA Map & Demographics
Dryville Map
Dryville Overview
$40,575
PER CAPITA INCOME
19.9%
WAGE / INCOME GAP [ % ]
80.1¢/ $1
WAGE / INCOME GAP [ $ ]
0.40
INEQUALITY / GINI INDEX
185
TOTAL POPULATION
113
MALE POPULATION
72
FEMALE POPULATION
156.94
MALES / 100 FEMALES
63.72
FEMALES / 100 MALES
59.0
MEDIAN AGE
2.8
AVG FAMILY SIZE
2.5
AVG HOUSEHOLD SIZE
116
LABOR FORCE [ PEOPLE ]
65.9%
PERCENT IN LABOR FORCE
Income in Dryville
Income Overview in Dryville
| Characteristic | Number | Measure |
| Per Capita Income | 185 | $40,575 |
| Median Family Income | 56 | $0 |
| Mean Family Income | 56 | $114,484 |
| Median Household Income | 75 | $0 |
| Mean Household Income | 75 | $95,569 |
| Income Deficit | 56 | $0 |
| Wage / Income Gap (%) | 185 | 19.91% |
| Wage / Income Gap ($) | 185 | 80.09¢ per $1 |
| Gini / Inequality Index | 185 | 0.40 |
Earnings by Sex in Dryville
Average Earnings in Dryville are $52,609, $52,717 for men and $42,222 for women, a difference of 19.9%.
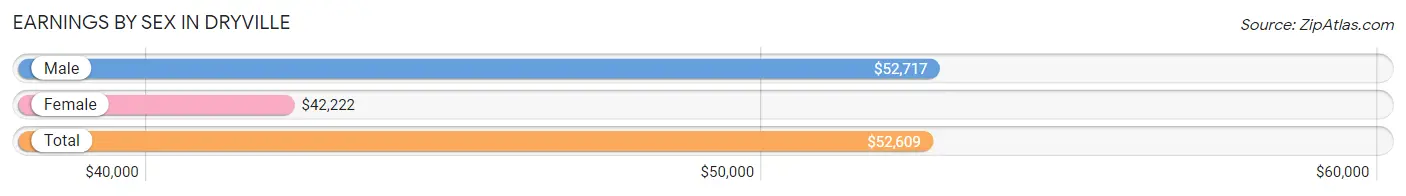
| Sex | Number | Average Earnings |
| Male | 64 (47.1%) | $52,717 |
| Female | 72 (52.9%) | $42,222 |
| Total | 136 (100.0%) | $52,609 |
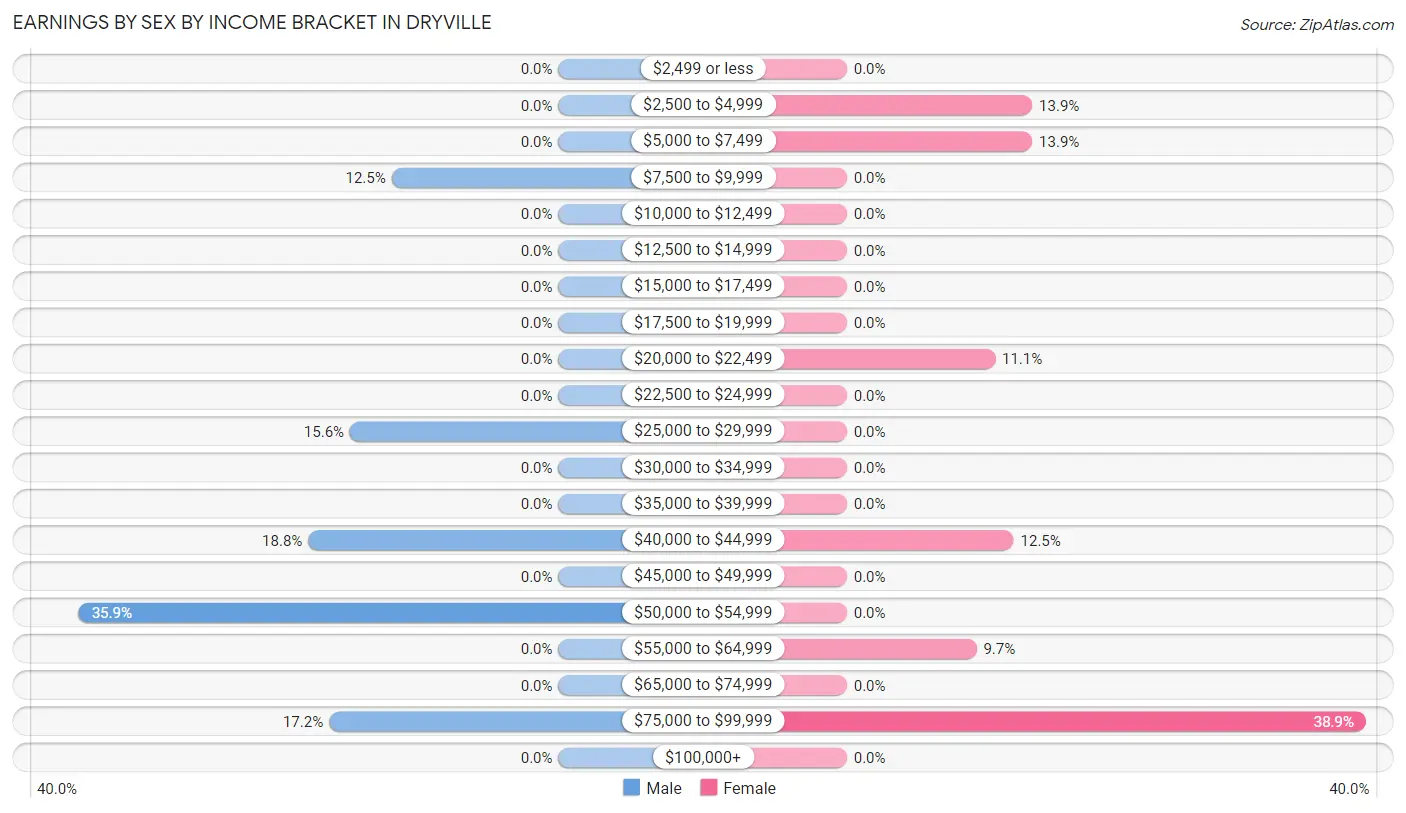
Earnings by Sex by Income Bracket in Dryville
The most common earnings brackets in Dryville are $50,000 to $54,999 for men (23 | 35.9%) and $75,000 to $99,999 for women (28 | 38.9%).
| Income | Male | Female |
| $2,499 or less | 0 (0.0%) | 0 (0.0%) |
| $2,500 to $4,999 | 0 (0.0%) | 10 (13.9%) |
| $5,000 to $7,499 | 0 (0.0%) | 10 (13.9%) |
| $7,500 to $9,999 | 8 (12.5%) | 0 (0.0%) |
| $10,000 to $12,499 | 0 (0.0%) | 0 (0.0%) |
| $12,500 to $14,999 | 0 (0.0%) | 0 (0.0%) |
| $15,000 to $17,499 | 0 (0.0%) | 0 (0.0%) |
| $17,500 to $19,999 | 0 (0.0%) | 0 (0.0%) |
| $20,000 to $22,499 | 0 (0.0%) | 8 (11.1%) |
| $22,500 to $24,999 | 0 (0.0%) | 0 (0.0%) |
| $25,000 to $29,999 | 10 (15.6%) | 0 (0.0%) |
| $30,000 to $34,999 | 0 (0.0%) | 0 (0.0%) |
| $35,000 to $39,999 | 0 (0.0%) | 0 (0.0%) |
| $40,000 to $44,999 | 12 (18.8%) | 9 (12.5%) |
| $45,000 to $49,999 | 0 (0.0%) | 0 (0.0%) |
| $50,000 to $54,999 | 23 (35.9%) | 0 (0.0%) |
| $55,000 to $64,999 | 0 (0.0%) | 7 (9.7%) |
| $65,000 to $74,999 | 0 (0.0%) | 0 (0.0%) |
| $75,000 to $99,999 | 11 (17.2%) | 28 (38.9%) |
| $100,000+ | 0 (0.0%) | 0 (0.0%) |
| Total | 64 (100.0%) | 72 (100.0%) |
Earnings by Sex by Educational Attainment in Dryville
Average earnings in Dryville are $44,063 for men and $58,929 for women, a difference of 25.2%. Men with an educational attainment of high school diploma enjoy the highest average annual earnings of $43,021, while those with high school diploma education earn the least with $43,021. Women with an educational attainment of high school diploma earn the most with the average annual earnings of $58,750, while those with high school diploma education have the smallest earnings of $58,750.
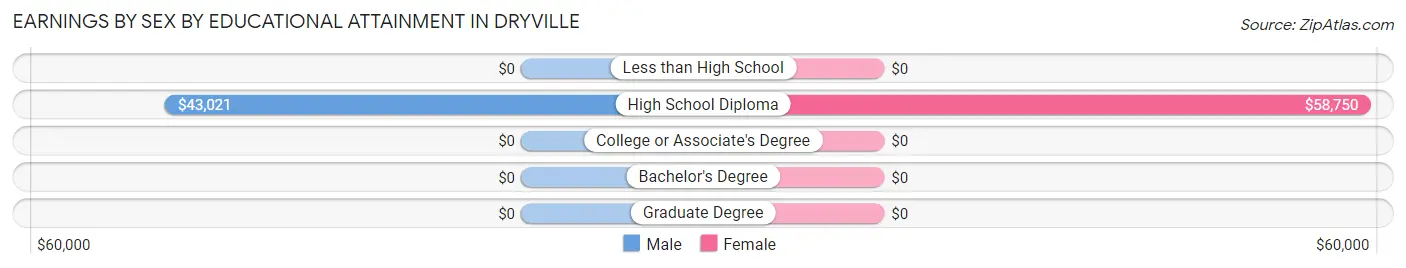
| Educational Attainment | Male Income | Female Income |
| Less than High School | - | - |
| High School Diploma | $43,021 | $58,750 |
| College or Associate's Degree | - | - |
| Bachelor's Degree | - | - |
| Graduate Degree | - | - |
| Total | $44,063 | $58,929 |
Family Income in Dryville
Family Income Brackets in Dryville
According to the Dryville family income data, there are 29 families falling into the $150,000 to $199,999 income range, which is the most common income bracket and makes up 51.8% of all families.
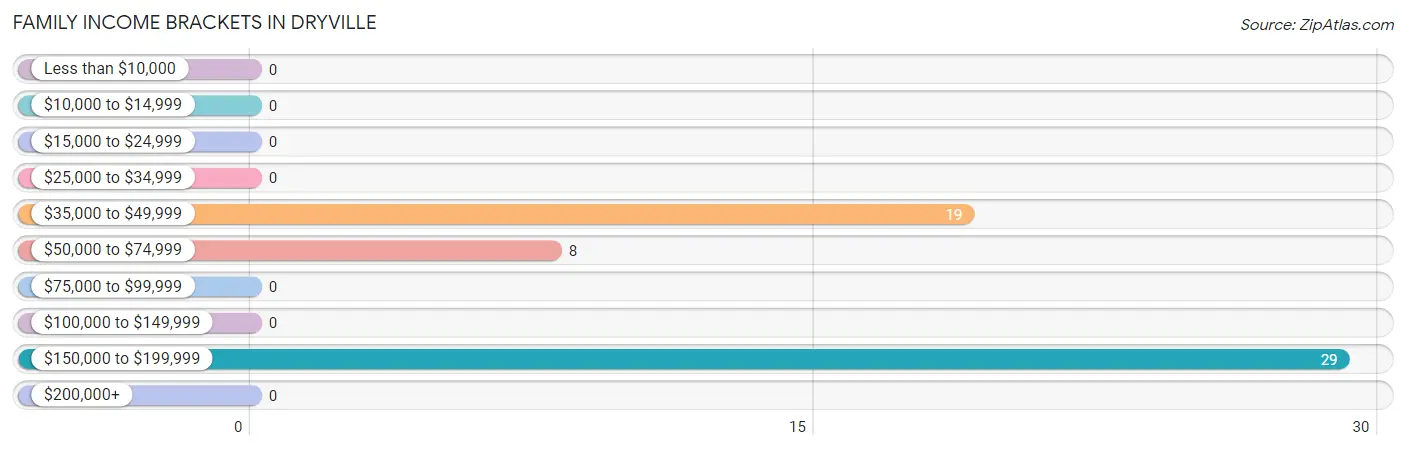
| Income Bracket | # Families | % Families |
| Less than $10,000 | 0 | 0.0% |
| $10,000 to $14,999 | 0 | 0.0% |
| $15,000 to $24,999 | 0 | 0.0% |
| $25,000 to $34,999 | 0 | 0.0% |
| $35,000 to $49,999 | 19 | 33.9% |
| $50,000 to $74,999 | 8 | 14.3% |
| $75,000 to $99,999 | 0 | 0.0% |
| $100,000 to $149,999 | 0 | 0.0% |
| $150,000 to $199,999 | 29 | 51.8% |
| $200,000+ | 0 | 0.0% |
Family Income by Famaliy Size in Dryville
| Income Bracket | # Families | Median Income |
| 2-Person Families | 28 (50.0%) | $0 |
| 3-Person Families | 20 (35.7%) | $0 |
| 4-Person Families | 8 (14.3%) | $0 |
| 5-Person Families | 0 (0.0%) | $0 |
| 6-Person Families | 0 (0.0%) | $0 |
| 7+ Person Families | 0 (0.0%) | $0 |
| Total | 56 (100.0%) | $0 |
Family Income by Number of Earners in Dryville
| Number of Earners | # Families | Median Income |
| No Earners | 0 (0.0%) | $0 |
| 1 Earner | 19 (33.9%) | $0 |
| 2 Earners | 19 (33.9%) | $0 |
| 3+ Earners | 18 (32.1%) | $0 |
| Total | 56 (100.0%) | $0 |
Household Income in Dryville
Household Income Brackets in Dryville
With 29 households falling in the category, the $150,000 to $199,999 income range is the most frequent in Dryville, accounting for 38.7% of all households.
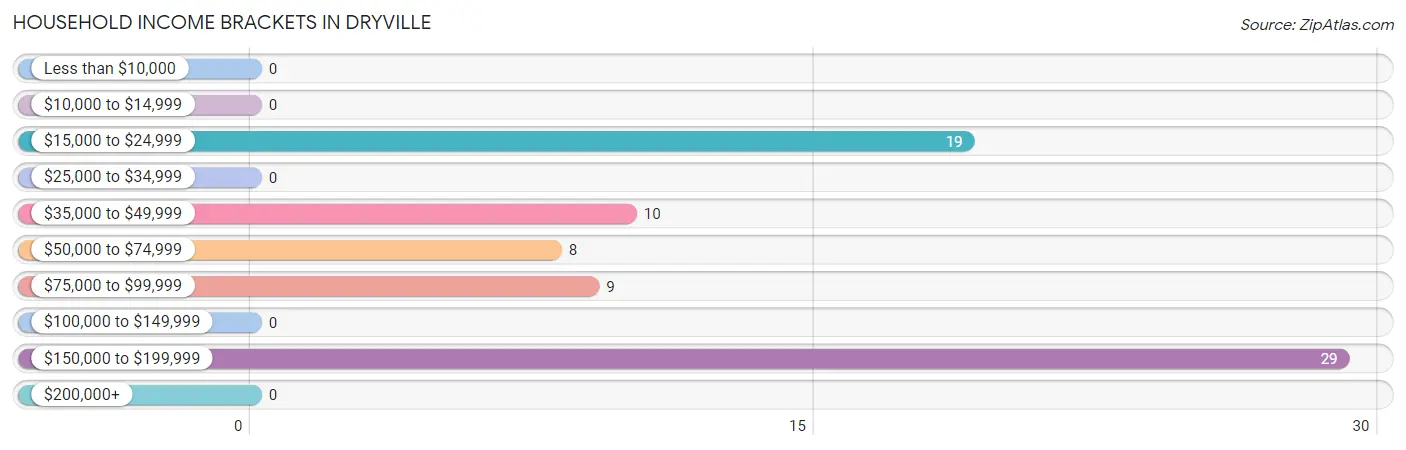
| Income Bracket | # Households | % Households |
| Less than $10,000 | 0 | 0.0% |
| $10,000 to $14,999 | 0 | 0.0% |
| $15,000 to $24,999 | 19 | 25.3% |
| $25,000 to $34,999 | 0 | 0.0% |
| $35,000 to $49,999 | 10 | 13.3% |
| $50,000 to $74,999 | 8 | 10.7% |
| $75,000 to $99,999 | 9 | 12.0% |
| $100,000 to $149,999 | 0 | 0.0% |
| $150,000 to $199,999 | 29 | 38.7% |
| $200,000+ | 0 | 0.0% |
Household Income by Householder Age in Dryville
The median household income in Dryville is $0, with the highest median household income of $166,250 found in the 45 to 64 years age bracket for the primary householder. A total of 26 households (34.7%) fall into this category.
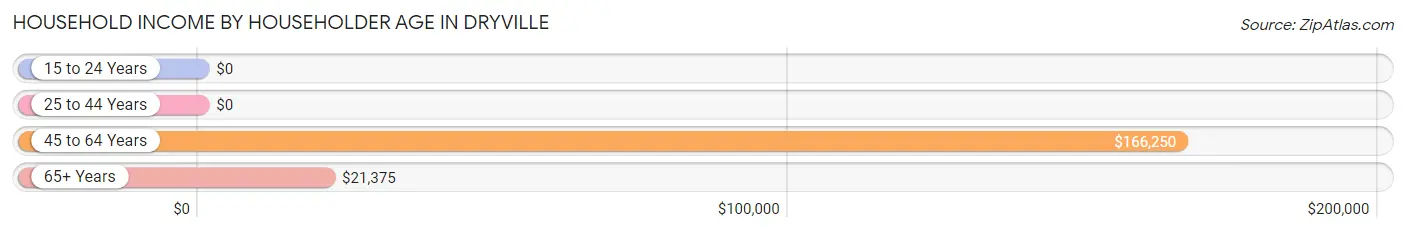
| Income Bracket | # Households | Median Income |
| 15 to 24 Years | 0 (0.0%) | $0 |
| 25 to 44 Years | 20 (26.7%) | $0 |
| 45 to 64 Years | 26 (34.7%) | $166,250 |
| 65+ Years | 29 (38.7%) | $21,375 |
| Total | 75 (100.0%) | $0 |
Poverty in Dryville
Income Below Poverty by Sex and Age in Dryville
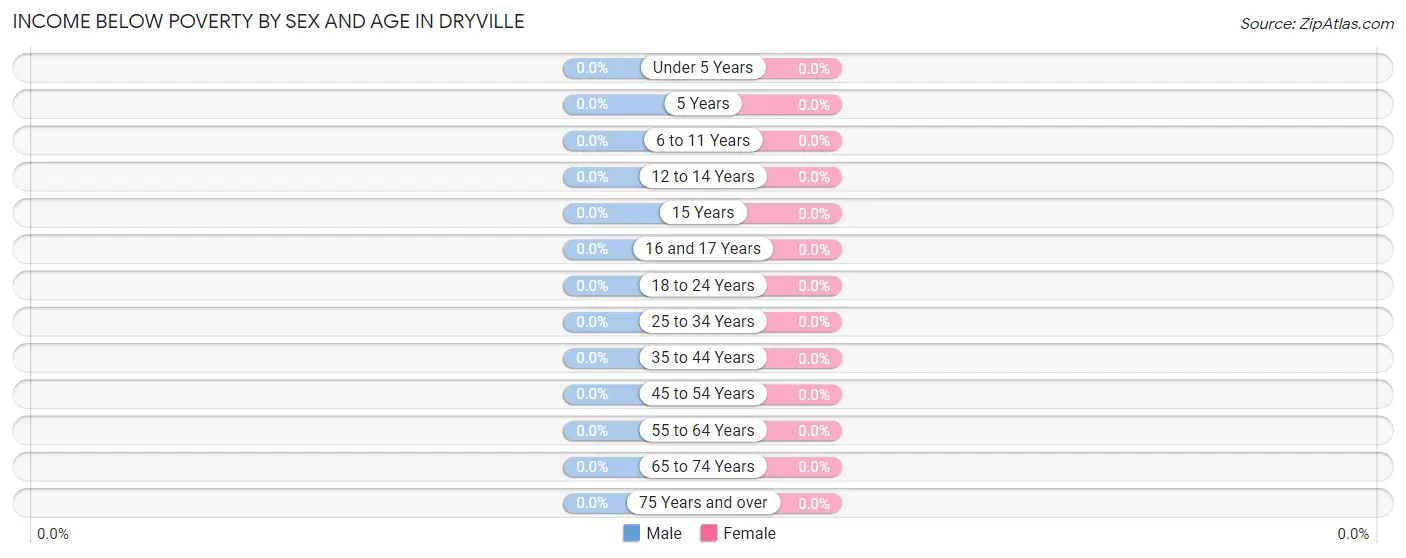
| Age Bracket | Male | Female |
| Under 5 Years | 0 (0.0%) | 0 (0.0%) |
| 5 Years | 0 (0.0%) | 0 (0.0%) |
| 6 to 11 Years | 0 (0.0%) | 0 (0.0%) |
| 12 to 14 Years | 0 (0.0%) | 0 (0.0%) |
| 15 Years | 0 (0.0%) | 0 (0.0%) |
| 16 and 17 Years | 0 (0.0%) | 0 (0.0%) |
| 18 to 24 Years | 0 (0.0%) | 0 (0.0%) |
| 25 to 34 Years | 0 (0.0%) | 0 (0.0%) |
| 35 to 44 Years | 0 (0.0%) | 0 (0.0%) |
| 45 to 54 Years | 0 (0.0%) | 0 (0.0%) |
| 55 to 64 Years | 0 (0.0%) | 0 (0.0%) |
| 65 to 74 Years | 0 (0.0%) | 0 (0.0%) |
| 75 Years and over | 0 (0.0%) | 0 (0.0%) |
| Total | 0 (0.0%) | 0 (0.0%) |
Income Above Poverty by Sex and Age in Dryville
According to the poverty statistics in Dryville, males aged 6 to 11 years and females aged 18 to 24 years are the age groups that are most secure financially, with 100.0% of males and 100.0% of females in these age groups living above the poverty line.
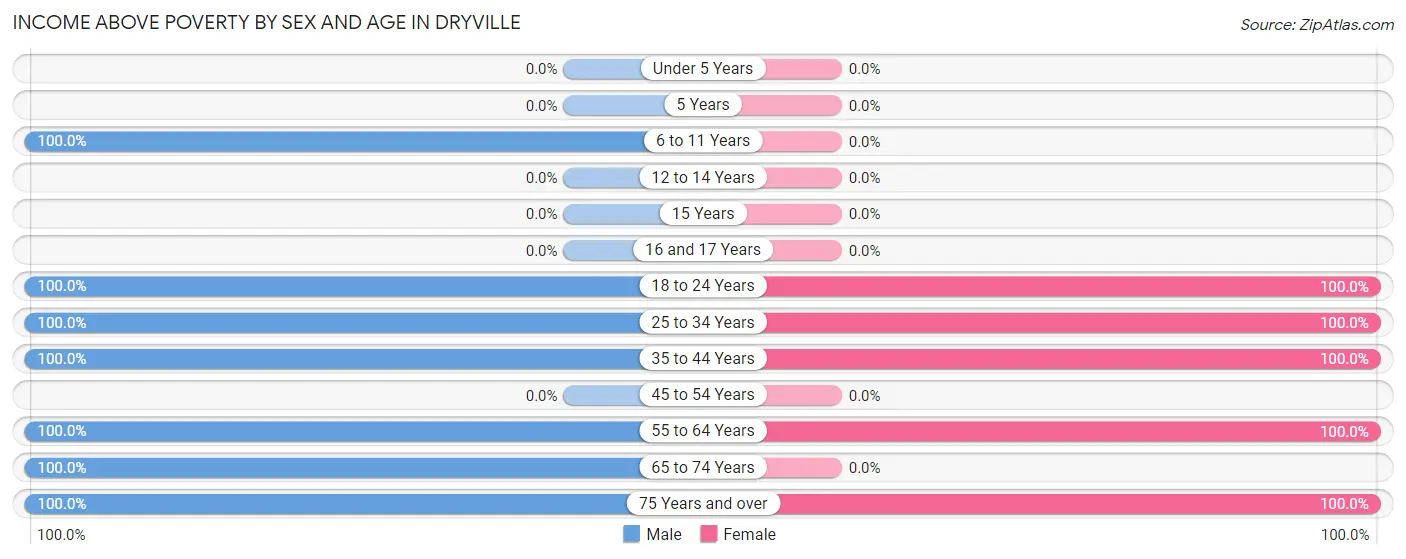
| Age Bracket | Male | Female |
| Under 5 Years | 0 (0.0%) | 0 (0.0%) |
| 5 Years | 0 (0.0%) | 0 (0.0%) |
| 6 to 11 Years | 9 (100.0%) | 0 (0.0%) |
| 12 to 14 Years | 0 (0.0%) | 0 (0.0%) |
| 15 Years | 0 (0.0%) | 0 (0.0%) |
| 16 and 17 Years | 0 (0.0%) | 0 (0.0%) |
| 18 to 24 Years | 13 (100.0%) | 10 (100.0%) |
| 25 to 34 Years | 12 (100.0%) | 17 (100.0%) |
| 35 to 44 Years | 11 (100.0%) | 10 (100.0%) |
| 45 to 54 Years | 0 (0.0%) | 0 (0.0%) |
| 55 to 64 Years | 28 (100.0%) | 25 (100.0%) |
| 65 to 74 Years | 12 (100.0%) | 0 (0.0%) |
| 75 Years and over | 28 (100.0%) | 10 (100.0%) |
| Total | 113 (100.0%) | 72 (100.0%) |
Income Below Poverty Among Married-Couple Families in Dryville
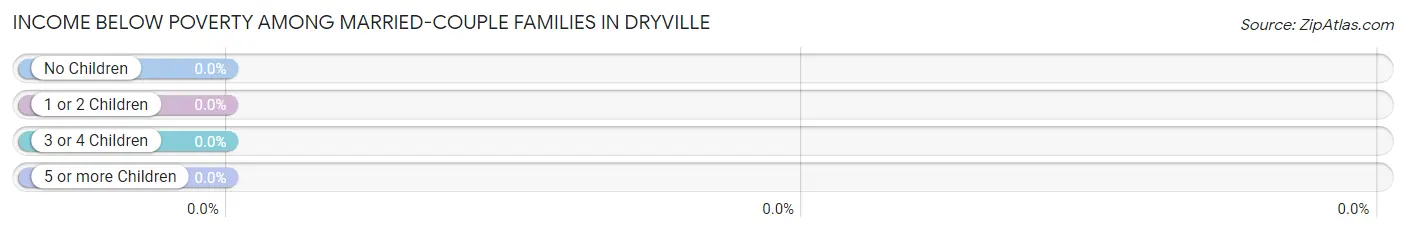
| Children | Above Poverty | Below Poverty |
| No Children | 47 (100.0%) | 0 (0.0%) |
| 1 or 2 Children | 0 (0.0%) | 0 (0.0%) |
| 3 or 4 Children | 0 (0.0%) | 0 (0.0%) |
| 5 or more Children | 0 (0.0%) | 0 (0.0%) |
| Total | 47 (100.0%) | 0 (0.0%) |
Income Below Poverty Among Single-Parent Households in Dryville
| Children | Single Father | Single Mother |
| No Children | 0 (0.0%) | 0 (0.0%) |
| 1 or 2 Children | 0 (0.0%) | 0 (0.0%) |
| 3 or 4 Children | 0 (0.0%) | 0 (0.0%) |
| 5 or more Children | 0 (0.0%) | 0 (0.0%) |
| Total | 0 (0.0%) | 0 (0.0%) |
Income Below Poverty Among Married-Couple vs Single-Parent Households in Dryville
| Children | Married-Couple Families | Single-Parent Households |
| No Children | 0 (0.0%) | 0 (0.0%) |
| 1 or 2 Children | 0 (0.0%) | 0 (0.0%) |
| 3 or 4 Children | 0 (0.0%) | 0 (0.0%) |
| 5 or more Children | 0 (0.0%) | 0 (0.0%) |
| Total | 0 (0.0%) | 0 (0.0%) |
Race in Dryville
The most populous races in Dryville are White / Caucasian (155 | 83.8%), Black / African American (30 | 16.2%), and Hispanic or Latino (30 | 16.2%).
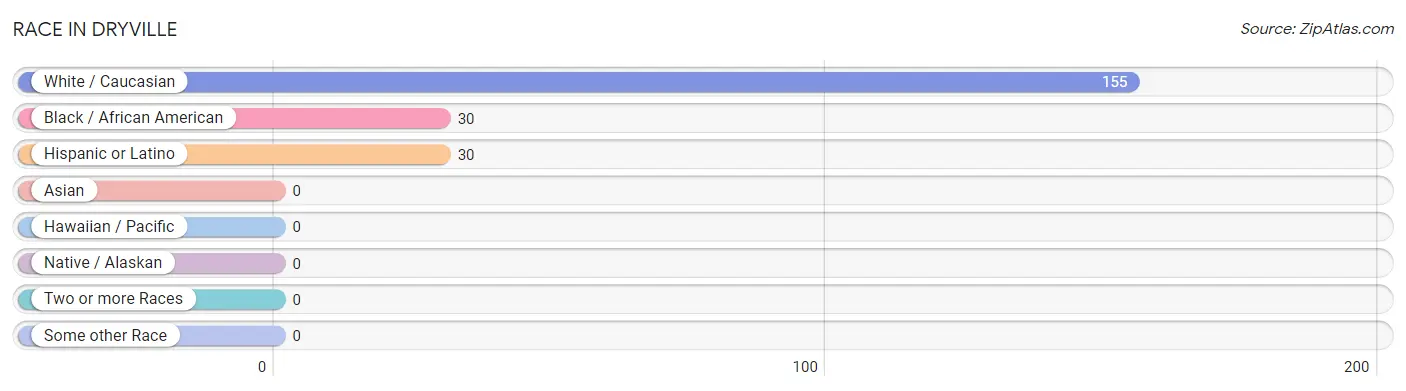
| Race | # Population | % Population |
| Asian | 0 | 0.0% |
| Black / African American | 30 | 16.2% |
| Hawaiian / Pacific | 0 | 0.0% |
| Hispanic or Latino | 30 | 16.2% |
| Native / Alaskan | 0 | 0.0% |
| White / Caucasian | 155 | 83.8% |
| Two or more Races | 0 | 0.0% |
| Some other Race | 0 | 0.0% |
| Total | 185 | 100.0% |
Ancestry in Dryville
The most populous ancestries reported in Dryville are German (85 | 46.0%), Swiss (41 | 22.2%), Italian (30 | 16.2%), African (21 | 11.4%), and English (21 | 11.4%), together accounting for 107.0% of all Dryville residents.
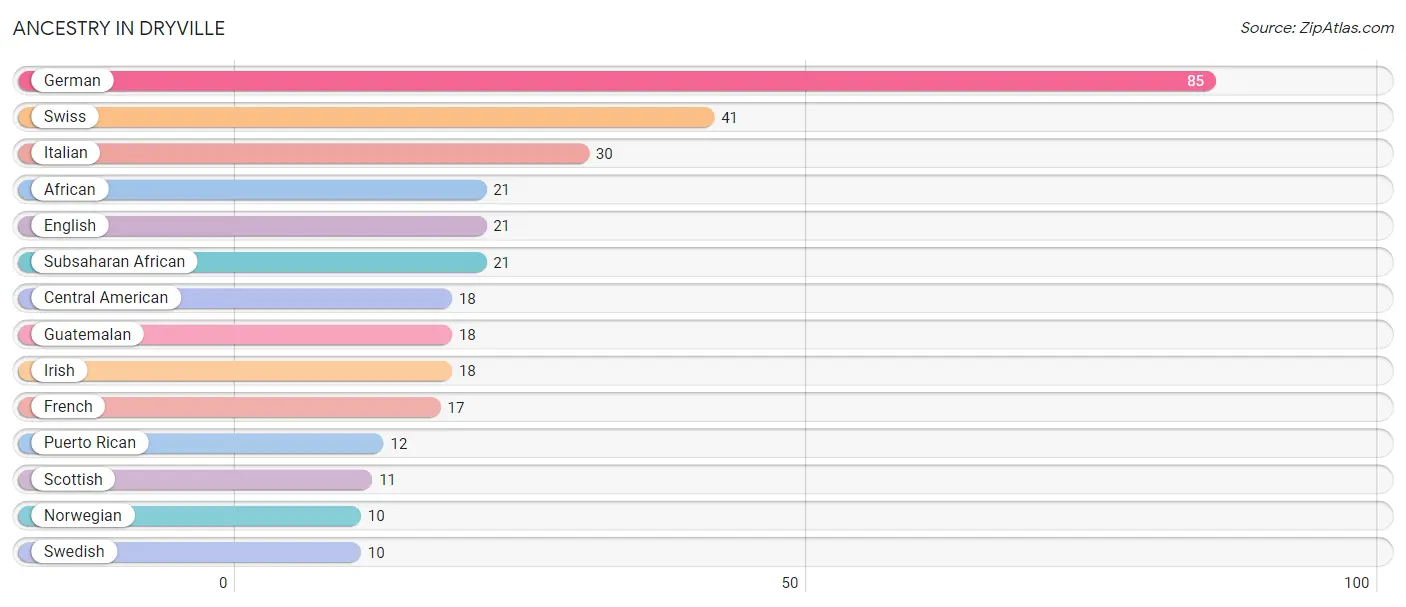
| Ancestry | # Population | % Population |
| African | 21 | 11.4% |
| Central American | 18 | 9.7% |
| English | 21 | 11.4% |
| French | 17 | 9.2% |
| German | 85 | 46.0% |
| Guatemalan | 18 | 9.7% |
| Irish | 18 | 9.7% |
| Italian | 30 | 16.2% |
| Norwegian | 10 | 5.4% |
| Puerto Rican | 12 | 6.5% |
| Scottish | 11 | 5.9% |
| Subsaharan African | 21 | 11.4% |
| Swedish | 10 | 5.4% |
| Swiss | 41 | 22.2% | View All 14 Rows |
Immigrants in Dryville

| Immigration Origin | # Population | % Population | View All 0 Rows |
Sex and Age in Dryville
Sex and Age in Dryville
The most populous age groups in Dryville are 60 to 64 Years (28 | 24.8%) for men and 55 to 59 Years (25 | 34.7%) for women.
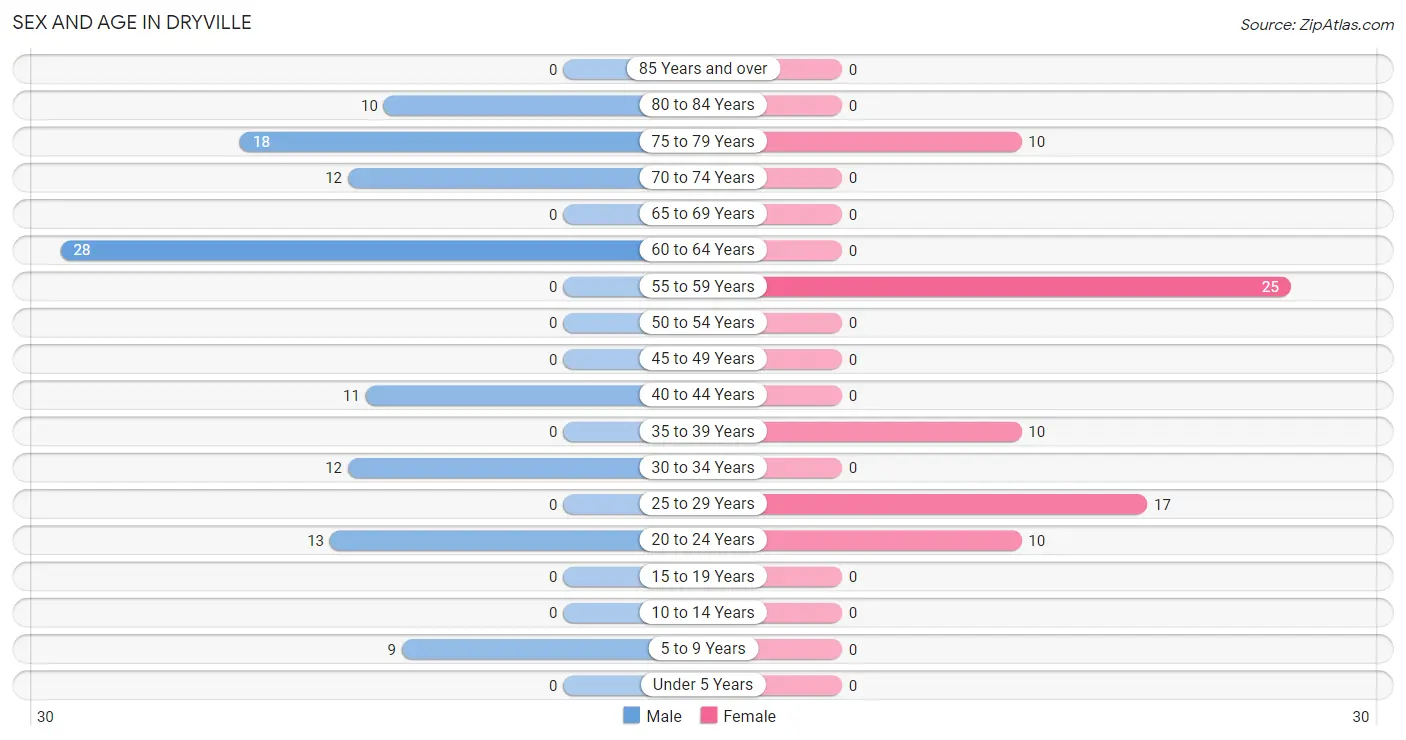
| Age Bracket | Male | Female |
| Under 5 Years | 0 (0.0%) | 0 (0.0%) |
| 5 to 9 Years | 9 (8.0%) | 0 (0.0%) |
| 10 to 14 Years | 0 (0.0%) | 0 (0.0%) |
| 15 to 19 Years | 0 (0.0%) | 0 (0.0%) |
| 20 to 24 Years | 13 (11.5%) | 10 (13.9%) |
| 25 to 29 Years | 0 (0.0%) | 17 (23.6%) |
| 30 to 34 Years | 12 (10.6%) | 0 (0.0%) |
| 35 to 39 Years | 0 (0.0%) | 10 (13.9%) |
| 40 to 44 Years | 11 (9.7%) | 0 (0.0%) |
| 45 to 49 Years | 0 (0.0%) | 0 (0.0%) |
| 50 to 54 Years | 0 (0.0%) | 0 (0.0%) |
| 55 to 59 Years | 0 (0.0%) | 25 (34.7%) |
| 60 to 64 Years | 28 (24.8%) | 0 (0.0%) |
| 65 to 69 Years | 0 (0.0%) | 0 (0.0%) |
| 70 to 74 Years | 12 (10.6%) | 0 (0.0%) |
| 75 to 79 Years | 18 (15.9%) | 10 (13.9%) |
| 80 to 84 Years | 10 (8.8%) | 0 (0.0%) |
| 85 Years and over | 0 (0.0%) | 0 (0.0%) |
| Total | 113 (100.0%) | 72 (100.0%) |
Families and Households in Dryville
Median Family Size in Dryville
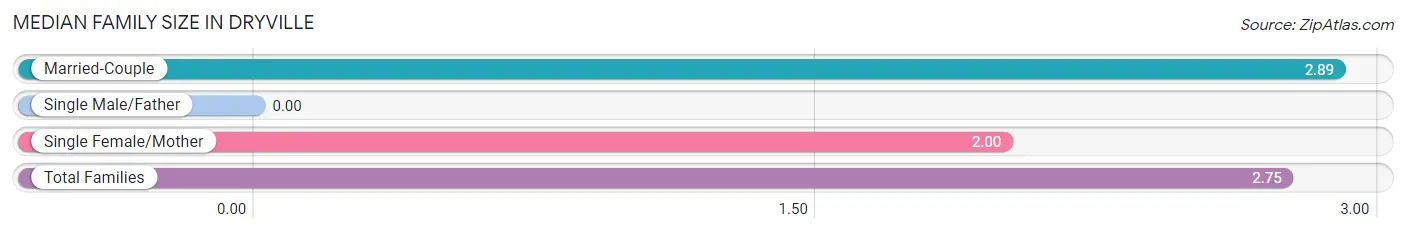
| Family Type | # Families | Family Size |
| Married-Couple | 47 (83.9%) | 2.89 |
| Single Male/Father | 0 (0.0%) | - |
| Single Female/Mother | 9 (16.1%) | 2.00 |
| Total Families | 56 (100.0%) | 2.75 |
Median Household Size in Dryville
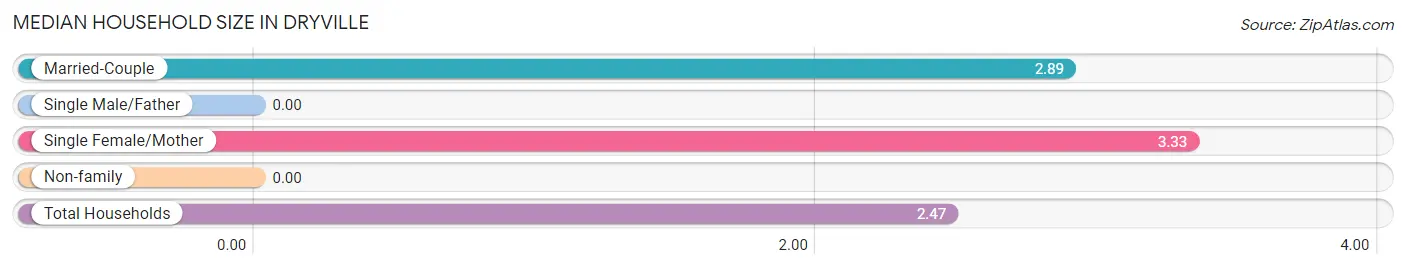
| Household Type | # Households | Household Size |
| Married-Couple | 47 (62.7%) | 2.89 |
| Single Male/Father | 0 (0.0%) | - |
| Single Female/Mother | 9 (12.0%) | 3.33 |
| Non-family | 19 (25.3%) | - |
| Total Households | 75 (100.0%) | 2.47 |
Household Size by Marriage Status in Dryville
Out of a total of 75 households in Dryville, 56 (74.7%) are family households, while 19 (25.3%) are nonfamily households. The most numerous type of family households are 3-person households, comprising 29, and the most common type of nonfamily households are 1-person households, comprising 19.
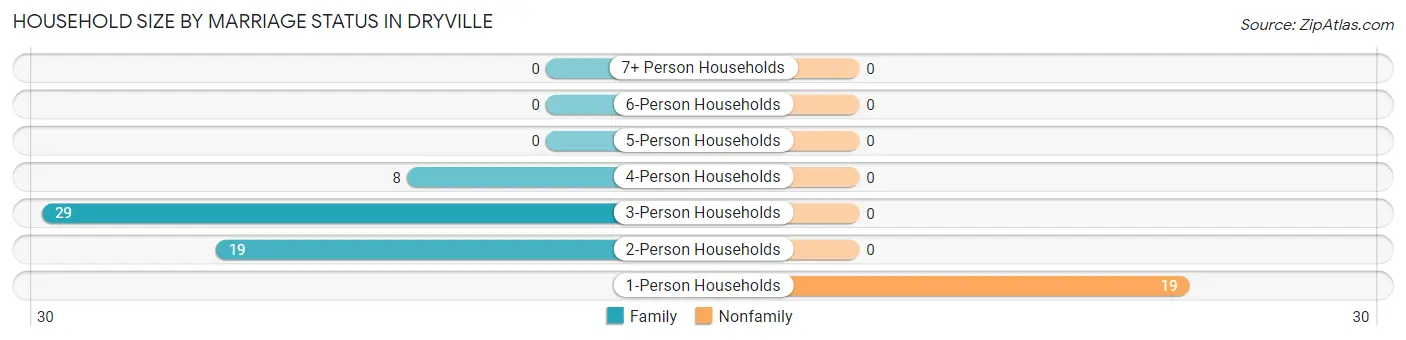
| Household Size | Family Households | Nonfamily Households |
| 1-Person Households | - | 19 (25.3%) |
| 2-Person Households | 19 (25.3%) | 0 (0.0%) |
| 3-Person Households | 29 (38.7%) | 0 (0.0%) |
| 4-Person Households | 8 (10.7%) | 0 (0.0%) |
| 5-Person Households | 0 (0.0%) | 0 (0.0%) |
| 6-Person Households | 0 (0.0%) | 0 (0.0%) |
| 7+ Person Households | 0 (0.0%) | 0 (0.0%) |
| Total | 56 (74.7%) | 19 (25.3%) |
Female Fertility in Dryville
Fertility by Age in Dryville
| Age Bracket | Women with Births | Births / 1,000 Women |
| 15 to 19 years | 0 (0.0%) | 0.0 |
| 20 to 34 years | 0 (0.0%) | 0.0 |
| 35 to 50 years | 0 (0.0%) | 0.0 |
| Total | 0 (0.0%) | 0.0 |
Fertility by Age by Marriage Status in Dryville
| Age Bracket | Married | Unmarried |
| 15 to 19 years | 0 (0.0%) | 0 (0.0%) |
| 20 to 34 years | 0 (0.0%) | 0 (0.0%) |
| 35 to 50 years | 0 (0.0%) | 0 (0.0%) |
| Total | 0 (0.0%) | 0 (0.0%) |
Fertility by Education in Dryville
| Educational Attainment | Women with Births | Births / 1,000 Women |
| Less than High School | 0 (0.0%) | 0.0 |
| High School Diploma | 0 (0.0%) | 0.0 |
| College or Associate's Degree | 0 (0.0%) | 0.0 |
| Bachelor's Degree | 0 (0.0%) | 0.0 |
| Graduate Degree | 0 (0.0%) | 0.0 |
| Total | 0 (0.0%) | 0.0 |
Fertility by Education by Marriage Status in Dryville
| Educational Attainment | Married | Unmarried |
| Less than High School | 0 (0.0%) | 0 (0.0%) |
| High School Diploma | 0 (0.0%) | 0 (0.0%) |
| College or Associate's Degree | 0 (0.0%) | 0 (0.0%) |
| Bachelor's Degree | 0 (0.0%) | 0 (0.0%) |
| Graduate Degree | 0 (0.0%) | 0 (0.0%) |
| Total | 0 (0.0%) | 0 (0.0%) |
Employment Characteristics in Dryville
Employment by Class of Employer in Dryville
Among the 116 employed individuals in Dryville, private company employees (80 | 69.0%), self-employed (not incorporated) (16 | 13.8%), and self-employed (incorporated) (10 | 8.6%) make up the most common classes of employment.
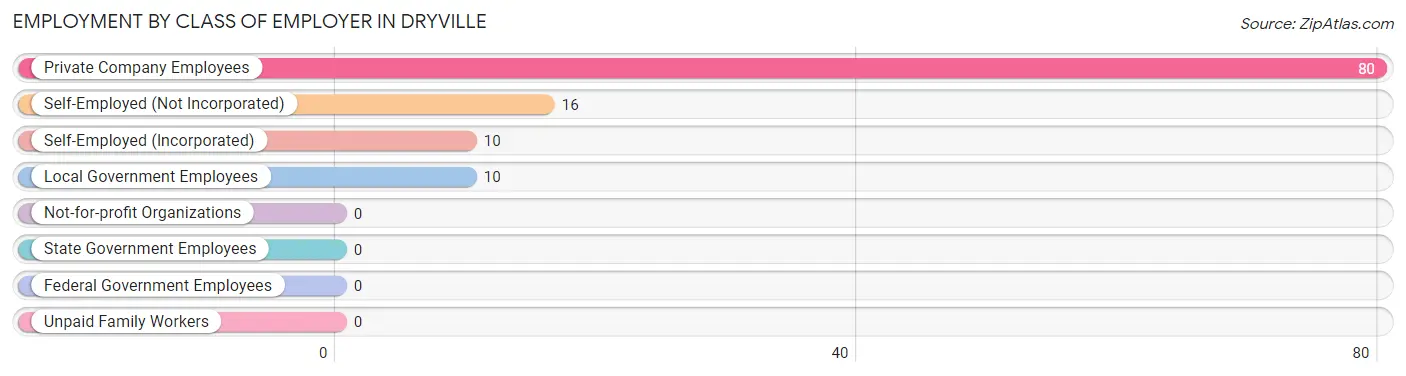
| Employer Class | # Employees | % Employees |
| Private Company Employees | 80 | 69.0% |
| Self-Employed (Incorporated) | 10 | 8.6% |
| Self-Employed (Not Incorporated) | 16 | 13.8% |
| Not-for-profit Organizations | 0 | 0.0% |
| Local Government Employees | 10 | 8.6% |
| State Government Employees | 0 | 0.0% |
| Federal Government Employees | 0 | 0.0% |
| Unpaid Family Workers | 0 | 0.0% |
| Total | 116 | 100.0% |
Employment Status by Age in Dryville
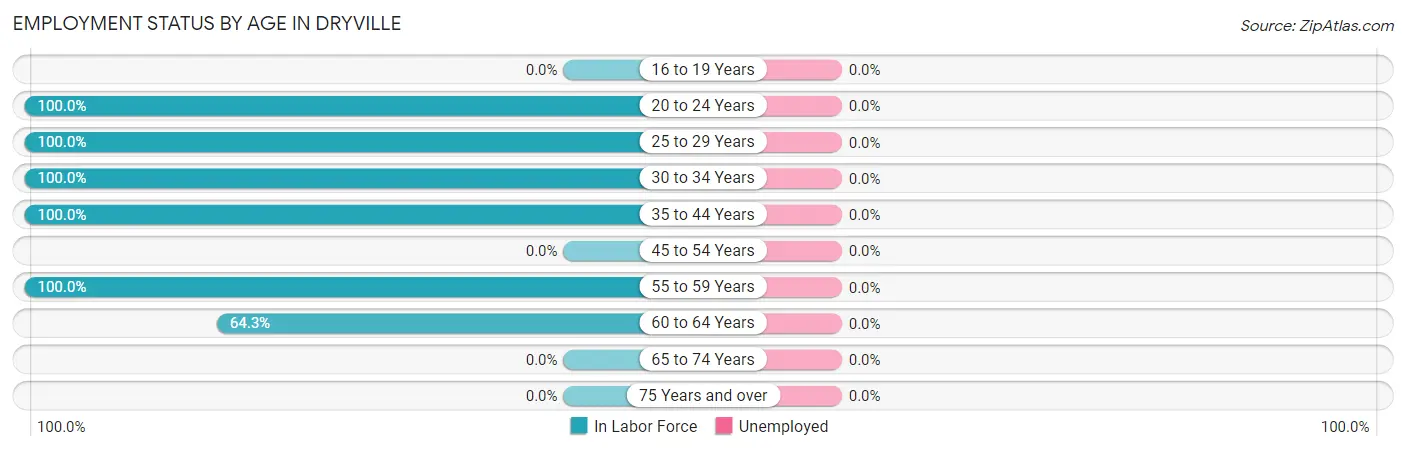
| Age Bracket | In Labor Force | Unemployed |
| 16 to 19 Years | 0 (0.0%) | 0 (0.0%) |
| 20 to 24 Years | 23 (100.0%) | 0 (0.0%) |
| 25 to 29 Years | 17 (100.0%) | 0 (0.0%) |
| 30 to 34 Years | 12 (100.0%) | 0 (0.0%) |
| 35 to 44 Years | 21 (100.0%) | 0 (0.0%) |
| 45 to 54 Years | 0 (0.0%) | 0 (0.0%) |
| 55 to 59 Years | 25 (100.0%) | 0 (0.0%) |
| 60 to 64 Years | 18 (64.3%) | 0 (0.0%) |
| 65 to 74 Years | 0 (0.0%) | 0 (0.0%) |
| 75 Years and over | 0 (0.0%) | 0 (0.0%) |
| Total | 116 (65.9%) | 0 (0.0%) |
Employment Status by Educational Attainment in Dryville
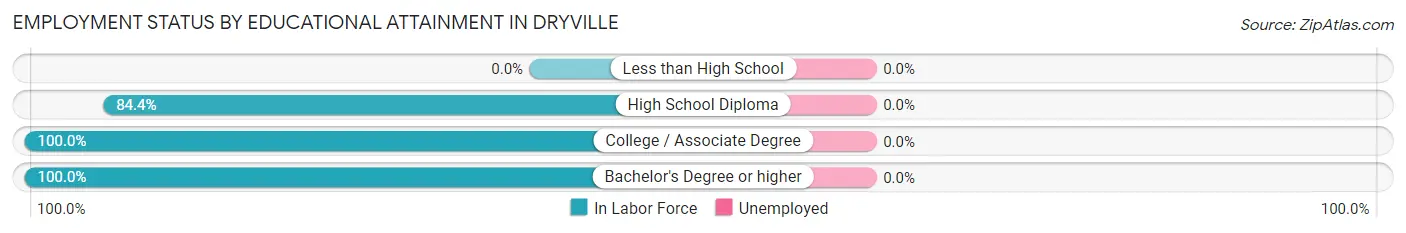
| Educational Attainment | In Labor Force | Unemployed |
| Less than High School | 0 (0.0%) | 0 (0.0%) |
| High School Diploma | 54 (84.4%) | 0 (0.0%) |
| College / Associate Degree | 19 (100.0%) | 0 (0.0%) |
| Bachelor's Degree or higher | 20 (100.0%) | 0 (0.0%) |
| Total | 93 (90.3%) | 0 (0.0%) |
Employment Occupations by Sex in Dryville
Management, Business, Science and Arts Occupations
The most common Management, Business, Science and Arts occupations in Dryville are Management (20 | 17.2%), Community & Social Service (10 | 8.6%), and Education Instruction & Library (10 | 8.6%).
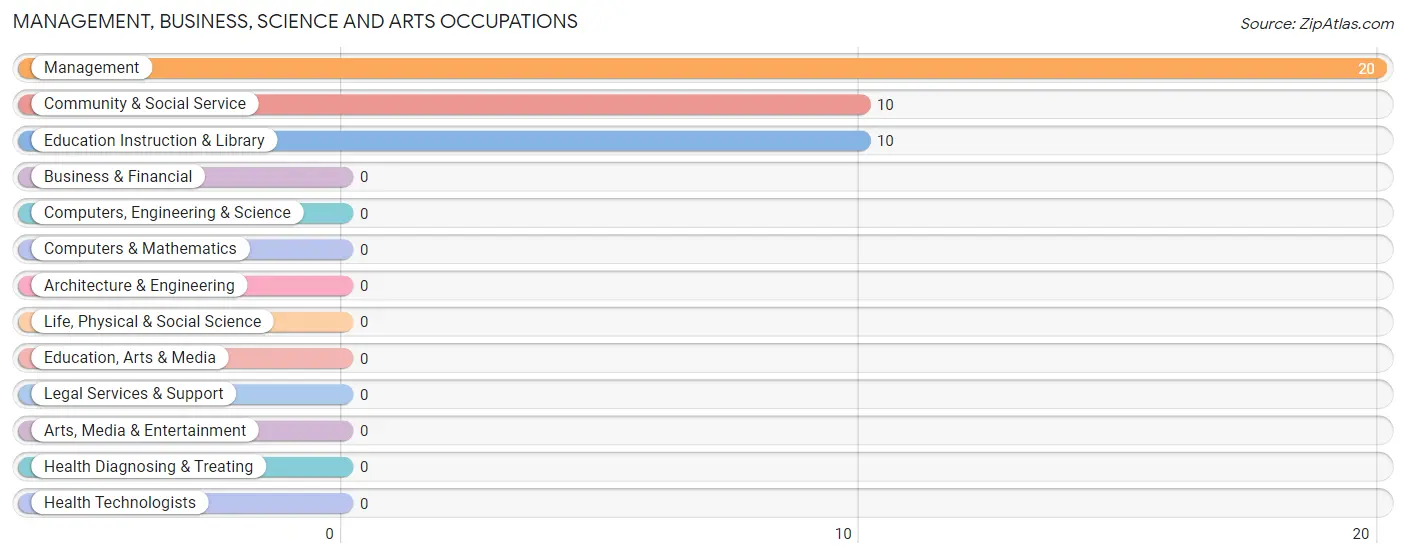
Management, Business, Science and Arts Occupations by Sex
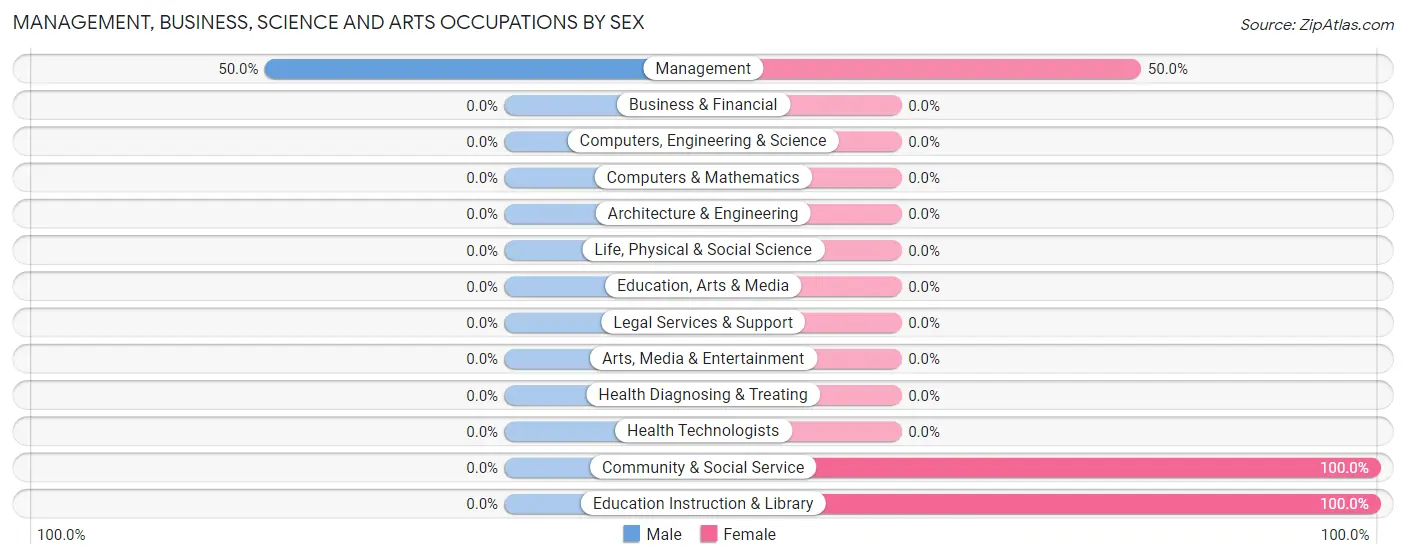
| Occupation | Male | Female |
| Management | 10 (50.0%) | 10 (50.0%) |
| Business & Financial | 0 (0.0%) | 0 (0.0%) |
| Computers, Engineering & Science | 0 (0.0%) | 0 (0.0%) |
| Computers & Mathematics | 0 (0.0%) | 0 (0.0%) |
| Architecture & Engineering | 0 (0.0%) | 0 (0.0%) |
| Life, Physical & Social Science | 0 (0.0%) | 0 (0.0%) |
| Community & Social Service | 0 (0.0%) | 10 (100.0%) |
| Education, Arts & Media | 0 (0.0%) | 0 (0.0%) |
| Legal Services & Support | 0 (0.0%) | 0 (0.0%) |
| Education Instruction & Library | 0 (0.0%) | 10 (100.0%) |
| Arts, Media & Entertainment | 0 (0.0%) | 0 (0.0%) |
| Health Diagnosing & Treating | 0 (0.0%) | 0 (0.0%) |
| Health Technologists | 0 (0.0%) | 0 (0.0%) |
| Total (Category) | 10 (33.3%) | 20 (66.7%) |
| Total (Overall) | 54 (46.6%) | 62 (53.4%) |
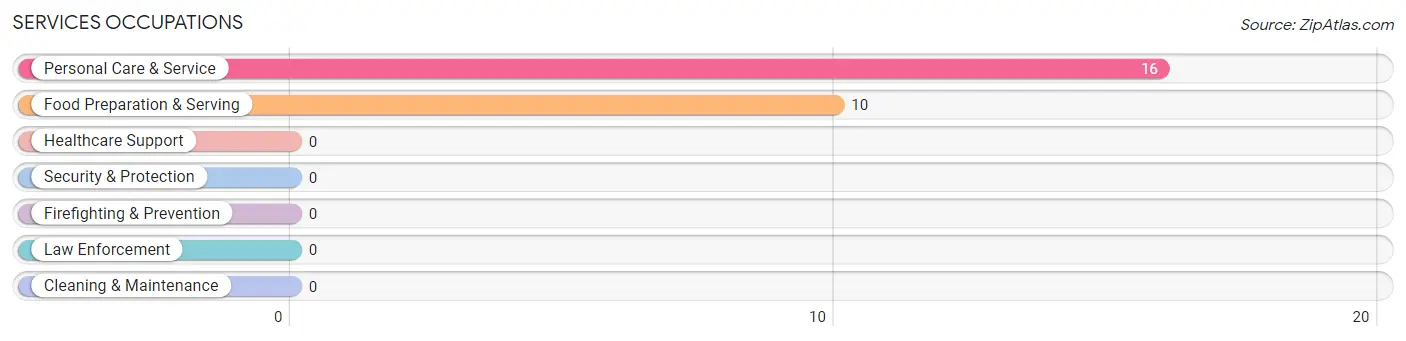
Services Occupations
The most common Services occupations in Dryville are Personal Care & Service (16 | 13.8%), and Food Preparation & Serving (10 | 8.6%).
Services Occupations by Sex
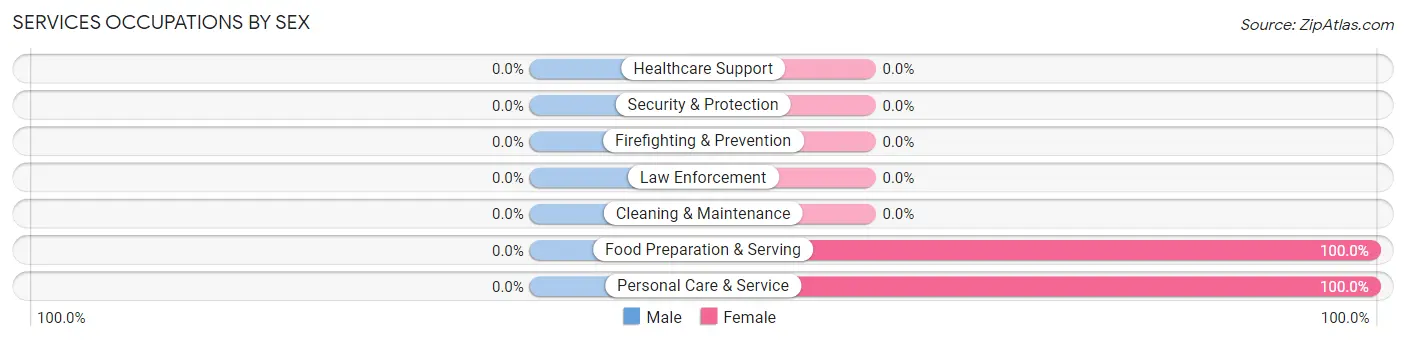
| Occupation | Male | Female |
| Healthcare Support | 0 (0.0%) | 0 (0.0%) |
| Security & Protection | 0 (0.0%) | 0 (0.0%) |
| Firefighting & Prevention | 0 (0.0%) | 0 (0.0%) |
| Law Enforcement | 0 (0.0%) | 0 (0.0%) |
| Food Preparation & Serving | 0 (0.0%) | 10 (100.0%) |
| Cleaning & Maintenance | 0 (0.0%) | 0 (0.0%) |
| Personal Care & Service | 0 (0.0%) | 16 (100.0%) |
| Total (Category) | 0 (0.0%) | 26 (100.0%) |
| Total (Overall) | 54 (46.6%) | 62 (53.4%) |
Sales and Office Occupations
The most common Sales and Office occupations in Dryville are , and Office & Administration (9 | 7.8%).
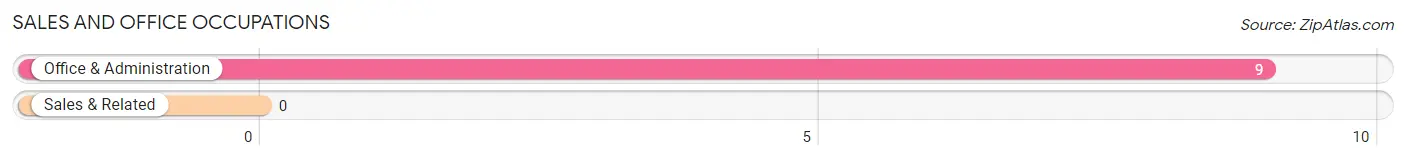
Sales and Office Occupations by Sex
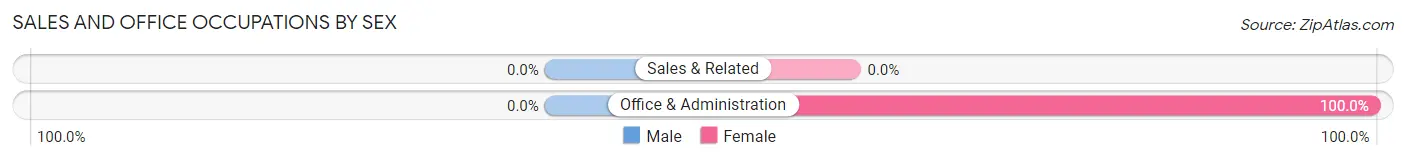
| Occupation | Male | Female |
| Sales & Related | 0 (0.0%) | 0 (0.0%) |
| Office & Administration | 0 (0.0%) | 9 (100.0%) |
| Total (Category) | 0 (0.0%) | 9 (100.0%) |
| Total (Overall) | 54 (46.6%) | 62 (53.4%) |
Natural Resources, Construction and Maintenance Occupations
The most common Natural Resources, Construction and Maintenance occupations in Dryville are , and Installation, Maintenance & Repair (19 | 16.4%).
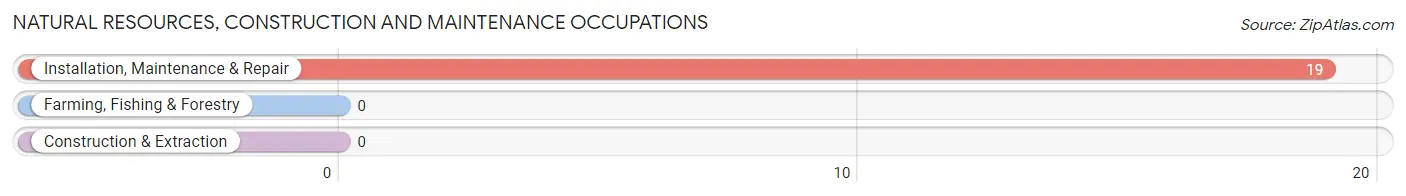
Natural Resources, Construction and Maintenance Occupations by Sex
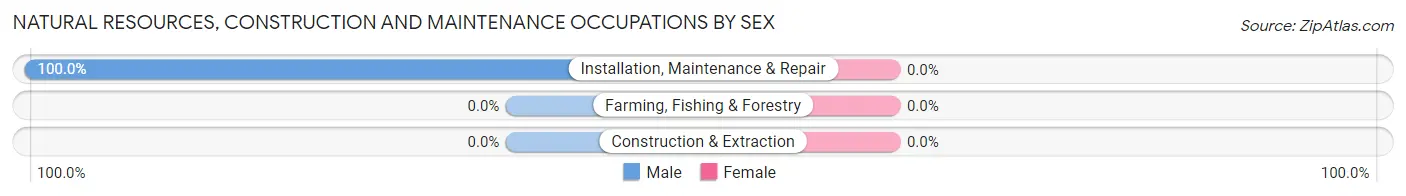
| Occupation | Male | Female |
| Farming, Fishing & Forestry | 0 (0.0%) | 0 (0.0%) |
| Construction & Extraction | 0 (0.0%) | 0 (0.0%) |
| Installation, Maintenance & Repair | 19 (100.0%) | 0 (0.0%) |
| Total (Category) | 19 (100.0%) | 0 (0.0%) |
| Total (Overall) | 54 (46.6%) | 62 (53.4%) |
Production, Transportation and Moving Occupations
The most common Production, Transportation and Moving occupations in Dryville are Production (19 | 16.4%), and Transportation (13 | 11.2%).
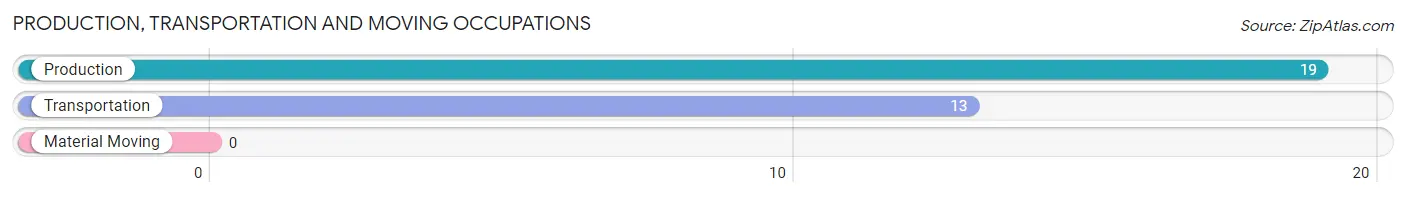
Production, Transportation and Moving Occupations by Sex
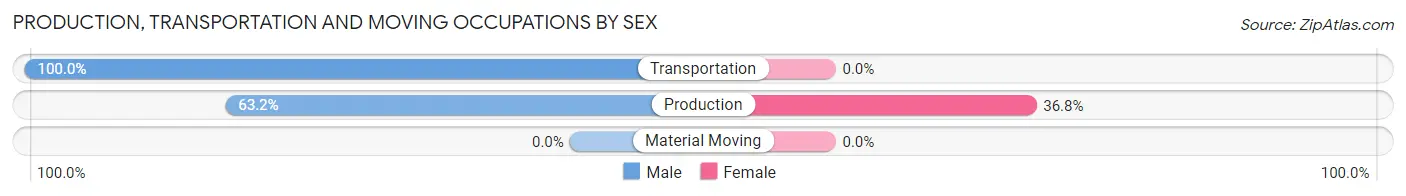
| Occupation | Male | Female |
| Production | 12 (63.2%) | 7 (36.8%) |
| Transportation | 13 (100.0%) | 0 (0.0%) |
| Material Moving | 0 (0.0%) | 0 (0.0%) |
| Total (Category) | 25 (78.1%) | 7 (21.9%) |
| Total (Overall) | 54 (46.6%) | 62 (53.4%) |
Employment Industries by Sex in Dryville
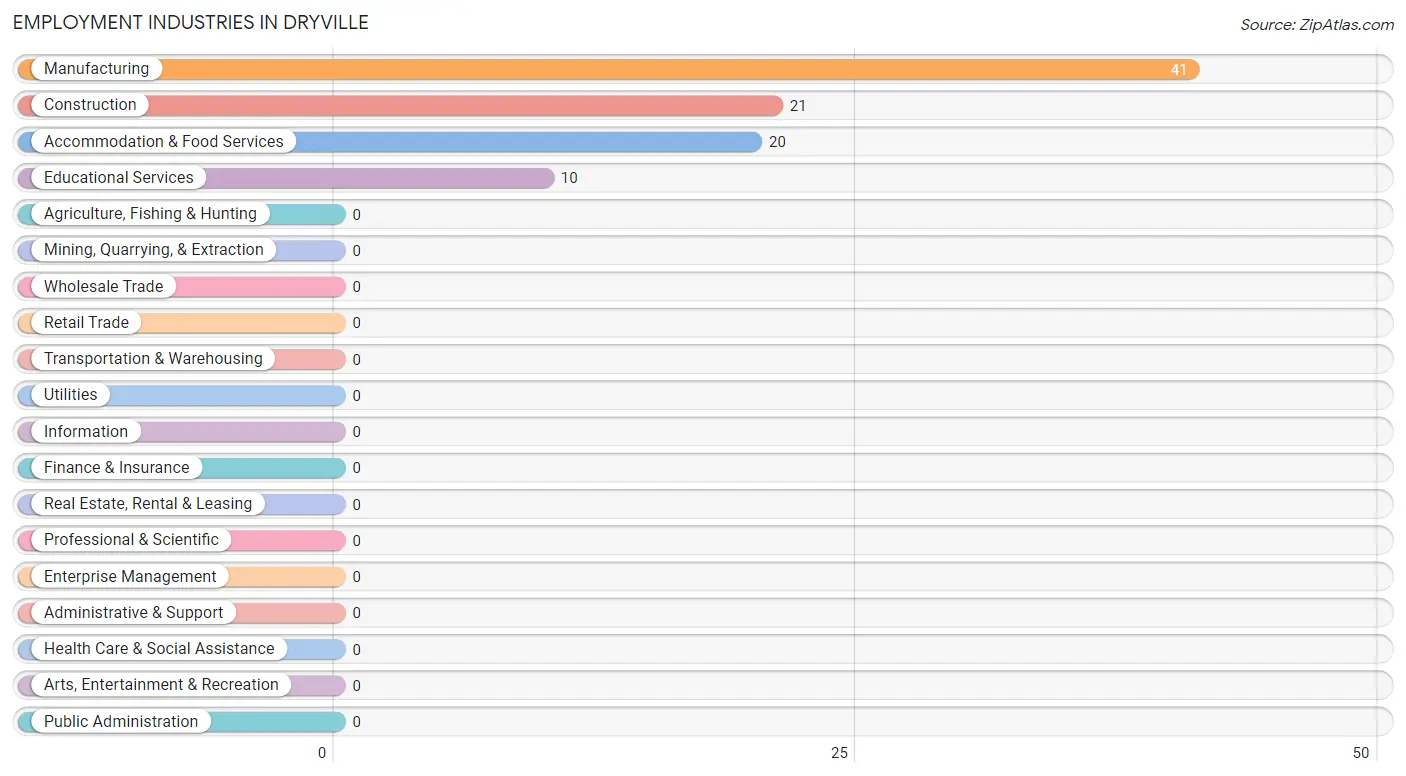
Employment Industries in Dryville
The major employment industries in Dryville include Manufacturing (41 | 35.3%), Construction (21 | 18.1%), Accommodation & Food Services (20 | 17.2%), and Educational Services (10 | 8.6%).
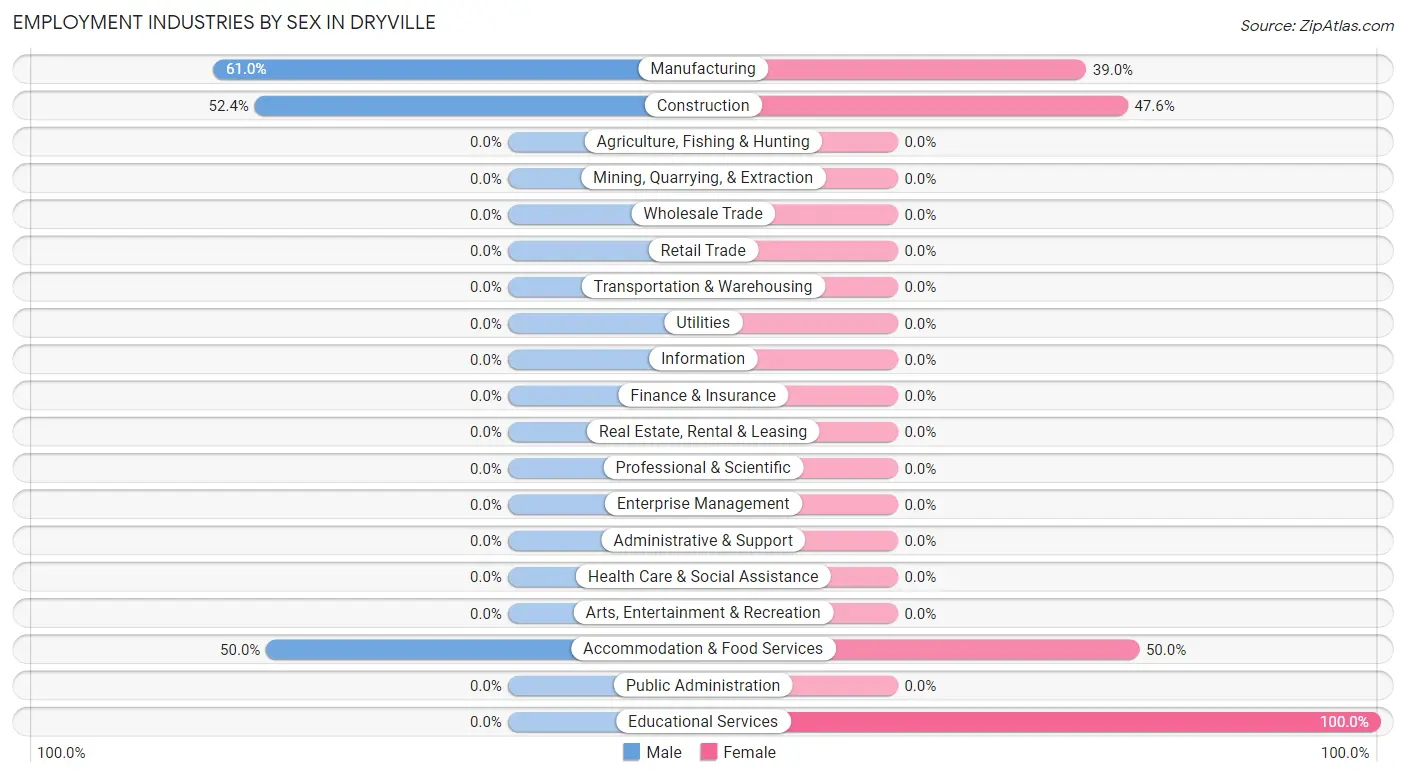
Employment Industries by Sex in Dryville
The Dryville industries that see more men than women are Manufacturing (61.0%), Construction (52.4%), and Accommodation & Food Services (50.0%), whereas the industries that tend to have a higher number of women are Educational Services (100.0%), Accommodation & Food Services (50.0%), and Construction (47.6%).
| Industry | Male | Female |
| Agriculture, Fishing & Hunting | 0 (0.0%) | 0 (0.0%) |
| Mining, Quarrying, & Extraction | 0 (0.0%) | 0 (0.0%) |
| Construction | 11 (52.4%) | 10 (47.6%) |
| Manufacturing | 25 (61.0%) | 16 (39.0%) |
| Wholesale Trade | 0 (0.0%) | 0 (0.0%) |
| Retail Trade | 0 (0.0%) | 0 (0.0%) |
| Transportation & Warehousing | 0 (0.0%) | 0 (0.0%) |
| Utilities | 0 (0.0%) | 0 (0.0%) |
| Information | 0 (0.0%) | 0 (0.0%) |
| Finance & Insurance | 0 (0.0%) | 0 (0.0%) |
| Real Estate, Rental & Leasing | 0 (0.0%) | 0 (0.0%) |
| Professional & Scientific | 0 (0.0%) | 0 (0.0%) |
| Enterprise Management | 0 (0.0%) | 0 (0.0%) |
| Administrative & Support | 0 (0.0%) | 0 (0.0%) |
| Educational Services | 0 (0.0%) | 10 (100.0%) |
| Health Care & Social Assistance | 0 (0.0%) | 0 (0.0%) |
| Arts, Entertainment & Recreation | 0 (0.0%) | 0 (0.0%) |
| Accommodation & Food Services | 10 (50.0%) | 10 (50.0%) |
| Public Administration | 0 (0.0%) | 0 (0.0%) |
| Total | 54 (46.6%) | 62 (53.4%) |
Education in Dryville
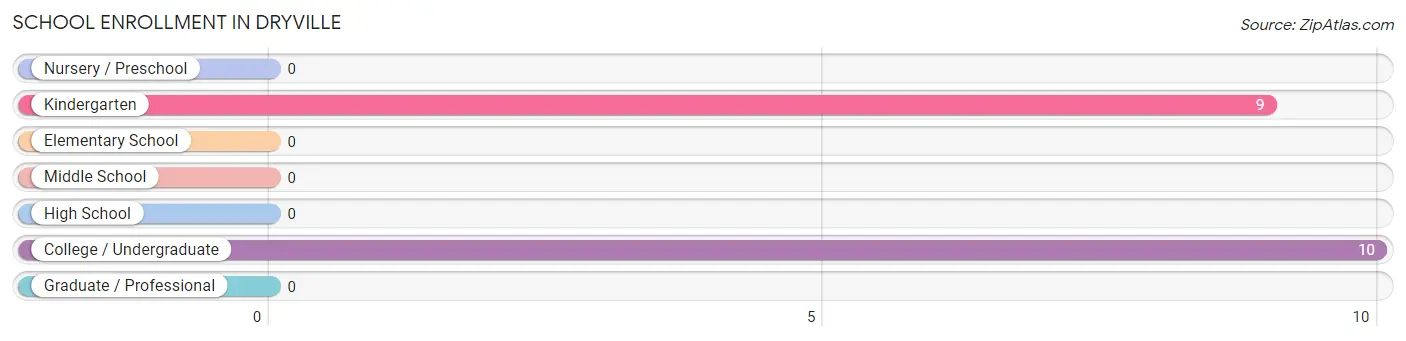
School Enrollment in Dryville
The most common levels of schooling among the 19 students in Dryville are college / undergraduate (10 | 52.6%), and kindergarten (9 | 47.4%).
| School Level | # Students | % Students |
| Nursery / Preschool | 0 | 0.0% |
| Kindergarten | 9 | 47.4% |
| Elementary School | 0 | 0.0% |
| Middle School | 0 | 0.0% |
| High School | 0 | 0.0% |
| College / Undergraduate | 10 | 52.6% |
| Graduate / Professional | 0 | 0.0% |
| Total | 19 | 100.0% |
School Enrollment by Age by Funding Source in Dryville
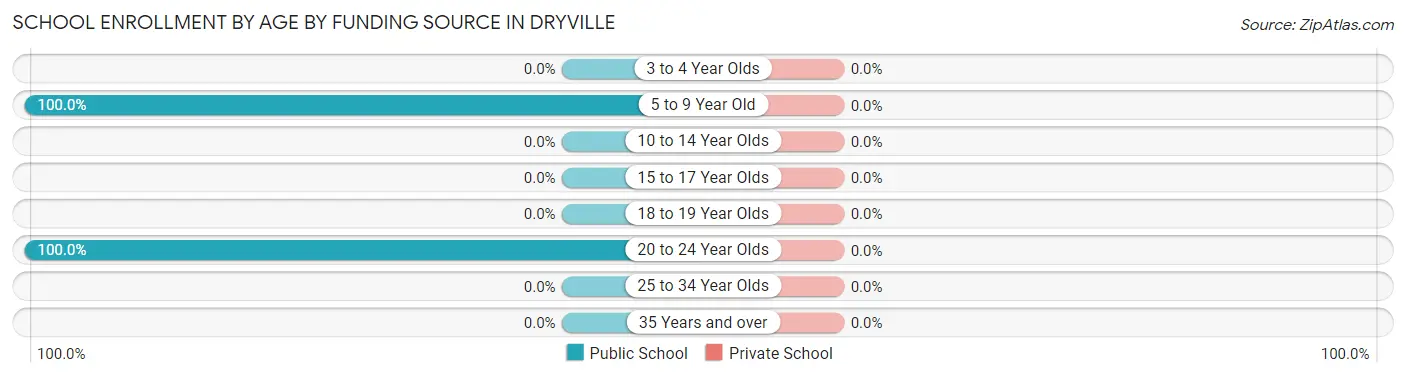
| Age Bracket | Public School | Private School |
| 3 to 4 Year Olds | 0 (0.0%) | 0 (0.0%) |
| 5 to 9 Year Old | 9 (100.0%) | 0 (0.0%) |
| 10 to 14 Year Olds | 0 (0.0%) | 0 (0.0%) |
| 15 to 17 Year Olds | 0 (0.0%) | 0 (0.0%) |
| 18 to 19 Year Olds | 0 (0.0%) | 0 (0.0%) |
| 20 to 24 Year Olds | 10 (100.0%) | 0 (0.0%) |
| 25 to 34 Year Olds | 0 (0.0%) | 0 (0.0%) |
| 35 Years and over | 0 (0.0%) | 0 (0.0%) |
| Total | 19 (100.0%) | 0 (0.0%) |
Educational Attainment by Field of Study in Dryville
Business (10 | 50.0%), and education (10 | 50.0%) are the most common fields of study among 20 individuals in Dryville who have obtained a bachelor's degree or higher.
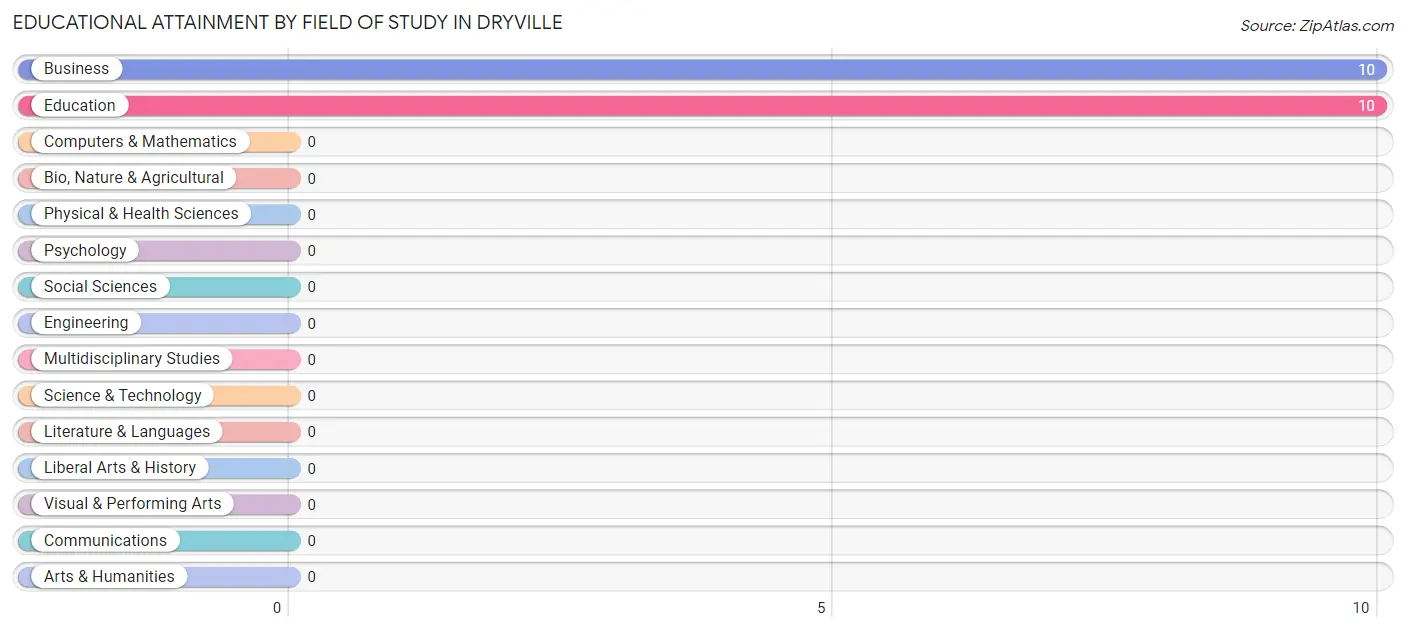
| Field of Study | # Graduates | % Graduates |
| Computers & Mathematics | 0 | 0.0% |
| Bio, Nature & Agricultural | 0 | 0.0% |
| Physical & Health Sciences | 0 | 0.0% |
| Psychology | 0 | 0.0% |
| Social Sciences | 0 | 0.0% |
| Engineering | 0 | 0.0% |
| Multidisciplinary Studies | 0 | 0.0% |
| Science & Technology | 0 | 0.0% |
| Business | 10 | 50.0% |
| Education | 10 | 50.0% |
| Literature & Languages | 0 | 0.0% |
| Liberal Arts & History | 0 | 0.0% |
| Visual & Performing Arts | 0 | 0.0% |
| Communications | 0 | 0.0% |
| Arts & Humanities | 0 | 0.0% |
| Total | 20 | 100.0% |
Transportation & Commute in Dryville
Vehicle Availability by Sex in Dryville
The most prevalent vehicle ownership categories in Dryville are males with 3 vehicles (21, accounting for 38.9%) and females with 3 vehicles (30, making up 33.9%).
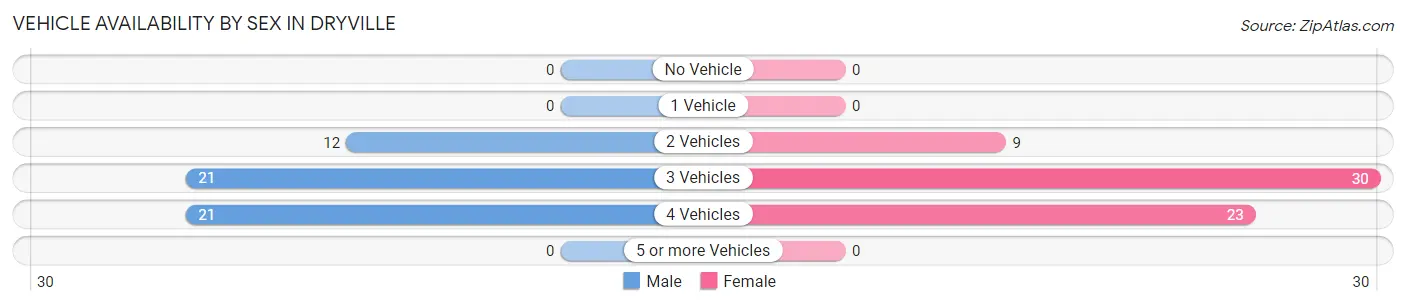
| Vehicles Available | Male | Female |
| No Vehicle | 0 (0.0%) | 0 (0.0%) |
| 1 Vehicle | 0 (0.0%) | 0 (0.0%) |
| 2 Vehicles | 12 (22.2%) | 9 (14.5%) |
| 3 Vehicles | 21 (38.9%) | 30 (48.4%) |
| 4 Vehicles | 21 (38.9%) | 23 (37.1%) |
| 5 or more Vehicles | 0 (0.0%) | 0 (0.0%) |
| Total | 54 (100.0%) | 62 (100.0%) |
Commute Time in Dryville
The most frequently occuring commute durations in Dryville are 15 to 19 minutes (38 commuters, 35.2%), 30 to 34 minutes (21 commuters, 19.4%), and 5 to 9 minutes (20 commuters, 18.5%).
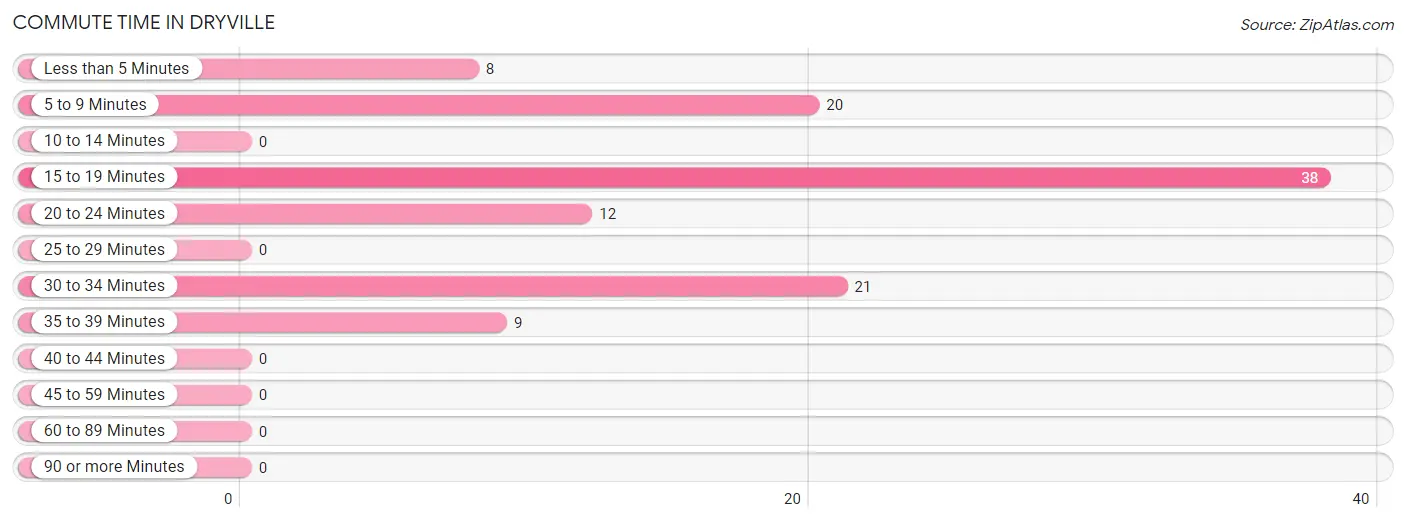
| Commute Time | # Commuters | % Commuters |
| Less than 5 Minutes | 8 | 7.4% |
| 5 to 9 Minutes | 20 | 18.5% |
| 10 to 14 Minutes | 0 | 0.0% |
| 15 to 19 Minutes | 38 | 35.2% |
| 20 to 24 Minutes | 12 | 11.1% |
| 25 to 29 Minutes | 0 | 0.0% |
| 30 to 34 Minutes | 21 | 19.4% |
| 35 to 39 Minutes | 9 | 8.3% |
| 40 to 44 Minutes | 0 | 0.0% |
| 45 to 59 Minutes | 0 | 0.0% |
| 60 to 89 Minutes | 0 | 0.0% |
| 90 or more Minutes | 0 | 0.0% |
Commute Time by Sex in Dryville
The most common commute times in Dryville are 5 to 9 minutes (13 commuters, 24.1%) for males and 15 to 19 minutes (28 commuters, 51.8%) for females.
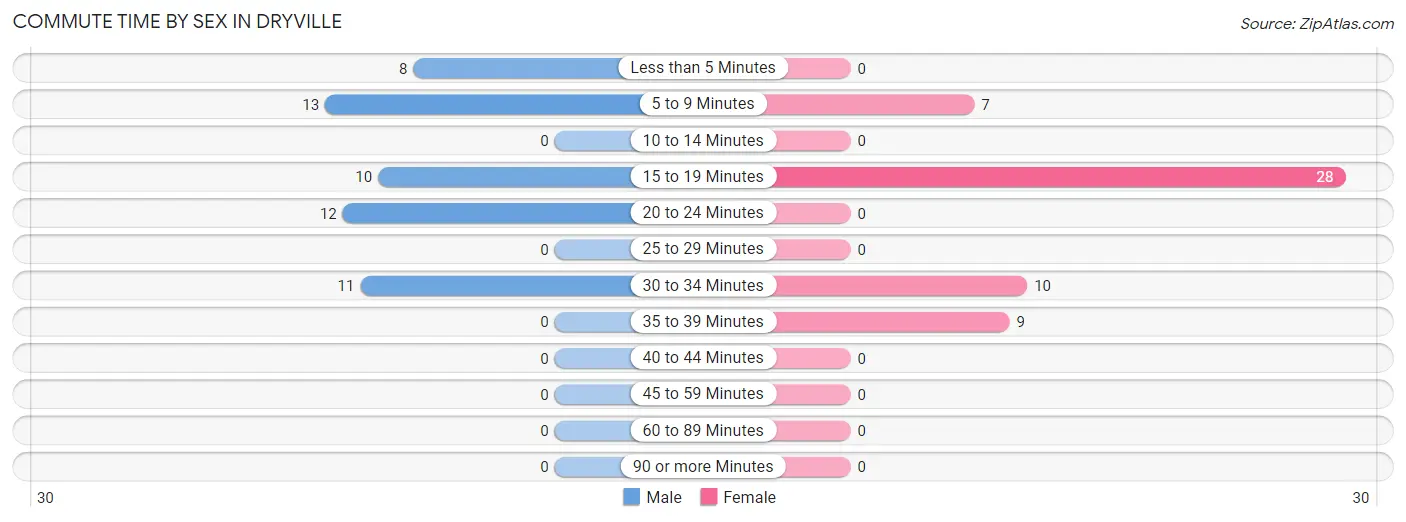
| Commute Time | Male | Female |
| Less than 5 Minutes | 8 (14.8%) | 0 (0.0%) |
| 5 to 9 Minutes | 13 (24.1%) | 7 (13.0%) |
| 10 to 14 Minutes | 0 (0.0%) | 0 (0.0%) |
| 15 to 19 Minutes | 10 (18.5%) | 28 (51.8%) |
| 20 to 24 Minutes | 12 (22.2%) | 0 (0.0%) |
| 25 to 29 Minutes | 0 (0.0%) | 0 (0.0%) |
| 30 to 34 Minutes | 11 (20.4%) | 10 (18.5%) |
| 35 to 39 Minutes | 0 (0.0%) | 9 (16.7%) |
| 40 to 44 Minutes | 0 (0.0%) | 0 (0.0%) |
| 45 to 59 Minutes | 0 (0.0%) | 0 (0.0%) |
| 60 to 89 Minutes | 0 (0.0%) | 0 (0.0%) |
| 90 or more Minutes | 0 (0.0%) | 0 (0.0%) |
Time of Departure to Work by Sex in Dryville
The most frequent times of departure to work in Dryville are 5:30 AM to 5:59 AM (22, 40.7%) for males and 6:30 AM to 6:59 AM (15, 27.8%) for females.
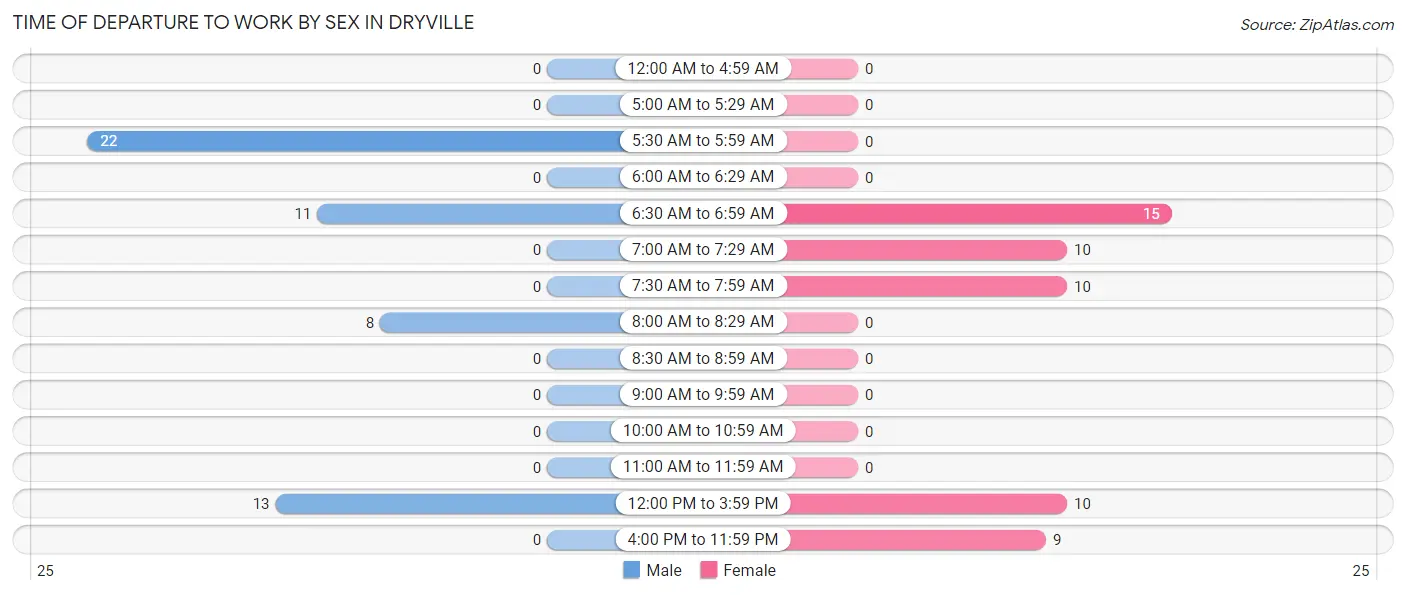
| Time of Departure | Male | Female |
| 12:00 AM to 4:59 AM | 0 (0.0%) | 0 (0.0%) |
| 5:00 AM to 5:29 AM | 0 (0.0%) | 0 (0.0%) |
| 5:30 AM to 5:59 AM | 22 (40.7%) | 0 (0.0%) |
| 6:00 AM to 6:29 AM | 0 (0.0%) | 0 (0.0%) |
| 6:30 AM to 6:59 AM | 11 (20.4%) | 15 (27.8%) |
| 7:00 AM to 7:29 AM | 0 (0.0%) | 10 (18.5%) |
| 7:30 AM to 7:59 AM | 0 (0.0%) | 10 (18.5%) |
| 8:00 AM to 8:29 AM | 8 (14.8%) | 0 (0.0%) |
| 8:30 AM to 8:59 AM | 0 (0.0%) | 0 (0.0%) |
| 9:00 AM to 9:59 AM | 0 (0.0%) | 0 (0.0%) |
| 10:00 AM to 10:59 AM | 0 (0.0%) | 0 (0.0%) |
| 11:00 AM to 11:59 AM | 0 (0.0%) | 0 (0.0%) |
| 12:00 PM to 3:59 PM | 13 (24.1%) | 10 (18.5%) |
| 4:00 PM to 11:59 PM | 0 (0.0%) | 9 (16.7%) |
| Total | 54 (100.0%) | 54 (100.0%) |
Housing Occupancy in Dryville
Occupancy by Ownership in Dryville
Of the total 75 dwellings in Dryville, owner-occupied units account for 66 (88.0%), while renter-occupied units make up 9 (12.0%).
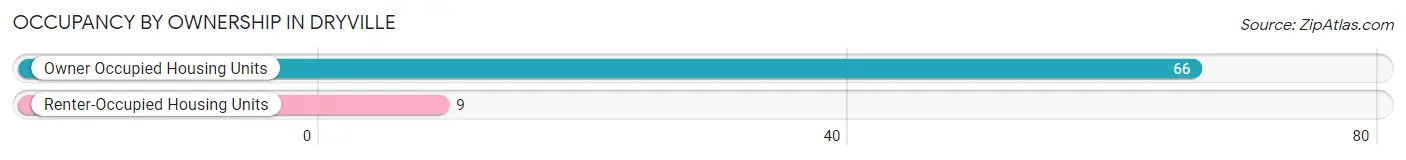
| Occupancy | # Housing Units | % Housing Units |
| Owner Occupied Housing Units | 66 | 88.0% |
| Renter-Occupied Housing Units | 9 | 12.0% |
| Total Occupied Housing Units | 75 | 100.0% |
Occupancy by Household Size in Dryville
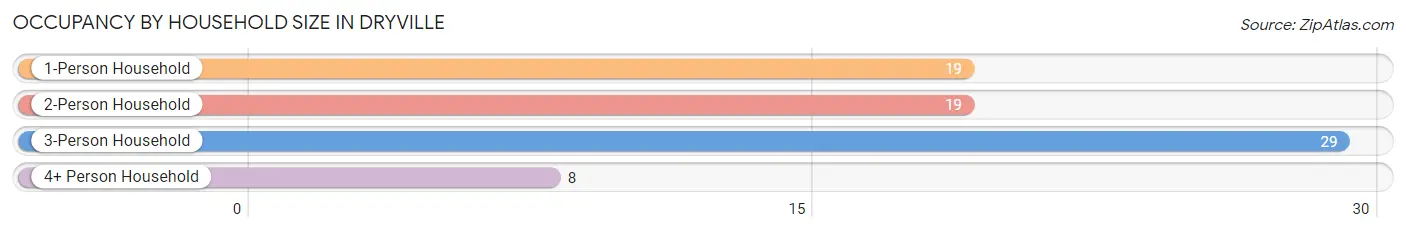
| Household Size | # Housing Units | % Housing Units |
| 1-Person Household | 19 | 25.3% |
| 2-Person Household | 19 | 25.3% |
| 3-Person Household | 29 | 38.7% |
| 4+ Person Household | 8 | 10.7% |
| Total Housing Units | 75 | 100.0% |
Occupancy by Ownership by Household Size in Dryville
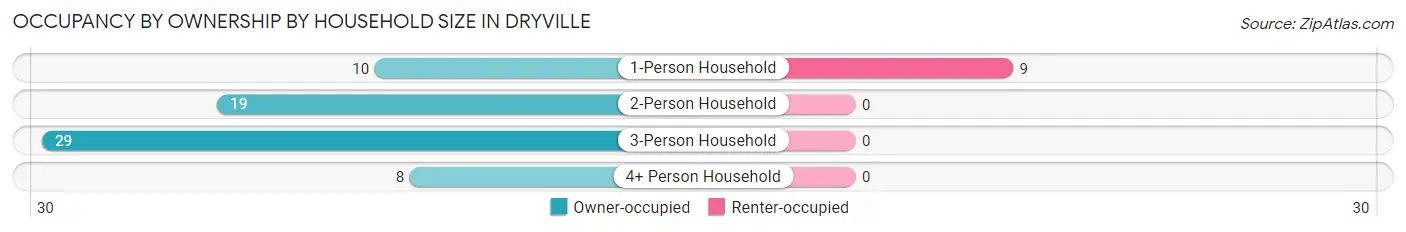
| Household Size | Owner-occupied | Renter-occupied |
| 1-Person Household | 10 (52.6%) | 9 (47.4%) |
| 2-Person Household | 19 (100.0%) | 0 (0.0%) |
| 3-Person Household | 29 (100.0%) | 0 (0.0%) |
| 4+ Person Household | 8 (100.0%) | 0 (0.0%) |
| Total Housing Units | 66 (88.0%) | 9 (12.0%) |
Occupancy by Educational Attainment in Dryville
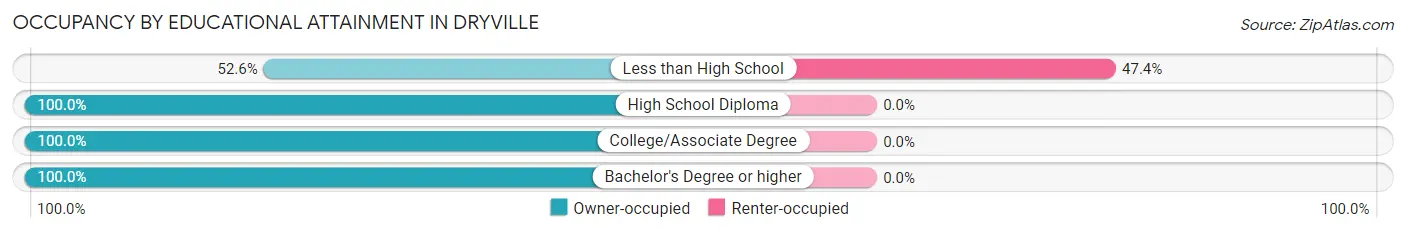
| Household Size | Owner-occupied | Renter-occupied |
| Less than High School | 10 (52.6%) | 9 (47.4%) |
| High School Diploma | 27 (100.0%) | 0 (0.0%) |
| College/Associate Degree | 19 (100.0%) | 0 (0.0%) |
| Bachelor's Degree or higher | 10 (100.0%) | 0 (0.0%) |
Occupancy by Age of Householder in Dryville
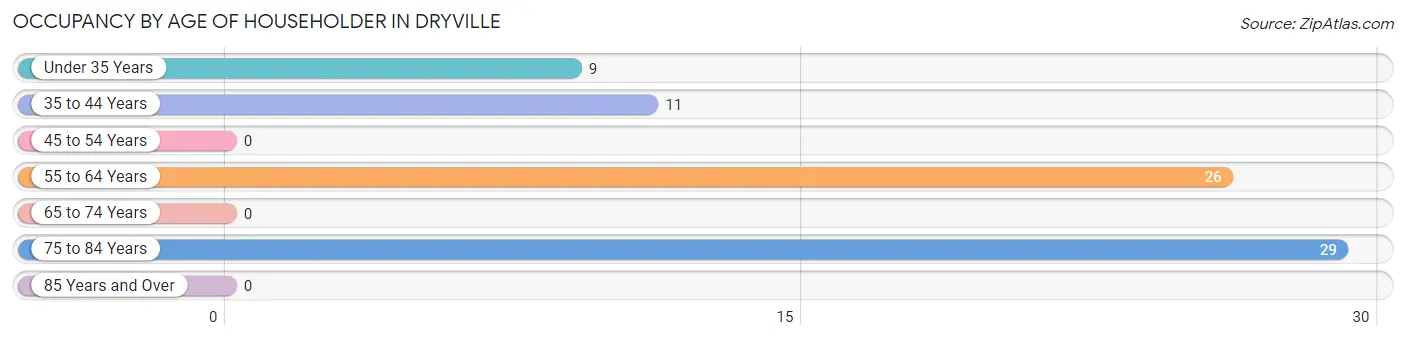
| Age Bracket | # Households | % Households |
| Under 35 Years | 9 | 12.0% |
| 35 to 44 Years | 11 | 14.7% |
| 45 to 54 Years | 0 | 0.0% |
| 55 to 64 Years | 26 | 34.7% |
| 65 to 74 Years | 0 | 0.0% |
| 75 to 84 Years | 29 | 38.7% |
| 85 Years and Over | 0 | 0.0% |
| Total | 75 | 100.0% |
Housing Finances in Dryville
Median Income by Occupancy in Dryville
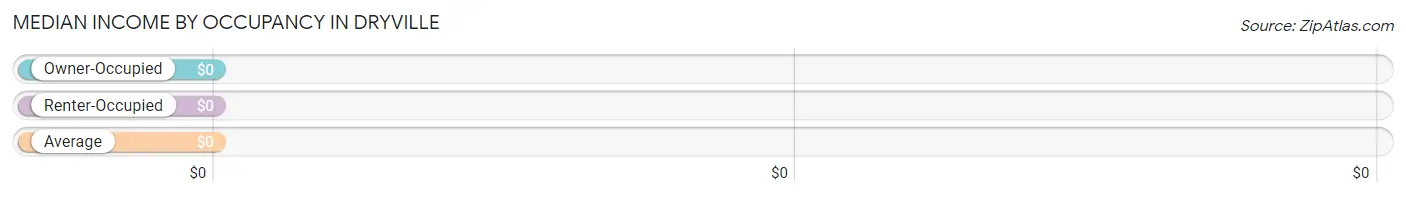
| Occupancy Type | # Households | Median Income |
| Owner-Occupied | 66 (88.0%) | $0 |
| Renter-Occupied | 9 (12.0%) | $0 |
| Average | 75 (100.0%) | $0 |
Occupancy by Householder Income Bracket in Dryville
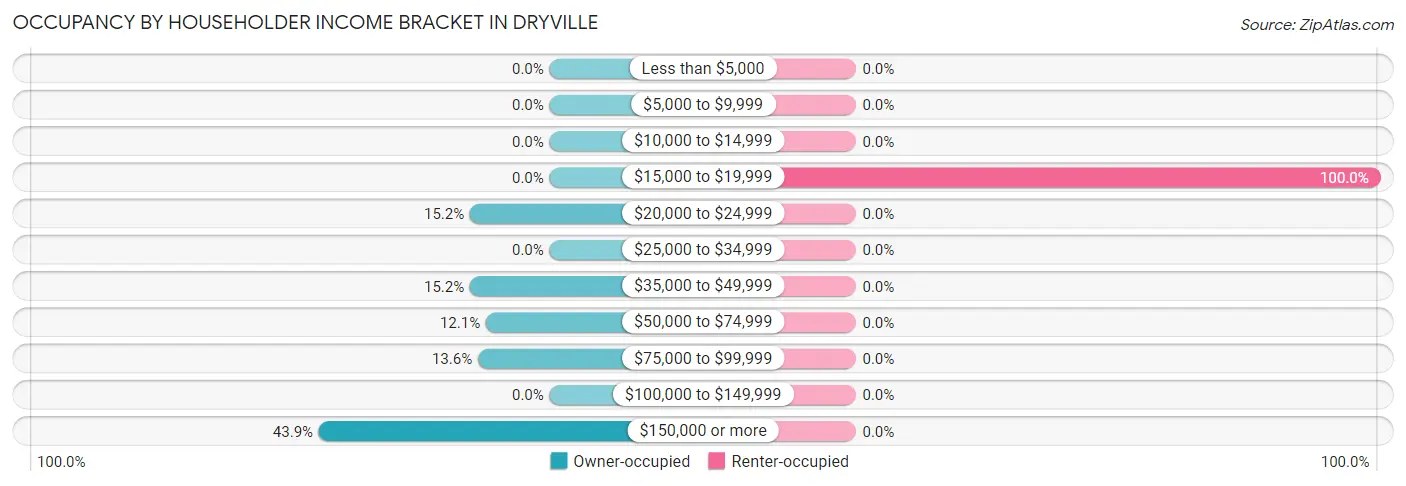
| Income Bracket | Owner-occupied | Renter-occupied |
| Less than $5,000 | 0 (0.0%) | 0 (0.0%) |
| $5,000 to $9,999 | 0 (0.0%) | 0 (0.0%) |
| $10,000 to $14,999 | 0 (0.0%) | 0 (0.0%) |
| $15,000 to $19,999 | 0 (0.0%) | 9 (100.0%) |
| $20,000 to $24,999 | 10 (15.1%) | 0 (0.0%) |
| $25,000 to $34,999 | 0 (0.0%) | 0 (0.0%) |
| $35,000 to $49,999 | 10 (15.1%) | 0 (0.0%) |
| $50,000 to $74,999 | 8 (12.1%) | 0 (0.0%) |
| $75,000 to $99,999 | 9 (13.6%) | 0 (0.0%) |
| $100,000 to $149,999 | 0 (0.0%) | 0 (0.0%) |
| $150,000 or more | 29 (43.9%) | 0 (0.0%) |
| Total | 66 (100.0%) | 9 (100.0%) |
Monthly Housing Cost Tiers in Dryville
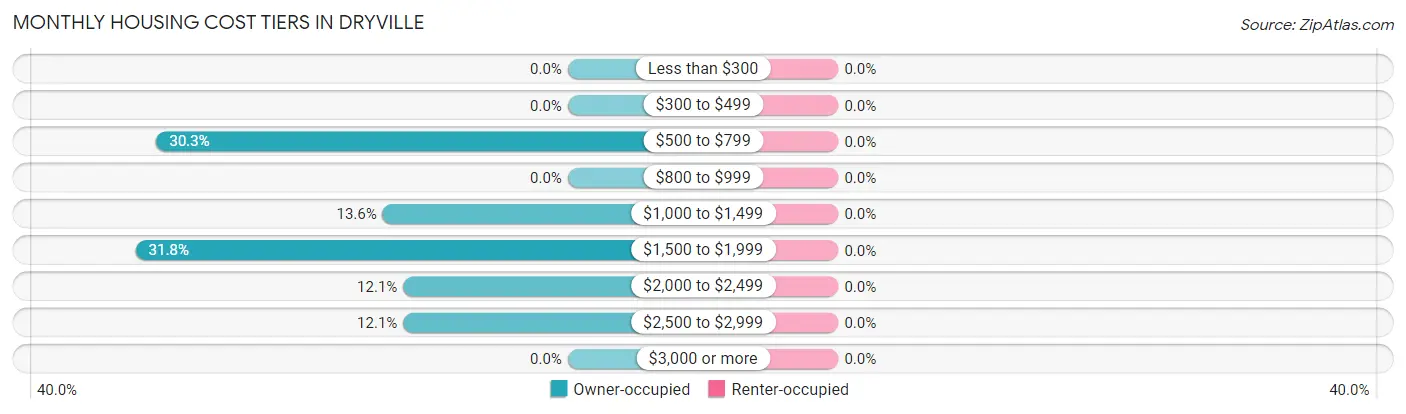
| Monthly Cost | Owner-occupied | Renter-occupied |
| Less than $300 | 0 (0.0%) | 0 (0.0%) |
| $300 to $499 | 0 (0.0%) | 0 (0.0%) |
| $500 to $799 | 20 (30.3%) | 0 (0.0%) |
| $800 to $999 | 0 (0.0%) | 0 (0.0%) |
| $1,000 to $1,499 | 9 (13.6%) | 0 (0.0%) |
| $1,500 to $1,999 | 21 (31.8%) | 0 (0.0%) |
| $2,000 to $2,499 | 8 (12.1%) | 0 (0.0%) |
| $2,500 to $2,999 | 8 (12.1%) | 0 (0.0%) |
| $3,000 or more | 0 (0.0%) | 0 (0.0%) |
| Total | 66 (100.0%) | 9 (100.0%) |
Physical Housing Characteristics in Dryville
Housing Structures in Dryville
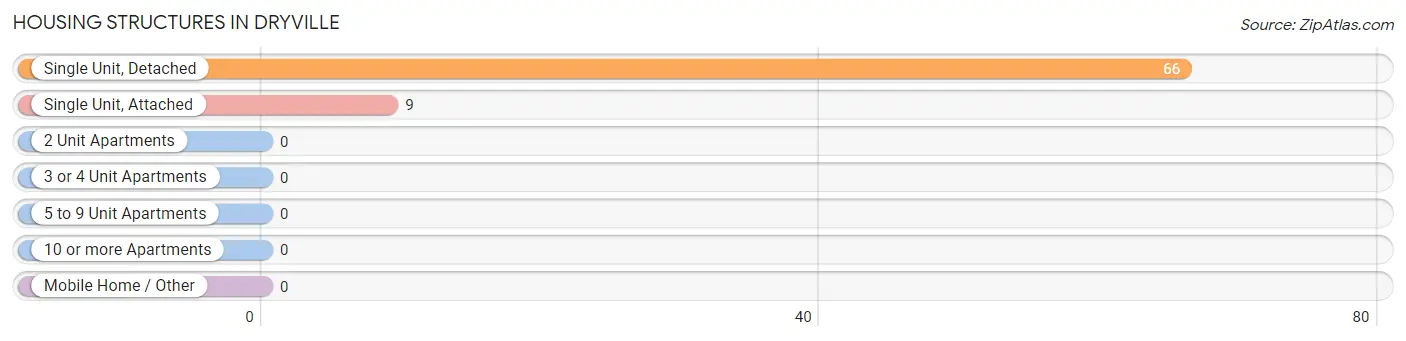
| Structure Type | # Housing Units | % Housing Units |
| Single Unit, Detached | 66 | 88.0% |
| Single Unit, Attached | 9 | 12.0% |
| 2 Unit Apartments | 0 | 0.0% |
| 3 or 4 Unit Apartments | 0 | 0.0% |
| 5 to 9 Unit Apartments | 0 | 0.0% |
| 10 or more Apartments | 0 | 0.0% |
| Mobile Home / Other | 0 | 0.0% |
| Total | 75 | 100.0% |
Housing Structures by Occupancy in Dryville
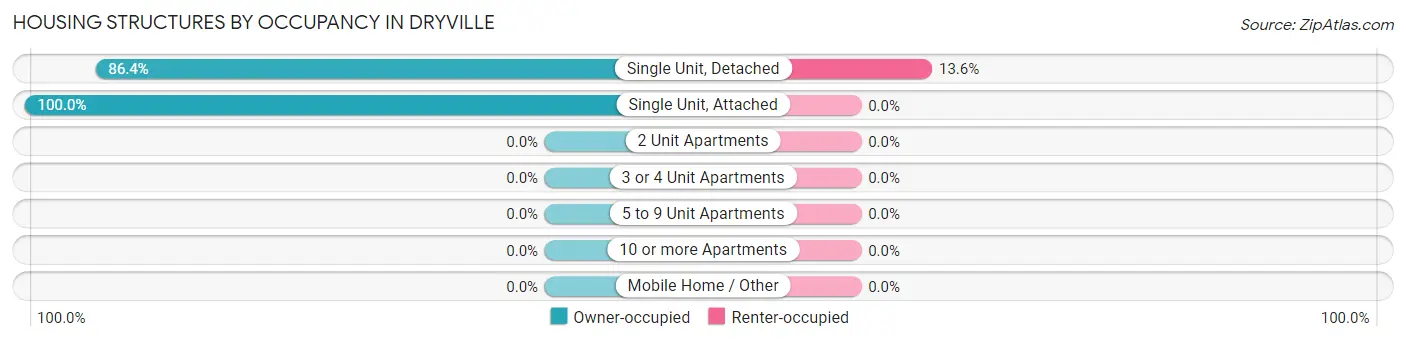
| Structure Type | Owner-occupied | Renter-occupied |
| Single Unit, Detached | 57 (86.4%) | 9 (13.6%) |
| Single Unit, Attached | 9 (100.0%) | 0 (0.0%) |
| 2 Unit Apartments | 0 (0.0%) | 0 (0.0%) |
| 3 or 4 Unit Apartments | 0 (0.0%) | 0 (0.0%) |
| 5 to 9 Unit Apartments | 0 (0.0%) | 0 (0.0%) |
| 10 or more Apartments | 0 (0.0%) | 0 (0.0%) |
| Mobile Home / Other | 0 (0.0%) | 0 (0.0%) |
| Total | 66 (88.0%) | 9 (12.0%) |
Housing Structures by Number of Rooms in Dryville
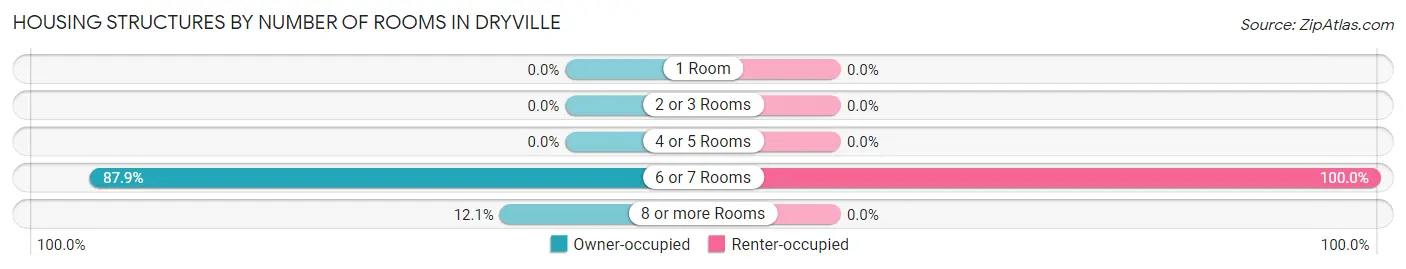
| Number of Rooms | Owner-occupied | Renter-occupied |
| 1 Room | 0 (0.0%) | 0 (0.0%) |
| 2 or 3 Rooms | 0 (0.0%) | 0 (0.0%) |
| 4 or 5 Rooms | 0 (0.0%) | 0 (0.0%) |
| 6 or 7 Rooms | 58 (87.9%) | 9 (100.0%) |
| 8 or more Rooms | 8 (12.1%) | 0 (0.0%) |
| Total | 66 (100.0%) | 9 (100.0%) |
Housing Structure by Heating Type in Dryville
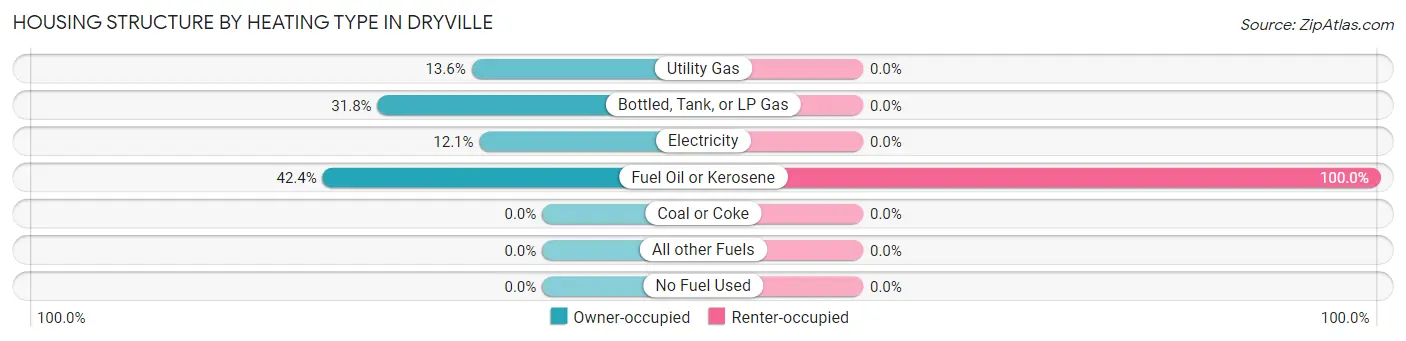
| Heating Type | Owner-occupied | Renter-occupied |
| Utility Gas | 9 (13.6%) | 0 (0.0%) |
| Bottled, Tank, or LP Gas | 21 (31.8%) | 0 (0.0%) |
| Electricity | 8 (12.1%) | 0 (0.0%) |
| Fuel Oil or Kerosene | 28 (42.4%) | 9 (100.0%) |
| Coal or Coke | 0 (0.0%) | 0 (0.0%) |
| All other Fuels | 0 (0.0%) | 0 (0.0%) |
| No Fuel Used | 0 (0.0%) | 0 (0.0%) |
| Total | 66 (100.0%) | 9 (100.0%) |
Household Vehicle Usage in Dryville
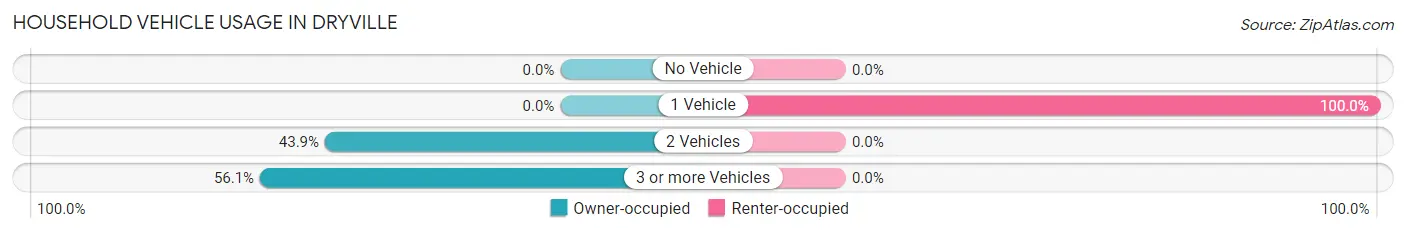
| Vehicles per Household | Owner-occupied | Renter-occupied |
| No Vehicle | 0 (0.0%) | 0 (0.0%) |
| 1 Vehicle | 0 (0.0%) | 9 (100.0%) |
| 2 Vehicles | 29 (43.9%) | 0 (0.0%) |
| 3 or more Vehicles | 37 (56.1%) | 0 (0.0%) |
| Total | 66 (100.0%) | 9 (100.0%) |
Real Estate & Mortgages in Dryville
Real Estate and Mortgage Overview in Dryville
| Characteristic | Without Mortgage | With Mortgage |
| Housing Units | 20 | 46 |
| Median Property Value | - | - |
| Median Household Income | - | - |
| Monthly Housing Costs | - | - |
| Real Estate Taxes | - | - |
Property Value by Mortgage Status in Dryville
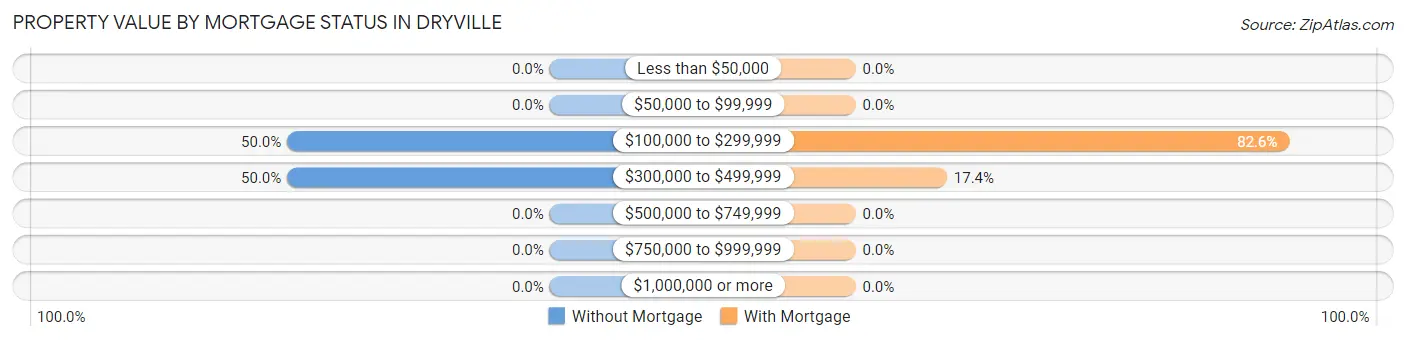
| Property Value | Without Mortgage | With Mortgage |
| Less than $50,000 | 0 (0.0%) | 0 (0.0%) |
| $50,000 to $99,999 | 0 (0.0%) | 0 (0.0%) |
| $100,000 to $299,999 | 10 (50.0%) | 38 (82.6%) |
| $300,000 to $499,999 | 10 (50.0%) | 8 (17.4%) |
| $500,000 to $749,999 | 0 (0.0%) | 0 (0.0%) |
| $750,000 to $999,999 | 0 (0.0%) | 0 (0.0%) |
| $1,000,000 or more | 0 (0.0%) | 0 (0.0%) |
| Total | 20 (100.0%) | 46 (100.0%) |
Household Income by Mortgage Status in Dryville
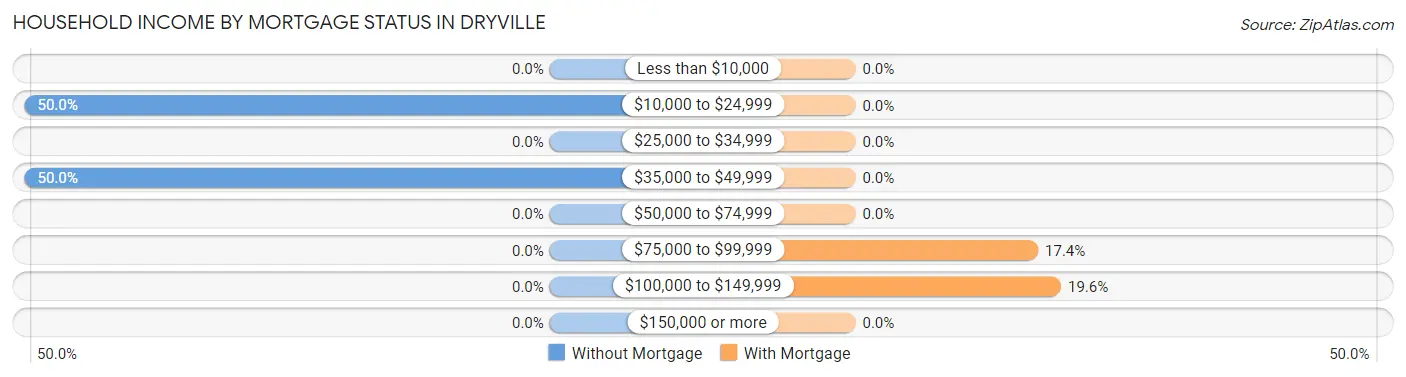
| Household Income | Without Mortgage | With Mortgage |
| Less than $10,000 | 0 (0.0%) | 0 (0.0%) |
| $10,000 to $24,999 | 10 (50.0%) | 0 (0.0%) |
| $25,000 to $34,999 | 0 (0.0%) | 0 (0.0%) |
| $35,000 to $49,999 | 10 (50.0%) | 0 (0.0%) |
| $50,000 to $74,999 | 0 (0.0%) | 0 (0.0%) |
| $75,000 to $99,999 | 0 (0.0%) | 8 (17.4%) |
| $100,000 to $149,999 | 0 (0.0%) | 9 (19.6%) |
| $150,000 or more | 0 (0.0%) | 0 (0.0%) |
| Total | 20 (100.0%) | 46 (100.0%) |
Property Value to Household Income Ratio in Dryville
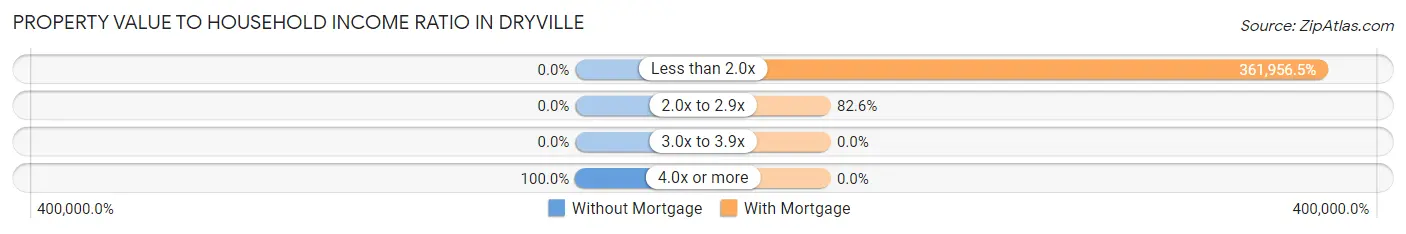
| Value-to-Income Ratio | Without Mortgage | With Mortgage |
| Less than 2.0x | 0 (0.0%) | 166,500 (361,956.5%) |
| 2.0x to 2.9x | 0 (0.0%) | 38 (82.6%) |
| 3.0x to 3.9x | 0 (0.0%) | 0 (0.0%) |
| 4.0x or more | 20 (100.0%) | 0 (0.0%) |
| Total | 20 (100.0%) | 46 (100.0%) |
Real Estate Taxes by Mortgage Status in Dryville
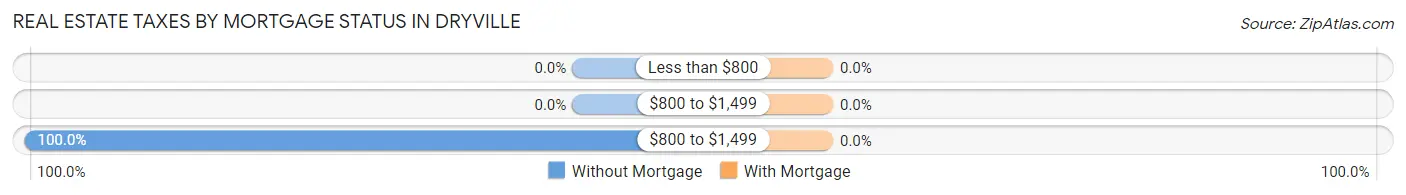
| Property Taxes | Without Mortgage | With Mortgage |
| Less than $800 | 0 (0.0%) | 0 (0.0%) |
| $800 to $1,499 | 0 (0.0%) | 0 (0.0%) |
| $800 to $1,499 | 20 (100.0%) | 0 (0.0%) |
| Total | 20 (100.0%) | 46 (100.0%) |
Health & Disability in Dryville
Health Insurance Coverage by Age in Dryville
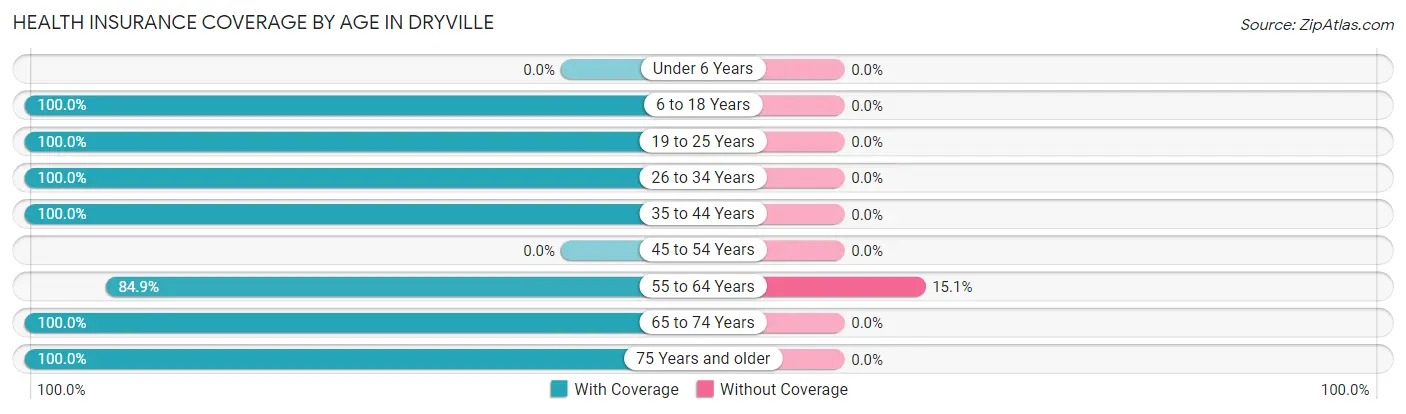
| Age Bracket | With Coverage | Without Coverage |
| Under 6 Years | 0 (0.0%) | 0 (0.0%) |
| 6 to 18 Years | 9 (100.0%) | 0 (0.0%) |
| 19 to 25 Years | 31 (100.0%) | 0 (0.0%) |
| 26 to 34 Years | 21 (100.0%) | 0 (0.0%) |
| 35 to 44 Years | 21 (100.0%) | 0 (0.0%) |
| 45 to 54 Years | 0 (0.0%) | 0 (0.0%) |
| 55 to 64 Years | 45 (84.9%) | 8 (15.1%) |
| 65 to 74 Years | 12 (100.0%) | 0 (0.0%) |
| 75 Years and older | 38 (100.0%) | 0 (0.0%) |
| Total | 177 (95.7%) | 8 (4.3%) |
Health Insurance Coverage by Citizenship Status in Dryville
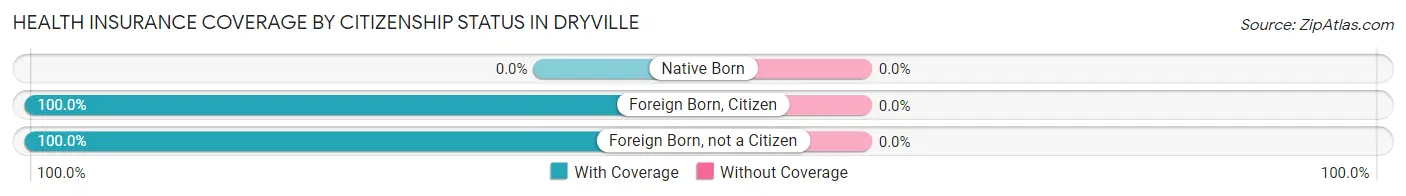
| Citizenship Status | With Coverage | Without Coverage |
| Native Born | 0 (0.0%) | 0 (0.0%) |
| Foreign Born, Citizen | 9 (100.0%) | 0 (0.0%) |
| Foreign Born, not a Citizen | 31 (100.0%) | 0 (0.0%) |
Health Insurance Coverage by Household Income in Dryville
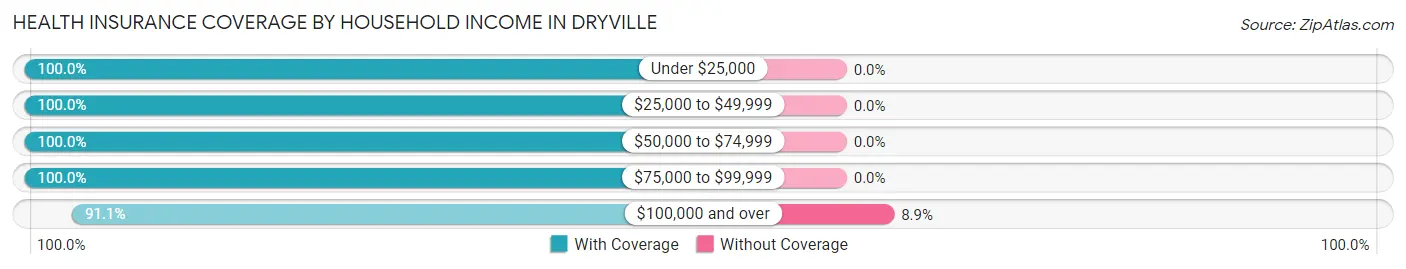
| Household Income | With Coverage | Without Coverage |
| Under $25,000 | 19 (100.0%) | 0 (0.0%) |
| $25,000 to $49,999 | 31 (100.0%) | 0 (0.0%) |
| $50,000 to $74,999 | 15 (100.0%) | 0 (0.0%) |
| $75,000 to $99,999 | 30 (100.0%) | 0 (0.0%) |
| $100,000 and over | 82 (91.1%) | 8 (8.9%) |
Public vs Private Health Insurance Coverage by Age in Dryville
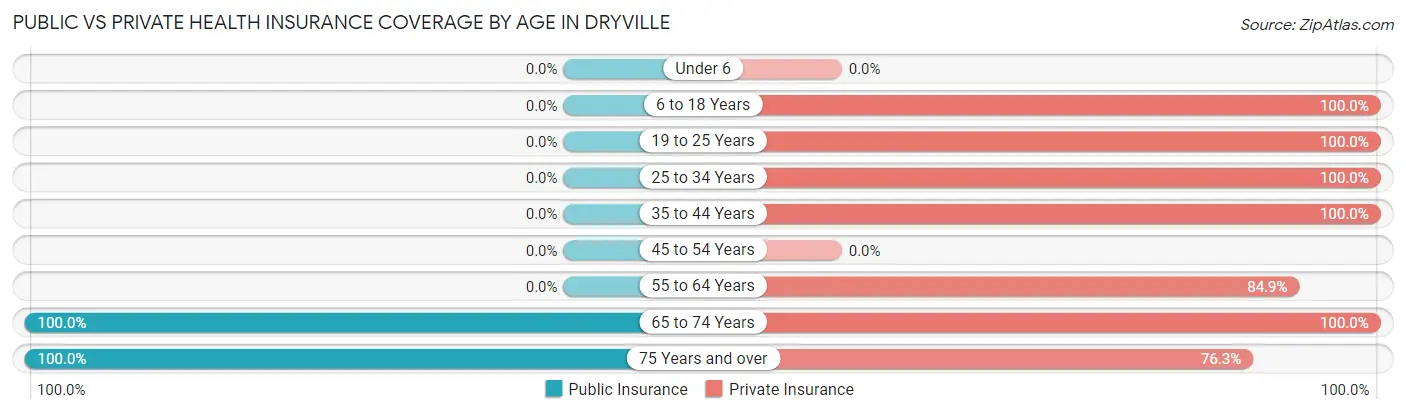
| Age Bracket | Public Insurance | Private Insurance |
| Under 6 | 0 (0.0%) | 0 (0.0%) |
| 6 to 18 Years | 0 (0.0%) | 9 (100.0%) |
| 19 to 25 Years | 0 (0.0%) | 31 (100.0%) |
| 25 to 34 Years | 0 (0.0%) | 21 (100.0%) |
| 35 to 44 Years | 0 (0.0%) | 21 (100.0%) |
| 45 to 54 Years | 0 (0.0%) | 0 (0.0%) |
| 55 to 64 Years | 0 (0.0%) | 45 (84.9%) |
| 65 to 74 Years | 12 (100.0%) | 12 (100.0%) |
| 75 Years and over | 38 (100.0%) | 29 (76.3%) |
| Total | 50 (27.0%) | 168 (90.8%) |
Disability Status by Sex by Age in Dryville
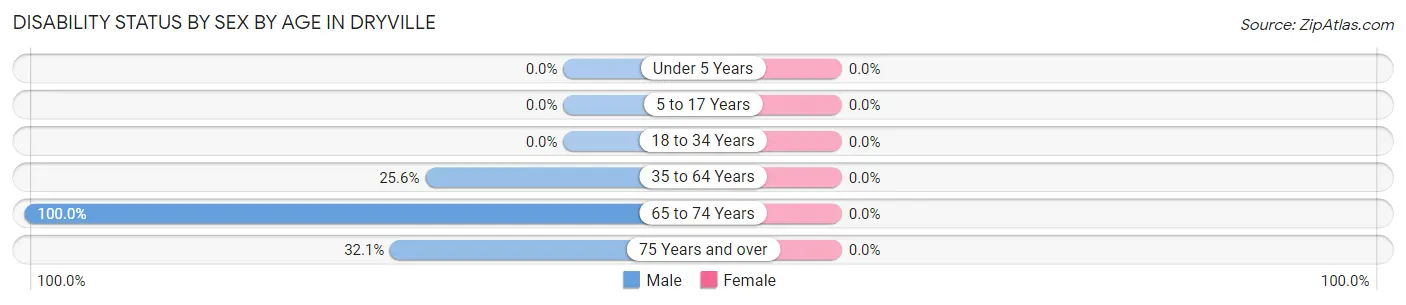
| Age Bracket | Male | Female |
| Under 5 Years | 0 (0.0%) | 0 (0.0%) |
| 5 to 17 Years | 0 (0.0%) | 0 (0.0%) |
| 18 to 34 Years | 0 (0.0%) | 0 (0.0%) |
| 35 to 64 Years | 10 (25.6%) | 0 (0.0%) |
| 65 to 74 Years | 12 (100.0%) | 0 (0.0%) |
| 75 Years and over | 9 (32.1%) | 0 (0.0%) |
Disability Class by Sex by Age in Dryville
Disability Class: Hearing Difficulty
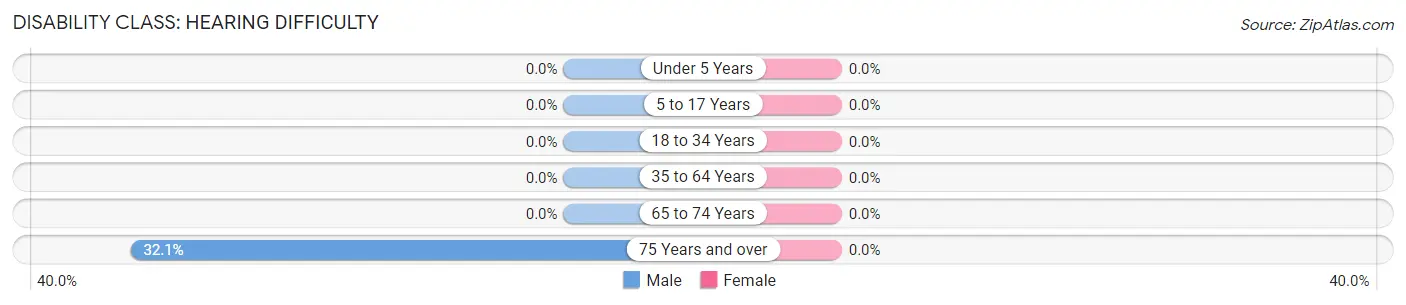
| Age Bracket | Male | Female |
| Under 5 Years | 0 (0.0%) | 0 (0.0%) |
| 5 to 17 Years | 0 (0.0%) | 0 (0.0%) |
| 18 to 34 Years | 0 (0.0%) | 0 (0.0%) |
| 35 to 64 Years | 0 (0.0%) | 0 (0.0%) |
| 65 to 74 Years | 0 (0.0%) | 0 (0.0%) |
| 75 Years and over | 9 (32.1%) | 0 (0.0%) |
Disability Class: Vision Difficulty
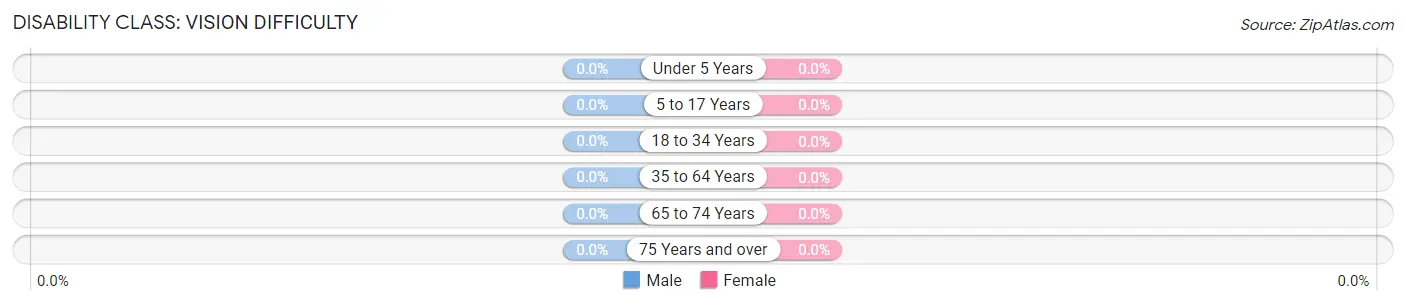
| Age Bracket | Male | Female |
| Under 5 Years | 0 (0.0%) | 0 (0.0%) |
| 5 to 17 Years | 0 (0.0%) | 0 (0.0%) |
| 18 to 34 Years | 0 (0.0%) | 0 (0.0%) |
| 35 to 64 Years | 0 (0.0%) | 0 (0.0%) |
| 65 to 74 Years | 0 (0.0%) | 0 (0.0%) |
| 75 Years and over | 0 (0.0%) | 0 (0.0%) |
Disability Class: Cognitive Difficulty
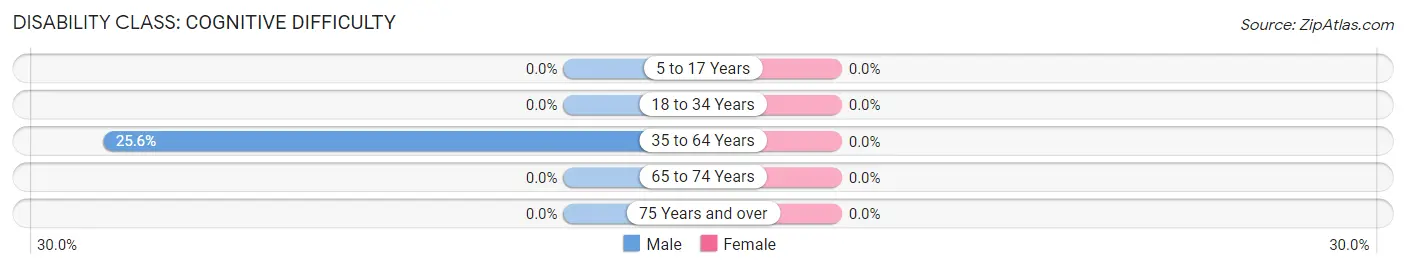
| Age Bracket | Male | Female |
| 5 to 17 Years | 0 (0.0%) | 0 (0.0%) |
| 18 to 34 Years | 0 (0.0%) | 0 (0.0%) |
| 35 to 64 Years | 10 (25.6%) | 0 (0.0%) |
| 65 to 74 Years | 0 (0.0%) | 0 (0.0%) |
| 75 Years and over | 0 (0.0%) | 0 (0.0%) |
Disability Class: Ambulatory Difficulty
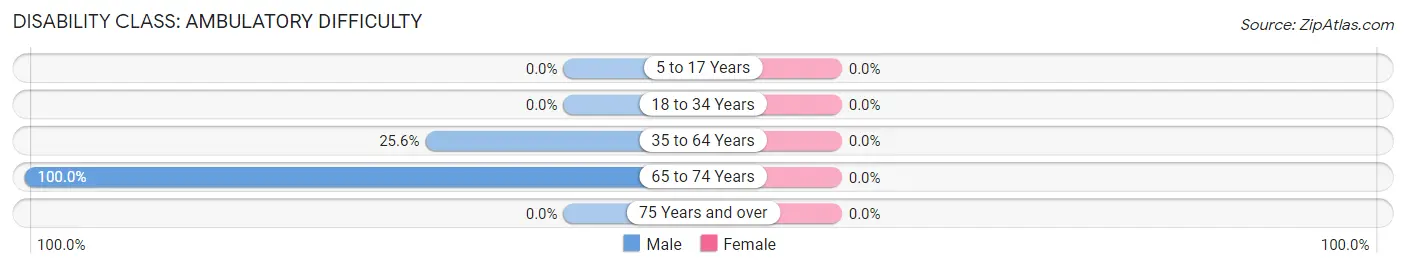
| Age Bracket | Male | Female |
| 5 to 17 Years | 0 (0.0%) | 0 (0.0%) |
| 18 to 34 Years | 0 (0.0%) | 0 (0.0%) |
| 35 to 64 Years | 10 (25.6%) | 0 (0.0%) |
| 65 to 74 Years | 12 (100.0%) | 0 (0.0%) |
| 75 Years and over | 0 (0.0%) | 0 (0.0%) |
Disability Class: Self-Care Difficulty
| Age Bracket | Male | Female |
| 5 to 17 Years | 0 (0.0%) | 0 (0.0%) |
| 18 to 34 Years | 0 (0.0%) | 0 (0.0%) |
| 35 to 64 Years | 0 (0.0%) | 0 (0.0%) |
| 65 to 74 Years | 0 (0.0%) | 0 (0.0%) |
| 75 Years and over | 0 (0.0%) | 0 (0.0%) |
Technology Access in Dryville
Computing Device Access in Dryville
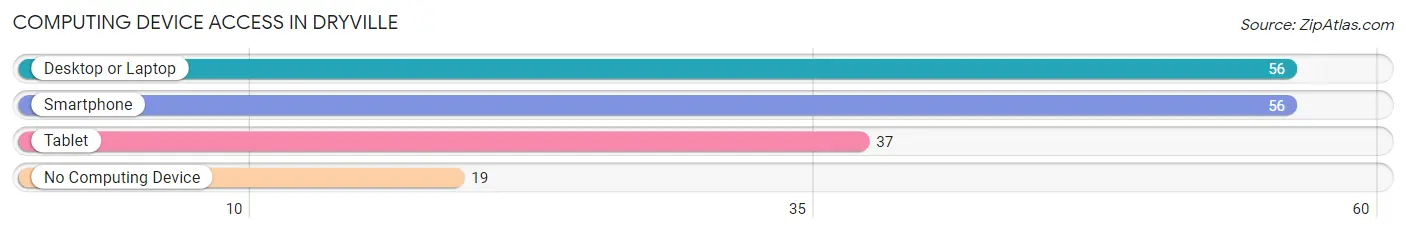
| Device Type | # Households | % Households |
| Desktop or Laptop | 56 | 74.7% |
| Smartphone | 56 | 74.7% |
| Tablet | 37 | 49.3% |
| No Computing Device | 19 | 25.3% |
| Total | 75 | 100.0% |
Internet Access in Dryville
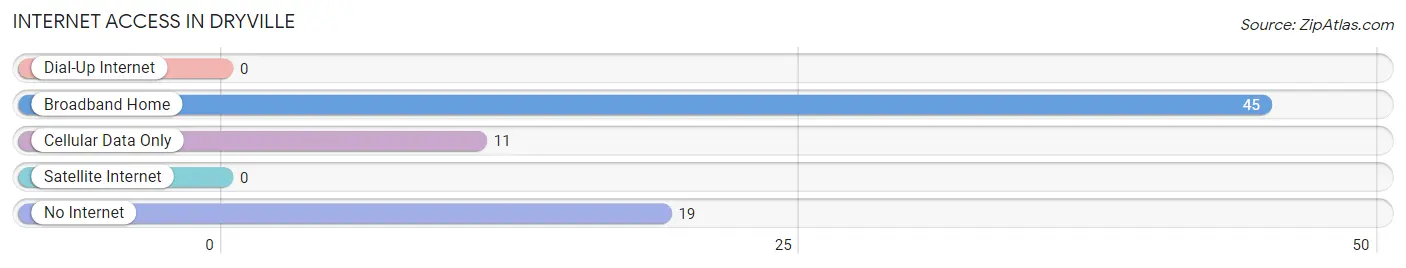
| Internet Type | # Households | % Households |
| Dial-Up Internet | 0 | 0.0% |
| Broadband Home | 45 | 60.0% |
| Cellular Data Only | 11 | 14.7% |
| Satellite Internet | 0 | 0.0% |
| No Internet | 19 | 25.3% |
| Total | 75 | 100.0% |
Dryville Summary
Dryville, Pennsylvania is a small borough located in Berks County, Pennsylvania. It is situated in the southeastern part of the state, approximately 20 miles northwest of Philadelphia. The population of Dryville was 1,845 as of the 2010 census.
History
Dryville was founded in 1737 by a group of German settlers. The town was originally known as “Dry’s Town” after the first settler, John Dry. The town was officially incorporated in 1845.
In the late 19th century, Dryville was a thriving agricultural community. The town was known for its production of wheat, corn, and oats. The town also had a number of small businesses, including a blacksmith, a general store, and a post office.
In the early 20th century, Dryville began to experience a decline in population as many of its residents moved away to larger cities in search of better job opportunities. The town’s population decreased from 1,945 in 1900 to 1,845 in 2010.
Geography
Dryville is located in southeastern Pennsylvania, approximately 20 miles northwest of Philadelphia. The borough is situated in the Schuylkill River Valley, which is part of the Appalachian Mountains. The borough is bordered by the boroughs of Boyertown to the north, Pottstown to the east, and Birdsboro to the south.
The terrain of Dryville is mostly flat, with some rolling hills. The borough is located in a temperate climate zone, with hot summers and cold winters. The average annual temperature is around 50 degrees Fahrenheit.
Economy
Dryville’s economy is largely based on agriculture. The town is known for its production of wheat, corn, and oats. The town also has a number of small businesses, including a general store, a post office, and a few restaurants.
The town is also home to a number of light manufacturing companies, including a plastics factory and a metal fabrication plant. The town also has a number of small retail stores, including a hardware store and a grocery store.
Demographics
As of the 2010 census, the population of Dryville was 1,845. The racial makeup of the town was 95.3% White, 1.2% African American, 0.3% Native American, 0.7% Asian, 0.1% Pacific Islander, and 2.4% from other races. The median household income was $45,938, and the median family income was $51,938.
The town is served by the Boyertown Area School District. The town has one elementary school, one middle school, and one high school. The town also has a public library and a number of churches.
Conclusion
Dryville, Pennsylvania is a small borough located in Berks County, Pennsylvania. It is situated in the southeastern part of the state, approximately 20 miles northwest of Philadelphia. The population of Dryville was 1,845 as of the 2010 census. The town’s economy is largely based on agriculture, with some light manufacturing and retail businesses. The town is served by the Boyertown Area School District and has a public library and a number of churches.
Common Questions
What is Per Capita Income in Dryville?
Per Capita income in Dryville is $40,575.
What is Income or Wage Gap in Dryville?
Income or Wage Gap in Dryville is 19.9%.
Women in Dryville earn 80.1 cents for every dollar earned by a man.
What is Inequality or Gini Index in Dryville?
Inequality or Gini Index in Dryville is 0.40.
What is the Total Population of Dryville?
Total Population of Dryville is 185.
What is the Total Male Population of Dryville?
Total Male Population of Dryville is 113.
What is the Total Female Population of Dryville?
Total Female Population of Dryville is 72.
What is the Ratio of Males per 100 Females in Dryville?
There are 156.94 Males per 100 Females in Dryville.
What is the Ratio of Females per 100 Males in Dryville?
There are 63.72 Females per 100 Males in Dryville.
What is the Median Population Age in Dryville?
Median Population Age in Dryville is 59.0 Years.
What is the Average Family Size in Dryville
Average Family Size in Dryville is 2.8 People.
What is the Average Household Size in Dryville
Average Household Size in Dryville is 2.5 People.
How Large is the Labor Force in Dryville?
There are 116 People in the Labor Forcein in Dryville.
What is the Percentage of People in the Labor Force in Dryville?
65.9% of People are in the Labor Force in Dryville.