Warminster Heights, PA Map & Demographics
Warminster Heights Map
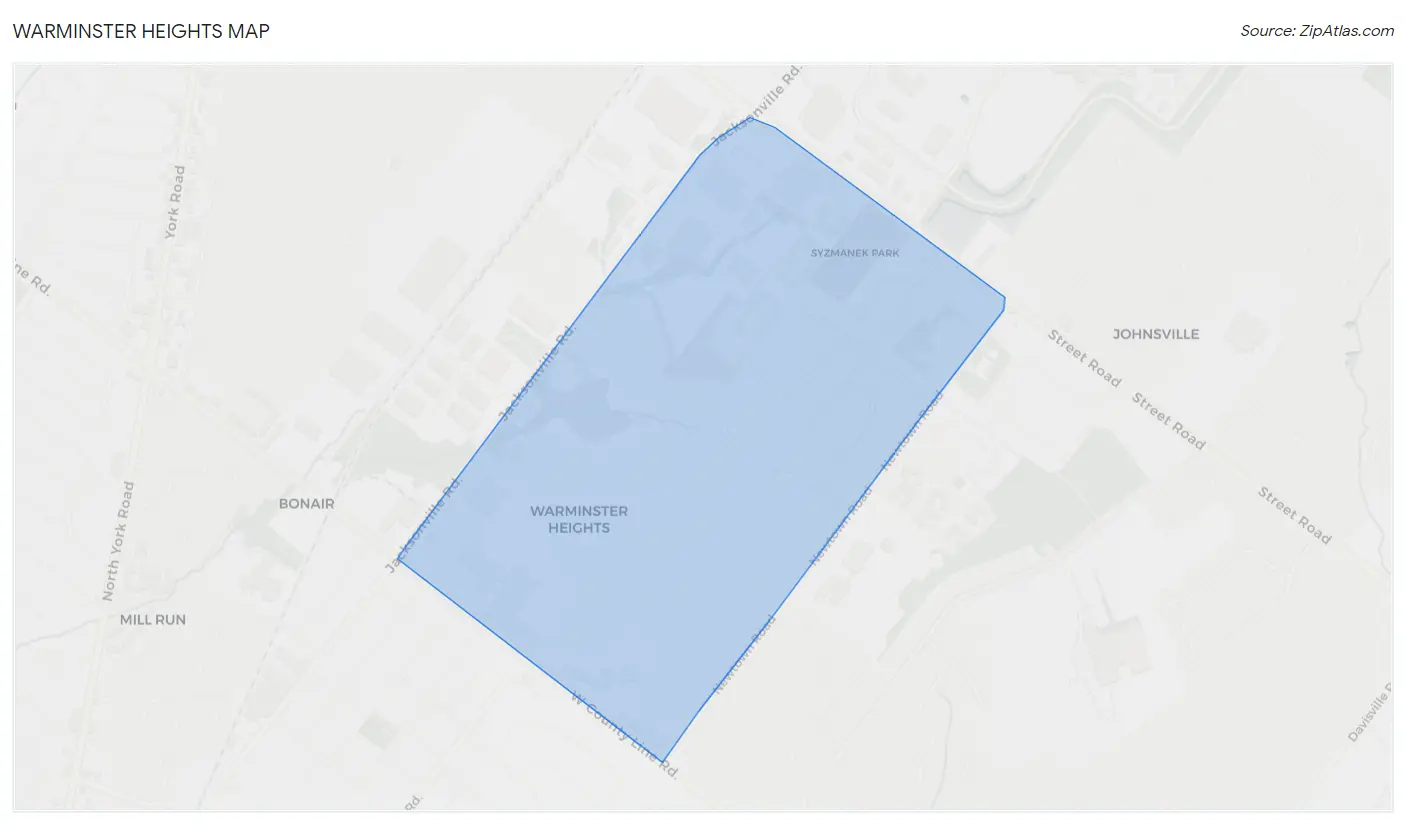
Warminster Heights Overview
$35,233
PER CAPITA INCOME
$76,161
AVG FAMILY INCOME
$56,429
AVG HOUSEHOLD INCOME
40.1%
WAGE / INCOME GAP [ % ]
59.9¢/ $1
WAGE / INCOME GAP [ $ ]
0.43
INEQUALITY / GINI INDEX
3,884
TOTAL POPULATION
1,608
MALE POPULATION
2,276
FEMALE POPULATION
70.65
MALES / 100 FEMALES
141.54
FEMALES / 100 MALES
41.6
MEDIAN AGE
2.9
AVG FAMILY SIZE
2.1
AVG HOUSEHOLD SIZE
2,360
LABOR FORCE [ PEOPLE ]
72.5%
PERCENT IN LABOR FORCE
1.5%
UNEMPLOYMENT RATE
Income in Warminster Heights
Income Overview in Warminster Heights
Per Capita Income in Warminster Heights is $35,233, while median incomes of families and households are $76,161 and $56,429 respectively.
| Characteristic | Number | Measure |
| Per Capita Income | 3,884 | $35,233 |
| Median Family Income | 1,032 | $76,161 |
| Mean Family Income | 1,032 | $91,274 |
| Median Household Income | 1,810 | $56,429 |
| Mean Household Income | 1,810 | $75,213 |
| Income Deficit | 1,032 | $0 |
| Wage / Income Gap (%) | 3,884 | 40.13% |
| Wage / Income Gap ($) | 3,884 | 59.87¢ per $1 |
| Gini / Inequality Index | 3,884 | 0.43 |
Earnings by Sex in Warminster Heights
Average Earnings in Warminster Heights are $37,266, $55,409 for men and $33,173 for women, a difference of 40.1%.
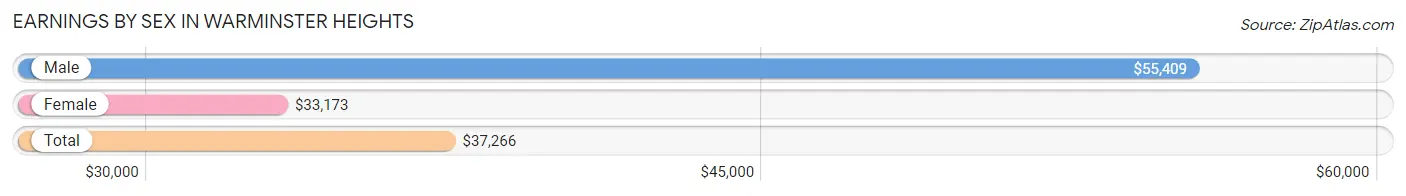
| Sex | Number | Average Earnings |
| Male | 1,031 (42.4%) | $55,409 |
| Female | 1,401 (57.6%) | $33,173 |
| Total | 2,432 (100.0%) | $37,266 |
Earnings by Sex by Income Bracket in Warminster Heights
The most common earnings brackets in Warminster Heights are $75,000 to $99,999 for men (265 | 25.7%) and $30,000 to $34,999 for women (161 | 11.5%).
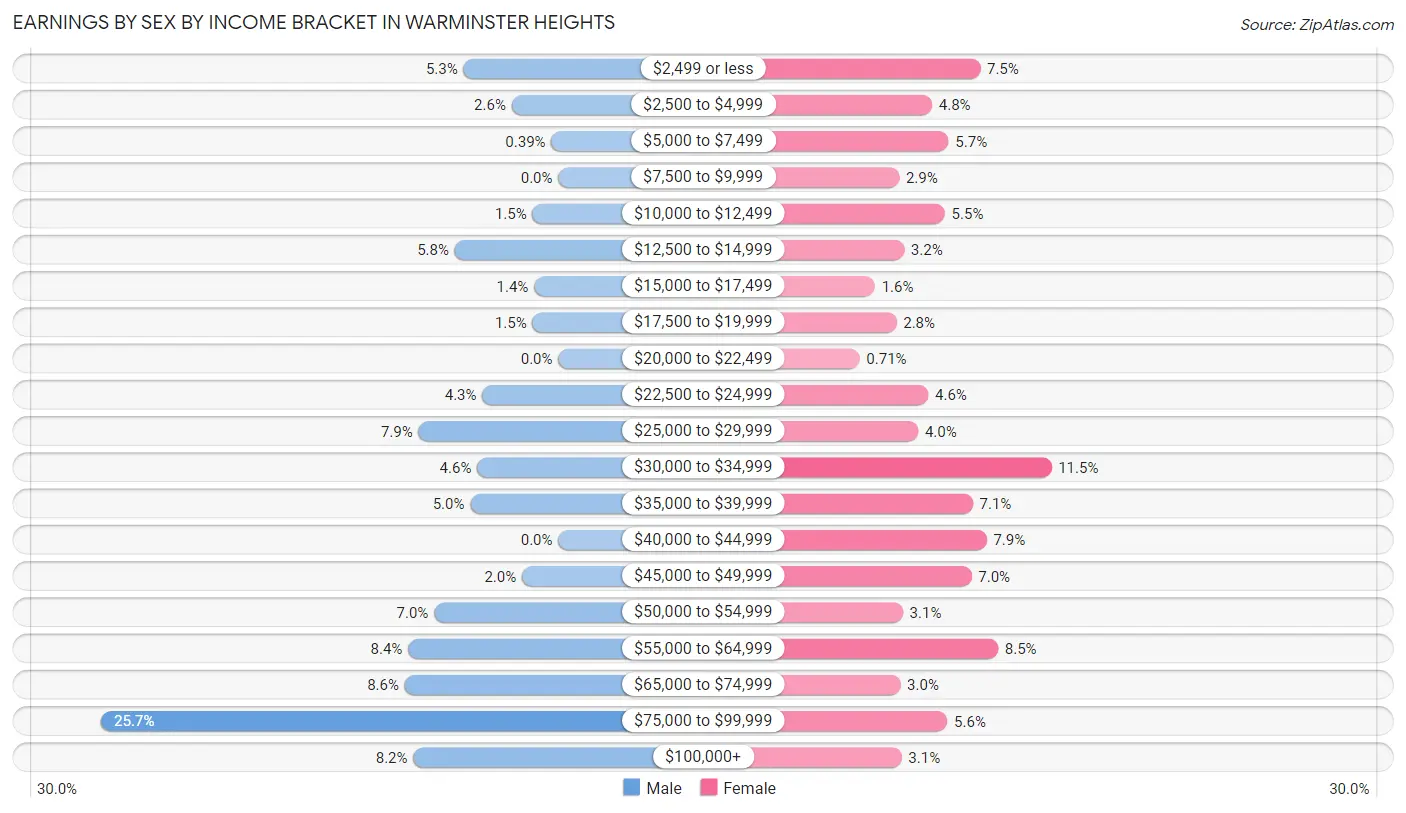
| Income | Male | Female |
| $2,499 or less | 55 (5.3%) | 105 (7.5%) |
| $2,500 to $4,999 | 27 (2.6%) | 67 (4.8%) |
| $5,000 to $7,499 | 4 (0.4%) | 80 (5.7%) |
| $7,500 to $9,999 | 0 (0.0%) | 41 (2.9%) |
| $10,000 to $12,499 | 15 (1.5%) | 77 (5.5%) |
| $12,500 to $14,999 | 60 (5.8%) | 45 (3.2%) |
| $15,000 to $17,499 | 14 (1.4%) | 22 (1.6%) |
| $17,500 to $19,999 | 15 (1.5%) | 39 (2.8%) |
| $20,000 to $22,499 | 0 (0.0%) | 10 (0.7%) |
| $22,500 to $24,999 | 44 (4.3%) | 64 (4.6%) |
| $25,000 to $29,999 | 81 (7.9%) | 56 (4.0%) |
| $30,000 to $34,999 | 47 (4.6%) | 161 (11.5%) |
| $35,000 to $39,999 | 51 (5.0%) | 99 (7.1%) |
| $40,000 to $44,999 | 0 (0.0%) | 110 (7.9%) |
| $45,000 to $49,999 | 21 (2.0%) | 98 (7.0%) |
| $50,000 to $54,999 | 72 (7.0%) | 44 (3.1%) |
| $55,000 to $64,999 | 87 (8.4%) | 119 (8.5%) |
| $65,000 to $74,999 | 89 (8.6%) | 42 (3.0%) |
| $75,000 to $99,999 | 265 (25.7%) | 79 (5.6%) |
| $100,000+ | 84 (8.2%) | 43 (3.1%) |
| Total | 1,031 (100.0%) | 1,401 (100.0%) |
Earnings by Sex by Educational Attainment in Warminster Heights
Average earnings in Warminster Heights are $60,948 for men and $34,931 for women, a difference of 42.7%. Men with an educational attainment of bachelor's degree enjoy the highest average annual earnings of $71,304, while those with high school diploma education earn the least with $54,875. Women with an educational attainment of graduate degree earn the most with the average annual earnings of $50,119, while those with high school diploma education have the smallest earnings of $31,344.
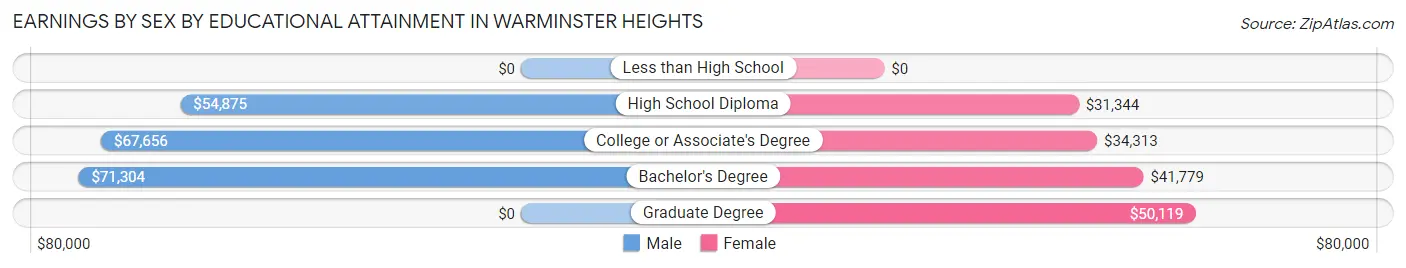
| Educational Attainment | Male Income | Female Income |
| Less than High School | - | - |
| High School Diploma | $54,875 | $31,344 |
| College or Associate's Degree | $67,656 | $34,313 |
| Bachelor's Degree | $71,304 | $41,779 |
| Graduate Degree | - | - |
| Total | $60,948 | $34,931 |
Family Income in Warminster Heights
Family Income Brackets in Warminster Heights
According to the Warminster Heights family income data, there are 211 families falling into the $50,000 to $74,999 income range, which is the most common income bracket and makes up 20.4% of all families. Conversely, the less than $10,000 income bracket is the least frequent group with only 27 families (2.6%) belonging to this category.
| Income Bracket | # Families | % Families |
| Less than $10,000 | 27 | 2.6% |
| $10,000 to $14,999 | 64 | 6.2% |
| $15,000 to $24,999 | 41 | 4.0% |
| $25,000 to $34,999 | 85 | 8.2% |
| $35,000 to $49,999 | 75 | 7.3% |
| $50,000 to $74,999 | 211 | 20.4% |
| $75,000 to $99,999 | 188 | 18.2% |
| $100,000 to $149,999 | 153 | 14.8% |
| $150,000 to $199,999 | 98 | 9.5% |
| $200,000+ | 90 | 8.7% |
Family Income by Famaliy Size in Warminster Heights
2-person families (536 | 51.9%) account for the highest median family income in Warminster Heights with $88,500 per family, while 2-person families (536 | 51.9%) have the highest median income of $44,250 per family member.
| Income Bracket | # Families | Median Income |
| 2-Person Families | 536 (51.9%) | $88,500 |
| 3-Person Families | 194 (18.8%) | $66,190 |
| 4-Person Families | 234 (22.7%) | $75,625 |
| 5-Person Families | 68 (6.6%) | $0 |
| 6-Person Families | 0 (0.0%) | $0 |
| 7+ Person Families | 0 (0.0%) | $0 |
| Total | 1,032 (100.0%) | $76,161 |
Family Income by Number of Earners in Warminster Heights
| Number of Earners | # Families | Median Income |
| No Earners | 55 (5.3%) | $0 |
| 1 Earner | 358 (34.7%) | $51,218 |
| 2 Earners | 505 (48.9%) | $96,683 |
| 3+ Earners | 114 (11.1%) | $0 |
| Total | 1,032 (100.0%) | $76,161 |
Household Income in Warminster Heights
Household Income Brackets in Warminster Heights
With 320 households falling in the category, the $50,000 to $74,999 income range is the most frequent in Warminster Heights, accounting for 17.7% of all households. In contrast, only 27 households (1.5%) fall into the less than $10,000 income bracket, making it the least populous group.
| Income Bracket | # Households | % Households |
| Less than $10,000 | 27 | 1.5% |
| $10,000 to $14,999 | 119 | 6.6% |
| $15,000 to $24,999 | 205 | 11.3% |
| $25,000 to $34,999 | 214 | 11.8% |
| $35,000 to $49,999 | 237 | 13.1% |
| $50,000 to $74,999 | 320 | 17.7% |
| $75,000 to $99,999 | 212 | 11.7% |
| $100,000 to $149,999 | 248 | 13.7% |
| $150,000 to $199,999 | 127 | 7.0% |
| $200,000+ | 103 | 5.7% |
Household Income by Householder Age in Warminster Heights
The median household income in Warminster Heights is $56,429, with the highest median household income of $100,192 found in the 15 to 24 years age bracket for the primary householder. A total of 48 households (2.6%) fall into this category. Meanwhile, the 65+ years age bracket for the primary householder has the lowest median household income of $24,703, with 445 households (24.6%) in this group.
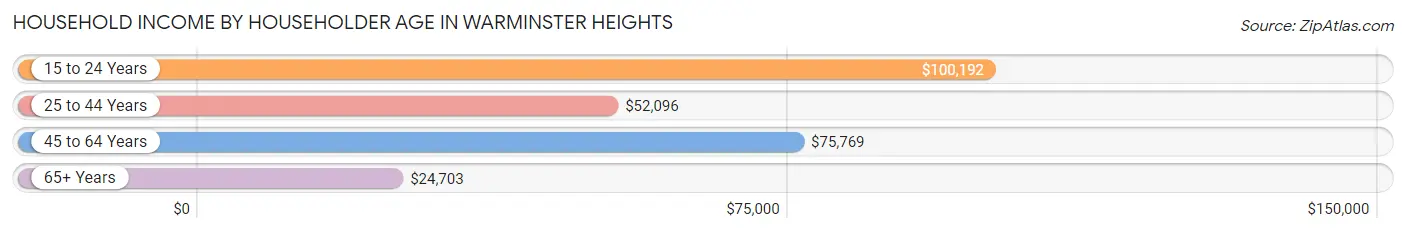
| Income Bracket | # Households | Median Income |
| 15 to 24 Years | 48 (2.6%) | $100,192 |
| 25 to 44 Years | 623 (34.4%) | $52,096 |
| 45 to 64 Years | 694 (38.3%) | $75,769 |
| 65+ Years | 445 (24.6%) | $24,703 |
| Total | 1,810 (100.0%) | $56,429 |
Poverty in Warminster Heights
Income Below Poverty by Sex and Age in Warminster Heights
With 12.5% poverty level for males and 8.2% for females among the residents of Warminster Heights, 65 to 74 year old males and 65 to 74 year old females are the most vulnerable to poverty, with 36 males (25.9%) and 53 females (24.5%) in their respective age groups living below the poverty level.
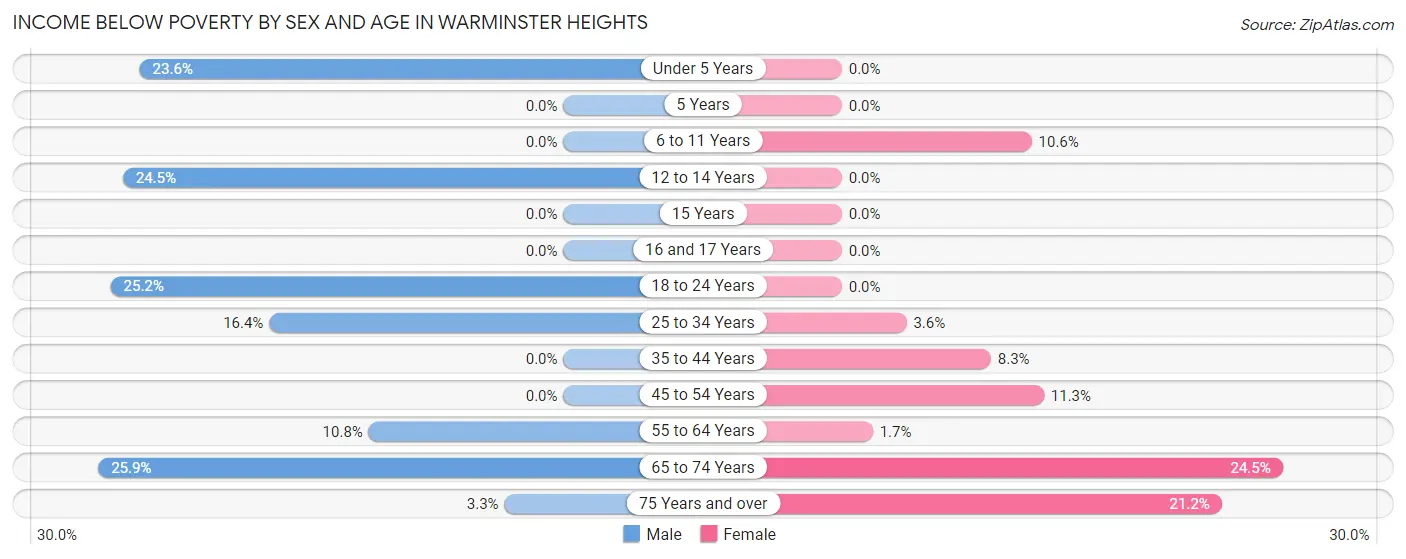
| Age Bracket | Male | Female |
| Under 5 Years | 46 (23.6%) | 0 (0.0%) |
| 5 Years | 0 (0.0%) | 0 (0.0%) |
| 6 to 11 Years | 0 (0.0%) | 13 (10.6%) |
| 12 to 14 Years | 13 (24.5%) | 0 (0.0%) |
| 15 Years | 0 (0.0%) | 0 (0.0%) |
| 16 and 17 Years | 0 (0.0%) | 0 (0.0%) |
| 18 to 24 Years | 30 (25.2%) | 0 (0.0%) |
| 25 to 34 Years | 47 (16.4%) | 13 (3.6%) |
| 35 to 44 Years | 0 (0.0%) | 19 (8.3%) |
| 45 to 54 Years | 0 (0.0%) | 35 (11.3%) |
| 55 to 64 Years | 27 (10.8%) | 6 (1.7%) |
| 65 to 74 Years | 36 (25.9%) | 53 (24.5%) |
| 75 Years and over | 2 (3.3%) | 48 (21.1%) |
| Total | 201 (12.5%) | 187 (8.2%) |
Income Above Poverty by Sex and Age in Warminster Heights
According to the poverty statistics in Warminster Heights, males aged 6 to 11 years and females aged under 5 years are the age groups that are most secure financially, with 100.0% of males and 100.0% of females in these age groups living above the poverty line.
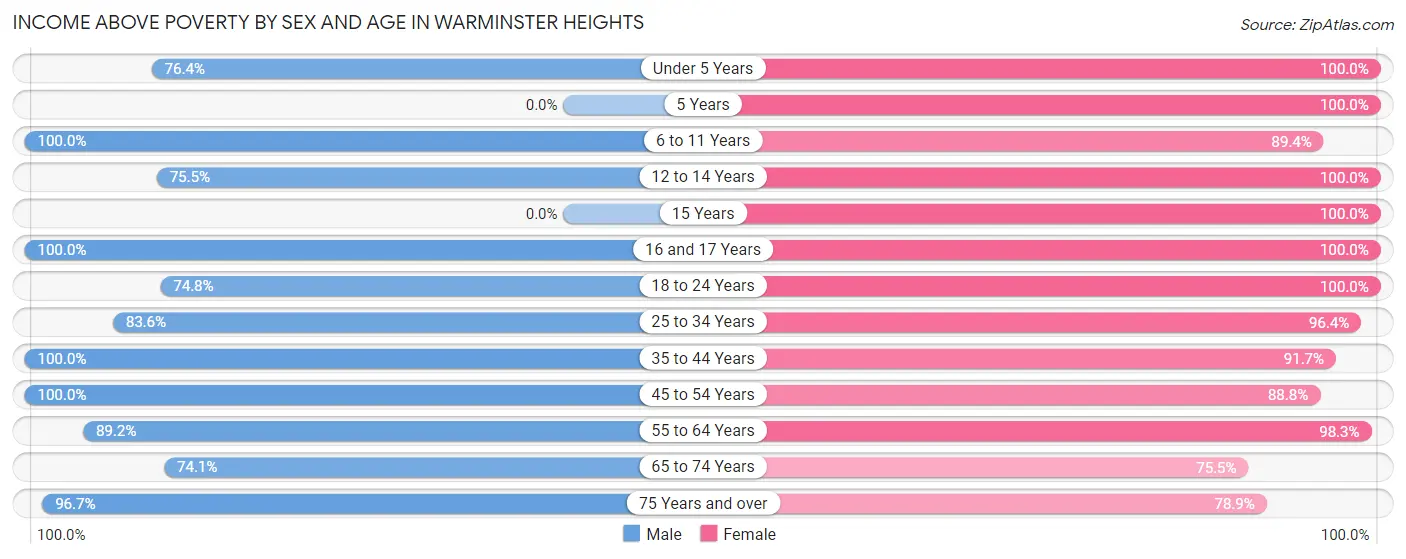
| Age Bracket | Male | Female |
| Under 5 Years | 149 (76.4%) | 116 (100.0%) |
| 5 Years | 0 (0.0%) | 11 (100.0%) |
| 6 to 11 Years | 44 (100.0%) | 110 (89.4%) |
| 12 to 14 Years | 40 (75.5%) | 65 (100.0%) |
| 15 Years | 0 (0.0%) | 22 (100.0%) |
| 16 and 17 Years | 34 (100.0%) | 44 (100.0%) |
| 18 to 24 Years | 89 (74.8%) | 202 (100.0%) |
| 25 to 34 Years | 240 (83.6%) | 348 (96.4%) |
| 35 to 44 Years | 197 (100.0%) | 210 (91.7%) |
| 45 to 54 Years | 230 (100.0%) | 276 (88.7%) |
| 55 to 64 Years | 222 (89.2%) | 343 (98.3%) |
| 65 to 74 Years | 103 (74.1%) | 163 (75.5%) |
| 75 Years and over | 59 (96.7%) | 179 (78.8%) |
| Total | 1,407 (87.5%) | 2,089 (91.8%) |
Income Below Poverty Among Married-Couple Families in Warminster Heights
The poverty statistics for married-couple families in Warminster Heights show that 4.7% or 30 of the total 635 families live below the poverty line. Families with no children have the highest poverty rate of 6.9%, comprising of 30 families. On the other hand, families with 1 or 2 children have the lowest poverty rate of 0.0%, which includes 0 families.
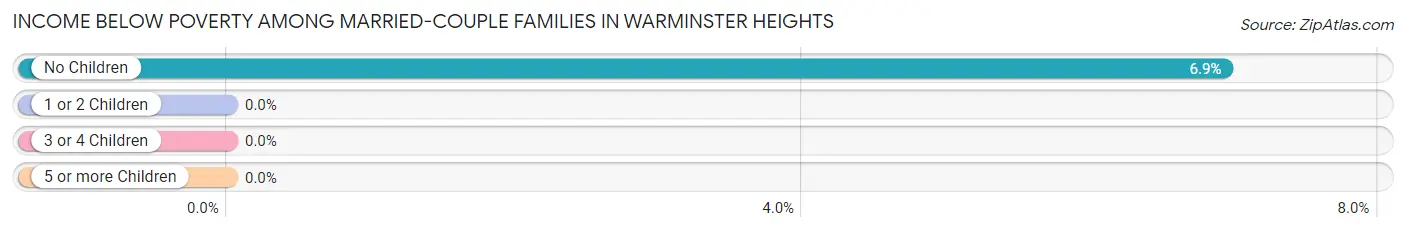
| Children | Above Poverty | Below Poverty |
| No Children | 403 (93.1%) | 30 (6.9%) |
| 1 or 2 Children | 202 (100.0%) | 0 (0.0%) |
| 3 or 4 Children | 0 (0.0%) | 0 (0.0%) |
| 5 or more Children | 0 (0.0%) | 0 (0.0%) |
| Total | 605 (95.3%) | 30 (4.7%) |
Income Below Poverty Among Single-Parent Households in Warminster Heights
According to the poverty data in Warminster Heights, 50.0% or 61 single-father households and 11.6% or 32 single-mother households are living below the poverty line. Among single-father households, those with 1 or 2 children have the highest poverty rate, with 34 households (100.0%) experiencing poverty. Likewise, among single-mother households, those with 1 or 2 children have the highest poverty rate, with 13 households (16.3%) falling below the poverty line.
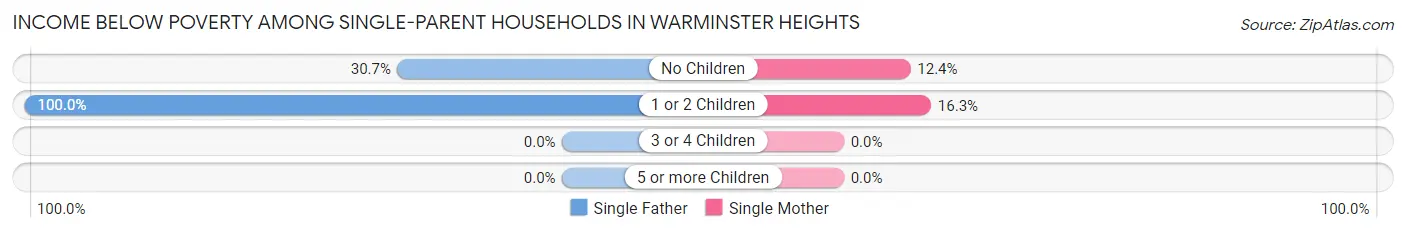
| Children | Single Father | Single Mother |
| No Children | 27 (30.7%) | 19 (12.4%) |
| 1 or 2 Children | 34 (100.0%) | 13 (16.3%) |
| 3 or 4 Children | 0 (0.0%) | 0 (0.0%) |
| 5 or more Children | 0 (0.0%) | 0 (0.0%) |
| Total | 61 (50.0%) | 32 (11.6%) |
Income Below Poverty Among Married-Couple vs Single-Parent Households in Warminster Heights
The poverty data for Warminster Heights shows that 30 of the married-couple family households (4.7%) and 93 of the single-parent households (23.4%) are living below the poverty level. Within the married-couple family households, those with no children have the highest poverty rate, with 30 households (6.9%) falling below the poverty line. Among the single-parent households, those with 1 or 2 children have the highest poverty rate, with 47 household (41.2%) living below poverty.
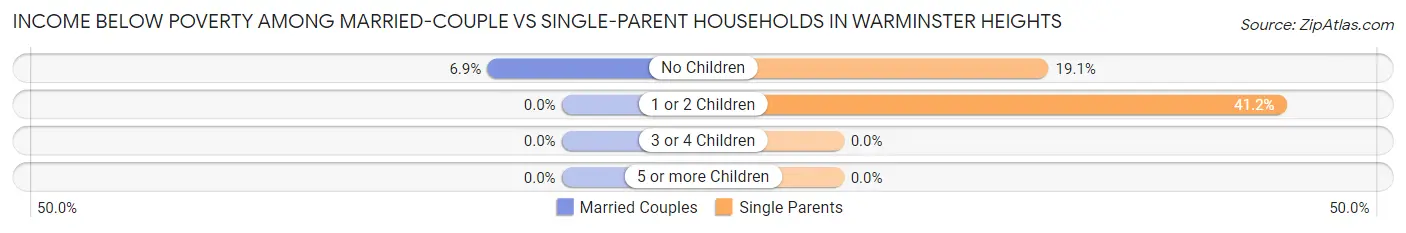
| Children | Married-Couple Families | Single-Parent Households |
| No Children | 30 (6.9%) | 46 (19.1%) |
| 1 or 2 Children | 0 (0.0%) | 47 (41.2%) |
| 3 or 4 Children | 0 (0.0%) | 0 (0.0%) |
| 5 or more Children | 0 (0.0%) | 0 (0.0%) |
| Total | 30 (4.7%) | 93 (23.4%) |
Race in Warminster Heights
The most populous races in Warminster Heights are White / Caucasian (2,342 | 60.3%), Black / African American (793 | 20.4%), and Hispanic or Latino (468 | 12.0%).
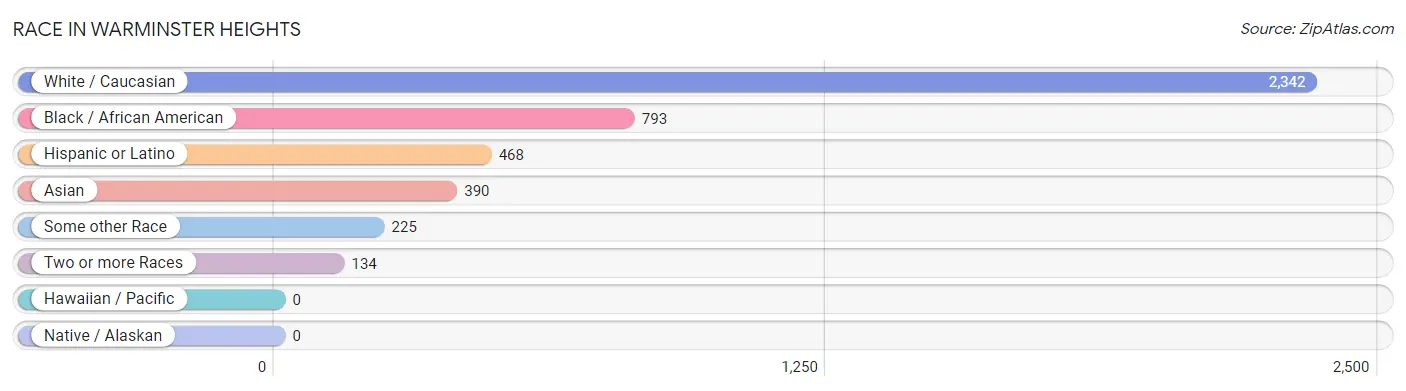
| Race | # Population | % Population |
| Asian | 390 | 10.0% |
| Black / African American | 793 | 20.4% |
| Hawaiian / Pacific | 0 | 0.0% |
| Hispanic or Latino | 468 | 12.0% |
| Native / Alaskan | 0 | 0.0% |
| White / Caucasian | 2,342 | 60.3% |
| Two or more Races | 134 | 3.5% |
| Some other Race | 225 | 5.8% |
| Total | 3,884 | 100.0% |
Ancestry in Warminster Heights
The most populous ancestries reported in Warminster Heights are Irish (683 | 17.6%), German (473 | 12.2%), Puerto Rican (288 | 7.4%), Subsaharan African (266 | 6.9%), and English (225 | 5.8%), together accounting for 49.8% of all Warminster Heights residents.
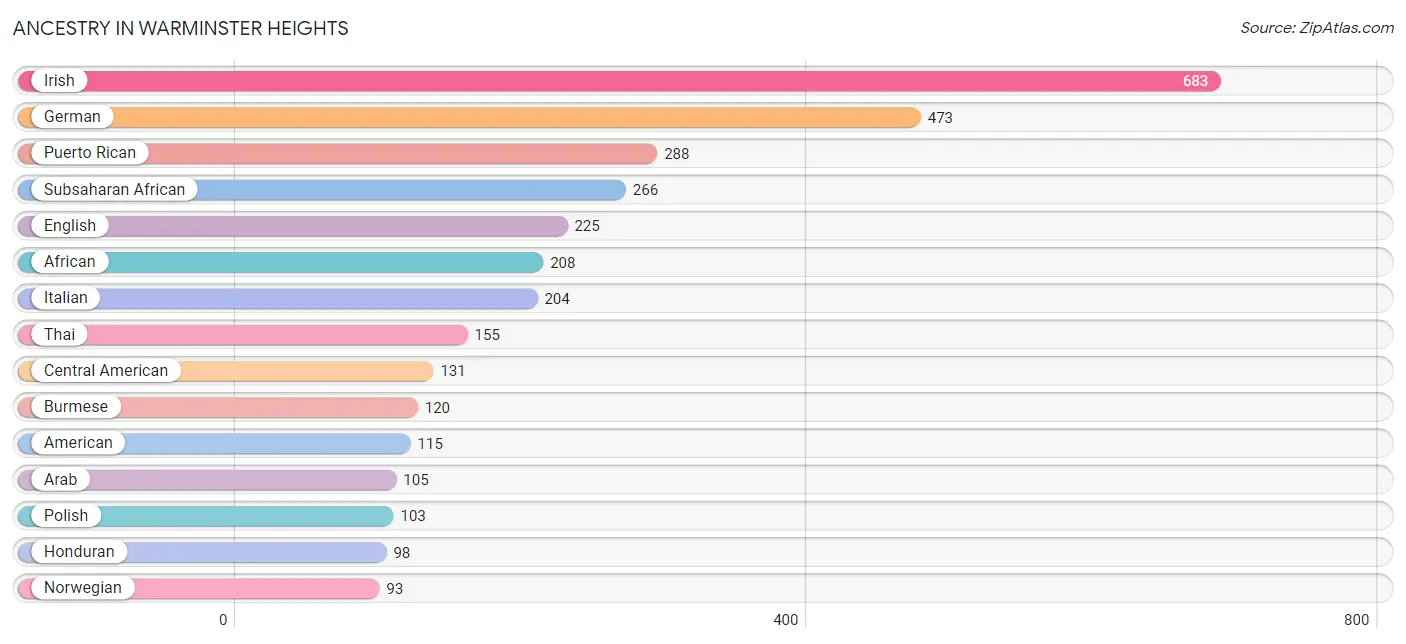
| Ancestry | # Population | % Population |
| African | 208 | 5.4% |
| Albanian | 24 | 0.6% |
| American | 115 | 3.0% |
| Arab | 105 | 2.7% |
| Austrian | 10 | 0.3% |
| Burmese | 120 | 3.1% |
| Central American | 131 | 3.4% |
| Costa Rican | 11 | 0.3% |
| Dutch | 39 | 1.0% |
| Eastern European | 21 | 0.5% |
| English | 225 | 5.8% |
| European | 28 | 0.7% |
| French | 32 | 0.8% |
| German | 473 | 12.2% |
| Ghanaian | 58 | 1.5% |
| Greek | 30 | 0.8% |
| Haitian | 48 | 1.2% |
| Honduran | 98 | 2.5% |
| Indian (Asian) | 75 | 1.9% |
| Irish | 683 | 17.6% |
| Italian | 204 | 5.2% |
| Jamaican | 26 | 0.7% |
| Japanese | 51 | 1.3% |
| Latvian | 17 | 0.4% |
| Mexican | 49 | 1.3% |
| Moroccan | 90 | 2.3% |
| Northern European | 9 | 0.2% |
| Norwegian | 93 | 2.4% |
| Pennsylvania German | 48 | 1.2% |
| Polish | 103 | 2.6% |
| Puerto Rican | 288 | 7.4% |
| Russian | 27 | 0.7% |
| Salvadoran | 22 | 0.6% |
| Scottish | 46 | 1.2% |
| Serbian | 20 | 0.5% |
| Slovak | 16 | 0.4% |
| Subsaharan African | 266 | 6.9% |
| Swiss | 16 | 0.4% |
| Thai | 155 | 4.0% |
| Trinidadian and Tobagonian | 13 | 0.3% |
| Ukrainian | 80 | 2.1% |
| Welsh | 9 | 0.2% |
| West Indian | 25 | 0.6% | View All 43 Rows |
Immigrants in Warminster Heights
The most numerous immigrant groups reported in Warminster Heights came from Asia (247 | 6.4%), Africa (231 | 5.9%), Europe (205 | 5.3%), India (135 | 3.5%), and South Central Asia (135 | 3.5%), together accounting for 24.5% of all Warminster Heights residents.
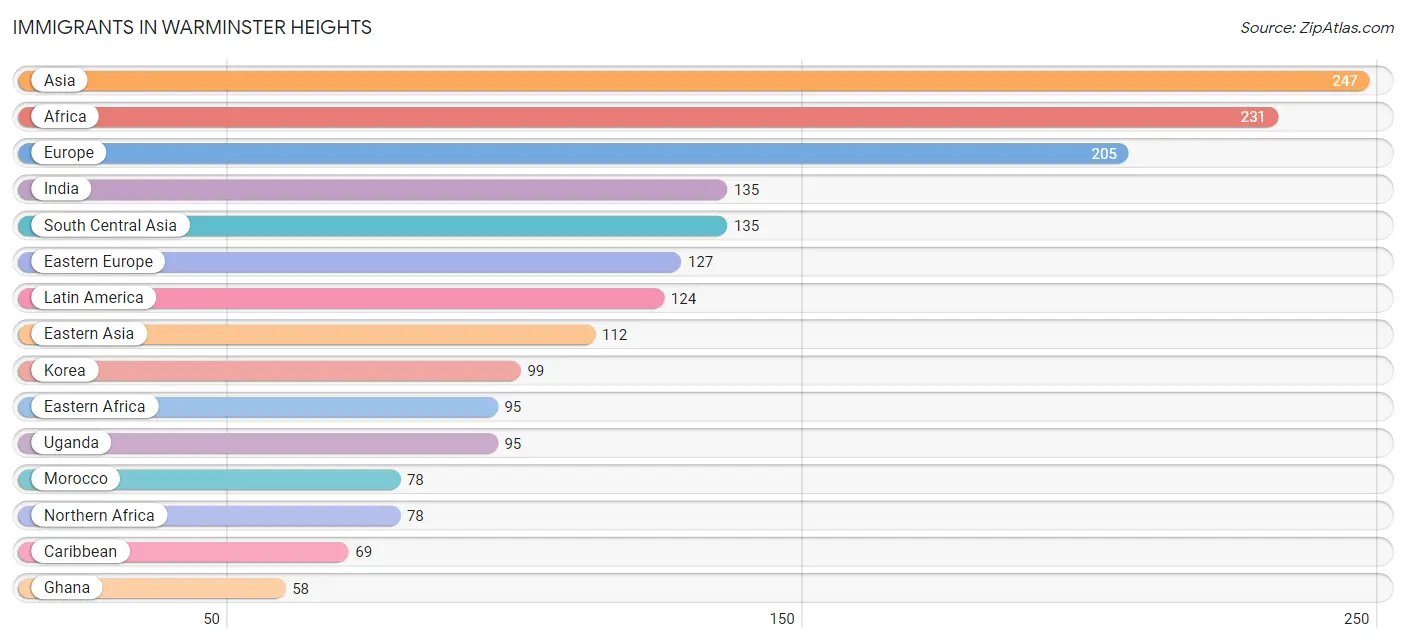
| Immigration Origin | # Population | % Population |
| Africa | 231 | 5.9% |
| Asia | 247 | 6.4% |
| Belarus | 38 | 1.0% |
| Caribbean | 69 | 1.8% |
| Central America | 55 | 1.4% |
| China | 13 | 0.3% |
| Costa Rica | 11 | 0.3% |
| Eastern Africa | 95 | 2.5% |
| Eastern Asia | 112 | 2.9% |
| Eastern Europe | 127 | 3.3% |
| El Salvador | 11 | 0.3% |
| Europe | 205 | 5.3% |
| Germany | 47 | 1.2% |
| Ghana | 58 | 1.5% |
| Greece | 15 | 0.4% |
| Haiti | 31 | 0.8% |
| Hong Kong | 13 | 0.3% |
| India | 135 | 3.5% |
| Ireland | 16 | 0.4% |
| Korea | 99 | 2.5% |
| Latin America | 124 | 3.2% |
| Latvia | 17 | 0.4% |
| Mexico | 33 | 0.9% |
| Morocco | 78 | 2.0% |
| Northern Africa | 78 | 2.0% |
| Northern Europe | 16 | 0.4% |
| Russia | 17 | 0.4% |
| South Central Asia | 135 | 3.5% |
| Southern Europe | 15 | 0.4% |
| Trinidad and Tobago | 38 | 1.0% |
| Uganda | 95 | 2.5% |
| Ukraine | 44 | 1.1% |
| Western Africa | 58 | 1.5% |
| Western Europe | 47 | 1.2% | View All 34 Rows |
Sex and Age in Warminster Heights
Sex and Age in Warminster Heights
The most populous age groups in Warminster Heights are Under 5 Years (195 | 12.1%) for men and 30 to 34 Years (227 | 10.0%) for women.
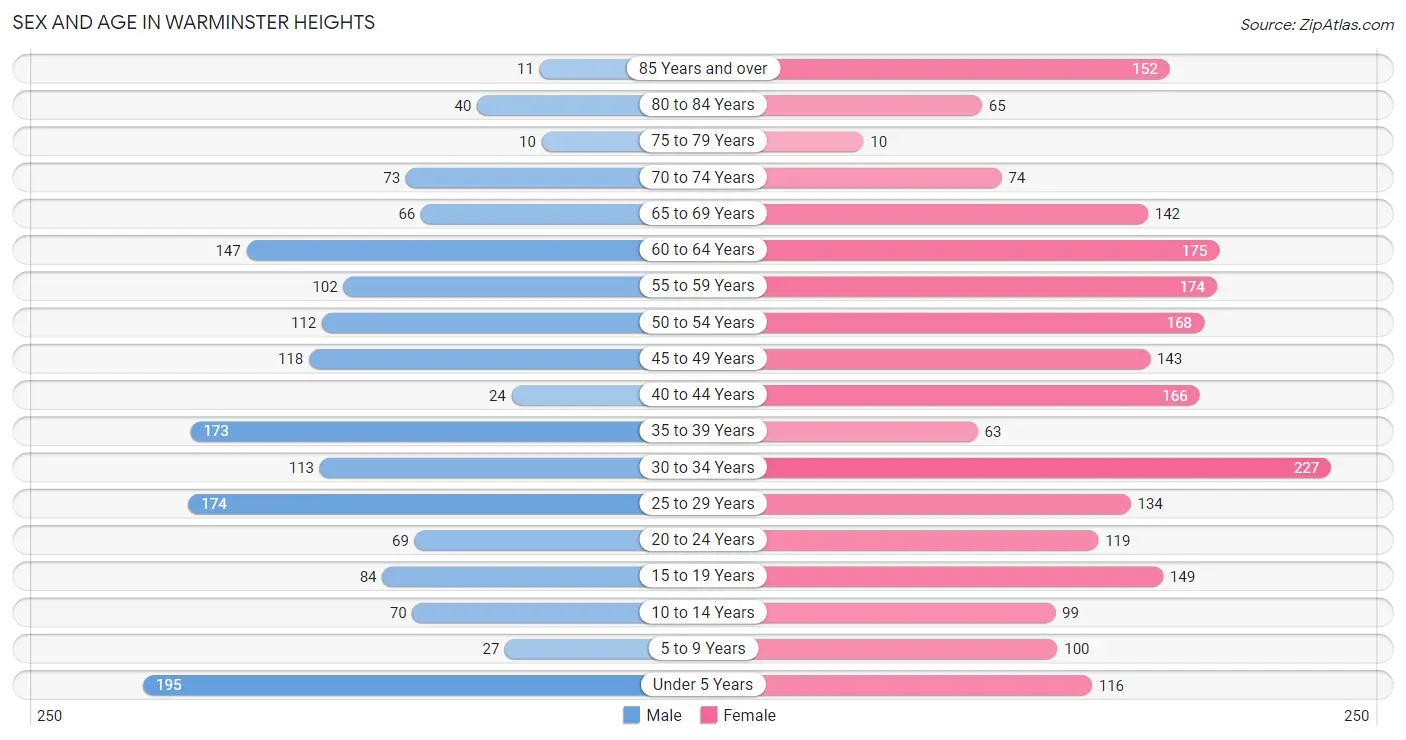
| Age Bracket | Male | Female |
| Under 5 Years | 195 (12.1%) | 116 (5.1%) |
| 5 to 9 Years | 27 (1.7%) | 100 (4.4%) |
| 10 to 14 Years | 70 (4.3%) | 99 (4.3%) |
| 15 to 19 Years | 84 (5.2%) | 149 (6.6%) |
| 20 to 24 Years | 69 (4.3%) | 119 (5.2%) |
| 25 to 29 Years | 174 (10.8%) | 134 (5.9%) |
| 30 to 34 Years | 113 (7.0%) | 227 (10.0%) |
| 35 to 39 Years | 173 (10.8%) | 63 (2.8%) |
| 40 to 44 Years | 24 (1.5%) | 166 (7.3%) |
| 45 to 49 Years | 118 (7.3%) | 143 (6.3%) |
| 50 to 54 Years | 112 (7.0%) | 168 (7.4%) |
| 55 to 59 Years | 102 (6.3%) | 174 (7.6%) |
| 60 to 64 Years | 147 (9.1%) | 175 (7.7%) |
| 65 to 69 Years | 66 (4.1%) | 142 (6.2%) |
| 70 to 74 Years | 73 (4.5%) | 74 (3.3%) |
| 75 to 79 Years | 10 (0.6%) | 10 (0.4%) |
| 80 to 84 Years | 40 (2.5%) | 65 (2.9%) |
| 85 Years and over | 11 (0.7%) | 152 (6.7%) |
| Total | 1,608 (100.0%) | 2,276 (100.0%) |
Families and Households in Warminster Heights
Median Family Size in Warminster Heights
The median family size in Warminster Heights is 2.85 persons per family, with single female/mother families (275 | 26.7%) accounting for the largest median family size of 3.1 persons per family. On the other hand, single male/father families (122 | 11.8%) represent the smallest median family size with 2.16 persons per family.
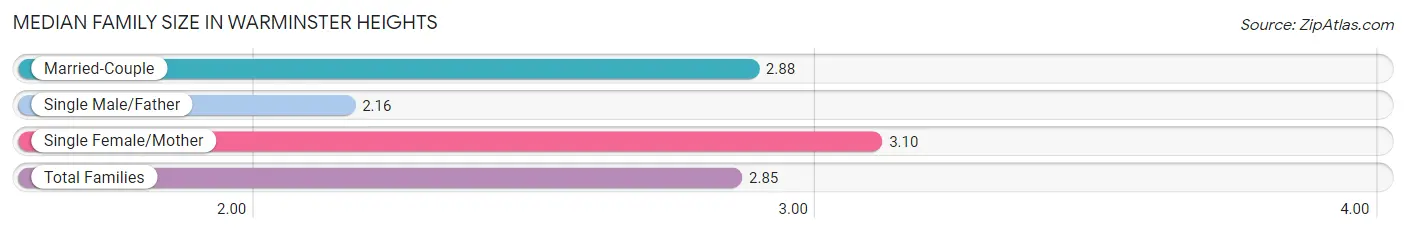
| Family Type | # Families | Family Size |
| Married-Couple | 635 (61.5%) | 2.88 |
| Single Male/Father | 122 (11.8%) | 2.16 |
| Single Female/Mother | 275 (26.7%) | 3.10 |
| Total Families | 1,032 (100.0%) | 2.85 |
Median Household Size in Warminster Heights
The median household size in Warminster Heights is 2.15 persons per household, with single female/mother households (275 | 15.2%) accounting for the largest median household size of 3.1 persons per household. non-family households (778 | 43.0%) represent the smallest median household size with 1.19 persons per household.
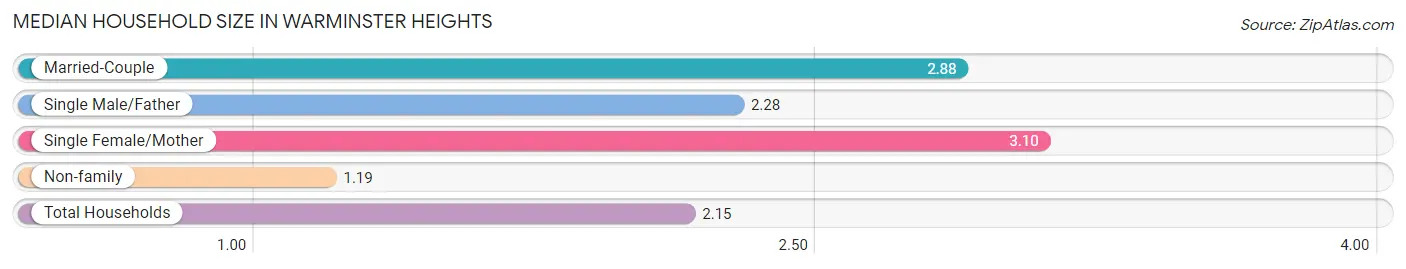
| Household Type | # Households | Household Size |
| Married-Couple | 635 (35.1%) | 2.88 |
| Single Male/Father | 122 (6.7%) | 2.28 |
| Single Female/Mother | 275 (15.2%) | 3.10 |
| Non-family | 778 (43.0%) | 1.19 |
| Total Households | 1,810 (100.0%) | 2.15 |
Household Size by Marriage Status in Warminster Heights
Out of a total of 1,810 households in Warminster Heights, 1,032 (57.0%) are family households, while 778 (43.0%) are nonfamily households. The most numerous type of family households are 2-person households, comprising 521, and the most common type of nonfamily households are 1-person households, comprising 631.
| Household Size | Family Households | Nonfamily Households |
| 1-Person Households | - | 631 (34.9%) |
| 2-Person Households | 521 (28.8%) | 147 (8.1%) |
| 3-Person Households | 209 (11.6%) | 0 (0.0%) |
| 4-Person Households | 234 (12.9%) | 0 (0.0%) |
| 5-Person Households | 68 (3.8%) | 0 (0.0%) |
| 6-Person Households | 0 (0.0%) | 0 (0.0%) |
| 7+ Person Households | 0 (0.0%) | 0 (0.0%) |
| Total | 1,032 (57.0%) | 778 (43.0%) |
Female Fertility in Warminster Heights
Fertility by Age in Warminster Heights
Average fertility rate in Warminster Heights is 85.0 births per 1,000 women. Women in the age bracket of 20 to 34 years have the highest fertility rate with 179.0 births per 1,000 women. Women in the age bracket of 20 to 34 years acount for 100.0% of all women with births.
| Age Bracket | Women with Births | Births / 1,000 Women |
| 15 to 19 years | 0 (0.0%) | 0.0 |
| 20 to 34 years | 86 (100.0%) | 179.0 |
| 35 to 50 years | 0 (0.0%) | 0.0 |
| Total | 86 (100.0%) | 85.0 |
Fertility by Age by Marriage Status in Warminster Heights
| Age Bracket | Married | Unmarried |
| 15 to 19 years | 0 (0.0%) | 0 (0.0%) |
| 20 to 34 years | 86 (100.0%) | 0 (0.0%) |
| 35 to 50 years | 0 (0.0%) | 0 (0.0%) |
| Total | 86 (100.0%) | 0 (0.0%) |
Fertility by Education in Warminster Heights
| Educational Attainment | Women with Births | Births / 1,000 Women |
| Less than High School | 29 (33.7%) | 180.0 |
| High School Diploma | 0 (0.0%) | 0.0 |
| College or Associate's Degree | 57 (66.3%) | 163.0 |
| Bachelor's Degree | 0 (0.0%) | 0.0 |
| Graduate Degree | 0 (0.0%) | 0.0 |
| Total | 86 (100.0%) | 85.0 |
Fertility by Education by Marriage Status in Warminster Heights
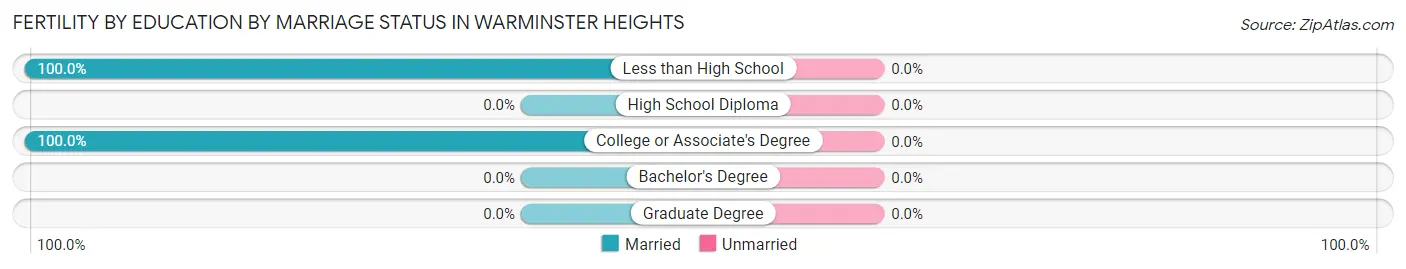
| Educational Attainment | Married | Unmarried |
| Less than High School | 29 (100.0%) | 0 (0.0%) |
| High School Diploma | 0 (0.0%) | 0 (0.0%) |
| College or Associate's Degree | 57 (100.0%) | 0 (0.0%) |
| Bachelor's Degree | 0 (0.0%) | 0 (0.0%) |
| Graduate Degree | 0 (0.0%) | 0 (0.0%) |
| Total | 86 (100.0%) | 0 (0.0%) |
Employment Characteristics in Warminster Heights
Employment by Class of Employer in Warminster Heights
Among the 2,222 employed individuals in Warminster Heights, private company employees (1,642 | 73.9%), not-for-profit organizations (258 | 11.6%), and local government employees (150 | 6.8%) make up the most common classes of employment.
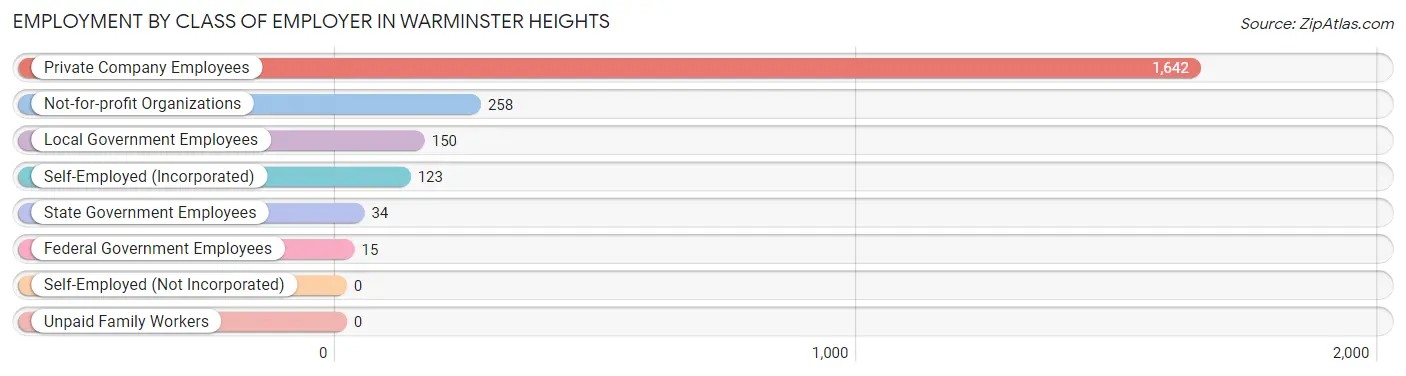
| Employer Class | # Employees | % Employees |
| Private Company Employees | 1,642 | 73.9% |
| Self-Employed (Incorporated) | 123 | 5.5% |
| Self-Employed (Not Incorporated) | 0 | 0.0% |
| Not-for-profit Organizations | 258 | 11.6% |
| Local Government Employees | 150 | 6.8% |
| State Government Employees | 34 | 1.5% |
| Federal Government Employees | 15 | 0.7% |
| Unpaid Family Workers | 0 | 0.0% |
| Total | 2,222 | 100.0% |
Employment Status by Age in Warminster Heights
According to the labor force statistics for Warminster Heights, out of the total population over 16 years of age (3,255), 72.5% or 2,360 individuals are in the labor force, with 1.5% or 35 of them unemployed. The age group with the highest labor force participation rate is 30 to 34 years, with 97.4% or 331 individuals in the labor force. Within the labor force, the 20 to 24 years age range has the highest percentage of unemployed individuals, with 7.3% or 11 of them being unemployed.
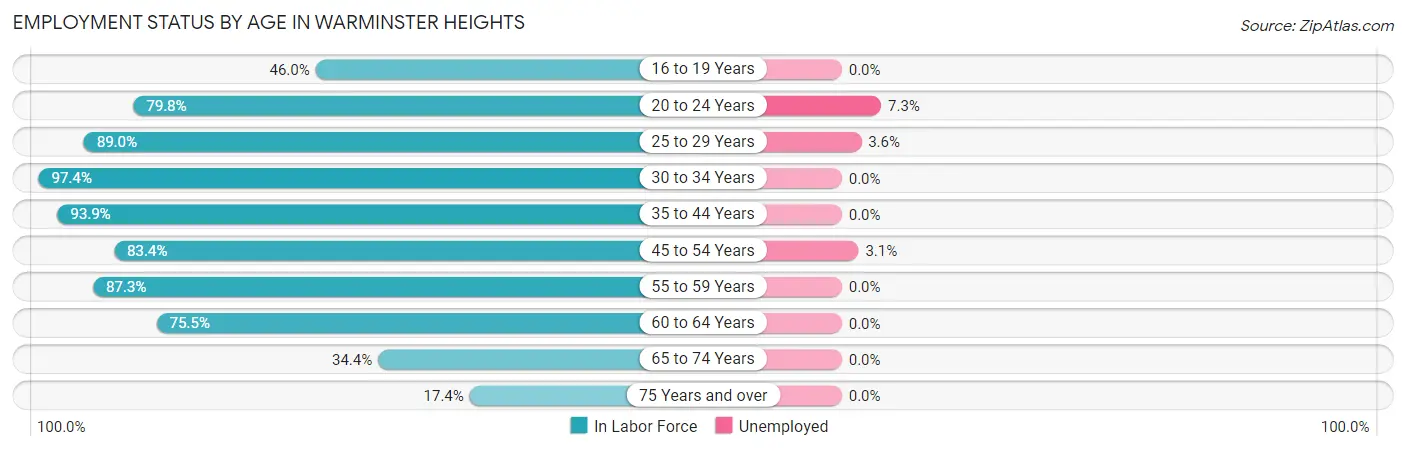
| Age Bracket | In Labor Force | Unemployed |
| 16 to 19 Years | 97 (46.0%) | 0 (0.0%) |
| 20 to 24 Years | 150 (79.8%) | 11 (7.3%) |
| 25 to 29 Years | 274 (89.0%) | 10 (3.6%) |
| 30 to 34 Years | 331 (97.4%) | 0 (0.0%) |
| 35 to 44 Years | 400 (93.9%) | 0 (0.0%) |
| 45 to 54 Years | 451 (83.4%) | 14 (3.1%) |
| 55 to 59 Years | 241 (87.3%) | 0 (0.0%) |
| 60 to 64 Years | 243 (75.5%) | 0 (0.0%) |
| 65 to 74 Years | 122 (34.4%) | 0 (0.0%) |
| 75 Years and over | 50 (17.4%) | 0 (0.0%) |
| Total | 2,360 (72.5%) | 35 (1.5%) |
Employment Status by Educational Attainment in Warminster Heights
According to labor force statistics for Warminster Heights, 87.7% of individuals (1,941) out of the total population between 25 and 64 years of age (2,213) are in the labor force, with 1.2% or 23 of them being unemployed. The group with the highest labor force participation rate are those with the educational attainment of bachelor's degree or higher, with 90.7% or 625 individuals in the labor force. Within the labor force, individuals with high school diploma education have the highest percentage of unemployment, with 4.0% or 24 of them being unemployed.
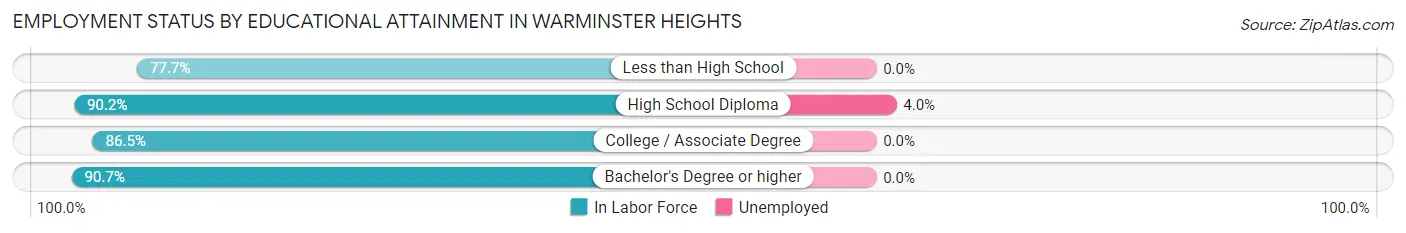
| Educational Attainment | In Labor Force | Unemployed |
| Less than High School | 240 (77.7%) | 0 (0.0%) |
| High School Diploma | 595 (90.2%) | 26 (4.0%) |
| College / Associate Degree | 480 (86.5%) | 0 (0.0%) |
| Bachelor's Degree or higher | 625 (90.7%) | 0 (0.0%) |
| Total | 1,941 (87.7%) | 27 (1.2%) |
Employment Occupations by Sex in Warminster Heights
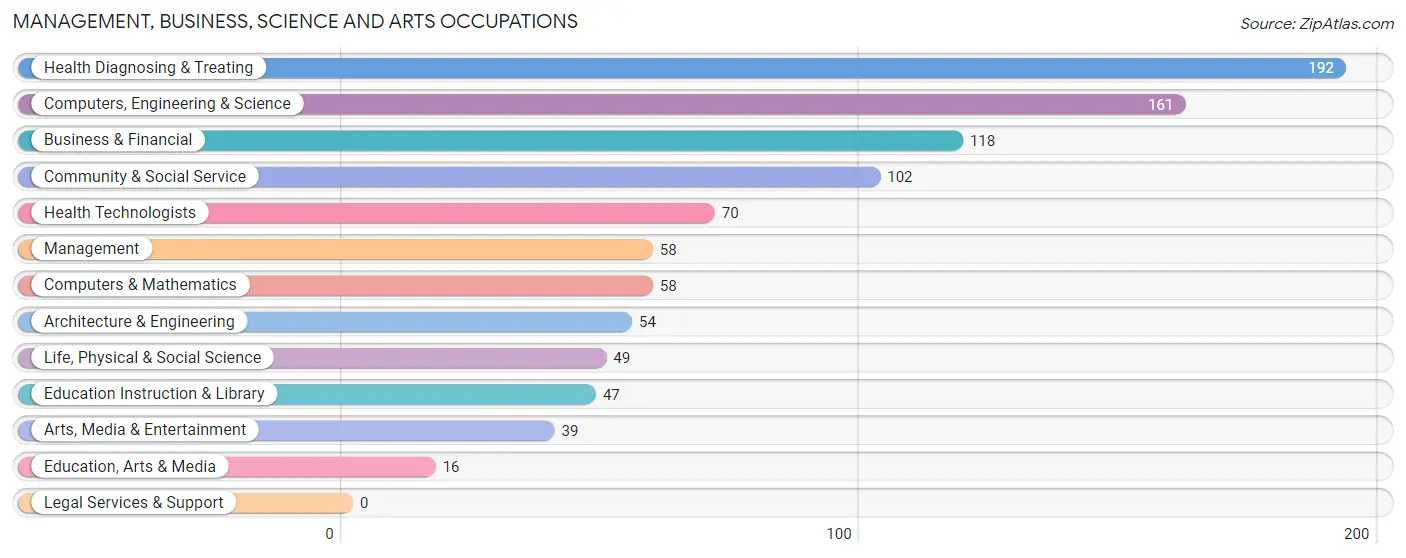
Management, Business, Science and Arts Occupations
The most common Management, Business, Science and Arts occupations in Warminster Heights are Health Diagnosing & Treating (192 | 8.3%), Computers, Engineering & Science (161 | 6.9%), Business & Financial (118 | 5.1%), Community & Social Service (102 | 4.4%), and Health Technologists (70 | 3.0%).
Management, Business, Science and Arts Occupations by Sex
Within the Management, Business, Science and Arts occupations in Warminster Heights, the most male-oriented occupations are Arts, Media & Entertainment (100.0%), Management (82.8%), and Architecture & Engineering (81.5%), while the most female-oriented occupations are Education, Arts & Media (100.0%), Education Instruction & Library (100.0%), and Health Technologists (100.0%).
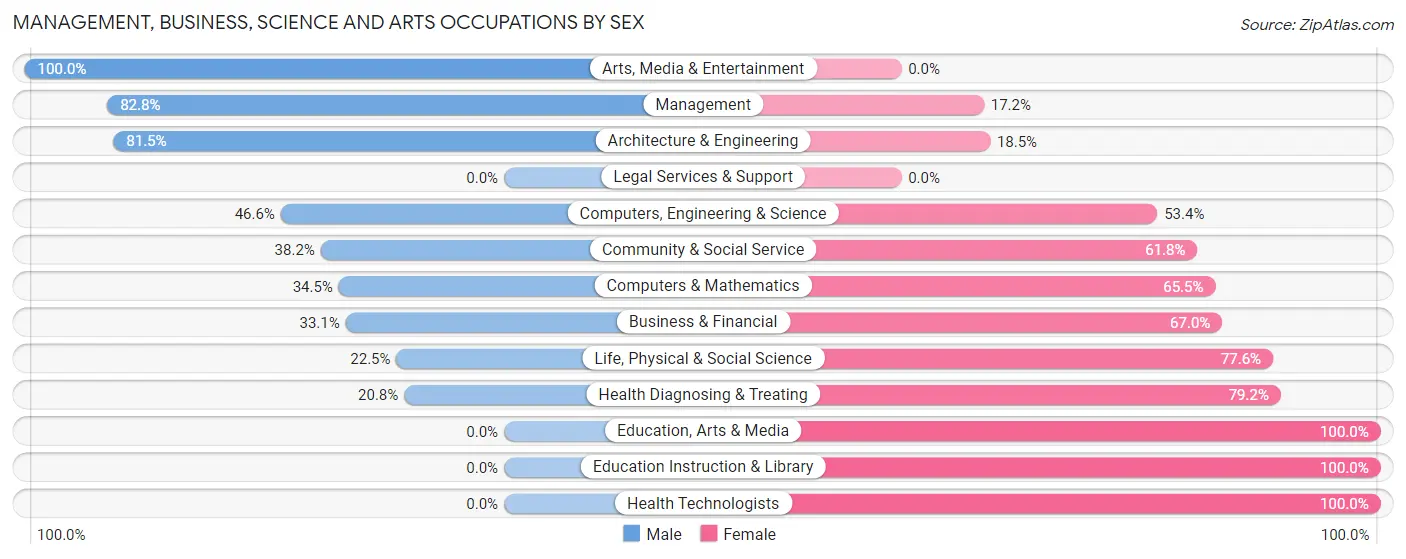
| Occupation | Male | Female |
| Management | 48 (82.8%) | 10 (17.2%) |
| Business & Financial | 39 (33.1%) | 79 (66.9%) |
| Computers, Engineering & Science | 75 (46.6%) | 86 (53.4%) |
| Computers & Mathematics | 20 (34.5%) | 38 (65.5%) |
| Architecture & Engineering | 44 (81.5%) | 10 (18.5%) |
| Life, Physical & Social Science | 11 (22.5%) | 38 (77.5%) |
| Community & Social Service | 39 (38.2%) | 63 (61.8%) |
| Education, Arts & Media | 0 (0.0%) | 16 (100.0%) |
| Legal Services & Support | 0 (0.0%) | 0 (0.0%) |
| Education Instruction & Library | 0 (0.0%) | 47 (100.0%) |
| Arts, Media & Entertainment | 39 (100.0%) | 0 (0.0%) |
| Health Diagnosing & Treating | 40 (20.8%) | 152 (79.2%) |
| Health Technologists | 0 (0.0%) | 70 (100.0%) |
| Total (Category) | 241 (38.2%) | 390 (61.8%) |
| Total (Overall) | 1,002 (43.1%) | 1,322 (56.9%) |
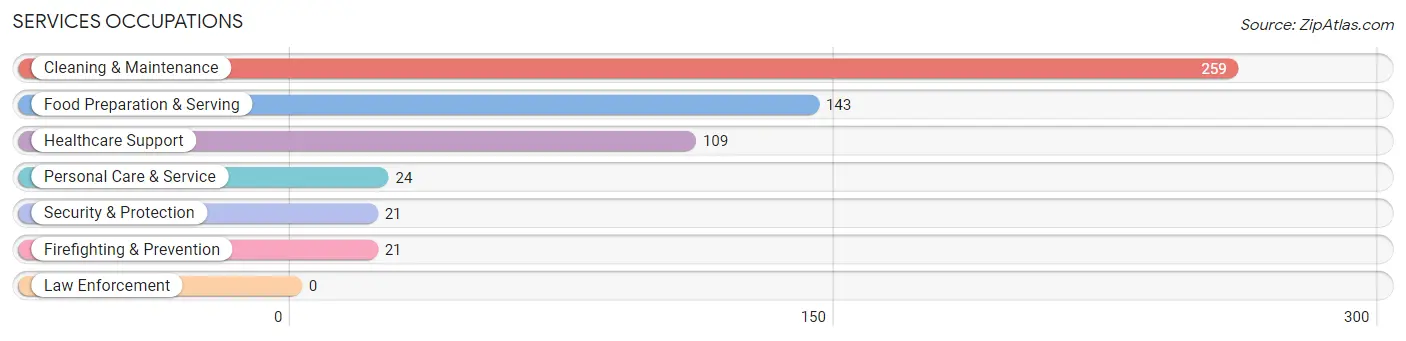
Services Occupations
The most common Services occupations in Warminster Heights are Cleaning & Maintenance (259 | 11.1%), Food Preparation & Serving (143 | 6.1%), Healthcare Support (109 | 4.7%), Personal Care & Service (24 | 1.0%), and Security & Protection (21 | 0.9%).
Services Occupations by Sex
Within the Services occupations in Warminster Heights, the most male-oriented occupations are Personal Care & Service (100.0%), Food Preparation & Serving (55.9%), and Security & Protection (52.4%), while the most female-oriented occupations are Cleaning & Maintenance (79.9%), Healthcare Support (76.1%), and Security & Protection (47.6%).
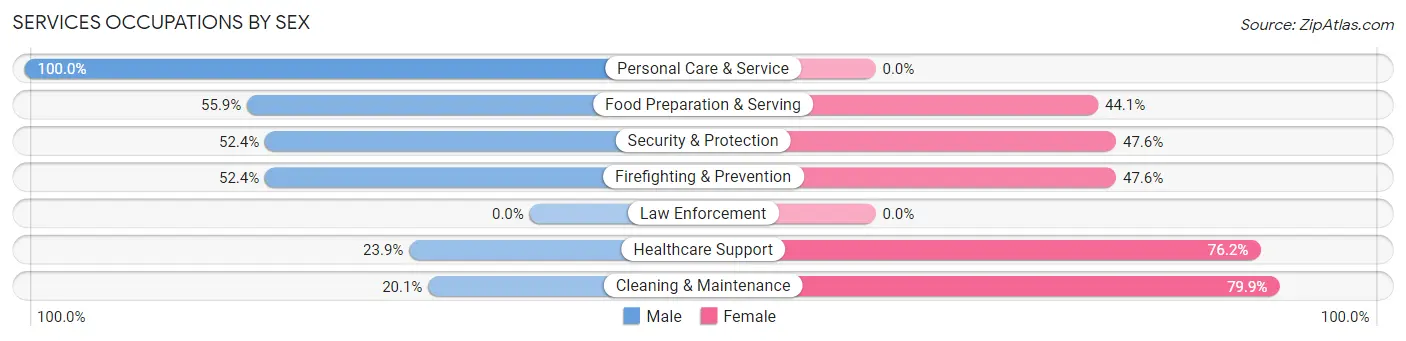
| Occupation | Male | Female |
| Healthcare Support | 26 (23.8%) | 83 (76.1%) |
| Security & Protection | 11 (52.4%) | 10 (47.6%) |
| Firefighting & Prevention | 11 (52.4%) | 10 (47.6%) |
| Law Enforcement | 0 (0.0%) | 0 (0.0%) |
| Food Preparation & Serving | 80 (55.9%) | 63 (44.1%) |
| Cleaning & Maintenance | 52 (20.1%) | 207 (79.9%) |
| Personal Care & Service | 24 (100.0%) | 0 (0.0%) |
| Total (Category) | 193 (34.7%) | 363 (65.3%) |
| Total (Overall) | 1,002 (43.1%) | 1,322 (56.9%) |
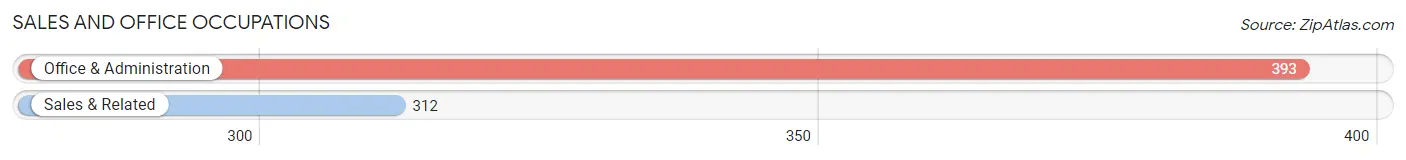
Sales and Office Occupations
The most common Sales and Office occupations in Warminster Heights are Office & Administration (393 | 16.9%), and Sales & Related (312 | 13.4%).
Sales and Office Occupations by Sex
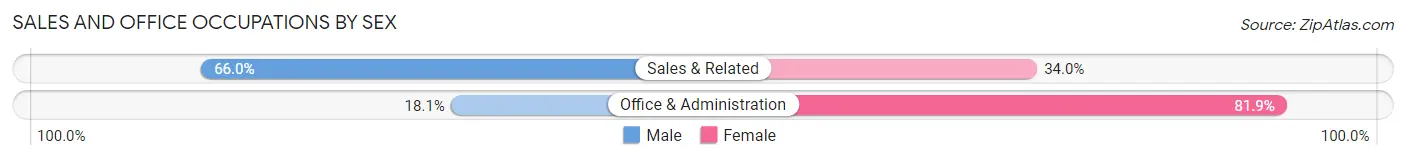
| Occupation | Male | Female |
| Sales & Related | 206 (66.0%) | 106 (34.0%) |
| Office & Administration | 71 (18.1%) | 322 (81.9%) |
| Total (Category) | 277 (39.3%) | 428 (60.7%) |
| Total (Overall) | 1,002 (43.1%) | 1,322 (56.9%) |
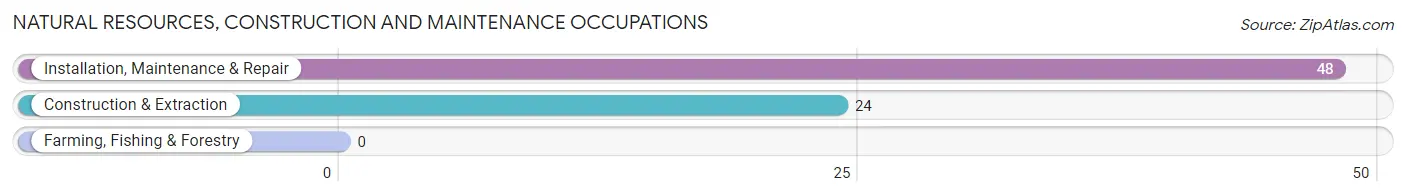
Natural Resources, Construction and Maintenance Occupations
The most common Natural Resources, Construction and Maintenance occupations in Warminster Heights are Installation, Maintenance & Repair (48 | 2.1%), and Construction & Extraction (24 | 1.0%).
Natural Resources, Construction and Maintenance Occupations by Sex
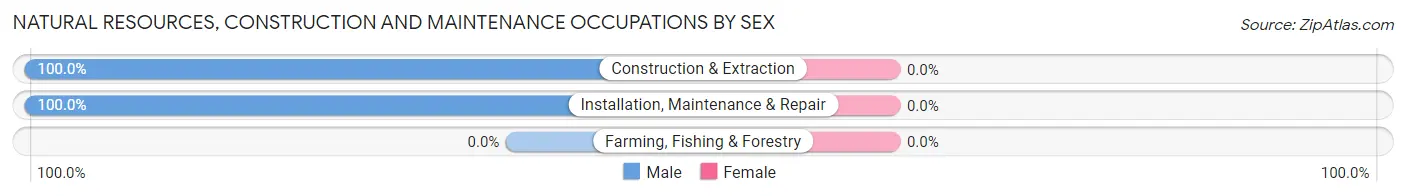
| Occupation | Male | Female |
| Farming, Fishing & Forestry | 0 (0.0%) | 0 (0.0%) |
| Construction & Extraction | 24 (100.0%) | 0 (0.0%) |
| Installation, Maintenance & Repair | 48 (100.0%) | 0 (0.0%) |
| Total (Category) | 72 (100.0%) | 0 (0.0%) |
| Total (Overall) | 1,002 (43.1%) | 1,322 (56.9%) |
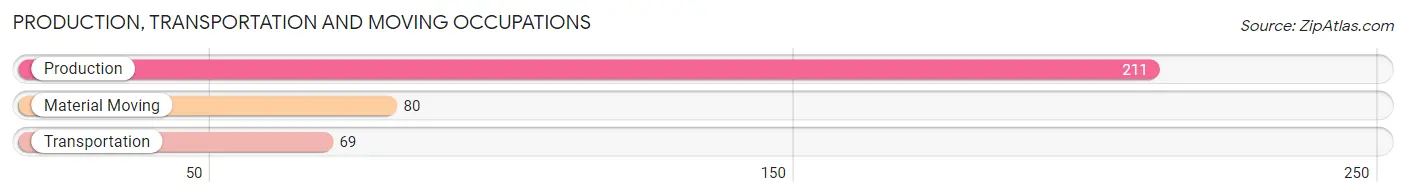
Production, Transportation and Moving Occupations
The most common Production, Transportation and Moving occupations in Warminster Heights are Production (211 | 9.1%), Material Moving (80 | 3.4%), and Transportation (69 | 3.0%).
Production, Transportation and Moving Occupations by Sex
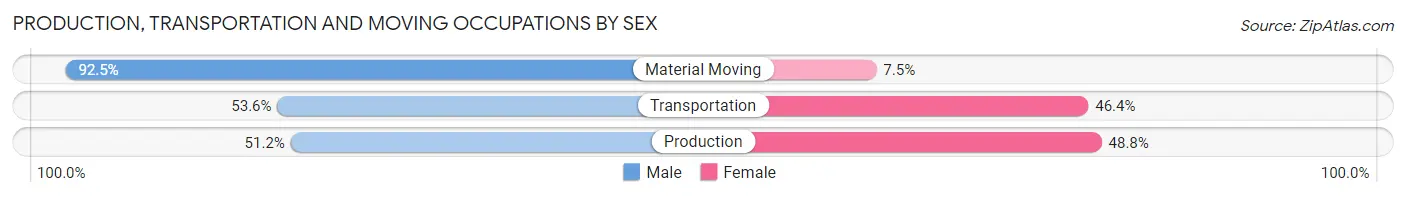
| Occupation | Male | Female |
| Production | 108 (51.2%) | 103 (48.8%) |
| Transportation | 37 (53.6%) | 32 (46.4%) |
| Material Moving | 74 (92.5%) | 6 (7.5%) |
| Total (Category) | 219 (60.8%) | 141 (39.2%) |
| Total (Overall) | 1,002 (43.1%) | 1,322 (56.9%) |
Employment Industries by Sex in Warminster Heights
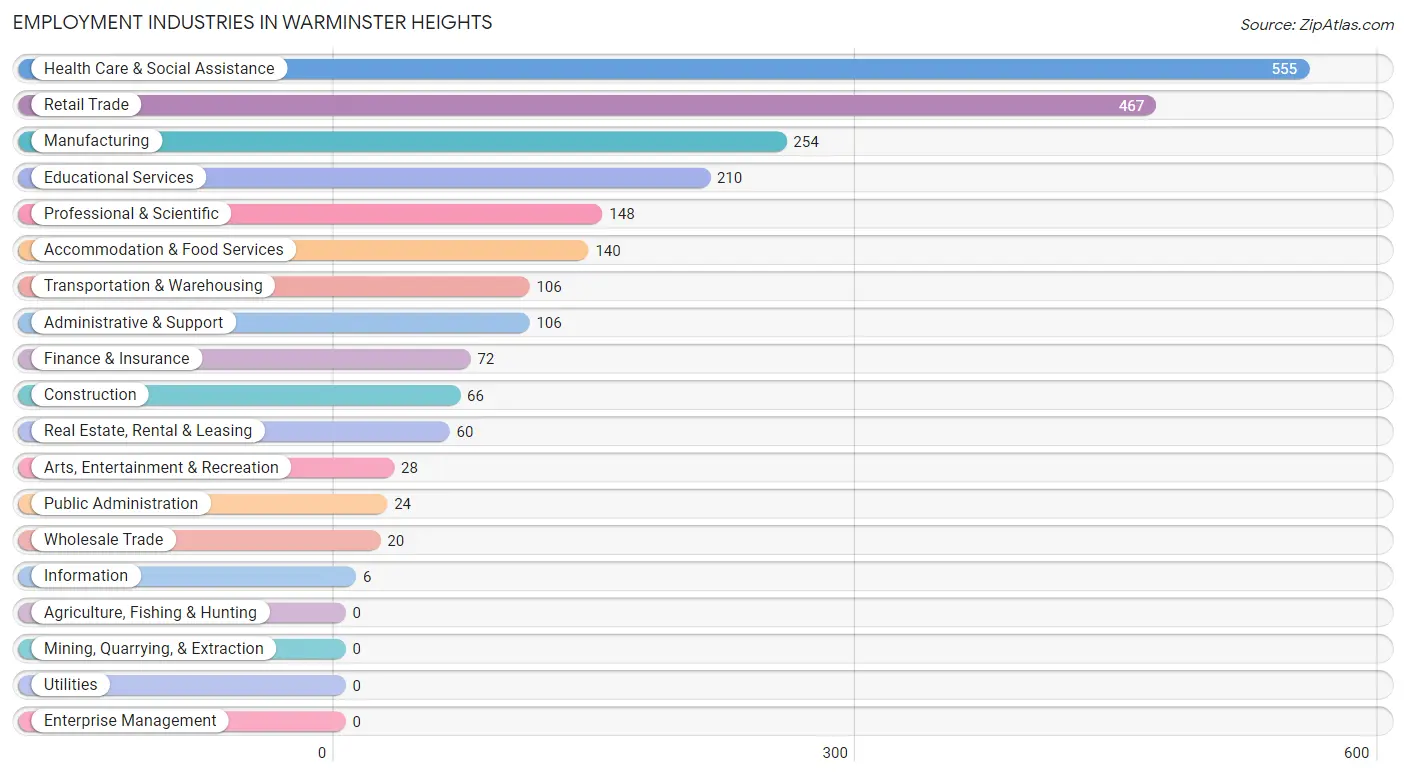
Employment Industries in Warminster Heights
The major employment industries in Warminster Heights include Health Care & Social Assistance (555 | 23.9%), Retail Trade (467 | 20.1%), Manufacturing (254 | 10.9%), Educational Services (210 | 9.0%), and Professional & Scientific (148 | 6.4%).
Employment Industries by Sex in Warminster Heights
The Warminster Heights industries that see more men than women are Information (100.0%), Arts, Entertainment & Recreation (100.0%), and Public Administration (100.0%), whereas the industries that tend to have a higher number of women are Real Estate, Rental & Leasing (100.0%), Health Care & Social Assistance (76.4%), and Educational Services (70.5%).
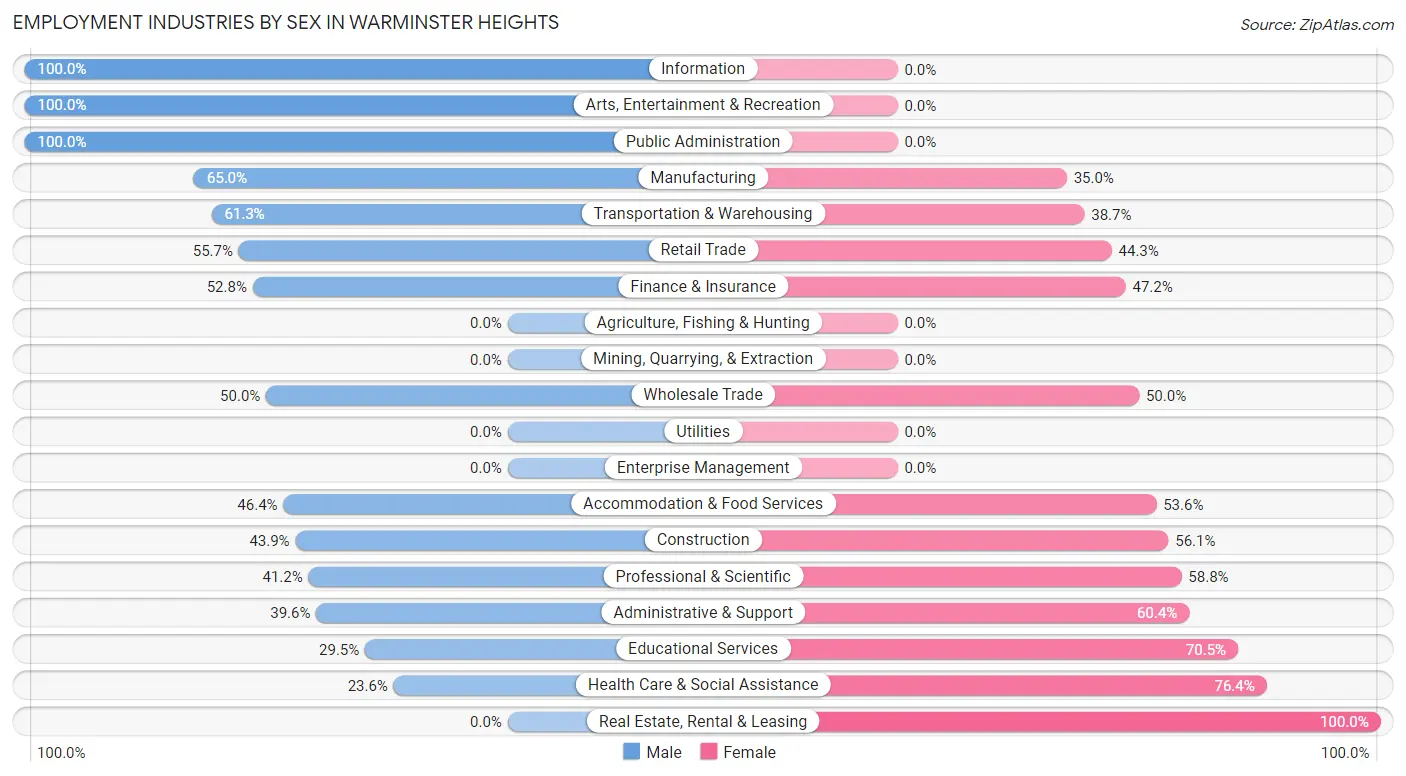
| Industry | Male | Female |
| Agriculture, Fishing & Hunting | 0 (0.0%) | 0 (0.0%) |
| Mining, Quarrying, & Extraction | 0 (0.0%) | 0 (0.0%) |
| Construction | 29 (43.9%) | 37 (56.1%) |
| Manufacturing | 165 (65.0%) | 89 (35.0%) |
| Wholesale Trade | 10 (50.0%) | 10 (50.0%) |
| Retail Trade | 260 (55.7%) | 207 (44.3%) |
| Transportation & Warehousing | 65 (61.3%) | 41 (38.7%) |
| Utilities | 0 (0.0%) | 0 (0.0%) |
| Information | 6 (100.0%) | 0 (0.0%) |
| Finance & Insurance | 38 (52.8%) | 34 (47.2%) |
| Real Estate, Rental & Leasing | 0 (0.0%) | 60 (100.0%) |
| Professional & Scientific | 61 (41.2%) | 87 (58.8%) |
| Enterprise Management | 0 (0.0%) | 0 (0.0%) |
| Administrative & Support | 42 (39.6%) | 64 (60.4%) |
| Educational Services | 62 (29.5%) | 148 (70.5%) |
| Health Care & Social Assistance | 131 (23.6%) | 424 (76.4%) |
| Arts, Entertainment & Recreation | 28 (100.0%) | 0 (0.0%) |
| Accommodation & Food Services | 65 (46.4%) | 75 (53.6%) |
| Public Administration | 24 (100.0%) | 0 (0.0%) |
| Total | 1,002 (43.1%) | 1,322 (56.9%) |
Education in Warminster Heights
School Enrollment in Warminster Heights
The most common levels of schooling among the 691 students in Warminster Heights are high school (205 | 29.7%), college / undergraduate (194 | 28.1%), and elementary school (150 | 21.7%).
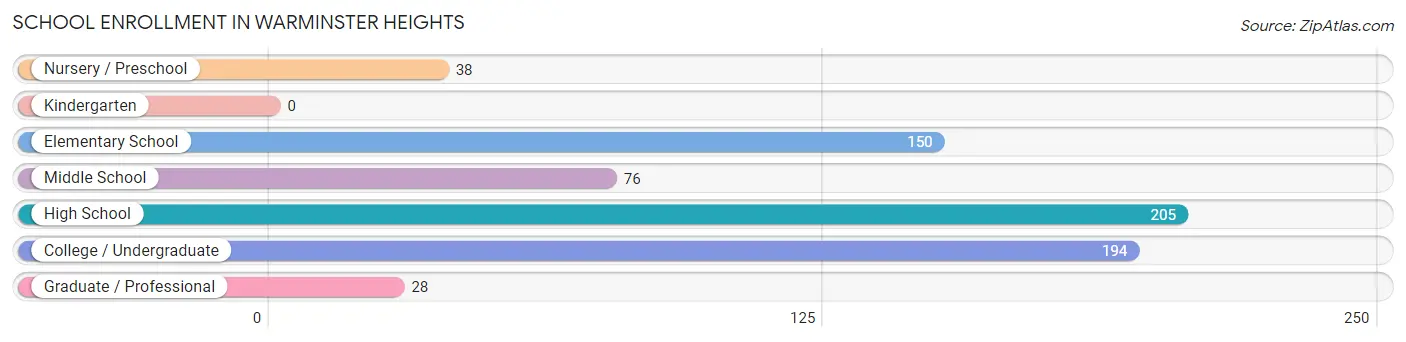
| School Level | # Students | % Students |
| Nursery / Preschool | 38 | 5.5% |
| Kindergarten | 0 | 0.0% |
| Elementary School | 150 | 21.7% |
| Middle School | 76 | 11.0% |
| High School | 205 | 29.7% |
| College / Undergraduate | 194 | 28.1% |
| Graduate / Professional | 28 | 4.1% |
| Total | 691 | 100.0% |
School Enrollment by Age by Funding Source in Warminster Heights
Out of a total of 691 students who are enrolled in schools in Warminster Heights, 28 (4.1%) attend a private institution, while the remaining 663 (95.9%) are enrolled in public schools. The age group of 35 years and over has the highest likelihood of being enrolled in private schools, with 28 (45.2% in the age bracket) enrolled. Conversely, the age group of 3 to 4 year olds has the lowest likelihood of being enrolled in a private school, with 38 (100.0% in the age bracket) attending a public institution.
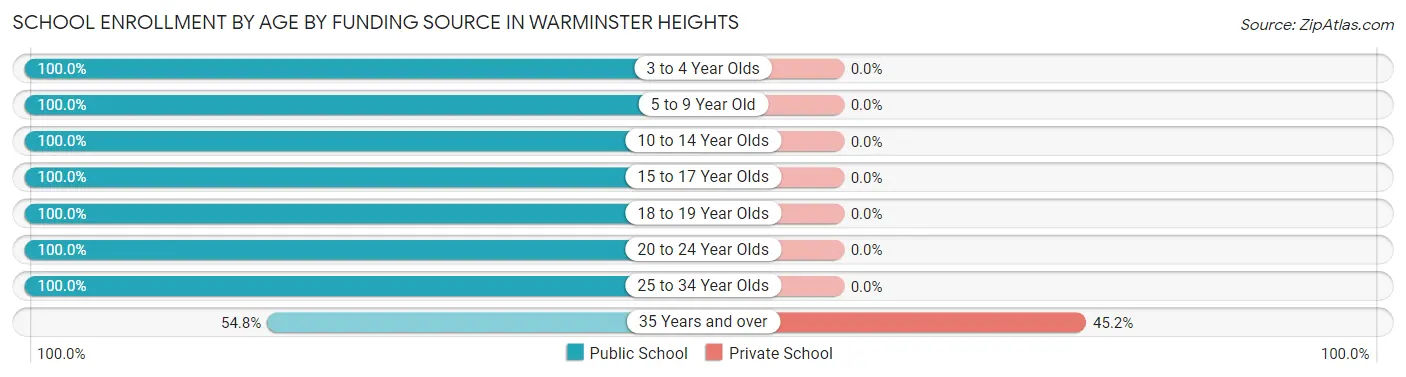
| Age Bracket | Public School | Private School |
| 3 to 4 Year Olds | 38 (100.0%) | 0 (0.0%) |
| 5 to 9 Year Old | 116 (100.0%) | 0 (0.0%) |
| 10 to 14 Year Olds | 169 (100.0%) | 0 (0.0%) |
| 15 to 17 Year Olds | 100 (100.0%) | 0 (0.0%) |
| 18 to 19 Year Olds | 113 (100.0%) | 0 (0.0%) |
| 20 to 24 Year Olds | 72 (100.0%) | 0 (0.0%) |
| 25 to 34 Year Olds | 21 (100.0%) | 0 (0.0%) |
| 35 Years and over | 34 (54.8%) | 28 (45.2%) |
| Total | 663 (95.9%) | 28 (4.1%) |
Educational Attainment by Field of Study in Warminster Heights
Business (217 | 27.5%), arts & humanities (88 | 11.2%), science & technology (74 | 9.4%), liberal arts & history (59 | 7.5%), and social sciences (57 | 7.2%) are the most common fields of study among 788 individuals in Warminster Heights who have obtained a bachelor's degree or higher.
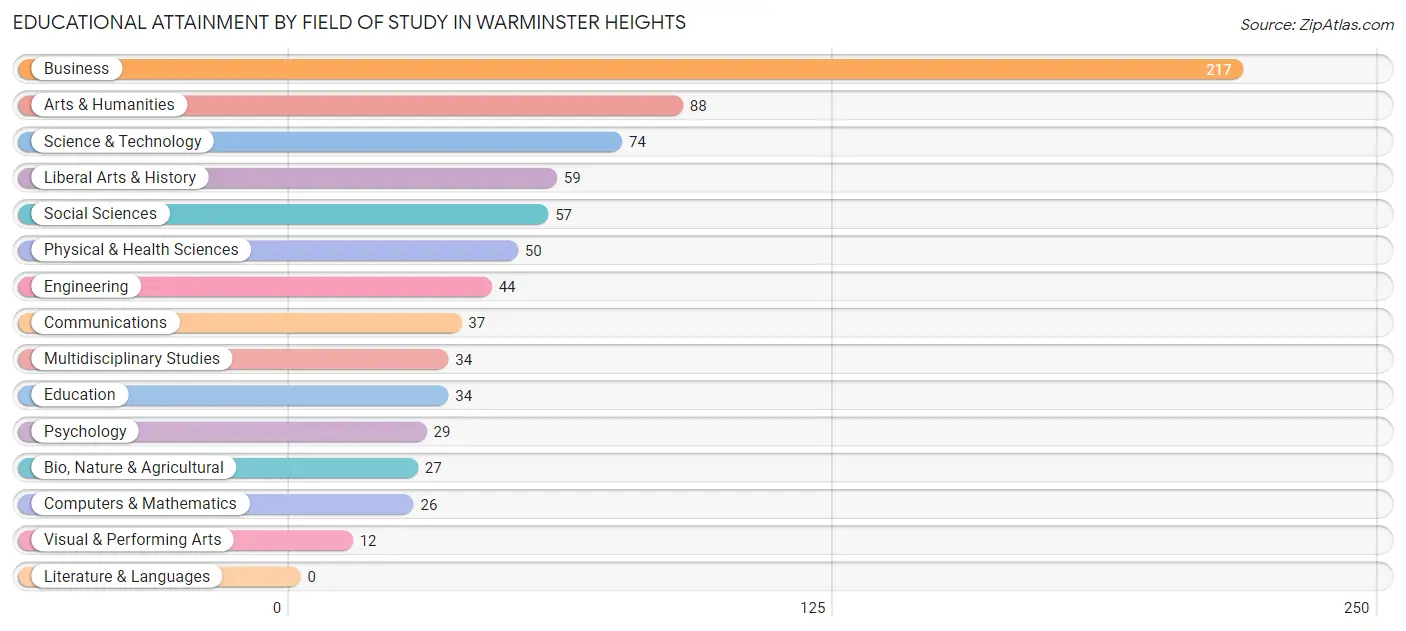
| Field of Study | # Graduates | % Graduates |
| Computers & Mathematics | 26 | 3.3% |
| Bio, Nature & Agricultural | 27 | 3.4% |
| Physical & Health Sciences | 50 | 6.4% |
| Psychology | 29 | 3.7% |
| Social Sciences | 57 | 7.2% |
| Engineering | 44 | 5.6% |
| Multidisciplinary Studies | 34 | 4.3% |
| Science & Technology | 74 | 9.4% |
| Business | 217 | 27.5% |
| Education | 34 | 4.3% |
| Literature & Languages | 0 | 0.0% |
| Liberal Arts & History | 59 | 7.5% |
| Visual & Performing Arts | 12 | 1.5% |
| Communications | 37 | 4.7% |
| Arts & Humanities | 88 | 11.2% |
| Total | 788 | 100.0% |
Transportation & Commute in Warminster Heights
Vehicle Availability by Sex in Warminster Heights
The most prevalent vehicle ownership categories in Warminster Heights are males with 2 vehicles (441, accounting for 45.0%) and females with 2 vehicles (496, making up 35.5%).
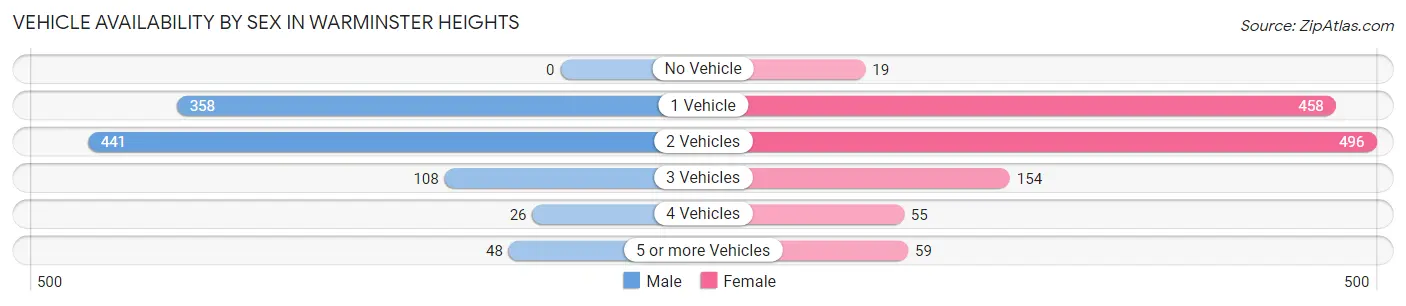
| Vehicles Available | Male | Female |
| No Vehicle | 0 (0.0%) | 19 (1.5%) |
| 1 Vehicle | 358 (36.5%) | 458 (36.9%) |
| 2 Vehicles | 441 (45.0%) | 496 (40.0%) |
| 3 Vehicles | 108 (11.0%) | 154 (12.4%) |
| 4 Vehicles | 26 (2.6%) | 55 (4.4%) |
| 5 or more Vehicles | 48 (4.9%) | 59 (4.8%) |
| Total | 981 (100.0%) | 1,241 (100.0%) |
Commute Time in Warminster Heights
The most frequently occuring commute durations in Warminster Heights are 10 to 14 minutes (363 commuters, 17.2%), 5 to 9 minutes (332 commuters, 15.7%), and 20 to 24 minutes (242 commuters, 11.4%).
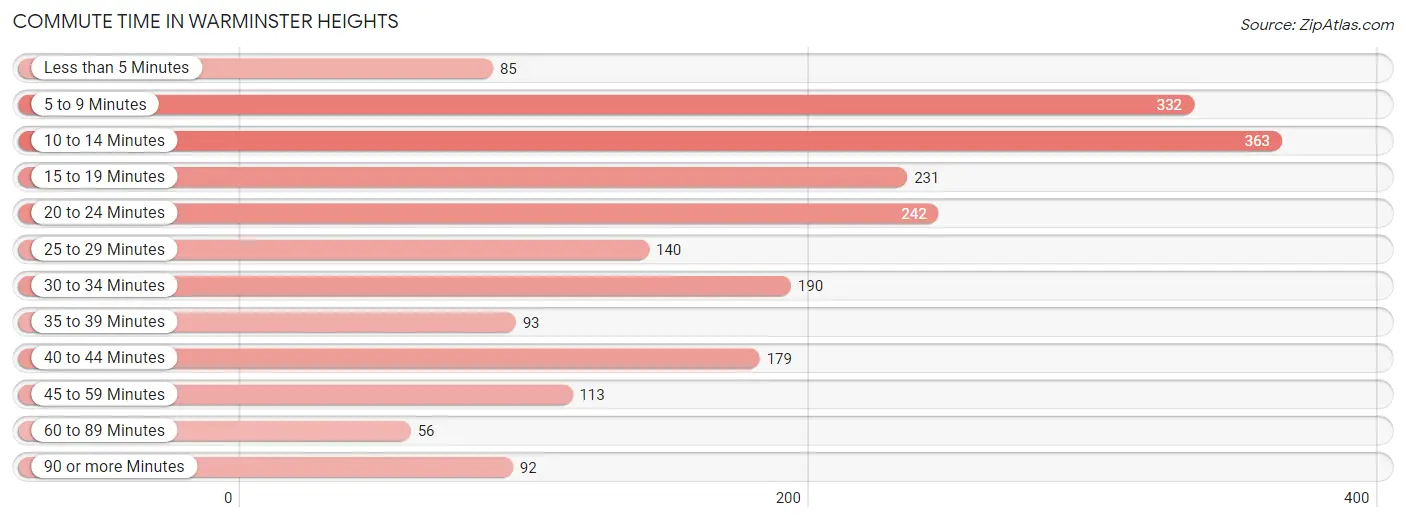
| Commute Time | # Commuters | % Commuters |
| Less than 5 Minutes | 85 | 4.0% |
| 5 to 9 Minutes | 332 | 15.7% |
| 10 to 14 Minutes | 363 | 17.2% |
| 15 to 19 Minutes | 231 | 10.9% |
| 20 to 24 Minutes | 242 | 11.4% |
| 25 to 29 Minutes | 140 | 6.6% |
| 30 to 34 Minutes | 190 | 9.0% |
| 35 to 39 Minutes | 93 | 4.4% |
| 40 to 44 Minutes | 179 | 8.5% |
| 45 to 59 Minutes | 113 | 5.3% |
| 60 to 89 Minutes | 56 | 2.6% |
| 90 or more Minutes | 92 | 4.3% |
Commute Time by Sex in Warminster Heights
The most common commute times in Warminster Heights are 10 to 14 minutes (233 commuters, 25.4%) for males and 5 to 9 minutes (284 commuters, 23.7%) for females.
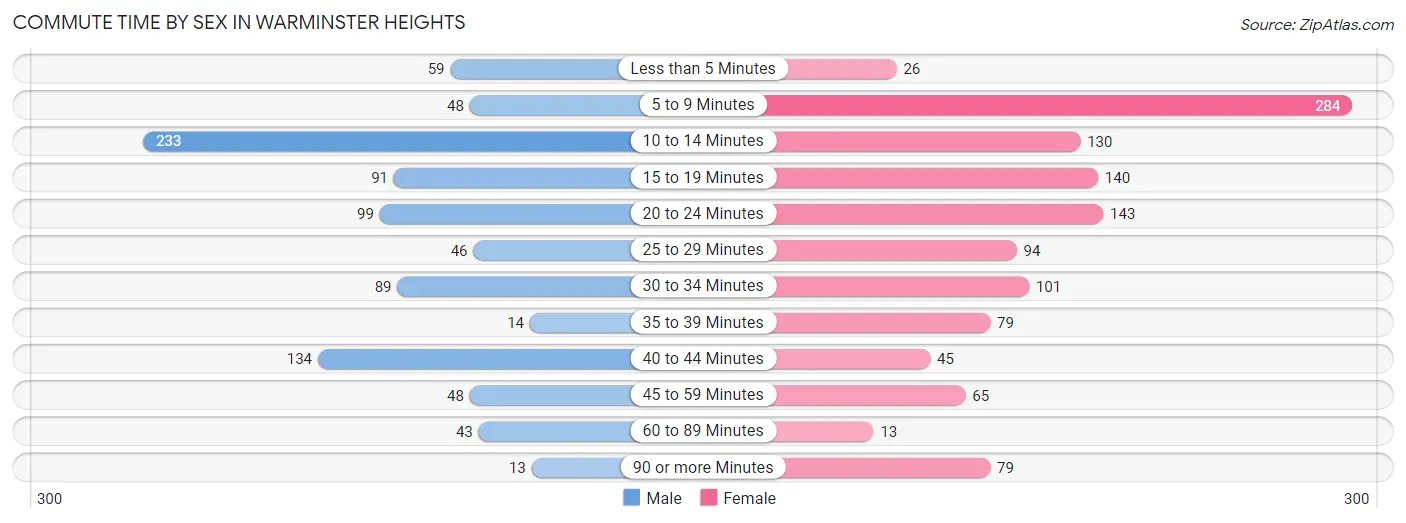
| Commute Time | Male | Female |
| Less than 5 Minutes | 59 (6.4%) | 26 (2.2%) |
| 5 to 9 Minutes | 48 (5.2%) | 284 (23.7%) |
| 10 to 14 Minutes | 233 (25.4%) | 130 (10.8%) |
| 15 to 19 Minutes | 91 (9.9%) | 140 (11.7%) |
| 20 to 24 Minutes | 99 (10.8%) | 143 (11.9%) |
| 25 to 29 Minutes | 46 (5.0%) | 94 (7.8%) |
| 30 to 34 Minutes | 89 (9.7%) | 101 (8.4%) |
| 35 to 39 Minutes | 14 (1.5%) | 79 (6.6%) |
| 40 to 44 Minutes | 134 (14.6%) | 45 (3.7%) |
| 45 to 59 Minutes | 48 (5.2%) | 65 (5.4%) |
| 60 to 89 Minutes | 43 (4.7%) | 13 (1.1%) |
| 90 or more Minutes | 13 (1.4%) | 79 (6.6%) |
Time of Departure to Work by Sex in Warminster Heights
The most frequent times of departure to work in Warminster Heights are 8:00 AM to 8:29 AM (162, 17.7%) for males and 7:00 AM to 7:29 AM (167, 13.9%) for females.
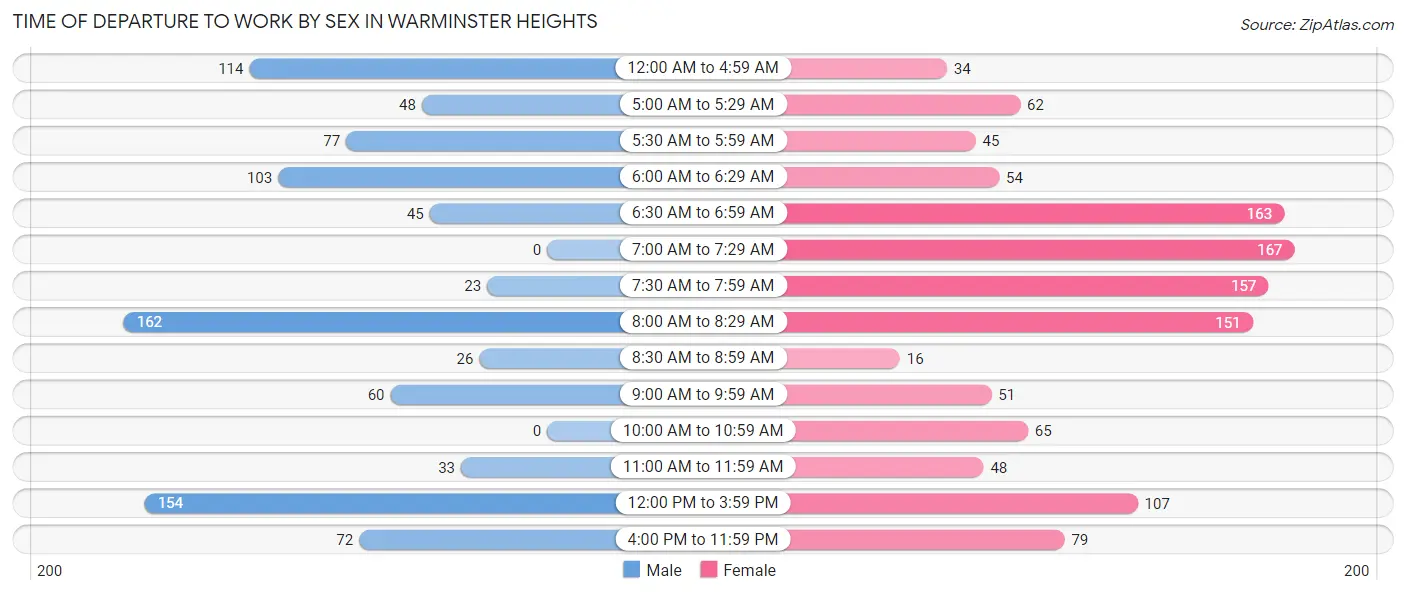
| Time of Departure | Male | Female |
| 12:00 AM to 4:59 AM | 114 (12.4%) | 34 (2.8%) |
| 5:00 AM to 5:29 AM | 48 (5.2%) | 62 (5.2%) |
| 5:30 AM to 5:59 AM | 77 (8.4%) | 45 (3.7%) |
| 6:00 AM to 6:29 AM | 103 (11.2%) | 54 (4.5%) |
| 6:30 AM to 6:59 AM | 45 (4.9%) | 163 (13.6%) |
| 7:00 AM to 7:29 AM | 0 (0.0%) | 167 (13.9%) |
| 7:30 AM to 7:59 AM | 23 (2.5%) | 157 (13.1%) |
| 8:00 AM to 8:29 AM | 162 (17.7%) | 151 (12.6%) |
| 8:30 AM to 8:59 AM | 26 (2.8%) | 16 (1.3%) |
| 9:00 AM to 9:59 AM | 60 (6.5%) | 51 (4.3%) |
| 10:00 AM to 10:59 AM | 0 (0.0%) | 65 (5.4%) |
| 11:00 AM to 11:59 AM | 33 (3.6%) | 48 (4.0%) |
| 12:00 PM to 3:59 PM | 154 (16.8%) | 107 (8.9%) |
| 4:00 PM to 11:59 PM | 72 (7.9%) | 79 (6.6%) |
| Total | 917 (100.0%) | 1,199 (100.0%) |
Housing Occupancy in Warminster Heights
Occupancy by Ownership in Warminster Heights
Of the total 1,810 dwellings in Warminster Heights, owner-occupied units account for 415 (22.9%), while renter-occupied units make up 1,395 (77.1%).
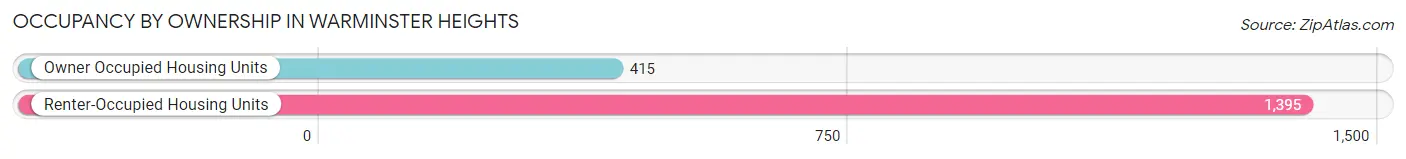
| Occupancy | # Housing Units | % Housing Units |
| Owner Occupied Housing Units | 415 | 22.9% |
| Renter-Occupied Housing Units | 1,395 | 77.1% |
| Total Occupied Housing Units | 1,810 | 100.0% |
Occupancy by Household Size in Warminster Heights
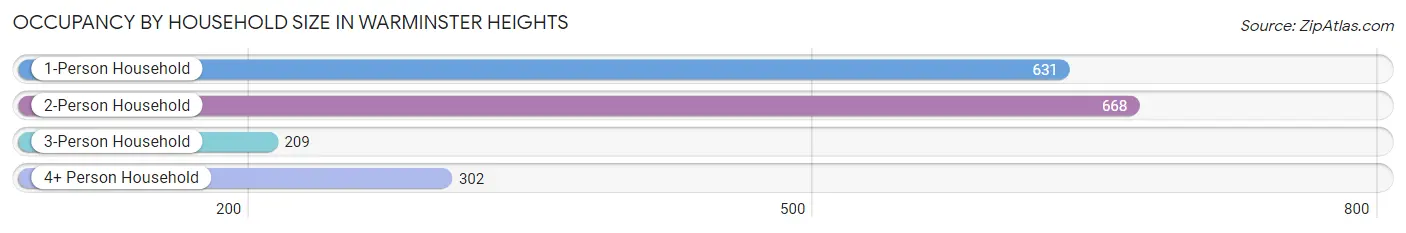
| Household Size | # Housing Units | % Housing Units |
| 1-Person Household | 631 | 34.9% |
| 2-Person Household | 668 | 36.9% |
| 3-Person Household | 209 | 11.6% |
| 4+ Person Household | 302 | 16.7% |
| Total Housing Units | 1,810 | 100.0% |
Occupancy by Ownership by Household Size in Warminster Heights
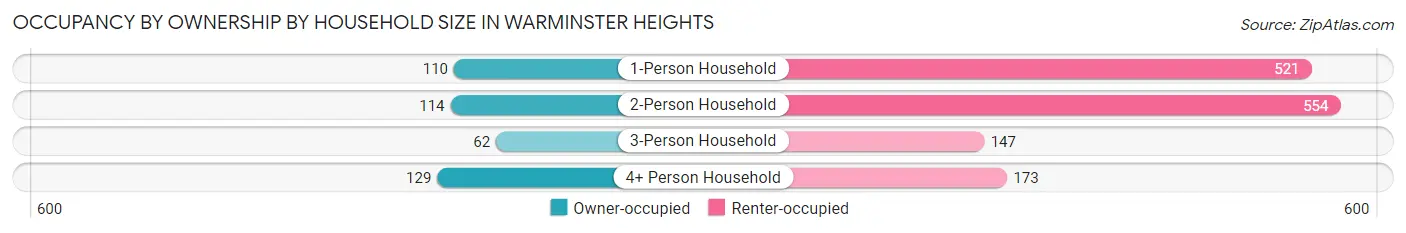
| Household Size | Owner-occupied | Renter-occupied |
| 1-Person Household | 110 (17.4%) | 521 (82.6%) |
| 2-Person Household | 114 (17.1%) | 554 (82.9%) |
| 3-Person Household | 62 (29.7%) | 147 (70.3%) |
| 4+ Person Household | 129 (42.7%) | 173 (57.3%) |
| Total Housing Units | 415 (22.9%) | 1,395 (77.1%) |
Occupancy by Educational Attainment in Warminster Heights
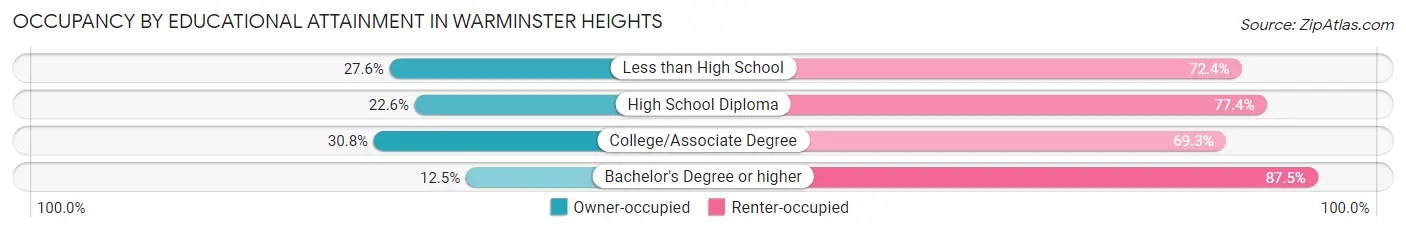
| Household Size | Owner-occupied | Renter-occupied |
| Less than High School | 74 (27.6%) | 194 (72.4%) |
| High School Diploma | 126 (22.6%) | 431 (77.4%) |
| College/Associate Degree | 155 (30.7%) | 349 (69.3%) |
| Bachelor's Degree or higher | 60 (12.5%) | 421 (87.5%) |
Occupancy by Age of Householder in Warminster Heights
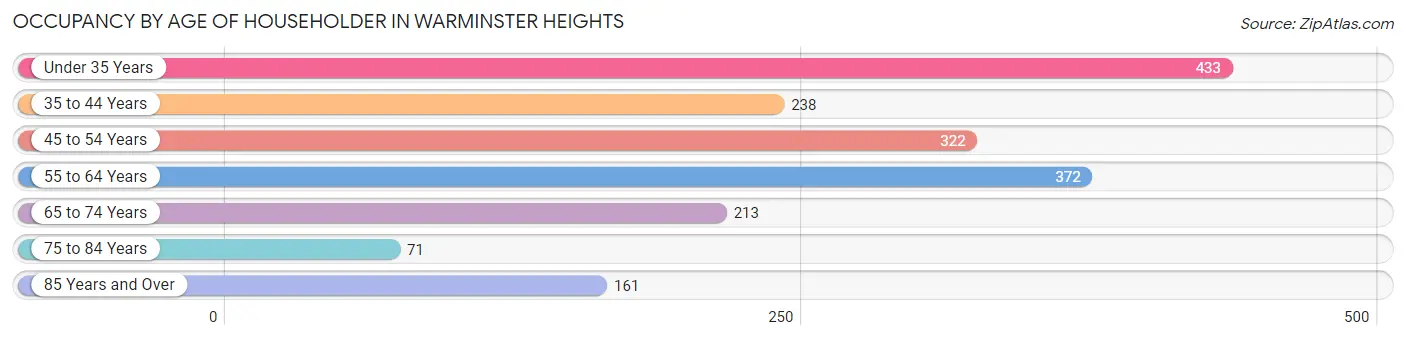
| Age Bracket | # Households | % Households |
| Under 35 Years | 433 | 23.9% |
| 35 to 44 Years | 238 | 13.2% |
| 45 to 54 Years | 322 | 17.8% |
| 55 to 64 Years | 372 | 20.5% |
| 65 to 74 Years | 213 | 11.8% |
| 75 to 84 Years | 71 | 3.9% |
| 85 Years and Over | 161 | 8.9% |
| Total | 1,810 | 100.0% |
Housing Finances in Warminster Heights
Median Income by Occupancy in Warminster Heights
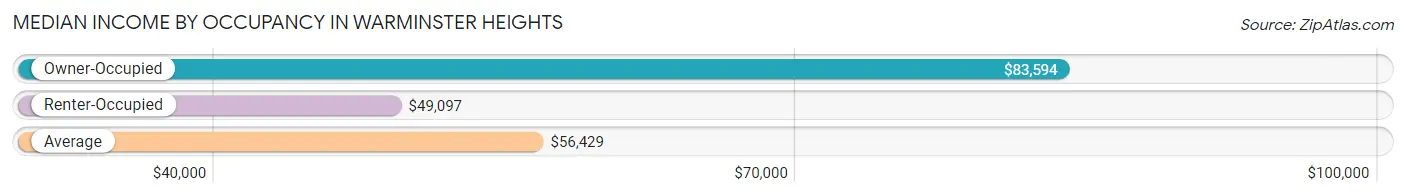
| Occupancy Type | # Households | Median Income |
| Owner-Occupied | 415 (22.9%) | $83,594 |
| Renter-Occupied | 1,395 (77.1%) | $49,097 |
| Average | 1,810 (100.0%) | $56,429 |
Occupancy by Householder Income Bracket in Warminster Heights
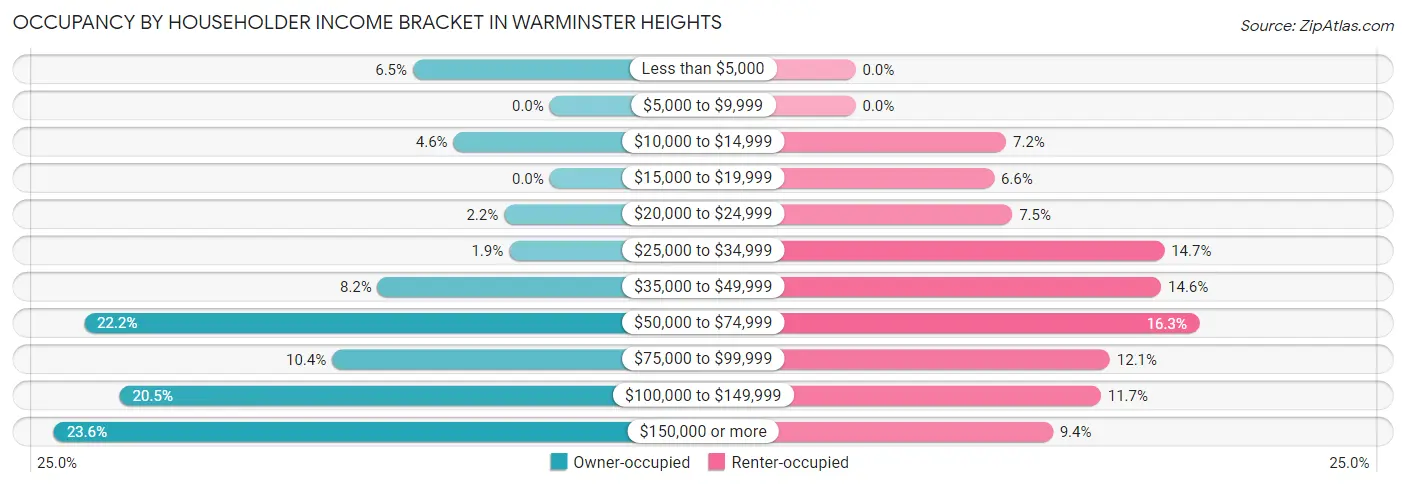
| Income Bracket | Owner-occupied | Renter-occupied |
| Less than $5,000 | 27 (6.5%) | 0 (0.0%) |
| $5,000 to $9,999 | 0 (0.0%) | 0 (0.0%) |
| $10,000 to $14,999 | 19 (4.6%) | 100 (7.2%) |
| $15,000 to $19,999 | 0 (0.0%) | 92 (6.6%) |
| $20,000 to $24,999 | 9 (2.2%) | 104 (7.5%) |
| $25,000 to $34,999 | 8 (1.9%) | 205 (14.7%) |
| $35,000 to $49,999 | 34 (8.2%) | 203 (14.5%) |
| $50,000 to $74,999 | 92 (22.2%) | 228 (16.3%) |
| $75,000 to $99,999 | 43 (10.4%) | 169 (12.1%) |
| $100,000 to $149,999 | 85 (20.5%) | 163 (11.7%) |
| $150,000 or more | 98 (23.6%) | 131 (9.4%) |
| Total | 415 (100.0%) | 1,395 (100.0%) |
Monthly Housing Cost Tiers in Warminster Heights
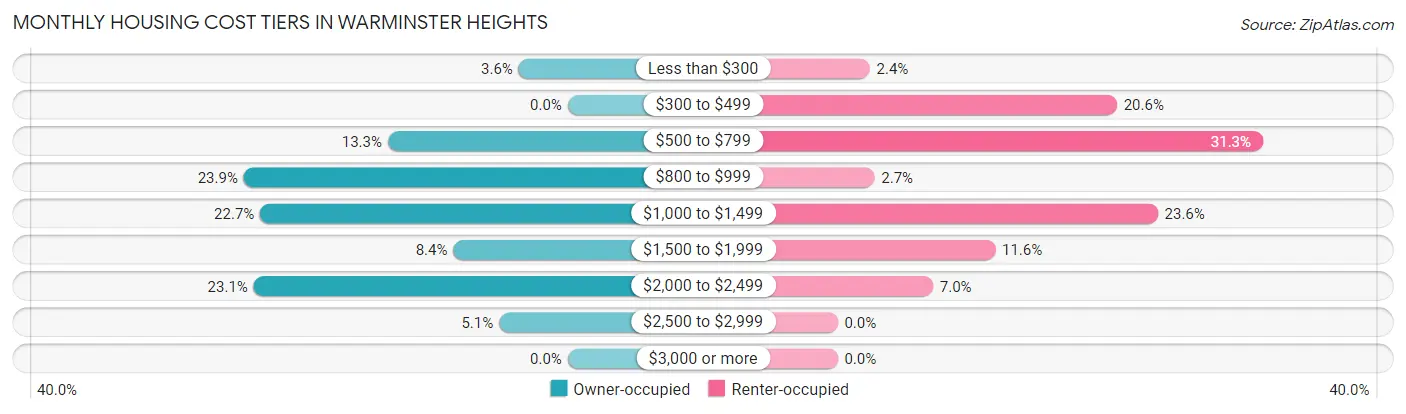
| Monthly Cost | Owner-occupied | Renter-occupied |
| Less than $300 | 15 (3.6%) | 33 (2.4%) |
| $300 to $499 | 0 (0.0%) | 287 (20.6%) |
| $500 to $799 | 55 (13.3%) | 437 (31.3%) |
| $800 to $999 | 99 (23.9%) | 38 (2.7%) |
| $1,000 to $1,499 | 94 (22.7%) | 329 (23.6%) |
| $1,500 to $1,999 | 35 (8.4%) | 162 (11.6%) |
| $2,000 to $2,499 | 96 (23.1%) | 98 (7.0%) |
| $2,500 to $2,999 | 21 (5.1%) | 0 (0.0%) |
| $3,000 or more | 0 (0.0%) | 0 (0.0%) |
| Total | 415 (100.0%) | 1,395 (100.0%) |
Physical Housing Characteristics in Warminster Heights
Housing Structures in Warminster Heights
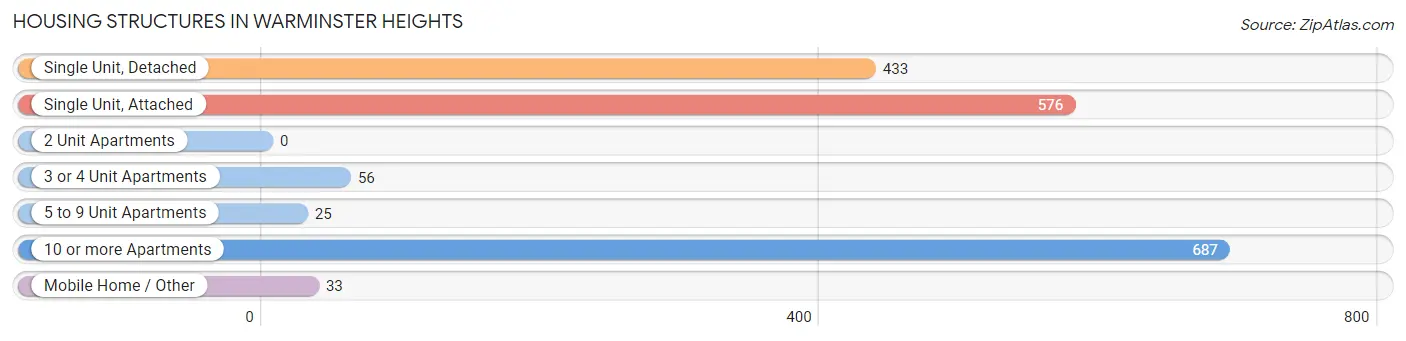
| Structure Type | # Housing Units | % Housing Units |
| Single Unit, Detached | 433 | 23.9% |
| Single Unit, Attached | 576 | 31.8% |
| 2 Unit Apartments | 0 | 0.0% |
| 3 or 4 Unit Apartments | 56 | 3.1% |
| 5 to 9 Unit Apartments | 25 | 1.4% |
| 10 or more Apartments | 687 | 38.0% |
| Mobile Home / Other | 33 | 1.8% |
| Total | 1,810 | 100.0% |
Housing Structures by Occupancy in Warminster Heights
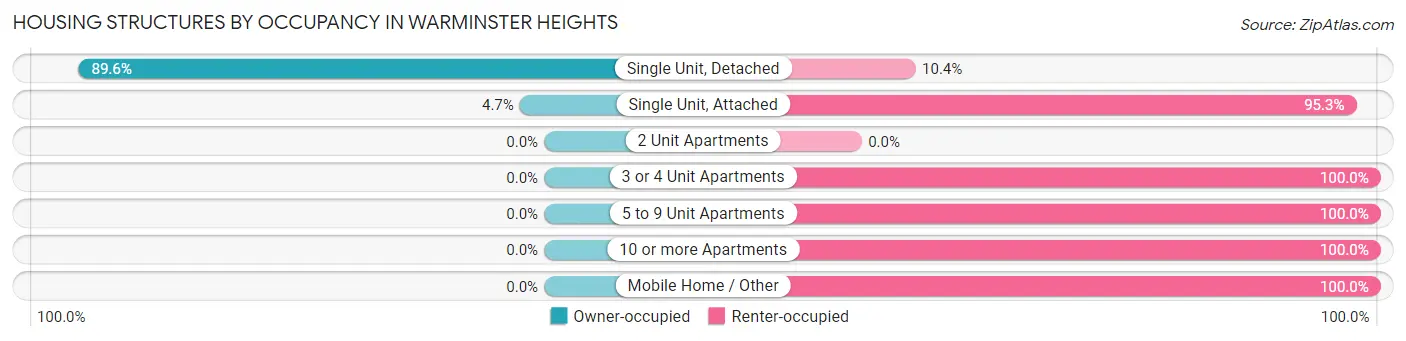
| Structure Type | Owner-occupied | Renter-occupied |
| Single Unit, Detached | 388 (89.6%) | 45 (10.4%) |
| Single Unit, Attached | 27 (4.7%) | 549 (95.3%) |
| 2 Unit Apartments | 0 (0.0%) | 0 (0.0%) |
| 3 or 4 Unit Apartments | 0 (0.0%) | 56 (100.0%) |
| 5 to 9 Unit Apartments | 0 (0.0%) | 25 (100.0%) |
| 10 or more Apartments | 0 (0.0%) | 687 (100.0%) |
| Mobile Home / Other | 0 (0.0%) | 33 (100.0%) |
| Total | 415 (22.9%) | 1,395 (77.1%) |
Housing Structures by Number of Rooms in Warminster Heights
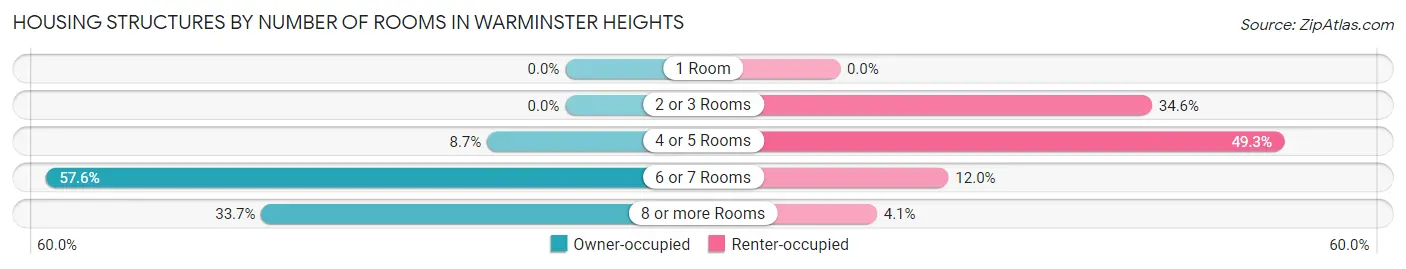
| Number of Rooms | Owner-occupied | Renter-occupied |
| 1 Room | 0 (0.0%) | 0 (0.0%) |
| 2 or 3 Rooms | 0 (0.0%) | 483 (34.6%) |
| 4 or 5 Rooms | 36 (8.7%) | 687 (49.2%) |
| 6 or 7 Rooms | 239 (57.6%) | 168 (12.0%) |
| 8 or more Rooms | 140 (33.7%) | 57 (4.1%) |
| Total | 415 (100.0%) | 1,395 (100.0%) |
Housing Structure by Heating Type in Warminster Heights
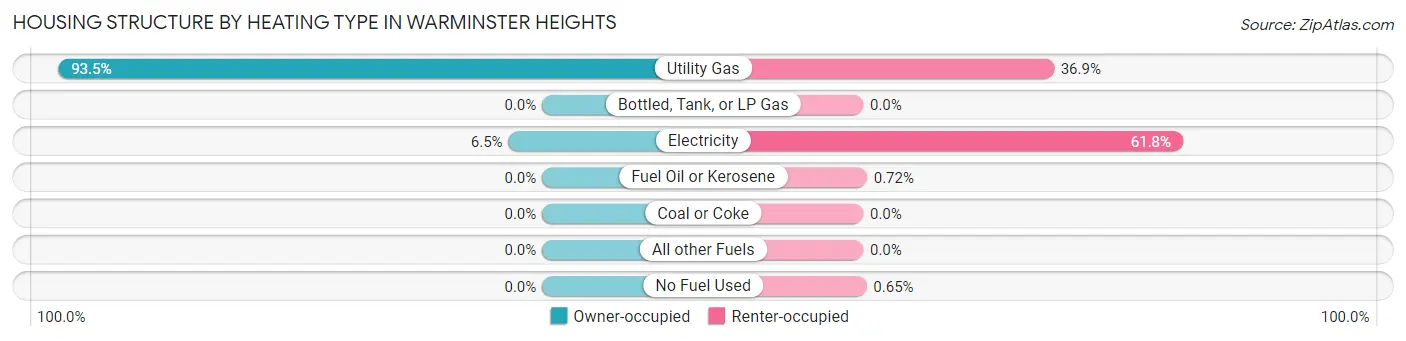
| Heating Type | Owner-occupied | Renter-occupied |
| Utility Gas | 388 (93.5%) | 514 (36.8%) |
| Bottled, Tank, or LP Gas | 0 (0.0%) | 0 (0.0%) |
| Electricity | 27 (6.5%) | 862 (61.8%) |
| Fuel Oil or Kerosene | 0 (0.0%) | 10 (0.7%) |
| Coal or Coke | 0 (0.0%) | 0 (0.0%) |
| All other Fuels | 0 (0.0%) | 0 (0.0%) |
| No Fuel Used | 0 (0.0%) | 9 (0.6%) |
| Total | 415 (100.0%) | 1,395 (100.0%) |
Household Vehicle Usage in Warminster Heights
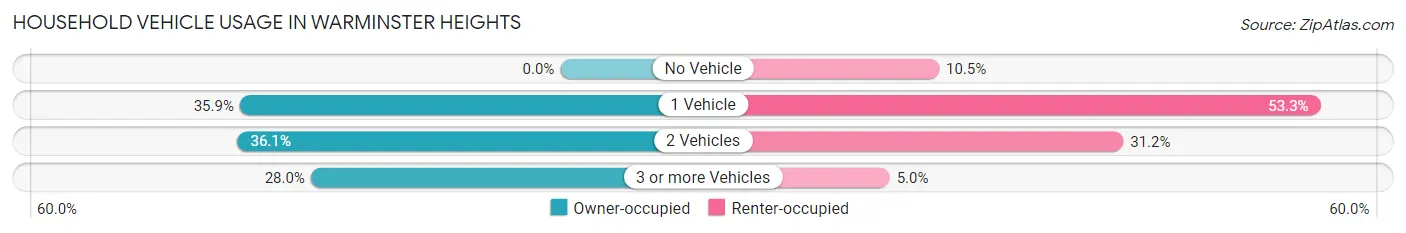
| Vehicles per Household | Owner-occupied | Renter-occupied |
| No Vehicle | 0 (0.0%) | 147 (10.5%) |
| 1 Vehicle | 149 (35.9%) | 743 (53.3%) |
| 2 Vehicles | 150 (36.1%) | 435 (31.2%) |
| 3 or more Vehicles | 116 (28.0%) | 70 (5.0%) |
| Total | 415 (100.0%) | 1,395 (100.0%) |
Real Estate & Mortgages in Warminster Heights
Real Estate and Mortgage Overview in Warminster Heights
| Characteristic | Without Mortgage | With Mortgage |
| Housing Units | 247 | 168 |
| Median Property Value | $336,900 | $343,000 |
| Median Household Income | $59,708 | $86 |
| Monthly Housing Costs | $872 | $0 |
| Real Estate Taxes | $4,709 | $0 |
Property Value by Mortgage Status in Warminster Heights
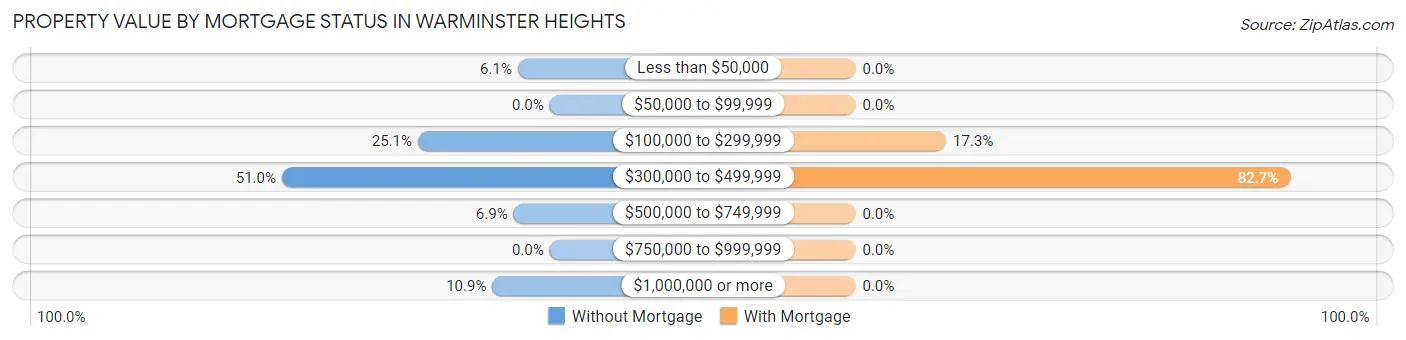
| Property Value | Without Mortgage | With Mortgage |
| Less than $50,000 | 15 (6.1%) | 0 (0.0%) |
| $50,000 to $99,999 | 0 (0.0%) | 0 (0.0%) |
| $100,000 to $299,999 | 62 (25.1%) | 29 (17.3%) |
| $300,000 to $499,999 | 126 (51.0%) | 139 (82.7%) |
| $500,000 to $749,999 | 17 (6.9%) | 0 (0.0%) |
| $750,000 to $999,999 | 0 (0.0%) | 0 (0.0%) |
| $1,000,000 or more | 27 (10.9%) | 0 (0.0%) |
| Total | 247 (100.0%) | 168 (100.0%) |
Household Income by Mortgage Status in Warminster Heights
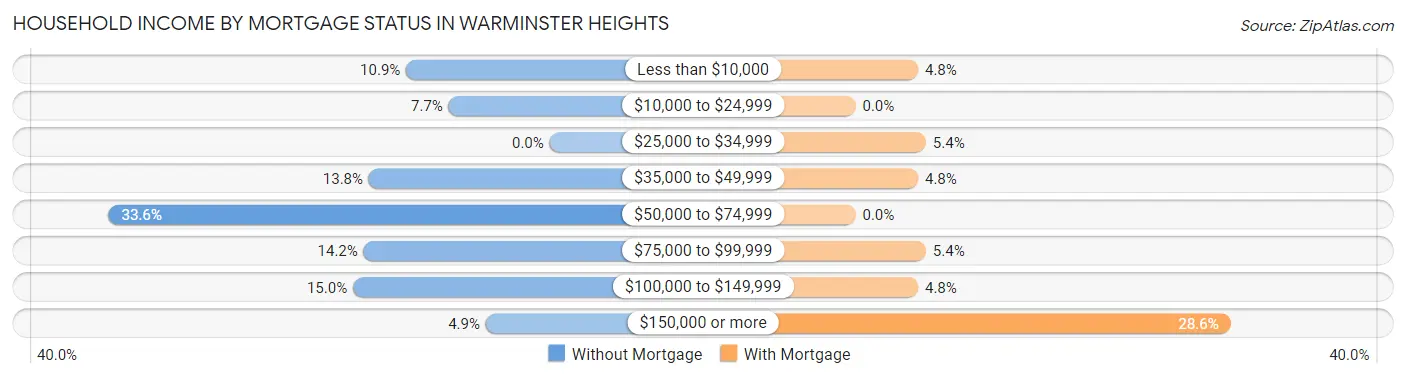
| Household Income | Without Mortgage | With Mortgage |
| Less than $10,000 | 27 (10.9%) | 8 (4.8%) |
| $10,000 to $24,999 | 19 (7.7%) | 0 (0.0%) |
| $25,000 to $34,999 | 0 (0.0%) | 9 (5.4%) |
| $35,000 to $49,999 | 34 (13.8%) | 8 (4.8%) |
| $50,000 to $74,999 | 83 (33.6%) | 0 (0.0%) |
| $75,000 to $99,999 | 35 (14.2%) | 9 (5.4%) |
| $100,000 to $149,999 | 37 (15.0%) | 8 (4.8%) |
| $150,000 or more | 12 (4.9%) | 48 (28.6%) |
| Total | 247 (100.0%) | 168 (100.0%) |
Property Value to Household Income Ratio in Warminster Heights
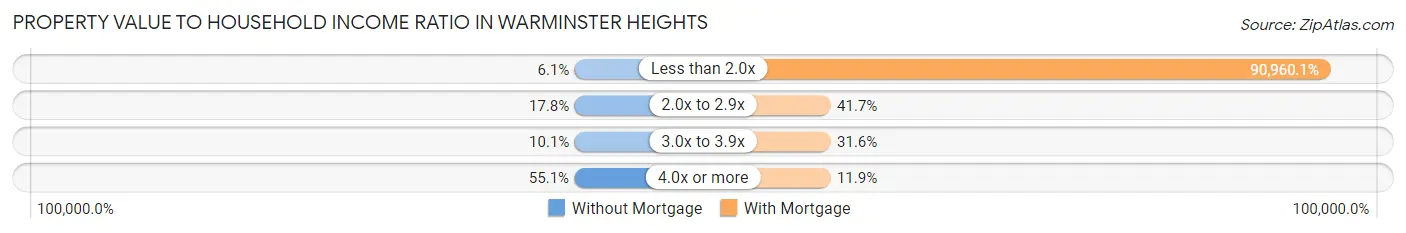
| Value-to-Income Ratio | Without Mortgage | With Mortgage |
| Less than 2.0x | 15 (6.1%) | 152,813 (90,960.1%) |
| 2.0x to 2.9x | 44 (17.8%) | 70 (41.7%) |
| 3.0x to 3.9x | 25 (10.1%) | 53 (31.6%) |
| 4.0x or more | 136 (55.1%) | 20 (11.9%) |
| Total | 247 (100.0%) | 168 (100.0%) |
Real Estate Taxes by Mortgage Status in Warminster Heights
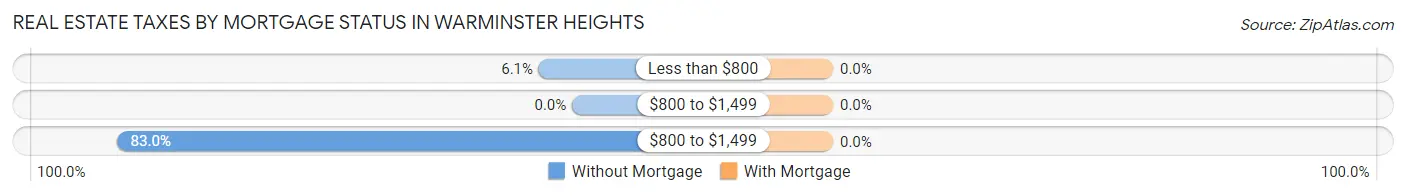
| Property Taxes | Without Mortgage | With Mortgage |
| Less than $800 | 15 (6.1%) | 0 (0.0%) |
| $800 to $1,499 | 0 (0.0%) | 0 (0.0%) |
| $800 to $1,499 | 205 (83.0%) | 0 (0.0%) |
| Total | 247 (100.0%) | 168 (100.0%) |
Health & Disability in Warminster Heights
Health Insurance Coverage by Age in Warminster Heights
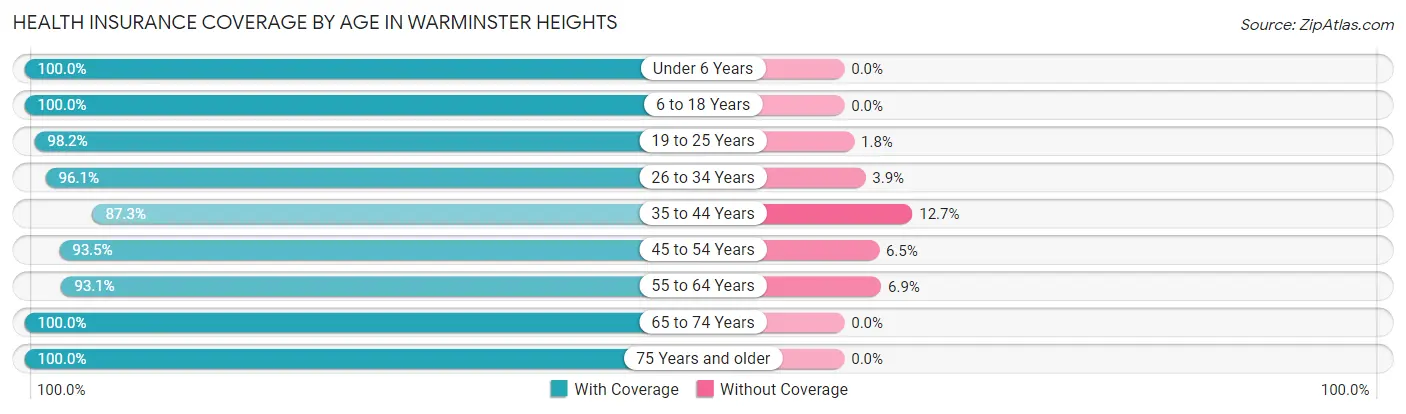
| Age Bracket | With Coverage | Without Coverage |
| Under 6 Years | 322 (100.0%) | 0 (0.0%) |
| 6 to 18 Years | 417 (100.0%) | 0 (0.0%) |
| 19 to 25 Years | 321 (98.2%) | 6 (1.8%) |
| 26 to 34 Years | 586 (96.1%) | 24 (3.9%) |
| 35 to 44 Years | 372 (87.3%) | 54 (12.7%) |
| 45 to 54 Years | 506 (93.5%) | 35 (6.5%) |
| 55 to 64 Years | 557 (93.1%) | 41 (6.9%) |
| 65 to 74 Years | 355 (100.0%) | 0 (0.0%) |
| 75 Years and older | 288 (100.0%) | 0 (0.0%) |
| Total | 3,724 (95.9%) | 160 (4.1%) |
Health Insurance Coverage by Citizenship Status in Warminster Heights
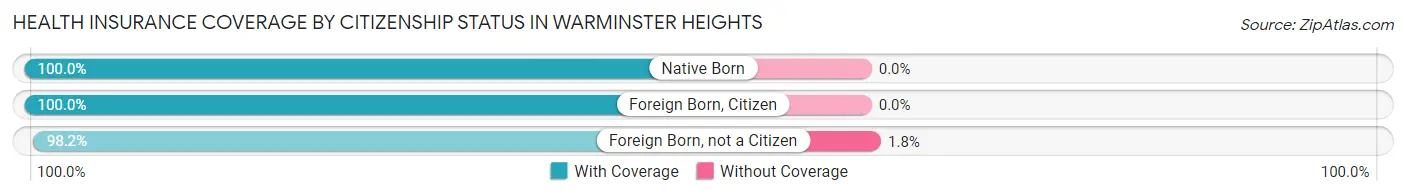
| Citizenship Status | With Coverage | Without Coverage |
| Native Born | 322 (100.0%) | 0 (0.0%) |
| Foreign Born, Citizen | 417 (100.0%) | 0 (0.0%) |
| Foreign Born, not a Citizen | 321 (98.2%) | 6 (1.8%) |
Health Insurance Coverage by Household Income in Warminster Heights
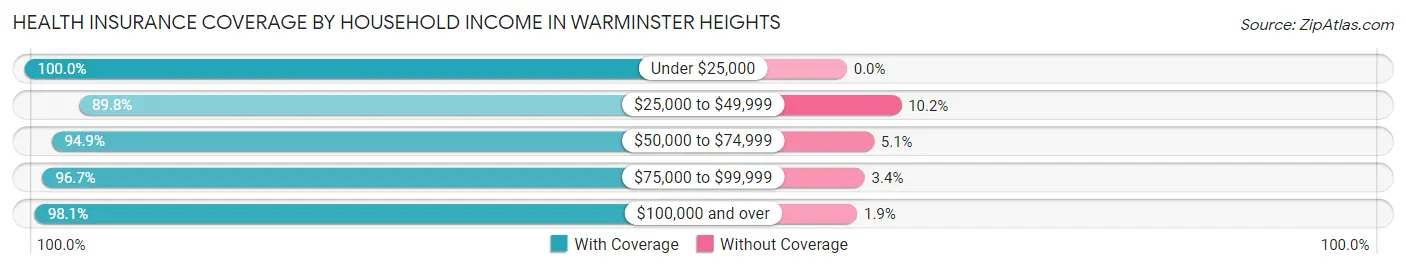
| Household Income | With Coverage | Without Coverage |
| Under $25,000 | 519 (100.0%) | 0 (0.0%) |
| $25,000 to $49,999 | 670 (89.8%) | 76 (10.2%) |
| $50,000 to $74,999 | 787 (94.9%) | 42 (5.1%) |
| $75,000 to $99,999 | 519 (96.7%) | 18 (3.4%) |
| $100,000 and over | 1,229 (98.1%) | 24 (1.9%) |
Public vs Private Health Insurance Coverage by Age in Warminster Heights
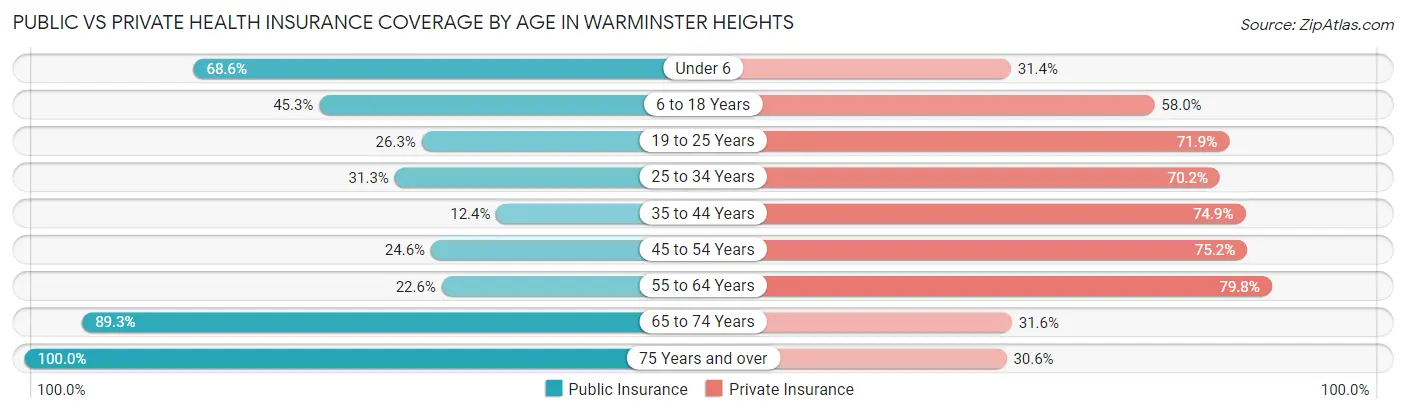
| Age Bracket | Public Insurance | Private Insurance |
| Under 6 | 221 (68.6%) | 101 (31.4%) |
| 6 to 18 Years | 189 (45.3%) | 242 (58.0%) |
| 19 to 25 Years | 86 (26.3%) | 235 (71.9%) |
| 25 to 34 Years | 191 (31.3%) | 428 (70.2%) |
| 35 to 44 Years | 53 (12.4%) | 319 (74.9%) |
| 45 to 54 Years | 133 (24.6%) | 407 (75.2%) |
| 55 to 64 Years | 135 (22.6%) | 477 (79.8%) |
| 65 to 74 Years | 317 (89.3%) | 112 (31.6%) |
| 75 Years and over | 288 (100.0%) | 88 (30.6%) |
| Total | 1,613 (41.5%) | 2,409 (62.0%) |
Disability Status by Sex by Age in Warminster Heights
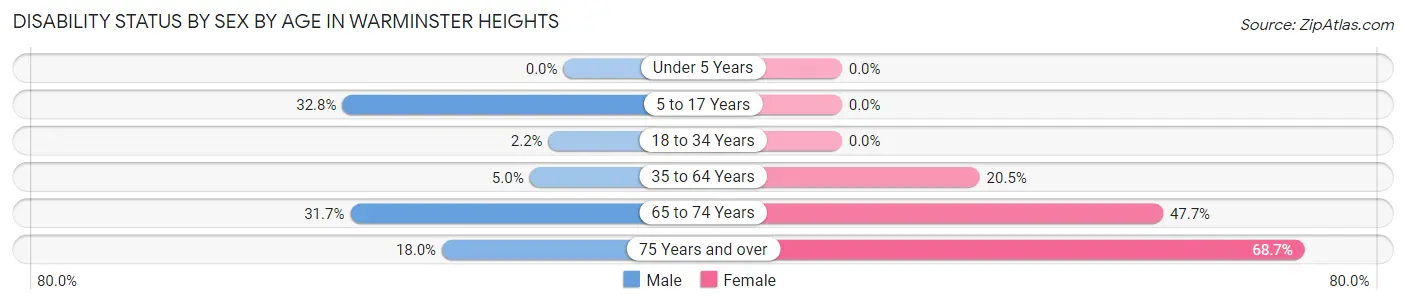
| Age Bracket | Male | Female |
| Under 5 Years | 0 (0.0%) | 0 (0.0%) |
| 5 to 17 Years | 43 (32.8%) | 0 (0.0%) |
| 18 to 34 Years | 9 (2.2%) | 0 (0.0%) |
| 35 to 64 Years | 34 (5.0%) | 182 (20.5%) |
| 65 to 74 Years | 44 (31.7%) | 103 (47.7%) |
| 75 Years and over | 11 (18.0%) | 156 (68.7%) |
Disability Class by Sex by Age in Warminster Heights
Disability Class: Hearing Difficulty
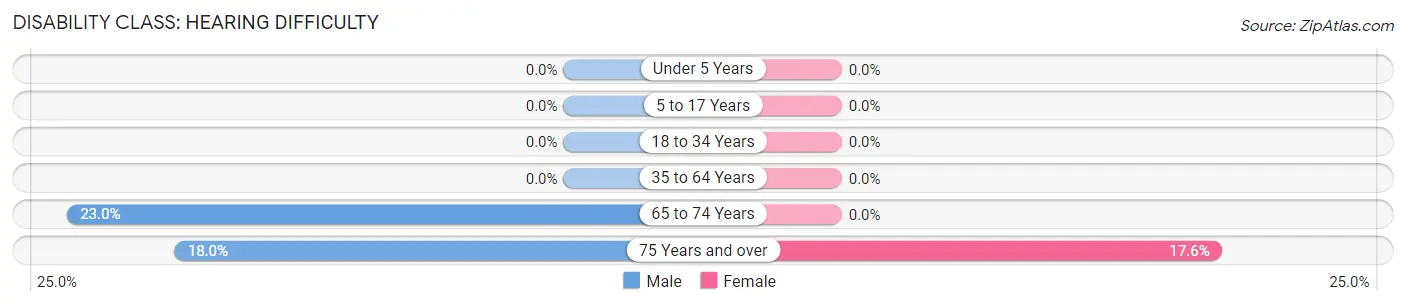
| Age Bracket | Male | Female |
| Under 5 Years | 0 (0.0%) | 0 (0.0%) |
| 5 to 17 Years | 0 (0.0%) | 0 (0.0%) |
| 18 to 34 Years | 0 (0.0%) | 0 (0.0%) |
| 35 to 64 Years | 0 (0.0%) | 0 (0.0%) |
| 65 to 74 Years | 32 (23.0%) | 0 (0.0%) |
| 75 Years and over | 11 (18.0%) | 40 (17.6%) |
Disability Class: Vision Difficulty
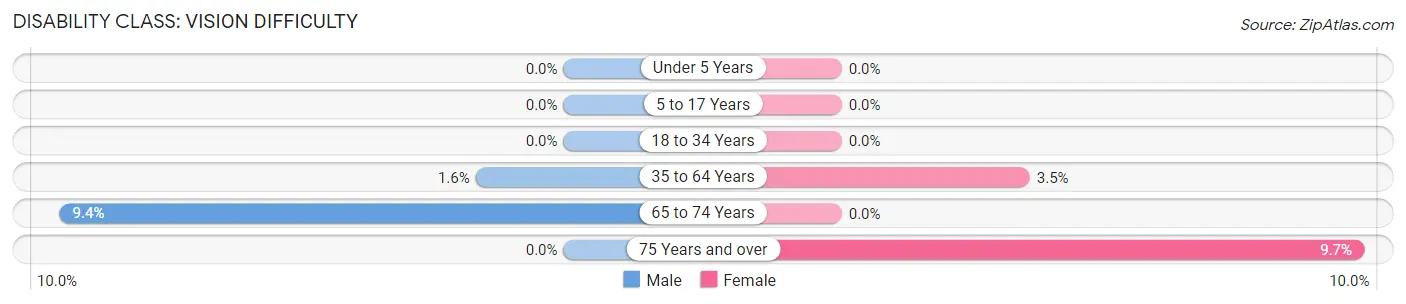
| Age Bracket | Male | Female |
| Under 5 Years | 0 (0.0%) | 0 (0.0%) |
| 5 to 17 Years | 0 (0.0%) | 0 (0.0%) |
| 18 to 34 Years | 0 (0.0%) | 0 (0.0%) |
| 35 to 64 Years | 11 (1.6%) | 31 (3.5%) |
| 65 to 74 Years | 13 (9.3%) | 0 (0.0%) |
| 75 Years and over | 0 (0.0%) | 22 (9.7%) |
Disability Class: Cognitive Difficulty
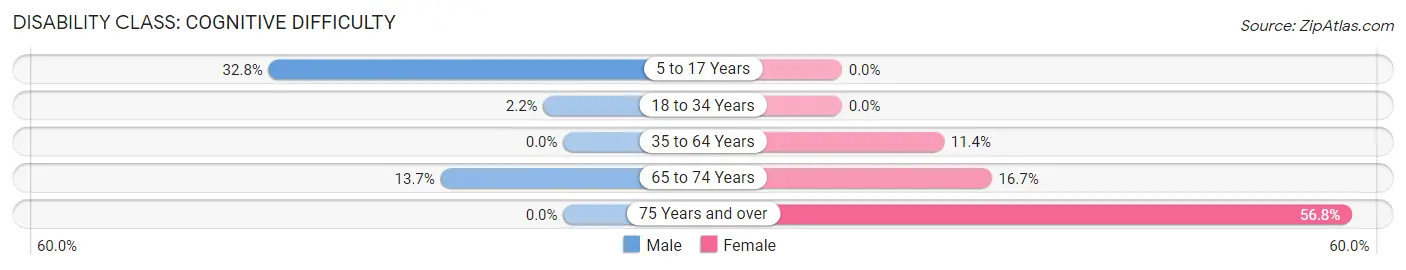
| Age Bracket | Male | Female |
| 5 to 17 Years | 43 (32.8%) | 0 (0.0%) |
| 18 to 34 Years | 9 (2.2%) | 0 (0.0%) |
| 35 to 64 Years | 0 (0.0%) | 101 (11.4%) |
| 65 to 74 Years | 19 (13.7%) | 36 (16.7%) |
| 75 Years and over | 0 (0.0%) | 129 (56.8%) |
Disability Class: Ambulatory Difficulty
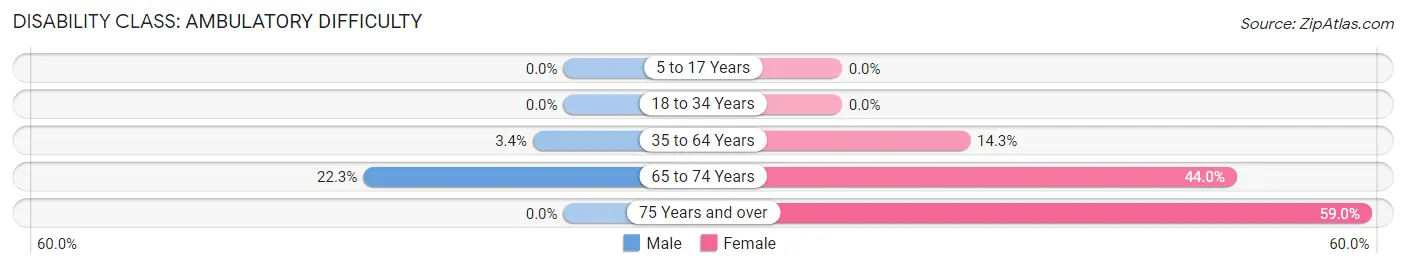
| Age Bracket | Male | Female |
| 5 to 17 Years | 0 (0.0%) | 0 (0.0%) |
| 18 to 34 Years | 0 (0.0%) | 0 (0.0%) |
| 35 to 64 Years | 23 (3.4%) | 127 (14.3%) |
| 65 to 74 Years | 31 (22.3%) | 95 (44.0%) |
| 75 Years and over | 0 (0.0%) | 134 (59.0%) |
Disability Class: Self-Care Difficulty
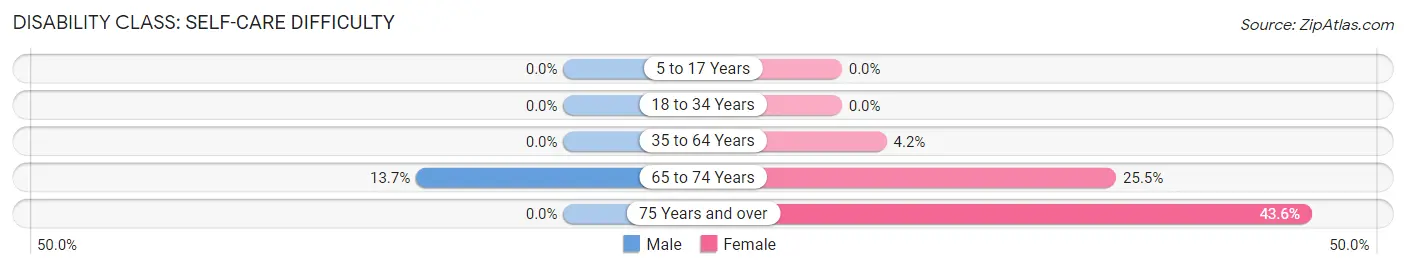
| Age Bracket | Male | Female |
| 5 to 17 Years | 0 (0.0%) | 0 (0.0%) |
| 18 to 34 Years | 0 (0.0%) | 0 (0.0%) |
| 35 to 64 Years | 0 (0.0%) | 37 (4.2%) |
| 65 to 74 Years | 19 (13.7%) | 55 (25.5%) |
| 75 Years and over | 0 (0.0%) | 99 (43.6%) |
Technology Access in Warminster Heights
Computing Device Access in Warminster Heights
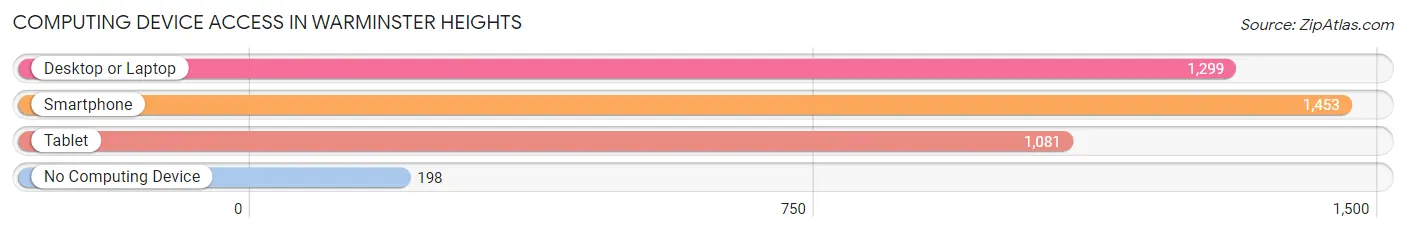
| Device Type | # Households | % Households |
| Desktop or Laptop | 1,299 | 71.8% |
| Smartphone | 1,453 | 80.3% |
| Tablet | 1,081 | 59.7% |
| No Computing Device | 198 | 10.9% |
| Total | 1,810 | 100.0% |
Internet Access in Warminster Heights
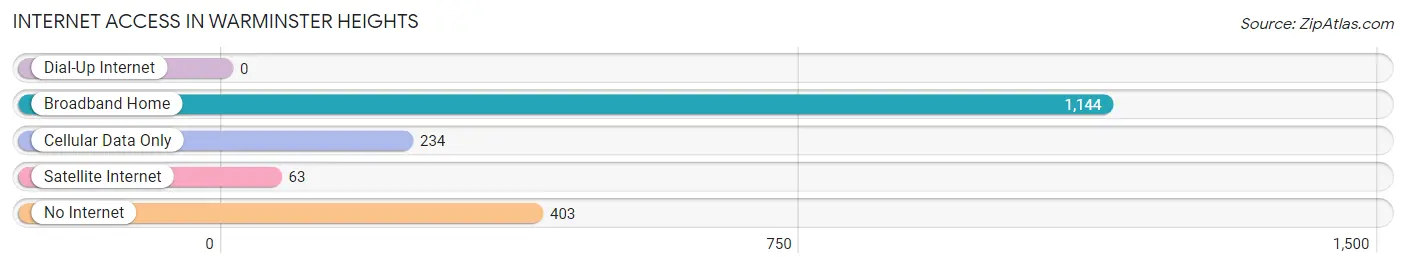
| Internet Type | # Households | % Households |
| Dial-Up Internet | 0 | 0.0% |
| Broadband Home | 1,144 | 63.2% |
| Cellular Data Only | 234 | 12.9% |
| Satellite Internet | 63 | 3.5% |
| No Internet | 403 | 22.3% |
| Total | 1,810 | 100.0% |
Warminster Heights Summary
History
The area now known as Warminster Heights, Pennsylvania was originally inhabited by the Lenape Native Americans. The first European settlers arrived in the area in the late 1600s, and the area was officially established as Warminster Township in 1711. The area was named after Warminster, England, and was originally part of Bucks County. In 1752, Warminster Township was divided into two parts, Warminster Township and Warminster Heights.
The area was primarily agricultural until the late 19th century, when the Pennsylvania Railroad began to expand its lines through the area. This led to an influx of new residents and businesses, and Warminster Heights began to develop into a small suburban community.
In the early 20th century, Warminster Heights experienced a period of rapid growth. The population increased from 1,000 in 1910 to over 5,000 by 1930. This growth was fueled by the expansion of the Pennsylvania Railroad and the development of new industries in the area.
Geography
Warminster Heights is located in Bucks County, Pennsylvania, approximately 25 miles north of Philadelphia. The area is bordered by Warminster Township to the north, Ivyland to the east, Hartsville to the south, and Warrington to the west.
The area is mostly flat, with an elevation of approximately 200 feet above sea level. The area is drained by the Neshaminy Creek, which flows through the center of Warminster Heights.
Economy
The economy of Warminster Heights is largely based on the service industry. The area is home to a variety of retail stores, restaurants, and other businesses. The area is also home to several industrial parks, which provide employment opportunities for local residents.
The area is also home to several large employers, including Lockheed Martin, Siemens, and the United States Postal Service. These employers provide a significant number of jobs for local residents.
Demographics
As of the 2010 census, the population of Warminster Heights was 8,845. The racial makeup of the area was 87.3% White, 6.2% African American, 0.7% Native American, 2.2% Asian, and 3.6% from other races. Hispanic or Latino of any race were 5.3% of the population.
The median household income in Warminster Heights was $63,944, and the median family income was $76,944. The per capita income was $30,944. About 4.3% of families and 5.7% of the population were below the poverty line.
Common Questions
What is Per Capita Income in Warminster Heights?
Per Capita income in Warminster Heights is $35,233.
What is the Median Family Income in Warminster Heights?
Median Family Income in Warminster Heights is $76,161.
What is the Median Household income in Warminster Heights?
Median Household Income in Warminster Heights is $56,429.
What is Income or Wage Gap in Warminster Heights?
Income or Wage Gap in Warminster Heights is 40.1%.
Women in Warminster Heights earn 59.9 cents for every dollar earned by a man.
What is Inequality or Gini Index in Warminster Heights?
Inequality or Gini Index in Warminster Heights is 0.43.
What is the Total Population of Warminster Heights?
Total Population of Warminster Heights is 3,884.
What is the Total Male Population of Warminster Heights?
Total Male Population of Warminster Heights is 1,608.
What is the Total Female Population of Warminster Heights?
Total Female Population of Warminster Heights is 2,276.
What is the Ratio of Males per 100 Females in Warminster Heights?
There are 70.65 Males per 100 Females in Warminster Heights.
What is the Ratio of Females per 100 Males in Warminster Heights?
There are 141.54 Females per 100 Males in Warminster Heights.
What is the Median Population Age in Warminster Heights?
Median Population Age in Warminster Heights is 41.6 Years.
What is the Average Family Size in Warminster Heights
Average Family Size in Warminster Heights is 2.9 People.
What is the Average Household Size in Warminster Heights
Average Household Size in Warminster Heights is 2.1 People.
How Large is the Labor Force in Warminster Heights?
There are 2,360 People in the Labor Forcein in Warminster Heights.
What is the Percentage of People in the Labor Force in Warminster Heights?
72.5% of People are in the Labor Force in Warminster Heights.
What is the Unemployment Rate in Warminster Heights?
Unemployment Rate in Warminster Heights is 1.5%.