Monroeville, PA Map & Demographics
Monroeville Map
Monroeville Overview
$44,110
PER CAPITA INCOME
$98,229
AVG FAMILY INCOME
$80,625
AVG HOUSEHOLD INCOME
18.5%
WAGE / INCOME GAP [ % ]
81.5¢/ $1
WAGE / INCOME GAP [ $ ]
0.41
INEQUALITY / GINI INDEX
28,517
TOTAL POPULATION
13,898
MALE POPULATION
14,619
FEMALE POPULATION
95.07
MALES / 100 FEMALES
105.19
FEMALES / 100 MALES
44.8
MEDIAN AGE
2.9
AVG FAMILY SIZE
2.3
AVG HOUSEHOLD SIZE
15,541
LABOR FORCE [ PEOPLE ]
64.6%
PERCENT IN LABOR FORCE
4.8%
UNEMPLOYMENT RATE
Monroeville Zip Codes
Monroeville Area Codes
Income in Monroeville
Income Overview in Monroeville
Per Capita Income in Monroeville is $44,110, while median incomes of families and households are $98,229 and $80,625 respectively.
| Characteristic | Number | Measure |
| Per Capita Income | 28,517 | $44,110 |
| Median Family Income | 7,667 | $98,229 |
| Mean Family Income | 7,667 | $114,552 |
| Median Household Income | 12,348 | $80,625 |
| Mean Household Income | 12,348 | $97,511 |
| Income Deficit | 7,667 | $0 |
| Wage / Income Gap (%) | 28,517 | 18.47% |
| Wage / Income Gap ($) | 28,517 | 81.53¢ per $1 |
| Gini / Inequality Index | 28,517 | 0.41 |
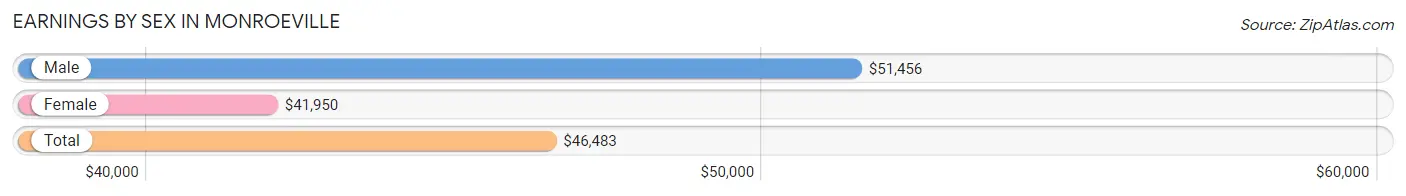
Earnings by Sex in Monroeville
Average Earnings in Monroeville are $46,483, $51,456 for men and $41,950 for women, a difference of 18.5%.
| Sex | Number | Average Earnings |
| Male | 7,885 (49.7%) | $51,456 |
| Female | 7,968 (50.3%) | $41,950 |
| Total | 15,853 (100.0%) | $46,483 |
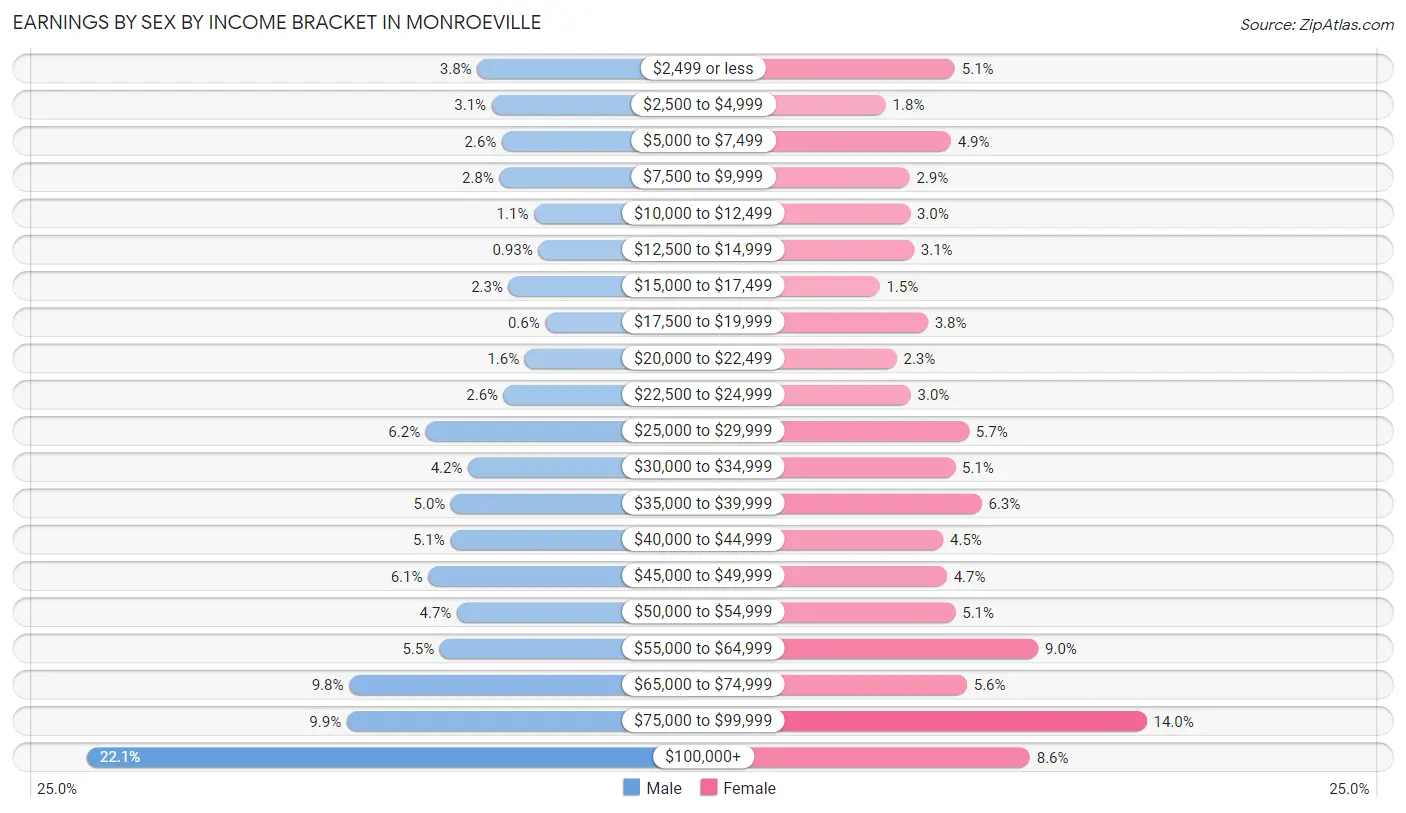
Earnings by Sex by Income Bracket in Monroeville
The most common earnings brackets in Monroeville are $100,000+ for men (1,741 | 22.1%) and $75,000 to $99,999 for women (1,119 | 14.0%).
| Income | Male | Female |
| $2,499 or less | 299 (3.8%) | 403 (5.1%) |
| $2,500 to $4,999 | 245 (3.1%) | 145 (1.8%) |
| $5,000 to $7,499 | 207 (2.6%) | 388 (4.9%) |
| $7,500 to $9,999 | 217 (2.8%) | 234 (2.9%) |
| $10,000 to $12,499 | 89 (1.1%) | 236 (3.0%) |
| $12,500 to $14,999 | 73 (0.9%) | 250 (3.1%) |
| $15,000 to $17,499 | 183 (2.3%) | 122 (1.5%) |
| $17,500 to $19,999 | 47 (0.6%) | 302 (3.8%) |
| $20,000 to $22,499 | 123 (1.6%) | 186 (2.3%) |
| $22,500 to $24,999 | 201 (2.5%) | 238 (3.0%) |
| $25,000 to $29,999 | 489 (6.2%) | 456 (5.7%) |
| $30,000 to $34,999 | 333 (4.2%) | 404 (5.1%) |
| $35,000 to $39,999 | 396 (5.0%) | 503 (6.3%) |
| $40,000 to $44,999 | 398 (5.1%) | 359 (4.5%) |
| $45,000 to $49,999 | 480 (6.1%) | 373 (4.7%) |
| $50,000 to $54,999 | 374 (4.7%) | 405 (5.1%) |
| $55,000 to $64,999 | 437 (5.5%) | 714 (9.0%) |
| $65,000 to $74,999 | 772 (9.8%) | 448 (5.6%) |
| $75,000 to $99,999 | 781 (9.9%) | 1,119 (14.0%) |
| $100,000+ | 1,741 (22.1%) | 683 (8.6%) |
| Total | 7,885 (100.0%) | 7,968 (100.0%) |
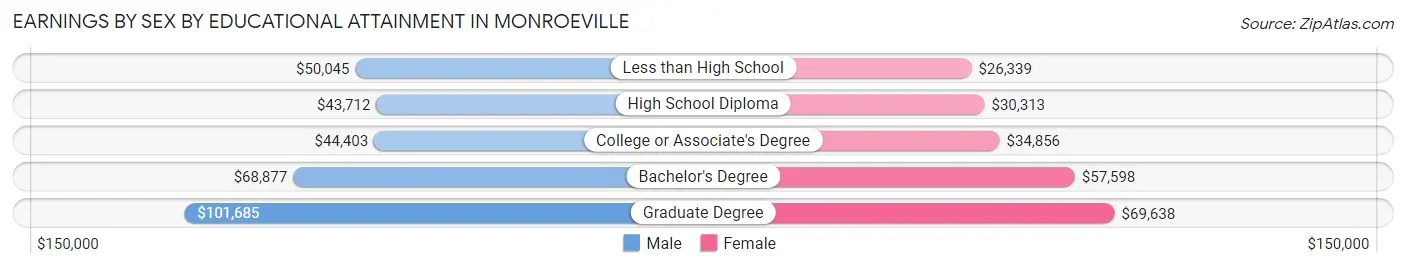
Earnings by Sex by Educational Attainment in Monroeville
Average earnings in Monroeville are $59,327 for men and $46,382 for women, a difference of 21.8%. Men with an educational attainment of graduate degree enjoy the highest average annual earnings of $101,685, while those with high school diploma education earn the least with $43,712. Women with an educational attainment of graduate degree earn the most with the average annual earnings of $69,638, while those with less than high school education have the smallest earnings of $26,339.
| Educational Attainment | Male Income | Female Income |
| Less than High School | $50,045 | $26,339 |
| High School Diploma | $43,712 | $30,313 |
| College or Associate's Degree | $44,403 | $34,856 |
| Bachelor's Degree | $68,877 | $57,598 |
| Graduate Degree | $101,685 | $69,638 |
| Total | $59,327 | $46,382 |
Family Income in Monroeville
Family Income Brackets in Monroeville
According to the Monroeville family income data, there are 2,231 families falling into the $100,000 to $149,999 income range, which is the most common income bracket and makes up 29.1% of all families. Conversely, the less than $10,000 income bracket is the least frequent group with only 92 families (1.2%) belonging to this category.
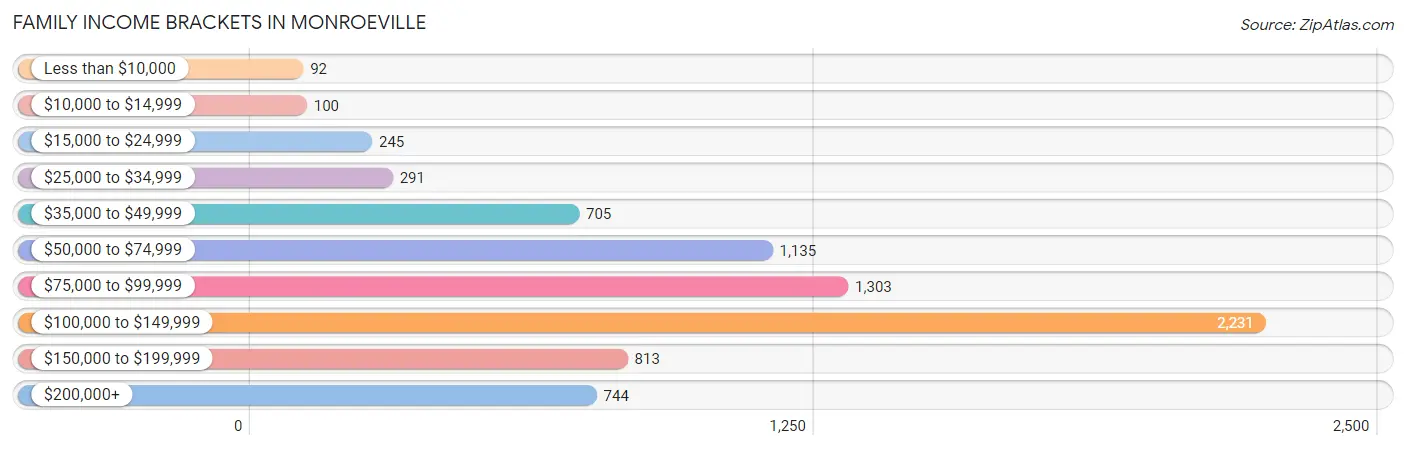
| Income Bracket | # Families | % Families |
| Less than $10,000 | 92 | 1.2% |
| $10,000 to $14,999 | 100 | 1.3% |
| $15,000 to $24,999 | 245 | 3.2% |
| $25,000 to $34,999 | 291 | 3.8% |
| $35,000 to $49,999 | 705 | 9.2% |
| $50,000 to $74,999 | 1,135 | 14.8% |
| $75,000 to $99,999 | 1,303 | 17.0% |
| $100,000 to $149,999 | 2,231 | 29.1% |
| $150,000 to $199,999 | 813 | 10.6% |
| $200,000+ | 744 | 9.7% |
Family Income by Famaliy Size in Monroeville
5-person families (511 | 6.7%) account for the highest median family income in Monroeville with $128,337 per family, while 2-person families (4,181 | 54.5%) have the highest median income of $43,982 per family member.
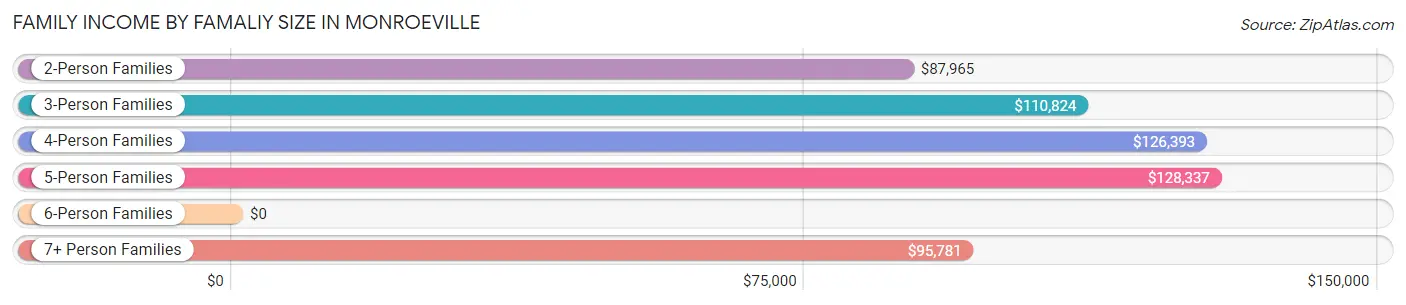
| Income Bracket | # Families | Median Income |
| 2-Person Families | 4,181 (54.5%) | $87,965 |
| 3-Person Families | 1,621 (21.1%) | $110,824 |
| 4-Person Families | 1,211 (15.8%) | $126,393 |
| 5-Person Families | 511 (6.7%) | $128,337 |
| 6-Person Families | 76 (1.0%) | $0 |
| 7+ Person Families | 67 (0.9%) | $95,781 |
| Total | 7,667 (100.0%) | $98,229 |
Family Income by Number of Earners in Monroeville
The median family income in Monroeville is $98,229, with families comprising 3+ earners (756) having the highest median family income of $166,500, while families with no earners (1,147) have the lowest median family income of $59,635, accounting for 9.9% and 15.0% of families, respectively.
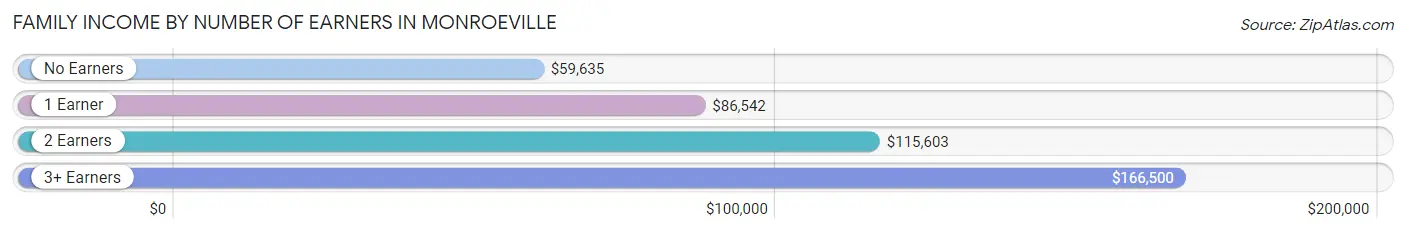
| Number of Earners | # Families | Median Income |
| No Earners | 1,147 (15.0%) | $59,635 |
| 1 Earner | 2,101 (27.4%) | $86,542 |
| 2 Earners | 3,663 (47.8%) | $115,603 |
| 3+ Earners | 756 (9.9%) | $166,500 |
| Total | 7,667 (100.0%) | $98,229 |
Household Income in Monroeville
Household Income Brackets in Monroeville
With 2,951 households falling in the category, the $100,000 to $149,999 income range is the most frequent in Monroeville, accounting for 23.9% of all households. In contrast, only 309 households (2.5%) fall into the less than $10,000 income bracket, making it the least populous group.
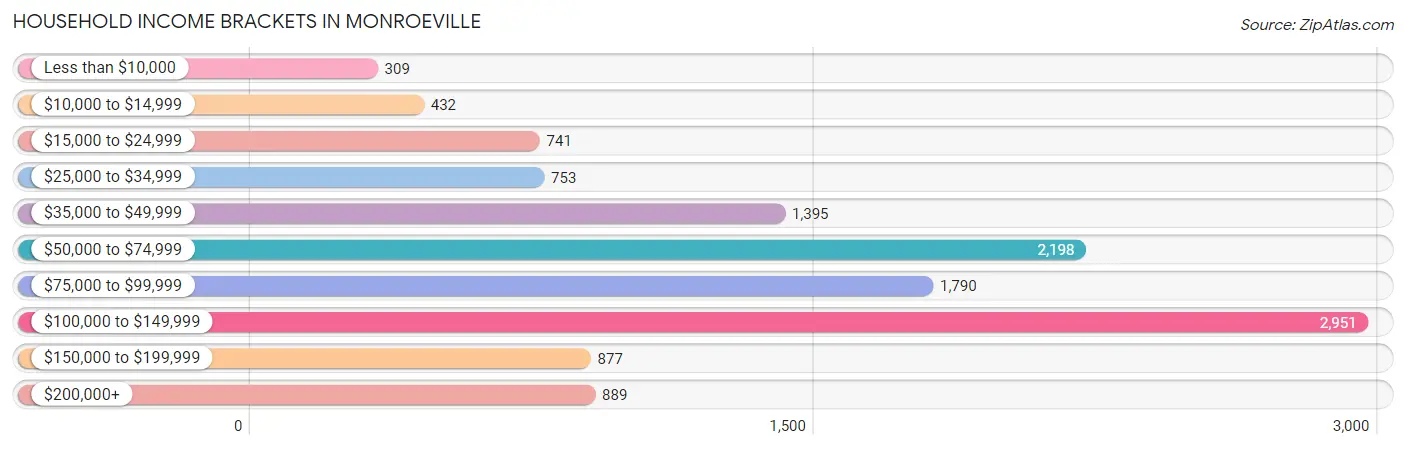
| Income Bracket | # Households | % Households |
| Less than $10,000 | 309 | 2.5% |
| $10,000 to $14,999 | 432 | 3.5% |
| $15,000 to $24,999 | 741 | 6.0% |
| $25,000 to $34,999 | 753 | 6.1% |
| $35,000 to $49,999 | 1,395 | 11.3% |
| $50,000 to $74,999 | 2,198 | 17.8% |
| $75,000 to $99,999 | 1,790 | 14.5% |
| $100,000 to $149,999 | 2,951 | 23.9% |
| $150,000 to $199,999 | 877 | 7.1% |
| $200,000+ | 889 | 7.2% |
Household Income by Householder Age in Monroeville
The median household income in Monroeville is $80,625, with the highest median household income of $102,785 found in the 45 to 64 years age bracket for the primary householder. A total of 4,829 households (39.1%) fall into this category. Meanwhile, the 15 to 24 years age bracket for the primary householder has the lowest median household income of $51,031, with 317 households (2.6%) in this group.
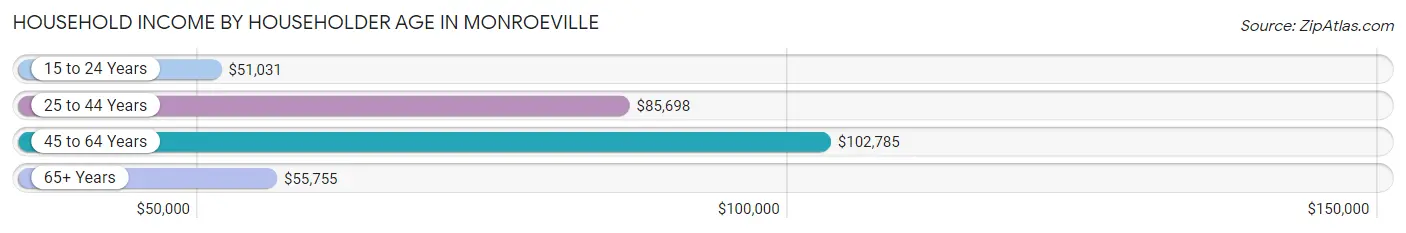
| Income Bracket | # Households | Median Income |
| 15 to 24 Years | 317 (2.6%) | $51,031 |
| 25 to 44 Years | 3,447 (27.9%) | $85,698 |
| 45 to 64 Years | 4,829 (39.1%) | $102,785 |
| 65+ Years | 3,755 (30.4%) | $55,755 |
| Total | 12,348 (100.0%) | $80,625 |
Poverty in Monroeville
Income Below Poverty by Sex and Age in Monroeville
With 6.6% poverty level for males and 9.5% for females among the residents of Monroeville, 16 and 17 year old males and 16 and 17 year old females are the most vulnerable to poverty, with 95 males (26.5%) and 167 females (53.7%) in their respective age groups living below the poverty level.
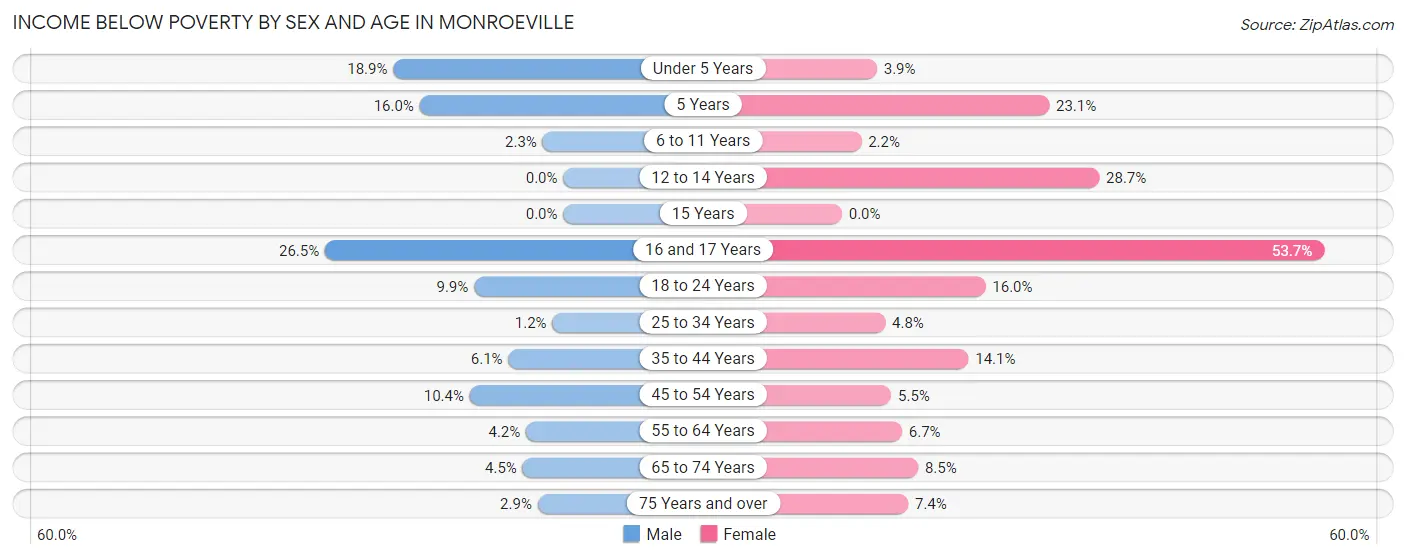
| Age Bracket | Male | Female |
| Under 5 Years | 140 (18.9%) | 31 (3.9%) |
| 5 Years | 24 (16.0%) | 33 (23.1%) |
| 6 to 11 Years | 21 (2.3%) | 15 (2.2%) |
| 12 to 14 Years | 0 (0.0%) | 88 (28.7%) |
| 15 Years | 0 (0.0%) | 0 (0.0%) |
| 16 and 17 Years | 95 (26.5%) | 167 (53.7%) |
| 18 to 24 Years | 114 (9.9%) | 170 (16.0%) |
| 25 to 34 Years | 20 (1.2%) | 81 (4.8%) |
| 35 to 44 Years | 100 (6.1%) | 277 (14.1%) |
| 45 to 54 Years | 203 (10.4%) | 106 (5.5%) |
| 55 to 64 Years | 81 (4.2%) | 142 (6.7%) |
| 65 to 74 Years | 74 (4.5%) | 144 (8.5%) |
| 75 Years and over | 28 (2.9%) | 105 (7.4%) |
| Total | 900 (6.6%) | 1,359 (9.5%) |
Income Above Poverty by Sex and Age in Monroeville
According to the poverty statistics in Monroeville, males aged 12 to 14 years and females aged 15 years are the age groups that are most secure financially, with 100.0% of males and 100.0% of females in these age groups living above the poverty line.
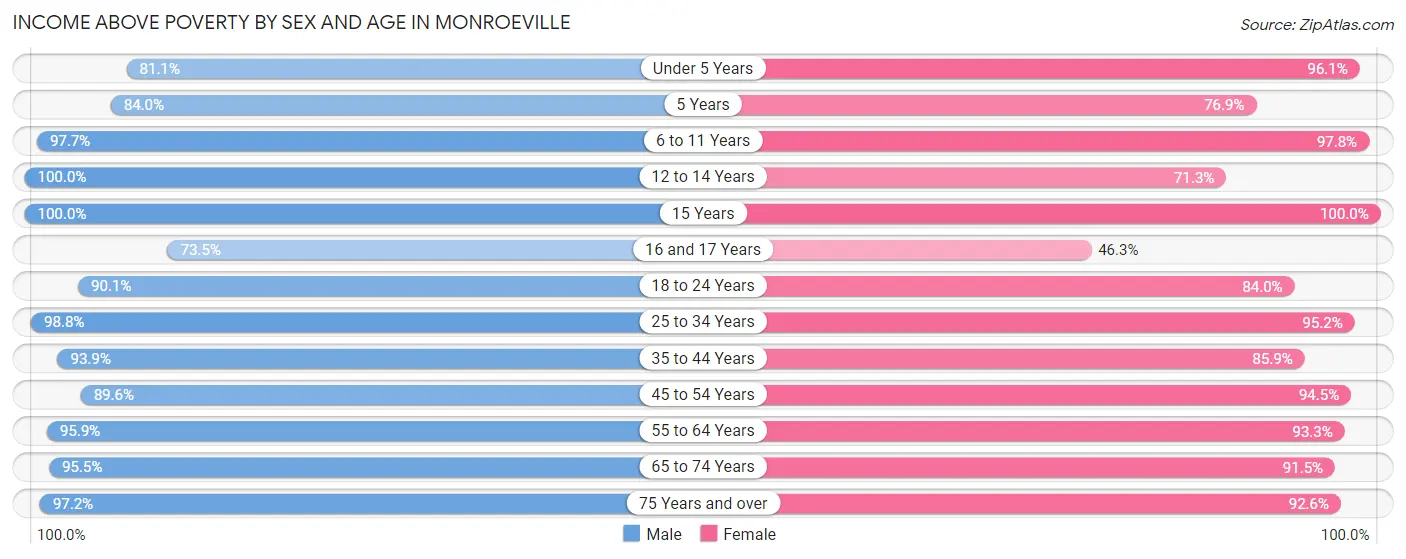
| Age Bracket | Male | Female |
| Under 5 Years | 599 (81.1%) | 763 (96.1%) |
| 5 Years | 126 (84.0%) | 110 (76.9%) |
| 6 to 11 Years | 891 (97.7%) | 681 (97.8%) |
| 12 to 14 Years | 410 (100.0%) | 219 (71.3%) |
| 15 Years | 141 (100.0%) | 107 (100.0%) |
| 16 and 17 Years | 263 (73.5%) | 144 (46.3%) |
| 18 to 24 Years | 1,033 (90.1%) | 893 (84.0%) |
| 25 to 34 Years | 1,626 (98.8%) | 1,598 (95.2%) |
| 35 to 44 Years | 1,533 (93.9%) | 1,689 (85.9%) |
| 45 to 54 Years | 1,746 (89.6%) | 1,826 (94.5%) |
| 55 to 64 Years | 1,870 (95.9%) | 1,981 (93.3%) |
| 65 to 74 Years | 1,560 (95.5%) | 1,555 (91.5%) |
| 75 Years and over | 955 (97.2%) | 1,317 (92.6%) |
| Total | 12,753 (93.4%) | 12,883 (90.5%) |
Income Below Poverty Among Married-Couple Families in Monroeville
The poverty statistics for married-couple families in Monroeville show that 3.6% or 212 of the total 5,926 families live below the poverty line. Families with 1 or 2 children have the highest poverty rate of 10.3%, comprising of 165 families. On the other hand, families with 3 or 4 children have the lowest poverty rate of 0.0%, which includes 0 families.
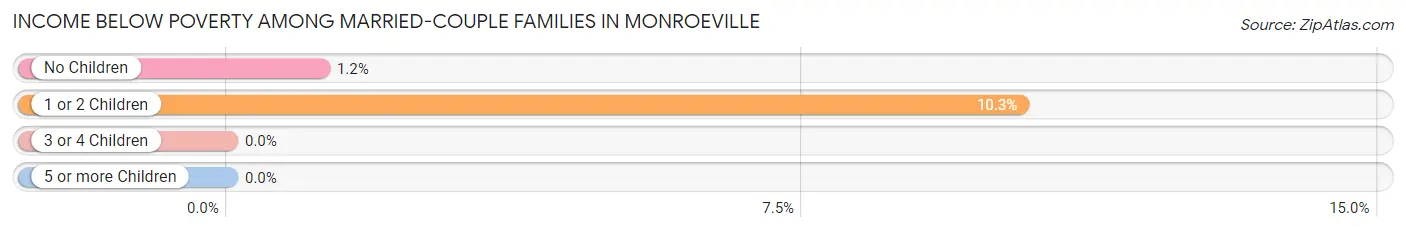
| Children | Above Poverty | Below Poverty |
| No Children | 3,858 (98.8%) | 47 (1.2%) |
| 1 or 2 Children | 1,433 (89.7%) | 165 (10.3%) |
| 3 or 4 Children | 382 (100.0%) | 0 (0.0%) |
| 5 or more Children | 41 (100.0%) | 0 (0.0%) |
| Total | 5,714 (96.4%) | 212 (3.6%) |
Income Below Poverty Among Single-Parent Households in Monroeville
According to the poverty data in Monroeville, 1.0% or 5 single-father households and 15.4% or 192 single-mother households are living below the poverty line. Among single-father households, those with no children have the highest poverty rate, with 5 households (1.5%) experiencing poverty. Likewise, among single-mother households, those with 3 or 4 children have the highest poverty rate, with 57 households (100.0%) falling below the poverty line.
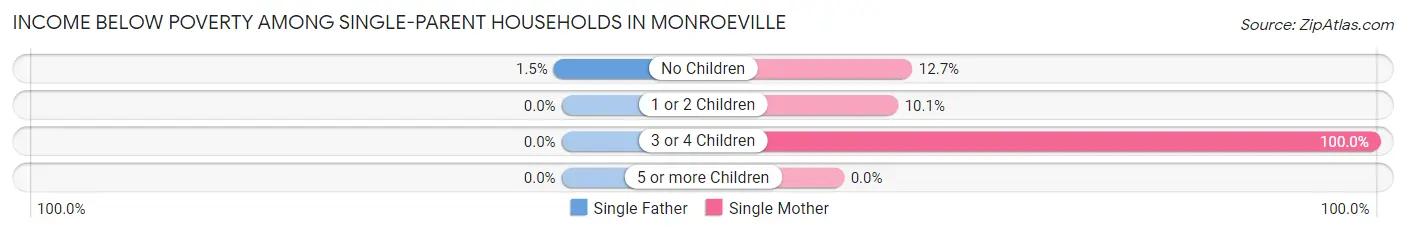
| Children | Single Father | Single Mother |
| No Children | 5 (1.5%) | 75 (12.7%) |
| 1 or 2 Children | 0 (0.0%) | 60 (10.1%) |
| 3 or 4 Children | 0 (0.0%) | 57 (100.0%) |
| 5 or more Children | 0 (0.0%) | 0 (0.0%) |
| Total | 5 (1.0%) | 192 (15.4%) |
Income Below Poverty Among Married-Couple vs Single-Parent Households in Monroeville
The poverty data for Monroeville shows that 212 of the married-couple family households (3.6%) and 197 of the single-parent households (11.3%) are living below the poverty level. Within the married-couple family households, those with 1 or 2 children have the highest poverty rate, with 165 households (10.3%) falling below the poverty line. Among the single-parent households, those with 3 or 4 children have the highest poverty rate, with 57 household (81.4%) living below poverty.
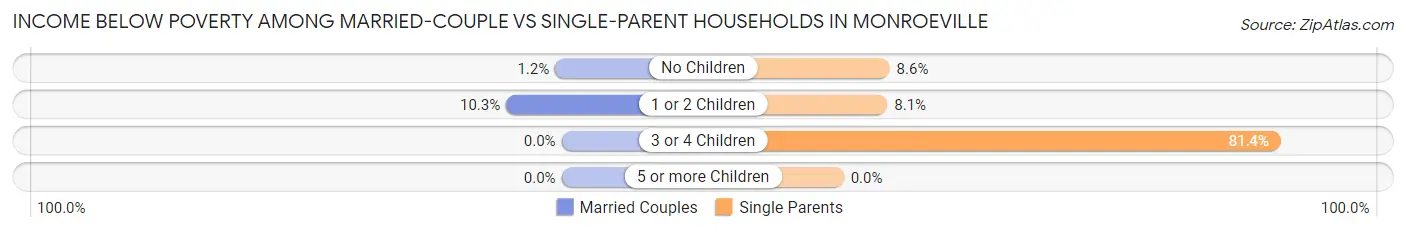
| Children | Married-Couple Families | Single-Parent Households |
| No Children | 47 (1.2%) | 80 (8.6%) |
| 1 or 2 Children | 165 (10.3%) | 60 (8.1%) |
| 3 or 4 Children | 0 (0.0%) | 57 (81.4%) |
| 5 or more Children | 0 (0.0%) | 0 (0.0%) |
| Total | 212 (3.6%) | 197 (11.3%) |
Race in Monroeville
The most populous races in Monroeville are White / Caucasian (20,607 | 72.3%), Black / African American (3,829 | 13.4%), and Asian (1,920 | 6.7%).
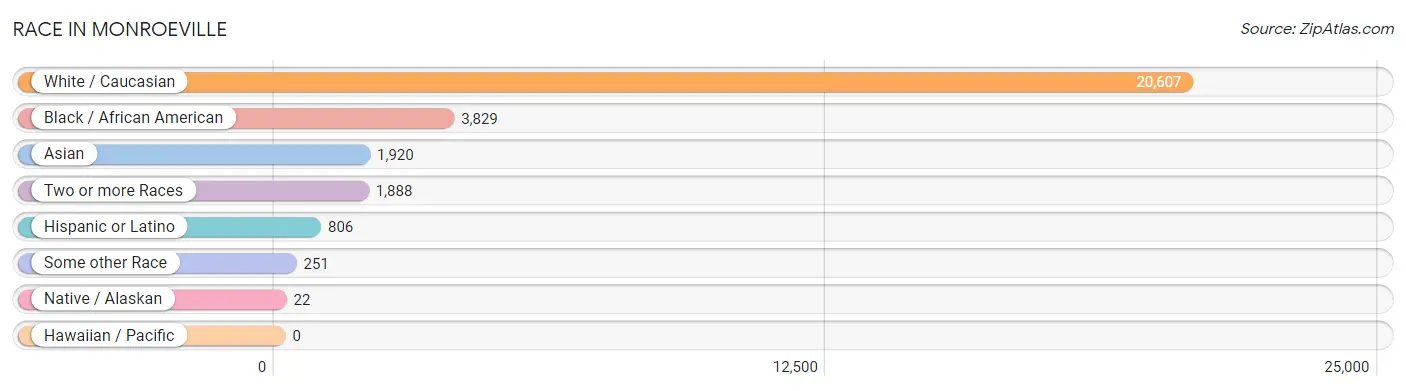
| Race | # Population | % Population |
| Asian | 1,920 | 6.7% |
| Black / African American | 3,829 | 13.4% |
| Hawaiian / Pacific | 0 | 0.0% |
| Hispanic or Latino | 806 | 2.8% |
| Native / Alaskan | 22 | 0.1% |
| White / Caucasian | 20,607 | 72.3% |
| Two or more Races | 1,888 | 6.6% |
| Some other Race | 251 | 0.9% |
| Total | 28,517 | 100.0% |
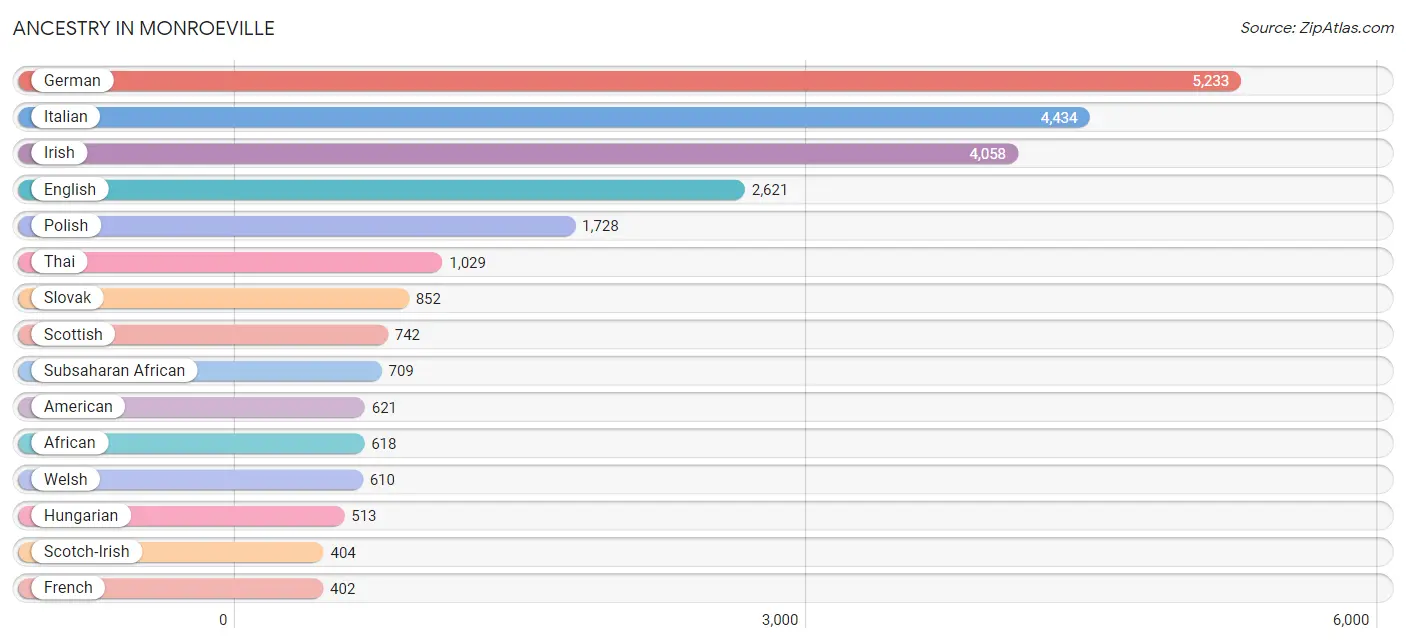
Ancestry in Monroeville
The most populous ancestries reported in Monroeville are German (5,233 | 18.3%), Italian (4,434 | 15.5%), Irish (4,058 | 14.2%), English (2,621 | 9.2%), and Polish (1,728 | 6.1%), together accounting for 63.4% of all Monroeville residents.
| Ancestry | # Population | % Population |
| African | 618 | 2.2% |
| American | 621 | 2.2% |
| Arab | 309 | 1.1% |
| Armenian | 8 | 0.0% |
| Austrian | 173 | 0.6% |
| Bhutanese | 72 | 0.3% |
| Blackfeet | 139 | 0.5% |
| British | 56 | 0.2% |
| Burmese | 158 | 0.5% |
| Canadian | 57 | 0.2% |
| Central American | 92 | 0.3% |
| Cherokee | 123 | 0.4% |
| Chilean | 210 | 0.7% |
| Chippewa | 8 | 0.0% |
| Colombian | 80 | 0.3% |
| Croatian | 121 | 0.4% |
| Cuban | 69 | 0.2% |
| Czech | 138 | 0.5% |
| Czechoslovakian | 54 | 0.2% |
| Danish | 20 | 0.1% |
| Dutch | 95 | 0.3% |
| Eastern European | 181 | 0.6% |
| Ecuadorian | 6 | 0.0% |
| English | 2,621 | 9.2% |
| European | 293 | 1.0% |
| Filipino | 12 | 0.0% |
| French | 402 | 1.4% |
| French Canadian | 10 | 0.0% |
| German | 5,233 | 18.3% |
| Greek | 306 | 1.1% |
| Guatemalan | 71 | 0.3% |
| Haitian | 66 | 0.2% |
| Hungarian | 513 | 1.8% |
| Indian (Asian) | 167 | 0.6% |
| Indonesian | 30 | 0.1% |
| Iranian | 30 | 0.1% |
| Irish | 4,058 | 14.2% |
| Iroquois | 6 | 0.0% |
| Italian | 4,434 | 15.5% |
| Jamaican | 159 | 0.6% |
| Korean | 231 | 0.8% |
| Laotian | 23 | 0.1% |
| Latvian | 8 | 0.0% |
| Lebanese | 69 | 0.2% |
| Lithuanian | 47 | 0.2% |
| Mexican | 173 | 0.6% |
| Moroccan | 63 | 0.2% |
| Navajo | 15 | 0.1% |
| Nigerian | 41 | 0.1% |
| Northern European | 28 | 0.1% |
| Norwegian | 48 | 0.2% |
| Pakistani | 16 | 0.1% |
| Paraguayan | 14 | 0.1% |
| Pennsylvania German | 54 | 0.2% |
| Polish | 1,728 | 6.1% |
| Portuguese | 13 | 0.1% |
| Puerto Rican | 63 | 0.2% |
| Romanian | 33 | 0.1% |
| Russian | 401 | 1.4% |
| Salvadoran | 21 | 0.1% |
| Scandinavian | 17 | 0.1% |
| Scotch-Irish | 404 | 1.4% |
| Scottish | 742 | 2.6% |
| Seminole | 12 | 0.0% |
| Serbian | 226 | 0.8% |
| Sierra Leonean | 6 | 0.0% |
| Slavic | 39 | 0.1% |
| Slovak | 852 | 3.0% |
| Slovene | 37 | 0.1% |
| South American | 310 | 1.1% |
| Spanish | 46 | 0.2% |
| Sri Lankan | 89 | 0.3% |
| Subsaharan African | 709 | 2.5% |
| Swedish | 126 | 0.4% |
| Swiss | 115 | 0.4% |
| Syrian | 213 | 0.7% |
| Thai | 1,029 | 3.6% |
| Turkish | 13 | 0.1% |
| Ugandan | 30 | 0.1% |
| Ukrainian | 162 | 0.6% |
| Vietnamese | 21 | 0.1% |
| Welsh | 610 | 2.1% |
| Yugoslavian | 61 | 0.2% | View All 83 Rows |
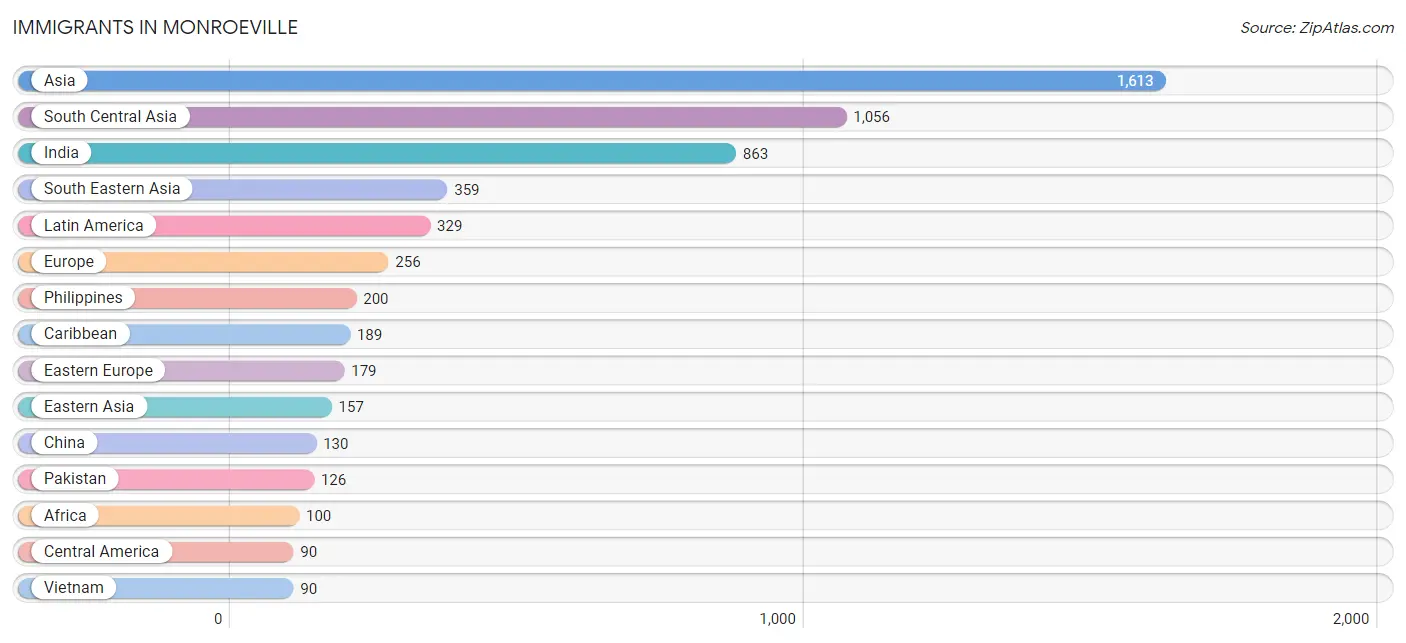
Immigrants in Monroeville
The most numerous immigrant groups reported in Monroeville came from Asia (1,613 | 5.7%), South Central Asia (1,056 | 3.7%), India (863 | 3.0%), South Eastern Asia (359 | 1.3%), and Latin America (329 | 1.1%), together accounting for 14.8% of all Monroeville residents.
| Immigration Origin | # Population | % Population |
| Africa | 100 | 0.4% |
| Asia | 1,613 | 5.7% |
| Bangladesh | 40 | 0.1% |
| Belarus | 42 | 0.2% |
| Bosnia and Herzegovina | 27 | 0.1% |
| Canada | 9 | 0.0% |
| Caribbean | 189 | 0.7% |
| Central America | 90 | 0.3% |
| China | 130 | 0.5% |
| Colombia | 50 | 0.2% |
| Cuba | 69 | 0.2% |
| Czechoslovakia | 15 | 0.1% |
| Eastern Asia | 157 | 0.5% |
| Eastern Europe | 179 | 0.6% |
| Europe | 256 | 0.9% |
| Germany | 49 | 0.2% |
| Guatemala | 41 | 0.1% |
| Haiti | 20 | 0.1% |
| India | 863 | 3.0% |
| Indonesia | 23 | 0.1% |
| Iran | 19 | 0.1% |
| Iraq | 5 | 0.0% |
| Italy | 22 | 0.1% |
| Jamaica | 65 | 0.2% |
| Japan | 13 | 0.1% |
| Jordan | 7 | 0.0% |
| Korea | 14 | 0.1% |
| Latin America | 329 | 1.1% |
| Lebanon | 7 | 0.0% |
| Mexico | 49 | 0.2% |
| Morocco | 43 | 0.2% |
| Nepal | 8 | 0.0% |
| Nigeria | 30 | 0.1% |
| Northern Africa | 43 | 0.2% |
| Northern Europe | 6 | 0.0% |
| Pakistan | 126 | 0.4% |
| Philippines | 200 | 0.7% |
| Russia | 30 | 0.1% |
| Serbia | 46 | 0.2% |
| Sierra Leone | 13 | 0.1% |
| South America | 50 | 0.2% |
| South Central Asia | 1,056 | 3.7% |
| South Eastern Asia | 359 | 1.3% |
| Southern Europe | 22 | 0.1% |
| Syria | 17 | 0.1% |
| Taiwan | 71 | 0.3% |
| Thailand | 16 | 0.1% |
| Trinidad and Tobago | 11 | 0.0% |
| Vietnam | 90 | 0.3% |
| Western Africa | 57 | 0.2% |
| Western Asia | 41 | 0.1% |
| Western Europe | 49 | 0.2% | View All 52 Rows |
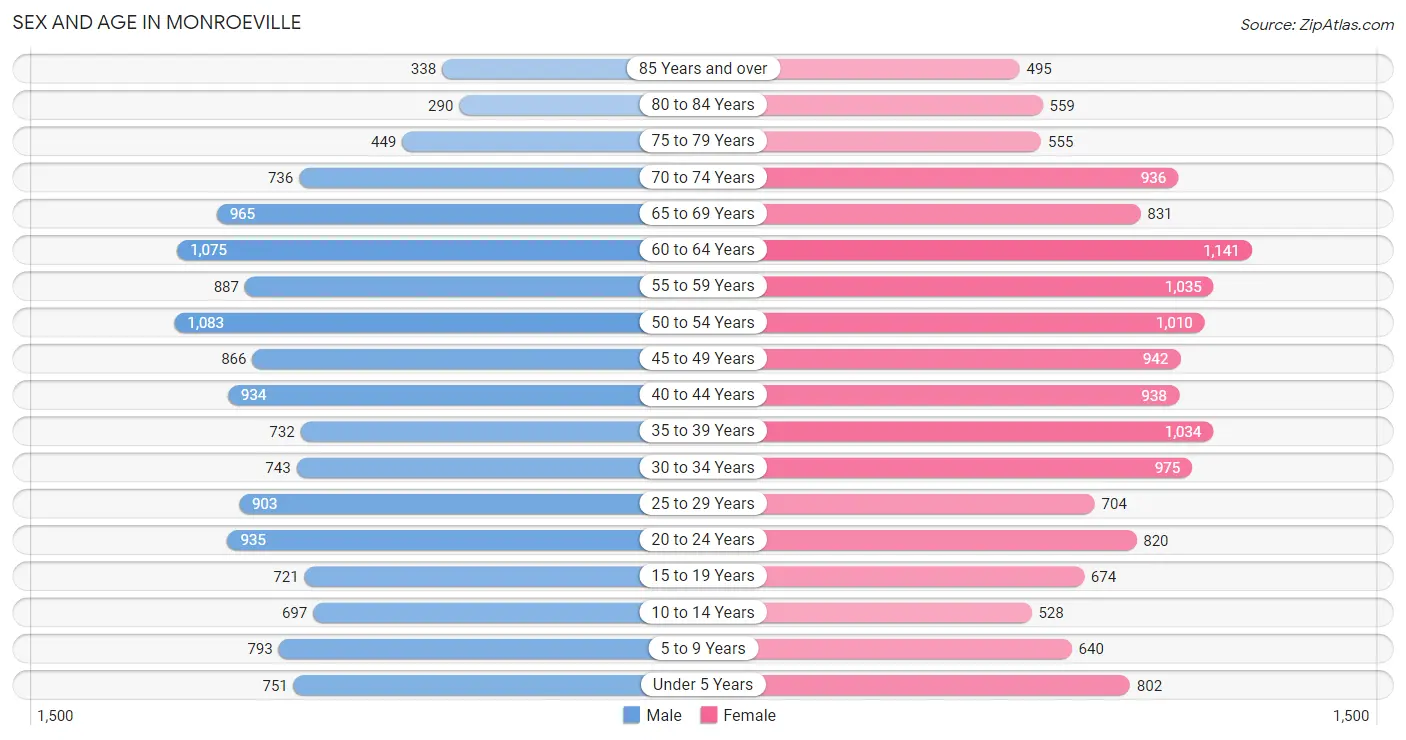
Sex and Age in Monroeville
Sex and Age in Monroeville
The most populous age groups in Monroeville are 50 to 54 Years (1,083 | 7.8%) for men and 60 to 64 Years (1,141 | 7.8%) for women.
| Age Bracket | Male | Female |
| Under 5 Years | 751 (5.4%) | 802 (5.5%) |
| 5 to 9 Years | 793 (5.7%) | 640 (4.4%) |
| 10 to 14 Years | 697 (5.0%) | 528 (3.6%) |
| 15 to 19 Years | 721 (5.2%) | 674 (4.6%) |
| 20 to 24 Years | 935 (6.7%) | 820 (5.6%) |
| 25 to 29 Years | 903 (6.5%) | 704 (4.8%) |
| 30 to 34 Years | 743 (5.3%) | 975 (6.7%) |
| 35 to 39 Years | 732 (5.3%) | 1,034 (7.1%) |
| 40 to 44 Years | 934 (6.7%) | 938 (6.4%) |
| 45 to 49 Years | 866 (6.2%) | 942 (6.4%) |
| 50 to 54 Years | 1,083 (7.8%) | 1,010 (6.9%) |
| 55 to 59 Years | 887 (6.4%) | 1,035 (7.1%) |
| 60 to 64 Years | 1,075 (7.7%) | 1,141 (7.8%) |
| 65 to 69 Years | 965 (6.9%) | 831 (5.7%) |
| 70 to 74 Years | 736 (5.3%) | 936 (6.4%) |
| 75 to 79 Years | 449 (3.2%) | 555 (3.8%) |
| 80 to 84 Years | 290 (2.1%) | 559 (3.8%) |
| 85 Years and over | 338 (2.4%) | 495 (3.4%) |
| Total | 13,898 (100.0%) | 14,619 (100.0%) |
Families and Households in Monroeville
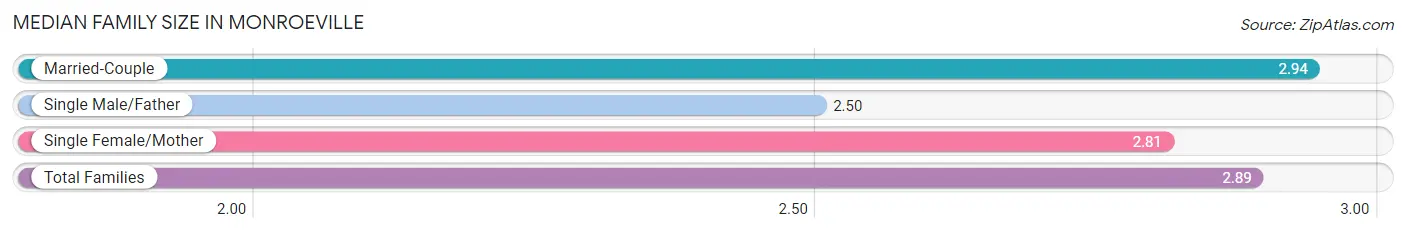
Median Family Size in Monroeville
The median family size in Monroeville is 2.89 persons per family, with married-couple families (5,926 | 77.3%) accounting for the largest median family size of 2.94 persons per family. On the other hand, single male/father families (498 | 6.5%) represent the smallest median family size with 2.50 persons per family.
| Family Type | # Families | Family Size |
| Married-Couple | 5,926 (77.3%) | 2.94 |
| Single Male/Father | 498 (6.5%) | 2.50 |
| Single Female/Mother | 1,243 (16.2%) | 2.81 |
| Total Families | 7,667 (100.0%) | 2.89 |
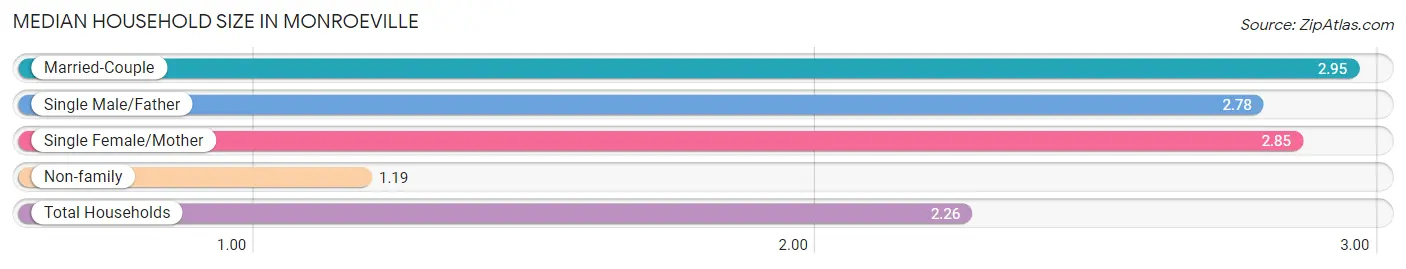
Median Household Size in Monroeville
The median household size in Monroeville is 2.26 persons per household, with married-couple households (5,926 | 48.0%) accounting for the largest median household size of 2.95 persons per household. non-family households (4,681 | 37.9%) represent the smallest median household size with 1.19 persons per household.
| Household Type | # Households | Household Size |
| Married-Couple | 5,926 (48.0%) | 2.95 |
| Single Male/Father | 498 (4.0%) | 2.78 |
| Single Female/Mother | 1,243 (10.1%) | 2.85 |
| Non-family | 4,681 (37.9%) | 1.19 |
| Total Households | 12,348 (100.0%) | 2.26 |
Household Size by Marriage Status in Monroeville
Out of a total of 12,348 households in Monroeville, 7,667 (62.1%) are family households, while 4,681 (37.9%) are nonfamily households. The most numerous type of family households are 2-person households, comprising 4,090, and the most common type of nonfamily households are 1-person households, comprising 3,982.
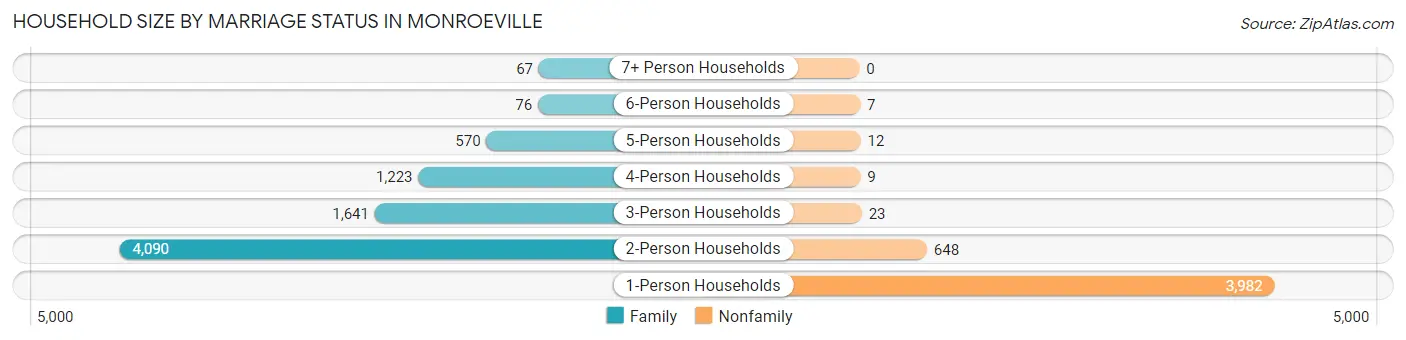
| Household Size | Family Households | Nonfamily Households |
| 1-Person Households | - | 3,982 (32.3%) |
| 2-Person Households | 4,090 (33.1%) | 648 (5.2%) |
| 3-Person Households | 1,641 (13.3%) | 23 (0.2%) |
| 4-Person Households | 1,223 (9.9%) | 9 (0.1%) |
| 5-Person Households | 570 (4.6%) | 12 (0.1%) |
| 6-Person Households | 76 (0.6%) | 7 (0.1%) |
| 7+ Person Households | 67 (0.5%) | 0 (0.0%) |
| Total | 7,667 (62.1%) | 4,681 (37.9%) |
Female Fertility in Monroeville
Fertility by Age in Monroeville
Average fertility rate in Monroeville is 44.0 births per 1,000 women. Women in the age bracket of 20 to 34 years have the highest fertility rate with 87.0 births per 1,000 women. Women in the age bracket of 20 to 34 years acount for 77.2% of all women with births.
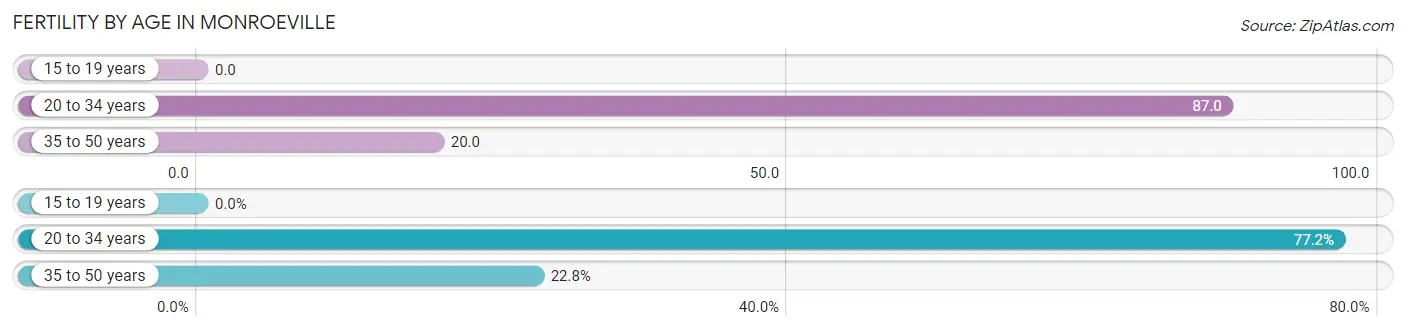
| Age Bracket | Women with Births | Births / 1,000 Women |
| 15 to 19 years | 0 (0.0%) | 0.0 |
| 20 to 34 years | 217 (77.2%) | 87.0 |
| 35 to 50 years | 64 (22.8%) | 20.0 |
| Total | 281 (100.0%) | 44.0 |
Fertility by Age by Marriage Status in Monroeville
83.6% of women with births (281) in Monroeville are married. The highest percentage of unmarried women with births falls into 20 to 34 years age bracket with 21.2% of them unmarried at the time of birth, while the lowest percentage of unmarried women with births belong to 35 to 50 years age bracket with 0.0% of them unmarried.
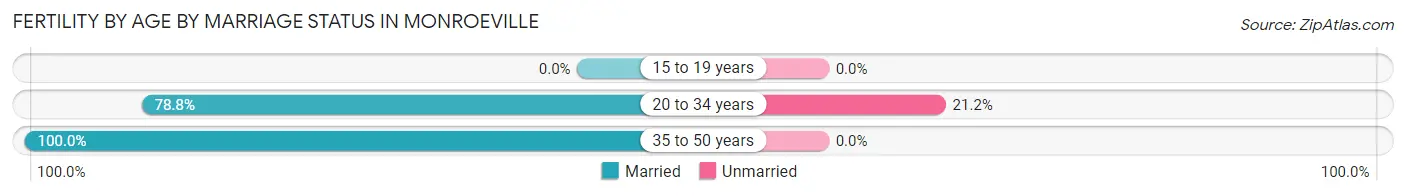
| Age Bracket | Married | Unmarried |
| 15 to 19 years | 0 (0.0%) | 0 (0.0%) |
| 20 to 34 years | 171 (78.8%) | 46 (21.2%) |
| 35 to 50 years | 64 (100.0%) | 0 (0.0%) |
| Total | 235 (83.6%) | 46 (16.4%) |
Fertility by Education in Monroeville
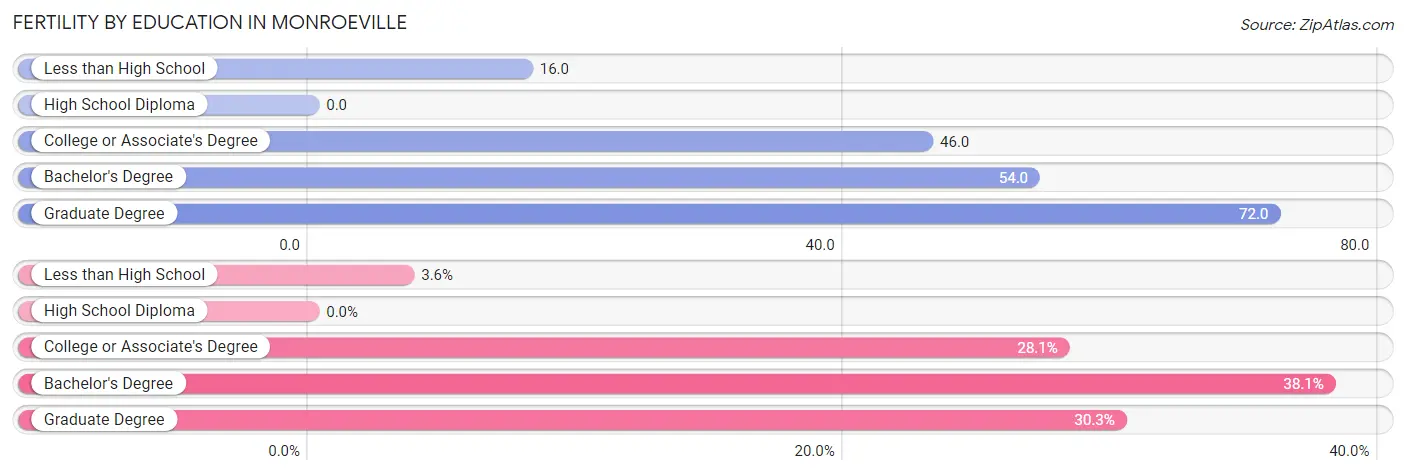
| Educational Attainment | Women with Births | Births / 1,000 Women |
| Less than High School | 10 (3.6%) | 16.0 |
| High School Diploma | 0 (0.0%) | 0.0 |
| College or Associate's Degree | 79 (28.1%) | 46.0 |
| Bachelor's Degree | 107 (38.1%) | 54.0 |
| Graduate Degree | 85 (30.2%) | 72.0 |
| Total | 281 (100.0%) | 44.0 |
Fertility by Education by Marriage Status in Monroeville
16.4% of women with births in Monroeville are unmarried. Women with the educational attainment of less than high school are most likely to be married with 100.0% of them married at childbirth, while women with the educational attainment of college or associate's degree are least likely to be married with 34.2% of them unmarried at childbirth.
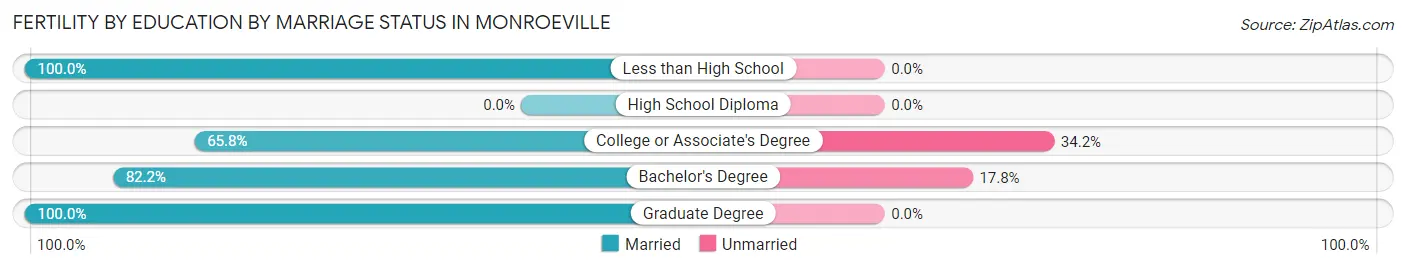
| Educational Attainment | Married | Unmarried |
| Less than High School | 10 (100.0%) | 0 (0.0%) |
| High School Diploma | 0 (0.0%) | 0 (0.0%) |
| College or Associate's Degree | 52 (65.8%) | 27 (34.2%) |
| Bachelor's Degree | 88 (82.2%) | 19 (17.8%) |
| Graduate Degree | 85 (100.0%) | 0 (0.0%) |
| Total | 235 (83.6%) | 46 (16.4%) |
Employment Characteristics in Monroeville
Employment by Class of Employer in Monroeville
Among the 14,397 employed individuals in Monroeville, private company employees (9,244 | 64.2%), not-for-profit organizations (2,297 | 16.0%), and local government employees (1,116 | 7.7%) make up the most common classes of employment.
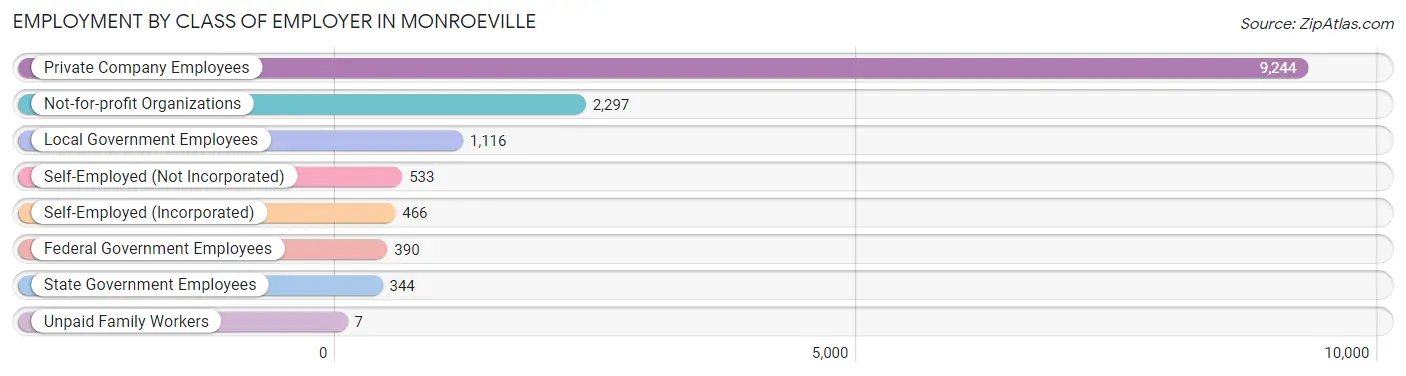
| Employer Class | # Employees | % Employees |
| Private Company Employees | 9,244 | 64.2% |
| Self-Employed (Incorporated) | 466 | 3.2% |
| Self-Employed (Not Incorporated) | 533 | 3.7% |
| Not-for-profit Organizations | 2,297 | 16.0% |
| Local Government Employees | 1,116 | 7.7% |
| State Government Employees | 344 | 2.4% |
| Federal Government Employees | 390 | 2.7% |
| Unpaid Family Workers | 7 | 0.1% |
| Total | 14,397 | 100.0% |
Employment Status by Age in Monroeville
According to the labor force statistics for Monroeville, out of the total population over 16 years of age (24,058), 64.6% or 15,541 individuals are in the labor force, with 4.8% or 746 of them unemployed. The age group with the highest labor force participation rate is 30 to 34 years, with 90.6% or 1,557 individuals in the labor force. Within the labor force, the 75 years and over age range has the highest percentage of unemployed individuals, with 27.4% or 52 of them being unemployed.
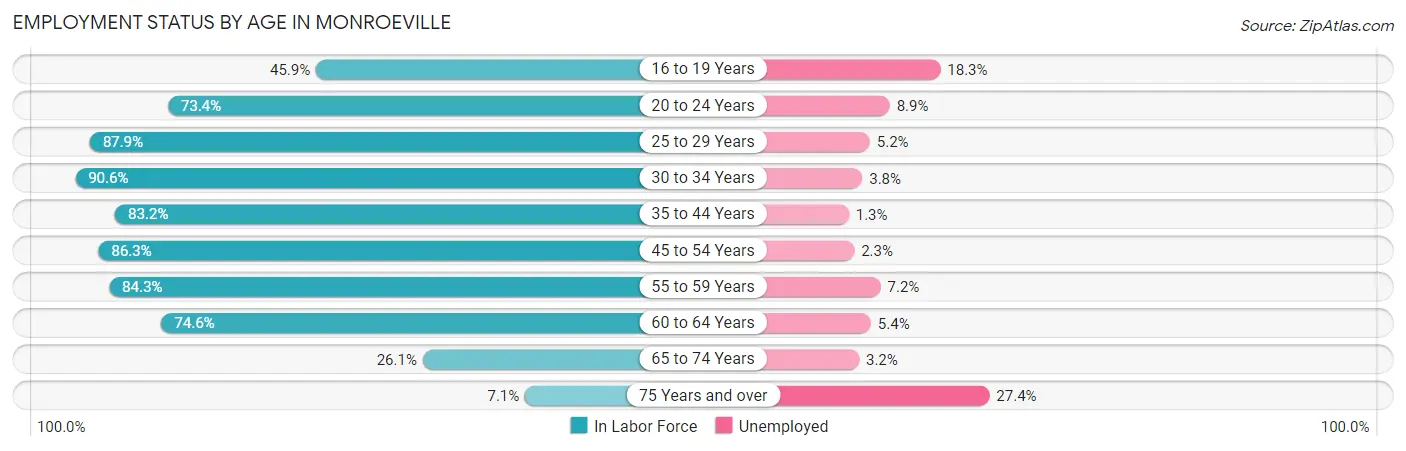
| Age Bracket | In Labor Force | Unemployed |
| 16 to 19 Years | 526 (45.9%) | 96 (18.3%) |
| 20 to 24 Years | 1,288 (73.4%) | 115 (8.9%) |
| 25 to 29 Years | 1,413 (87.9%) | 73 (5.2%) |
| 30 to 34 Years | 1,557 (90.6%) | 59 (3.8%) |
| 35 to 44 Years | 3,027 (83.2%) | 39 (1.3%) |
| 45 to 54 Years | 3,367 (86.3%) | 77 (2.3%) |
| 55 to 59 Years | 1,620 (84.3%) | 117 (7.2%) |
| 60 to 64 Years | 1,653 (74.6%) | 89 (5.4%) |
| 65 to 74 Years | 905 (26.1%) | 29 (3.2%) |
| 75 Years and over | 191 (7.1%) | 52 (27.4%) |
| Total | 15,541 (64.6%) | 746 (4.8%) |
Employment Status by Educational Attainment in Monroeville
According to labor force statistics for Monroeville, 84.2% of individuals (12,632) out of the total population between 25 and 64 years of age (15,002) are in the labor force, with 3.6% or 455 of them being unemployed. The group with the highest labor force participation rate are those with the educational attainment of bachelor's degree or higher, with 89.7% or 6,702 individuals in the labor force. Within the labor force, individuals with less than high school education have the highest percentage of unemployment, with 16.4% or 32 of them being unemployed.
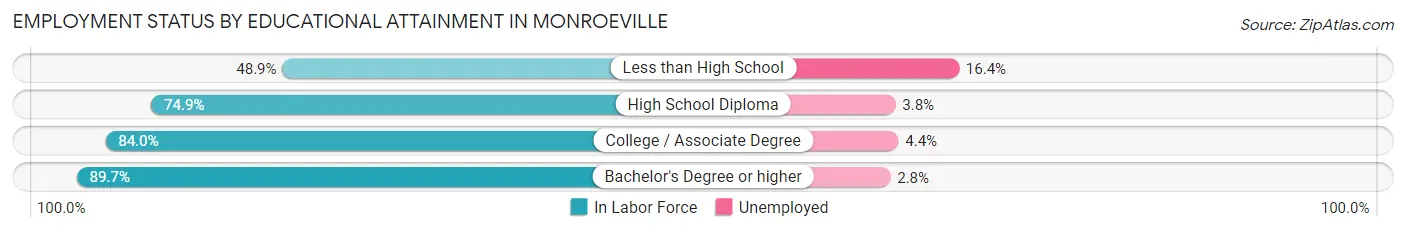
| Educational Attainment | In Labor Force | Unemployed |
| Less than High School | 195 (48.9%) | 65 (16.4%) |
| High School Diploma | 2,102 (74.9%) | 107 (3.8%) |
| College / Associate Degree | 3,633 (84.0%) | 190 (4.4%) |
| Bachelor's Degree or higher | 6,702 (89.7%) | 209 (2.8%) |
| Total | 12,632 (84.2%) | 540 (3.6%) |
Employment Occupations by Sex in Monroeville
Management, Business, Science and Arts Occupations
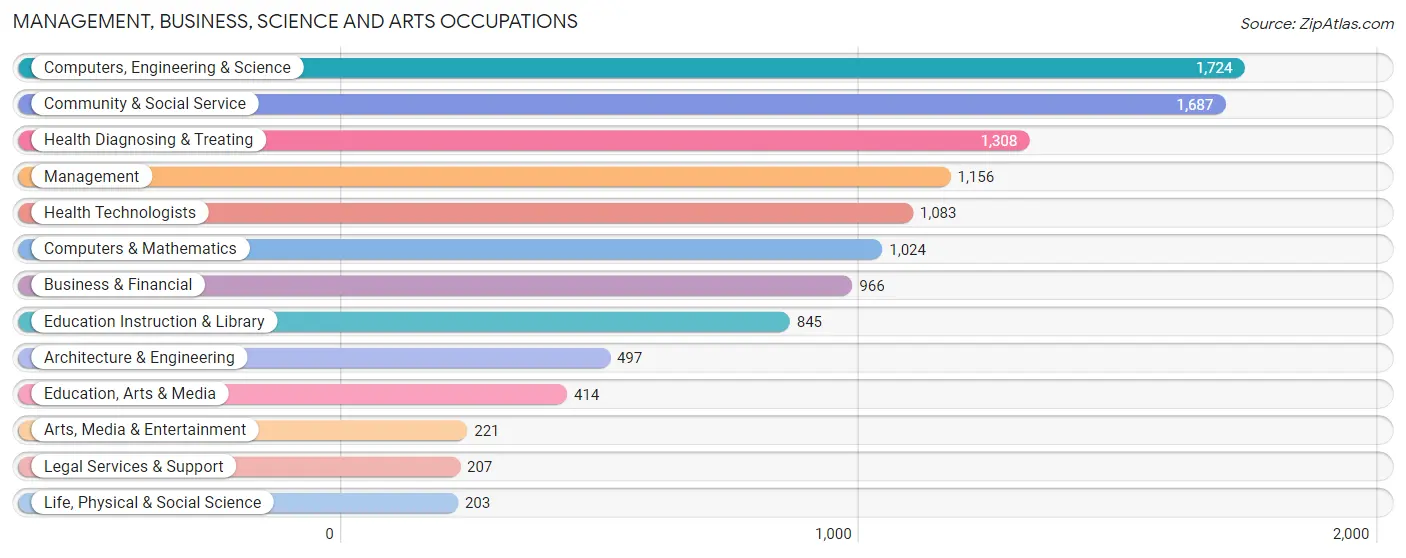
The most common Management, Business, Science and Arts occupations in Monroeville are Computers, Engineering & Science (1,724 | 11.7%), Community & Social Service (1,687 | 11.4%), Health Diagnosing & Treating (1,308 | 8.9%), Management (1,156 | 7.8%), and Health Technologists (1,083 | 7.3%).
Management, Business, Science and Arts Occupations by Sex
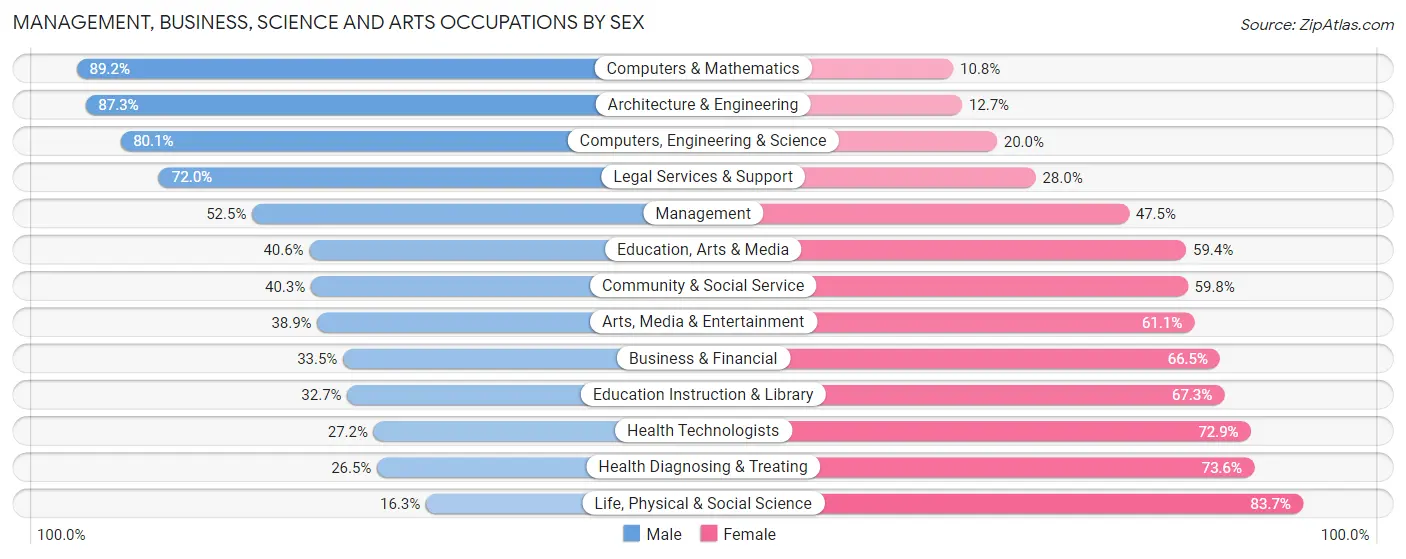
Within the Management, Business, Science and Arts occupations in Monroeville, the most male-oriented occupations are Computers & Mathematics (89.2%), Architecture & Engineering (87.3%), and Computers, Engineering & Science (80.0%), while the most female-oriented occupations are Life, Physical & Social Science (83.7%), Health Diagnosing & Treating (73.6%), and Health Technologists (72.9%).
| Occupation | Male | Female |
| Management | 607 (52.5%) | 549 (47.5%) |
| Business & Financial | 324 (33.5%) | 642 (66.5%) |
| Computers, Engineering & Science | 1,380 (80.0%) | 344 (20.0%) |
| Computers & Mathematics | 913 (89.2%) | 111 (10.8%) |
| Architecture & Engineering | 434 (87.3%) | 63 (12.7%) |
| Life, Physical & Social Science | 33 (16.3%) | 170 (83.7%) |
| Community & Social Service | 679 (40.3%) | 1,008 (59.8%) |
| Education, Arts & Media | 168 (40.6%) | 246 (59.4%) |
| Legal Services & Support | 149 (72.0%) | 58 (28.0%) |
| Education Instruction & Library | 276 (32.7%) | 569 (67.3%) |
| Arts, Media & Entertainment | 86 (38.9%) | 135 (61.1%) |
| Health Diagnosing & Treating | 346 (26.5%) | 962 (73.6%) |
| Health Technologists | 294 (27.2%) | 789 (72.9%) |
| Total (Category) | 3,336 (48.8%) | 3,505 (51.2%) |
| Total (Overall) | 7,301 (49.5%) | 7,461 (50.5%) |
Services Occupations
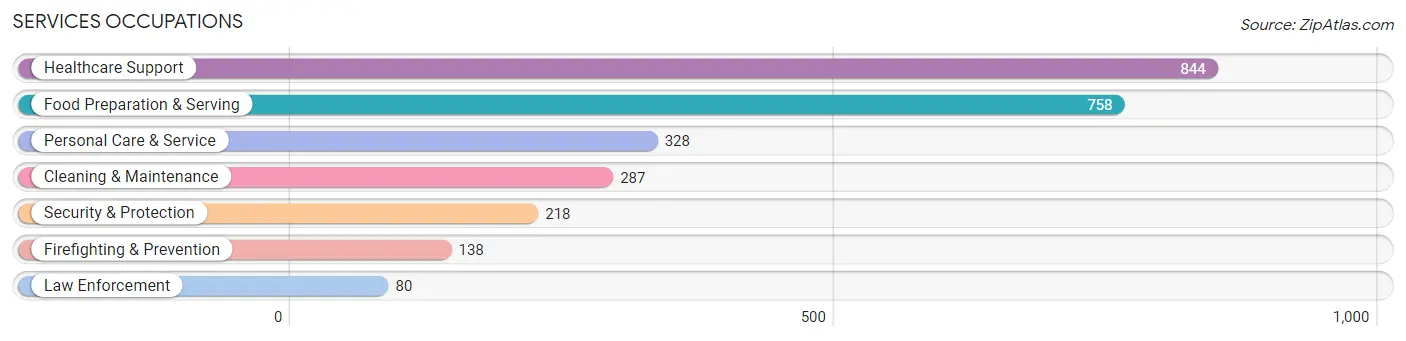
The most common Services occupations in Monroeville are Healthcare Support (844 | 5.7%), Food Preparation & Serving (758 | 5.1%), Personal Care & Service (328 | 2.2%), Cleaning & Maintenance (287 | 1.9%), and Security & Protection (218 | 1.5%).
Services Occupations by Sex
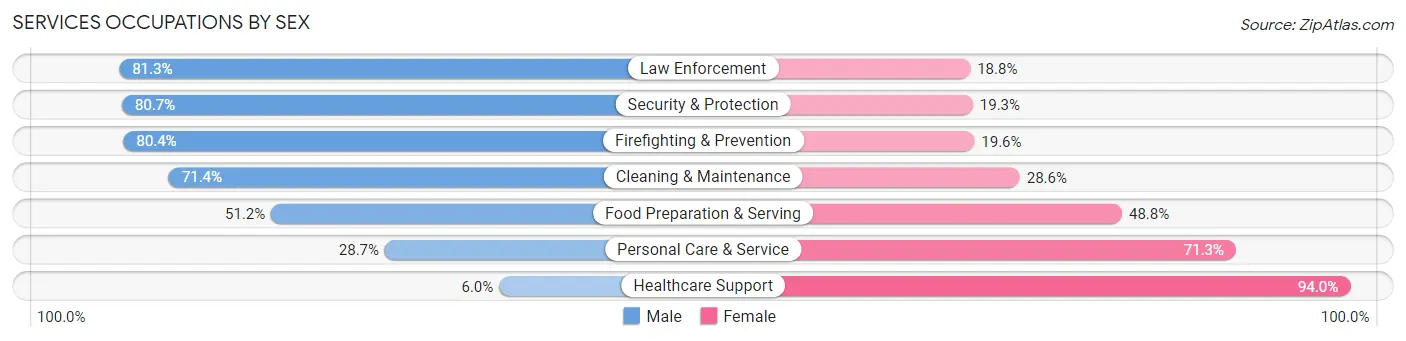
Within the Services occupations in Monroeville, the most male-oriented occupations are Law Enforcement (81.2%), Security & Protection (80.7%), and Firefighting & Prevention (80.4%), while the most female-oriented occupations are Healthcare Support (94.0%), Personal Care & Service (71.3%), and Food Preparation & Serving (48.8%).
| Occupation | Male | Female |
| Healthcare Support | 51 (6.0%) | 793 (94.0%) |
| Security & Protection | 176 (80.7%) | 42 (19.3%) |
| Firefighting & Prevention | 111 (80.4%) | 27 (19.6%) |
| Law Enforcement | 65 (81.2%) | 15 (18.8%) |
| Food Preparation & Serving | 388 (51.2%) | 370 (48.8%) |
| Cleaning & Maintenance | 205 (71.4%) | 82 (28.6%) |
| Personal Care & Service | 94 (28.7%) | 234 (71.3%) |
| Total (Category) | 914 (37.5%) | 1,521 (62.5%) |
| Total (Overall) | 7,301 (49.5%) | 7,461 (50.5%) |
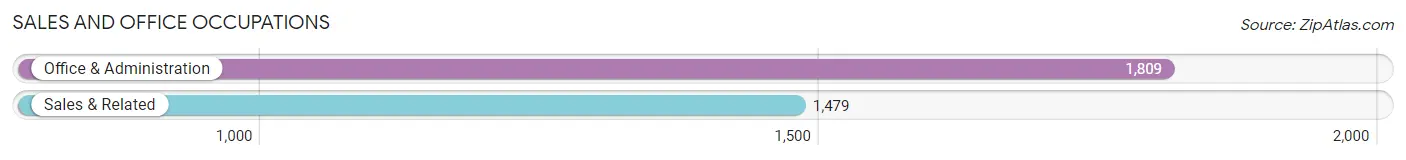
Sales and Office Occupations
The most common Sales and Office occupations in Monroeville are Office & Administration (1,809 | 12.2%), and Sales & Related (1,479 | 10.0%).
Sales and Office Occupations by Sex
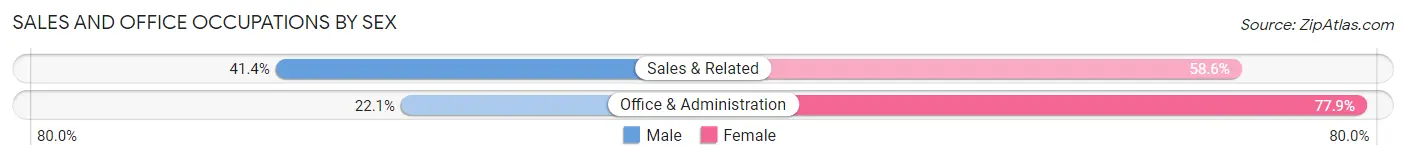
| Occupation | Male | Female |
| Sales & Related | 612 (41.4%) | 867 (58.6%) |
| Office & Administration | 400 (22.1%) | 1,409 (77.9%) |
| Total (Category) | 1,012 (30.8%) | 2,276 (69.2%) |
| Total (Overall) | 7,301 (49.5%) | 7,461 (50.5%) |
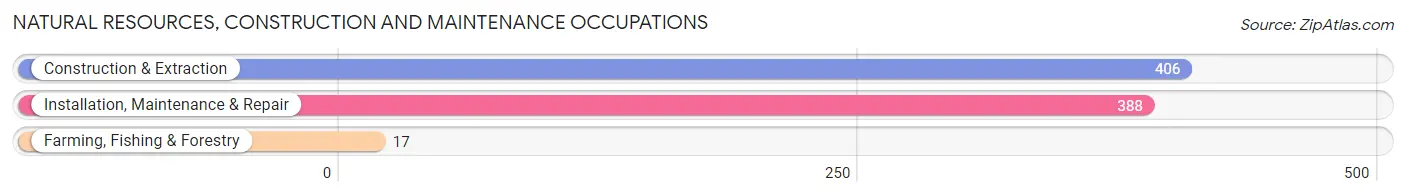
Natural Resources, Construction and Maintenance Occupations
The most common Natural Resources, Construction and Maintenance occupations in Monroeville are Construction & Extraction (406 | 2.8%), Installation, Maintenance & Repair (388 | 2.6%), and Farming, Fishing & Forestry (17 | 0.1%).
Natural Resources, Construction and Maintenance Occupations by Sex
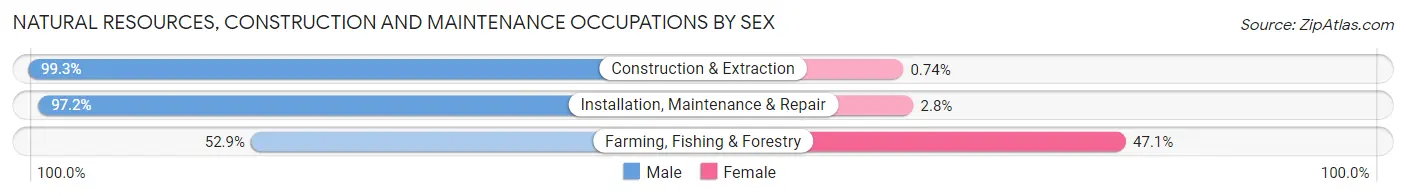
| Occupation | Male | Female |
| Farming, Fishing & Forestry | 9 (52.9%) | 8 (47.1%) |
| Construction & Extraction | 403 (99.3%) | 3 (0.7%) |
| Installation, Maintenance & Repair | 377 (97.2%) | 11 (2.8%) |
| Total (Category) | 789 (97.3%) | 22 (2.7%) |
| Total (Overall) | 7,301 (49.5%) | 7,461 (50.5%) |
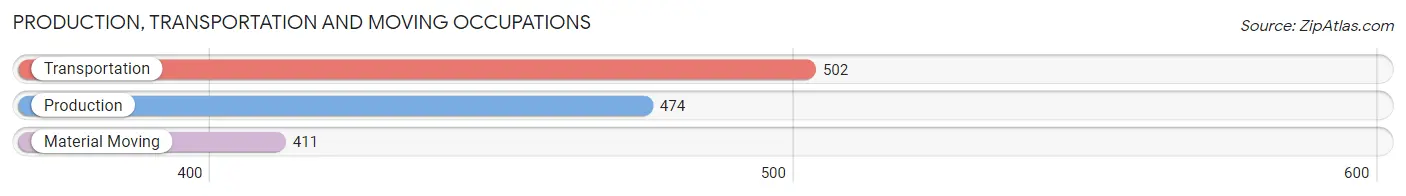
Production, Transportation and Moving Occupations
The most common Production, Transportation and Moving occupations in Monroeville are Transportation (502 | 3.4%), Production (474 | 3.2%), and Material Moving (411 | 2.8%).
Production, Transportation and Moving Occupations by Sex
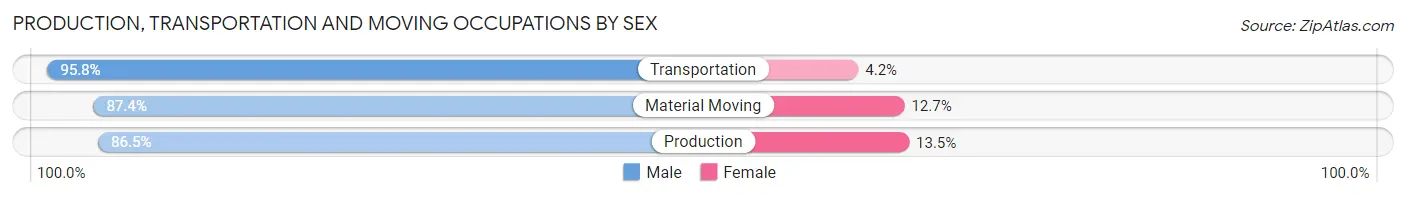
| Occupation | Male | Female |
| Production | 410 (86.5%) | 64 (13.5%) |
| Transportation | 481 (95.8%) | 21 (4.2%) |
| Material Moving | 359 (87.4%) | 52 (12.7%) |
| Total (Category) | 1,250 (90.1%) | 137 (9.9%) |
| Total (Overall) | 7,301 (49.5%) | 7,461 (50.5%) |
Employment Industries by Sex in Monroeville
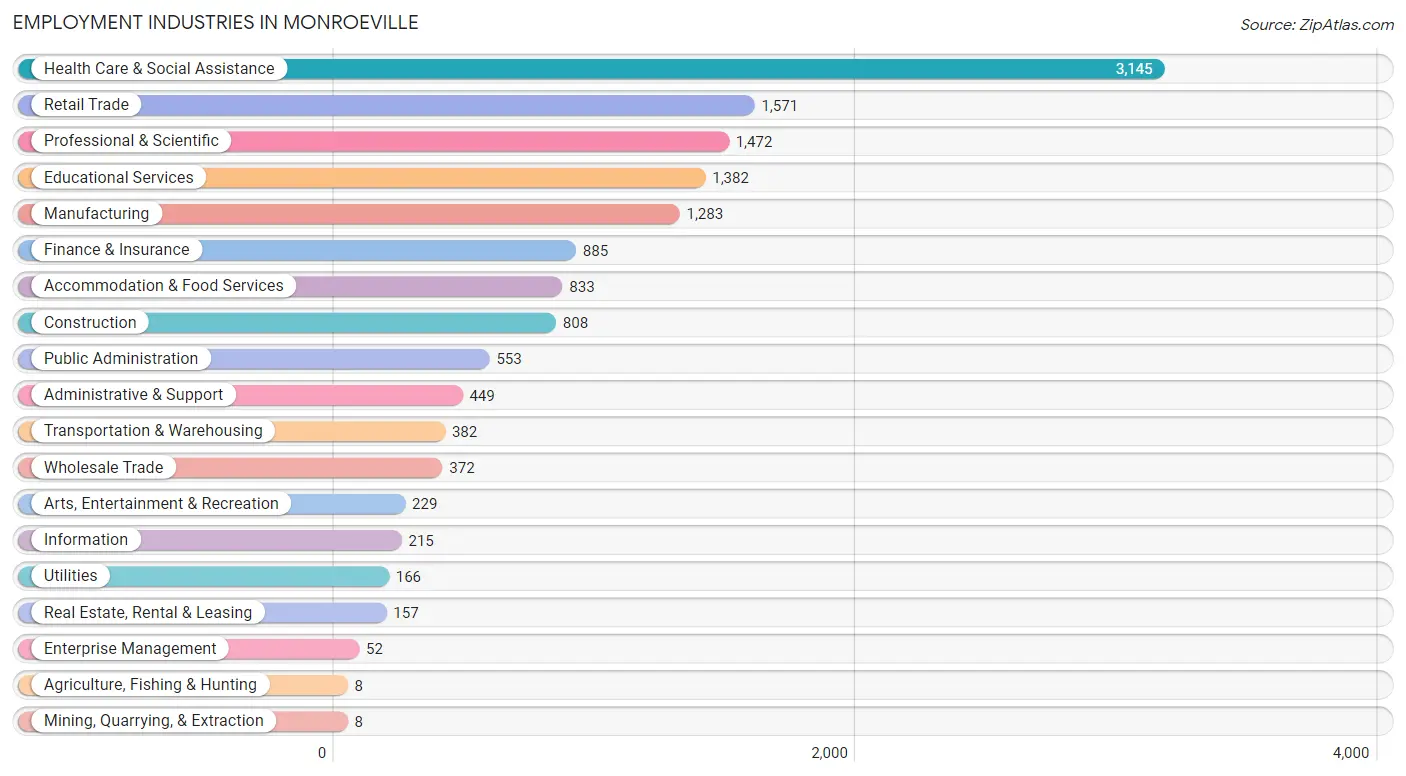
Employment Industries in Monroeville
The major employment industries in Monroeville include Health Care & Social Assistance (3,145 | 21.3%), Retail Trade (1,571 | 10.6%), Professional & Scientific (1,472 | 10.0%), Educational Services (1,382 | 9.4%), and Manufacturing (1,283 | 8.7%).
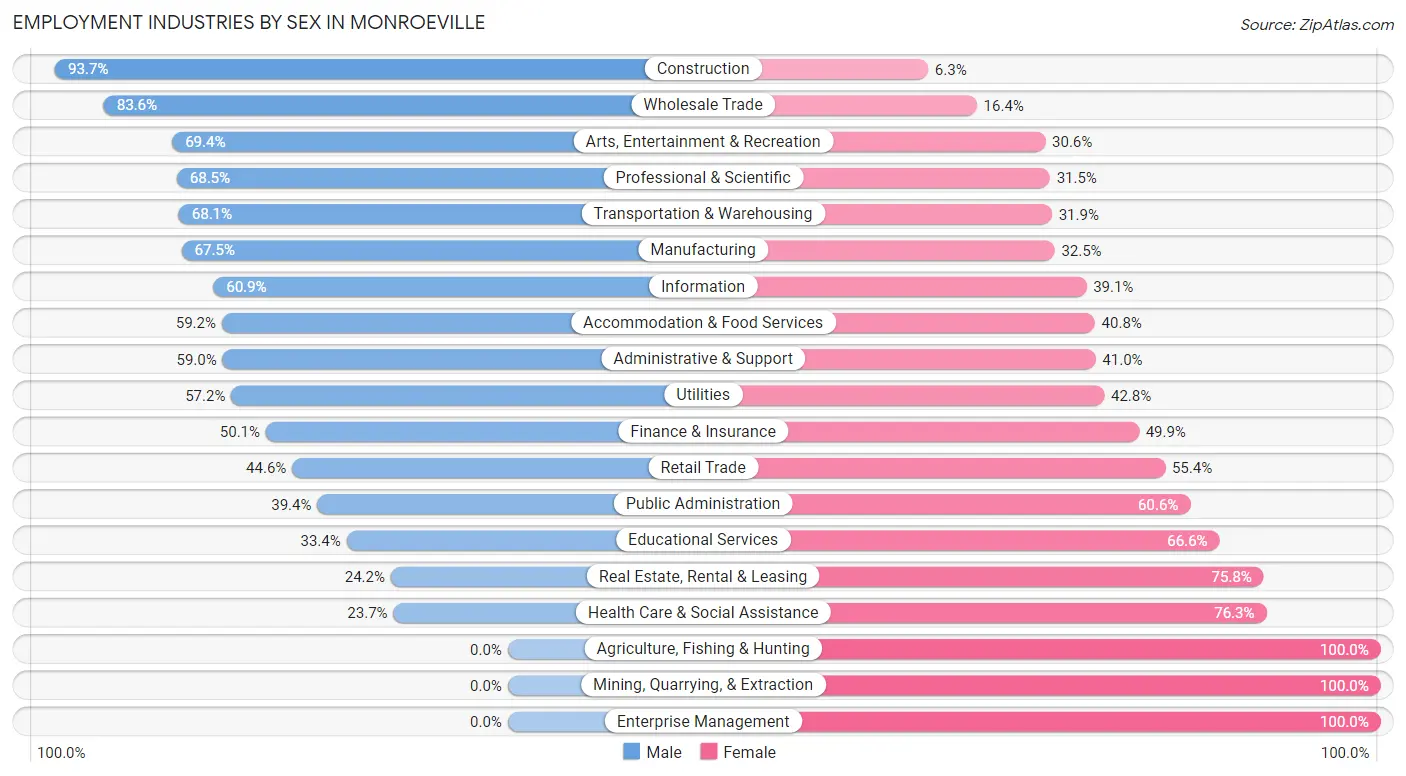
Employment Industries by Sex in Monroeville
The Monroeville industries that see more men than women are Construction (93.7%), Wholesale Trade (83.6%), and Arts, Entertainment & Recreation (69.4%), whereas the industries that tend to have a higher number of women are Agriculture, Fishing & Hunting (100.0%), Mining, Quarrying, & Extraction (100.0%), and Enterprise Management (100.0%).
| Industry | Male | Female |
| Agriculture, Fishing & Hunting | 0 (0.0%) | 8 (100.0%) |
| Mining, Quarrying, & Extraction | 0 (0.0%) | 8 (100.0%) |
| Construction | 757 (93.7%) | 51 (6.3%) |
| Manufacturing | 866 (67.5%) | 417 (32.5%) |
| Wholesale Trade | 311 (83.6%) | 61 (16.4%) |
| Retail Trade | 701 (44.6%) | 870 (55.4%) |
| Transportation & Warehousing | 260 (68.1%) | 122 (31.9%) |
| Utilities | 95 (57.2%) | 71 (42.8%) |
| Information | 131 (60.9%) | 84 (39.1%) |
| Finance & Insurance | 443 (50.1%) | 442 (49.9%) |
| Real Estate, Rental & Leasing | 38 (24.2%) | 119 (75.8%) |
| Professional & Scientific | 1,008 (68.5%) | 464 (31.5%) |
| Enterprise Management | 0 (0.0%) | 52 (100.0%) |
| Administrative & Support | 265 (59.0%) | 184 (41.0%) |
| Educational Services | 461 (33.4%) | 921 (66.6%) |
| Health Care & Social Assistance | 744 (23.7%) | 2,401 (76.3%) |
| Arts, Entertainment & Recreation | 159 (69.4%) | 70 (30.6%) |
| Accommodation & Food Services | 493 (59.2%) | 340 (40.8%) |
| Public Administration | 218 (39.4%) | 335 (60.6%) |
| Total | 7,301 (49.5%) | 7,461 (50.5%) |
Education in Monroeville
School Enrollment in Monroeville
The most common levels of schooling among the 5,065 students in Monroeville are high school (1,182 | 23.3%), middle school (952 | 18.8%), and elementary school (859 | 17.0%).
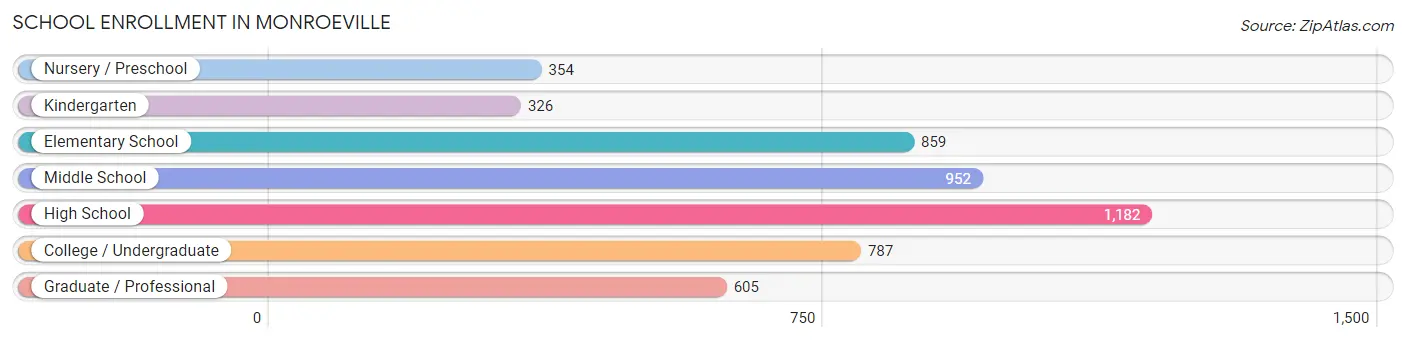
| School Level | # Students | % Students |
| Nursery / Preschool | 354 | 7.0% |
| Kindergarten | 326 | 6.4% |
| Elementary School | 859 | 17.0% |
| Middle School | 952 | 18.8% |
| High School | 1,182 | 23.3% |
| College / Undergraduate | 787 | 15.5% |
| Graduate / Professional | 605 | 11.9% |
| Total | 5,065 | 100.0% |
School Enrollment by Age by Funding Source in Monroeville
Out of a total of 5,065 students who are enrolled in schools in Monroeville, 1,520 (30.0%) attend a private institution, while the remaining 3,546 (70.0%) are enrolled in public schools. The age group of 20 to 24 year olds has the highest likelihood of being enrolled in private schools, with 314 (58.8% in the age bracket) enrolled. Conversely, the age group of 18 to 19 year olds has the lowest likelihood of being enrolled in a private school, with 373 (92.1% in the age bracket) attending a public institution.
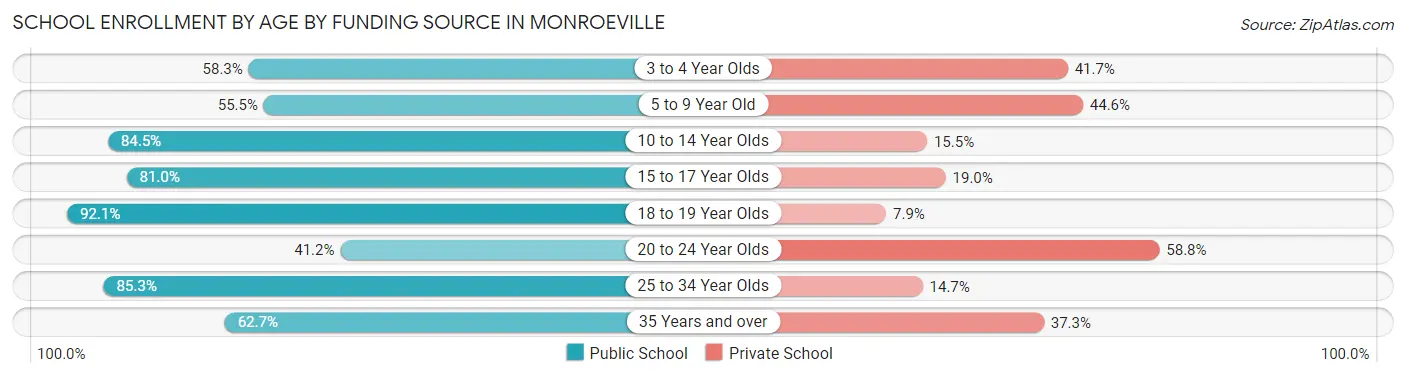
| Age Bracket | Public School | Private School |
| 3 to 4 Year Olds | 148 (58.3%) | 106 (41.7%) |
| 5 to 9 Year Old | 666 (55.4%) | 535 (44.6%) |
| 10 to 14 Year Olds | 887 (84.5%) | 163 (15.5%) |
| 15 to 17 Year Olds | 738 (81.0%) | 173 (19.0%) |
| 18 to 19 Year Olds | 373 (92.1%) | 32 (7.9%) |
| 20 to 24 Year Olds | 220 (41.2%) | 314 (58.8%) |
| 25 to 34 Year Olds | 267 (85.3%) | 46 (14.7%) |
| 35 Years and over | 249 (62.7%) | 148 (37.3%) |
| Total | 3,546 (70.0%) | 1,520 (30.0%) |
Educational Attainment by Field of Study in Monroeville
Business (1,876 | 18.2%), education (1,367 | 13.3%), science & technology (1,246 | 12.1%), engineering (1,123 | 10.9%), and arts & humanities (645 | 6.3%) are the most common fields of study among 10,305 individuals in Monroeville who have obtained a bachelor's degree or higher.
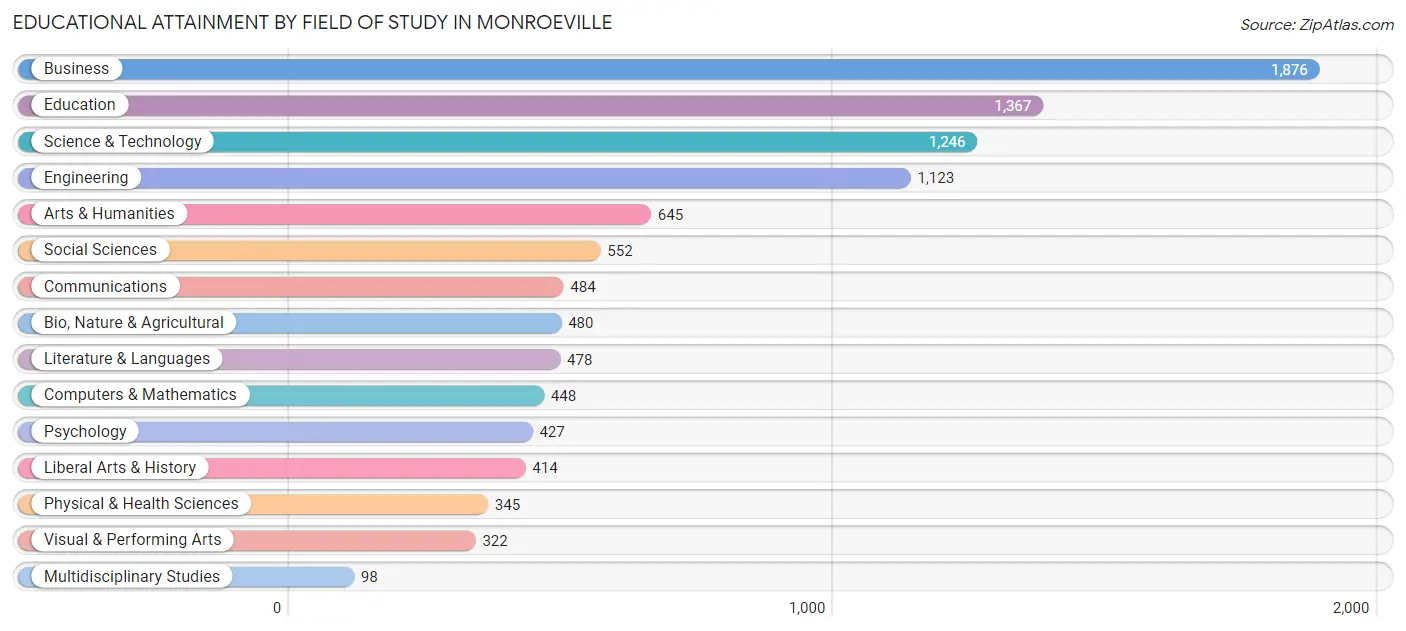
| Field of Study | # Graduates | % Graduates |
| Computers & Mathematics | 448 | 4.3% |
| Bio, Nature & Agricultural | 480 | 4.7% |
| Physical & Health Sciences | 345 | 3.4% |
| Psychology | 427 | 4.1% |
| Social Sciences | 552 | 5.4% |
| Engineering | 1,123 | 10.9% |
| Multidisciplinary Studies | 98 | 0.9% |
| Science & Technology | 1,246 | 12.1% |
| Business | 1,876 | 18.2% |
| Education | 1,367 | 13.3% |
| Literature & Languages | 478 | 4.6% |
| Liberal Arts & History | 414 | 4.0% |
| Visual & Performing Arts | 322 | 3.1% |
| Communications | 484 | 4.7% |
| Arts & Humanities | 645 | 6.3% |
| Total | 10,305 | 100.0% |
Transportation & Commute in Monroeville
Vehicle Availability by Sex in Monroeville
The most prevalent vehicle ownership categories in Monroeville are males with 2 vehicles (3,712, accounting for 51.8%) and females with 2 vehicles (3,216, making up 51.4%).
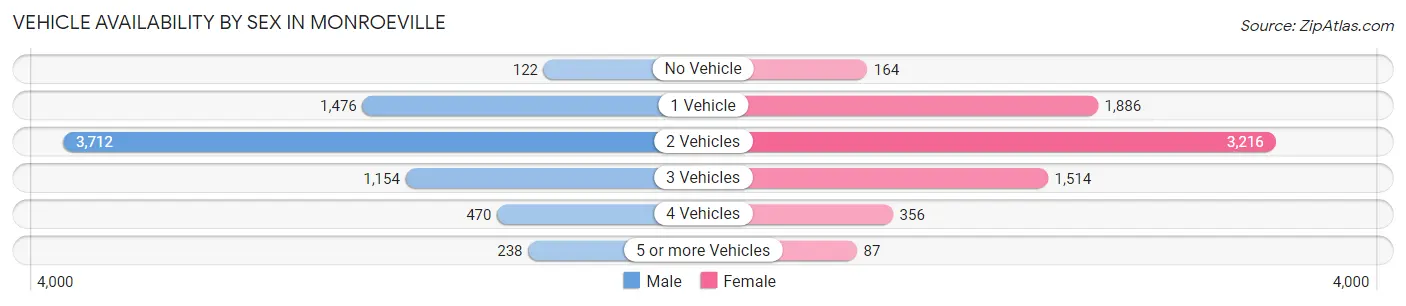
| Vehicles Available | Male | Female |
| No Vehicle | 122 (1.7%) | 164 (2.3%) |
| 1 Vehicle | 1,476 (20.6%) | 1,886 (26.1%) |
| 2 Vehicles | 3,712 (51.8%) | 3,216 (44.5%) |
| 3 Vehicles | 1,154 (16.1%) | 1,514 (21.0%) |
| 4 Vehicles | 470 (6.6%) | 356 (4.9%) |
| 5 or more Vehicles | 238 (3.3%) | 87 (1.2%) |
| Total | 7,172 (100.0%) | 7,223 (100.0%) |
Commute Time in Monroeville
The most frequently occuring commute durations in Monroeville are 30 to 34 minutes (1,862 commuters, 15.9%), 10 to 14 minutes (1,533 commuters, 13.1%), and 5 to 9 minutes (1,453 commuters, 12.4%).
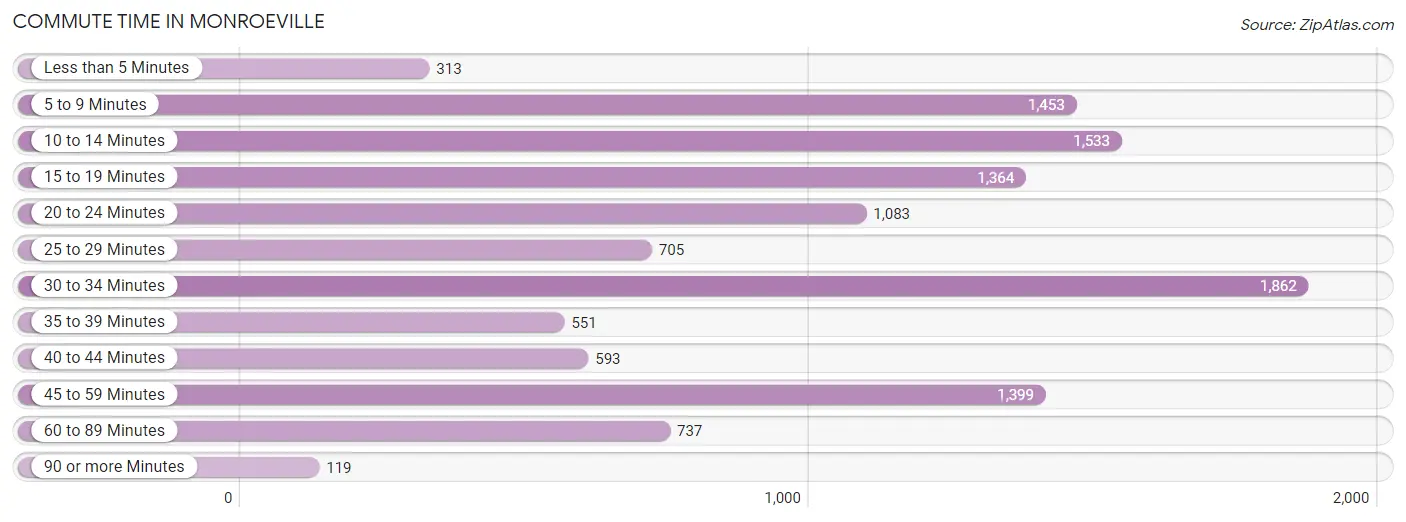
| Commute Time | # Commuters | % Commuters |
| Less than 5 Minutes | 313 | 2.7% |
| 5 to 9 Minutes | 1,453 | 12.4% |
| 10 to 14 Minutes | 1,533 | 13.1% |
| 15 to 19 Minutes | 1,364 | 11.7% |
| 20 to 24 Minutes | 1,083 | 9.2% |
| 25 to 29 Minutes | 705 | 6.0% |
| 30 to 34 Minutes | 1,862 | 15.9% |
| 35 to 39 Minutes | 551 | 4.7% |
| 40 to 44 Minutes | 593 | 5.1% |
| 45 to 59 Minutes | 1,399 | 11.9% |
| 60 to 89 Minutes | 737 | 6.3% |
| 90 or more Minutes | 119 | 1.0% |
Commute Time by Sex in Monroeville
The most common commute times in Monroeville are 30 to 34 minutes (870 commuters, 14.9%) for males and 30 to 34 minutes (992 commuters, 16.9%) for females.
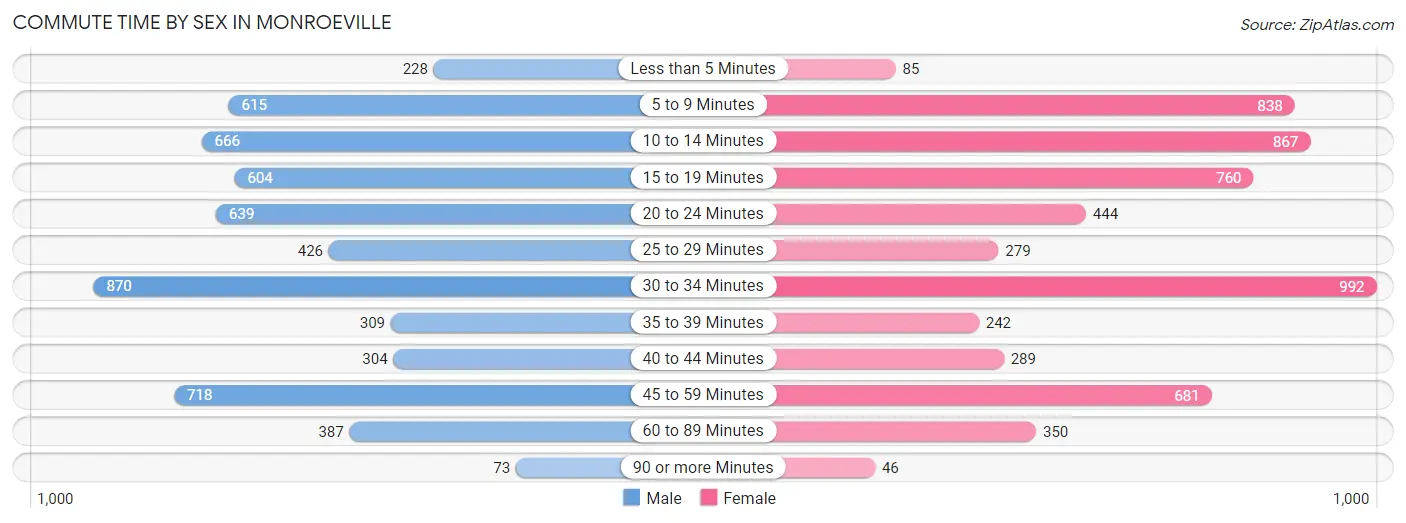
| Commute Time | Male | Female |
| Less than 5 Minutes | 228 (3.9%) | 85 (1.5%) |
| 5 to 9 Minutes | 615 (10.5%) | 838 (14.3%) |
| 10 to 14 Minutes | 666 (11.4%) | 867 (14.8%) |
| 15 to 19 Minutes | 604 (10.3%) | 760 (12.9%) |
| 20 to 24 Minutes | 639 (10.9%) | 444 (7.6%) |
| 25 to 29 Minutes | 426 (7.3%) | 279 (4.8%) |
| 30 to 34 Minutes | 870 (14.9%) | 992 (16.9%) |
| 35 to 39 Minutes | 309 (5.3%) | 242 (4.1%) |
| 40 to 44 Minutes | 304 (5.2%) | 289 (4.9%) |
| 45 to 59 Minutes | 718 (12.3%) | 681 (11.6%) |
| 60 to 89 Minutes | 387 (6.6%) | 350 (6.0%) |
| 90 or more Minutes | 73 (1.3%) | 46 (0.8%) |
Time of Departure to Work by Sex in Monroeville
The most frequent times of departure to work in Monroeville are 5:30 AM to 5:59 AM (710, 12.2%) for males and 7:30 AM to 7:59 AM (850, 14.5%) for females.
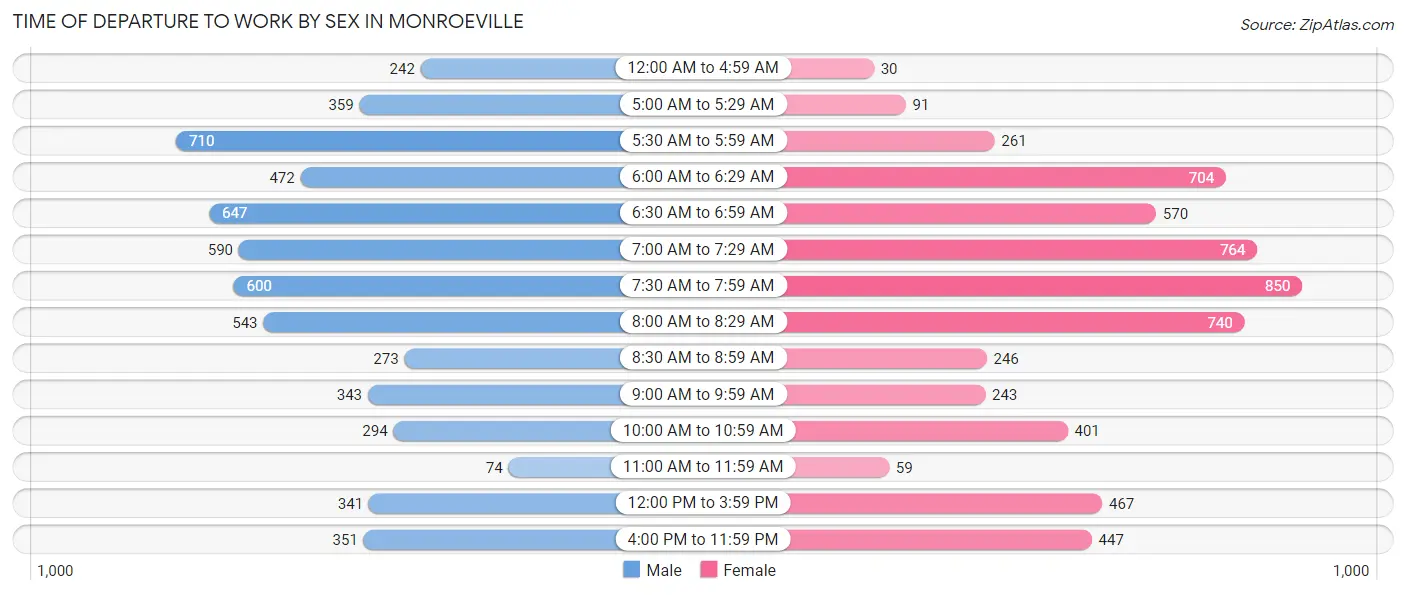
| Time of Departure | Male | Female |
| 12:00 AM to 4:59 AM | 242 (4.1%) | 30 (0.5%) |
| 5:00 AM to 5:29 AM | 359 (6.1%) | 91 (1.5%) |
| 5:30 AM to 5:59 AM | 710 (12.2%) | 261 (4.4%) |
| 6:00 AM to 6:29 AM | 472 (8.1%) | 704 (12.0%) |
| 6:30 AM to 6:59 AM | 647 (11.1%) | 570 (9.7%) |
| 7:00 AM to 7:29 AM | 590 (10.1%) | 764 (13.0%) |
| 7:30 AM to 7:59 AM | 600 (10.3%) | 850 (14.5%) |
| 8:00 AM to 8:29 AM | 543 (9.3%) | 740 (12.6%) |
| 8:30 AM to 8:59 AM | 273 (4.7%) | 246 (4.2%) |
| 9:00 AM to 9:59 AM | 343 (5.9%) | 243 (4.1%) |
| 10:00 AM to 10:59 AM | 294 (5.0%) | 401 (6.8%) |
| 11:00 AM to 11:59 AM | 74 (1.3%) | 59 (1.0%) |
| 12:00 PM to 3:59 PM | 341 (5.8%) | 467 (8.0%) |
| 4:00 PM to 11:59 PM | 351 (6.0%) | 447 (7.6%) |
| Total | 5,839 (100.0%) | 5,873 (100.0%) |
Housing Occupancy in Monroeville
Occupancy by Ownership in Monroeville
Of the total 12,348 dwellings in Monroeville, owner-occupied units account for 8,769 (71.0%), while renter-occupied units make up 3,579 (29.0%).
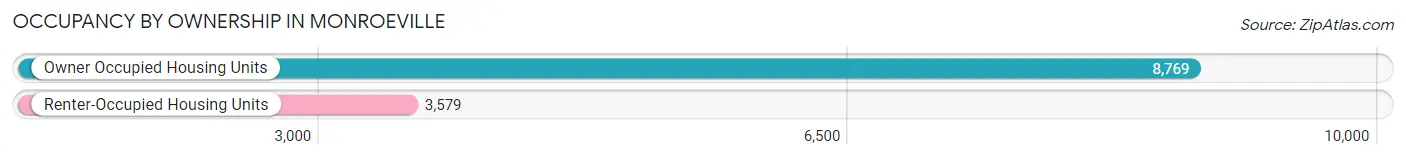
| Occupancy | # Housing Units | % Housing Units |
| Owner Occupied Housing Units | 8,769 | 71.0% |
| Renter-Occupied Housing Units | 3,579 | 29.0% |
| Total Occupied Housing Units | 12,348 | 100.0% |
Occupancy by Household Size in Monroeville
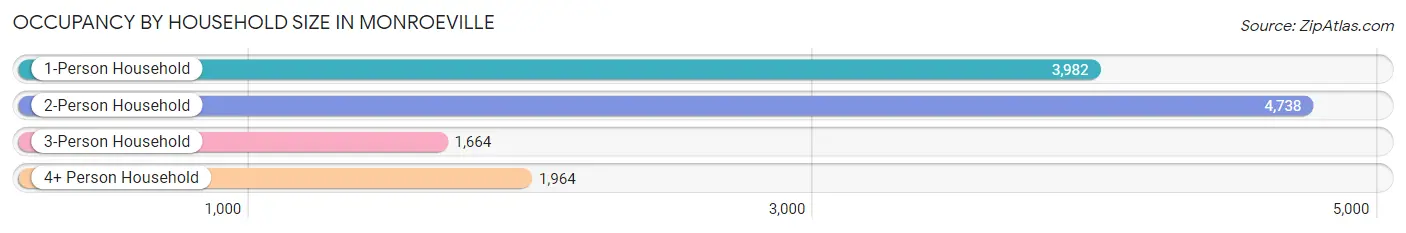
| Household Size | # Housing Units | % Housing Units |
| 1-Person Household | 3,982 | 32.3% |
| 2-Person Household | 4,738 | 38.4% |
| 3-Person Household | 1,664 | 13.5% |
| 4+ Person Household | 1,964 | 15.9% |
| Total Housing Units | 12,348 | 100.0% |
Occupancy by Ownership by Household Size in Monroeville
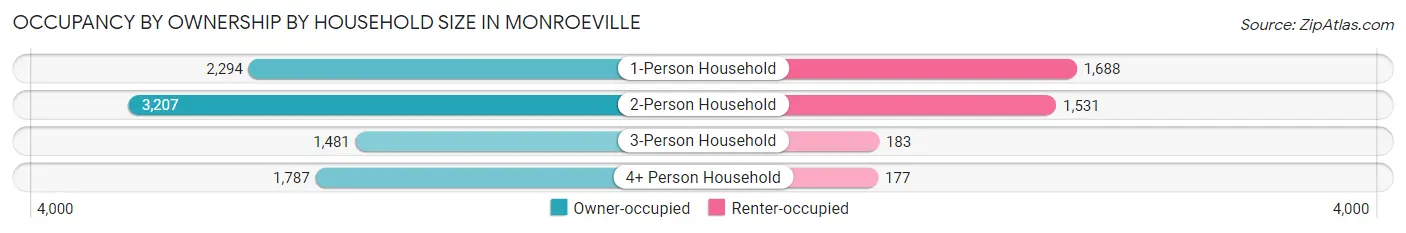
| Household Size | Owner-occupied | Renter-occupied |
| 1-Person Household | 2,294 (57.6%) | 1,688 (42.4%) |
| 2-Person Household | 3,207 (67.7%) | 1,531 (32.3%) |
| 3-Person Household | 1,481 (89.0%) | 183 (11.0%) |
| 4+ Person Household | 1,787 (91.0%) | 177 (9.0%) |
| Total Housing Units | 8,769 (71.0%) | 3,579 (29.0%) |
Occupancy by Educational Attainment in Monroeville
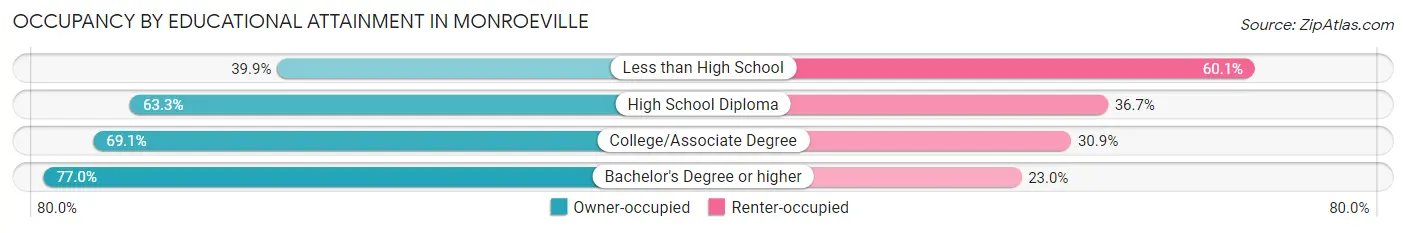
| Household Size | Owner-occupied | Renter-occupied |
| Less than High School | 117 (39.9%) | 176 (60.1%) |
| High School Diploma | 1,656 (63.3%) | 961 (36.7%) |
| College/Associate Degree | 2,375 (69.1%) | 1,062 (30.9%) |
| Bachelor's Degree or higher | 4,621 (77.0%) | 1,380 (23.0%) |
Occupancy by Age of Householder in Monroeville
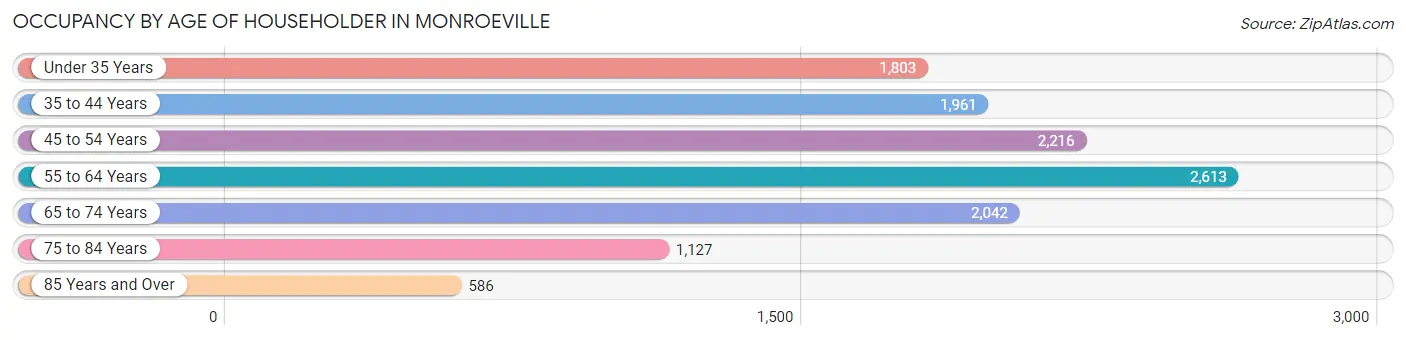
| Age Bracket | # Households | % Households |
| Under 35 Years | 1,803 | 14.6% |
| 35 to 44 Years | 1,961 | 15.9% |
| 45 to 54 Years | 2,216 | 17.9% |
| 55 to 64 Years | 2,613 | 21.2% |
| 65 to 74 Years | 2,042 | 16.5% |
| 75 to 84 Years | 1,127 | 9.1% |
| 85 Years and Over | 586 | 4.8% |
| Total | 12,348 | 100.0% |
Housing Finances in Monroeville
Median Income by Occupancy in Monroeville
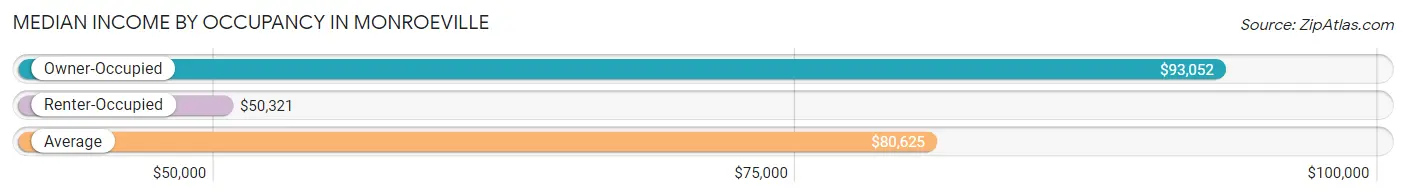
| Occupancy Type | # Households | Median Income |
| Owner-Occupied | 8,769 (71.0%) | $93,052 |
| Renter-Occupied | 3,579 (29.0%) | $50,321 |
| Average | 12,348 (100.0%) | $80,625 |
Occupancy by Householder Income Bracket in Monroeville
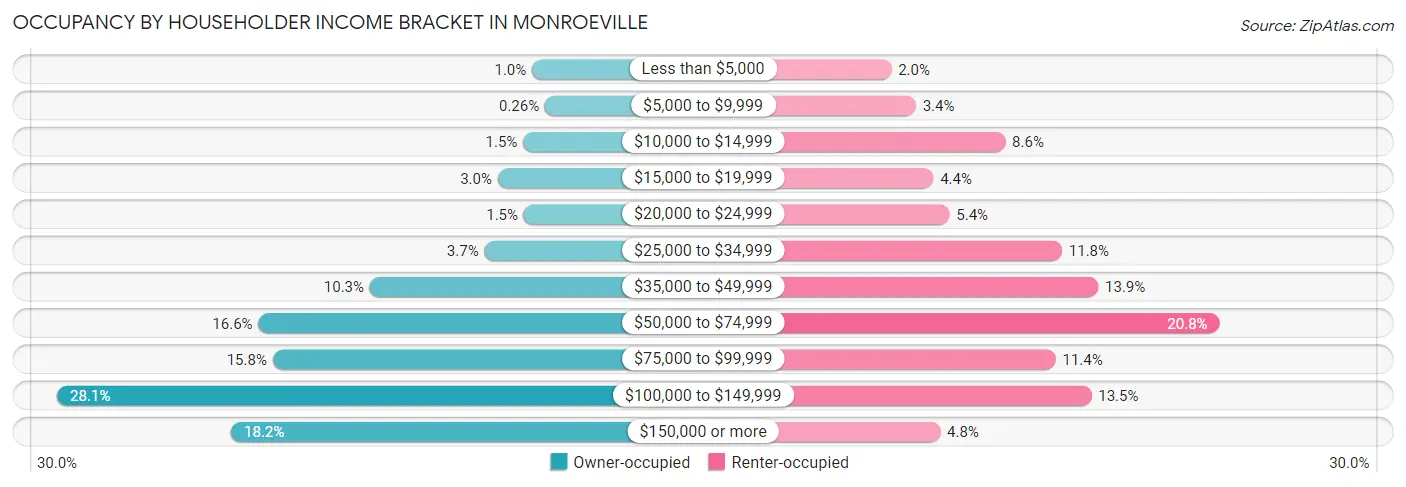
| Income Bracket | Owner-occupied | Renter-occupied |
| Less than $5,000 | 88 (1.0%) | 73 (2.0%) |
| $5,000 to $9,999 | 23 (0.3%) | 123 (3.4%) |
| $10,000 to $14,999 | 132 (1.5%) | 306 (8.6%) |
| $15,000 to $19,999 | 260 (3.0%) | 159 (4.4%) |
| $20,000 to $24,999 | 129 (1.5%) | 192 (5.4%) |
| $25,000 to $34,999 | 326 (3.7%) | 422 (11.8%) |
| $35,000 to $49,999 | 901 (10.3%) | 496 (13.9%) |
| $50,000 to $74,999 | 1,459 (16.6%) | 744 (20.8%) |
| $75,000 to $99,999 | 1,387 (15.8%) | 409 (11.4%) |
| $100,000 to $149,999 | 2,468 (28.1%) | 482 (13.5%) |
| $150,000 or more | 1,596 (18.2%) | 173 (4.8%) |
| Total | 8,769 (100.0%) | 3,579 (100.0%) |
Monthly Housing Cost Tiers in Monroeville
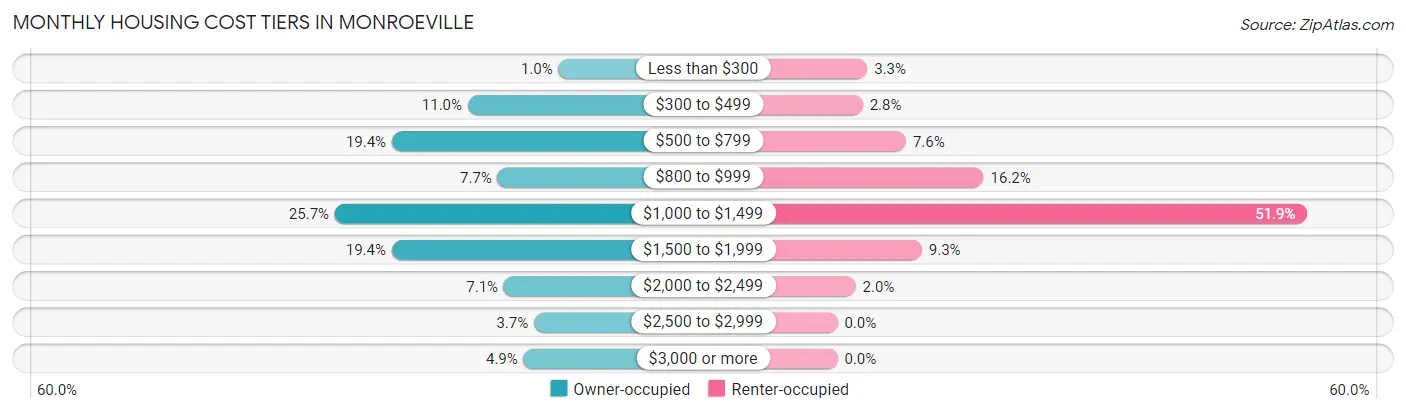
| Monthly Cost | Owner-occupied | Renter-occupied |
| Less than $300 | 89 (1.0%) | 118 (3.3%) |
| $300 to $499 | 967 (11.0%) | 100 (2.8%) |
| $500 to $799 | 1,703 (19.4%) | 271 (7.6%) |
| $800 to $999 | 679 (7.7%) | 578 (16.2%) |
| $1,000 to $1,499 | 2,255 (25.7%) | 1,858 (51.9%) |
| $1,500 to $1,999 | 1,705 (19.4%) | 334 (9.3%) |
| $2,000 to $2,499 | 618 (7.0%) | 72 (2.0%) |
| $2,500 to $2,999 | 326 (3.7%) | 0 (0.0%) |
| $3,000 or more | 427 (4.9%) | 0 (0.0%) |
| Total | 8,769 (100.0%) | 3,579 (100.0%) |
Physical Housing Characteristics in Monroeville
Housing Structures in Monroeville
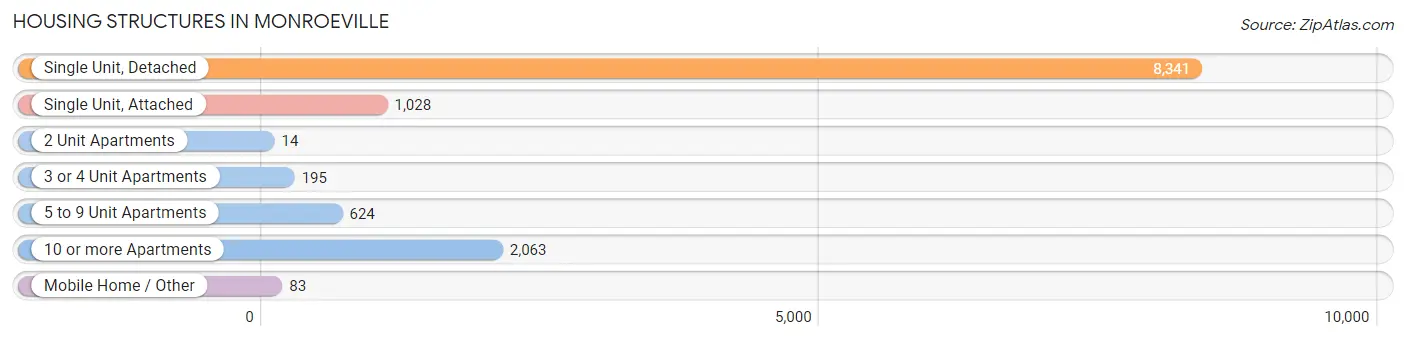
| Structure Type | # Housing Units | % Housing Units |
| Single Unit, Detached | 8,341 | 67.5% |
| Single Unit, Attached | 1,028 | 8.3% |
| 2 Unit Apartments | 14 | 0.1% |
| 3 or 4 Unit Apartments | 195 | 1.6% |
| 5 to 9 Unit Apartments | 624 | 5.1% |
| 10 or more Apartments | 2,063 | 16.7% |
| Mobile Home / Other | 83 | 0.7% |
| Total | 12,348 | 100.0% |
Housing Structures by Occupancy in Monroeville
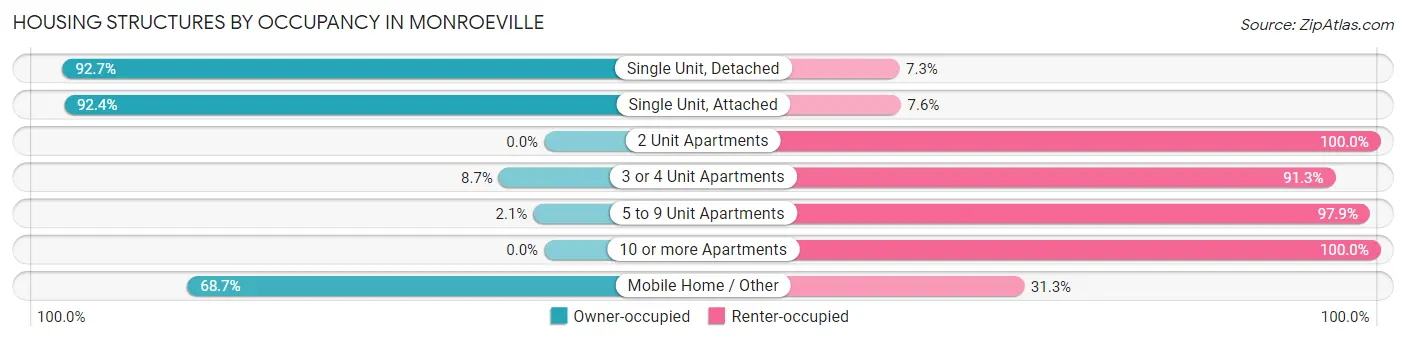
| Structure Type | Owner-occupied | Renter-occupied |
| Single Unit, Detached | 7,732 (92.7%) | 609 (7.3%) |
| Single Unit, Attached | 950 (92.4%) | 78 (7.6%) |
| 2 Unit Apartments | 0 (0.0%) | 14 (100.0%) |
| 3 or 4 Unit Apartments | 17 (8.7%) | 178 (91.3%) |
| 5 to 9 Unit Apartments | 13 (2.1%) | 611 (97.9%) |
| 10 or more Apartments | 0 (0.0%) | 2,063 (100.0%) |
| Mobile Home / Other | 57 (68.7%) | 26 (31.3%) |
| Total | 8,769 (71.0%) | 3,579 (29.0%) |
Housing Structures by Number of Rooms in Monroeville
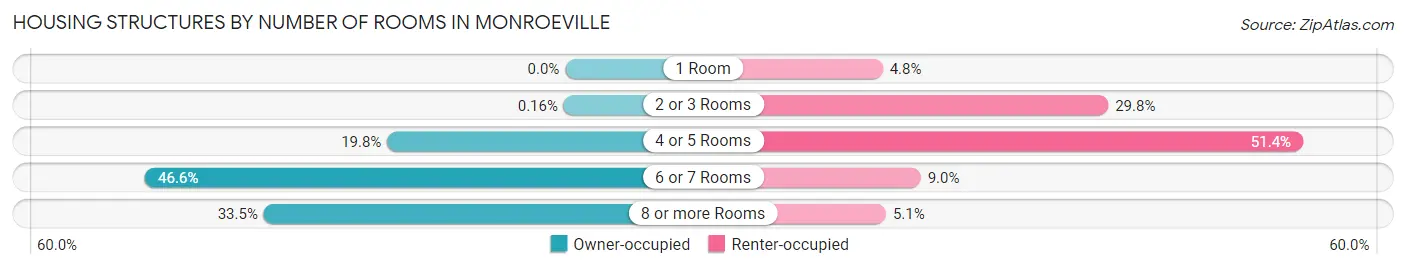
| Number of Rooms | Owner-occupied | Renter-occupied |
| 1 Room | 0 (0.0%) | 170 (4.8%) |
| 2 or 3 Rooms | 14 (0.2%) | 1,066 (29.8%) |
| 4 or 5 Rooms | 1,733 (19.8%) | 1,839 (51.4%) |
| 6 or 7 Rooms | 4,088 (46.6%) | 321 (9.0%) |
| 8 or more Rooms | 2,934 (33.5%) | 183 (5.1%) |
| Total | 8,769 (100.0%) | 3,579 (100.0%) |
Housing Structure by Heating Type in Monroeville
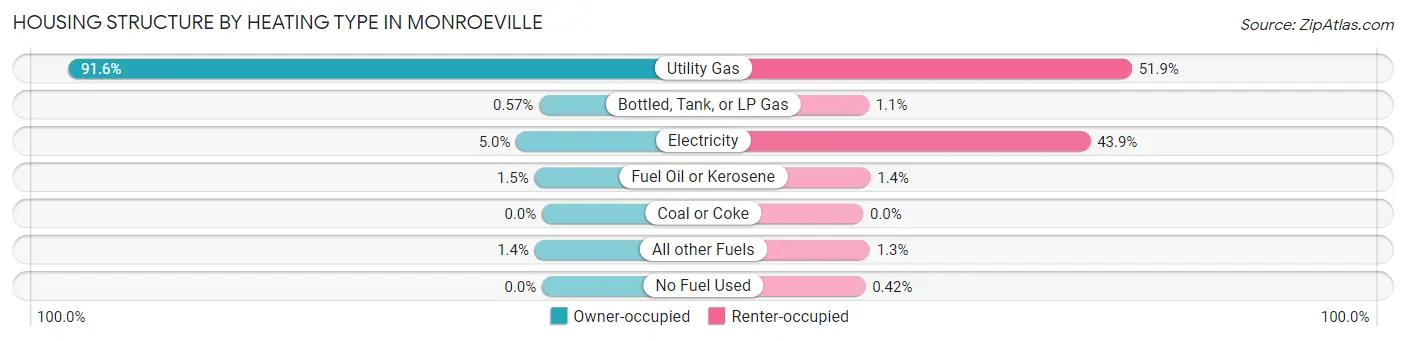
| Heating Type | Owner-occupied | Renter-occupied |
| Utility Gas | 8,031 (91.6%) | 1,858 (51.9%) |
| Bottled, Tank, or LP Gas | 50 (0.6%) | 39 (1.1%) |
| Electricity | 437 (5.0%) | 1,571 (43.9%) |
| Fuel Oil or Kerosene | 127 (1.5%) | 50 (1.4%) |
| Coal or Coke | 0 (0.0%) | 0 (0.0%) |
| All other Fuels | 124 (1.4%) | 46 (1.3%) |
| No Fuel Used | 0 (0.0%) | 15 (0.4%) |
| Total | 8,769 (100.0%) | 3,579 (100.0%) |
Household Vehicle Usage in Monroeville
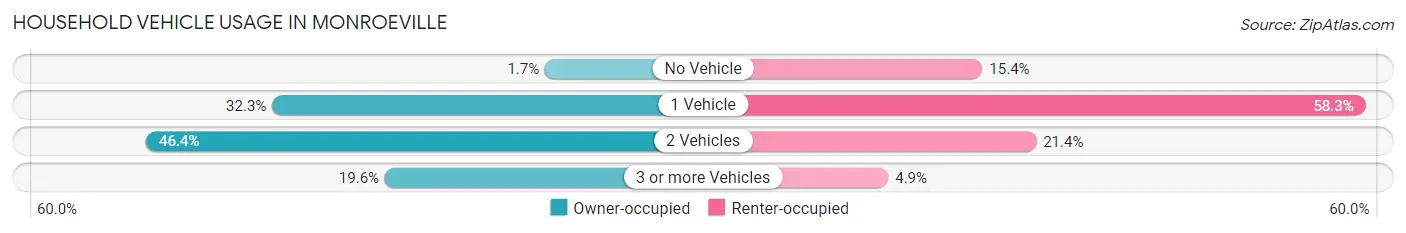
| Vehicles per Household | Owner-occupied | Renter-occupied |
| No Vehicle | 149 (1.7%) | 551 (15.4%) |
| 1 Vehicle | 2,830 (32.3%) | 2,087 (58.3%) |
| 2 Vehicles | 4,068 (46.4%) | 767 (21.4%) |
| 3 or more Vehicles | 1,722 (19.6%) | 174 (4.9%) |
| Total | 8,769 (100.0%) | 3,579 (100.0%) |
Real Estate & Mortgages in Monroeville
Real Estate and Mortgage Overview in Monroeville
| Characteristic | Without Mortgage | With Mortgage |
| Housing Units | 2,956 | 5,813 |
| Median Property Value | $172,400 | $187,300 |
| Median Household Income | $74,574 | $1,081 |
| Monthly Housing Costs | $590 | $427 |
| Real Estate Taxes | $2,801 | $82 |
Property Value by Mortgage Status in Monroeville
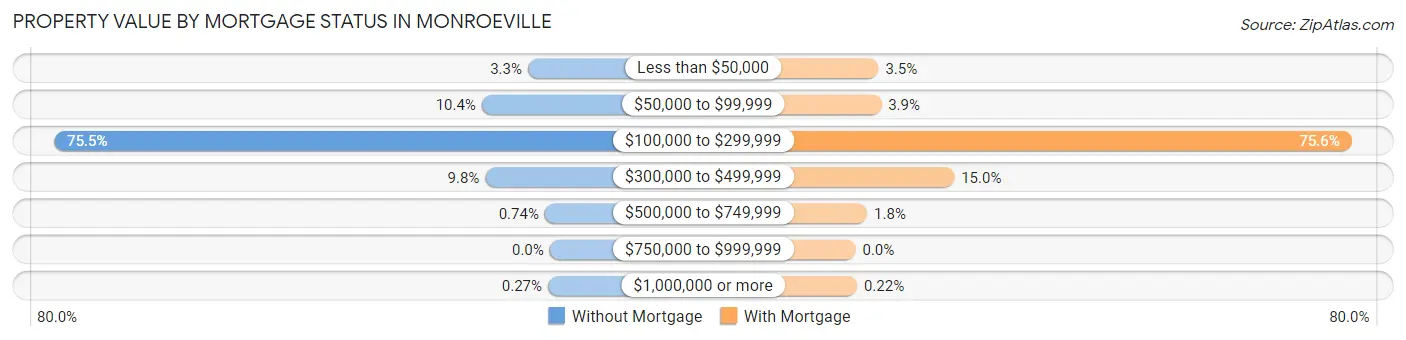
| Property Value | Without Mortgage | With Mortgage |
| Less than $50,000 | 98 (3.3%) | 203 (3.5%) |
| $50,000 to $99,999 | 306 (10.3%) | 227 (3.9%) |
| $100,000 to $299,999 | 2,232 (75.5%) | 4,393 (75.6%) |
| $300,000 to $499,999 | 290 (9.8%) | 874 (15.0%) |
| $500,000 to $749,999 | 22 (0.7%) | 103 (1.8%) |
| $750,000 to $999,999 | 0 (0.0%) | 0 (0.0%) |
| $1,000,000 or more | 8 (0.3%) | 13 (0.2%) |
| Total | 2,956 (100.0%) | 5,813 (100.0%) |
Household Income by Mortgage Status in Monroeville
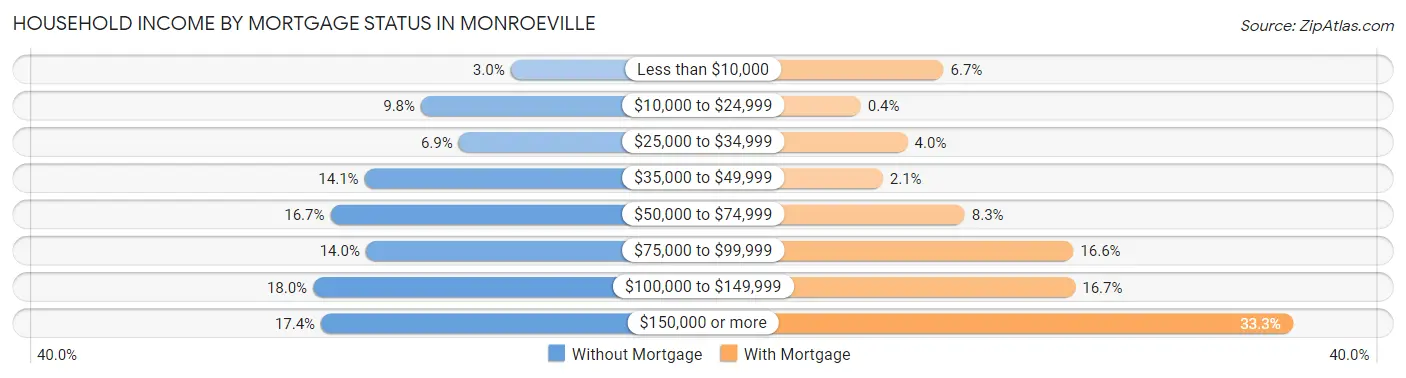
| Household Income | Without Mortgage | With Mortgage |
| Less than $10,000 | 88 (3.0%) | 390 (6.7%) |
| $10,000 to $24,999 | 290 (9.8%) | 23 (0.4%) |
| $25,000 to $34,999 | 205 (6.9%) | 231 (4.0%) |
| $35,000 to $49,999 | 417 (14.1%) | 121 (2.1%) |
| $50,000 to $74,999 | 494 (16.7%) | 484 (8.3%) |
| $75,000 to $99,999 | 414 (14.0%) | 965 (16.6%) |
| $100,000 to $149,999 | 533 (18.0%) | 973 (16.7%) |
| $150,000 or more | 515 (17.4%) | 1,935 (33.3%) |
| Total | 2,956 (100.0%) | 5,813 (100.0%) |
Property Value to Household Income Ratio in Monroeville
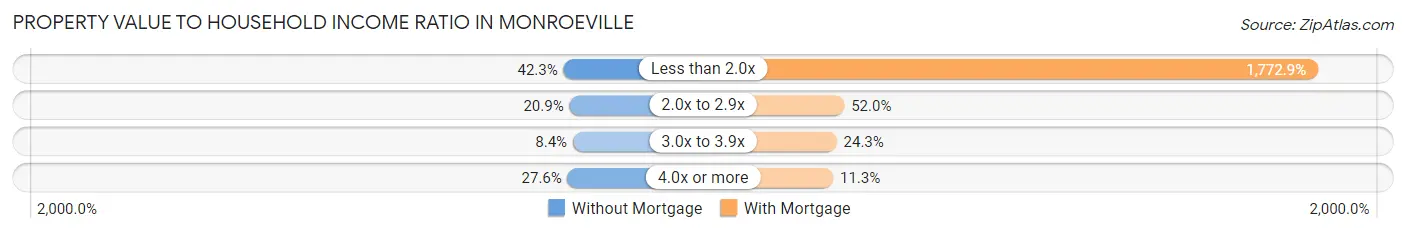
| Value-to-Income Ratio | Without Mortgage | With Mortgage |
| Less than 2.0x | 1,251 (42.3%) | 103,059 (1,772.9%) |
| 2.0x to 2.9x | 617 (20.9%) | 3,024 (52.0%) |
| 3.0x to 3.9x | 248 (8.4%) | 1,410 (24.3%) |
| 4.0x or more | 817 (27.6%) | 657 (11.3%) |
| Total | 2,956 (100.0%) | 5,813 (100.0%) |
Real Estate Taxes by Mortgage Status in Monroeville
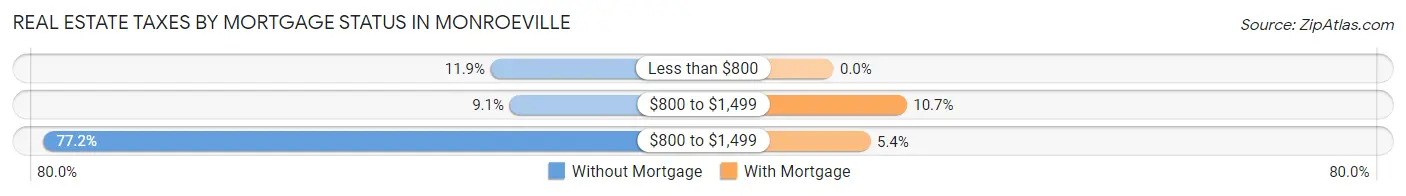
| Property Taxes | Without Mortgage | With Mortgage |
| Less than $800 | 351 (11.9%) | 0 (0.0%) |
| $800 to $1,499 | 269 (9.1%) | 622 (10.7%) |
| $800 to $1,499 | 2,283 (77.2%) | 314 (5.4%) |
| Total | 2,956 (100.0%) | 5,813 (100.0%) |
Health & Disability in Monroeville
Health Insurance Coverage by Age in Monroeville
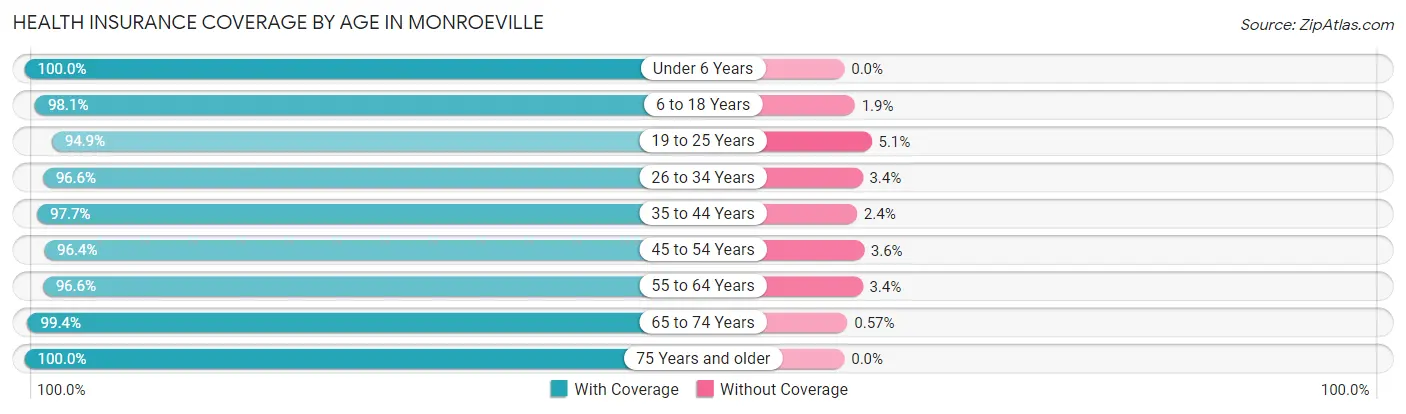
| Age Bracket | With Coverage | Without Coverage |
| Under 6 Years | 1,846 (100.0%) | 0 (0.0%) |
| 6 to 18 Years | 3,485 (98.1%) | 69 (1.9%) |
| 19 to 25 Years | 2,151 (94.9%) | 115 (5.1%) |
| 26 to 34 Years | 2,918 (96.6%) | 102 (3.4%) |
| 35 to 44 Years | 3,492 (97.7%) | 84 (2.4%) |
| 45 to 54 Years | 3,731 (96.4%) | 141 (3.6%) |
| 55 to 64 Years | 3,936 (96.6%) | 138 (3.4%) |
| 65 to 74 Years | 3,314 (99.4%) | 19 (0.6%) |
| 75 Years and older | 2,405 (100.0%) | 0 (0.0%) |
| Total | 27,278 (97.6%) | 668 (2.4%) |
Health Insurance Coverage by Citizenship Status in Monroeville
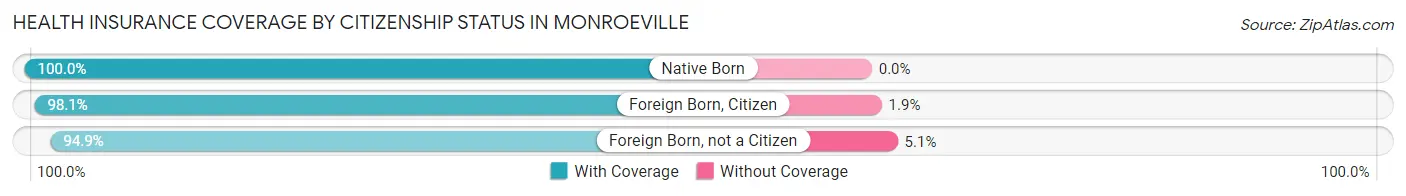
| Citizenship Status | With Coverage | Without Coverage |
| Native Born | 1,846 (100.0%) | 0 (0.0%) |
| Foreign Born, Citizen | 3,485 (98.1%) | 69 (1.9%) |
| Foreign Born, not a Citizen | 2,151 (94.9%) | 115 (5.1%) |
Health Insurance Coverage by Household Income in Monroeville
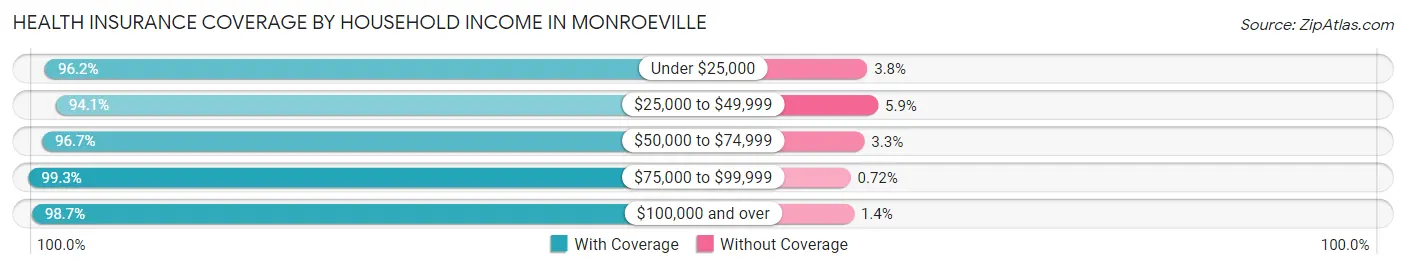
| Household Income | With Coverage | Without Coverage |
| Under $25,000 | 2,355 (96.2%) | 94 (3.8%) |
| $25,000 to $49,999 | 3,532 (94.1%) | 220 (5.9%) |
| $50,000 to $74,999 | 4,253 (96.7%) | 145 (3.3%) |
| $75,000 to $99,999 | 4,020 (99.3%) | 29 (0.7%) |
| $100,000 and over | 13,076 (98.7%) | 179 (1.3%) |
Public vs Private Health Insurance Coverage by Age in Monroeville
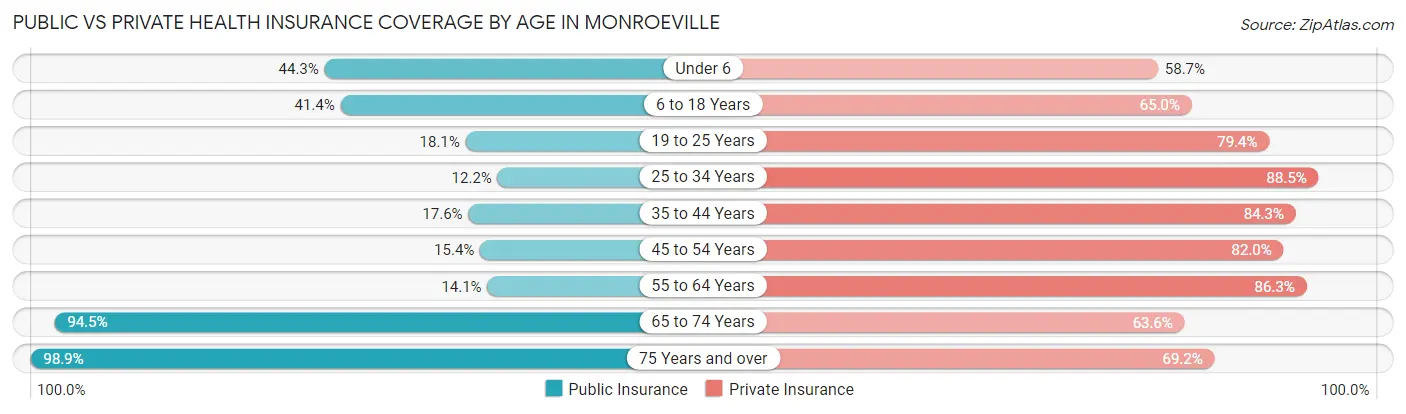
| Age Bracket | Public Insurance | Private Insurance |
| Under 6 | 818 (44.3%) | 1,083 (58.7%) |
| 6 to 18 Years | 1,470 (41.4%) | 2,309 (65.0%) |
| 19 to 25 Years | 411 (18.1%) | 1,798 (79.3%) |
| 25 to 34 Years | 368 (12.2%) | 2,673 (88.5%) |
| 35 to 44 Years | 630 (17.6%) | 3,013 (84.3%) |
| 45 to 54 Years | 598 (15.4%) | 3,175 (82.0%) |
| 55 to 64 Years | 574 (14.1%) | 3,515 (86.3%) |
| 65 to 74 Years | 3,149 (94.5%) | 2,121 (63.6%) |
| 75 Years and over | 2,379 (98.9%) | 1,664 (69.2%) |
| Total | 10,397 (37.2%) | 21,351 (76.4%) |
Disability Status by Sex by Age in Monroeville
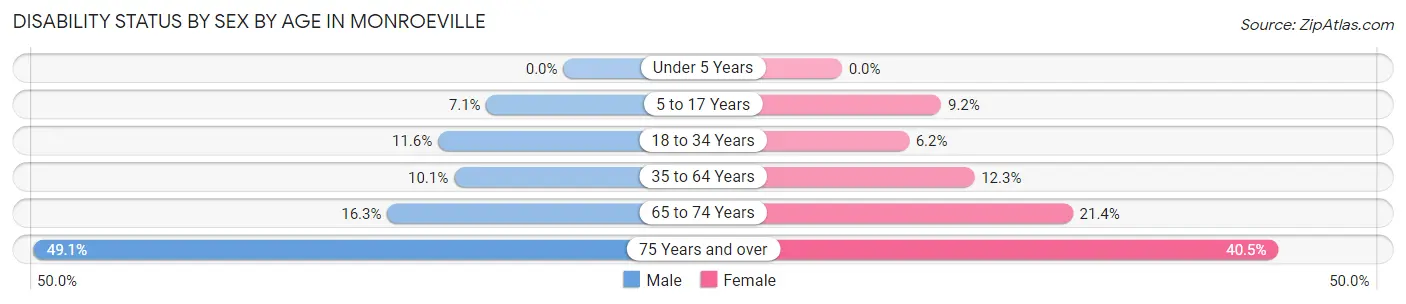
| Age Bracket | Male | Female |
| Under 5 Years | 0 (0.0%) | 0 (0.0%) |
| 5 to 17 Years | 142 (7.1%) | 146 (9.2%) |
| 18 to 34 Years | 326 (11.6%) | 171 (6.2%) |
| 35 to 64 Years | 558 (10.1%) | 740 (12.3%) |
| 65 to 74 Years | 267 (16.3%) | 364 (21.4%) |
| 75 Years and over | 483 (49.1%) | 576 (40.5%) |
Disability Class by Sex by Age in Monroeville
Disability Class: Hearing Difficulty
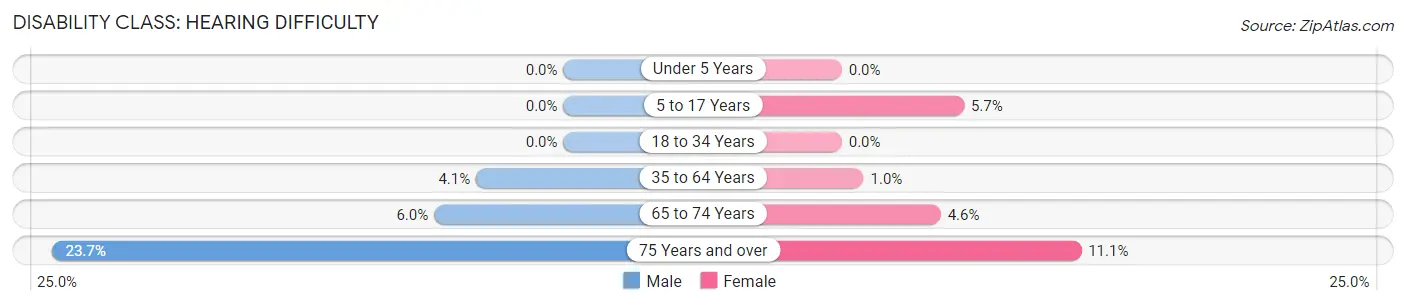
| Age Bracket | Male | Female |
| Under 5 Years | 0 (0.0%) | 0 (0.0%) |
| 5 to 17 Years | 0 (0.0%) | 90 (5.7%) |
| 18 to 34 Years | 0 (0.0%) | 0 (0.0%) |
| 35 to 64 Years | 223 (4.1%) | 61 (1.0%) |
| 65 to 74 Years | 98 (6.0%) | 78 (4.6%) |
| 75 Years and over | 233 (23.7%) | 158 (11.1%) |
Disability Class: Vision Difficulty
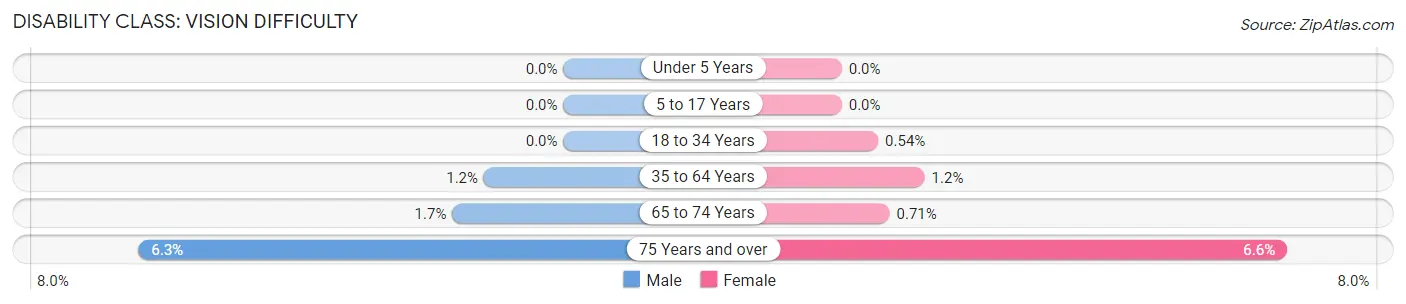
| Age Bracket | Male | Female |
| Under 5 Years | 0 (0.0%) | 0 (0.0%) |
| 5 to 17 Years | 0 (0.0%) | 0 (0.0%) |
| 18 to 34 Years | 0 (0.0%) | 15 (0.5%) |
| 35 to 64 Years | 65 (1.2%) | 74 (1.2%) |
| 65 to 74 Years | 27 (1.7%) | 12 (0.7%) |
| 75 Years and over | 62 (6.3%) | 94 (6.6%) |
Disability Class: Cognitive Difficulty
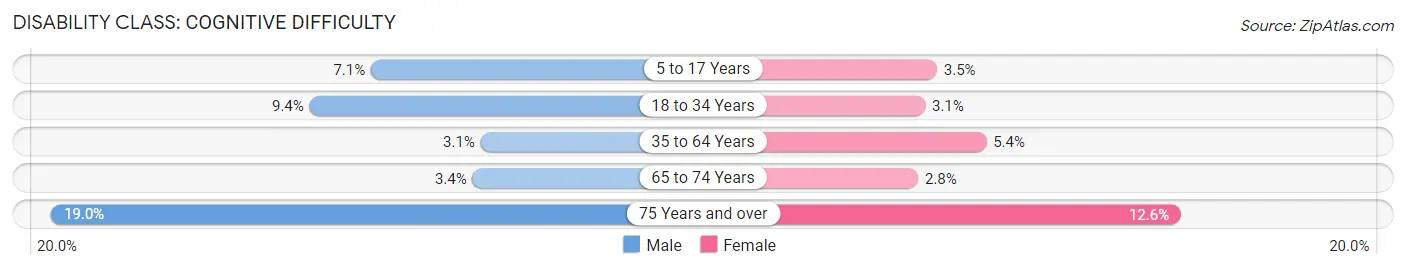
| Age Bracket | Male | Female |
| 5 to 17 Years | 142 (7.1%) | 56 (3.5%) |
| 18 to 34 Years | 264 (9.4%) | 85 (3.1%) |
| 35 to 64 Years | 169 (3.1%) | 323 (5.4%) |
| 65 to 74 Years | 55 (3.4%) | 48 (2.8%) |
| 75 Years and over | 187 (19.0%) | 179 (12.6%) |
Disability Class: Ambulatory Difficulty
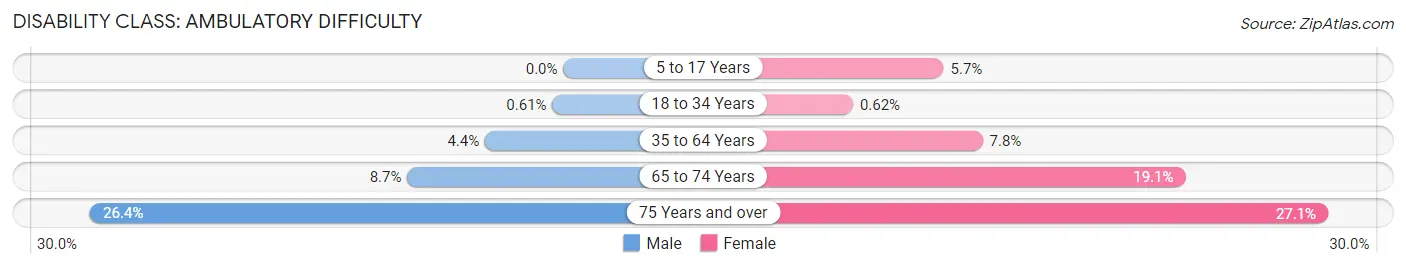
| Age Bracket | Male | Female |
| 5 to 17 Years | 0 (0.0%) | 90 (5.7%) |
| 18 to 34 Years | 17 (0.6%) | 17 (0.6%) |
| 35 to 64 Years | 240 (4.4%) | 472 (7.8%) |
| 65 to 74 Years | 142 (8.7%) | 325 (19.1%) |
| 75 Years and over | 259 (26.4%) | 385 (27.1%) |
Disability Class: Self-Care Difficulty
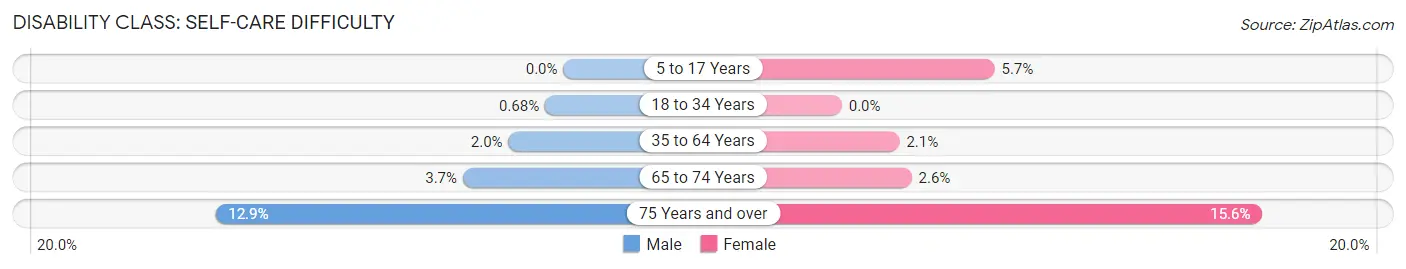
| Age Bracket | Male | Female |
| 5 to 17 Years | 0 (0.0%) | 90 (5.7%) |
| 18 to 34 Years | 19 (0.7%) | 0 (0.0%) |
| 35 to 64 Years | 112 (2.0%) | 129 (2.1%) |
| 65 to 74 Years | 61 (3.7%) | 44 (2.6%) |
| 75 Years and over | 127 (12.9%) | 222 (15.6%) |
Technology Access in Monroeville
Computing Device Access in Monroeville
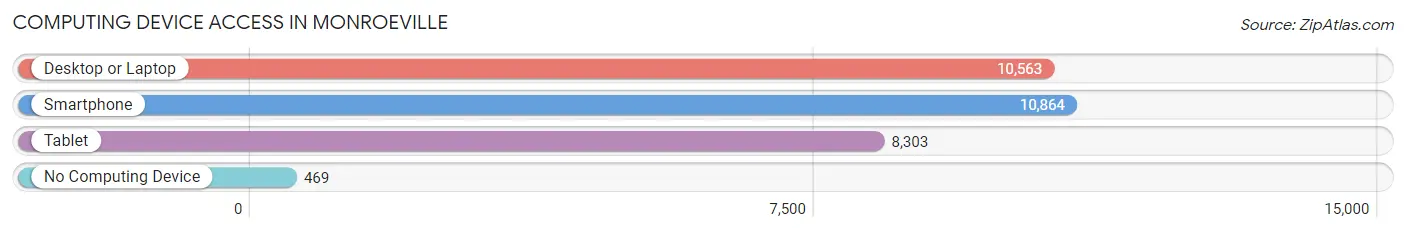
| Device Type | # Households | % Households |
| Desktop or Laptop | 10,563 | 85.5% |
| Smartphone | 10,864 | 88.0% |
| Tablet | 8,303 | 67.2% |
| No Computing Device | 469 | 3.8% |
| Total | 12,348 | 100.0% |
Internet Access in Monroeville
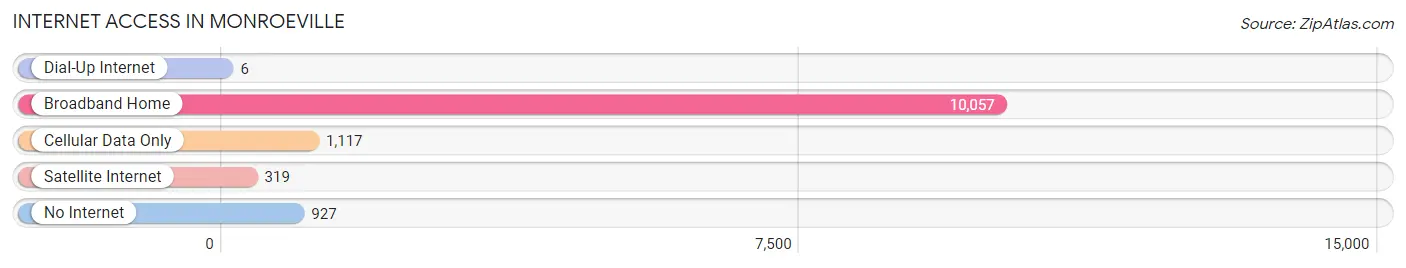
| Internet Type | # Households | % Households |
| Dial-Up Internet | 6 | 0.1% |
| Broadband Home | 10,057 | 81.5% |
| Cellular Data Only | 1,117 | 9.0% |
| Satellite Internet | 319 | 2.6% |
| No Internet | 927 | 7.5% |
| Total | 12,348 | 100.0% |
Monroeville Summary
Monroeville, Pennsylvania is a borough located in Allegheny County, Pennsylvania, United States. It is a suburb of Pittsburgh, located about 12 miles east of the city. The population of Monroeville was 28,386 at the 2010 census.
History
Monroeville was founded in 1788 by William and John Montooth, who named the town after their father, James Monroe. The town was originally a farming community, but it began to grow in the late 19th century when the Pennsylvania Railroad was built through the area. The railroad brought new industry and jobs to the area, and the population of Monroeville began to grow.
In the early 20th century, Monroeville was a popular destination for wealthy Pittsburgh residents who wanted to escape the city. The town was known for its large estates and luxurious homes.
In the 1950s, Monroeville began to experience rapid growth as the city of Pittsburgh expanded. The population of Monroeville increased from 4,000 in 1950 to 28,386 in 2010.
Geography
Monroeville is located in Allegheny County, Pennsylvania, about 12 miles east of Pittsburgh. The borough is bordered by the municipalities of Plum, Wilkins Township, and Pitcairn. Monroeville is located in the Allegheny Plateau region of Pennsylvania, and the terrain is mostly hilly.
The borough covers an area of 10.3 square miles, and the elevation ranges from 890 to 1,100 feet above sea level. The climate is humid continental, with cold winters and hot, humid summers.
Economy
Monroeville is a major commercial center in the Pittsburgh metropolitan area. The borough is home to several large shopping malls, including the Monroeville Mall, Miracle Mile Shopping Center, and Monroeville Towne Center.
The borough is also home to several corporate headquarters, including the headquarters of the Giant Eagle supermarket chain. Other major employers in Monroeville include UPMC East, UPMC St. Margaret, and the Monroeville Fire Department.
Demographics
As of the 2010 census, the population of Monroeville was 28,386. The racial makeup of the borough was 79.3% White, 14.2% African American, 0.2% Native American, 3.2% Asian, and 3.1% from other races.
The median household income in Monroeville was $50,945 in 2010. The median age of the borough's population was 42.7 years.
Monroeville is served by the Gateway School District and the Plum Borough School District. The borough is also home to several private schools, including the Monroeville Montessori School and the Monroeville Christian Academy.
Common Questions
What is Per Capita Income in Monroeville?
Per Capita income in Monroeville is $44,110.
What is the Median Family Income in Monroeville?
Median Family Income in Monroeville is $98,229.
What is the Median Household income in Monroeville?
Median Household Income in Monroeville is $80,625.
What is Income or Wage Gap in Monroeville?
Income or Wage Gap in Monroeville is 18.5%.
Women in Monroeville earn 81.5 cents for every dollar earned by a man.
What is Inequality or Gini Index in Monroeville?
Inequality or Gini Index in Monroeville is 0.41.
What is the Total Population of Monroeville?
Total Population of Monroeville is 28,517.
What is the Total Male Population of Monroeville?
Total Male Population of Monroeville is 13,898.
What is the Total Female Population of Monroeville?
Total Female Population of Monroeville is 14,619.
What is the Ratio of Males per 100 Females in Monroeville?
There are 95.07 Males per 100 Females in Monroeville.
What is the Ratio of Females per 100 Males in Monroeville?
There are 105.19 Females per 100 Males in Monroeville.
What is the Median Population Age in Monroeville?
Median Population Age in Monroeville is 44.8 Years.
What is the Average Family Size in Monroeville
Average Family Size in Monroeville is 2.9 People.
What is the Average Household Size in Monroeville
Average Household Size in Monroeville is 2.3 People.
How Large is the Labor Force in Monroeville?
There are 15,541 People in the Labor Forcein in Monroeville.
What is the Percentage of People in the Labor Force in Monroeville?
64.6% of People are in the Labor Force in Monroeville.
What is the Unemployment Rate in Monroeville?
Unemployment Rate in Monroeville is 4.8%.