Newmanstown, PA Map & Demographics
Newmanstown Map
Newmanstown Overview
$36,166
PER CAPITA INCOME
$87,456
AVG FAMILY INCOME
$86,099
AVG HOUSEHOLD INCOME
36.3%
WAGE / INCOME GAP [ % ]
63.7¢/ $1
WAGE / INCOME GAP [ $ ]
0.32
INEQUALITY / GINI INDEX
2,796
TOTAL POPULATION
1,411
MALE POPULATION
1,385
FEMALE POPULATION
101.88
MALES / 100 FEMALES
98.16
FEMALES / 100 MALES
40.7
MEDIAN AGE
2.9
AVG FAMILY SIZE
2.5
AVG HOUSEHOLD SIZE
1,508
LABOR FORCE [ PEOPLE ]
71.1%
PERCENT IN LABOR FORCE
Newmanstown Zip Codes
Newmanstown Area Codes
Income in Newmanstown
Income Overview in Newmanstown
Per Capita Income in Newmanstown is $36,166, while median incomes of families and households are $87,456 and $86,099 respectively.
| Characteristic | Number | Measure |
| Per Capita Income | 2,796 | $36,166 |
| Median Family Income | 813 | $87,456 |
| Mean Family Income | 813 | $100,290 |
| Median Household Income | 1,131 | $86,099 |
| Mean Household Income | 1,131 | $90,092 |
| Income Deficit | 813 | $0 |
| Wage / Income Gap (%) | 2,796 | 36.29% |
| Wage / Income Gap ($) | 2,796 | 63.71¢ per $1 |
| Gini / Inequality Index | 2,796 | 0.32 |
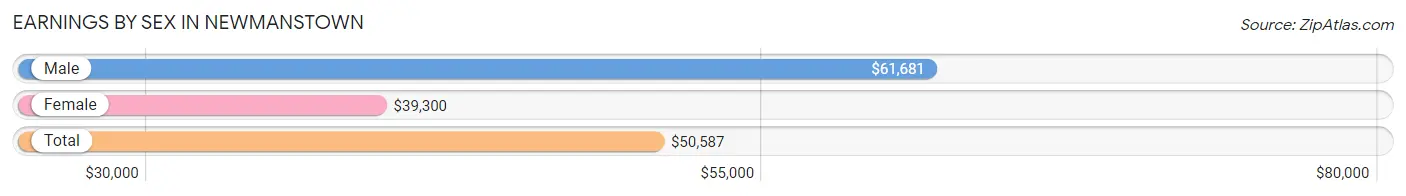
Earnings by Sex in Newmanstown
Average Earnings in Newmanstown are $50,587, $61,681 for men and $39,300 for women, a difference of 36.3%.
| Sex | Number | Average Earnings |
| Male | 763 (48.6%) | $61,681 |
| Female | 808 (51.4%) | $39,300 |
| Total | 1,571 (100.0%) | $50,587 |
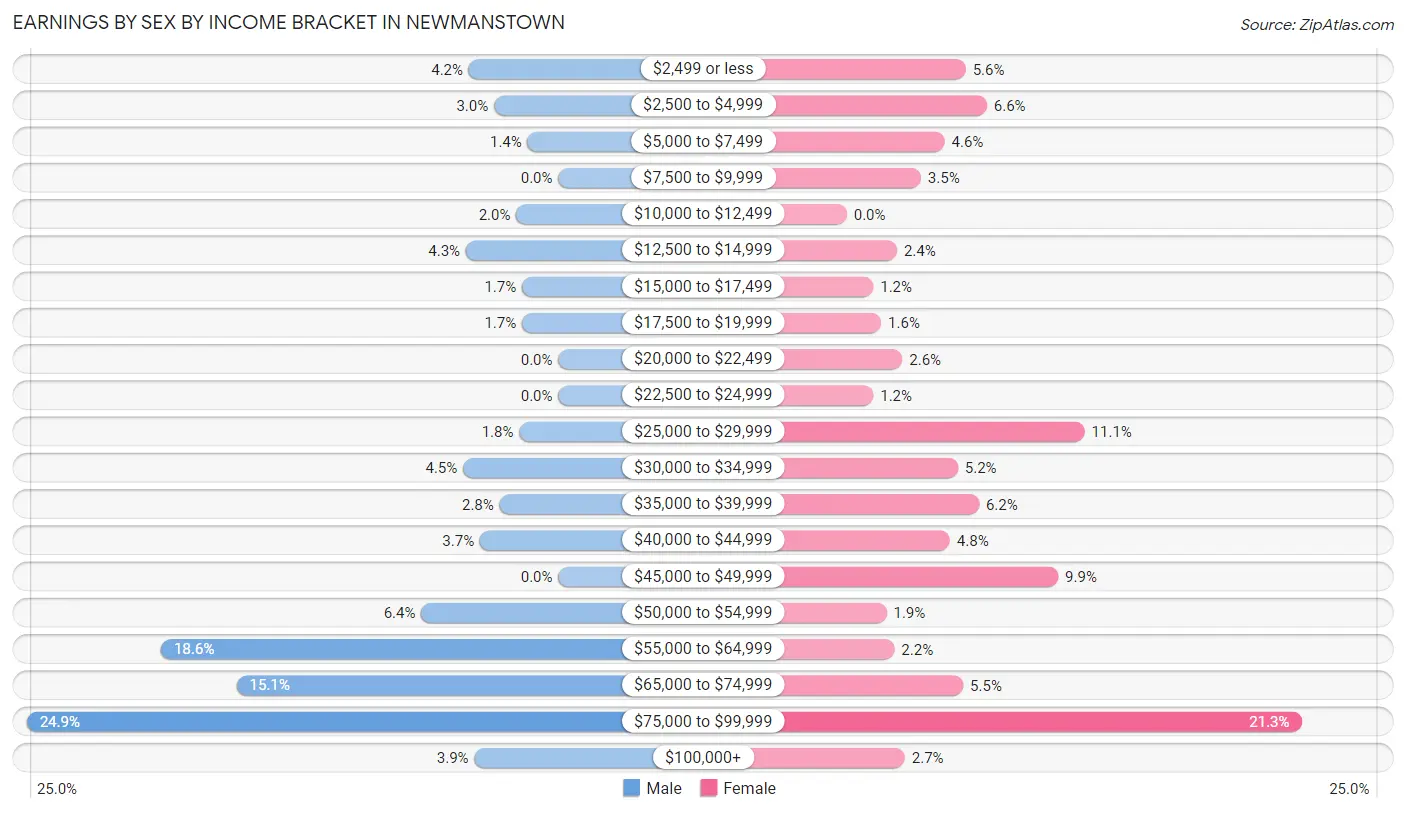
Earnings by Sex by Income Bracket in Newmanstown
The most common earnings brackets in Newmanstown are $75,000 to $99,999 for men (190 | 24.9%) and $75,000 to $99,999 for women (172 | 21.3%).
| Income | Male | Female |
| $2,499 or less | 32 (4.2%) | 45 (5.6%) |
| $2,500 to $4,999 | 23 (3.0%) | 53 (6.6%) |
| $5,000 to $7,499 | 11 (1.4%) | 37 (4.6%) |
| $7,500 to $9,999 | 0 (0.0%) | 28 (3.5%) |
| $10,000 to $12,499 | 15 (2.0%) | 0 (0.0%) |
| $12,500 to $14,999 | 33 (4.3%) | 19 (2.4%) |
| $15,000 to $17,499 | 13 (1.7%) | 10 (1.2%) |
| $17,500 to $19,999 | 13 (1.7%) | 13 (1.6%) |
| $20,000 to $22,499 | 0 (0.0%) | 21 (2.6%) |
| $22,500 to $24,999 | 0 (0.0%) | 10 (1.2%) |
| $25,000 to $29,999 | 14 (1.8%) | 90 (11.1%) |
| $30,000 to $34,999 | 34 (4.5%) | 42 (5.2%) |
| $35,000 to $39,999 | 21 (2.8%) | 50 (6.2%) |
| $40,000 to $44,999 | 28 (3.7%) | 39 (4.8%) |
| $45,000 to $49,999 | 0 (0.0%) | 80 (9.9%) |
| $50,000 to $54,999 | 49 (6.4%) | 15 (1.9%) |
| $55,000 to $64,999 | 142 (18.6%) | 18 (2.2%) |
| $65,000 to $74,999 | 115 (15.1%) | 44 (5.4%) |
| $75,000 to $99,999 | 190 (24.9%) | 172 (21.3%) |
| $100,000+ | 30 (3.9%) | 22 (2.7%) |
| Total | 763 (100.0%) | 808 (100.0%) |
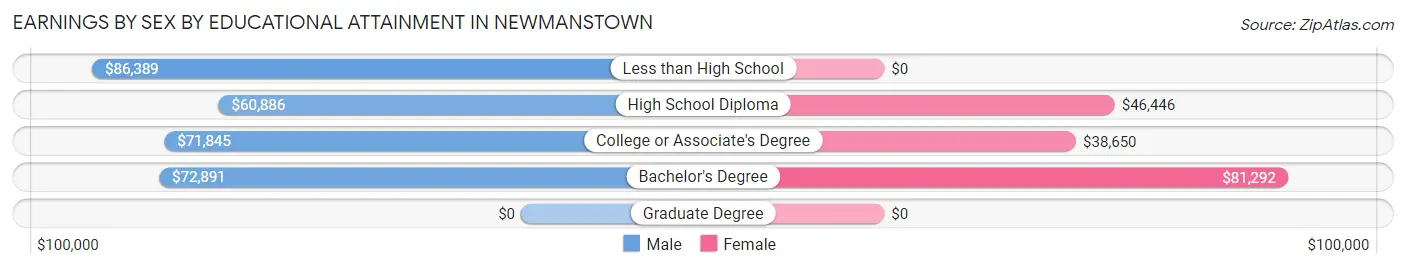
Earnings by Sex by Educational Attainment in Newmanstown
Average earnings in Newmanstown are $62,333 for men and $46,373 for women, a difference of 25.6%. Men with an educational attainment of less than high school enjoy the highest average annual earnings of $86,389, while those with high school diploma education earn the least with $60,886. Women with an educational attainment of bachelor's degree earn the most with the average annual earnings of $81,292, while those with college or associate's degree education have the smallest earnings of $38,650.
| Educational Attainment | Male Income | Female Income |
| Less than High School | $86,389 | $0 |
| High School Diploma | $60,886 | $46,446 |
| College or Associate's Degree | $71,845 | $38,650 |
| Bachelor's Degree | $72,891 | $81,292 |
| Graduate Degree | - | - |
| Total | $62,333 | $46,373 |
Family Income in Newmanstown
Family Income Brackets in Newmanstown
According to the Newmanstown family income data, there are 307 families falling into the $75,000 to $99,999 income range, which is the most common income bracket and makes up 37.8% of all families. Conversely, the $10,000 to $14,999 income bracket is the least frequent group with only 15 families (1.8%) belonging to this category.
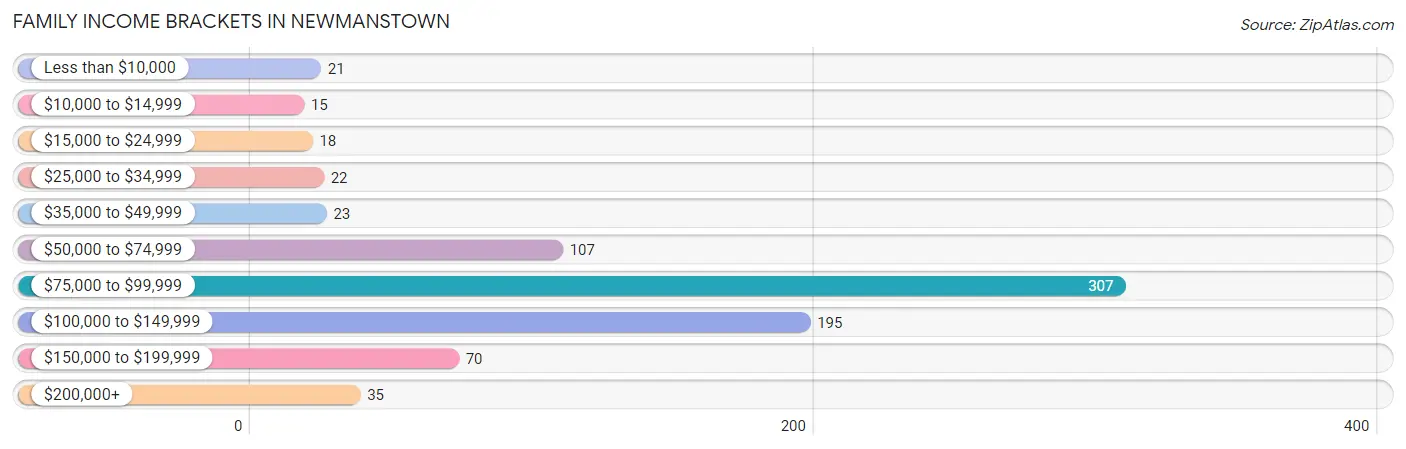
| Income Bracket | # Families | % Families |
| Less than $10,000 | 21 | 2.6% |
| $10,000 to $14,999 | 15 | 1.8% |
| $15,000 to $24,999 | 18 | 2.2% |
| $25,000 to $34,999 | 22 | 2.7% |
| $35,000 to $49,999 | 23 | 2.8% |
| $50,000 to $74,999 | 107 | 13.2% |
| $75,000 to $99,999 | 307 | 37.8% |
| $100,000 to $149,999 | 195 | 24.0% |
| $150,000 to $199,999 | 70 | 8.6% |
| $200,000+ | 35 | 4.3% |
Family Income by Famaliy Size in Newmanstown
5-person families (72 | 8.9%) account for the highest median family income in Newmanstown with $138,190 per family, while 2-person families (378 | 46.5%) have the highest median income of $43,231 per family member.
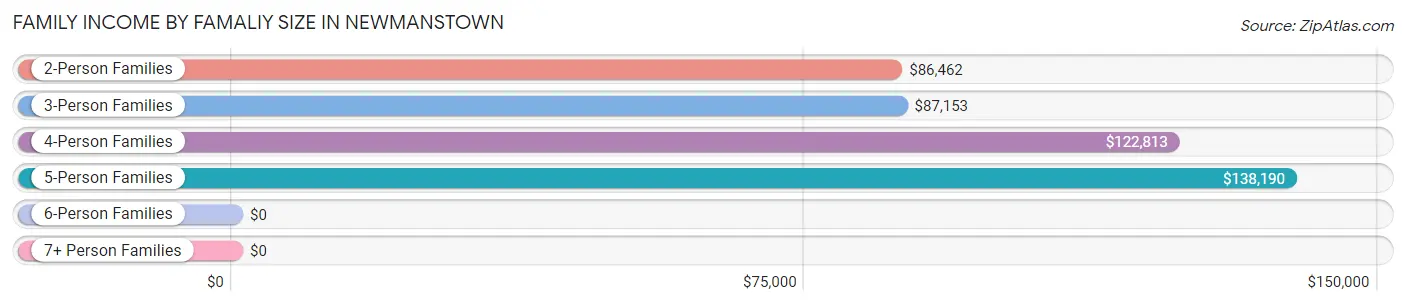
| Income Bracket | # Families | Median Income |
| 2-Person Families | 378 (46.5%) | $86,462 |
| 3-Person Families | 252 (31.0%) | $87,153 |
| 4-Person Families | 84 (10.3%) | $122,813 |
| 5-Person Families | 72 (8.9%) | $138,190 |
| 6-Person Families | 11 (1.3%) | $0 |
| 7+ Person Families | 16 (2.0%) | $0 |
| Total | 813 (100.0%) | $87,456 |
Family Income by Number of Earners in Newmanstown
The median family income in Newmanstown is $87,456, with families comprising 3+ earners (86) having the highest median family income of $121,429, while families with 1 earner (164) have the lowest median family income of $59,808, accounting for 10.6% and 20.2% of families, respectively.
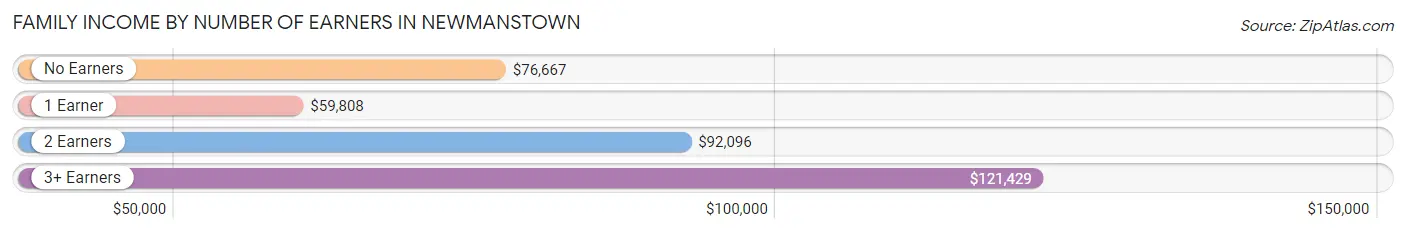
| Number of Earners | # Families | Median Income |
| No Earners | 82 (10.1%) | $76,667 |
| 1 Earner | 164 (20.2%) | $59,808 |
| 2 Earners | 481 (59.2%) | $92,096 |
| 3+ Earners | 86 (10.6%) | $121,429 |
| Total | 813 (100.0%) | $87,456 |
Household Income in Newmanstown
Household Income Brackets in Newmanstown
With 352 households falling in the category, the $75,000 to $99,999 income range is the most frequent in Newmanstown, accounting for 31.1% of all households. In contrast, only 7 households (0.6%) fall into the less than $10,000 income bracket, making it the least populous group.
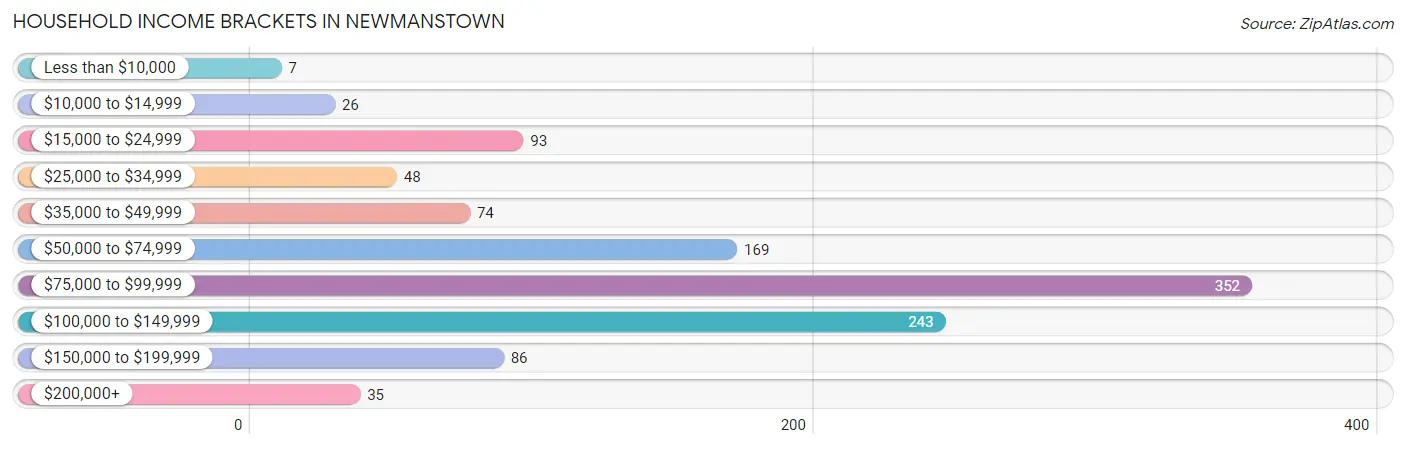
| Income Bracket | # Households | % Households |
| Less than $10,000 | 7 | 0.6% |
| $10,000 to $14,999 | 26 | 2.3% |
| $15,000 to $24,999 | 93 | 8.2% |
| $25,000 to $34,999 | 48 | 4.2% |
| $35,000 to $49,999 | 74 | 6.5% |
| $50,000 to $74,999 | 169 | 14.9% |
| $75,000 to $99,999 | 352 | 31.1% |
| $100,000 to $149,999 | 243 | 21.5% |
| $150,000 to $199,999 | 86 | 7.6% |
| $200,000+ | 35 | 3.1% |
Household Income by Householder Age in Newmanstown
The median household income in Newmanstown is $86,099, with the highest median household income of $111,172 found in the 25 to 44 years age bracket for the primary householder. A total of 243 households (21.5%) fall into this category. Meanwhile, the 65+ years age bracket for the primary householder has the lowest median household income of $51,275, with 311 households (27.5%) in this group.
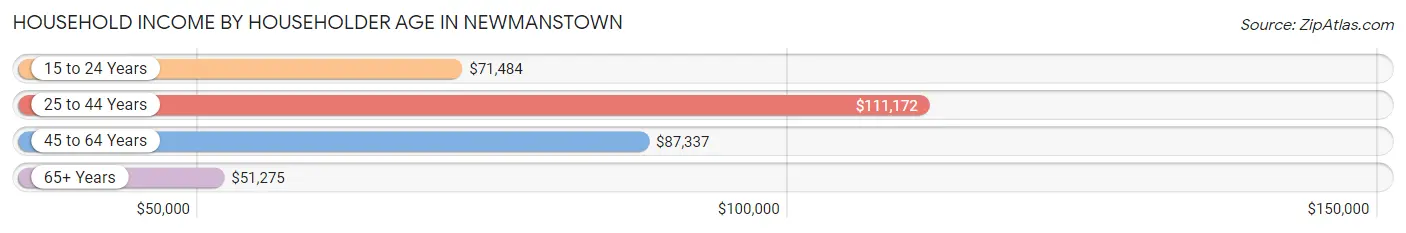
| Income Bracket | # Households | Median Income |
| 15 to 24 Years | 65 (5.8%) | $71,484 |
| 25 to 44 Years | 243 (21.5%) | $111,172 |
| 45 to 64 Years | 512 (45.3%) | $87,337 |
| 65+ Years | 311 (27.5%) | $51,275 |
| Total | 1,131 (100.0%) | $86,099 |
Poverty in Newmanstown
Income Below Poverty by Sex and Age in Newmanstown
With 6.5% poverty level for males and 8.2% for females among the residents of Newmanstown, 5 year old males and under 5 year old females are the most vulnerable to poverty, with 16 males (50.0%) and 32 females (42.7%) in their respective age groups living below the poverty level.
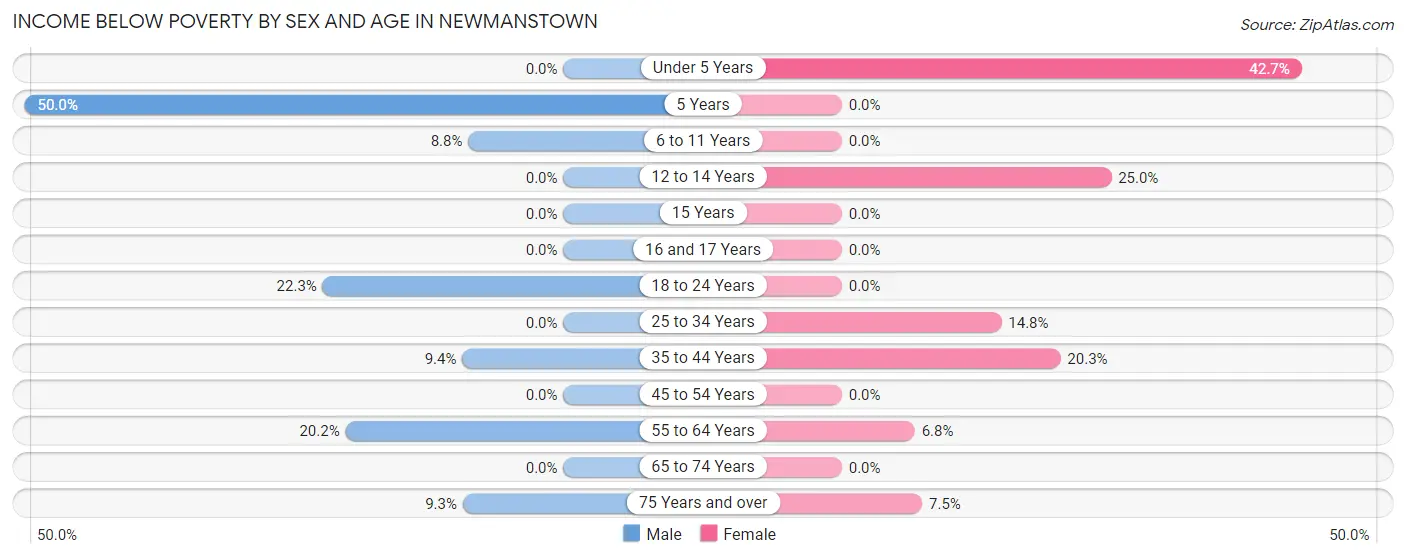
| Age Bracket | Male | Female |
| Under 5 Years | 0 (0.0%) | 32 (42.7%) |
| 5 Years | 16 (50.0%) | 0 (0.0%) |
| 6 to 11 Years | 15 (8.8%) | 0 (0.0%) |
| 12 to 14 Years | 0 (0.0%) | 16 (25.0%) |
| 15 Years | 0 (0.0%) | 0 (0.0%) |
| 16 and 17 Years | 0 (0.0%) | 0 (0.0%) |
| 18 to 24 Years | 21 (22.3%) | 0 (0.0%) |
| 25 to 34 Years | 0 (0.0%) | 12 (14.8%) |
| 35 to 44 Years | 15 (9.4%) | 28 (20.3%) |
| 45 to 54 Years | 0 (0.0%) | 0 (0.0%) |
| 55 to 64 Years | 18 (20.2%) | 18 (6.8%) |
| 65 to 74 Years | 0 (0.0%) | 0 (0.0%) |
| 75 Years and over | 7 (9.3%) | 7 (7.4%) |
| Total | 92 (6.5%) | 113 (8.2%) |
Income Above Poverty by Sex and Age in Newmanstown
According to the poverty statistics in Newmanstown, males aged under 5 years and females aged 6 to 11 years are the age groups that are most secure financially, with 100.0% of males and 100.0% of females in these age groups living above the poverty line.
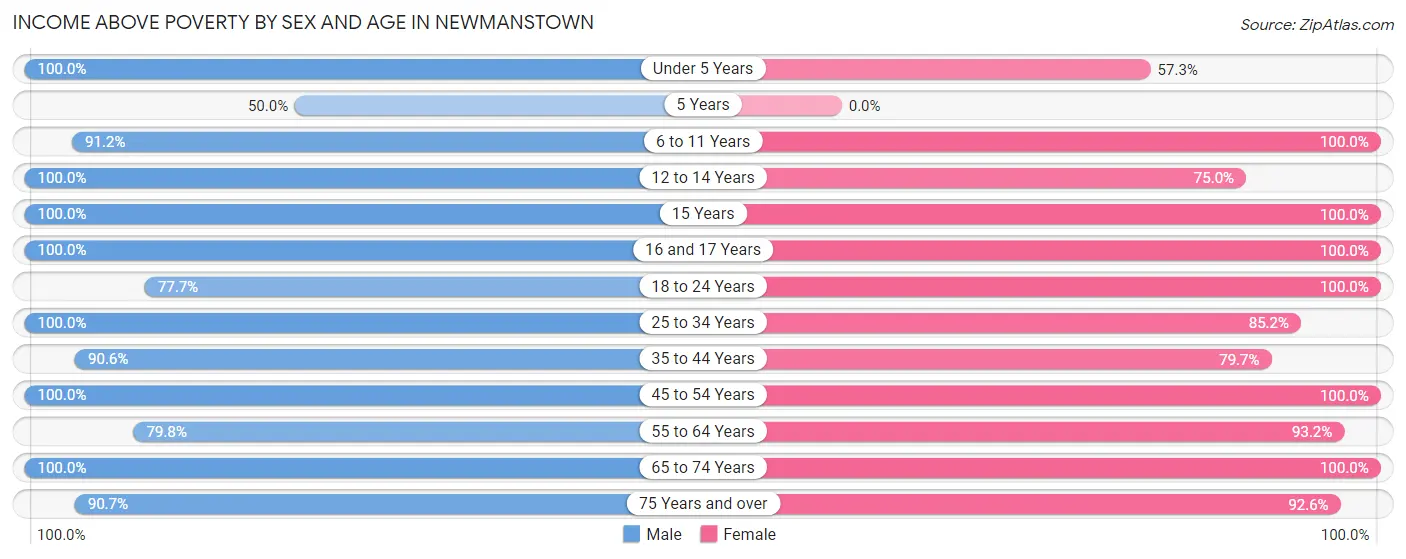
| Age Bracket | Male | Female |
| Under 5 Years | 41 (100.0%) | 43 (57.3%) |
| 5 Years | 16 (50.0%) | 0 (0.0%) |
| 6 to 11 Years | 155 (91.2%) | 65 (100.0%) |
| 12 to 14 Years | 179 (100.0%) | 48 (75.0%) |
| 15 Years | 32 (100.0%) | 17 (100.0%) |
| 16 and 17 Years | 32 (100.0%) | 129 (100.0%) |
| 18 to 24 Years | 73 (77.7%) | 78 (100.0%) |
| 25 to 34 Years | 112 (100.0%) | 69 (85.2%) |
| 35 to 44 Years | 145 (90.6%) | 110 (79.7%) |
| 45 to 54 Years | 283 (100.0%) | 264 (100.0%) |
| 55 to 64 Years | 71 (79.8%) | 248 (93.2%) |
| 65 to 74 Years | 112 (100.0%) | 114 (100.0%) |
| 75 Years and over | 68 (90.7%) | 87 (92.5%) |
| Total | 1,319 (93.5%) | 1,272 (91.8%) |
Income Below Poverty Among Married-Couple Families in Newmanstown
The poverty statistics for married-couple families in Newmanstown show that 7.0% or 40 of the total 574 families live below the poverty line. Families with 3 or 4 children have the highest poverty rate of 34.1%, comprising of 15 families. On the other hand, families with 1 or 2 children have the lowest poverty rate of 0.0%, which includes 0 families.
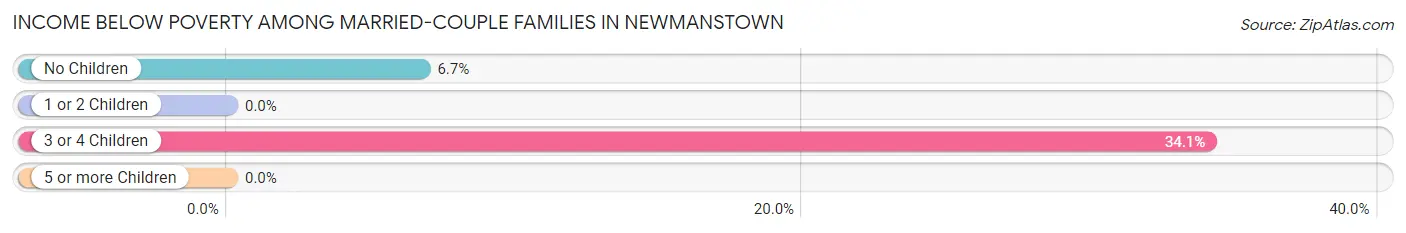
| Children | Above Poverty | Below Poverty |
| No Children | 348 (93.3%) | 25 (6.7%) |
| 1 or 2 Children | 141 (100.0%) | 0 (0.0%) |
| 3 or 4 Children | 29 (65.9%) | 15 (34.1%) |
| 5 or more Children | 16 (100.0%) | 0 (0.0%) |
| Total | 534 (93.0%) | 40 (7.0%) |
Income Below Poverty Among Single-Parent Households in Newmanstown
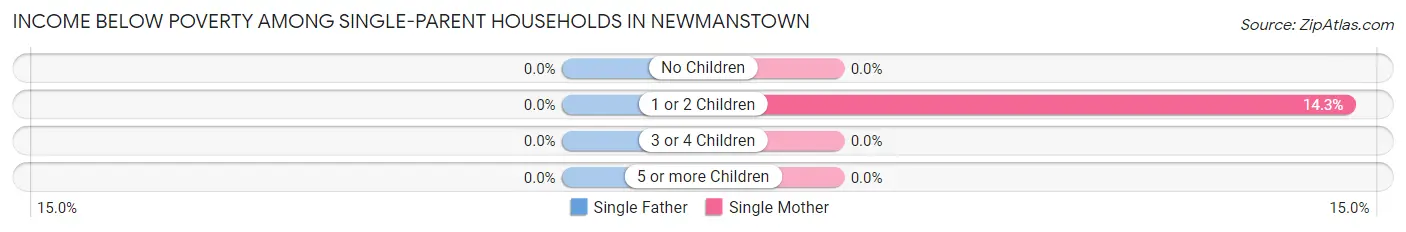
| Children | Single Father | Single Mother |
| No Children | 0 (0.0%) | 0 (0.0%) |
| 1 or 2 Children | 0 (0.0%) | 14 (14.3%) |
| 3 or 4 Children | 0 (0.0%) | 0 (0.0%) |
| 5 or more Children | 0 (0.0%) | 0 (0.0%) |
| Total | 0 (0.0%) | 14 (9.3%) |
Income Below Poverty Among Married-Couple vs Single-Parent Households in Newmanstown
The poverty data for Newmanstown shows that 40 of the married-couple family households (7.0%) and 14 of the single-parent households (5.9%) are living below the poverty level. Within the married-couple family households, those with 3 or 4 children have the highest poverty rate, with 15 households (34.1%) falling below the poverty line. Among the single-parent households, those with 1 or 2 children have the highest poverty rate, with 14 household (8.9%) living below poverty.
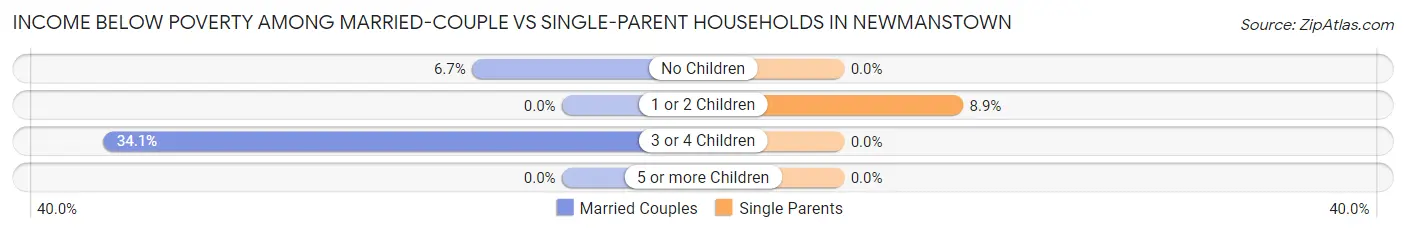
| Children | Married-Couple Families | Single-Parent Households |
| No Children | 25 (6.7%) | 0 (0.0%) |
| 1 or 2 Children | 0 (0.0%) | 14 (8.9%) |
| 3 or 4 Children | 15 (34.1%) | 0 (0.0%) |
| 5 or more Children | 0 (0.0%) | 0 (0.0%) |
| Total | 40 (7.0%) | 14 (5.9%) |
Race in Newmanstown
The most populous races in Newmanstown are White / Caucasian (2,446 | 87.5%), Two or more Races (171 | 6.1%), and Black / African American (123 | 4.4%).
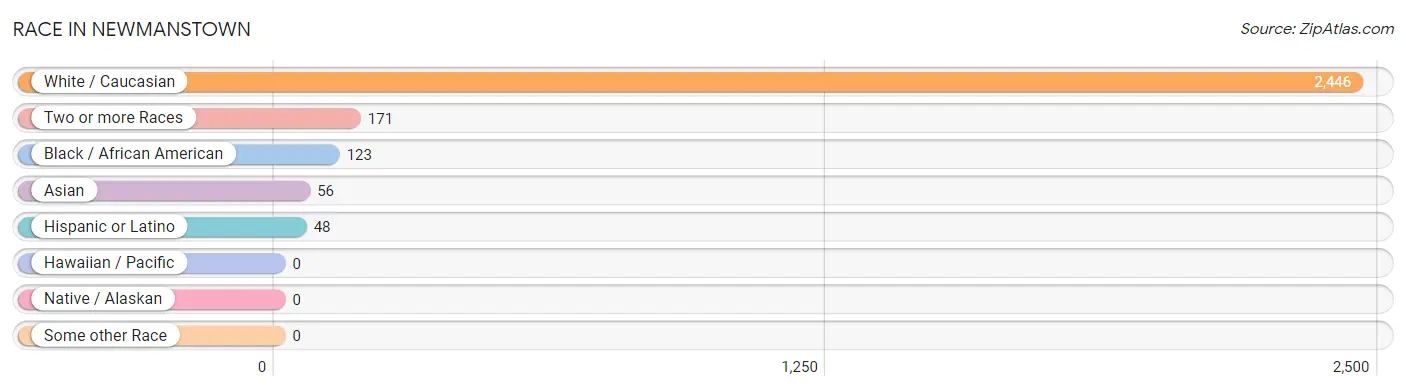
| Race | # Population | % Population |
| Asian | 56 | 2.0% |
| Black / African American | 123 | 4.4% |
| Hawaiian / Pacific | 0 | 0.0% |
| Hispanic or Latino | 48 | 1.7% |
| Native / Alaskan | 0 | 0.0% |
| White / Caucasian | 2,446 | 87.5% |
| Two or more Races | 171 | 6.1% |
| Some other Race | 0 | 0.0% |
| Total | 2,796 | 100.0% |
Ancestry in Newmanstown
The most populous ancestries reported in Newmanstown are German (1,048 | 37.5%), Irish (307 | 11.0%), English (277 | 9.9%), Italian (212 | 7.6%), and Swiss (161 | 5.8%), together accounting for 71.7% of all Newmanstown residents.
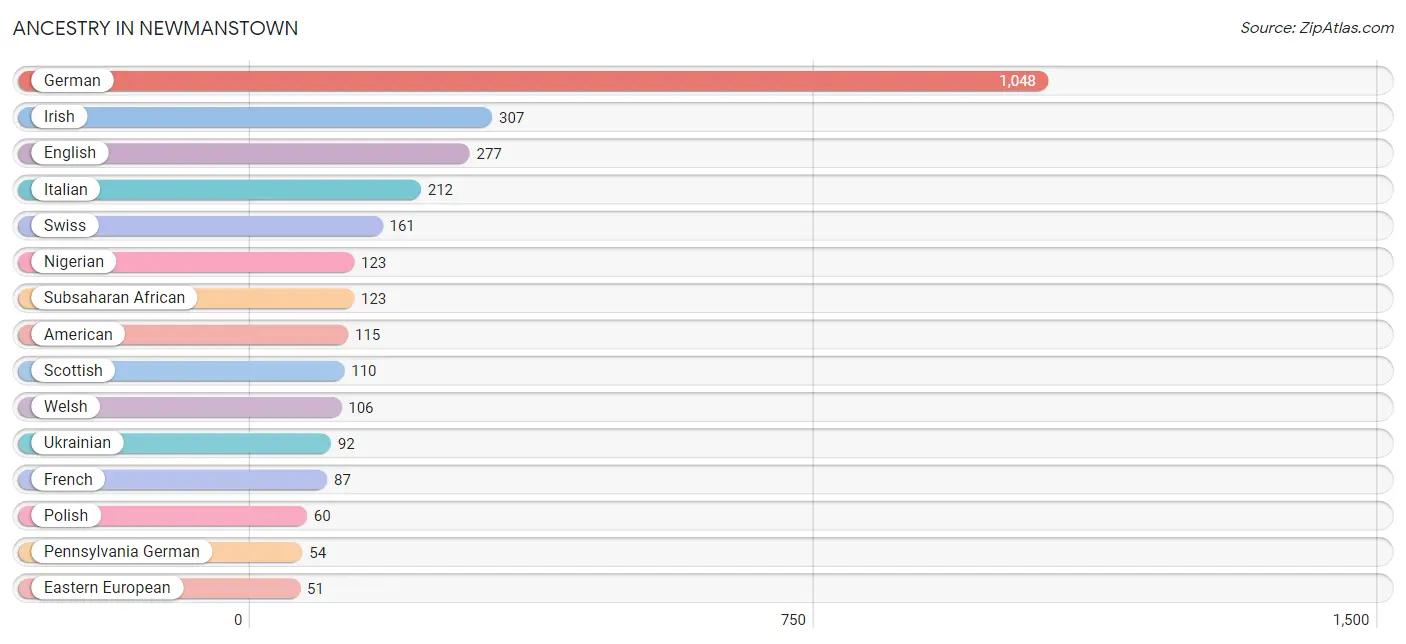
| Ancestry | # Population | % Population |
| American | 115 | 4.1% |
| Belgian | 7 | 0.3% |
| Czech | 12 | 0.4% |
| Dutch | 18 | 0.6% |
| Eastern European | 51 | 1.8% |
| English | 277 | 9.9% |
| French | 87 | 3.1% |
| German | 1,048 | 37.5% |
| Indian (Asian) | 31 | 1.1% |
| Irish | 307 | 11.0% |
| Italian | 212 | 7.6% |
| Korean | 42 | 1.5% |
| Nigerian | 123 | 4.4% |
| Pennsylvania German | 54 | 1.9% |
| Polish | 60 | 2.1% |
| Puerto Rican | 48 | 1.7% |
| Russian | 11 | 0.4% |
| Scottish | 110 | 3.9% |
| Sri Lankan | 45 | 1.6% |
| Subsaharan African | 123 | 4.4% |
| Swedish | 13 | 0.5% |
| Swiss | 161 | 5.8% |
| Ukrainian | 92 | 3.3% |
| Welsh | 106 | 3.8% | View All 24 Rows |
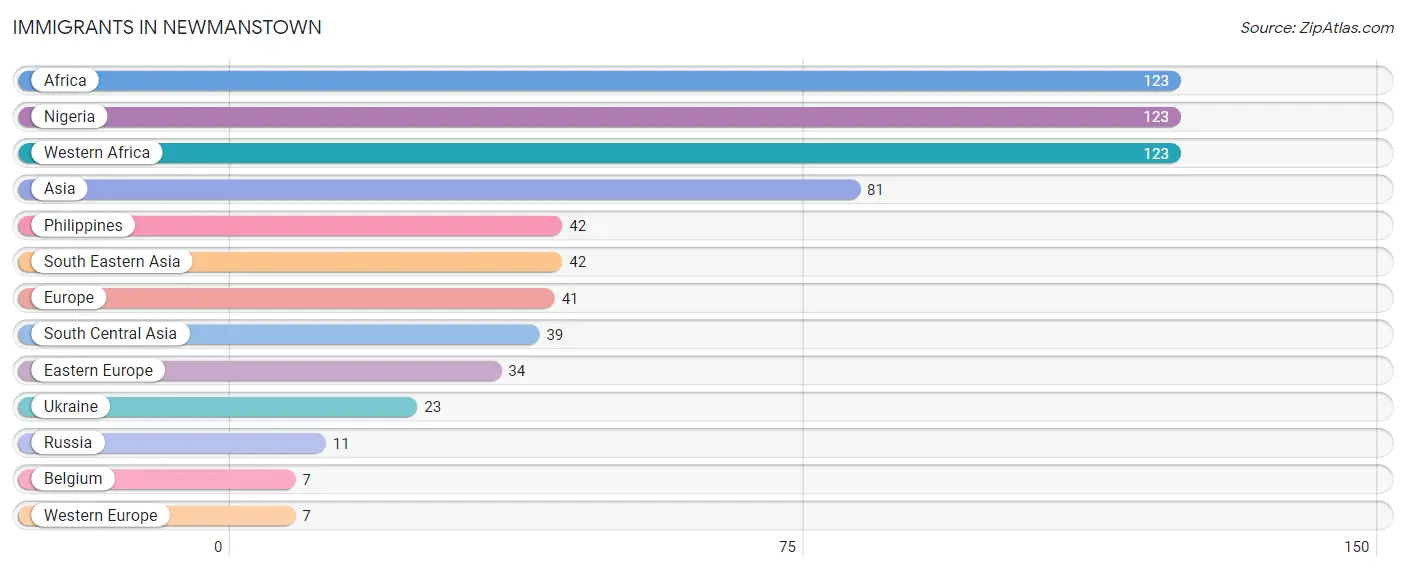
Immigrants in Newmanstown
The most numerous immigrant groups reported in Newmanstown came from Africa (123 | 4.4%), Nigeria (123 | 4.4%), Western Africa (123 | 4.4%), Asia (81 | 2.9%), and Philippines (42 | 1.5%), together accounting for 17.6% of all Newmanstown residents.
| Immigration Origin | # Population | % Population |
| Africa | 123 | 4.4% |
| Asia | 81 | 2.9% |
| Belgium | 7 | 0.3% |
| Eastern Europe | 34 | 1.2% |
| Europe | 41 | 1.5% |
| Nigeria | 123 | 4.4% |
| Philippines | 42 | 1.5% |
| Russia | 11 | 0.4% |
| South Central Asia | 39 | 1.4% |
| South Eastern Asia | 42 | 1.5% |
| Ukraine | 23 | 0.8% |
| Western Africa | 123 | 4.4% |
| Western Europe | 7 | 0.3% | View All 13 Rows |
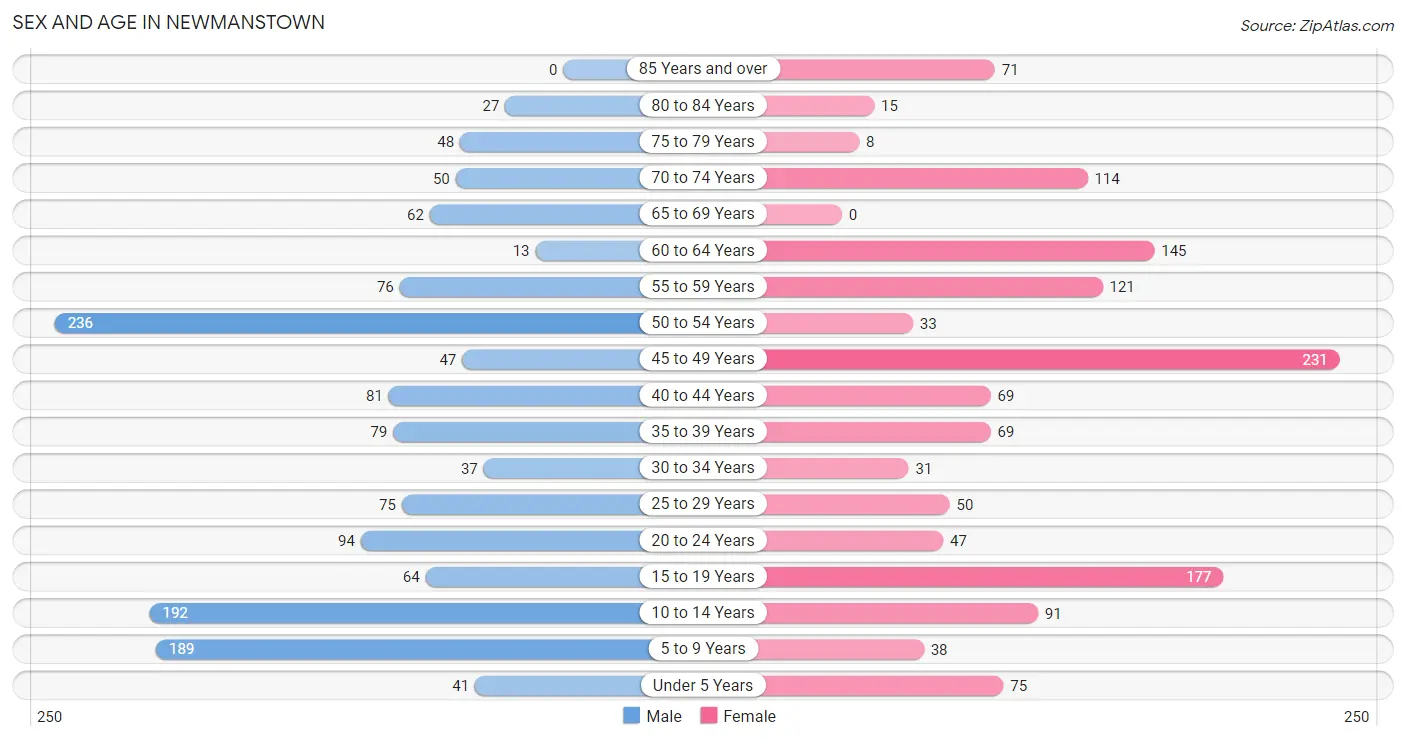
Sex and Age in Newmanstown
Sex and Age in Newmanstown
The most populous age groups in Newmanstown are 50 to 54 Years (236 | 16.7%) for men and 45 to 49 Years (231 | 16.7%) for women.
| Age Bracket | Male | Female |
| Under 5 Years | 41 (2.9%) | 75 (5.4%) |
| 5 to 9 Years | 189 (13.4%) | 38 (2.7%) |
| 10 to 14 Years | 192 (13.6%) | 91 (6.6%) |
| 15 to 19 Years | 64 (4.5%) | 177 (12.8%) |
| 20 to 24 Years | 94 (6.7%) | 47 (3.4%) |
| 25 to 29 Years | 75 (5.3%) | 50 (3.6%) |
| 30 to 34 Years | 37 (2.6%) | 31 (2.2%) |
| 35 to 39 Years | 79 (5.6%) | 69 (5.0%) |
| 40 to 44 Years | 81 (5.7%) | 69 (5.0%) |
| 45 to 49 Years | 47 (3.3%) | 231 (16.7%) |
| 50 to 54 Years | 236 (16.7%) | 33 (2.4%) |
| 55 to 59 Years | 76 (5.4%) | 121 (8.7%) |
| 60 to 64 Years | 13 (0.9%) | 145 (10.5%) |
| 65 to 69 Years | 62 (4.4%) | 0 (0.0%) |
| 70 to 74 Years | 50 (3.5%) | 114 (8.2%) |
| 75 to 79 Years | 48 (3.4%) | 8 (0.6%) |
| 80 to 84 Years | 27 (1.9%) | 15 (1.1%) |
| 85 Years and over | 0 (0.0%) | 71 (5.1%) |
| Total | 1,411 (100.0%) | 1,385 (100.0%) |
Families and Households in Newmanstown
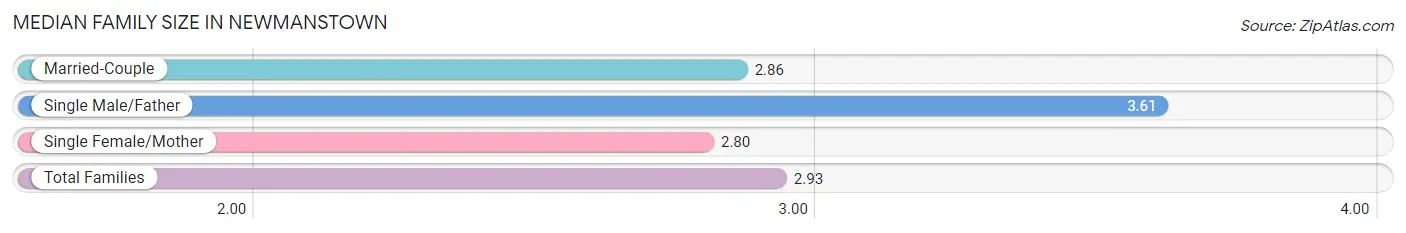
Median Family Size in Newmanstown
The median family size in Newmanstown is 2.93 persons per family, with single male/father families (88 | 10.8%) accounting for the largest median family size of 3.61 persons per family. On the other hand, single female/mother families (151 | 18.6%) represent the smallest median family size with 2.80 persons per family.
| Family Type | # Families | Family Size |
| Married-Couple | 574 (70.6%) | 2.86 |
| Single Male/Father | 88 (10.8%) | 3.61 |
| Single Female/Mother | 151 (18.6%) | 2.80 |
| Total Families | 813 (100.0%) | 2.93 |
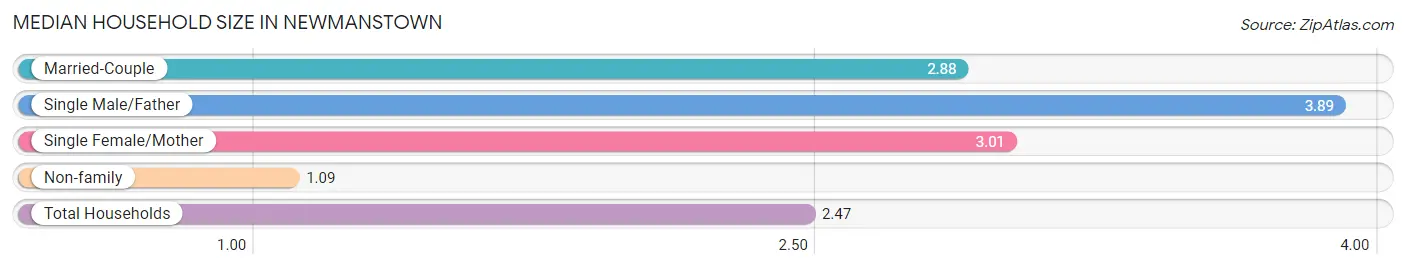
Median Household Size in Newmanstown
The median household size in Newmanstown is 2.47 persons per household, with single male/father households (88 | 7.8%) accounting for the largest median household size of 3.89 persons per household. non-family households (318 | 28.1%) represent the smallest median household size with 1.09 persons per household.
| Household Type | # Households | Household Size |
| Married-Couple | 574 (50.7%) | 2.88 |
| Single Male/Father | 88 (7.8%) | 3.89 |
| Single Female/Mother | 151 (13.4%) | 3.01 |
| Non-family | 318 (28.1%) | 1.09 |
| Total Households | 1,131 (100.0%) | 2.47 |
Household Size by Marriage Status in Newmanstown
Out of a total of 1,131 households in Newmanstown, 813 (71.9%) are family households, while 318 (28.1%) are nonfamily households. The most numerous type of family households are 2-person households, comprising 378, and the most common type of nonfamily households are 1-person households, comprising 289.
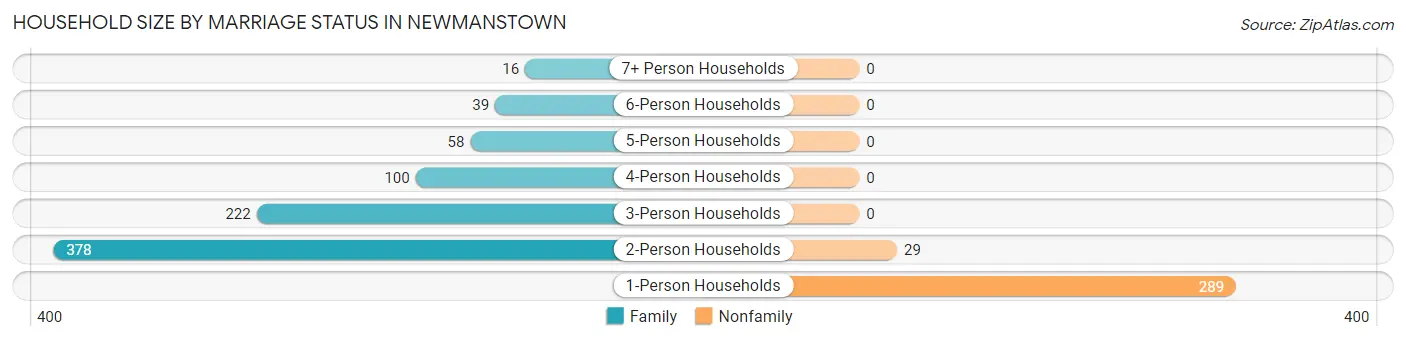
| Household Size | Family Households | Nonfamily Households |
| 1-Person Households | - | 289 (25.6%) |
| 2-Person Households | 378 (33.4%) | 29 (2.6%) |
| 3-Person Households | 222 (19.6%) | 0 (0.0%) |
| 4-Person Households | 100 (8.8%) | 0 (0.0%) |
| 5-Person Households | 58 (5.1%) | 0 (0.0%) |
| 6-Person Households | 39 (3.5%) | 0 (0.0%) |
| 7+ Person Households | 16 (1.4%) | 0 (0.0%) |
| Total | 813 (71.9%) | 318 (28.1%) |
Female Fertility in Newmanstown
Fertility by Age in Newmanstown
Average fertility rate in Newmanstown is 39.0 births per 1,000 women. Women in the age bracket of 20 to 34 years have the highest fertility rate with 203.0 births per 1,000 women. Women in the age bracket of 20 to 34 years acount for 100.0% of all women with births.
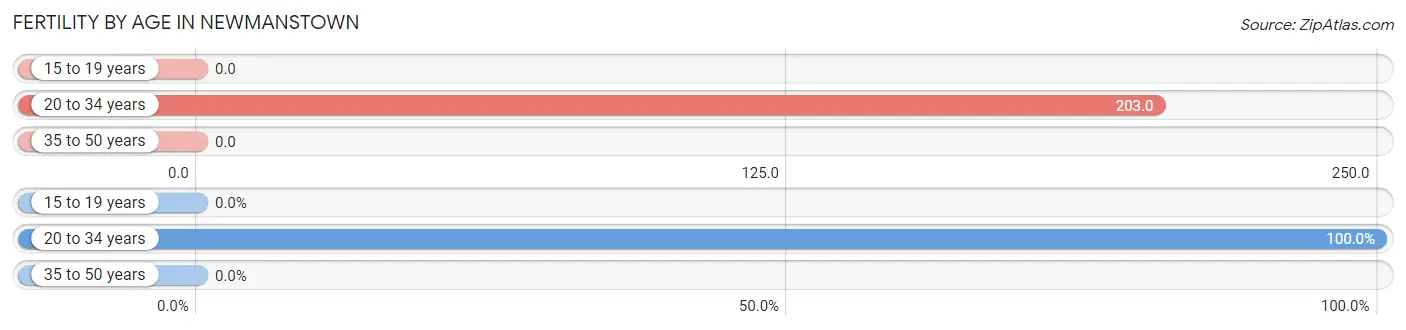
| Age Bracket | Women with Births | Births / 1,000 Women |
| 15 to 19 years | 0 (0.0%) | 0.0 |
| 20 to 34 years | 26 (100.0%) | 203.0 |
| 35 to 50 years | 0 (0.0%) | 0.0 |
| Total | 26 (100.0%) | 39.0 |
Fertility by Age by Marriage Status in Newmanstown
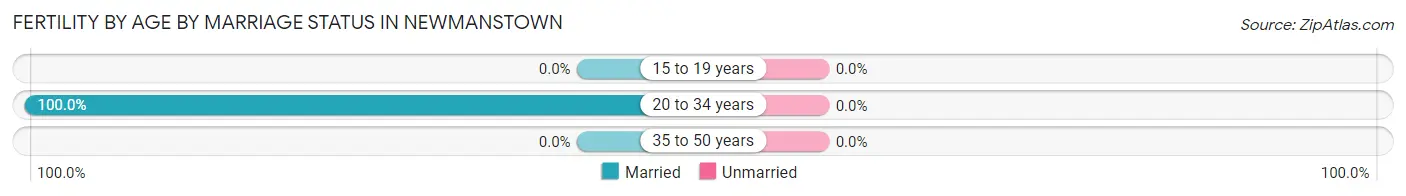
| Age Bracket | Married | Unmarried |
| 15 to 19 years | 0 (0.0%) | 0 (0.0%) |
| 20 to 34 years | 26 (100.0%) | 0 (0.0%) |
| 35 to 50 years | 0 (0.0%) | 0 (0.0%) |
| Total | 26 (100.0%) | 0 (0.0%) |
Fertility by Education in Newmanstown
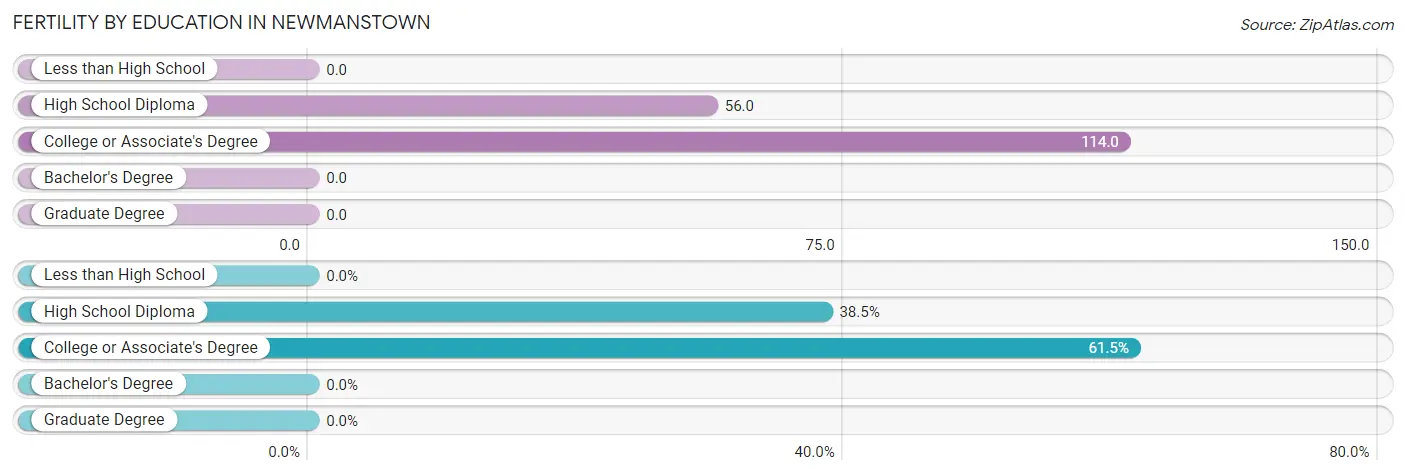
| Educational Attainment | Women with Births | Births / 1,000 Women |
| Less than High School | 0 (0.0%) | 0.0 |
| High School Diploma | 10 (38.5%) | 56.0 |
| College or Associate's Degree | 16 (61.5%) | 114.0 |
| Bachelor's Degree | 0 (0.0%) | 0.0 |
| Graduate Degree | 0 (0.0%) | 0.0 |
| Total | 26 (100.0%) | 39.0 |
Fertility by Education by Marriage Status in Newmanstown
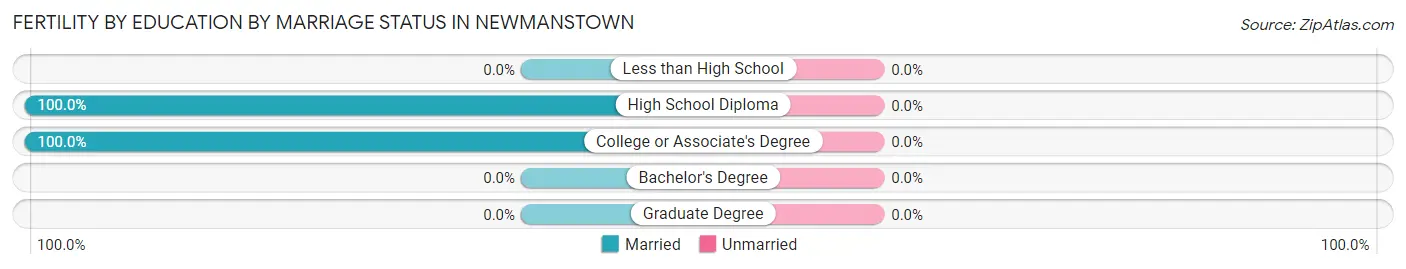
| Educational Attainment | Married | Unmarried |
| Less than High School | 0 (0.0%) | 0 (0.0%) |
| High School Diploma | 10 (100.0%) | 0 (0.0%) |
| College or Associate's Degree | 16 (100.0%) | 0 (0.0%) |
| Bachelor's Degree | 0 (0.0%) | 0 (0.0%) |
| Graduate Degree | 0 (0.0%) | 0 (0.0%) |
| Total | 26 (100.0%) | 0 (0.0%) |
Employment Characteristics in Newmanstown
Employment by Class of Employer in Newmanstown
Among the 1,496 employed individuals in Newmanstown, private company employees (954 | 63.8%), not-for-profit organizations (269 | 18.0%), and local government employees (116 | 7.7%) make up the most common classes of employment.
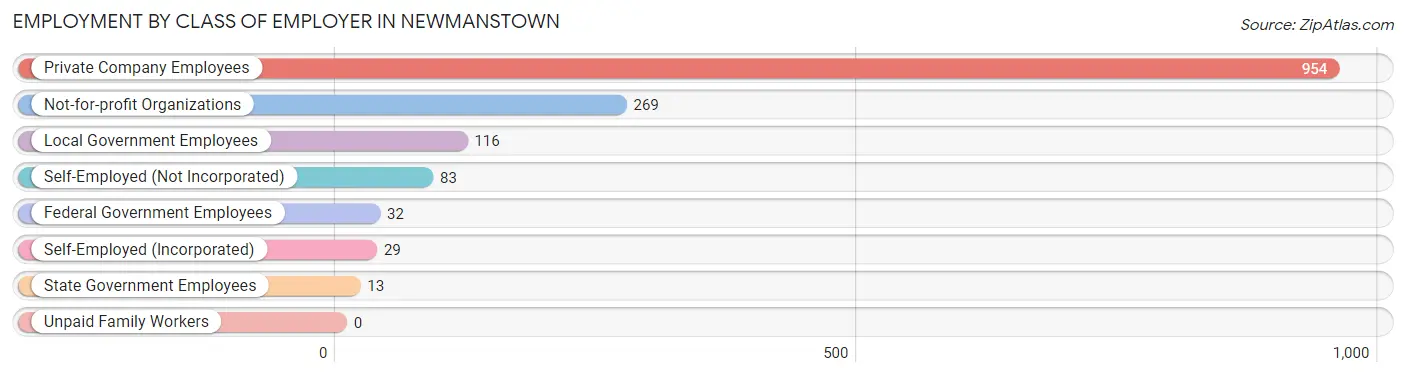
| Employer Class | # Employees | % Employees |
| Private Company Employees | 954 | 63.8% |
| Self-Employed (Incorporated) | 29 | 1.9% |
| Self-Employed (Not Incorporated) | 83 | 5.6% |
| Not-for-profit Organizations | 269 | 18.0% |
| Local Government Employees | 116 | 7.7% |
| State Government Employees | 13 | 0.9% |
| Federal Government Employees | 32 | 2.1% |
| Unpaid Family Workers | 0 | 0.0% |
| Total | 1,496 | 100.0% |
Employment Status by Age in Newmanstown
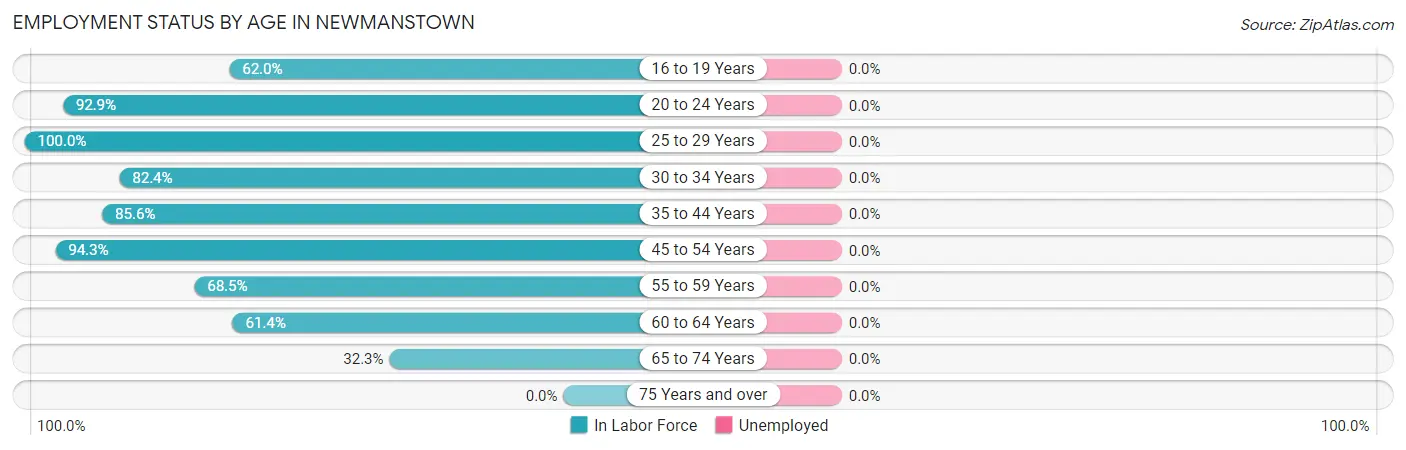
| Age Bracket | In Labor Force | Unemployed |
| 16 to 19 Years | 119 (62.0%) | 0 (0.0%) |
| 20 to 24 Years | 131 (92.9%) | 0 (0.0%) |
| 25 to 29 Years | 125 (100.0%) | 0 (0.0%) |
| 30 to 34 Years | 56 (82.4%) | 0 (0.0%) |
| 35 to 44 Years | 255 (85.6%) | 0 (0.0%) |
| 45 to 54 Years | 516 (94.3%) | 0 (0.0%) |
| 55 to 59 Years | 135 (68.5%) | 0 (0.0%) |
| 60 to 64 Years | 97 (61.4%) | 0 (0.0%) |
| 65 to 74 Years | 73 (32.3%) | 0 (0.0%) |
| 75 Years and over | 0 (0.0%) | 0 (0.0%) |
| Total | 1,508 (71.1%) | 0 (0.0%) |
Employment Status by Educational Attainment in Newmanstown
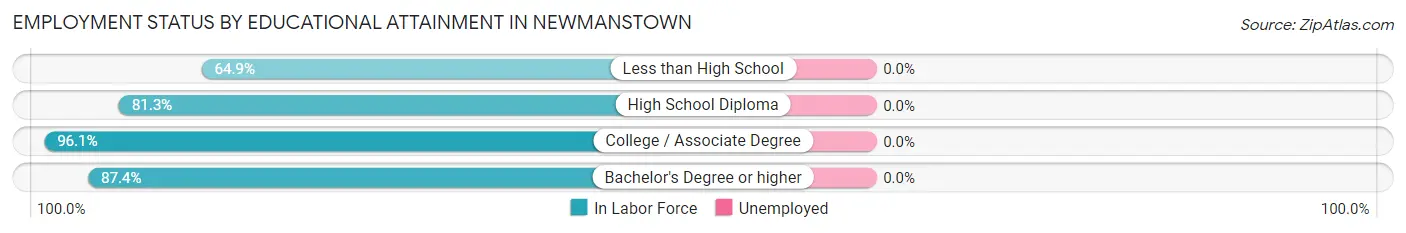
| Educational Attainment | In Labor Force | Unemployed |
| Less than High School | 63 (64.9%) | 0 (0.0%) |
| High School Diploma | 513 (81.3%) | 0 (0.0%) |
| College / Associate Degree | 297 (96.1%) | 0 (0.0%) |
| Bachelor's Degree or higher | 311 (87.4%) | 0 (0.0%) |
| Total | 1,184 (85.0%) | 0 (0.0%) |
Employment Occupations by Sex in Newmanstown
Management, Business, Science and Arts Occupations
The most common Management, Business, Science and Arts occupations in Newmanstown are Management (189 | 12.7%), Health Diagnosing & Treating (156 | 10.5%), Community & Social Service (128 | 8.6%), Health Technologists (127 | 8.5%), and Education Instruction & Library (116 | 7.8%).
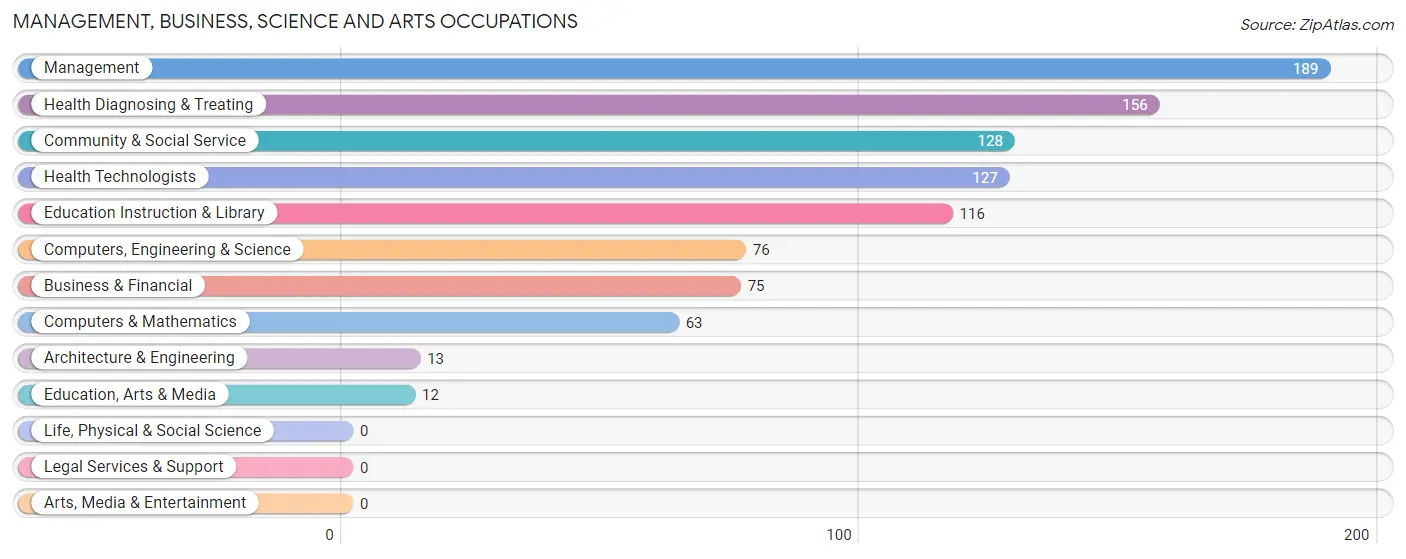
Management, Business, Science and Arts Occupations by Sex
Within the Management, Business, Science and Arts occupations in Newmanstown, the most male-oriented occupations are Architecture & Engineering (100.0%), Computers, Engineering & Science (72.4%), and Computers & Mathematics (66.7%), while the most female-oriented occupations are Education, Arts & Media (100.0%), Health Diagnosing & Treating (81.4%), and Health Technologists (77.2%).
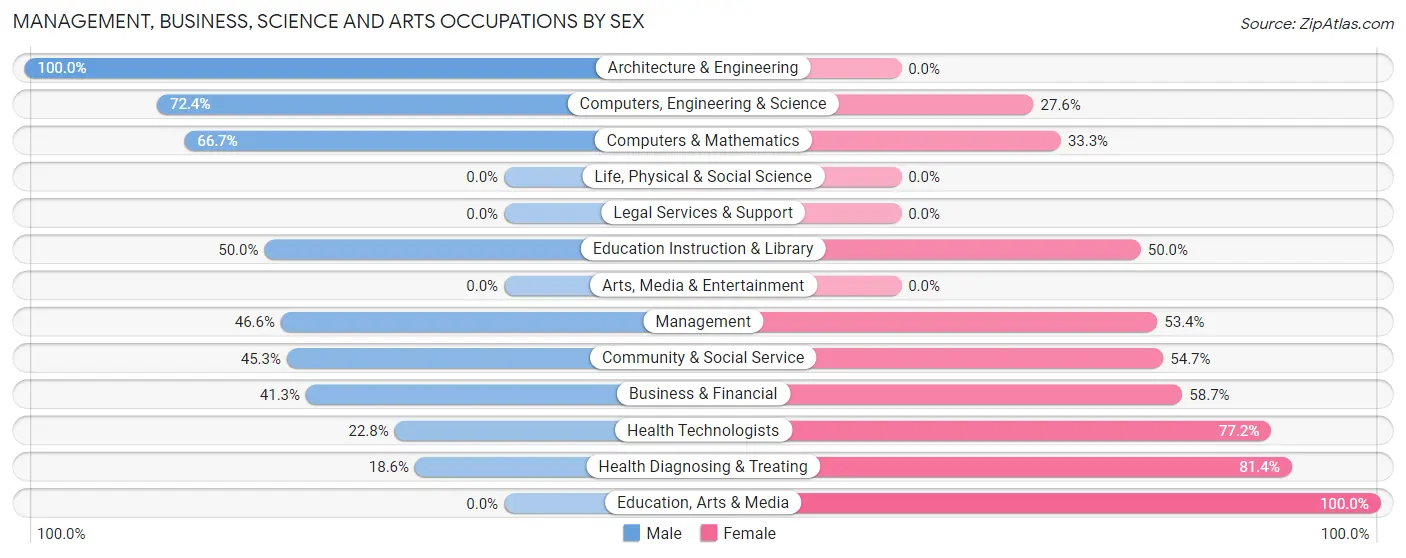
| Occupation | Male | Female |
| Management | 88 (46.6%) | 101 (53.4%) |
| Business & Financial | 31 (41.3%) | 44 (58.7%) |
| Computers, Engineering & Science | 55 (72.4%) | 21 (27.6%) |
| Computers & Mathematics | 42 (66.7%) | 21 (33.3%) |
| Architecture & Engineering | 13 (100.0%) | 0 (0.0%) |
| Life, Physical & Social Science | 0 (0.0%) | 0 (0.0%) |
| Community & Social Service | 58 (45.3%) | 70 (54.7%) |
| Education, Arts & Media | 0 (0.0%) | 12 (100.0%) |
| Legal Services & Support | 0 (0.0%) | 0 (0.0%) |
| Education Instruction & Library | 58 (50.0%) | 58 (50.0%) |
| Arts, Media & Entertainment | 0 (0.0%) | 0 (0.0%) |
| Health Diagnosing & Treating | 29 (18.6%) | 127 (81.4%) |
| Health Technologists | 29 (22.8%) | 98 (77.2%) |
| Total (Category) | 261 (41.8%) | 363 (58.2%) |
| Total (Overall) | 733 (49.2%) | 757 (50.8%) |
Services Occupations
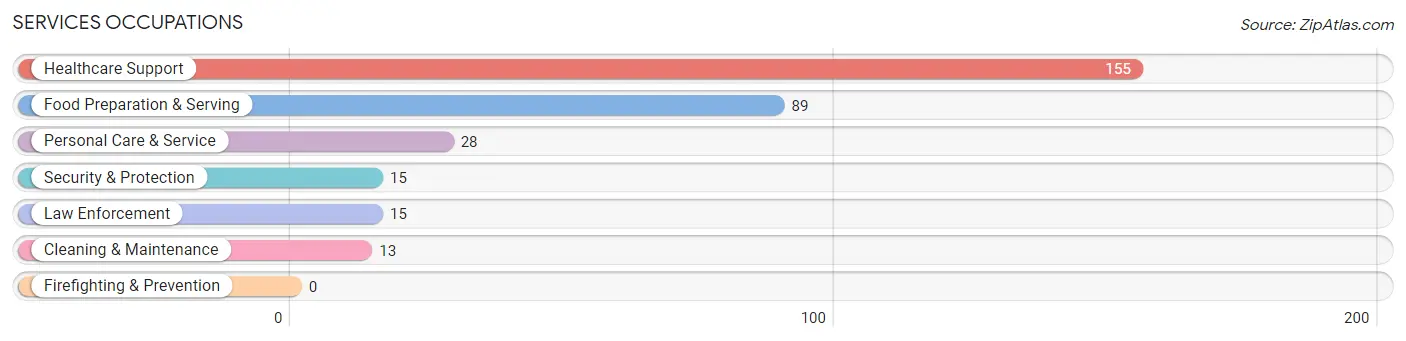
The most common Services occupations in Newmanstown are Healthcare Support (155 | 10.4%), Food Preparation & Serving (89 | 6.0%), Personal Care & Service (28 | 1.9%), Security & Protection (15 | 1.0%), and Law Enforcement (15 | 1.0%).
Services Occupations by Sex
Within the Services occupations in Newmanstown, the most male-oriented occupations are Security & Protection (100.0%), Law Enforcement (100.0%), and Cleaning & Maintenance (100.0%), while the most female-oriented occupations are Food Preparation & Serving (85.4%), Healthcare Support (78.1%), and Personal Care & Service (50.0%).
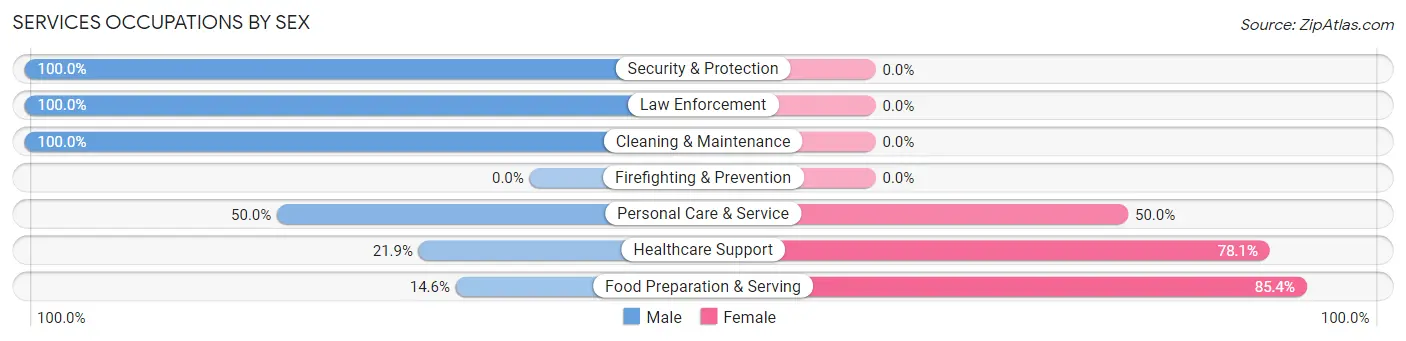
| Occupation | Male | Female |
| Healthcare Support | 34 (21.9%) | 121 (78.1%) |
| Security & Protection | 15 (100.0%) | 0 (0.0%) |
| Firefighting & Prevention | 0 (0.0%) | 0 (0.0%) |
| Law Enforcement | 15 (100.0%) | 0 (0.0%) |
| Food Preparation & Serving | 13 (14.6%) | 76 (85.4%) |
| Cleaning & Maintenance | 13 (100.0%) | 0 (0.0%) |
| Personal Care & Service | 14 (50.0%) | 14 (50.0%) |
| Total (Category) | 89 (29.7%) | 211 (70.3%) |
| Total (Overall) | 733 (49.2%) | 757 (50.8%) |
Sales and Office Occupations
The most common Sales and Office occupations in Newmanstown are Office & Administration (268 | 18.0%), and Sales & Related (65 | 4.4%).
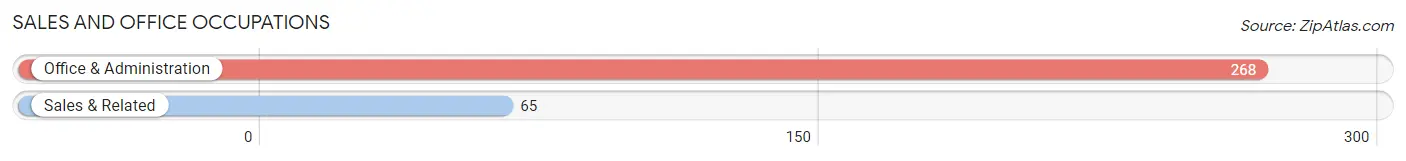
Sales and Office Occupations by Sex
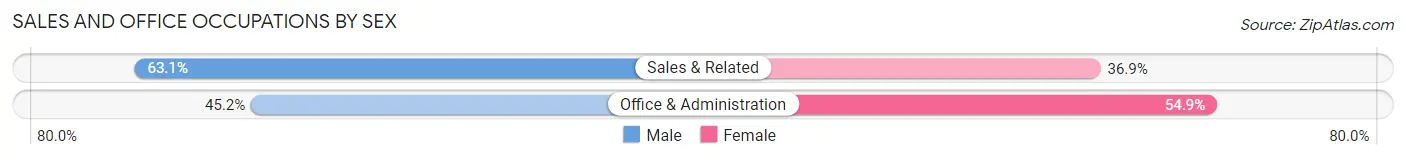
| Occupation | Male | Female |
| Sales & Related | 41 (63.1%) | 24 (36.9%) |
| Office & Administration | 121 (45.2%) | 147 (54.8%) |
| Total (Category) | 162 (48.6%) | 171 (51.3%) |
| Total (Overall) | 733 (49.2%) | 757 (50.8%) |
Natural Resources, Construction and Maintenance Occupations
The most common Natural Resources, Construction and Maintenance occupations in Newmanstown are Construction & Extraction (57 | 3.8%), and Installation, Maintenance & Repair (41 | 2.8%).
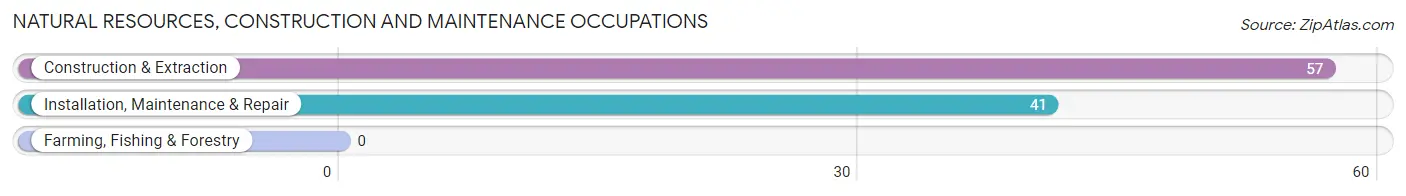
Natural Resources, Construction and Maintenance Occupations by Sex
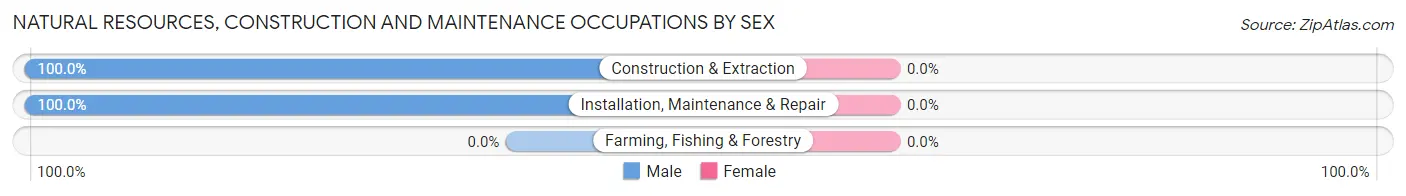
| Occupation | Male | Female |
| Farming, Fishing & Forestry | 0 (0.0%) | 0 (0.0%) |
| Construction & Extraction | 57 (100.0%) | 0 (0.0%) |
| Installation, Maintenance & Repair | 41 (100.0%) | 0 (0.0%) |
| Total (Category) | 98 (100.0%) | 0 (0.0%) |
| Total (Overall) | 733 (49.2%) | 757 (50.8%) |
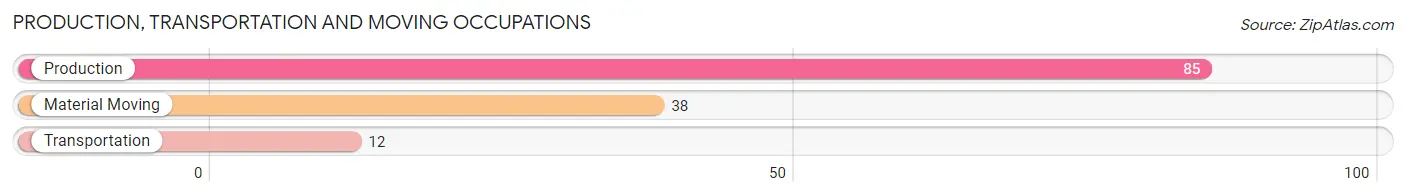
Production, Transportation and Moving Occupations
The most common Production, Transportation and Moving occupations in Newmanstown are Production (85 | 5.7%), Material Moving (38 | 2.5%), and Transportation (12 | 0.8%).
Production, Transportation and Moving Occupations by Sex
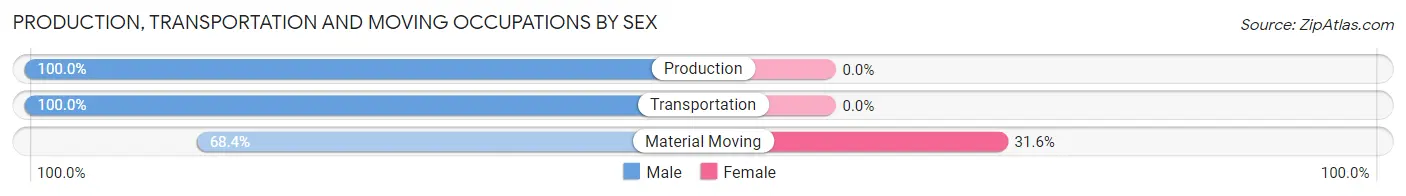
| Occupation | Male | Female |
| Production | 85 (100.0%) | 0 (0.0%) |
| Transportation | 12 (100.0%) | 0 (0.0%) |
| Material Moving | 26 (68.4%) | 12 (31.6%) |
| Total (Category) | 123 (91.1%) | 12 (8.9%) |
| Total (Overall) | 733 (49.2%) | 757 (50.8%) |
Employment Industries by Sex in Newmanstown
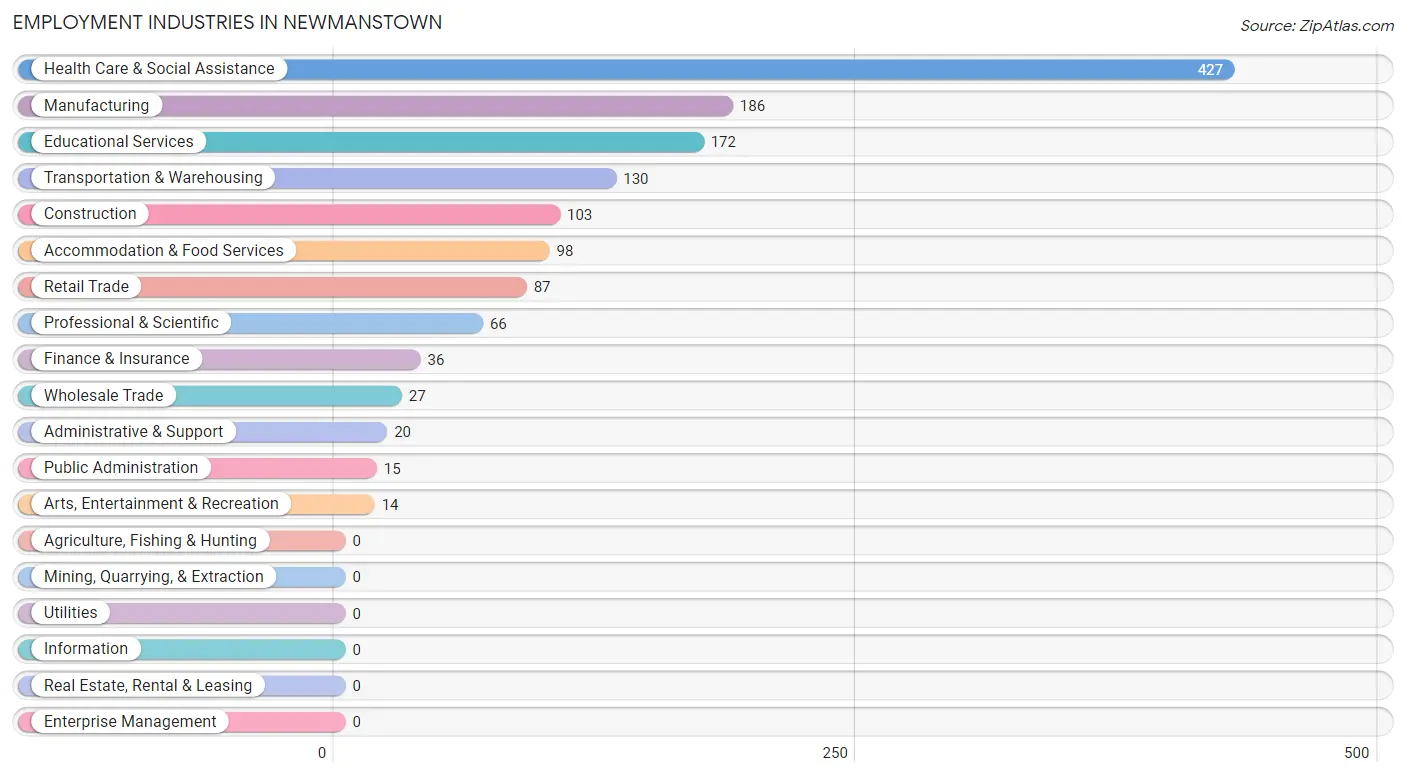
Employment Industries in Newmanstown
The major employment industries in Newmanstown include Health Care & Social Assistance (427 | 28.7%), Manufacturing (186 | 12.5%), Educational Services (172 | 11.5%), Transportation & Warehousing (130 | 8.7%), and Construction (103 | 6.9%).
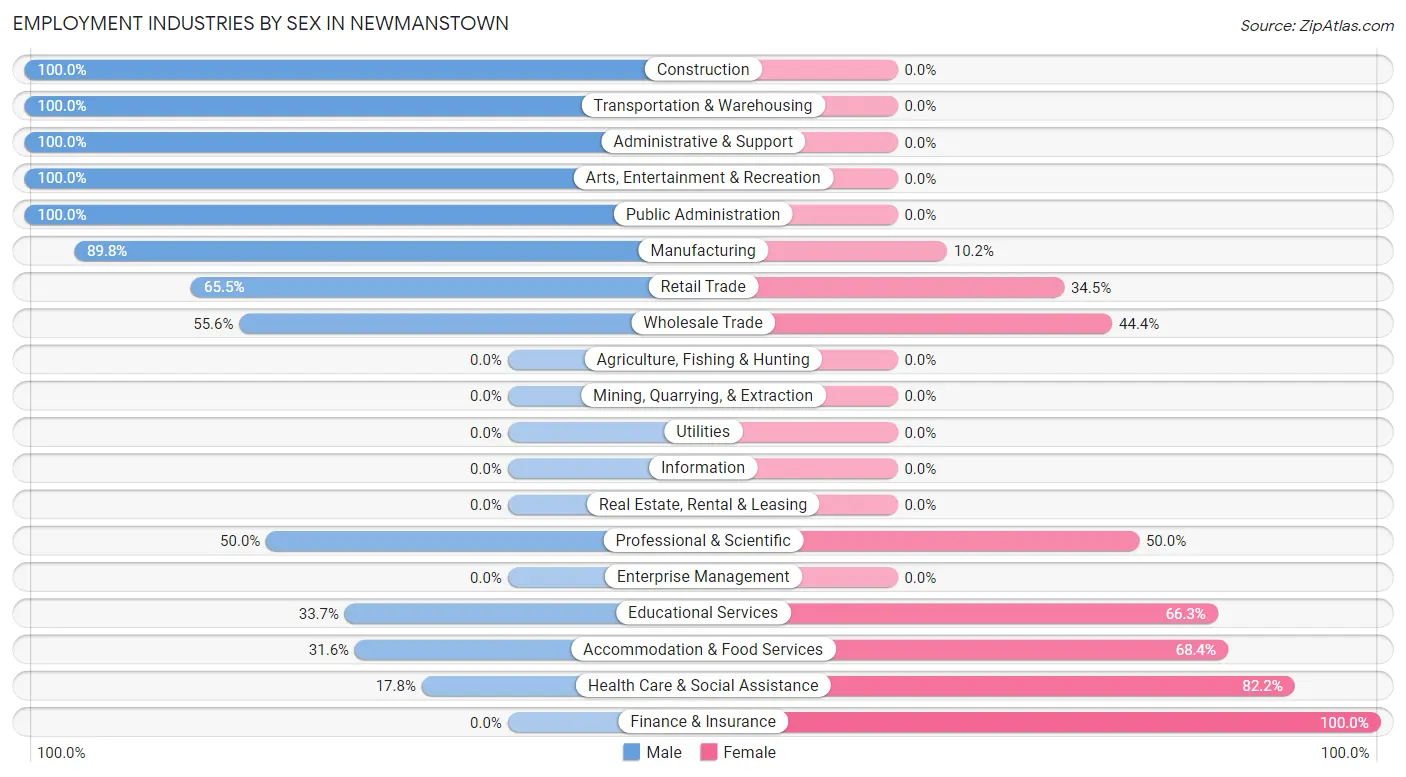
Employment Industries by Sex in Newmanstown
The Newmanstown industries that see more men than women are Construction (100.0%), Transportation & Warehousing (100.0%), and Administrative & Support (100.0%), whereas the industries that tend to have a higher number of women are Finance & Insurance (100.0%), Health Care & Social Assistance (82.2%), and Accommodation & Food Services (68.4%).
| Industry | Male | Female |
| Agriculture, Fishing & Hunting | 0 (0.0%) | 0 (0.0%) |
| Mining, Quarrying, & Extraction | 0 (0.0%) | 0 (0.0%) |
| Construction | 103 (100.0%) | 0 (0.0%) |
| Manufacturing | 167 (89.8%) | 19 (10.2%) |
| Wholesale Trade | 15 (55.6%) | 12 (44.4%) |
| Retail Trade | 57 (65.5%) | 30 (34.5%) |
| Transportation & Warehousing | 130 (100.0%) | 0 (0.0%) |
| Utilities | 0 (0.0%) | 0 (0.0%) |
| Information | 0 (0.0%) | 0 (0.0%) |
| Finance & Insurance | 0 (0.0%) | 36 (100.0%) |
| Real Estate, Rental & Leasing | 0 (0.0%) | 0 (0.0%) |
| Professional & Scientific | 33 (50.0%) | 33 (50.0%) |
| Enterprise Management | 0 (0.0%) | 0 (0.0%) |
| Administrative & Support | 20 (100.0%) | 0 (0.0%) |
| Educational Services | 58 (33.7%) | 114 (66.3%) |
| Health Care & Social Assistance | 76 (17.8%) | 351 (82.2%) |
| Arts, Entertainment & Recreation | 14 (100.0%) | 0 (0.0%) |
| Accommodation & Food Services | 31 (31.6%) | 67 (68.4%) |
| Public Administration | 15 (100.0%) | 0 (0.0%) |
| Total | 733 (49.2%) | 757 (50.8%) |
Education in Newmanstown
School Enrollment in Newmanstown
The most common levels of schooling among the 815 students in Newmanstown are high school (265 | 32.5%), middle school (213 | 26.1%), and elementary school (209 | 25.6%).
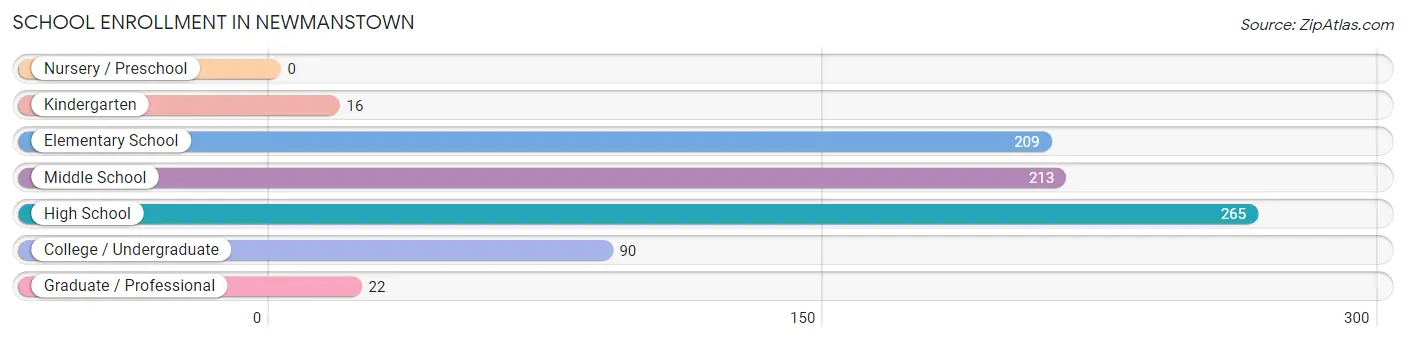
| School Level | # Students | % Students |
| Nursery / Preschool | 0 | 0.0% |
| Kindergarten | 16 | 2.0% |
| Elementary School | 209 | 25.6% |
| Middle School | 213 | 26.1% |
| High School | 265 | 32.5% |
| College / Undergraduate | 90 | 11.0% |
| Graduate / Professional | 22 | 2.7% |
| Total | 815 | 100.0% |
School Enrollment by Age by Funding Source in Newmanstown
Out of a total of 815 students who are enrolled in schools in Newmanstown, 144 (17.7%) attend a private institution, while the remaining 671 (82.3%) are enrolled in public schools. The age group of 35 years and over has the highest likelihood of being enrolled in private schools, with 64 (82.1% in the age bracket) enrolled. Conversely, the age group of 15 to 17 year olds has the lowest likelihood of being enrolled in a private school, with 198 (100.0% in the age bracket) attending a public institution.
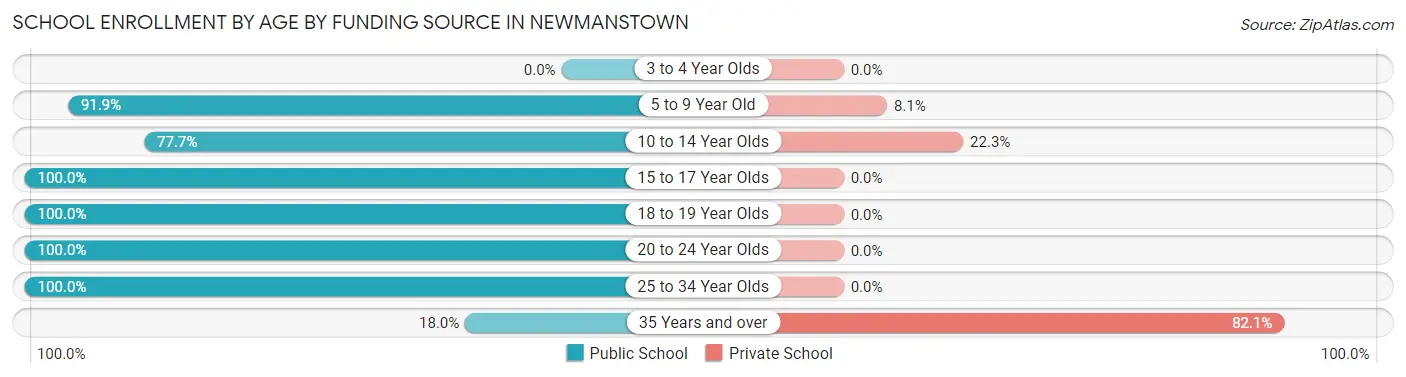
| Age Bracket | Public School | Private School |
| 3 to 4 Year Olds | 0 (0.0%) | 0 (0.0%) |
| 5 to 9 Year Old | 194 (91.9%) | 17 (8.1%) |
| 10 to 14 Year Olds | 220 (77.7%) | 63 (22.3%) |
| 15 to 17 Year Olds | 198 (100.0%) | 0 (0.0%) |
| 18 to 19 Year Olds | 11 (100.0%) | 0 (0.0%) |
| 20 to 24 Year Olds | 21 (100.0%) | 0 (0.0%) |
| 25 to 34 Year Olds | 13 (100.0%) | 0 (0.0%) |
| 35 Years and over | 14 (17.9%) | 64 (82.1%) |
| Total | 671 (82.3%) | 144 (17.7%) |
Educational Attainment by Field of Study in Newmanstown
Science & technology (93 | 22.7%), business (91 | 22.3%), education (74 | 18.1%), social sciences (35 | 8.6%), and arts & humanities (33 | 8.1%) are the most common fields of study among 409 individuals in Newmanstown who have obtained a bachelor's degree or higher.

| Field of Study | # Graduates | % Graduates |
| Computers & Mathematics | 22 | 5.4% |
| Bio, Nature & Agricultural | 27 | 6.6% |
| Physical & Health Sciences | 0 | 0.0% |
| Psychology | 0 | 0.0% |
| Social Sciences | 35 | 8.6% |
| Engineering | 19 | 4.6% |
| Multidisciplinary Studies | 0 | 0.0% |
| Science & Technology | 93 | 22.7% |
| Business | 91 | 22.3% |
| Education | 74 | 18.1% |
| Literature & Languages | 0 | 0.0% |
| Liberal Arts & History | 0 | 0.0% |
| Visual & Performing Arts | 0 | 0.0% |
| Communications | 15 | 3.7% |
| Arts & Humanities | 33 | 8.1% |
| Total | 409 | 100.0% |
Transportation & Commute in Newmanstown
Vehicle Availability by Sex in Newmanstown
The most prevalent vehicle ownership categories in Newmanstown are males with 2 vehicles (391, accounting for 52.1%) and females with 2 vehicles (363, making up 52.4%).
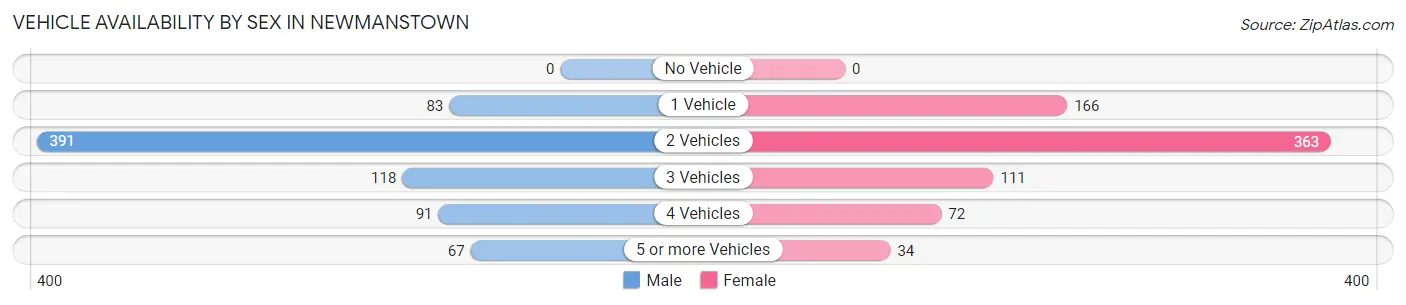
| Vehicles Available | Male | Female |
| No Vehicle | 0 (0.0%) | 0 (0.0%) |
| 1 Vehicle | 83 (11.1%) | 166 (22.3%) |
| 2 Vehicles | 391 (52.1%) | 363 (48.7%) |
| 3 Vehicles | 118 (15.7%) | 111 (14.9%) |
| 4 Vehicles | 91 (12.1%) | 72 (9.7%) |
| 5 or more Vehicles | 67 (8.9%) | 34 (4.6%) |
| Total | 750 (100.0%) | 746 (100.0%) |
Commute Time in Newmanstown
The most frequently occuring commute durations in Newmanstown are 25 to 29 minutes (289 commuters, 21.5%), 30 to 34 minutes (246 commuters, 18.3%), and 20 to 24 minutes (222 commuters, 16.6%).
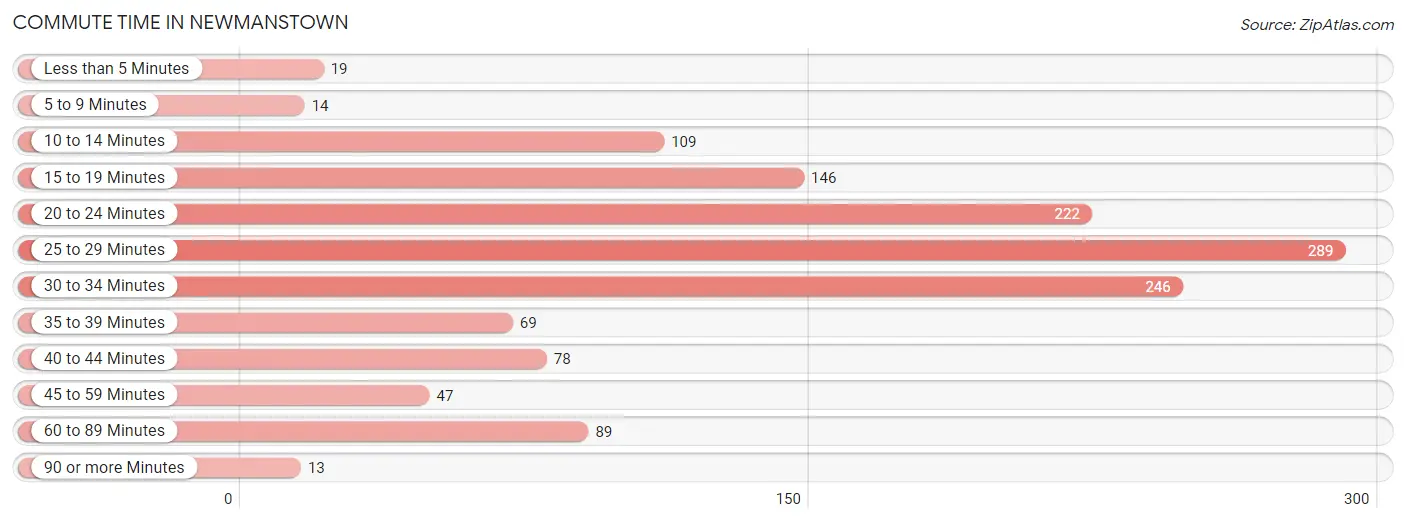
| Commute Time | # Commuters | % Commuters |
| Less than 5 Minutes | 19 | 1.4% |
| 5 to 9 Minutes | 14 | 1.0% |
| 10 to 14 Minutes | 109 | 8.1% |
| 15 to 19 Minutes | 146 | 10.9% |
| 20 to 24 Minutes | 222 | 16.6% |
| 25 to 29 Minutes | 289 | 21.5% |
| 30 to 34 Minutes | 246 | 18.3% |
| 35 to 39 Minutes | 69 | 5.1% |
| 40 to 44 Minutes | 78 | 5.8% |
| 45 to 59 Minutes | 47 | 3.5% |
| 60 to 89 Minutes | 89 | 6.6% |
| 90 or more Minutes | 13 | 1.0% |
Commute Time by Sex in Newmanstown
The most common commute times in Newmanstown are 25 to 29 minutes (200 commuters, 28.4%) for males and 30 to 34 minutes (189 commuters, 29.7%) for females.
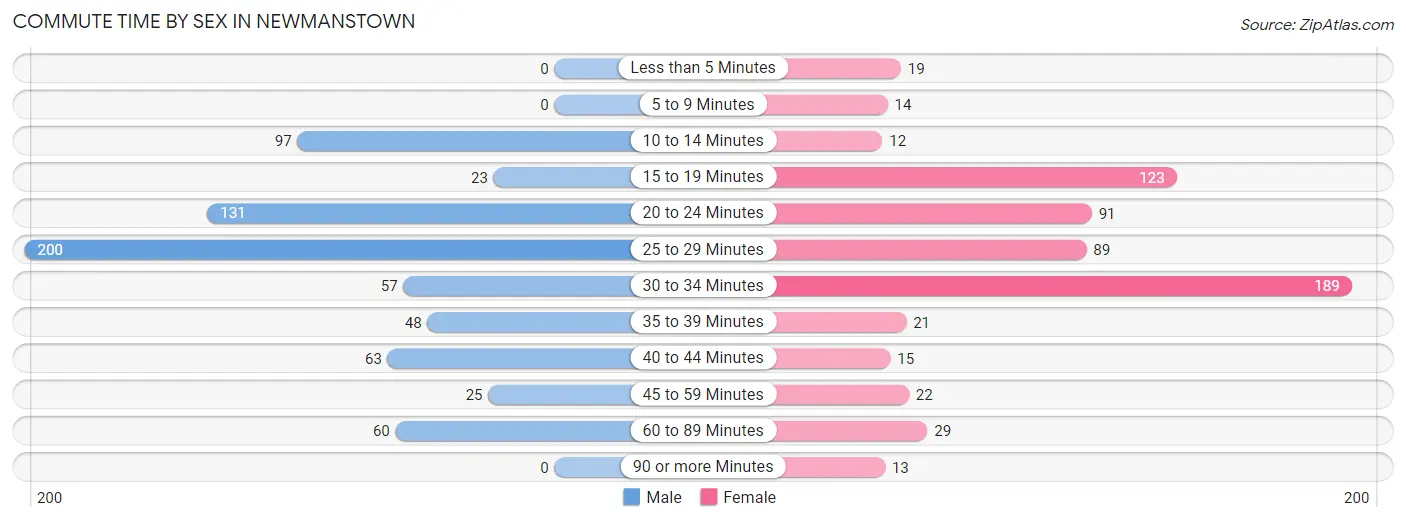
| Commute Time | Male | Female |
| Less than 5 Minutes | 0 (0.0%) | 19 (3.0%) |
| 5 to 9 Minutes | 0 (0.0%) | 14 (2.2%) |
| 10 to 14 Minutes | 97 (13.8%) | 12 (1.9%) |
| 15 to 19 Minutes | 23 (3.3%) | 123 (19.3%) |
| 20 to 24 Minutes | 131 (18.6%) | 91 (14.3%) |
| 25 to 29 Minutes | 200 (28.4%) | 89 (14.0%) |
| 30 to 34 Minutes | 57 (8.1%) | 189 (29.7%) |
| 35 to 39 Minutes | 48 (6.8%) | 21 (3.3%) |
| 40 to 44 Minutes | 63 (8.9%) | 15 (2.4%) |
| 45 to 59 Minutes | 25 (3.5%) | 22 (3.5%) |
| 60 to 89 Minutes | 60 (8.5%) | 29 (4.5%) |
| 90 or more Minutes | 0 (0.0%) | 13 (2.0%) |
Time of Departure to Work by Sex in Newmanstown
The most frequent times of departure to work in Newmanstown are 6:30 AM to 6:59 AM (158, 22.4%) for males and 7:00 AM to 7:29 AM (193, 30.3%) for females.
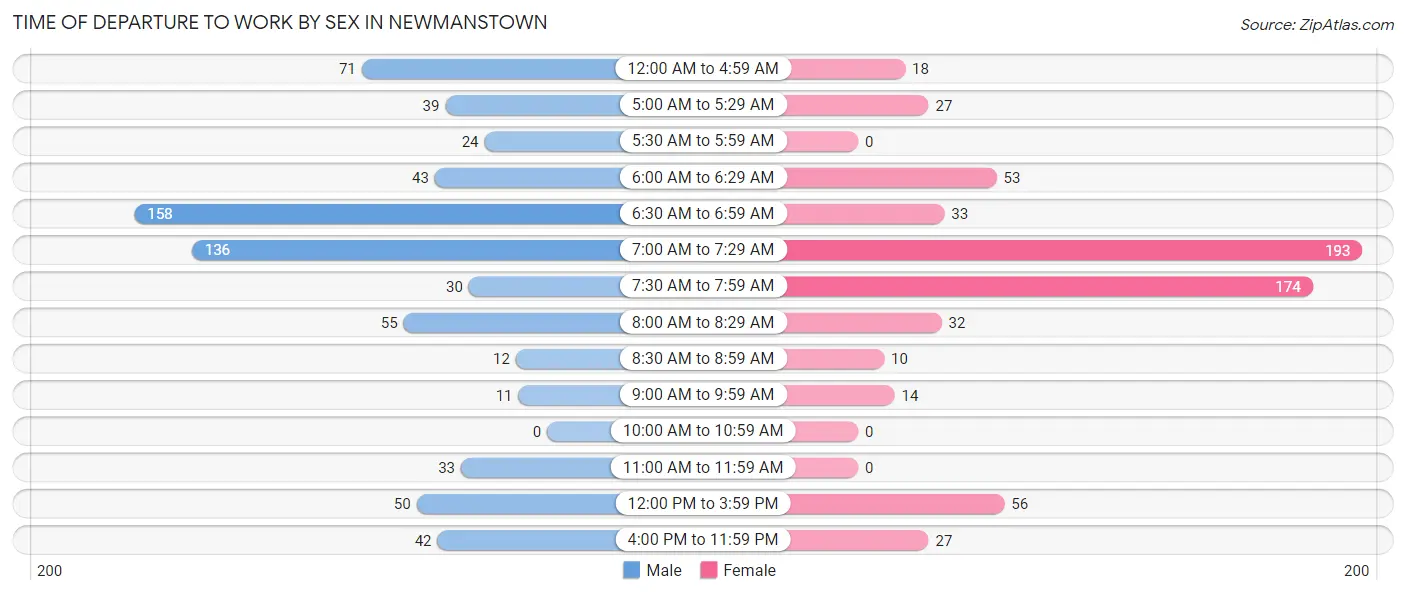
| Time of Departure | Male | Female |
| 12:00 AM to 4:59 AM | 71 (10.1%) | 18 (2.8%) |
| 5:00 AM to 5:29 AM | 39 (5.5%) | 27 (4.2%) |
| 5:30 AM to 5:59 AM | 24 (3.4%) | 0 (0.0%) |
| 6:00 AM to 6:29 AM | 43 (6.1%) | 53 (8.3%) |
| 6:30 AM to 6:59 AM | 158 (22.4%) | 33 (5.2%) |
| 7:00 AM to 7:29 AM | 136 (19.3%) | 193 (30.3%) |
| 7:30 AM to 7:59 AM | 30 (4.3%) | 174 (27.3%) |
| 8:00 AM to 8:29 AM | 55 (7.8%) | 32 (5.0%) |
| 8:30 AM to 8:59 AM | 12 (1.7%) | 10 (1.6%) |
| 9:00 AM to 9:59 AM | 11 (1.6%) | 14 (2.2%) |
| 10:00 AM to 10:59 AM | 0 (0.0%) | 0 (0.0%) |
| 11:00 AM to 11:59 AM | 33 (4.7%) | 0 (0.0%) |
| 12:00 PM to 3:59 PM | 50 (7.1%) | 56 (8.8%) |
| 4:00 PM to 11:59 PM | 42 (6.0%) | 27 (4.2%) |
| Total | 704 (100.0%) | 637 (100.0%) |
Housing Occupancy in Newmanstown
Occupancy by Ownership in Newmanstown
Of the total 1,131 dwellings in Newmanstown, owner-occupied units account for 921 (81.4%), while renter-occupied units make up 210 (18.6%).
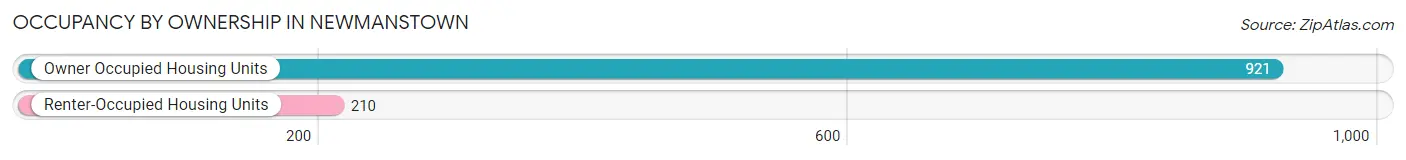
| Occupancy | # Housing Units | % Housing Units |
| Owner Occupied Housing Units | 921 | 81.4% |
| Renter-Occupied Housing Units | 210 | 18.6% |
| Total Occupied Housing Units | 1,131 | 100.0% |
Occupancy by Household Size in Newmanstown
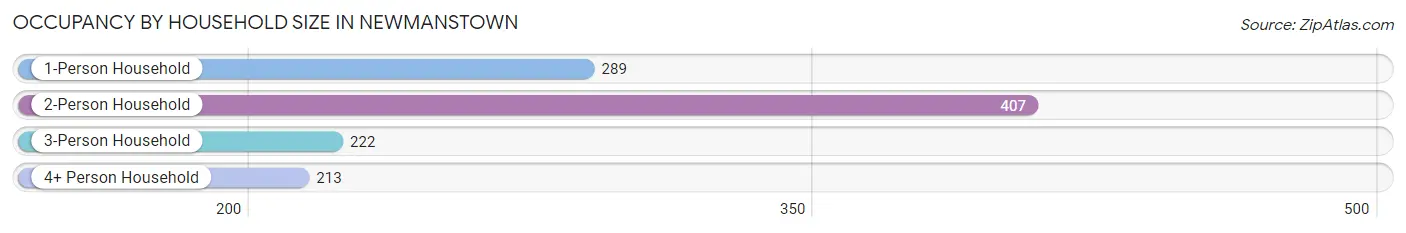
| Household Size | # Housing Units | % Housing Units |
| 1-Person Household | 289 | 25.6% |
| 2-Person Household | 407 | 36.0% |
| 3-Person Household | 222 | 19.6% |
| 4+ Person Household | 213 | 18.8% |
| Total Housing Units | 1,131 | 100.0% |
Occupancy by Ownership by Household Size in Newmanstown
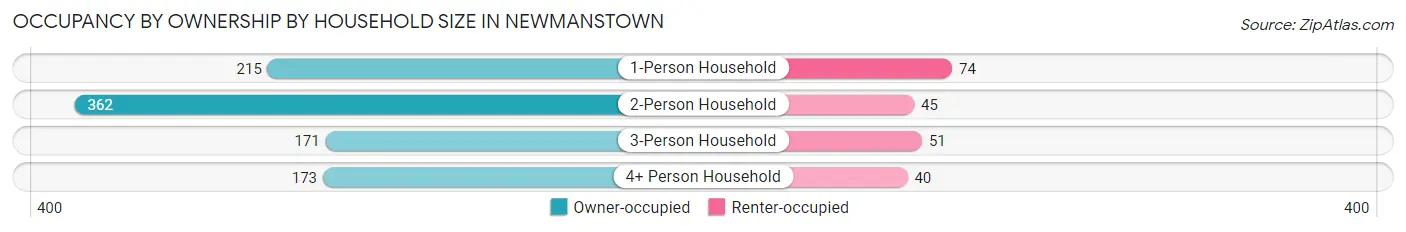
| Household Size | Owner-occupied | Renter-occupied |
| 1-Person Household | 215 (74.4%) | 74 (25.6%) |
| 2-Person Household | 362 (88.9%) | 45 (11.1%) |
| 3-Person Household | 171 (77.0%) | 51 (23.0%) |
| 4+ Person Household | 173 (81.2%) | 40 (18.8%) |
| Total Housing Units | 921 (81.4%) | 210 (18.6%) |
Occupancy by Educational Attainment in Newmanstown
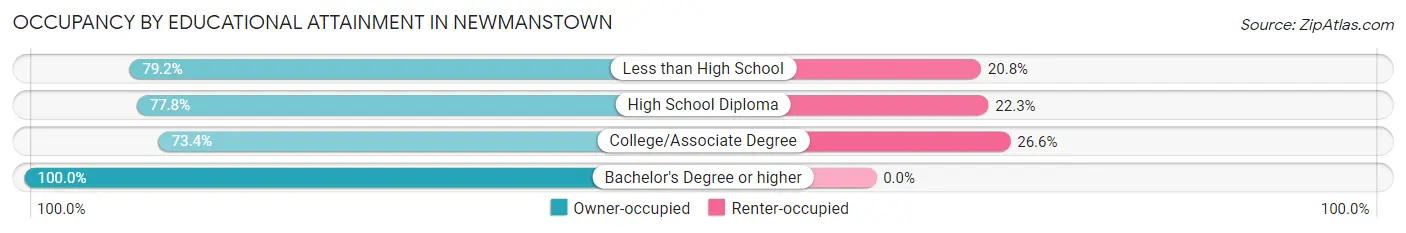
| Household Size | Owner-occupied | Renter-occupied |
| Less than High School | 103 (79.2%) | 27 (20.8%) |
| High School Diploma | 332 (77.7%) | 95 (22.3%) |
| College/Associate Degree | 243 (73.4%) | 88 (26.6%) |
| Bachelor's Degree or higher | 243 (100.0%) | 0 (0.0%) |
Occupancy by Age of Householder in Newmanstown
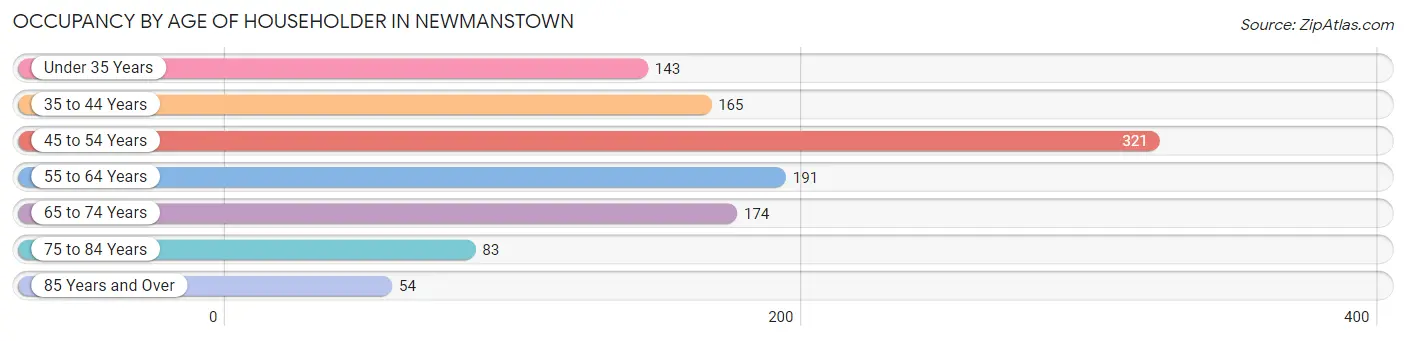
| Age Bracket | # Households | % Households |
| Under 35 Years | 143 | 12.6% |
| 35 to 44 Years | 165 | 14.6% |
| 45 to 54 Years | 321 | 28.4% |
| 55 to 64 Years | 191 | 16.9% |
| 65 to 74 Years | 174 | 15.4% |
| 75 to 84 Years | 83 | 7.3% |
| 85 Years and Over | 54 | 4.8% |
| Total | 1,131 | 100.0% |
Housing Finances in Newmanstown
Median Income by Occupancy in Newmanstown
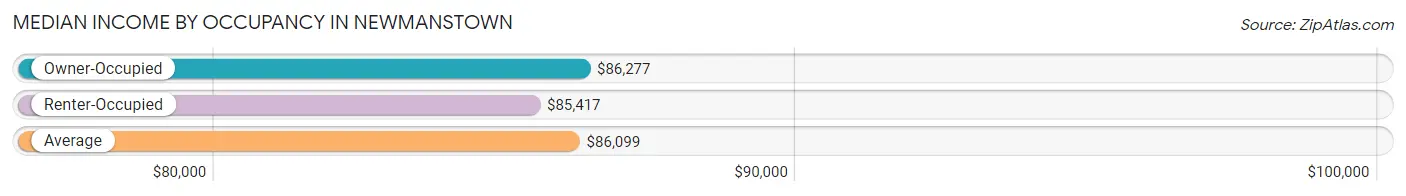
| Occupancy Type | # Households | Median Income |
| Owner-Occupied | 921 (81.4%) | $86,277 |
| Renter-Occupied | 210 (18.6%) | $85,417 |
| Average | 1,131 (100.0%) | $86,099 |
Occupancy by Householder Income Bracket in Newmanstown
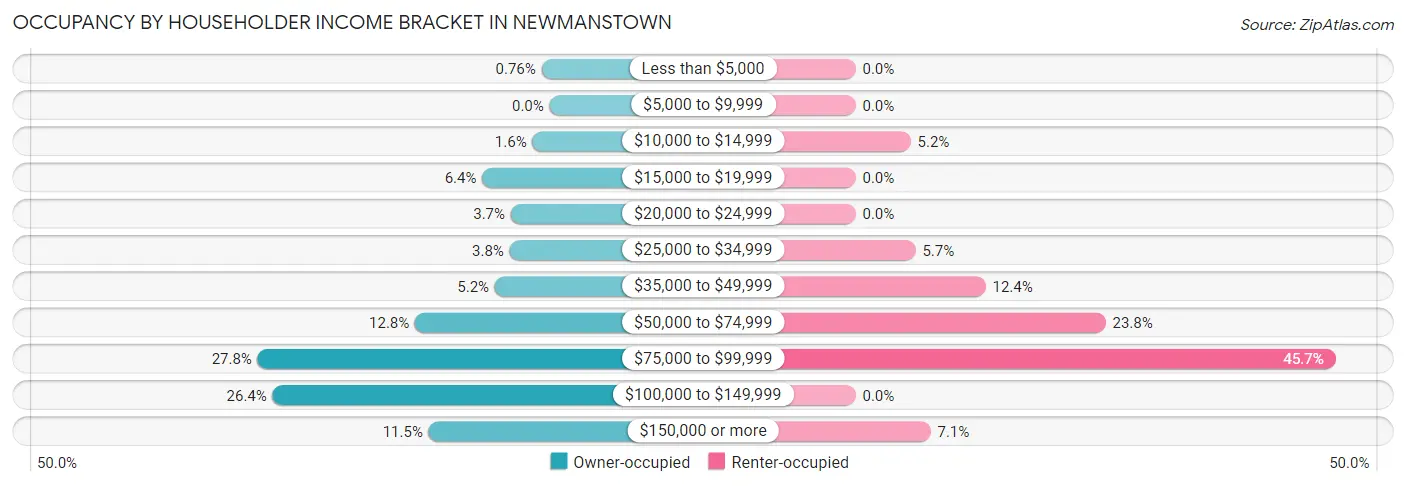
| Income Bracket | Owner-occupied | Renter-occupied |
| Less than $5,000 | 7 (0.8%) | 0 (0.0%) |
| $5,000 to $9,999 | 0 (0.0%) | 0 (0.0%) |
| $10,000 to $14,999 | 15 (1.6%) | 11 (5.2%) |
| $15,000 to $19,999 | 59 (6.4%) | 0 (0.0%) |
| $20,000 to $24,999 | 34 (3.7%) | 0 (0.0%) |
| $25,000 to $34,999 | 35 (3.8%) | 12 (5.7%) |
| $35,000 to $49,999 | 48 (5.2%) | 26 (12.4%) |
| $50,000 to $74,999 | 118 (12.8%) | 50 (23.8%) |
| $75,000 to $99,999 | 256 (27.8%) | 96 (45.7%) |
| $100,000 to $149,999 | 243 (26.4%) | 0 (0.0%) |
| $150,000 or more | 106 (11.5%) | 15 (7.1%) |
| Total | 921 (100.0%) | 210 (100.0%) |
Monthly Housing Cost Tiers in Newmanstown
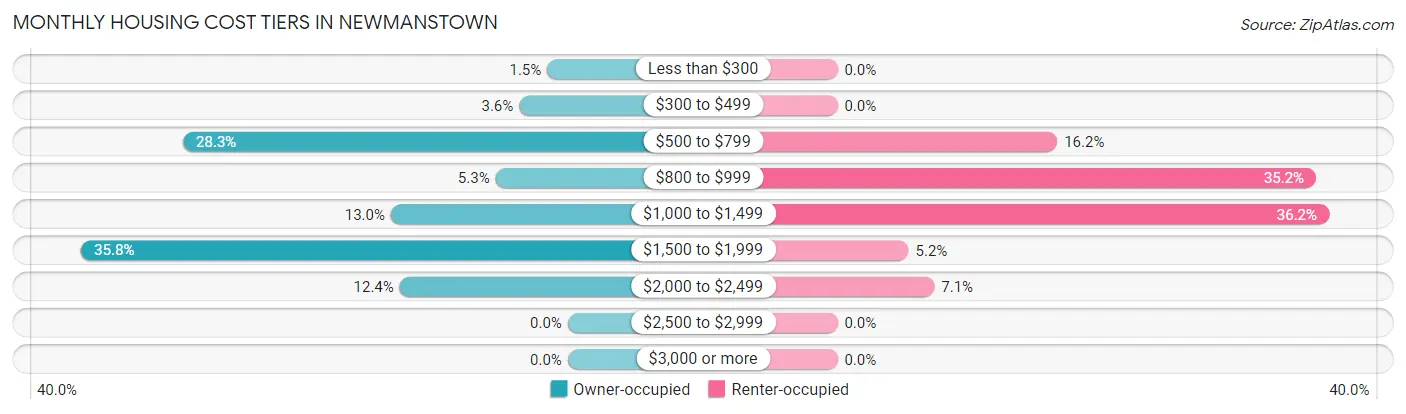
| Monthly Cost | Owner-occupied | Renter-occupied |
| Less than $300 | 14 (1.5%) | 0 (0.0%) |
| $300 to $499 | 33 (3.6%) | 0 (0.0%) |
| $500 to $799 | 261 (28.3%) | 34 (16.2%) |
| $800 to $999 | 49 (5.3%) | 74 (35.2%) |
| $1,000 to $1,499 | 120 (13.0%) | 76 (36.2%) |
| $1,500 to $1,999 | 330 (35.8%) | 11 (5.2%) |
| $2,000 to $2,499 | 114 (12.4%) | 15 (7.1%) |
| $2,500 to $2,999 | 0 (0.0%) | 0 (0.0%) |
| $3,000 or more | 0 (0.0%) | 0 (0.0%) |
| Total | 921 (100.0%) | 210 (100.0%) |
Physical Housing Characteristics in Newmanstown
Housing Structures in Newmanstown
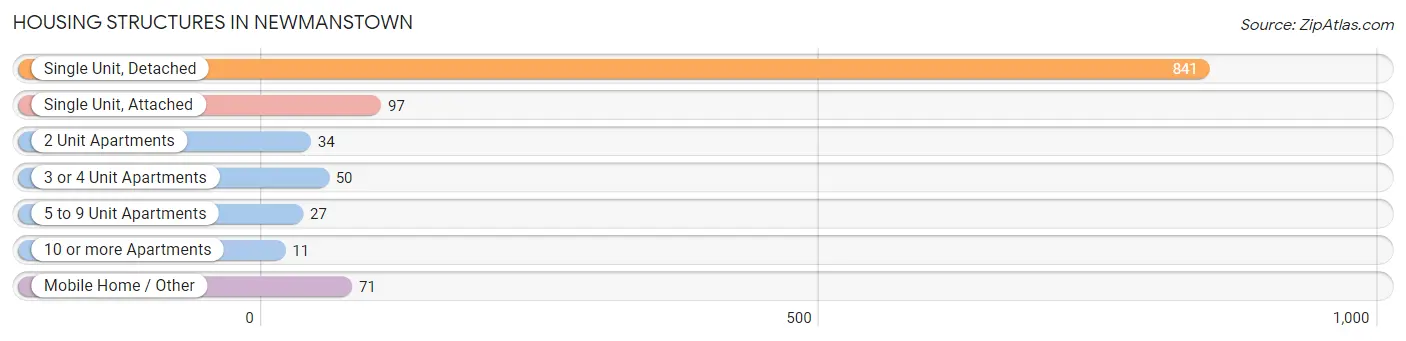
| Structure Type | # Housing Units | % Housing Units |
| Single Unit, Detached | 841 | 74.4% |
| Single Unit, Attached | 97 | 8.6% |
| 2 Unit Apartments | 34 | 3.0% |
| 3 or 4 Unit Apartments | 50 | 4.4% |
| 5 to 9 Unit Apartments | 27 | 2.4% |
| 10 or more Apartments | 11 | 1.0% |
| Mobile Home / Other | 71 | 6.3% |
| Total | 1,131 | 100.0% |
Housing Structures by Occupancy in Newmanstown
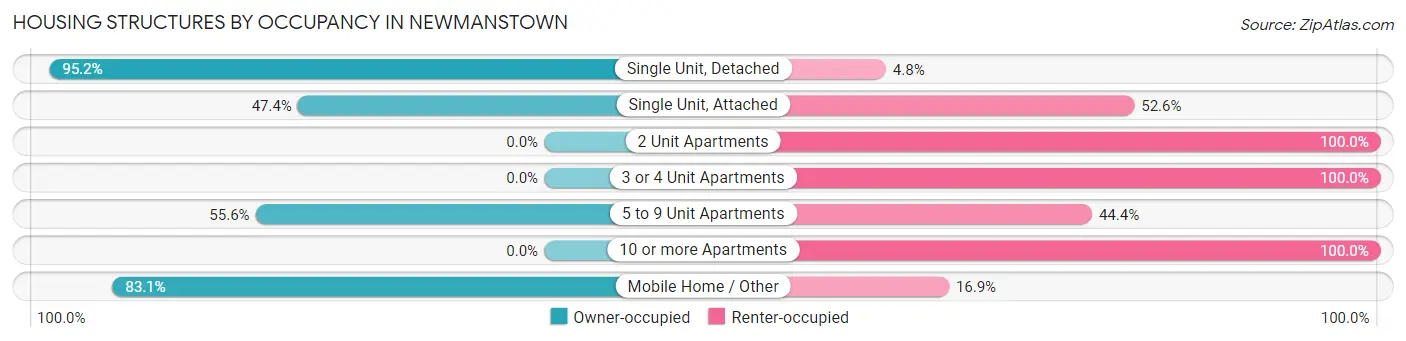
| Structure Type | Owner-occupied | Renter-occupied |
| Single Unit, Detached | 801 (95.2%) | 40 (4.8%) |
| Single Unit, Attached | 46 (47.4%) | 51 (52.6%) |
| 2 Unit Apartments | 0 (0.0%) | 34 (100.0%) |
| 3 or 4 Unit Apartments | 0 (0.0%) | 50 (100.0%) |
| 5 to 9 Unit Apartments | 15 (55.6%) | 12 (44.4%) |
| 10 or more Apartments | 0 (0.0%) | 11 (100.0%) |
| Mobile Home / Other | 59 (83.1%) | 12 (16.9%) |
| Total | 921 (81.4%) | 210 (18.6%) |
Housing Structures by Number of Rooms in Newmanstown
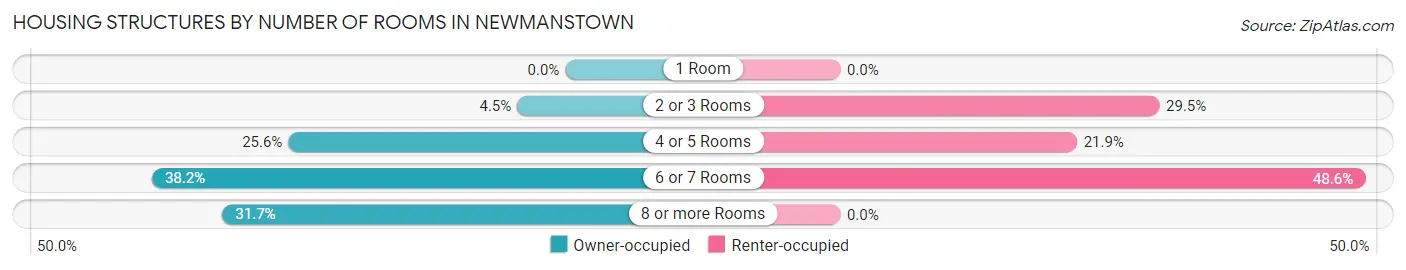
| Number of Rooms | Owner-occupied | Renter-occupied |
| 1 Room | 0 (0.0%) | 0 (0.0%) |
| 2 or 3 Rooms | 41 (4.4%) | 62 (29.5%) |
| 4 or 5 Rooms | 236 (25.6%) | 46 (21.9%) |
| 6 or 7 Rooms | 352 (38.2%) | 102 (48.6%) |
| 8 or more Rooms | 292 (31.7%) | 0 (0.0%) |
| Total | 921 (100.0%) | 210 (100.0%) |
Housing Structure by Heating Type in Newmanstown
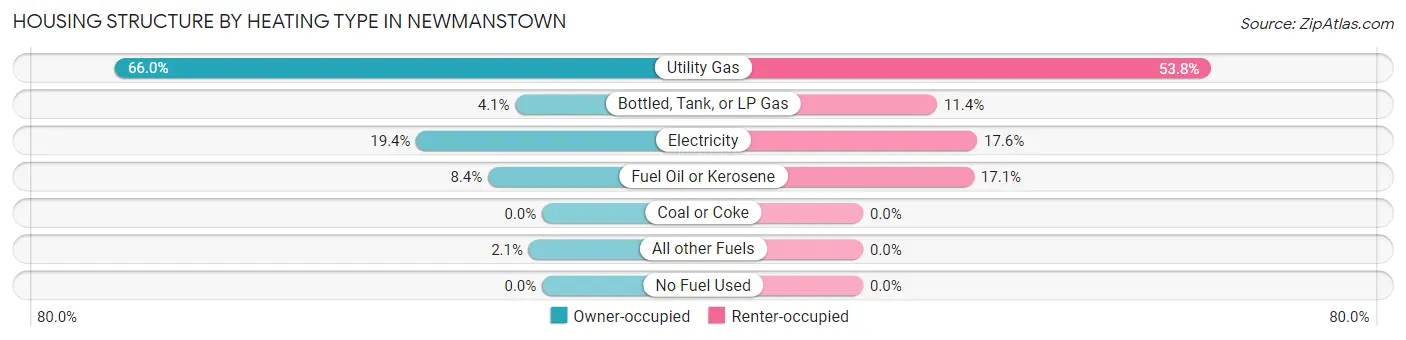
| Heating Type | Owner-occupied | Renter-occupied |
| Utility Gas | 608 (66.0%) | 113 (53.8%) |
| Bottled, Tank, or LP Gas | 38 (4.1%) | 24 (11.4%) |
| Electricity | 179 (19.4%) | 37 (17.6%) |
| Fuel Oil or Kerosene | 77 (8.4%) | 36 (17.1%) |
| Coal or Coke | 0 (0.0%) | 0 (0.0%) |
| All other Fuels | 19 (2.1%) | 0 (0.0%) |
| No Fuel Used | 0 (0.0%) | 0 (0.0%) |
| Total | 921 (100.0%) | 210 (100.0%) |
Household Vehicle Usage in Newmanstown
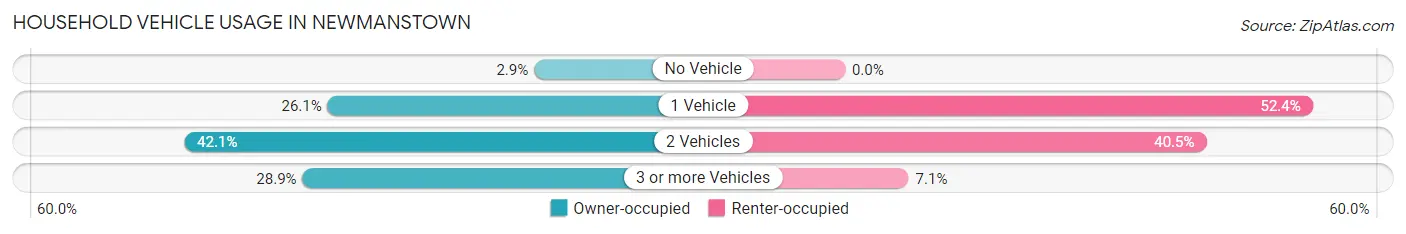
| Vehicles per Household | Owner-occupied | Renter-occupied |
| No Vehicle | 27 (2.9%) | 0 (0.0%) |
| 1 Vehicle | 240 (26.1%) | 110 (52.4%) |
| 2 Vehicles | 388 (42.1%) | 85 (40.5%) |
| 3 or more Vehicles | 266 (28.9%) | 15 (7.1%) |
| Total | 921 (100.0%) | 210 (100.0%) |
Real Estate & Mortgages in Newmanstown
Real Estate and Mortgage Overview in Newmanstown
| Characteristic | Without Mortgage | With Mortgage |
| Housing Units | 279 | 642 |
| Median Property Value | $199,800 | $212,900 |
| Median Household Income | $74,205 | $90 |
| Monthly Housing Costs | $619 | $0 |
| Real Estate Taxes | $2,821 | $0 |
Property Value by Mortgage Status in Newmanstown
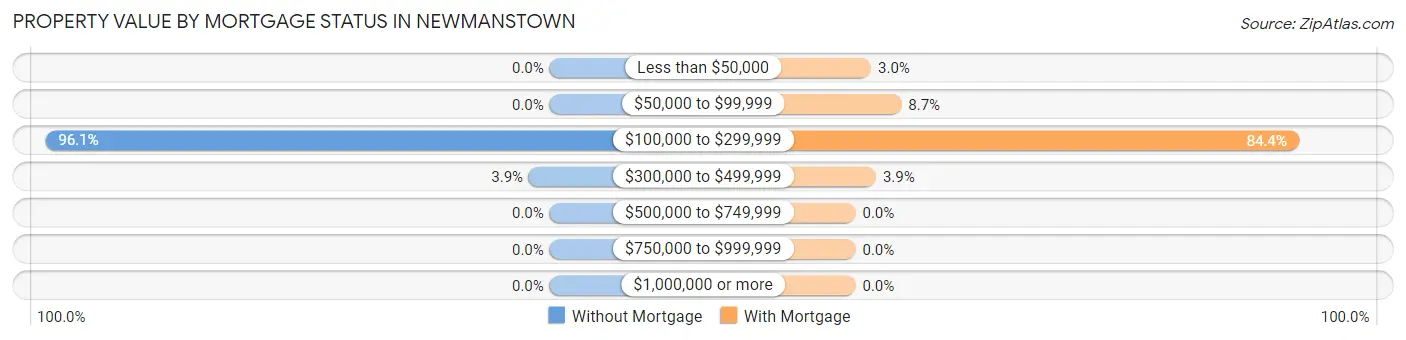
| Property Value | Without Mortgage | With Mortgage |
| Less than $50,000 | 0 (0.0%) | 19 (3.0%) |
| $50,000 to $99,999 | 0 (0.0%) | 56 (8.7%) |
| $100,000 to $299,999 | 268 (96.1%) | 542 (84.4%) |
| $300,000 to $499,999 | 11 (3.9%) | 25 (3.9%) |
| $500,000 to $749,999 | 0 (0.0%) | 0 (0.0%) |
| $750,000 to $999,999 | 0 (0.0%) | 0 (0.0%) |
| $1,000,000 or more | 0 (0.0%) | 0 (0.0%) |
| Total | 279 (100.0%) | 642 (100.0%) |
Household Income by Mortgage Status in Newmanstown
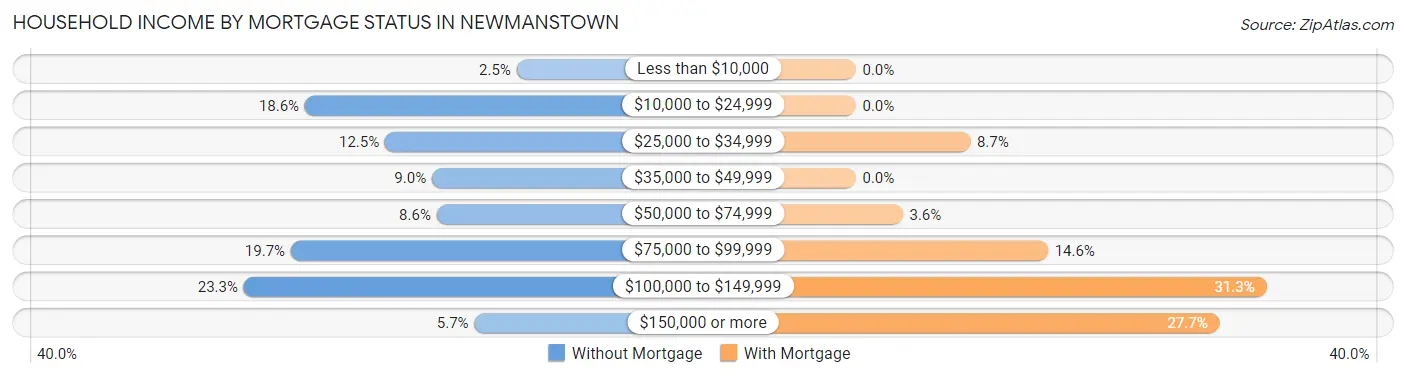
| Household Income | Without Mortgage | With Mortgage |
| Less than $10,000 | 7 (2.5%) | 0 (0.0%) |
| $10,000 to $24,999 | 52 (18.6%) | 0 (0.0%) |
| $25,000 to $34,999 | 35 (12.5%) | 56 (8.7%) |
| $35,000 to $49,999 | 25 (9.0%) | 0 (0.0%) |
| $50,000 to $74,999 | 24 (8.6%) | 23 (3.6%) |
| $75,000 to $99,999 | 55 (19.7%) | 94 (14.6%) |
| $100,000 to $149,999 | 65 (23.3%) | 201 (31.3%) |
| $150,000 or more | 16 (5.7%) | 178 (27.7%) |
| Total | 279 (100.0%) | 642 (100.0%) |
Property Value to Household Income Ratio in Newmanstown
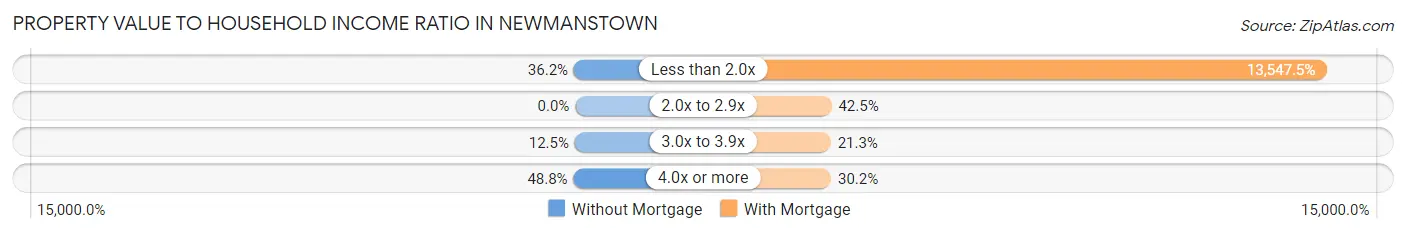
| Value-to-Income Ratio | Without Mortgage | With Mortgage |
| Less than 2.0x | 101 (36.2%) | 86,975 (13,547.5%) |
| 2.0x to 2.9x | 0 (0.0%) | 273 (42.5%) |
| 3.0x to 3.9x | 35 (12.5%) | 137 (21.3%) |
| 4.0x or more | 136 (48.7%) | 194 (30.2%) |
| Total | 279 (100.0%) | 642 (100.0%) |
Real Estate Taxes by Mortgage Status in Newmanstown
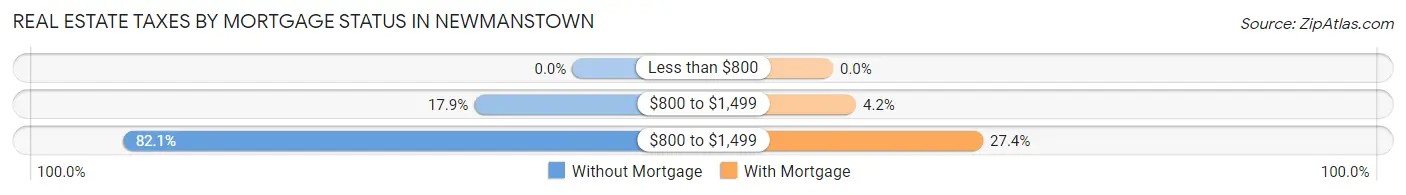
| Property Taxes | Without Mortgage | With Mortgage |
| Less than $800 | 0 (0.0%) | 0 (0.0%) |
| $800 to $1,499 | 50 (17.9%) | 27 (4.2%) |
| $800 to $1,499 | 229 (82.1%) | 176 (27.4%) |
| Total | 279 (100.0%) | 642 (100.0%) |
Health & Disability in Newmanstown
Health Insurance Coverage by Age in Newmanstown
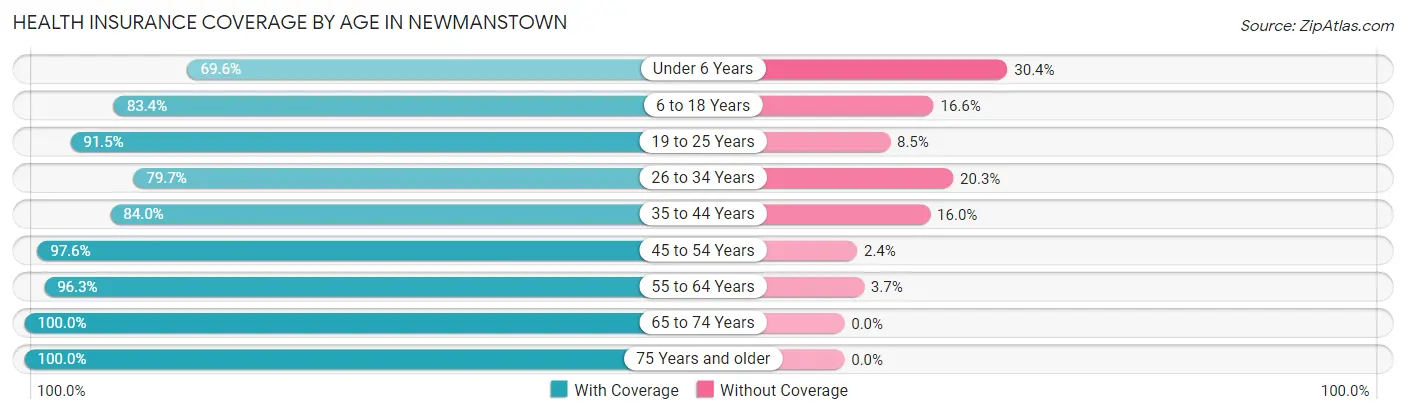
| Age Bracket | With Coverage | Without Coverage |
| Under 6 Years | 103 (69.6%) | 45 (30.4%) |
| 6 to 18 Years | 591 (83.4%) | 118 (16.6%) |
| 19 to 25 Years | 193 (91.5%) | 18 (8.5%) |
| 26 to 34 Years | 106 (79.7%) | 27 (20.3%) |
| 35 to 44 Years | 236 (84.0%) | 45 (16.0%) |
| 45 to 54 Years | 534 (97.6%) | 13 (2.4%) |
| 55 to 64 Years | 342 (96.3%) | 13 (3.7%) |
| 65 to 74 Years | 226 (100.0%) | 0 (0.0%) |
| 75 Years and older | 169 (100.0%) | 0 (0.0%) |
| Total | 2,500 (90.0%) | 279 (10.0%) |
Health Insurance Coverage by Citizenship Status in Newmanstown
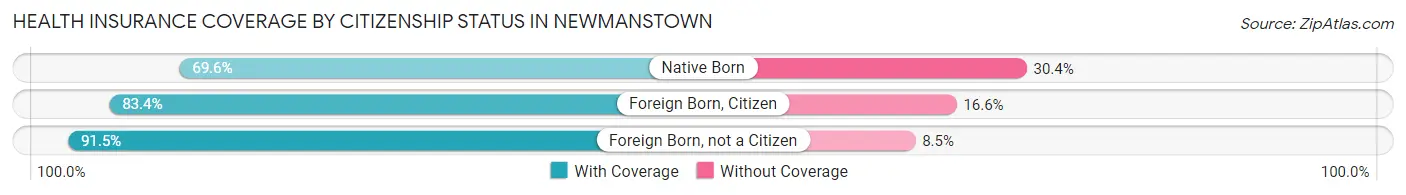
| Citizenship Status | With Coverage | Without Coverage |
| Native Born | 103 (69.6%) | 45 (30.4%) |
| Foreign Born, Citizen | 591 (83.4%) | 118 (16.6%) |
| Foreign Born, not a Citizen | 193 (91.5%) | 18 (8.5%) |
Health Insurance Coverage by Household Income in Newmanstown
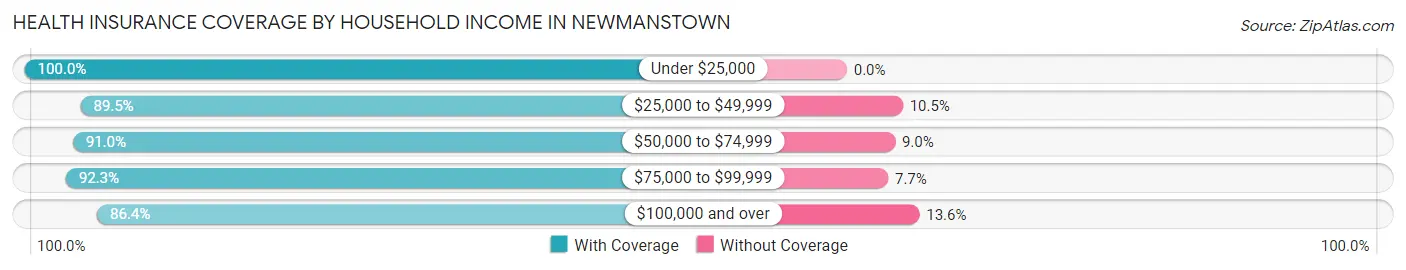
| Household Income | With Coverage | Without Coverage |
| Under $25,000 | 223 (100.0%) | 0 (0.0%) |
| $25,000 to $49,999 | 231 (89.5%) | 27 (10.5%) |
| $50,000 to $74,999 | 262 (91.0%) | 26 (9.0%) |
| $75,000 to $99,999 | 740 (92.3%) | 62 (7.7%) |
| $100,000 and over | 1,044 (86.4%) | 164 (13.6%) |
Public vs Private Health Insurance Coverage by Age in Newmanstown
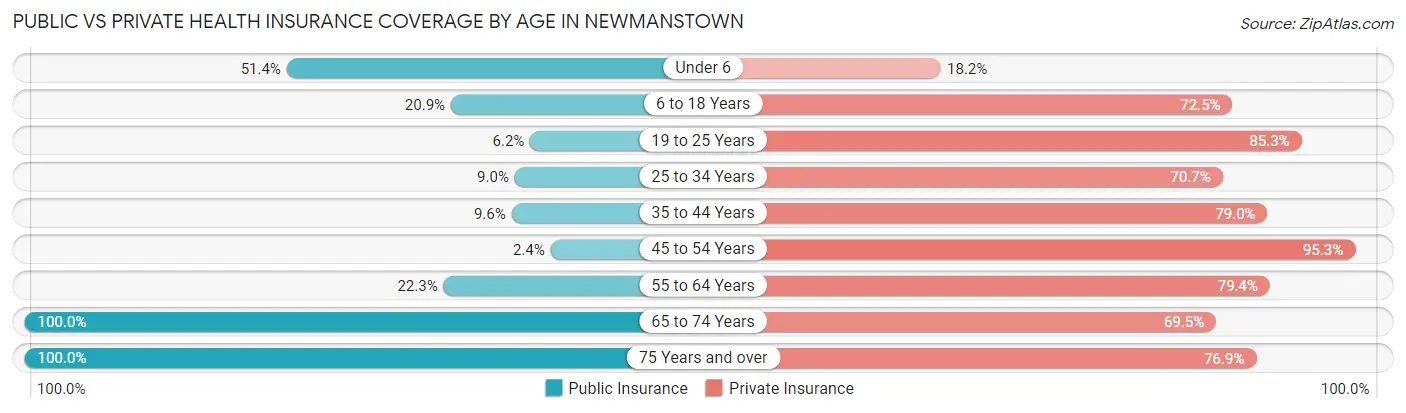
| Age Bracket | Public Insurance | Private Insurance |
| Under 6 | 76 (51.3%) | 27 (18.2%) |
| 6 to 18 Years | 148 (20.9%) | 514 (72.5%) |
| 19 to 25 Years | 13 (6.2%) | 180 (85.3%) |
| 25 to 34 Years | 12 (9.0%) | 94 (70.7%) |
| 35 to 44 Years | 27 (9.6%) | 222 (79.0%) |
| 45 to 54 Years | 13 (2.4%) | 521 (95.3%) |
| 55 to 64 Years | 79 (22.3%) | 282 (79.4%) |
| 65 to 74 Years | 226 (100.0%) | 157 (69.5%) |
| 75 Years and over | 169 (100.0%) | 130 (76.9%) |
| Total | 763 (27.5%) | 2,127 (76.5%) |
Disability Status by Sex by Age in Newmanstown
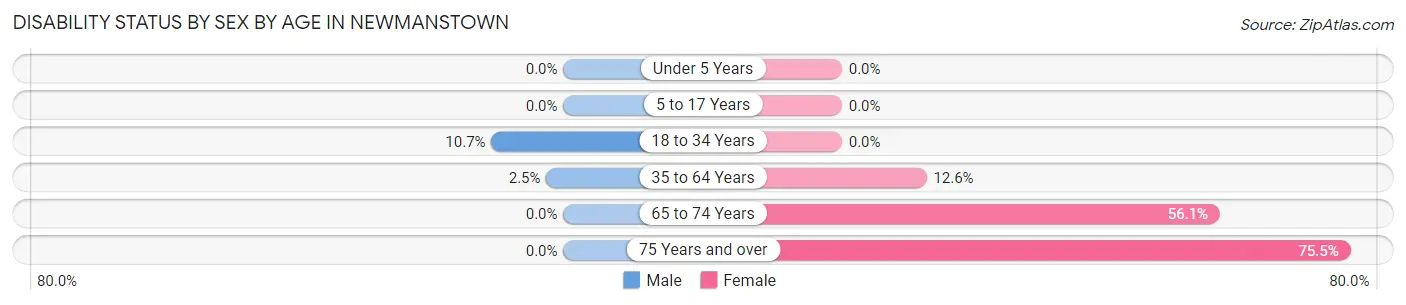
| Age Bracket | Male | Female |
| Under 5 Years | 0 (0.0%) | 0 (0.0%) |
| 5 to 17 Years | 0 (0.0%) | 0 (0.0%) |
| 18 to 34 Years | 22 (10.7%) | 0 (0.0%) |
| 35 to 64 Years | 13 (2.5%) | 84 (12.6%) |
| 65 to 74 Years | 0 (0.0%) | 64 (56.1%) |
| 75 Years and over | 0 (0.0%) | 71 (75.5%) |
Disability Class by Sex by Age in Newmanstown
Disability Class: Hearing Difficulty
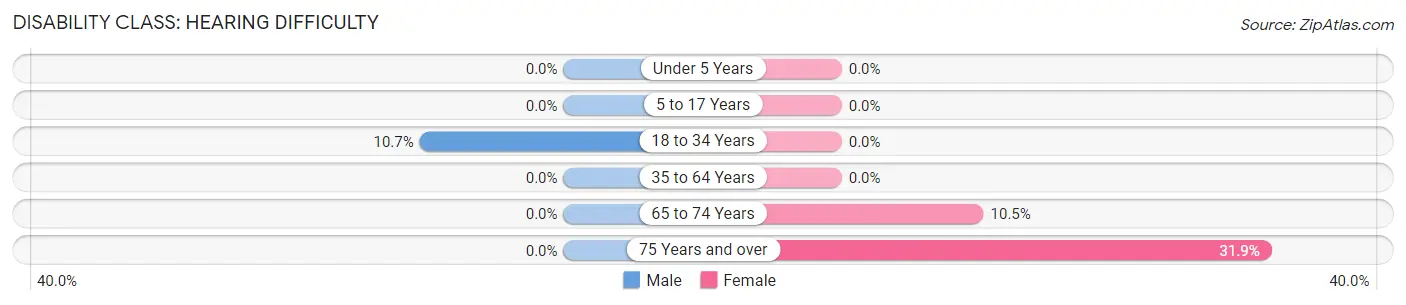
| Age Bracket | Male | Female |
| Under 5 Years | 0 (0.0%) | 0 (0.0%) |
| 5 to 17 Years | 0 (0.0%) | 0 (0.0%) |
| 18 to 34 Years | 22 (10.7%) | 0 (0.0%) |
| 35 to 64 Years | 0 (0.0%) | 0 (0.0%) |
| 65 to 74 Years | 0 (0.0%) | 12 (10.5%) |
| 75 Years and over | 0 (0.0%) | 30 (31.9%) |
Disability Class: Vision Difficulty
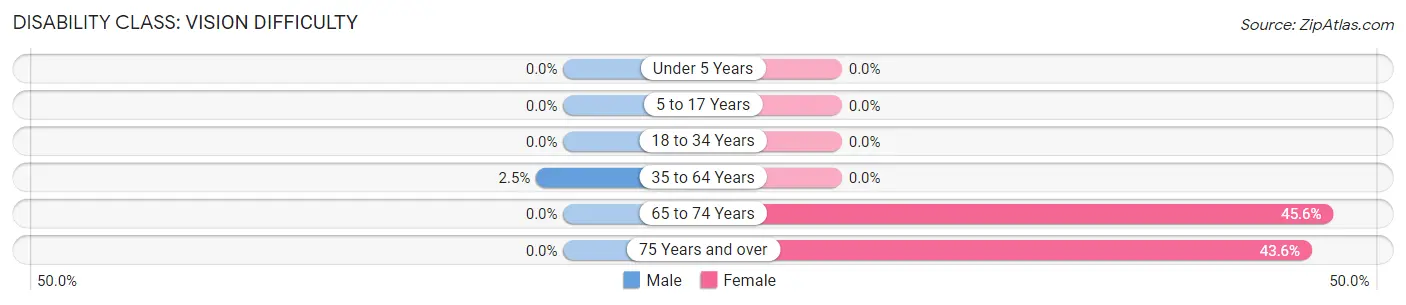
| Age Bracket | Male | Female |
| Under 5 Years | 0 (0.0%) | 0 (0.0%) |
| 5 to 17 Years | 0 (0.0%) | 0 (0.0%) |
| 18 to 34 Years | 0 (0.0%) | 0 (0.0%) |
| 35 to 64 Years | 13 (2.5%) | 0 (0.0%) |
| 65 to 74 Years | 0 (0.0%) | 52 (45.6%) |
| 75 Years and over | 0 (0.0%) | 41 (43.6%) |
Disability Class: Cognitive Difficulty
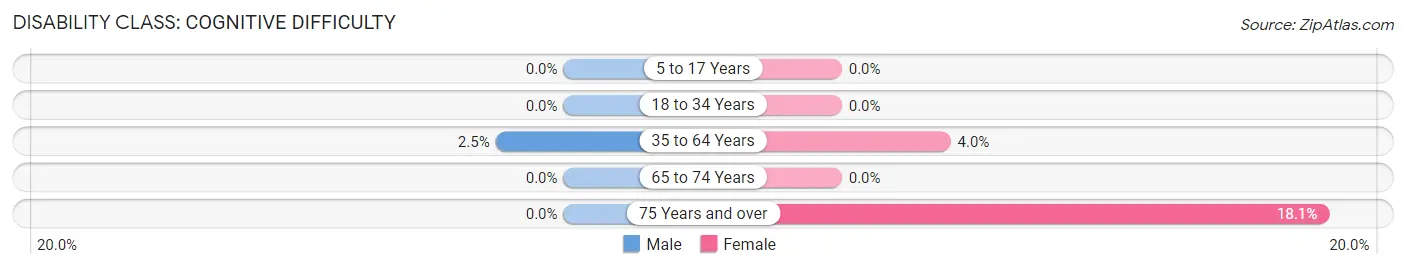
| Age Bracket | Male | Female |
| 5 to 17 Years | 0 (0.0%) | 0 (0.0%) |
| 18 to 34 Years | 0 (0.0%) | 0 (0.0%) |
| 35 to 64 Years | 13 (2.5%) | 27 (4.0%) |
| 65 to 74 Years | 0 (0.0%) | 0 (0.0%) |
| 75 Years and over | 0 (0.0%) | 17 (18.1%) |
Disability Class: Ambulatory Difficulty
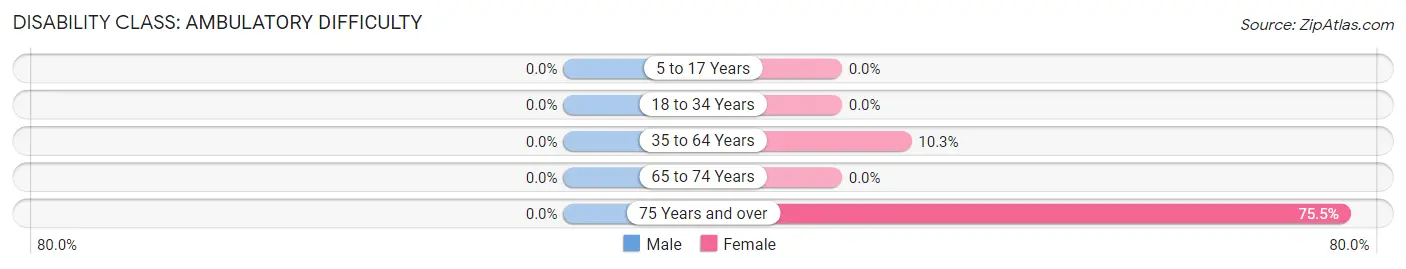
| Age Bracket | Male | Female |
| 5 to 17 Years | 0 (0.0%) | 0 (0.0%) |
| 18 to 34 Years | 0 (0.0%) | 0 (0.0%) |
| 35 to 64 Years | 0 (0.0%) | 69 (10.3%) |
| 65 to 74 Years | 0 (0.0%) | 0 (0.0%) |
| 75 Years and over | 0 (0.0%) | 71 (75.5%) |
Disability Class: Self-Care Difficulty
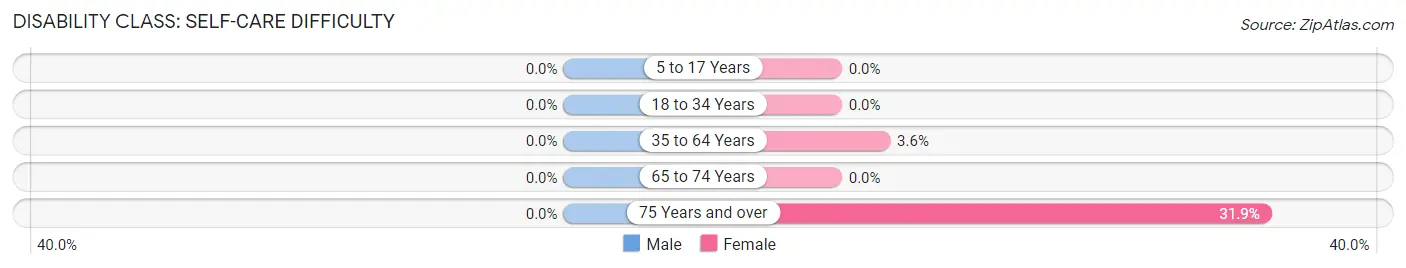
| Age Bracket | Male | Female |
| 5 to 17 Years | 0 (0.0%) | 0 (0.0%) |
| 18 to 34 Years | 0 (0.0%) | 0 (0.0%) |
| 35 to 64 Years | 0 (0.0%) | 24 (3.6%) |
| 65 to 74 Years | 0 (0.0%) | 0 (0.0%) |
| 75 Years and over | 0 (0.0%) | 30 (31.9%) |
Technology Access in Newmanstown
Computing Device Access in Newmanstown
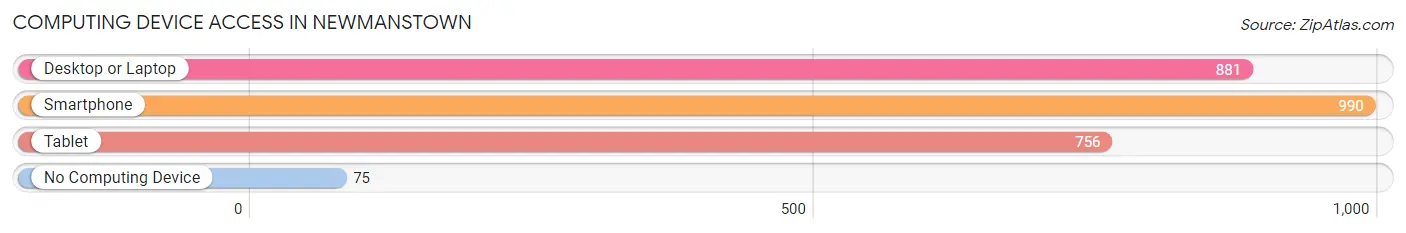
| Device Type | # Households | % Households |
| Desktop or Laptop | 881 | 77.9% |
| Smartphone | 990 | 87.5% |
| Tablet | 756 | 66.8% |
| No Computing Device | 75 | 6.6% |
| Total | 1,131 | 100.0% |
Internet Access in Newmanstown
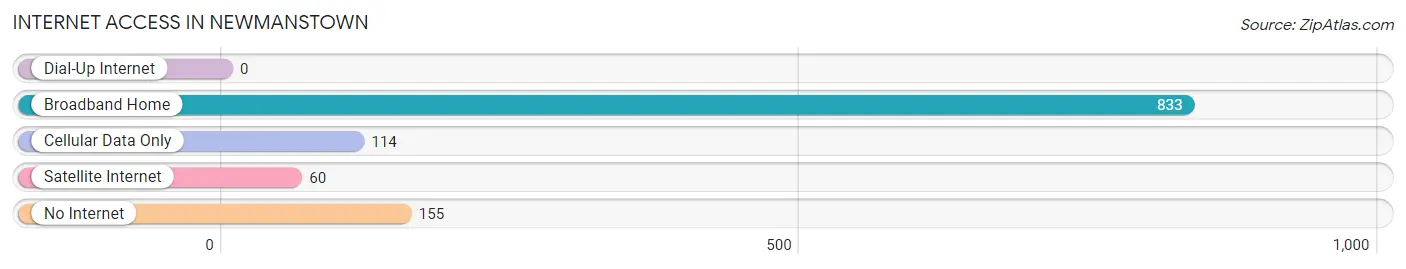
| Internet Type | # Households | % Households |
| Dial-Up Internet | 0 | 0.0% |
| Broadband Home | 833 | 73.7% |
| Cellular Data Only | 114 | 10.1% |
| Satellite Internet | 60 | 5.3% |
| No Internet | 155 | 13.7% |
| Total | 1,131 | 100.0% |
Newmanstown Summary
Newmanstown is a small borough located in Lebanon County, Pennsylvania. It is situated in the southeastern part of the state, about 10 miles east of the city of Lebanon. The borough is part of the Lebanon Metropolitan Statistical Area and has a population of 1,845 as of the 2010 census.
History
Newmanstown was founded in 1790 by John Newman, a German immigrant who had settled in the area in 1760. The town was originally known as Newmansville, but the name was changed to Newmanstown in 1845. The town was incorporated in 1851 and has remained relatively unchanged since then.
The town was an important stop on the Reading Railroad, which ran through the area from 1842 to 1976. The railroad was a major factor in the growth of the town, as it allowed for the transportation of goods and people to and from the area.
Geography
Newmanstown is located in southeastern Pennsylvania, about 10 miles east of the city of Lebanon. It is situated in the Lebanon Valley, which is part of the Ridge and Valley physiographic province. The town is located at an elevation of 545 feet above sea level.
The town is bordered by the townships of Heidelberg to the north, Millcreek to the east, and North Lebanon to the south and west. The town is located in the Susquehanna River watershed and is drained by the Little Swatara Creek.
Economy
Newmanstown’s economy is largely based on agriculture and light manufacturing. The town is home to several small businesses, including a feed mill, a sawmill, and a furniture factory. The town also has a few retail stores, including a grocery store, a hardware store, and a pharmacy.
The town is also home to a number of small farms, which produce a variety of crops, including corn, soybeans, wheat, and hay. The town also has a few wineries, which produce a variety of wines.
Demographics
As of the 2010 census, the population of Newmanstown was 1,845. The racial makeup of the town was 97.3% White, 0.7% African American, 0.2% Native American, 0.3% Asian, 0.1% Pacific Islander, 0.4% from other races, and 1.0% from two or more races. Hispanic or Latino of any race were 1.2% of the population.
The median household income in Newmanstown was $45,938, and the median family income was $54,844. The per capita income was $20,945. About 8.2% of families and 10.2% of the population were below the poverty line, including 14.2% of those under age 18 and 8.3% of those age 65 or over.
Newmanstown is served by the Eastern Lebanon County School District. The town is home to two schools, Newmanstown Elementary School and Eastern Lebanon County High School. The town also has a public library, the Newmanstown Community Library.
Common Questions
What is Per Capita Income in Newmanstown?
Per Capita income in Newmanstown is $36,166.
What is the Median Family Income in Newmanstown?
Median Family Income in Newmanstown is $87,456.
What is the Median Household income in Newmanstown?
Median Household Income in Newmanstown is $86,099.
What is Income or Wage Gap in Newmanstown?
Income or Wage Gap in Newmanstown is 36.3%.
Women in Newmanstown earn 63.7 cents for every dollar earned by a man.
What is Inequality or Gini Index in Newmanstown?
Inequality or Gini Index in Newmanstown is 0.32.
What is the Total Population of Newmanstown?
Total Population of Newmanstown is 2,796.
What is the Total Male Population of Newmanstown?
Total Male Population of Newmanstown is 1,411.
What is the Total Female Population of Newmanstown?
Total Female Population of Newmanstown is 1,385.
What is the Ratio of Males per 100 Females in Newmanstown?
There are 101.88 Males per 100 Females in Newmanstown.
What is the Ratio of Females per 100 Males in Newmanstown?
There are 98.16 Females per 100 Males in Newmanstown.
What is the Median Population Age in Newmanstown?
Median Population Age in Newmanstown is 40.7 Years.
What is the Average Family Size in Newmanstown
Average Family Size in Newmanstown is 2.9 People.
What is the Average Household Size in Newmanstown
Average Household Size in Newmanstown is 2.5 People.
How Large is the Labor Force in Newmanstown?
There are 1,508 People in the Labor Forcein in Newmanstown.
What is the Percentage of People in the Labor Force in Newmanstown?
71.1% of People are in the Labor Force in Newmanstown.