Masontown borough, PA Map & Demographics
Masontown borough Overview
$26,275
PER CAPITA INCOME
$77,500
AVG FAMILY INCOME
$52,692
AVG HOUSEHOLD INCOME
50.0%
WAGE / INCOME GAP [ % ]
50.0¢/ $1
WAGE / INCOME GAP [ $ ]
0.41
INEQUALITY / GINI INDEX
3,263
TOTAL POPULATION
1,850
MALE POPULATION
1,413
FEMALE POPULATION
130.93
MALES / 100 FEMALES
76.38
FEMALES / 100 MALES
39.0
MEDIAN AGE
3.3
AVG FAMILY SIZE
2.4
AVG HOUSEHOLD SIZE
1,310
LABOR FORCE [ PEOPLE ]
51.1%
PERCENT IN LABOR FORCE
9.5%
UNEMPLOYMENT RATE
Income in Masontown borough
Income Overview in Masontown borough
Per Capita Income in Masontown borough is $26,275, while median incomes of families and households are $77,500 and $52,692 respectively.
| Characteristic | Number | Measure |
| Per Capita Income | 3,263 | $26,275 |
| Median Family Income | 714 | $77,500 |
| Mean Family Income | 714 | $80,084 |
| Median Household Income | 1,344 | $52,692 |
| Mean Household Income | 1,344 | $62,768 |
| Income Deficit | 714 | $0 |
| Wage / Income Gap (%) | 3,263 | 49.97% |
| Wage / Income Gap ($) | 3,263 | 50.03¢ per $1 |
| Gini / Inequality Index | 3,263 | 0.41 |
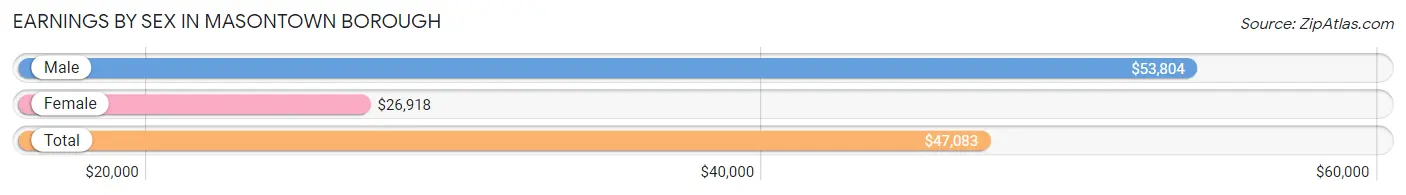
Earnings by Sex in Masontown borough
Average Earnings in Masontown borough are $47,083, $53,804 for men and $26,918 for women, a difference of 50.0%.
| Sex | Number | Average Earnings |
| Male | 808 (60.5%) | $53,804 |
| Female | 527 (39.5%) | $26,918 |
| Total | 1,335 (100.0%) | $47,083 |
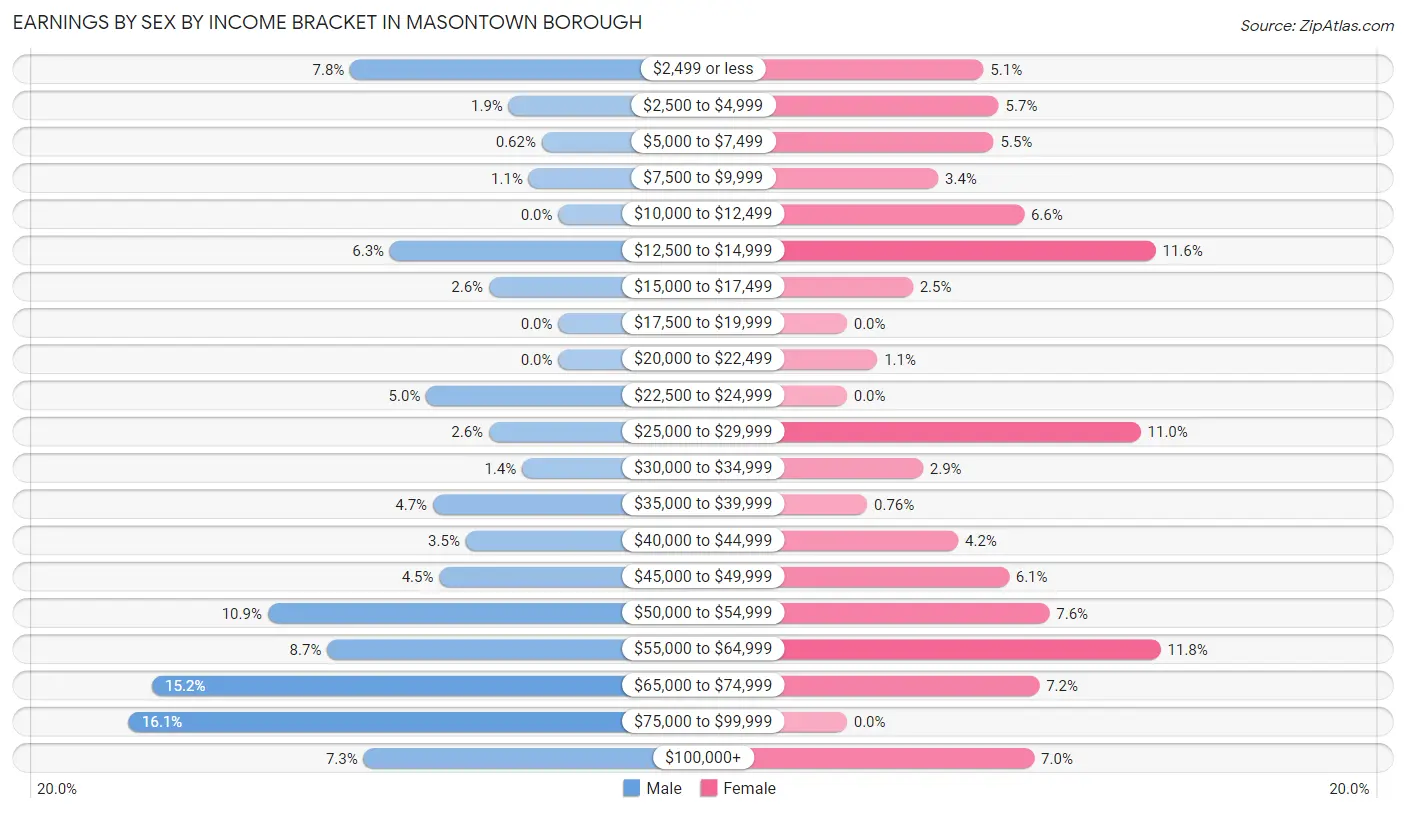
Earnings by Sex by Income Bracket in Masontown borough
The most common earnings brackets in Masontown borough are $75,000 to $99,999 for men (130 | 16.1%) and $55,000 to $64,999 for women (62 | 11.8%).
| Income | Male | Female |
| $2,499 or less | 63 (7.8%) | 27 (5.1%) |
| $2,500 to $4,999 | 15 (1.9%) | 30 (5.7%) |
| $5,000 to $7,499 | 5 (0.6%) | 29 (5.5%) |
| $7,500 to $9,999 | 9 (1.1%) | 18 (3.4%) |
| $10,000 to $12,499 | 0 (0.0%) | 35 (6.6%) |
| $12,500 to $14,999 | 51 (6.3%) | 61 (11.6%) |
| $15,000 to $17,499 | 21 (2.6%) | 13 (2.5%) |
| $17,500 to $19,999 | 0 (0.0%) | 0 (0.0%) |
| $20,000 to $22,499 | 0 (0.0%) | 6 (1.1%) |
| $22,500 to $24,999 | 40 (5.0%) | 0 (0.0%) |
| $25,000 to $29,999 | 21 (2.6%) | 58 (11.0%) |
| $30,000 to $34,999 | 11 (1.4%) | 15 (2.9%) |
| $35,000 to $39,999 | 38 (4.7%) | 4 (0.8%) |
| $40,000 to $44,999 | 28 (3.5%) | 22 (4.2%) |
| $45,000 to $49,999 | 36 (4.5%) | 32 (6.1%) |
| $50,000 to $54,999 | 88 (10.9%) | 40 (7.6%) |
| $55,000 to $64,999 | 70 (8.7%) | 62 (11.8%) |
| $65,000 to $74,999 | 123 (15.2%) | 38 (7.2%) |
| $75,000 to $99,999 | 130 (16.1%) | 0 (0.0%) |
| $100,000+ | 59 (7.3%) | 37 (7.0%) |
| Total | 808 (100.0%) | 527 (100.0%) |
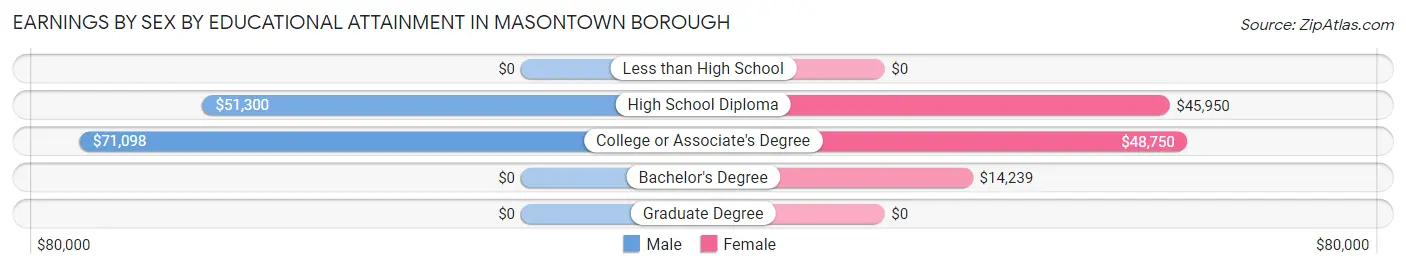
Earnings by Sex by Educational Attainment in Masontown borough
Average earnings in Masontown borough are $58,309 for men and $43,125 for women, a difference of 26.0%. Men with an educational attainment of college or associate's degree enjoy the highest average annual earnings of $71,098, while those with high school diploma education earn the least with $51,300. Women with an educational attainment of college or associate's degree earn the most with the average annual earnings of $48,750, while those with bachelor's degree education have the smallest earnings of $14,239.
| Educational Attainment | Male Income | Female Income |
| Less than High School | - | - |
| High School Diploma | $51,300 | $45,950 |
| College or Associate's Degree | $71,098 | $48,750 |
| Bachelor's Degree | - | - |
| Graduate Degree | - | - |
| Total | $58,309 | $43,125 |
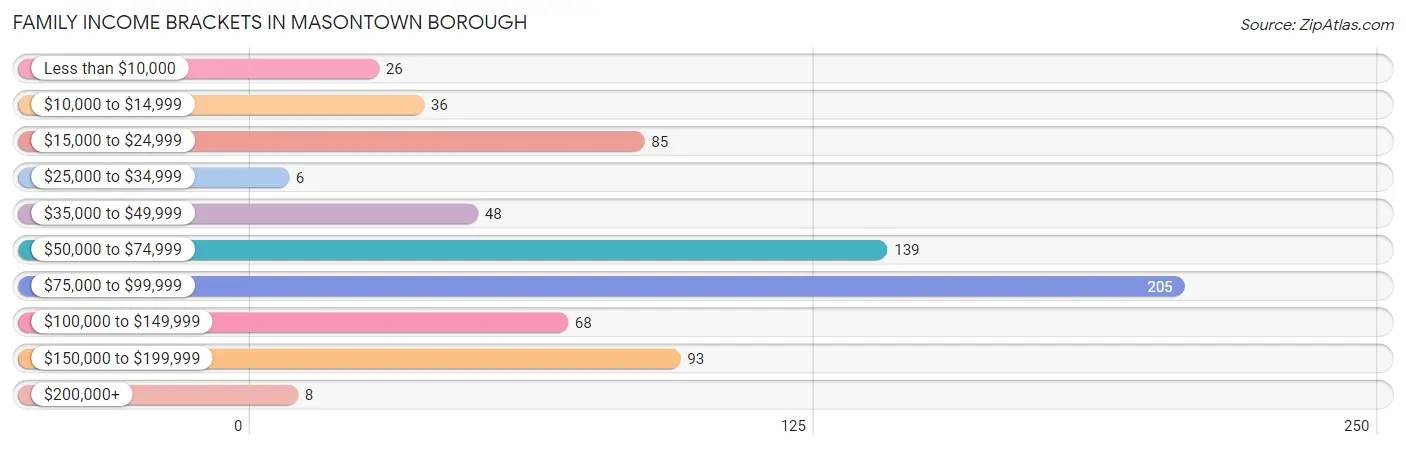
Family Income in Masontown borough
Family Income Brackets in Masontown borough
According to the Masontown borough family income data, there are 205 families falling into the $75,000 to $99,999 income range, which is the most common income bracket and makes up 28.7% of all families. Conversely, the $25,000 to $34,999 income bracket is the least frequent group with only 6 families (0.8%) belonging to this category.
| Income Bracket | # Families | % Families |
| Less than $10,000 | 26 | 3.6% |
| $10,000 to $14,999 | 36 | 5.0% |
| $15,000 to $24,999 | 85 | 11.9% |
| $25,000 to $34,999 | 6 | 0.8% |
| $35,000 to $49,999 | 48 | 6.7% |
| $50,000 to $74,999 | 139 | 19.5% |
| $75,000 to $99,999 | 205 | 28.7% |
| $100,000 to $149,999 | 68 | 9.5% |
| $150,000 to $199,999 | 93 | 13.0% |
| $200,000+ | 8 | 1.1% |
Family Income by Famaliy Size in Masontown borough
3-person families (174 | 24.4%) account for the highest median family income in Masontown borough with $84,900 per family, while 2-person families (259 | 36.3%) have the highest median income of $36,416 per family member.
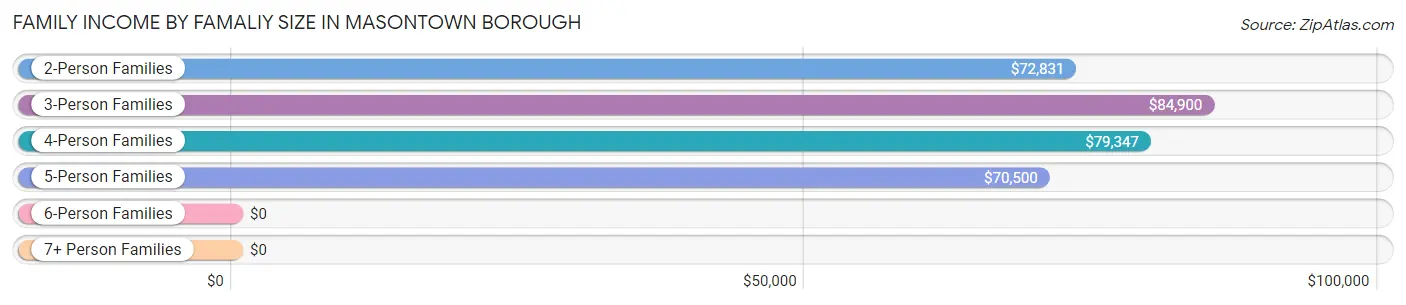
| Income Bracket | # Families | Median Income |
| 2-Person Families | 259 (36.3%) | $72,831 |
| 3-Person Families | 174 (24.4%) | $84,900 |
| 4-Person Families | 189 (26.5%) | $79,347 |
| 5-Person Families | 74 (10.4%) | $70,500 |
| 6-Person Families | 18 (2.5%) | $0 |
| 7+ Person Families | 0 (0.0%) | $0 |
| Total | 714 (100.0%) | $77,500 |
Family Income by Number of Earners in Masontown borough
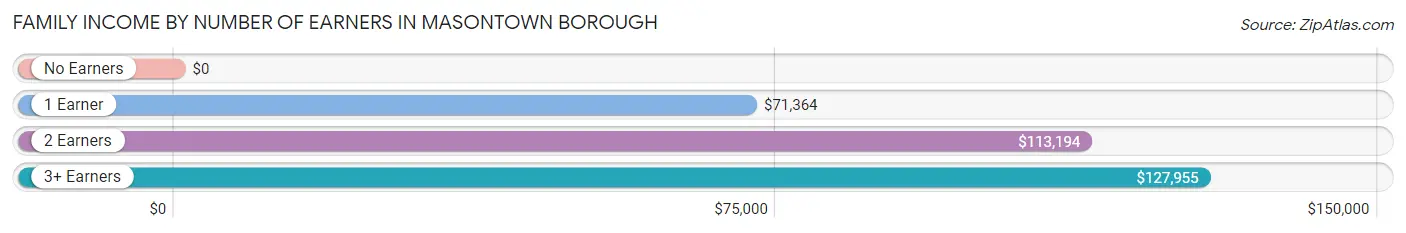
| Number of Earners | # Families | Median Income |
| No Earners | 131 (18.3%) | $0 |
| 1 Earner | 320 (44.8%) | $71,364 |
| 2 Earners | 209 (29.3%) | $113,194 |
| 3+ Earners | 54 (7.6%) | $127,955 |
| Total | 714 (100.0%) | $77,500 |
Household Income in Masontown borough
Household Income Brackets in Masontown borough
With 289 households falling in the category, the $75,000 to $99,999 income range is the most frequent in Masontown borough, accounting for 21.5% of all households. In contrast, only 8 households (0.6%) fall into the $200,000+ income bracket, making it the least populous group.
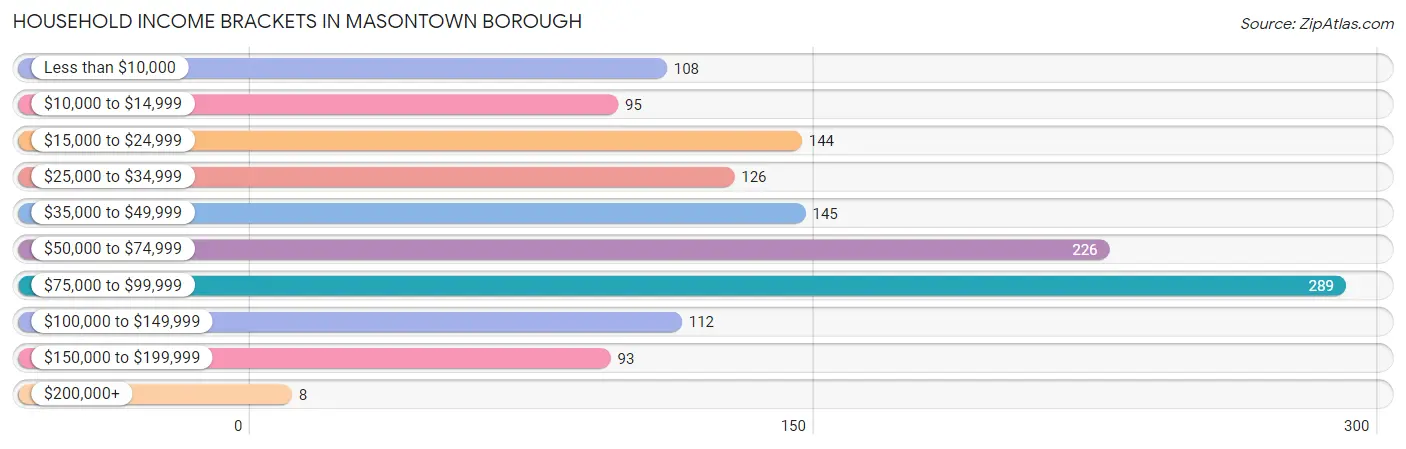
| Income Bracket | # Households | % Households |
| Less than $10,000 | 108 | 8.0% |
| $10,000 to $14,999 | 95 | 7.1% |
| $15,000 to $24,999 | 144 | 10.7% |
| $25,000 to $34,999 | 126 | 9.4% |
| $35,000 to $49,999 | 145 | 10.8% |
| $50,000 to $74,999 | 226 | 16.8% |
| $75,000 to $99,999 | 289 | 21.5% |
| $100,000 to $149,999 | 112 | 8.3% |
| $150,000 to $199,999 | 93 | 6.9% |
| $200,000+ | 8 | 0.6% |
Household Income by Householder Age in Masontown borough
The median household income in Masontown borough is $52,692, with the highest median household income of $89,875 found in the 15 to 24 years age bracket for the primary householder. A total of 57 households (4.2%) fall into this category. Meanwhile, the 65+ years age bracket for the primary householder has the lowest median household income of $34,052, with 408 households (30.4%) in this group.
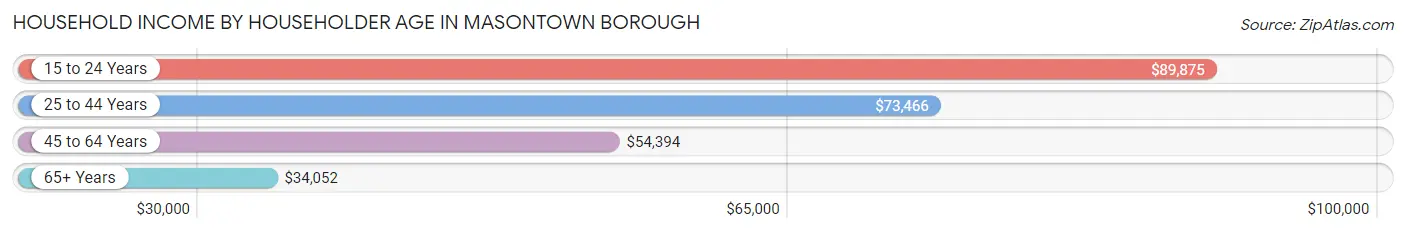
| Income Bracket | # Households | Median Income |
| 15 to 24 Years | 57 (4.2%) | $89,875 |
| 25 to 44 Years | 379 (28.2%) | $73,466 |
| 45 to 64 Years | 500 (37.2%) | $54,394 |
| 65+ Years | 408 (30.4%) | $34,052 |
| Total | 1,344 (100.0%) | $52,692 |
Poverty in Masontown borough
Income Below Poverty by Sex and Age in Masontown borough
With 20.4% poverty level for males and 31.2% for females among the residents of Masontown borough, 16 and 17 year old males and 6 to 11 year old females are the most vulnerable to poverty, with 58 males (92.1%) and 60 females (93.8%) in their respective age groups living below the poverty level.
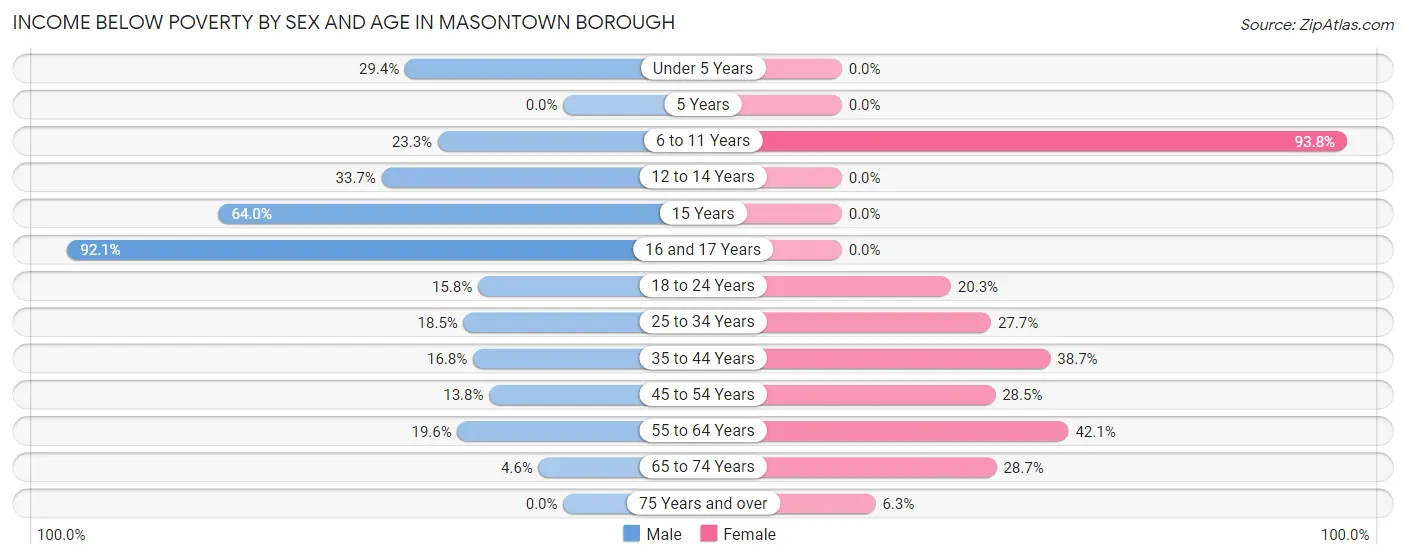
| Age Bracket | Male | Female |
| Under 5 Years | 62 (29.4%) | 0 (0.0%) |
| 5 Years | 0 (0.0%) | 0 (0.0%) |
| 6 to 11 Years | 27 (23.3%) | 60 (93.8%) |
| 12 to 14 Years | 28 (33.7%) | 0 (0.0%) |
| 15 Years | 16 (64.0%) | 0 (0.0%) |
| 16 and 17 Years | 58 (92.1%) | 0 (0.0%) |
| 18 to 24 Years | 16 (15.8%) | 16 (20.3%) |
| 25 to 34 Years | 47 (18.5%) | 59 (27.7%) |
| 35 to 44 Years | 28 (16.8%) | 91 (38.7%) |
| 45 to 54 Years | 37 (13.8%) | 45 (28.5%) |
| 55 to 64 Years | 44 (19.6%) | 93 (42.1%) |
| 65 to 74 Years | 6 (4.6%) | 58 (28.7%) |
| 75 Years and over | 0 (0.0%) | 9 (6.2%) |
| Total | 369 (20.4%) | 431 (31.2%) |
Income Above Poverty by Sex and Age in Masontown borough
According to the poverty statistics in Masontown borough, males aged 5 years and females aged 12 to 14 years are the age groups that are most secure financially, with 100.0% of males and 100.0% of females in these age groups living above the poverty line.
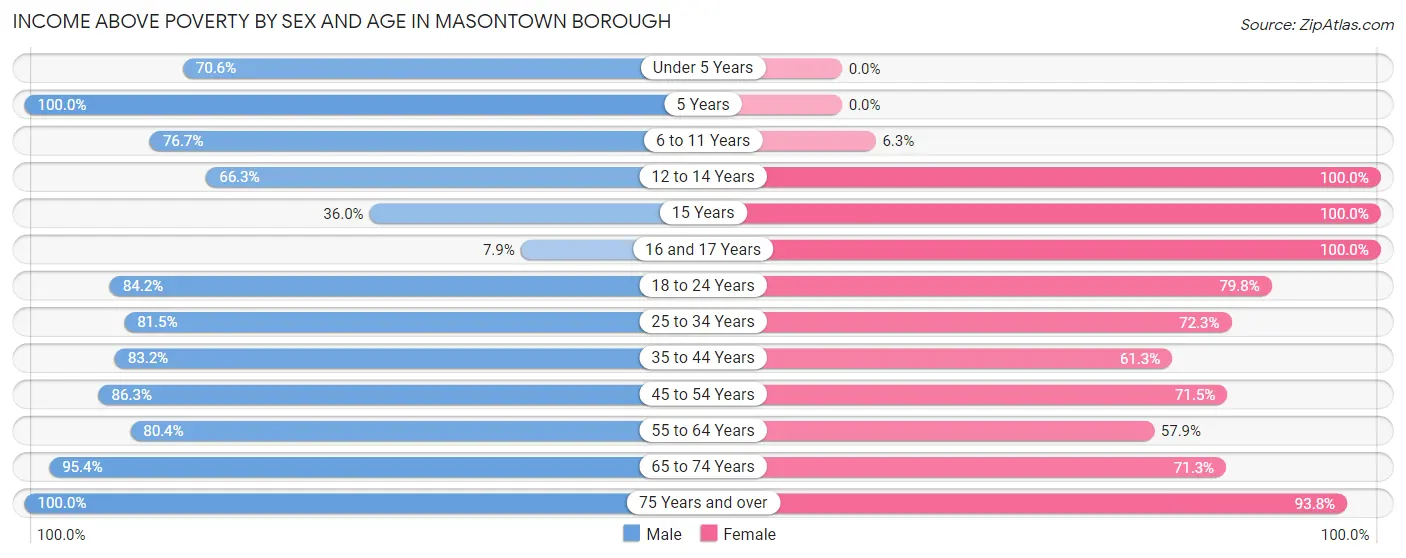
| Age Bracket | Male | Female |
| Under 5 Years | 149 (70.6%) | 0 (0.0%) |
| 5 Years | 100 (100.0%) | 0 (0.0%) |
| 6 to 11 Years | 89 (76.7%) | 4 (6.2%) |
| 12 to 14 Years | 55 (66.3%) | 31 (100.0%) |
| 15 Years | 9 (36.0%) | 13 (100.0%) |
| 16 and 17 Years | 5 (7.9%) | 22 (100.0%) |
| 18 to 24 Years | 85 (84.2%) | 63 (79.7%) |
| 25 to 34 Years | 207 (81.5%) | 154 (72.3%) |
| 35 to 44 Years | 139 (83.2%) | 144 (61.3%) |
| 45 to 54 Years | 232 (86.3%) | 113 (71.5%) |
| 55 to 64 Years | 180 (80.4%) | 128 (57.9%) |
| 65 to 74 Years | 125 (95.4%) | 144 (71.3%) |
| 75 Years and over | 61 (100.0%) | 135 (93.8%) |
| Total | 1,436 (79.6%) | 951 (68.8%) |
Income Below Poverty Among Married-Couple Families in Masontown borough
The poverty statistics for married-couple families in Masontown borough show that 12.4% or 66 of the total 534 families live below the poverty line. Families with 1 or 2 children have the highest poverty rate of 23.0%, comprising of 60 families. On the other hand, families with 3 or 4 children have the lowest poverty rate of 0.0%, which includes 0 families.
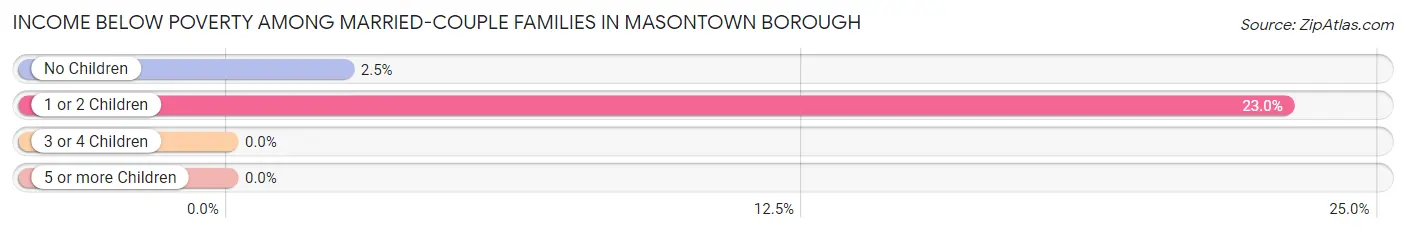
| Children | Above Poverty | Below Poverty |
| No Children | 232 (97.5%) | 6 (2.5%) |
| 1 or 2 Children | 201 (77.0%) | 60 (23.0%) |
| 3 or 4 Children | 35 (100.0%) | 0 (0.0%) |
| 5 or more Children | 0 (0.0%) | 0 (0.0%) |
| Total | 468 (87.6%) | 66 (12.4%) |
Income Below Poverty Among Single-Parent Households in Masontown borough
According to the poverty data in Masontown borough, 23.4% or 15 single-father households and 37.9% or 44 single-mother households are living below the poverty line. Among single-father households, those with 1 or 2 children have the highest poverty rate, with 15 households (28.3%) experiencing poverty. Likewise, among single-mother households, those with 3 or 4 children have the highest poverty rate, with 18 households (100.0%) falling below the poverty line.
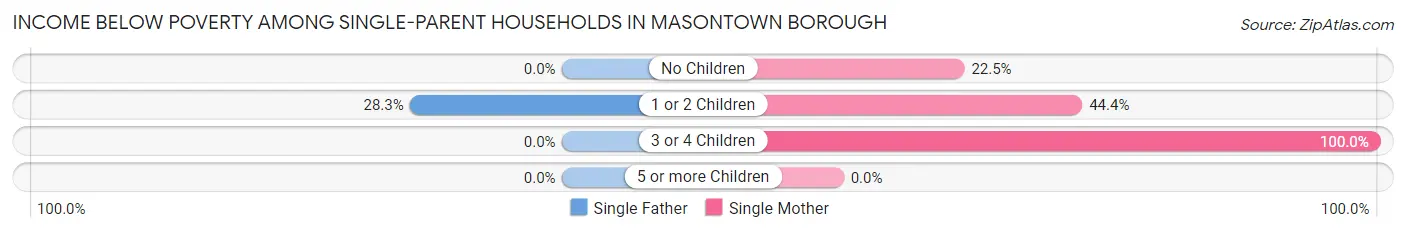
| Children | Single Father | Single Mother |
| No Children | 0 (0.0%) | 18 (22.5%) |
| 1 or 2 Children | 15 (28.3%) | 8 (44.4%) |
| 3 or 4 Children | 0 (0.0%) | 18 (100.0%) |
| 5 or more Children | 0 (0.0%) | 0 (0.0%) |
| Total | 15 (23.4%) | 44 (37.9%) |
Income Below Poverty Among Married-Couple vs Single-Parent Households in Masontown borough
The poverty data for Masontown borough shows that 66 of the married-couple family households (12.4%) and 59 of the single-parent households (32.8%) are living below the poverty level. Within the married-couple family households, those with 1 or 2 children have the highest poverty rate, with 60 households (23.0%) falling below the poverty line. Among the single-parent households, those with 3 or 4 children have the highest poverty rate, with 18 household (100.0%) living below poverty.
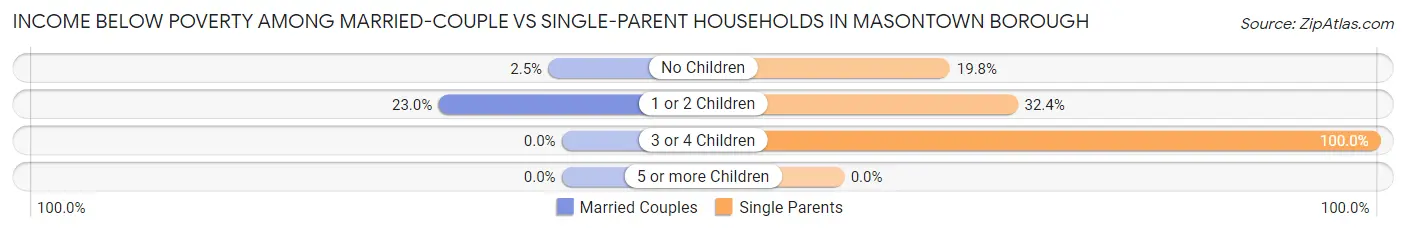
| Children | Married-Couple Families | Single-Parent Households |
| No Children | 6 (2.5%) | 18 (19.8%) |
| 1 or 2 Children | 60 (23.0%) | 23 (32.4%) |
| 3 or 4 Children | 0 (0.0%) | 18 (100.0%) |
| 5 or more Children | 0 (0.0%) | 0 (0.0%) |
| Total | 66 (12.4%) | 59 (32.8%) |
Race in Masontown borough
The most populous races in Masontown borough are White / Caucasian (2,799 | 85.8%), Black / African American (267 | 8.2%), and Two or more Races (197 | 6.0%).
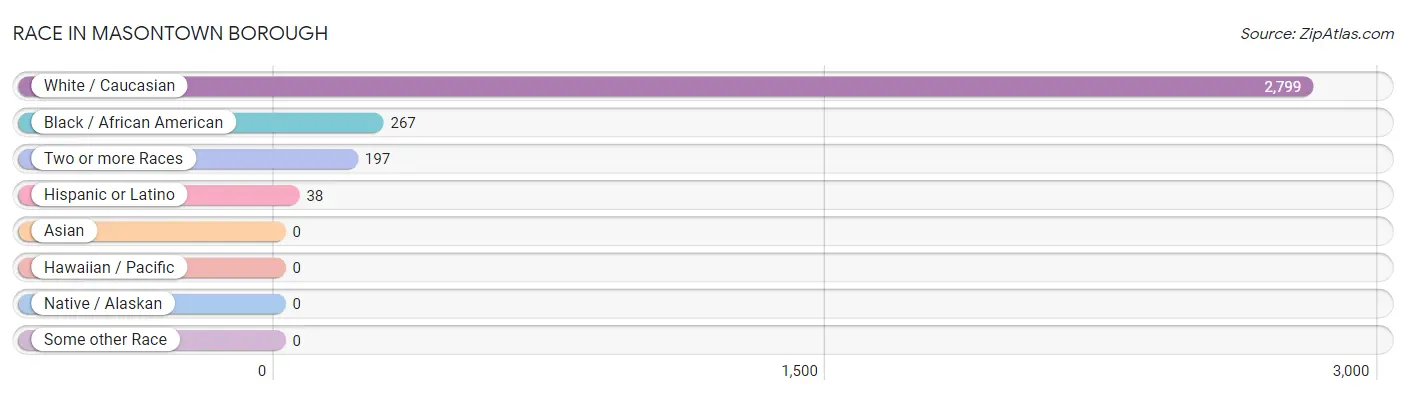
| Race | # Population | % Population |
| Asian | 0 | 0.0% |
| Black / African American | 267 | 8.2% |
| Hawaiian / Pacific | 0 | 0.0% |
| Hispanic or Latino | 38 | 1.2% |
| Native / Alaskan | 0 | 0.0% |
| White / Caucasian | 2,799 | 85.8% |
| Two or more Races | 197 | 6.0% |
| Some other Race | 0 | 0.0% |
| Total | 3,263 | 100.0% |
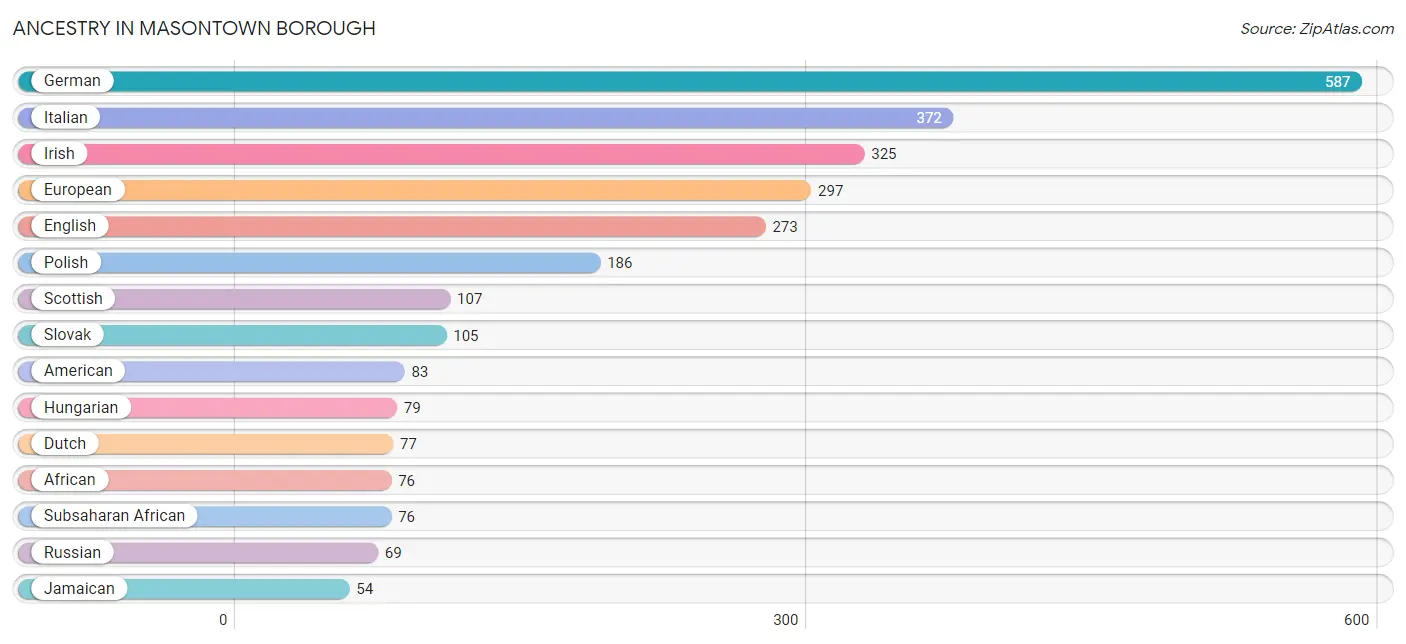
Ancestry in Masontown borough
The most populous ancestries reported in Masontown borough are German (587 | 18.0%), Italian (372 | 11.4%), Irish (325 | 10.0%), European (297 | 9.1%), and English (273 | 8.4%), together accounting for 56.8% of all Masontown borough residents.
| Ancestry | # Population | % Population |
| African | 76 | 2.3% |
| American | 83 | 2.5% |
| Australian | 6 | 0.2% |
| Austrian | 4 | 0.1% |
| Belgian | 19 | 0.6% |
| Canadian | 9 | 0.3% |
| Cherokee | 5 | 0.2% |
| Croatian | 40 | 1.2% |
| Czech | 6 | 0.2% |
| Czechoslovakian | 31 | 0.9% |
| Dutch | 77 | 2.4% |
| Eastern European | 11 | 0.3% |
| English | 273 | 8.4% |
| European | 297 | 9.1% |
| Finnish | 17 | 0.5% |
| French | 17 | 0.5% |
| German | 587 | 18.0% |
| Greek | 47 | 1.4% |
| Hungarian | 79 | 2.4% |
| Irish | 325 | 10.0% |
| Italian | 372 | 11.4% |
| Jamaican | 54 | 1.7% |
| Norwegian | 4 | 0.1% |
| Pennsylvania German | 6 | 0.2% |
| Polish | 186 | 5.7% |
| Puerto Rican | 38 | 1.2% |
| Russian | 69 | 2.1% |
| Scotch-Irish | 37 | 1.1% |
| Scottish | 107 | 3.3% |
| Slovak | 105 | 3.2% |
| Slovene | 6 | 0.2% |
| Subsaharan African | 76 | 2.3% |
| Welsh | 24 | 0.7% | View All 33 Rows |
Immigrants in Masontown borough
The most numerous immigrant groups reported in Masontown borough came from Canada (9 | 0.3%), Europe (1 | 0.0%), Italy (1 | 0.0%), and Southern Europe (1 | 0.0%), together accounting for 0.4% of all Masontown borough residents.
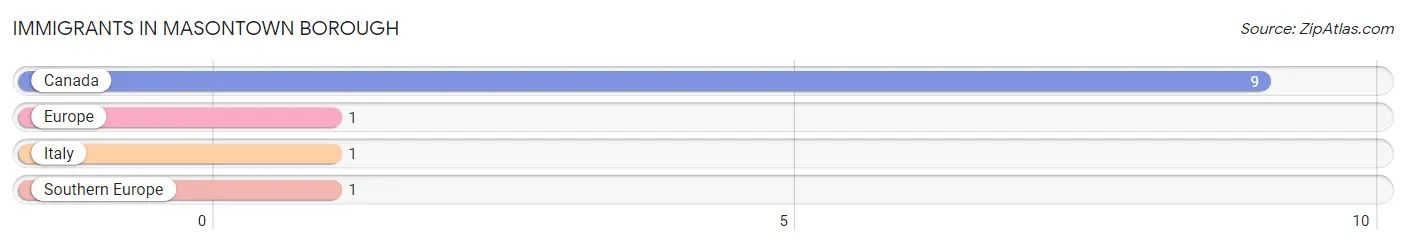
| Immigration Origin | # Population | % Population |
| Canada | 9 | 0.3% |
| Europe | 1 | 0.0% |
| Italy | 1 | 0.0% |
| Southern Europe | 1 | 0.0% | View All 4 Rows |
Sex and Age in Masontown borough
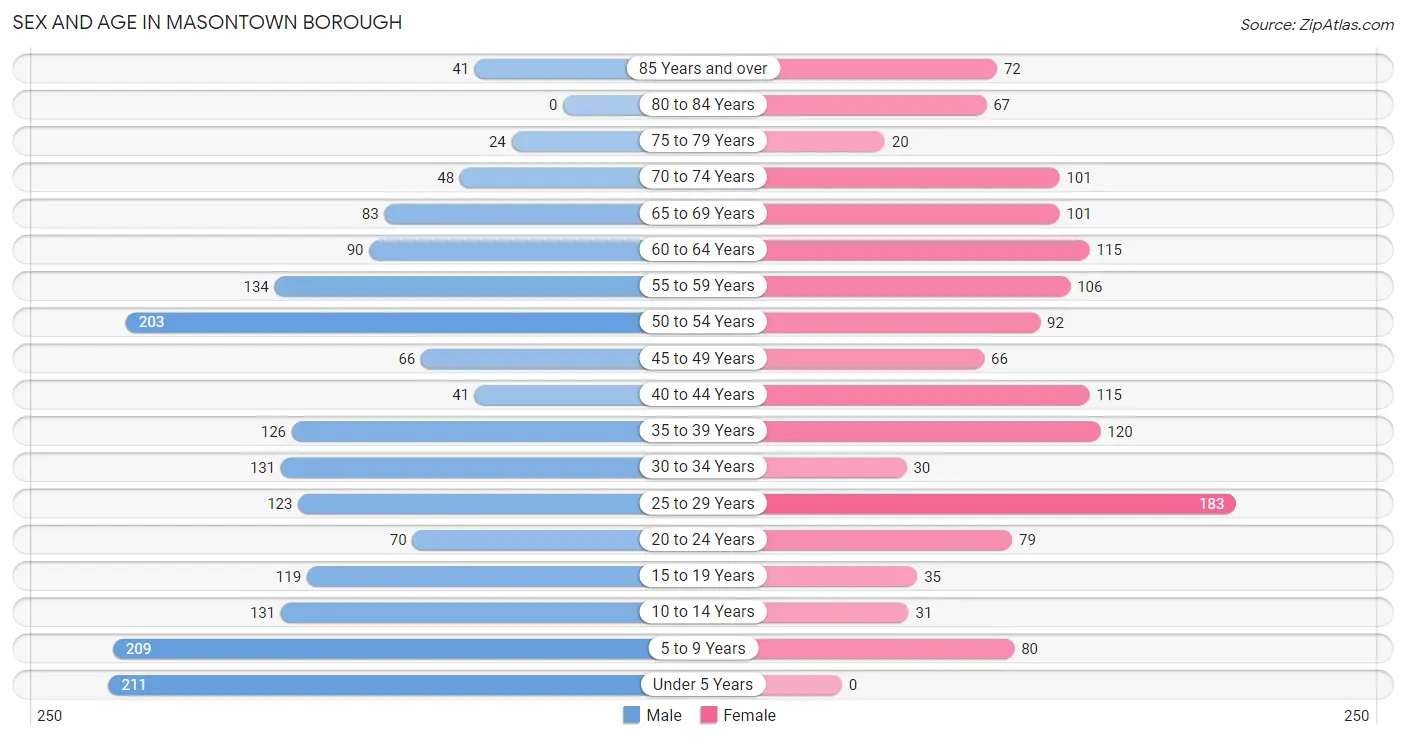
Sex and Age in Masontown borough
The most populous age groups in Masontown borough are Under 5 Years (211 | 11.4%) for men and 25 to 29 Years (183 | 13.0%) for women.
| Age Bracket | Male | Female |
| Under 5 Years | 211 (11.4%) | 0 (0.0%) |
| 5 to 9 Years | 209 (11.3%) | 80 (5.7%) |
| 10 to 14 Years | 131 (7.1%) | 31 (2.2%) |
| 15 to 19 Years | 119 (6.4%) | 35 (2.5%) |
| 20 to 24 Years | 70 (3.8%) | 79 (5.6%) |
| 25 to 29 Years | 123 (6.7%) | 183 (13.0%) |
| 30 to 34 Years | 131 (7.1%) | 30 (2.1%) |
| 35 to 39 Years | 126 (6.8%) | 120 (8.5%) |
| 40 to 44 Years | 41 (2.2%) | 115 (8.1%) |
| 45 to 49 Years | 66 (3.6%) | 66 (4.7%) |
| 50 to 54 Years | 203 (11.0%) | 92 (6.5%) |
| 55 to 59 Years | 134 (7.2%) | 106 (7.5%) |
| 60 to 64 Years | 90 (4.9%) | 115 (8.1%) |
| 65 to 69 Years | 83 (4.5%) | 101 (7.1%) |
| 70 to 74 Years | 48 (2.6%) | 101 (7.1%) |
| 75 to 79 Years | 24 (1.3%) | 20 (1.4%) |
| 80 to 84 Years | 0 (0.0%) | 67 (4.7%) |
| 85 Years and over | 41 (2.2%) | 72 (5.1%) |
| Total | 1,850 (100.0%) | 1,413 (100.0%) |
Families and Households in Masontown borough
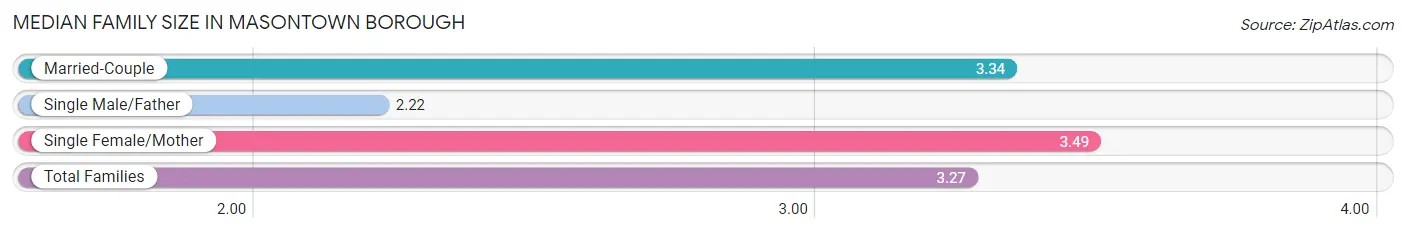
Median Family Size in Masontown borough
The median family size in Masontown borough is 3.27 persons per family, with single female/mother families (116 | 16.3%) accounting for the largest median family size of 3.49 persons per family. On the other hand, single male/father families (64 | 9.0%) represent the smallest median family size with 2.22 persons per family.
| Family Type | # Families | Family Size |
| Married-Couple | 534 (74.8%) | 3.34 |
| Single Male/Father | 64 (9.0%) | 2.22 |
| Single Female/Mother | 116 (16.3%) | 3.49 |
| Total Families | 714 (100.0%) | 3.27 |
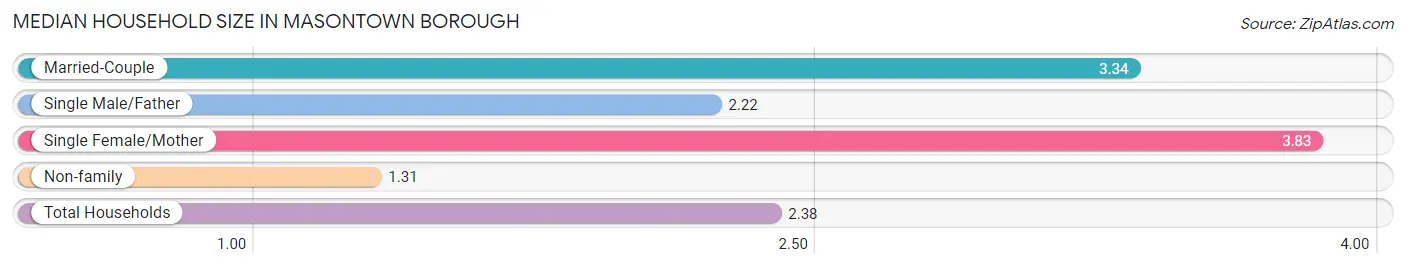
Median Household Size in Masontown borough
The median household size in Masontown borough is 2.38 persons per household, with single female/mother households (116 | 8.6%) accounting for the largest median household size of 3.83 persons per household. non-family households (630 | 46.9%) represent the smallest median household size with 1.31 persons per household.
| Household Type | # Households | Household Size |
| Married-Couple | 534 (39.7%) | 3.34 |
| Single Male/Father | 64 (4.8%) | 2.22 |
| Single Female/Mother | 116 (8.6%) | 3.83 |
| Non-family | 630 (46.9%) | 1.31 |
| Total Households | 1,344 (100.0%) | 2.38 |
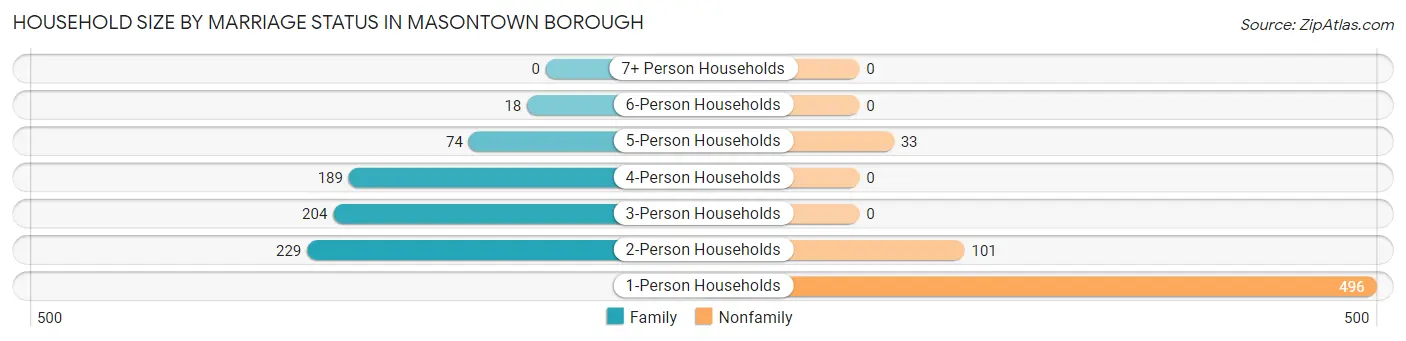
Household Size by Marriage Status in Masontown borough
Out of a total of 1,344 households in Masontown borough, 714 (53.1%) are family households, while 630 (46.9%) are nonfamily households. The most numerous type of family households are 2-person households, comprising 229, and the most common type of nonfamily households are 1-person households, comprising 496.
| Household Size | Family Households | Nonfamily Households |
| 1-Person Households | - | 496 (36.9%) |
| 2-Person Households | 229 (17.0%) | 101 (7.5%) |
| 3-Person Households | 204 (15.2%) | 0 (0.0%) |
| 4-Person Households | 189 (14.1%) | 0 (0.0%) |
| 5-Person Households | 74 (5.5%) | 33 (2.5%) |
| 6-Person Households | 18 (1.3%) | 0 (0.0%) |
| 7+ Person Households | 0 (0.0%) | 0 (0.0%) |
| Total | 714 (53.1%) | 630 (46.9%) |
Female Fertility in Masontown borough
Fertility by Age in Masontown borough
Average fertility rate in Masontown borough is 44.0 births per 1,000 women. Women in the age bracket of 20 to 34 years have the highest fertility rate with 99.0 births per 1,000 women. Women in the age bracket of 20 to 34 years acount for 100.0% of all women with births.
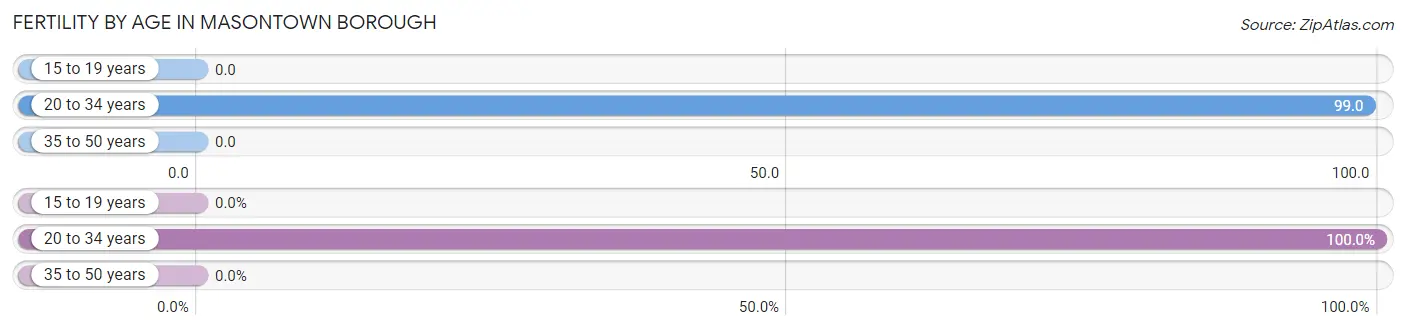
| Age Bracket | Women with Births | Births / 1,000 Women |
| 15 to 19 years | 0 (0.0%) | 0.0 |
| 20 to 34 years | 29 (100.0%) | 99.0 |
| 35 to 50 years | 0 (0.0%) | 0.0 |
| Total | 29 (100.0%) | 44.0 |
Fertility by Age by Marriage Status in Masontown borough
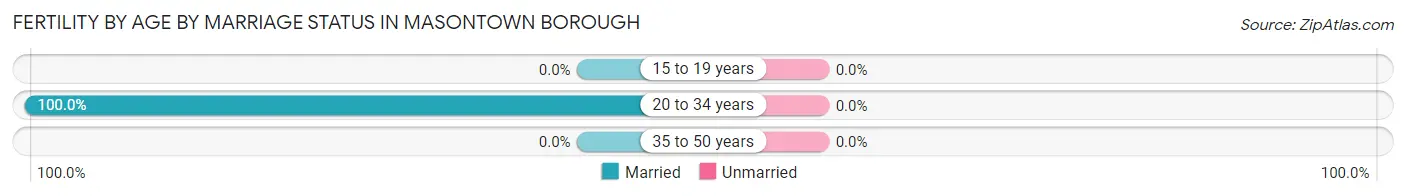
| Age Bracket | Married | Unmarried |
| 15 to 19 years | 0 (0.0%) | 0 (0.0%) |
| 20 to 34 years | 29 (100.0%) | 0 (0.0%) |
| 35 to 50 years | 0 (0.0%) | 0 (0.0%) |
| Total | 29 (100.0%) | 0 (0.0%) |
Fertility by Education in Masontown borough
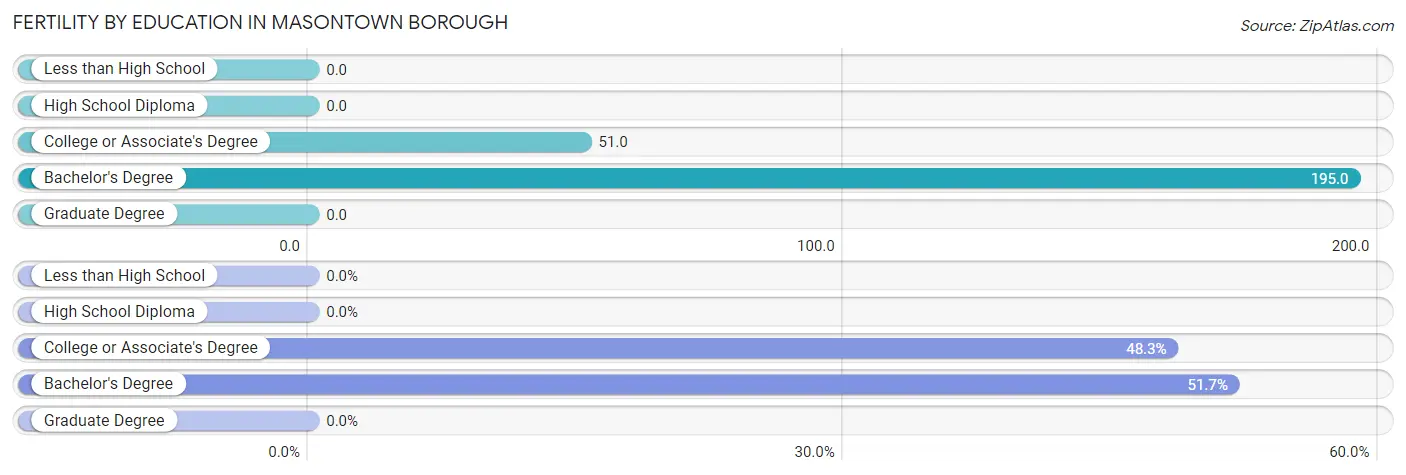
| Educational Attainment | Women with Births | Births / 1,000 Women |
| Less than High School | 0 (0.0%) | 0.0 |
| High School Diploma | 0 (0.0%) | 0.0 |
| College or Associate's Degree | 14 (48.3%) | 51.0 |
| Bachelor's Degree | 15 (51.7%) | 195.0 |
| Graduate Degree | 0 (0.0%) | 0.0 |
| Total | 29 (100.0%) | 44.0 |
Fertility by Education by Marriage Status in Masontown borough
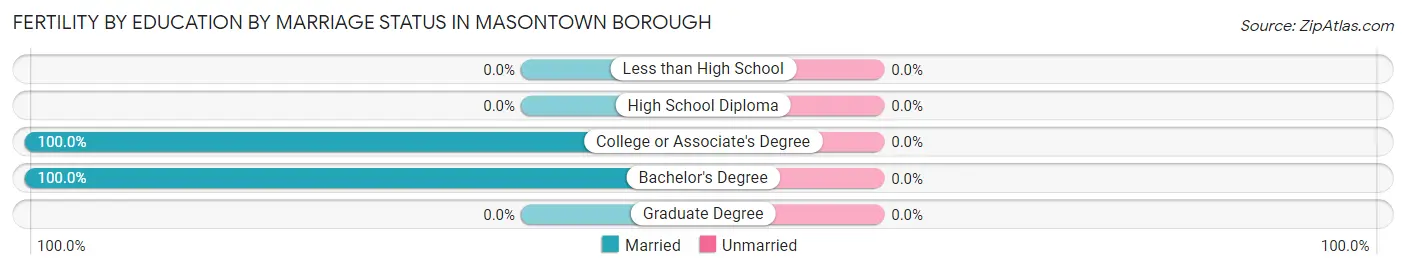
| Educational Attainment | Married | Unmarried |
| Less than High School | 0 (0.0%) | 0 (0.0%) |
| High School Diploma | 0 (0.0%) | 0 (0.0%) |
| College or Associate's Degree | 14 (100.0%) | 0 (0.0%) |
| Bachelor's Degree | 15 (100.0%) | 0 (0.0%) |
| Graduate Degree | 0 (0.0%) | 0 (0.0%) |
| Total | 29 (100.0%) | 0 (0.0%) |
Employment Characteristics in Masontown borough
Employment by Class of Employer in Masontown borough
Among the 1,164 employed individuals in Masontown borough, private company employees (742 | 63.7%), not-for-profit organizations (147 | 12.6%), and local government employees (146 | 12.5%) make up the most common classes of employment.
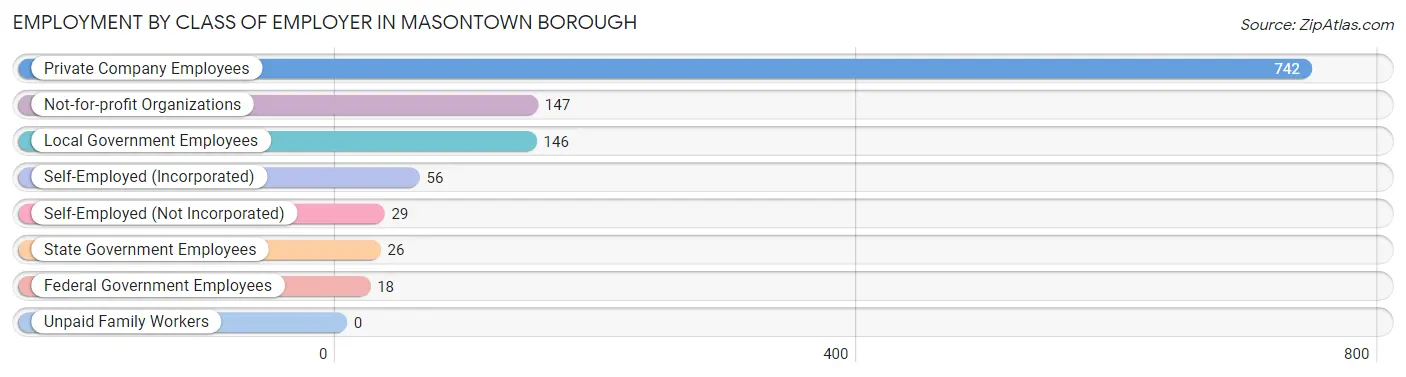
| Employer Class | # Employees | % Employees |
| Private Company Employees | 742 | 63.7% |
| Self-Employed (Incorporated) | 56 | 4.8% |
| Self-Employed (Not Incorporated) | 29 | 2.5% |
| Not-for-profit Organizations | 147 | 12.6% |
| Local Government Employees | 146 | 12.5% |
| State Government Employees | 26 | 2.2% |
| Federal Government Employees | 18 | 1.5% |
| Unpaid Family Workers | 0 | 0.0% |
| Total | 1,164 | 100.0% |
Employment Status by Age in Masontown borough
According to the labor force statistics for Masontown borough, out of the total population over 16 years of age (2,563), 51.1% or 1,310 individuals are in the labor force, with 9.5% or 124 of them unemployed. The age group with the highest labor force participation rate is 20 to 24 years, with 94.6% or 141 individuals in the labor force. Within the labor force, the 16 to 19 years age range has the highest percentage of unemployed individuals, with 44.8% or 30 of them being unemployed.
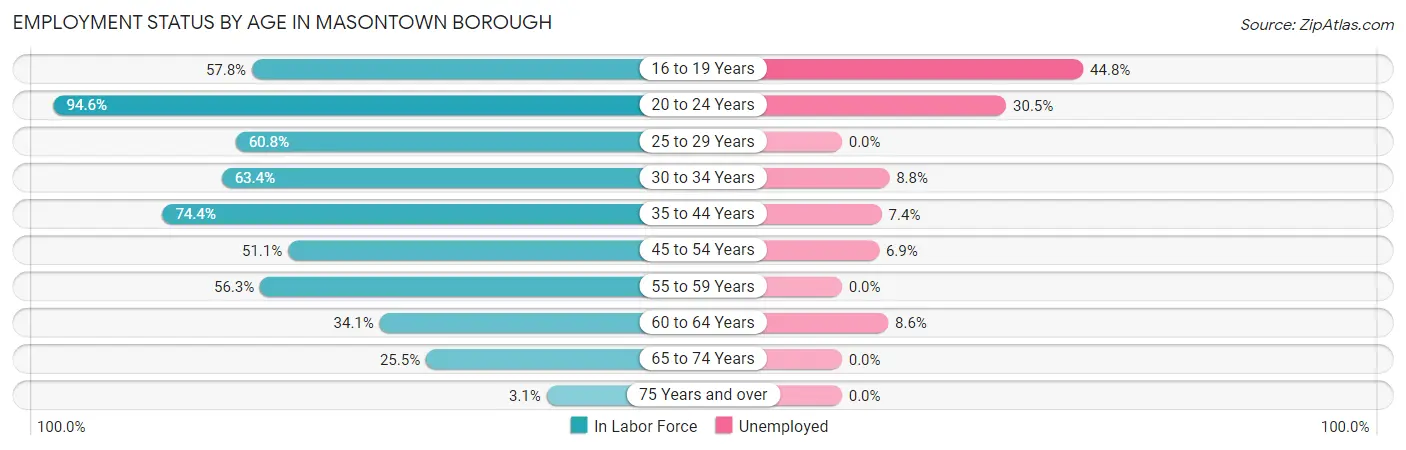
| Age Bracket | In Labor Force | Unemployed |
| 16 to 19 Years | 67 (57.8%) | 30 (44.8%) |
| 20 to 24 Years | 141 (94.6%) | 43 (30.5%) |
| 25 to 29 Years | 186 (60.8%) | 0 (0.0%) |
| 30 to 34 Years | 102 (63.4%) | 9 (8.8%) |
| 35 to 44 Years | 299 (74.4%) | 22 (7.4%) |
| 45 to 54 Years | 218 (51.1%) | 15 (6.9%) |
| 55 to 59 Years | 135 (56.3%) | 0 (0.0%) |
| 60 to 64 Years | 70 (34.1%) | 6 (8.6%) |
| 65 to 74 Years | 85 (25.5%) | 0 (0.0%) |
| 75 Years and over | 7 (3.1%) | 0 (0.0%) |
| Total | 1,310 (51.1%) | 124 (9.5%) |
Employment Status by Educational Attainment in Masontown borough
According to labor force statistics for Masontown borough, 58.0% of individuals (1,010) out of the total population between 25 and 64 years of age (1,741) are in the labor force, with 5.1% or 52 of them being unemployed. The group with the highest labor force participation rate are those with the educational attainment of college / associate degree, with 74.4% or 462 individuals in the labor force. Within the labor force, individuals with high school diploma education have the highest percentage of unemployment, with 7.7% or 31 of them being unemployed.
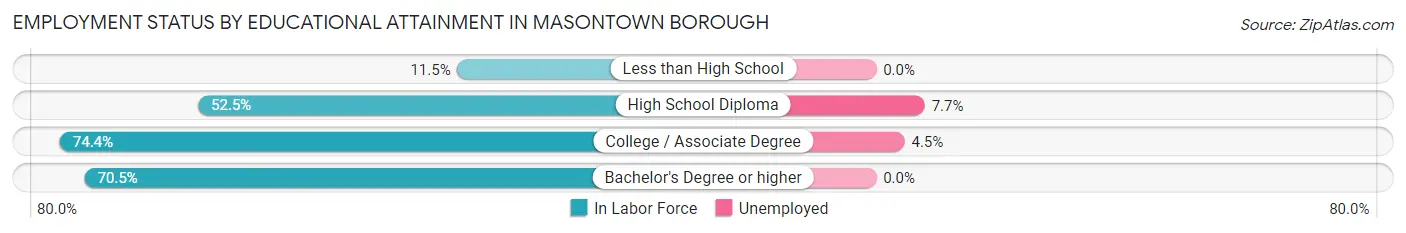
| Educational Attainment | In Labor Force | Unemployed |
| Less than High School | 20 (11.5%) | 0 (0.0%) |
| High School Diploma | 404 (52.5%) | 59 (7.7%) |
| College / Associate Degree | 462 (74.4%) | 28 (4.5%) |
| Bachelor's Degree or higher | 124 (70.5%) | 0 (0.0%) |
| Total | 1,010 (58.0%) | 89 (5.1%) |
Employment Occupations by Sex in Masontown borough
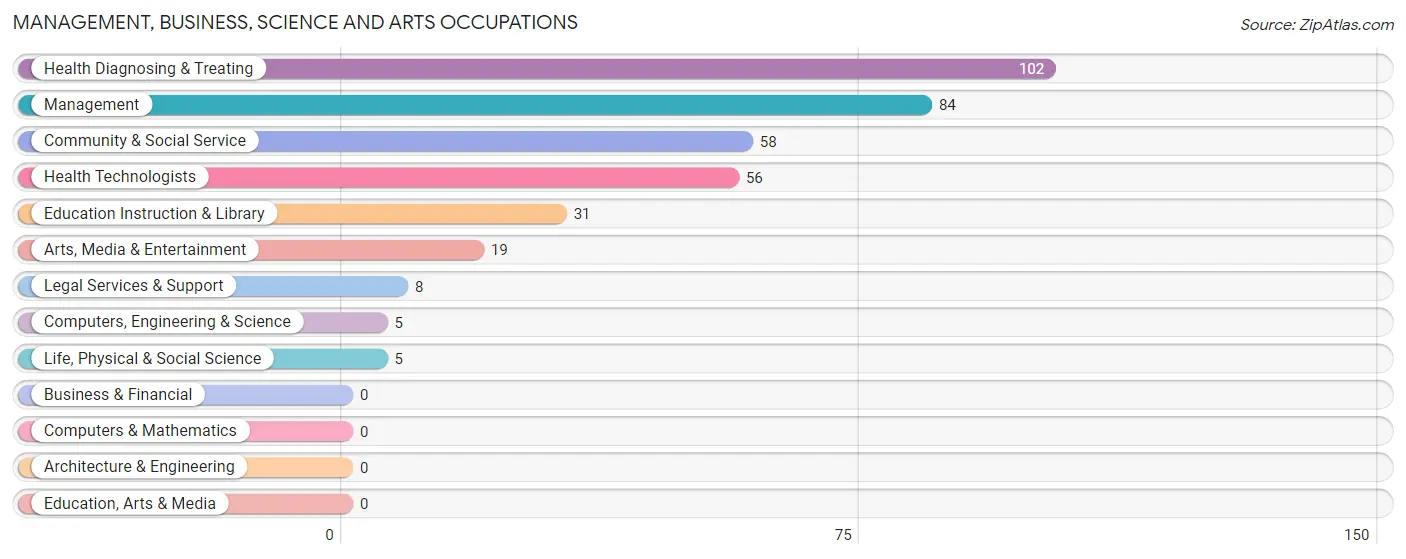
Management, Business, Science and Arts Occupations
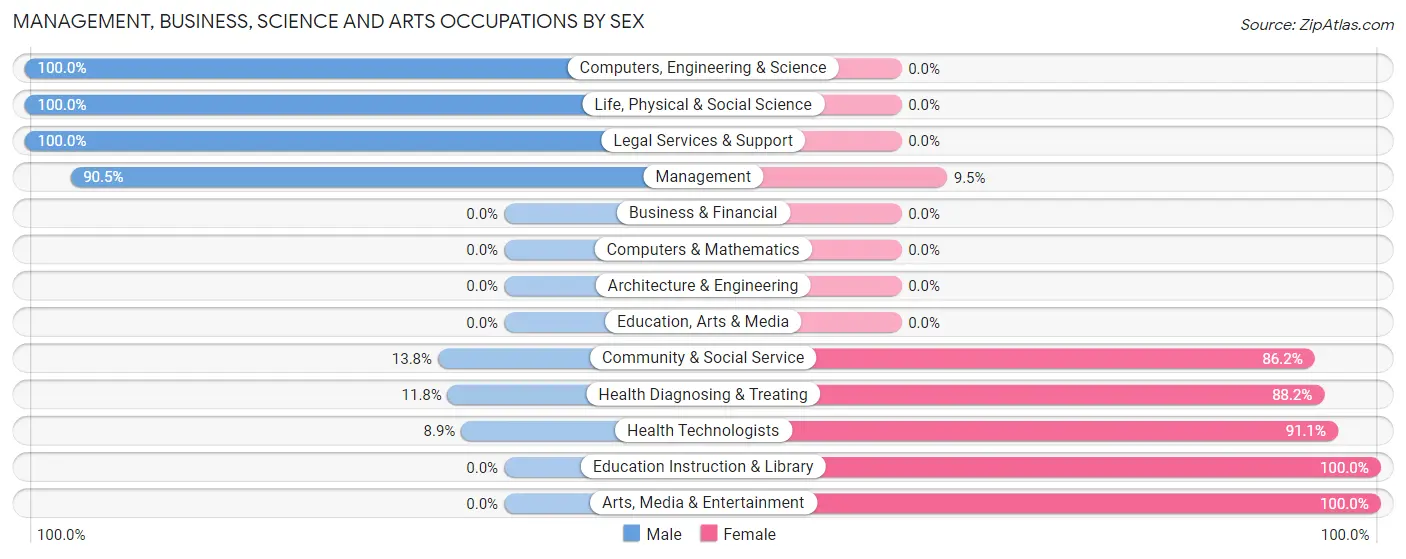
The most common Management, Business, Science and Arts occupations in Masontown borough are Health Diagnosing & Treating (102 | 8.6%), Management (84 | 7.1%), Community & Social Service (58 | 4.9%), Health Technologists (56 | 4.7%), and Education Instruction & Library (31 | 2.6%).
Management, Business, Science and Arts Occupations by Sex
Within the Management, Business, Science and Arts occupations in Masontown borough, the most male-oriented occupations are Computers, Engineering & Science (100.0%), Life, Physical & Social Science (100.0%), and Legal Services & Support (100.0%), while the most female-oriented occupations are Education Instruction & Library (100.0%), Arts, Media & Entertainment (100.0%), and Health Technologists (91.1%).
| Occupation | Male | Female |
| Management | 76 (90.5%) | 8 (9.5%) |
| Business & Financial | 0 (0.0%) | 0 (0.0%) |
| Computers, Engineering & Science | 5 (100.0%) | 0 (0.0%) |
| Computers & Mathematics | 0 (0.0%) | 0 (0.0%) |
| Architecture & Engineering | 0 (0.0%) | 0 (0.0%) |
| Life, Physical & Social Science | 5 (100.0%) | 0 (0.0%) |
| Community & Social Service | 8 (13.8%) | 50 (86.2%) |
| Education, Arts & Media | 0 (0.0%) | 0 (0.0%) |
| Legal Services & Support | 8 (100.0%) | 0 (0.0%) |
| Education Instruction & Library | 0 (0.0%) | 31 (100.0%) |
| Arts, Media & Entertainment | 0 (0.0%) | 19 (100.0%) |
| Health Diagnosing & Treating | 12 (11.8%) | 90 (88.2%) |
| Health Technologists | 5 (8.9%) | 51 (91.1%) |
| Total (Category) | 101 (40.6%) | 148 (59.4%) |
| Total (Overall) | 723 (61.0%) | 462 (39.0%) |
Services Occupations
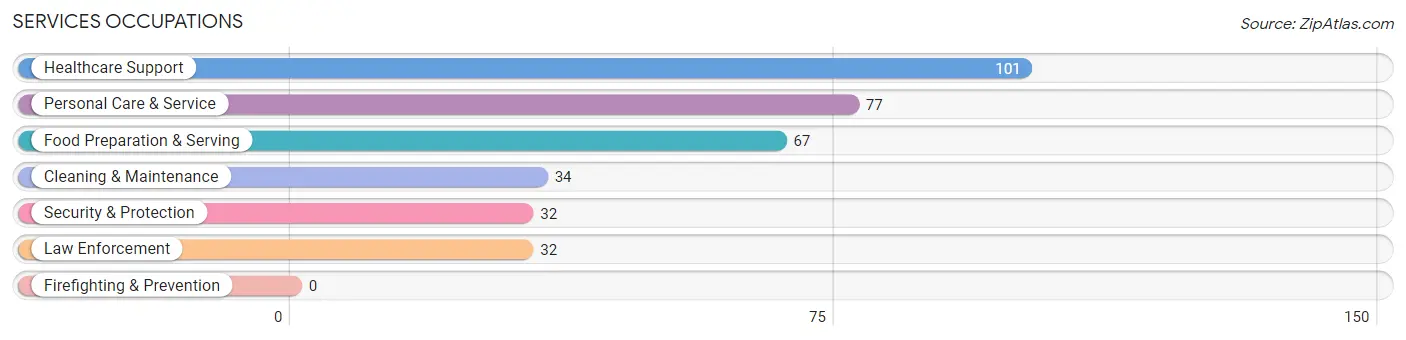
The most common Services occupations in Masontown borough are Healthcare Support (101 | 8.5%), Personal Care & Service (77 | 6.5%), Food Preparation & Serving (67 | 5.7%), Cleaning & Maintenance (34 | 2.9%), and Security & Protection (32 | 2.7%).
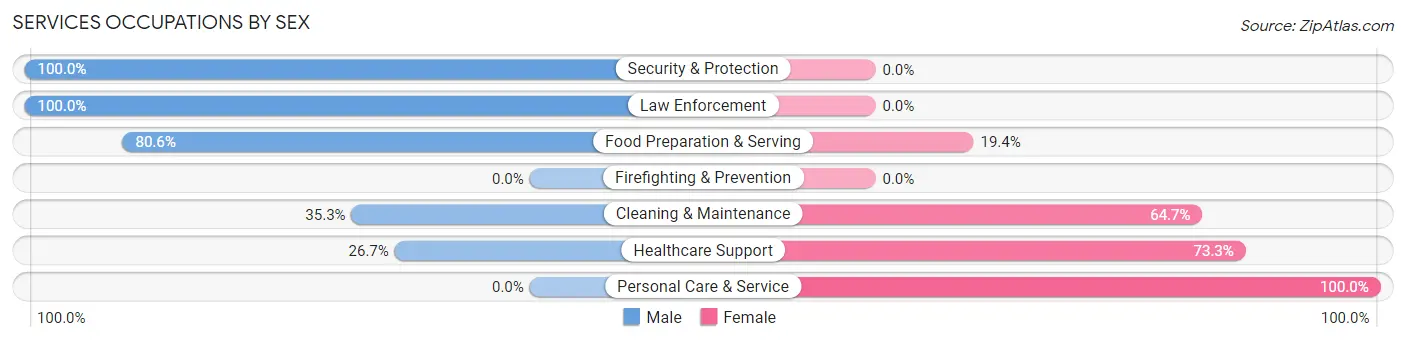
Services Occupations by Sex
Within the Services occupations in Masontown borough, the most male-oriented occupations are Security & Protection (100.0%), Law Enforcement (100.0%), and Food Preparation & Serving (80.6%), while the most female-oriented occupations are Personal Care & Service (100.0%), Healthcare Support (73.3%), and Cleaning & Maintenance (64.7%).
| Occupation | Male | Female |
| Healthcare Support | 27 (26.7%) | 74 (73.3%) |
| Security & Protection | 32 (100.0%) | 0 (0.0%) |
| Firefighting & Prevention | 0 (0.0%) | 0 (0.0%) |
| Law Enforcement | 32 (100.0%) | 0 (0.0%) |
| Food Preparation & Serving | 54 (80.6%) | 13 (19.4%) |
| Cleaning & Maintenance | 12 (35.3%) | 22 (64.7%) |
| Personal Care & Service | 0 (0.0%) | 77 (100.0%) |
| Total (Category) | 125 (40.2%) | 186 (59.8%) |
| Total (Overall) | 723 (61.0%) | 462 (39.0%) |
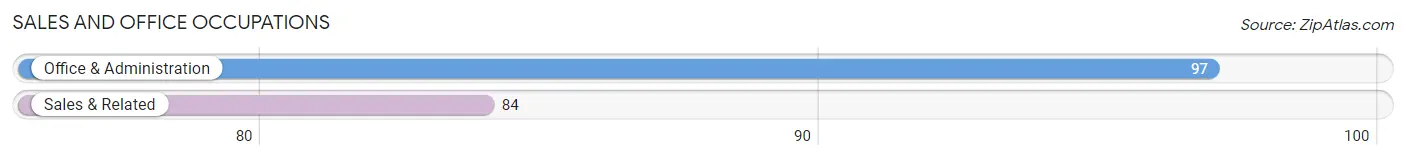
Sales and Office Occupations
The most common Sales and Office occupations in Masontown borough are Office & Administration (97 | 8.2%), and Sales & Related (84 | 7.1%).
Sales and Office Occupations by Sex
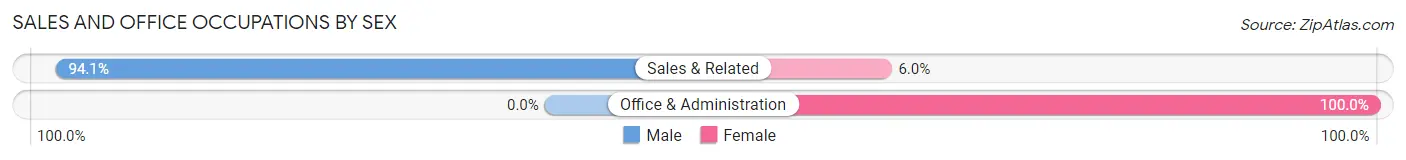
| Occupation | Male | Female |
| Sales & Related | 79 (94.1%) | 5 (5.9%) |
| Office & Administration | 0 (0.0%) | 97 (100.0%) |
| Total (Category) | 79 (43.6%) | 102 (56.4%) |
| Total (Overall) | 723 (61.0%) | 462 (39.0%) |
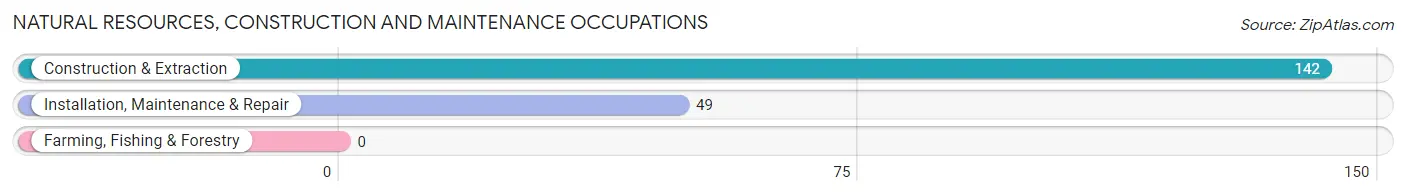
Natural Resources, Construction and Maintenance Occupations
The most common Natural Resources, Construction and Maintenance occupations in Masontown borough are Construction & Extraction (142 | 12.0%), and Installation, Maintenance & Repair (49 | 4.1%).
Natural Resources, Construction and Maintenance Occupations by Sex
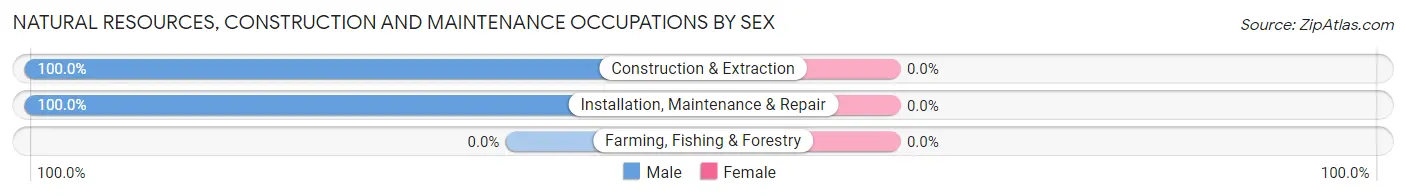
| Occupation | Male | Female |
| Farming, Fishing & Forestry | 0 (0.0%) | 0 (0.0%) |
| Construction & Extraction | 142 (100.0%) | 0 (0.0%) |
| Installation, Maintenance & Repair | 49 (100.0%) | 0 (0.0%) |
| Total (Category) | 191 (100.0%) | 0 (0.0%) |
| Total (Overall) | 723 (61.0%) | 462 (39.0%) |
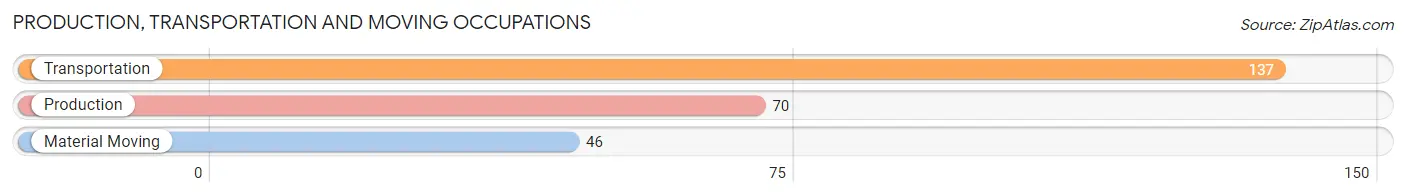
Production, Transportation and Moving Occupations
The most common Production, Transportation and Moving occupations in Masontown borough are Transportation (137 | 11.6%), Production (70 | 5.9%), and Material Moving (46 | 3.9%).
Production, Transportation and Moving Occupations by Sex
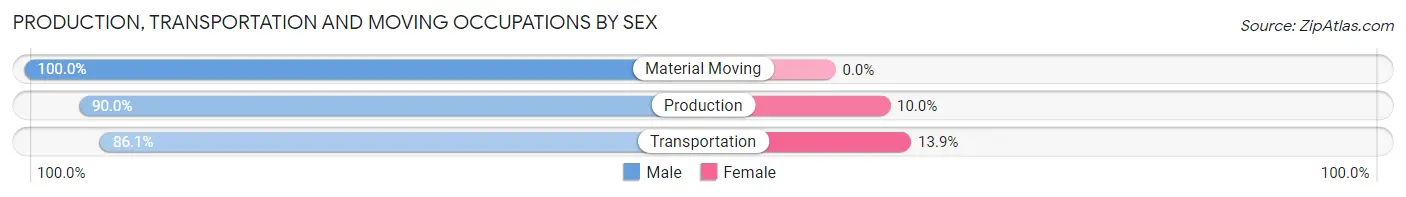
| Occupation | Male | Female |
| Production | 63 (90.0%) | 7 (10.0%) |
| Transportation | 118 (86.1%) | 19 (13.9%) |
| Material Moving | 46 (100.0%) | 0 (0.0%) |
| Total (Category) | 227 (89.7%) | 26 (10.3%) |
| Total (Overall) | 723 (61.0%) | 462 (39.0%) |
Employment Industries by Sex in Masontown borough
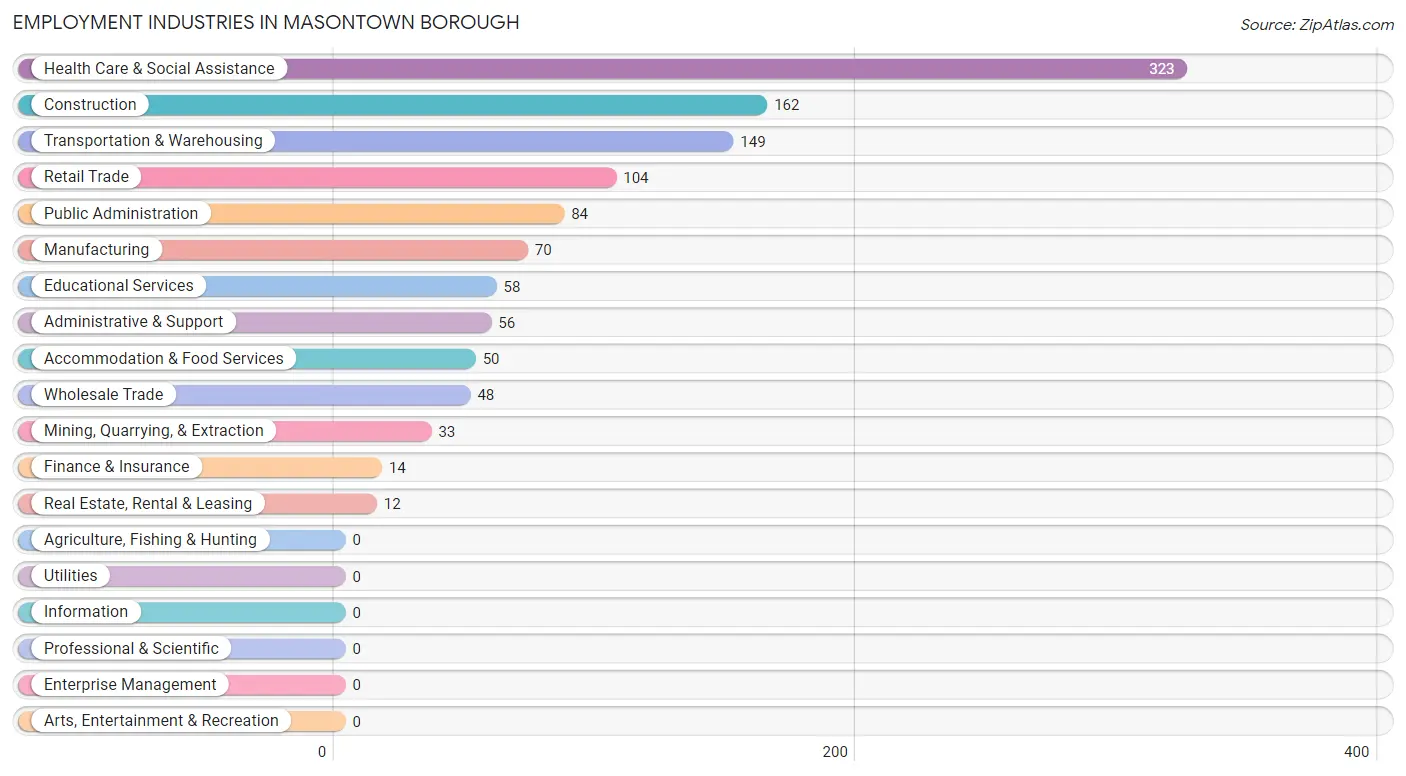
Employment Industries in Masontown borough
The major employment industries in Masontown borough include Health Care & Social Assistance (323 | 27.3%), Construction (162 | 13.7%), Transportation & Warehousing (149 | 12.6%), Retail Trade (104 | 8.8%), and Public Administration (84 | 7.1%).
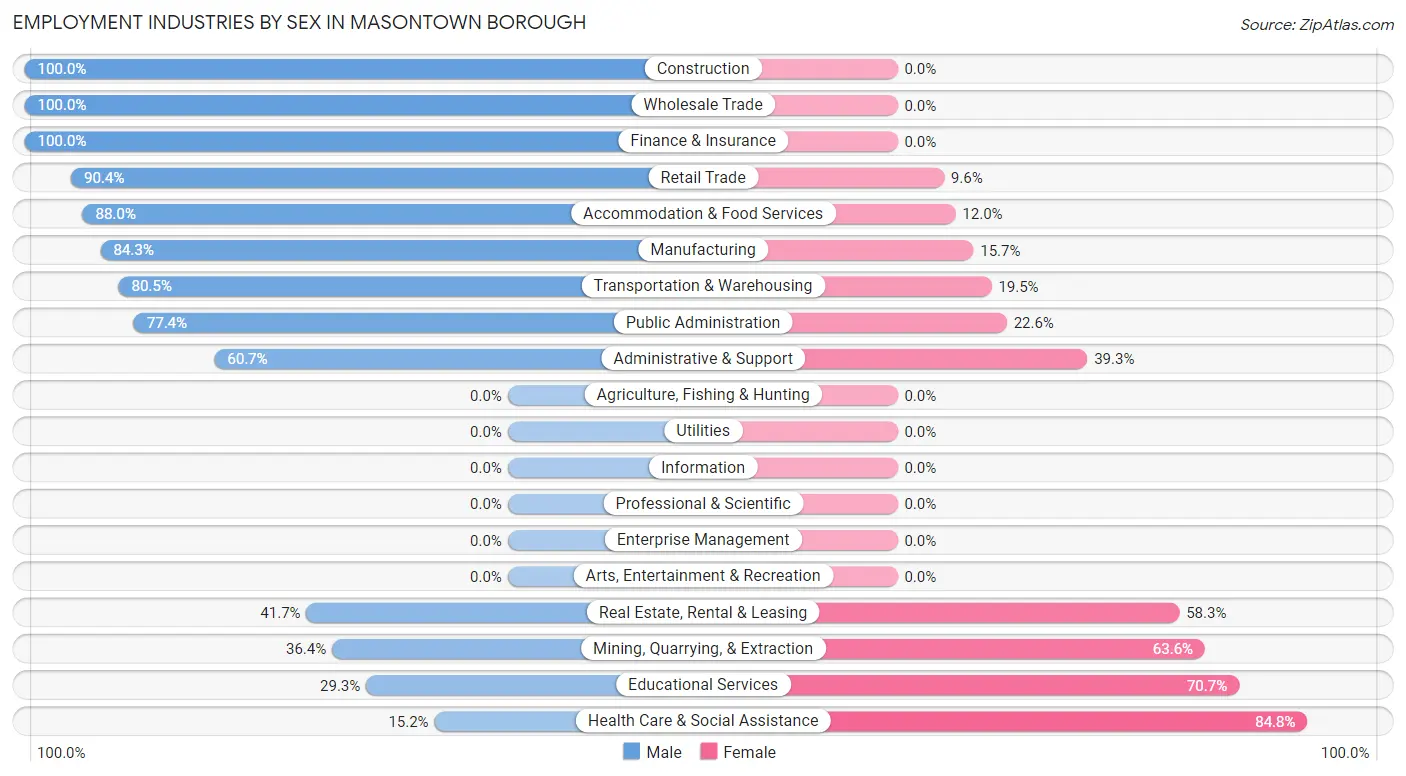
Employment Industries by Sex in Masontown borough
The Masontown borough industries that see more men than women are Construction (100.0%), Wholesale Trade (100.0%), and Finance & Insurance (100.0%), whereas the industries that tend to have a higher number of women are Health Care & Social Assistance (84.8%), Educational Services (70.7%), and Mining, Quarrying, & Extraction (63.6%).
| Industry | Male | Female |
| Agriculture, Fishing & Hunting | 0 (0.0%) | 0 (0.0%) |
| Mining, Quarrying, & Extraction | 12 (36.4%) | 21 (63.6%) |
| Construction | 162 (100.0%) | 0 (0.0%) |
| Manufacturing | 59 (84.3%) | 11 (15.7%) |
| Wholesale Trade | 48 (100.0%) | 0 (0.0%) |
| Retail Trade | 94 (90.4%) | 10 (9.6%) |
| Transportation & Warehousing | 120 (80.5%) | 29 (19.5%) |
| Utilities | 0 (0.0%) | 0 (0.0%) |
| Information | 0 (0.0%) | 0 (0.0%) |
| Finance & Insurance | 14 (100.0%) | 0 (0.0%) |
| Real Estate, Rental & Leasing | 5 (41.7%) | 7 (58.3%) |
| Professional & Scientific | 0 (0.0%) | 0 (0.0%) |
| Enterprise Management | 0 (0.0%) | 0 (0.0%) |
| Administrative & Support | 34 (60.7%) | 22 (39.3%) |
| Educational Services | 17 (29.3%) | 41 (70.7%) |
| Health Care & Social Assistance | 49 (15.2%) | 274 (84.8%) |
| Arts, Entertainment & Recreation | 0 (0.0%) | 0 (0.0%) |
| Accommodation & Food Services | 44 (88.0%) | 6 (12.0%) |
| Public Administration | 65 (77.4%) | 19 (22.6%) |
| Total | 723 (61.0%) | 462 (39.0%) |
Education in Masontown borough
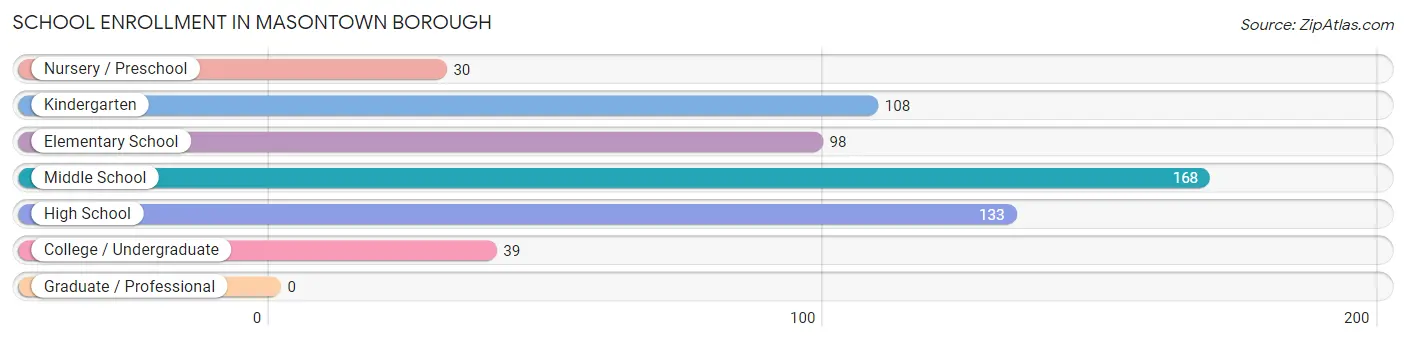
School Enrollment in Masontown borough
The most common levels of schooling among the 576 students in Masontown borough are middle school (168 | 29.2%), high school (133 | 23.1%), and kindergarten (108 | 18.8%).
| School Level | # Students | % Students |
| Nursery / Preschool | 30 | 5.2% |
| Kindergarten | 108 | 18.8% |
| Elementary School | 98 | 17.0% |
| Middle School | 168 | 29.2% |
| High School | 133 | 23.1% |
| College / Undergraduate | 39 | 6.8% |
| Graduate / Professional | 0 | 0.0% |
| Total | 576 | 100.0% |
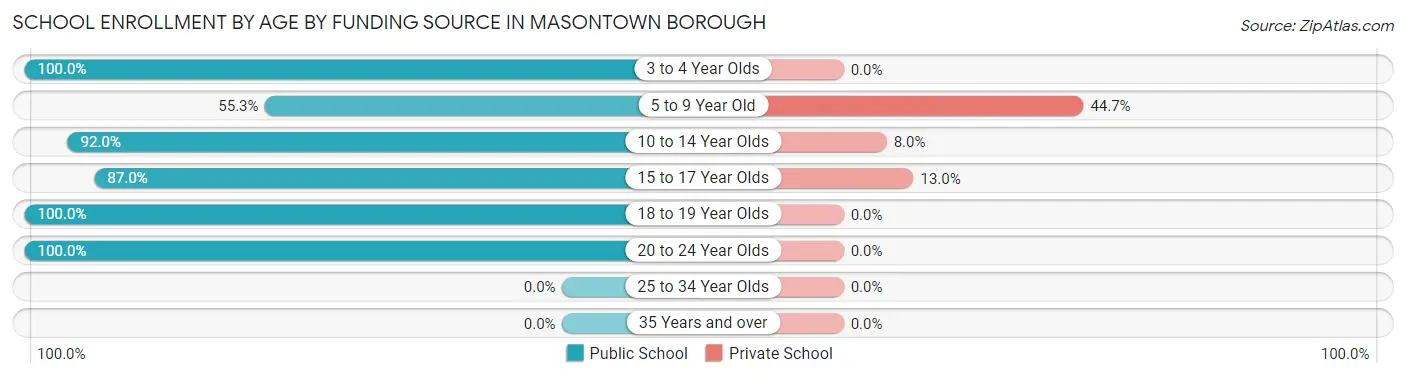
School Enrollment by Age by Funding Source in Masontown borough
Out of a total of 576 students who are enrolled in schools in Masontown borough, 121 (21.0%) attend a private institution, while the remaining 455 (79.0%) are enrolled in public schools. The age group of 5 to 9 year old has the highest likelihood of being enrolled in private schools, with 92 (44.7% in the age bracket) enrolled. Conversely, the age group of 3 to 4 year olds has the lowest likelihood of being enrolled in a private school, with 30 (100.0% in the age bracket) attending a public institution.
| Age Bracket | Public School | Private School |
| 3 to 4 Year Olds | 30 (100.0%) | 0 (0.0%) |
| 5 to 9 Year Old | 114 (55.3%) | 92 (44.7%) |
| 10 to 14 Year Olds | 149 (92.0%) | 13 (8.0%) |
| 15 to 17 Year Olds | 107 (87.0%) | 16 (13.0%) |
| 18 to 19 Year Olds | 31 (100.0%) | 0 (0.0%) |
| 20 to 24 Year Olds | 24 (100.0%) | 0 (0.0%) |
| 25 to 34 Year Olds | 0 (0.0%) | 0 (0.0%) |
| 35 Years and over | 0 (0.0%) | 0 (0.0%) |
| Total | 455 (79.0%) | 121 (21.0%) |
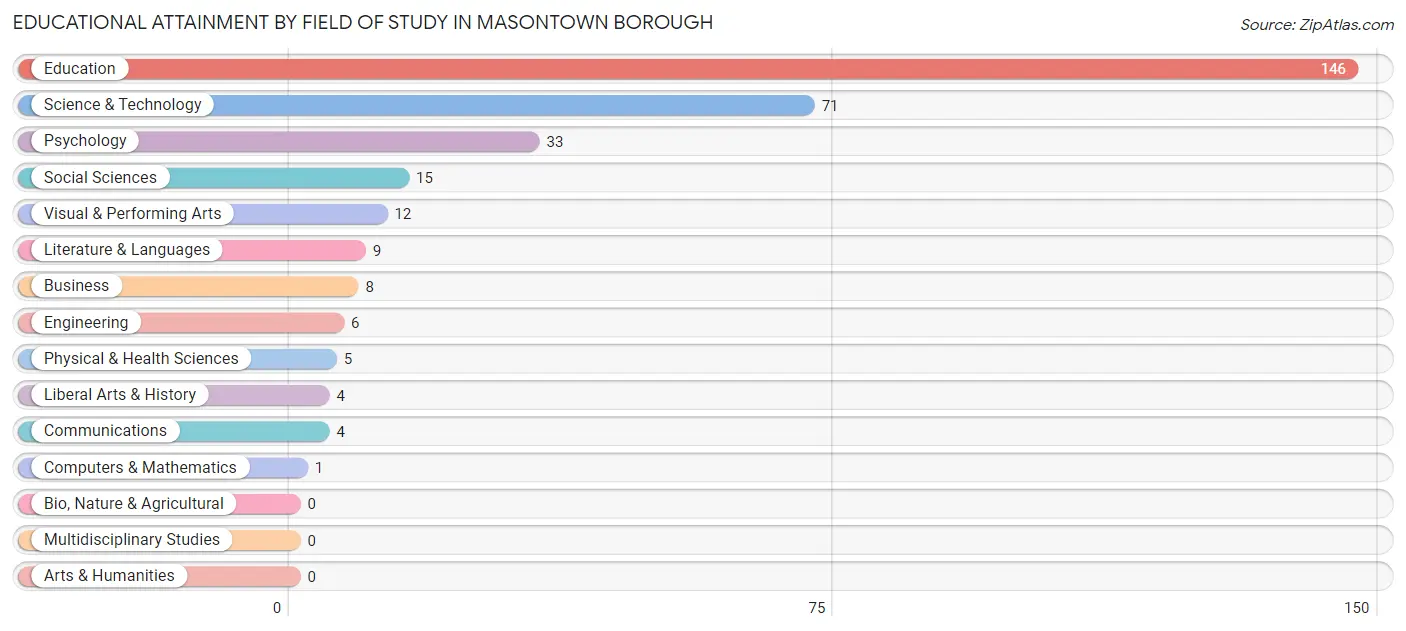
Educational Attainment by Field of Study in Masontown borough
Education (146 | 46.5%), science & technology (71 | 22.6%), psychology (33 | 10.5%), social sciences (15 | 4.8%), and visual & performing arts (12 | 3.8%) are the most common fields of study among 314 individuals in Masontown borough who have obtained a bachelor's degree or higher.
| Field of Study | # Graduates | % Graduates |
| Computers & Mathematics | 1 | 0.3% |
| Bio, Nature & Agricultural | 0 | 0.0% |
| Physical & Health Sciences | 5 | 1.6% |
| Psychology | 33 | 10.5% |
| Social Sciences | 15 | 4.8% |
| Engineering | 6 | 1.9% |
| Multidisciplinary Studies | 0 | 0.0% |
| Science & Technology | 71 | 22.6% |
| Business | 8 | 2.5% |
| Education | 146 | 46.5% |
| Literature & Languages | 9 | 2.9% |
| Liberal Arts & History | 4 | 1.3% |
| Visual & Performing Arts | 12 | 3.8% |
| Communications | 4 | 1.3% |
| Arts & Humanities | 0 | 0.0% |
| Total | 314 | 100.0% |
Transportation & Commute in Masontown borough
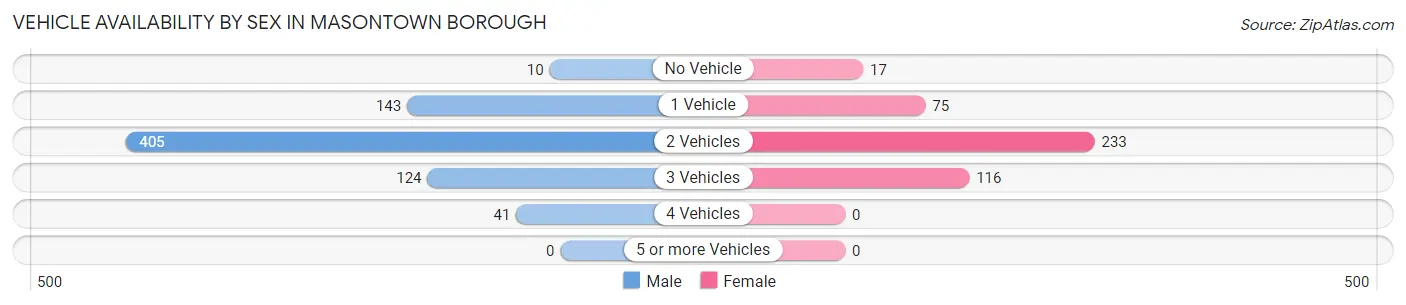
Vehicle Availability by Sex in Masontown borough
The most prevalent vehicle ownership categories in Masontown borough are males with 2 vehicles (405, accounting for 56.0%) and females with 2 vehicles (233, making up 91.8%).
| Vehicles Available | Male | Female |
| No Vehicle | 10 (1.4%) | 17 (3.8%) |
| 1 Vehicle | 143 (19.8%) | 75 (17.0%) |
| 2 Vehicles | 405 (56.0%) | 233 (52.8%) |
| 3 Vehicles | 124 (17.2%) | 116 (26.3%) |
| 4 Vehicles | 41 (5.7%) | 0 (0.0%) |
| 5 or more Vehicles | 0 (0.0%) | 0 (0.0%) |
| Total | 723 (100.0%) | 441 (100.0%) |
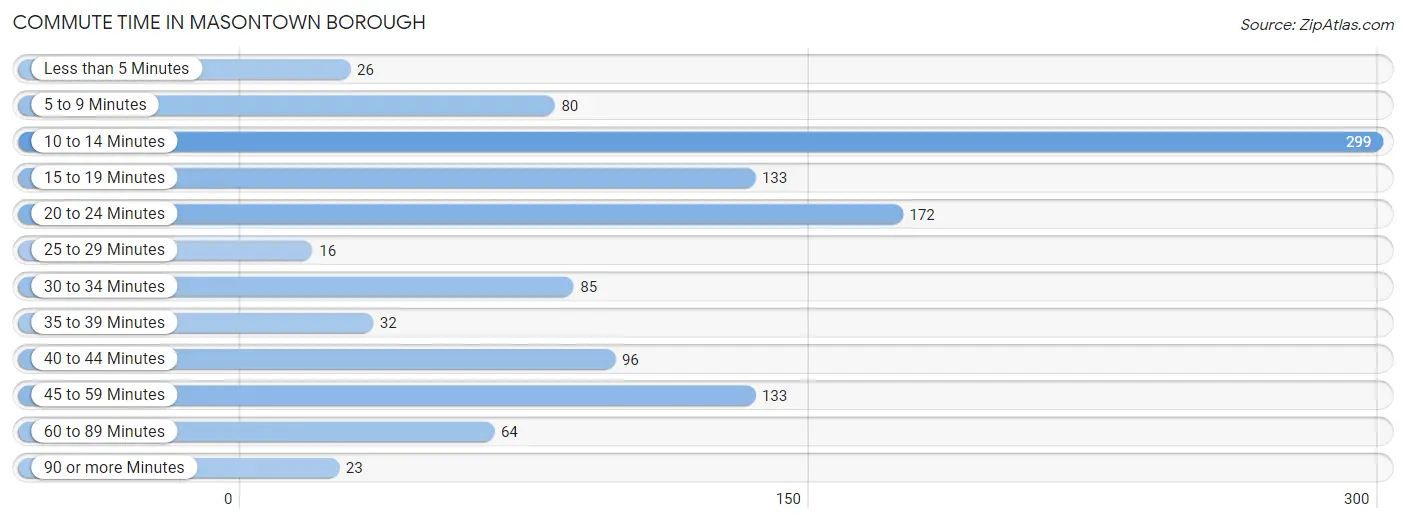
Commute Time in Masontown borough
The most frequently occuring commute durations in Masontown borough are 10 to 14 minutes (299 commuters, 25.8%), 20 to 24 minutes (172 commuters, 14.8%), and 15 to 19 minutes (133 commuters, 11.5%).
| Commute Time | # Commuters | % Commuters |
| Less than 5 Minutes | 26 | 2.2% |
| 5 to 9 Minutes | 80 | 6.9% |
| 10 to 14 Minutes | 299 | 25.8% |
| 15 to 19 Minutes | 133 | 11.5% |
| 20 to 24 Minutes | 172 | 14.8% |
| 25 to 29 Minutes | 16 | 1.4% |
| 30 to 34 Minutes | 85 | 7.3% |
| 35 to 39 Minutes | 32 | 2.8% |
| 40 to 44 Minutes | 96 | 8.3% |
| 45 to 59 Minutes | 133 | 11.5% |
| 60 to 89 Minutes | 64 | 5.5% |
| 90 or more Minutes | 23 | 2.0% |
Commute Time by Sex in Masontown borough
The most common commute times in Masontown borough are 10 to 14 minutes (287 commuters, 40.0%) for males and 20 to 24 minutes (103 commuters, 23.4%) for females.
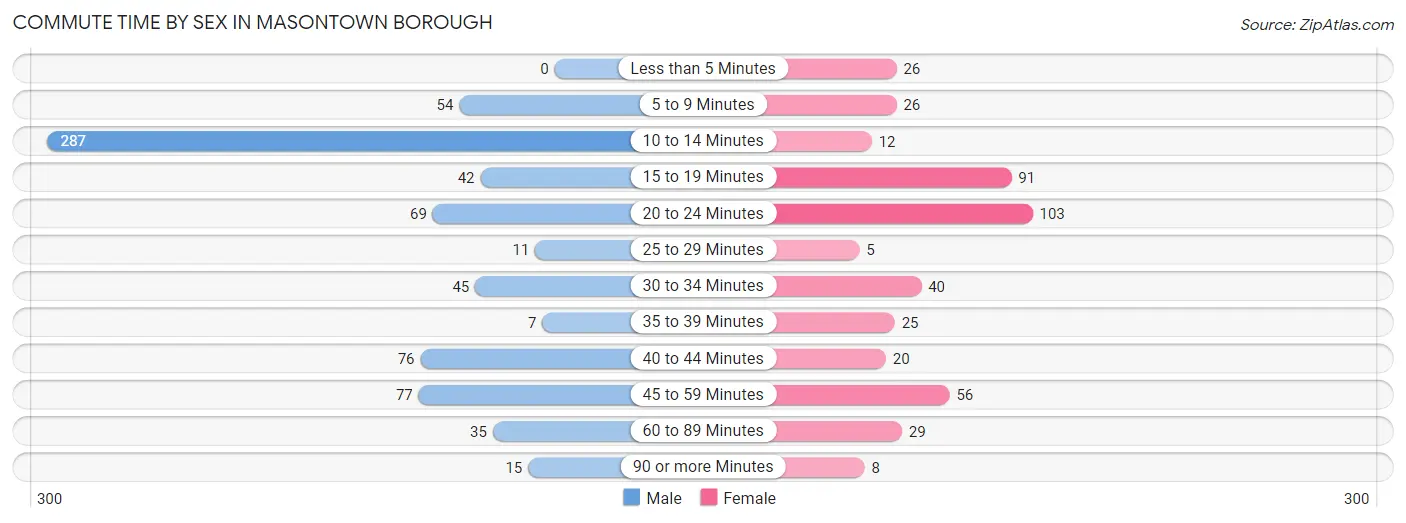
| Commute Time | Male | Female |
| Less than 5 Minutes | 0 (0.0%) | 26 (5.9%) |
| 5 to 9 Minutes | 54 (7.5%) | 26 (5.9%) |
| 10 to 14 Minutes | 287 (40.0%) | 12 (2.7%) |
| 15 to 19 Minutes | 42 (5.9%) | 91 (20.6%) |
| 20 to 24 Minutes | 69 (9.6%) | 103 (23.4%) |
| 25 to 29 Minutes | 11 (1.5%) | 5 (1.1%) |
| 30 to 34 Minutes | 45 (6.3%) | 40 (9.1%) |
| 35 to 39 Minutes | 7 (1.0%) | 25 (5.7%) |
| 40 to 44 Minutes | 76 (10.6%) | 20 (4.5%) |
| 45 to 59 Minutes | 77 (10.7%) | 56 (12.7%) |
| 60 to 89 Minutes | 35 (4.9%) | 29 (6.6%) |
| 90 or more Minutes | 15 (2.1%) | 8 (1.8%) |
Time of Departure to Work by Sex in Masontown borough
The most frequent times of departure to work in Masontown borough are 5:30 AM to 5:59 AM (230, 32.0%) for males and 7:00 AM to 7:29 AM (75, 17.0%) for females.
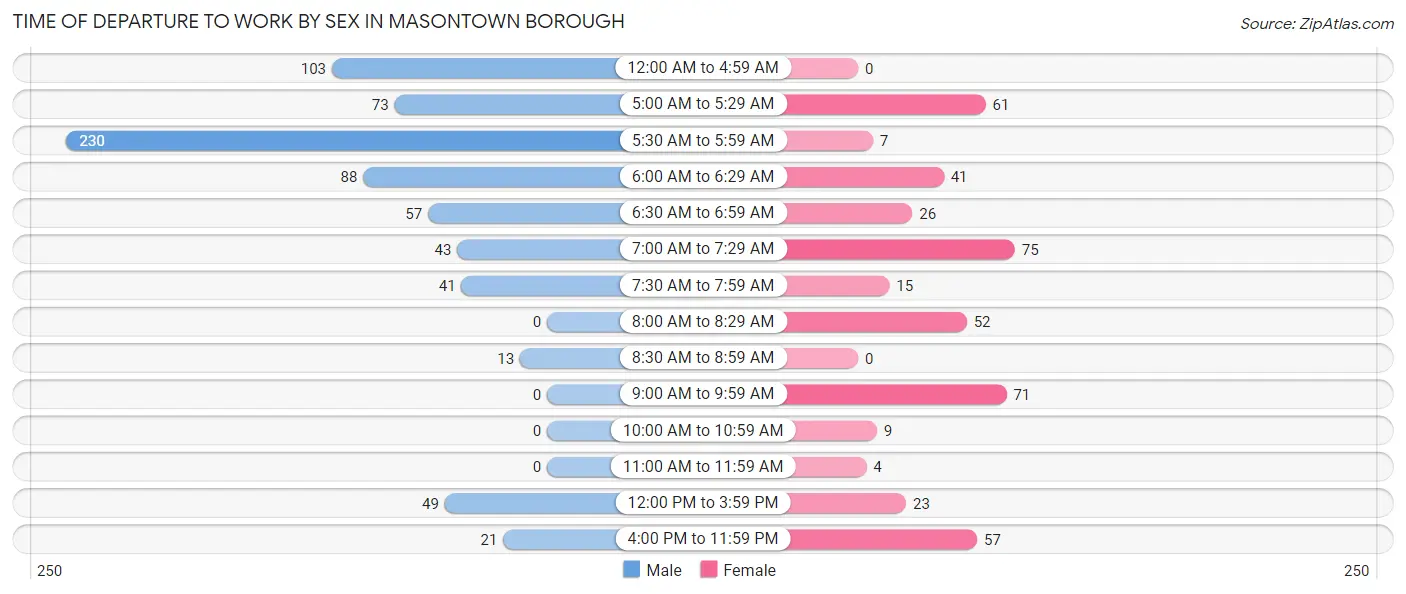
| Time of Departure | Male | Female |
| 12:00 AM to 4:59 AM | 103 (14.3%) | 0 (0.0%) |
| 5:00 AM to 5:29 AM | 73 (10.2%) | 61 (13.8%) |
| 5:30 AM to 5:59 AM | 230 (32.0%) | 7 (1.6%) |
| 6:00 AM to 6:29 AM | 88 (12.3%) | 41 (9.3%) |
| 6:30 AM to 6:59 AM | 57 (7.9%) | 26 (5.9%) |
| 7:00 AM to 7:29 AM | 43 (6.0%) | 75 (17.0%) |
| 7:30 AM to 7:59 AM | 41 (5.7%) | 15 (3.4%) |
| 8:00 AM to 8:29 AM | 0 (0.0%) | 52 (11.8%) |
| 8:30 AM to 8:59 AM | 13 (1.8%) | 0 (0.0%) |
| 9:00 AM to 9:59 AM | 0 (0.0%) | 71 (16.1%) |
| 10:00 AM to 10:59 AM | 0 (0.0%) | 9 (2.0%) |
| 11:00 AM to 11:59 AM | 0 (0.0%) | 4 (0.9%) |
| 12:00 PM to 3:59 PM | 49 (6.8%) | 23 (5.2%) |
| 4:00 PM to 11:59 PM | 21 (2.9%) | 57 (12.9%) |
| Total | 718 (100.0%) | 441 (100.0%) |
Housing Occupancy in Masontown borough
Occupancy by Ownership in Masontown borough
Of the total 1,344 dwellings in Masontown borough, owner-occupied units account for 947 (70.5%), while renter-occupied units make up 397 (29.5%).
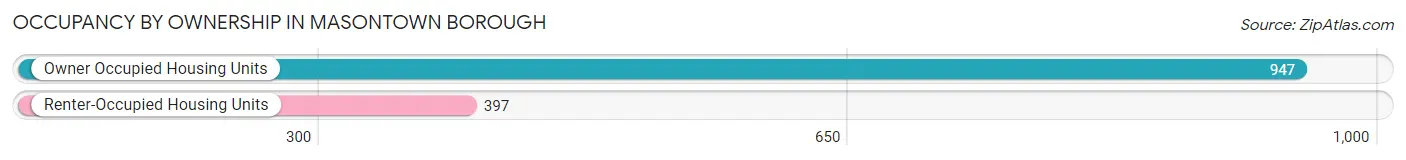
| Occupancy | # Housing Units | % Housing Units |
| Owner Occupied Housing Units | 947 | 70.5% |
| Renter-Occupied Housing Units | 397 | 29.5% |
| Total Occupied Housing Units | 1,344 | 100.0% |
Occupancy by Household Size in Masontown borough
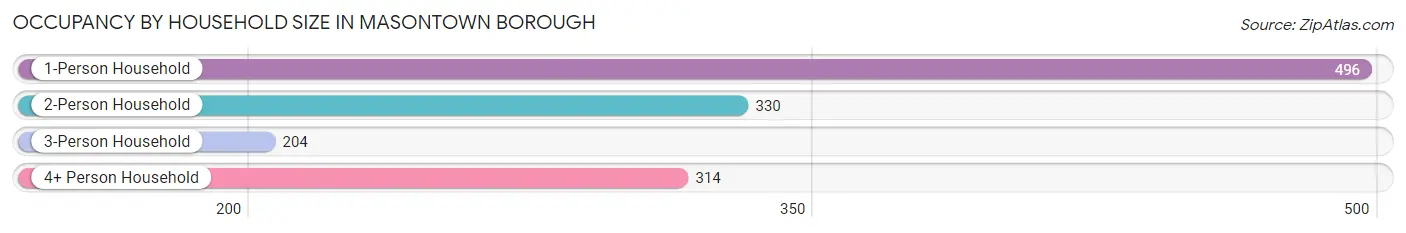
| Household Size | # Housing Units | % Housing Units |
| 1-Person Household | 496 | 36.9% |
| 2-Person Household | 330 | 24.5% |
| 3-Person Household | 204 | 15.2% |
| 4+ Person Household | 314 | 23.4% |
| Total Housing Units | 1,344 | 100.0% |
Occupancy by Ownership by Household Size in Masontown borough
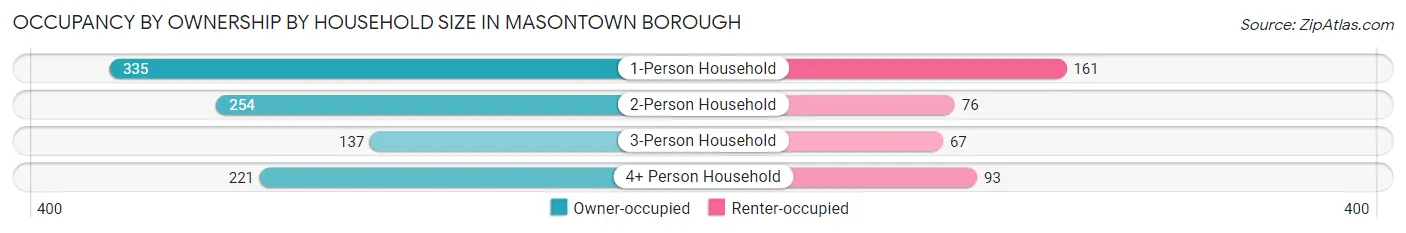
| Household Size | Owner-occupied | Renter-occupied |
| 1-Person Household | 335 (67.5%) | 161 (32.5%) |
| 2-Person Household | 254 (77.0%) | 76 (23.0%) |
| 3-Person Household | 137 (67.2%) | 67 (32.8%) |
| 4+ Person Household | 221 (70.4%) | 93 (29.6%) |
| Total Housing Units | 947 (70.5%) | 397 (29.5%) |
Occupancy by Educational Attainment in Masontown borough
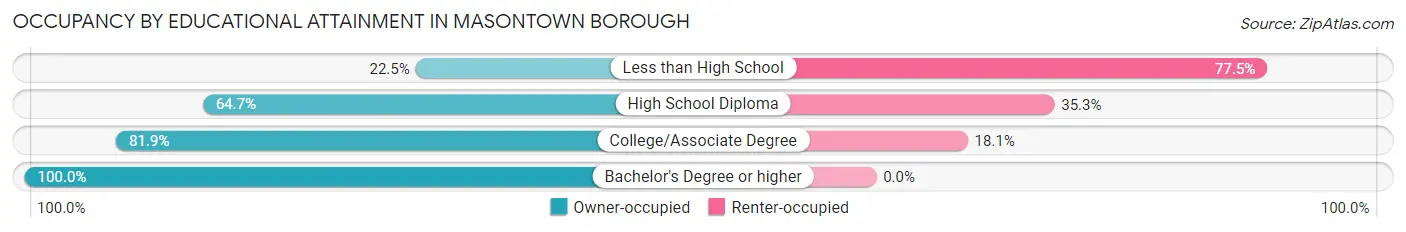
| Household Size | Owner-occupied | Renter-occupied |
| Less than High School | 38 (22.5%) | 131 (77.5%) |
| High School Diploma | 337 (64.7%) | 184 (35.3%) |
| College/Associate Degree | 370 (81.9%) | 82 (18.1%) |
| Bachelor's Degree or higher | 202 (100.0%) | 0 (0.0%) |
Occupancy by Age of Householder in Masontown borough
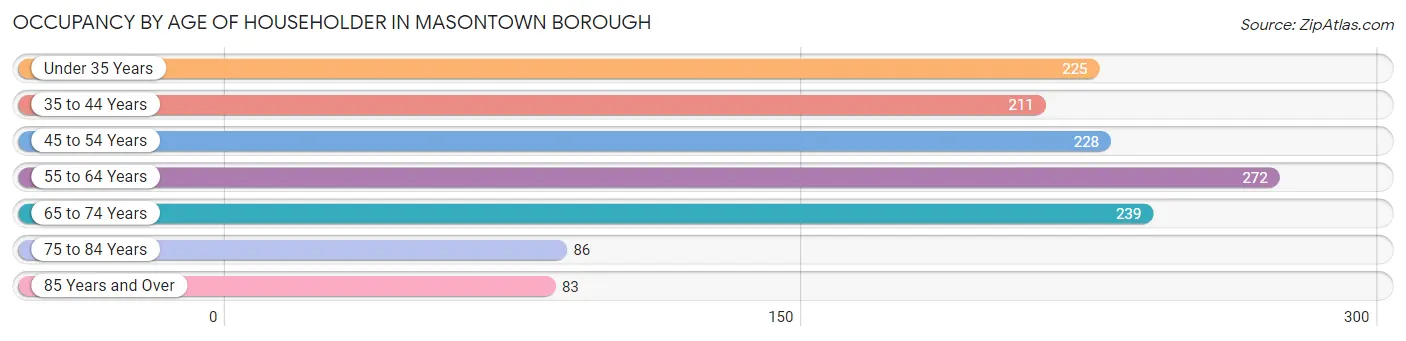
| Age Bracket | # Households | % Households |
| Under 35 Years | 225 | 16.7% |
| 35 to 44 Years | 211 | 15.7% |
| 45 to 54 Years | 228 | 17.0% |
| 55 to 64 Years | 272 | 20.2% |
| 65 to 74 Years | 239 | 17.8% |
| 75 to 84 Years | 86 | 6.4% |
| 85 Years and Over | 83 | 6.2% |
| Total | 1,344 | 100.0% |
Housing Finances in Masontown borough
Median Income by Occupancy in Masontown borough
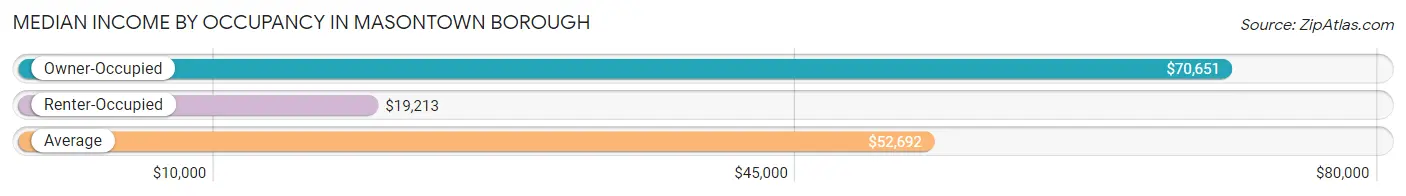
| Occupancy Type | # Households | Median Income |
| Owner-Occupied | 947 (70.5%) | $70,651 |
| Renter-Occupied | 397 (29.5%) | $19,213 |
| Average | 1,344 (100.0%) | $52,692 |
Occupancy by Householder Income Bracket in Masontown borough
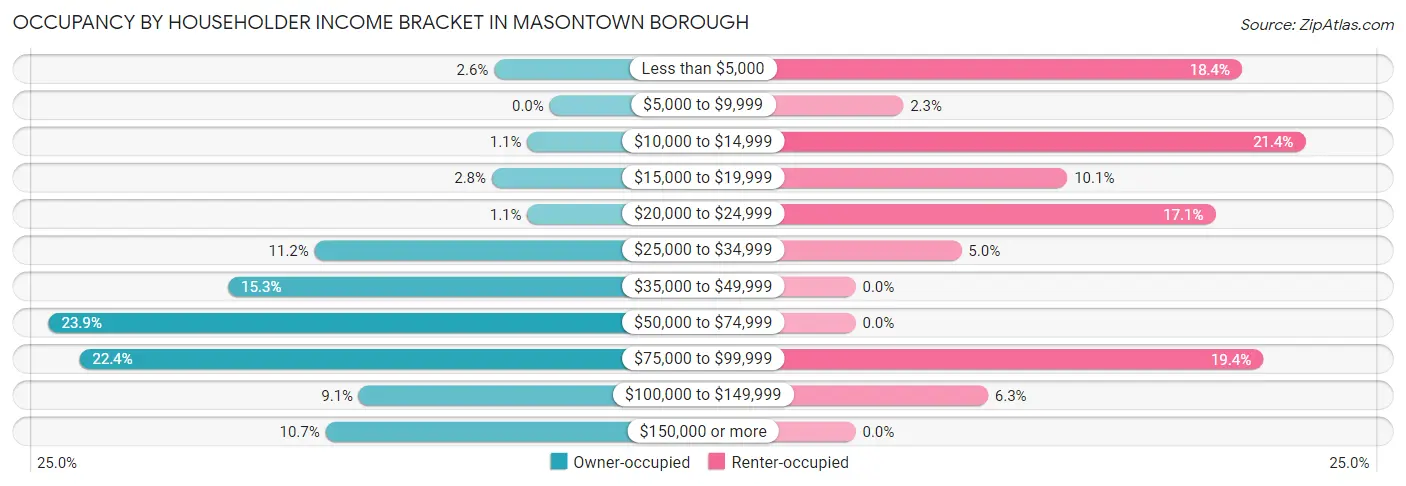
| Income Bracket | Owner-occupied | Renter-occupied |
| Less than $5,000 | 25 (2.6%) | 73 (18.4%) |
| $5,000 to $9,999 | 0 (0.0%) | 9 (2.3%) |
| $10,000 to $14,999 | 10 (1.1%) | 85 (21.4%) |
| $15,000 to $19,999 | 26 (2.8%) | 40 (10.1%) |
| $20,000 to $24,999 | 10 (1.1%) | 68 (17.1%) |
| $25,000 to $34,999 | 106 (11.2%) | 20 (5.0%) |
| $35,000 to $49,999 | 145 (15.3%) | 0 (0.0%) |
| $50,000 to $74,999 | 226 (23.9%) | 0 (0.0%) |
| $75,000 to $99,999 | 212 (22.4%) | 77 (19.4%) |
| $100,000 to $149,999 | 86 (9.1%) | 25 (6.3%) |
| $150,000 or more | 101 (10.7%) | 0 (0.0%) |
| Total | 947 (100.0%) | 397 (100.0%) |
Monthly Housing Cost Tiers in Masontown borough
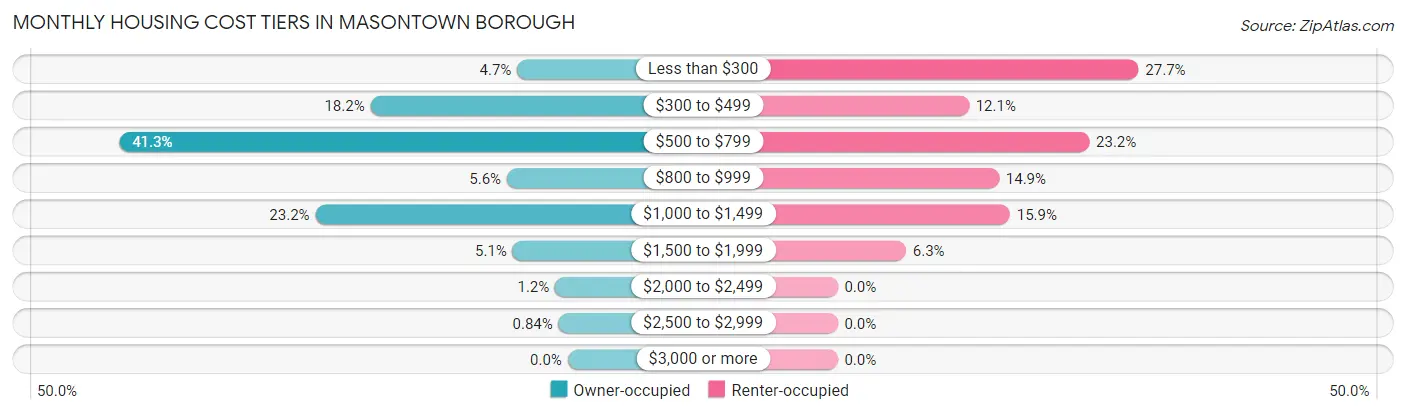
| Monthly Cost | Owner-occupied | Renter-occupied |
| Less than $300 | 44 (4.6%) | 110 (27.7%) |
| $300 to $499 | 172 (18.2%) | 48 (12.1%) |
| $500 to $799 | 391 (41.3%) | 92 (23.2%) |
| $800 to $999 | 53 (5.6%) | 59 (14.9%) |
| $1,000 to $1,499 | 220 (23.2%) | 63 (15.9%) |
| $1,500 to $1,999 | 48 (5.1%) | 25 (6.3%) |
| $2,000 to $2,499 | 11 (1.2%) | 0 (0.0%) |
| $2,500 to $2,999 | 8 (0.8%) | 0 (0.0%) |
| $3,000 or more | 0 (0.0%) | 0 (0.0%) |
| Total | 947 (100.0%) | 397 (100.0%) |
Physical Housing Characteristics in Masontown borough
Housing Structures in Masontown borough
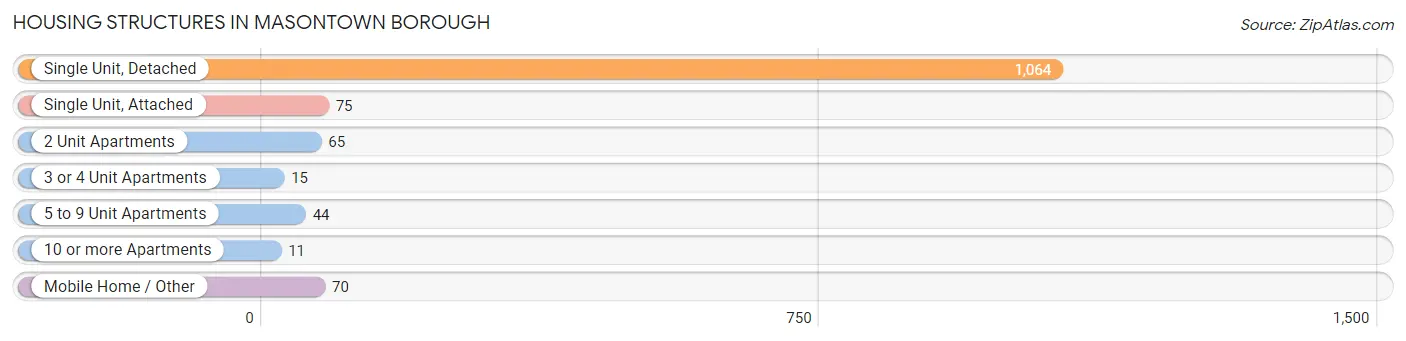
| Structure Type | # Housing Units | % Housing Units |
| Single Unit, Detached | 1,064 | 79.2% |
| Single Unit, Attached | 75 | 5.6% |
| 2 Unit Apartments | 65 | 4.8% |
| 3 or 4 Unit Apartments | 15 | 1.1% |
| 5 to 9 Unit Apartments | 44 | 3.3% |
| 10 or more Apartments | 11 | 0.8% |
| Mobile Home / Other | 70 | 5.2% |
| Total | 1,344 | 100.0% |
Housing Structures by Occupancy in Masontown borough
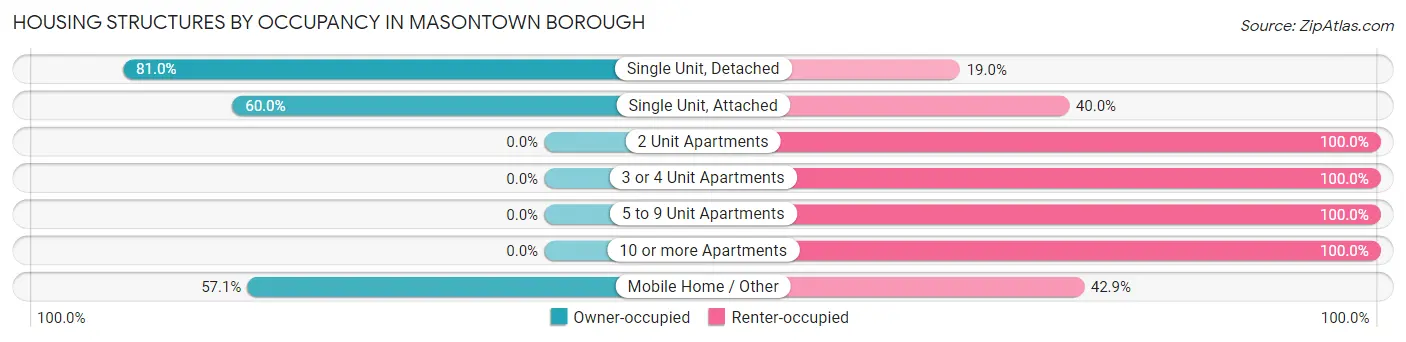
| Structure Type | Owner-occupied | Renter-occupied |
| Single Unit, Detached | 862 (81.0%) | 202 (19.0%) |
| Single Unit, Attached | 45 (60.0%) | 30 (40.0%) |
| 2 Unit Apartments | 0 (0.0%) | 65 (100.0%) |
| 3 or 4 Unit Apartments | 0 (0.0%) | 15 (100.0%) |
| 5 to 9 Unit Apartments | 0 (0.0%) | 44 (100.0%) |
| 10 or more Apartments | 0 (0.0%) | 11 (100.0%) |
| Mobile Home / Other | 40 (57.1%) | 30 (42.9%) |
| Total | 947 (70.5%) | 397 (29.5%) |
Housing Structures by Number of Rooms in Masontown borough
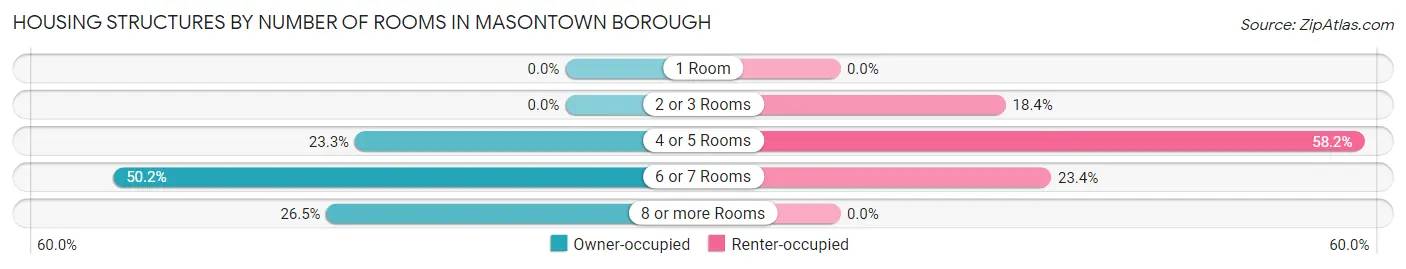
| Number of Rooms | Owner-occupied | Renter-occupied |
| 1 Room | 0 (0.0%) | 0 (0.0%) |
| 2 or 3 Rooms | 0 (0.0%) | 73 (18.4%) |
| 4 or 5 Rooms | 221 (23.3%) | 231 (58.2%) |
| 6 or 7 Rooms | 475 (50.2%) | 93 (23.4%) |
| 8 or more Rooms | 251 (26.5%) | 0 (0.0%) |
| Total | 947 (100.0%) | 397 (100.0%) |
Housing Structure by Heating Type in Masontown borough
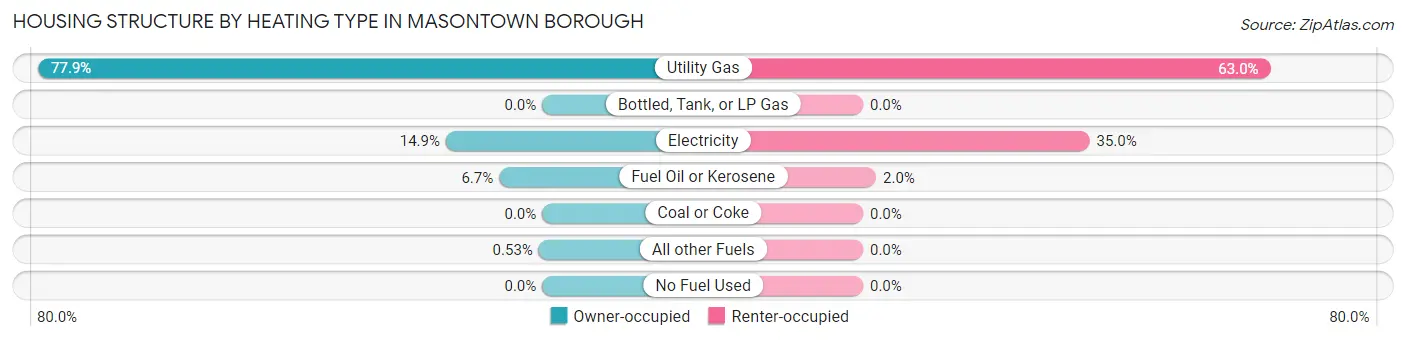
| Heating Type | Owner-occupied | Renter-occupied |
| Utility Gas | 738 (77.9%) | 250 (63.0%) |
| Bottled, Tank, or LP Gas | 0 (0.0%) | 0 (0.0%) |
| Electricity | 141 (14.9%) | 139 (35.0%) |
| Fuel Oil or Kerosene | 63 (6.7%) | 8 (2.0%) |
| Coal or Coke | 0 (0.0%) | 0 (0.0%) |
| All other Fuels | 5 (0.5%) | 0 (0.0%) |
| No Fuel Used | 0 (0.0%) | 0 (0.0%) |
| Total | 947 (100.0%) | 397 (100.0%) |
Household Vehicle Usage in Masontown borough
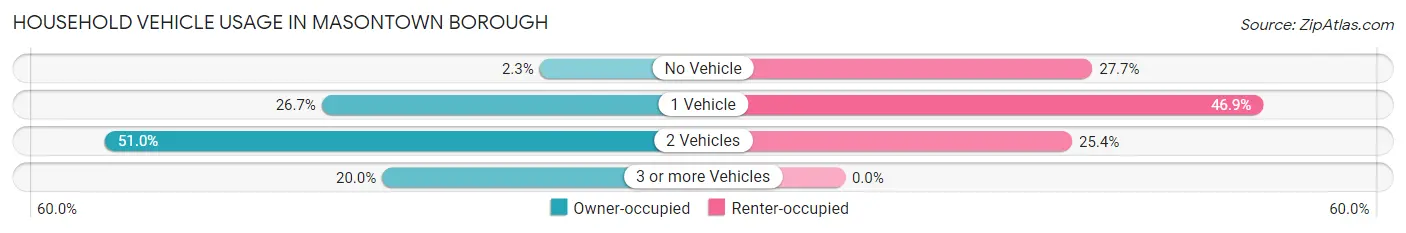
| Vehicles per Household | Owner-occupied | Renter-occupied |
| No Vehicle | 22 (2.3%) | 110 (27.7%) |
| 1 Vehicle | 253 (26.7%) | 186 (46.9%) |
| 2 Vehicles | 483 (51.0%) | 101 (25.4%) |
| 3 or more Vehicles | 189 (20.0%) | 0 (0.0%) |
| Total | 947 (100.0%) | 397 (100.0%) |
Real Estate & Mortgages in Masontown borough
Real Estate and Mortgage Overview in Masontown borough
| Characteristic | Without Mortgage | With Mortgage |
| Housing Units | 440 | 507 |
| Median Property Value | $110,500 | $117,000 |
| Median Household Income | $70,833 | $35 |
| Monthly Housing Costs | $521 | $0 |
| Real Estate Taxes | $1,394 | $31 |
Property Value by Mortgage Status in Masontown borough
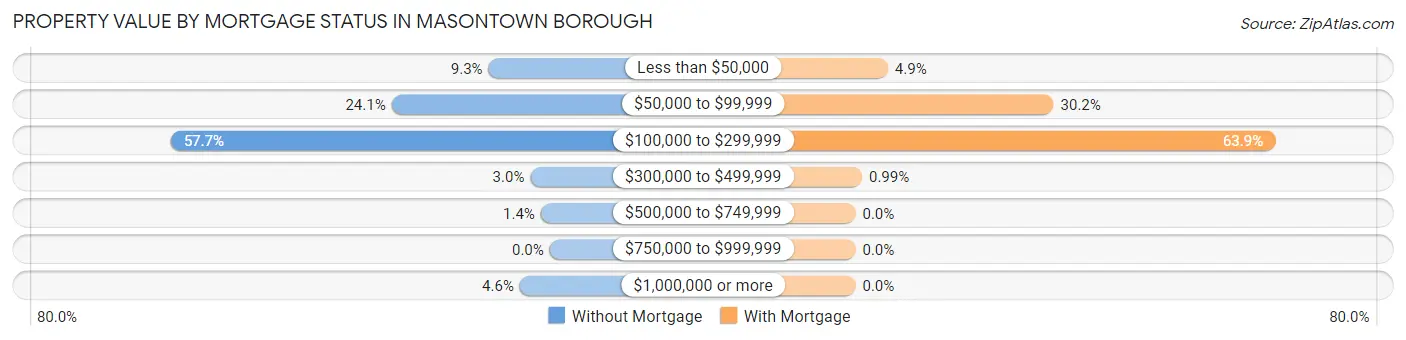
| Property Value | Without Mortgage | With Mortgage |
| Less than $50,000 | 41 (9.3%) | 25 (4.9%) |
| $50,000 to $99,999 | 106 (24.1%) | 153 (30.2%) |
| $100,000 to $299,999 | 254 (57.7%) | 324 (63.9%) |
| $300,000 to $499,999 | 13 (2.9%) | 5 (1.0%) |
| $500,000 to $749,999 | 6 (1.4%) | 0 (0.0%) |
| $750,000 to $999,999 | 0 (0.0%) | 0 (0.0%) |
| $1,000,000 or more | 20 (4.5%) | 0 (0.0%) |
| Total | 440 (100.0%) | 507 (100.0%) |
Household Income by Mortgage Status in Masontown borough
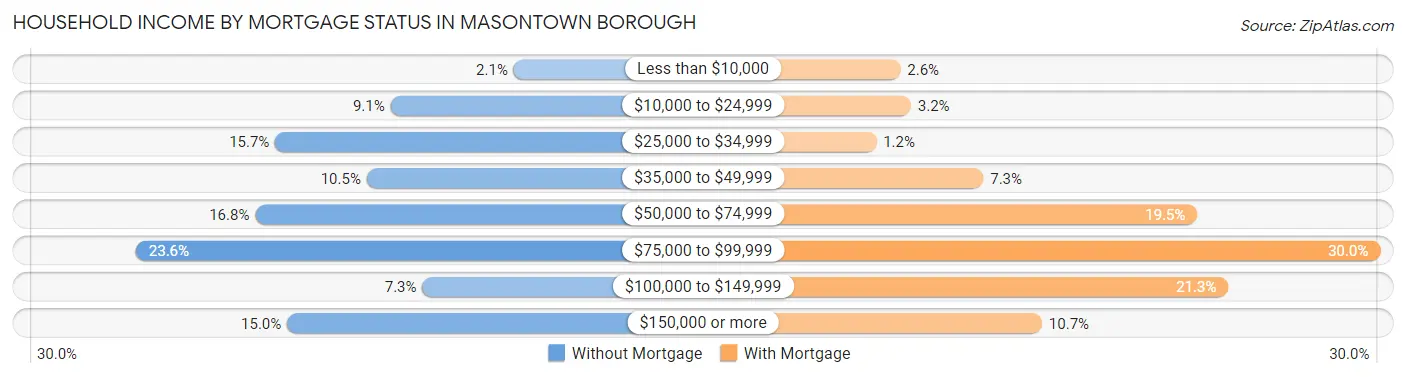
| Household Income | Without Mortgage | With Mortgage |
| Less than $10,000 | 9 (2.1%) | 13 (2.6%) |
| $10,000 to $24,999 | 40 (9.1%) | 16 (3.2%) |
| $25,000 to $34,999 | 69 (15.7%) | 6 (1.2%) |
| $35,000 to $49,999 | 46 (10.4%) | 37 (7.3%) |
| $50,000 to $74,999 | 74 (16.8%) | 99 (19.5%) |
| $75,000 to $99,999 | 104 (23.6%) | 152 (30.0%) |
| $100,000 to $149,999 | 32 (7.3%) | 108 (21.3%) |
| $150,000 or more | 66 (15.0%) | 54 (10.6%) |
| Total | 440 (100.0%) | 507 (100.0%) |
Property Value to Household Income Ratio in Masontown borough
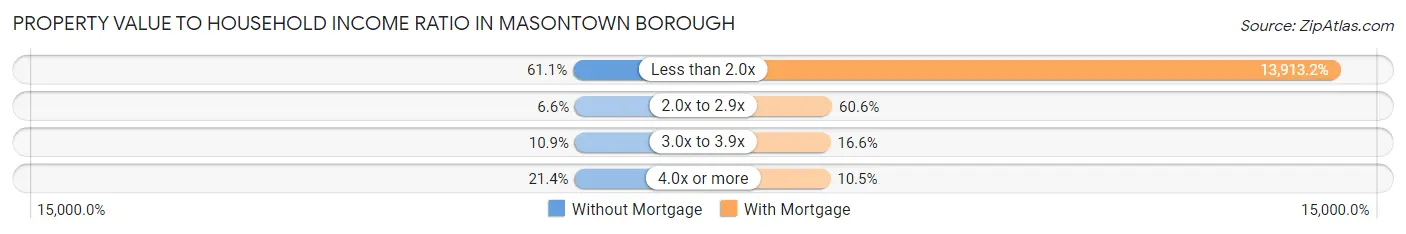
| Value-to-Income Ratio | Without Mortgage | With Mortgage |
| Less than 2.0x | 269 (61.1%) | 70,540 (13,913.2%) |
| 2.0x to 2.9x | 29 (6.6%) | 307 (60.6%) |
| 3.0x to 3.9x | 48 (10.9%) | 84 (16.6%) |
| 4.0x or more | 94 (21.4%) | 53 (10.4%) |
| Total | 440 (100.0%) | 507 (100.0%) |
Real Estate Taxes by Mortgage Status in Masontown borough
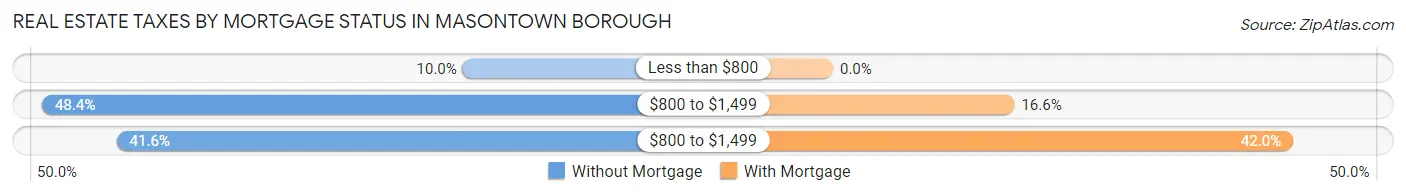
| Property Taxes | Without Mortgage | With Mortgage |
| Less than $800 | 44 (10.0%) | 0 (0.0%) |
| $800 to $1,499 | 213 (48.4%) | 84 (16.6%) |
| $800 to $1,499 | 183 (41.6%) | 213 (42.0%) |
| Total | 440 (100.0%) | 507 (100.0%) |
Health & Disability in Masontown borough
Health Insurance Coverage by Age in Masontown borough
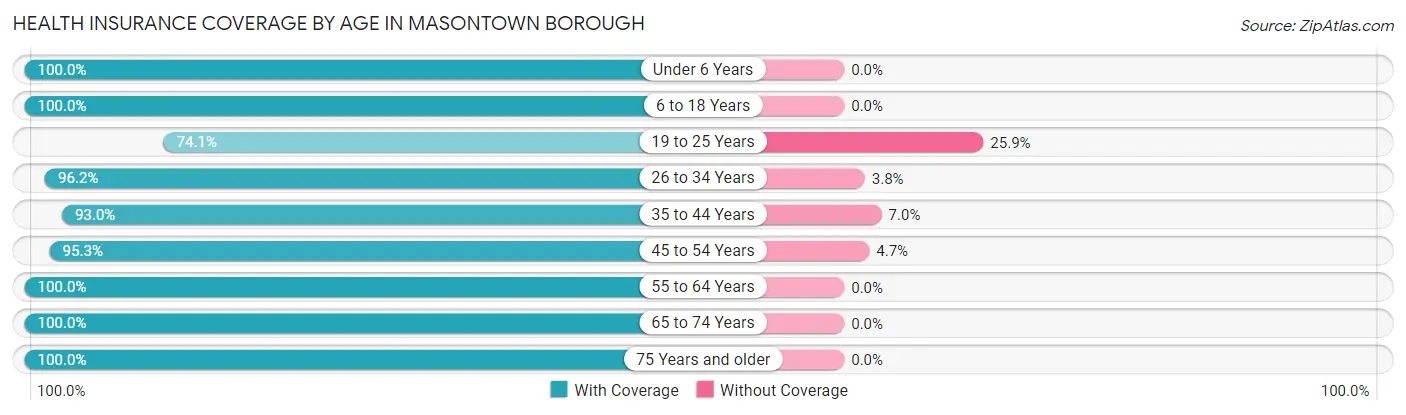
| Age Bracket | With Coverage | Without Coverage |
| Under 6 Years | 311 (100.0%) | 0 (0.0%) |
| 6 to 18 Years | 490 (100.0%) | 0 (0.0%) |
| 19 to 25 Years | 177 (74.1%) | 62 (25.9%) |
| 26 to 34 Years | 377 (96.2%) | 15 (3.8%) |
| 35 to 44 Years | 374 (93.0%) | 28 (7.0%) |
| 45 to 54 Years | 407 (95.3%) | 20 (4.7%) |
| 55 to 64 Years | 445 (100.0%) | 0 (0.0%) |
| 65 to 74 Years | 333 (100.0%) | 0 (0.0%) |
| 75 Years and older | 205 (100.0%) | 0 (0.0%) |
| Total | 3,119 (96.2%) | 125 (3.8%) |
Health Insurance Coverage by Citizenship Status in Masontown borough
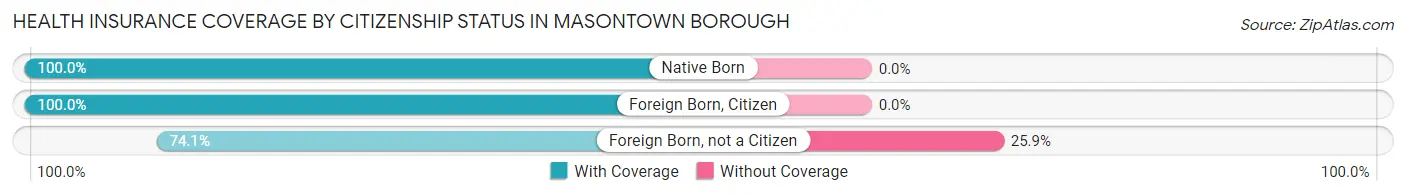
| Citizenship Status | With Coverage | Without Coverage |
| Native Born | 311 (100.0%) | 0 (0.0%) |
| Foreign Born, Citizen | 490 (100.0%) | 0 (0.0%) |
| Foreign Born, not a Citizen | 177 (74.1%) | 62 (25.9%) |
Health Insurance Coverage by Household Income in Masontown borough
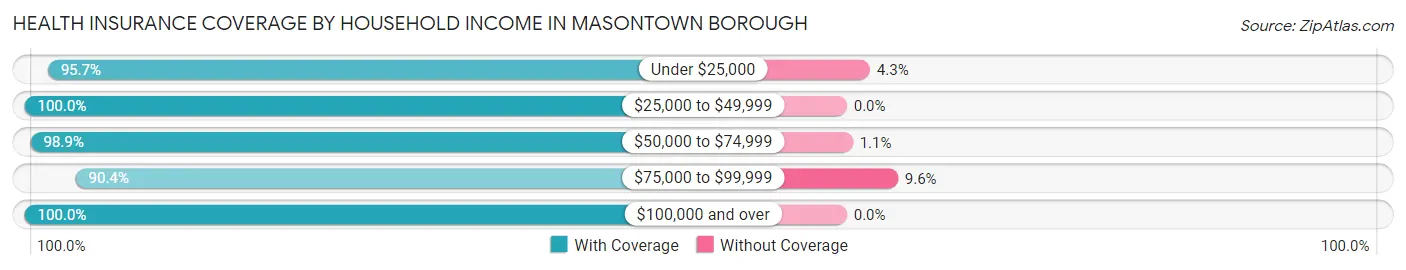
| Household Income | With Coverage | Without Coverage |
| Under $25,000 | 619 (95.7%) | 28 (4.3%) |
| $25,000 to $49,999 | 476 (100.0%) | 0 (0.0%) |
| $50,000 to $74,999 | 536 (98.9%) | 6 (1.1%) |
| $75,000 to $99,999 | 861 (90.4%) | 91 (9.6%) |
| $100,000 and over | 581 (100.0%) | 0 (0.0%) |
Public vs Private Health Insurance Coverage by Age in Masontown borough
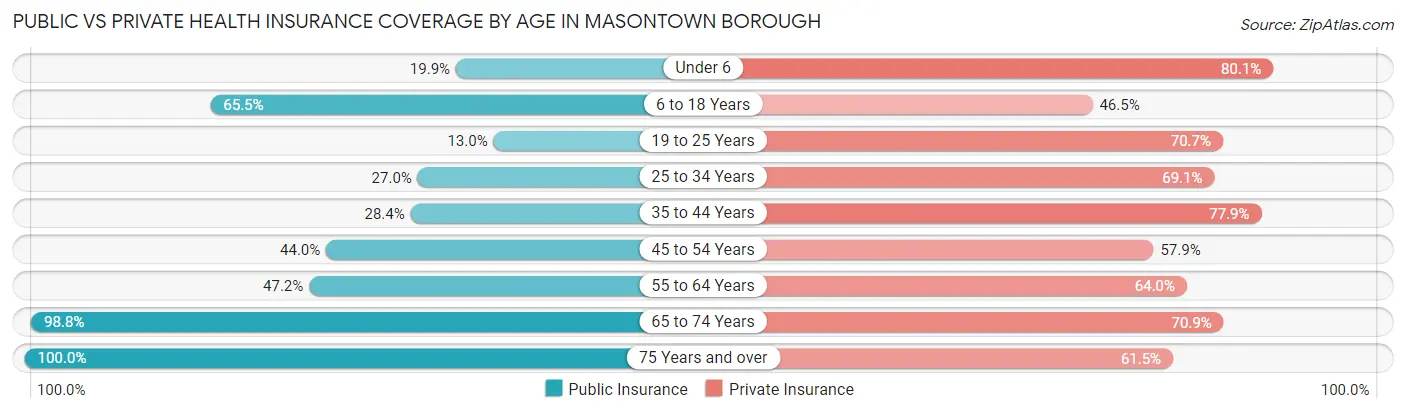
| Age Bracket | Public Insurance | Private Insurance |
| Under 6 | 62 (19.9%) | 249 (80.1%) |
| 6 to 18 Years | 321 (65.5%) | 228 (46.5%) |
| 19 to 25 Years | 31 (13.0%) | 169 (70.7%) |
| 25 to 34 Years | 106 (27.0%) | 271 (69.1%) |
| 35 to 44 Years | 114 (28.4%) | 313 (77.9%) |
| 45 to 54 Years | 188 (44.0%) | 247 (57.9%) |
| 55 to 64 Years | 210 (47.2%) | 285 (64.0%) |
| 65 to 74 Years | 329 (98.8%) | 236 (70.9%) |
| 75 Years and over | 205 (100.0%) | 126 (61.5%) |
| Total | 1,566 (48.3%) | 2,124 (65.5%) |
Disability Status by Sex by Age in Masontown borough
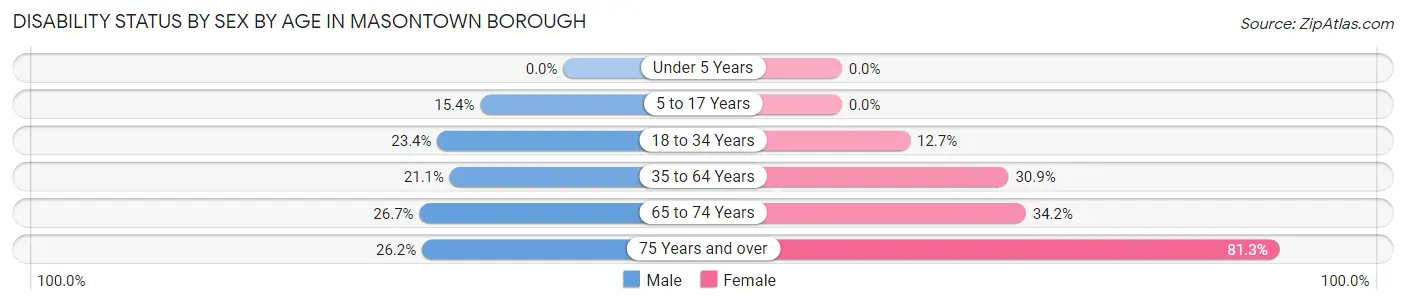
| Age Bracket | Male | Female |
| Under 5 Years | 0 (0.0%) | 0 (0.0%) |
| 5 to 17 Years | 66 (15.4%) | 0 (0.0%) |
| 18 to 34 Years | 83 (23.4%) | 37 (12.7%) |
| 35 to 64 Years | 139 (21.1%) | 190 (30.9%) |
| 65 to 74 Years | 35 (26.7%) | 69 (34.2%) |
| 75 Years and over | 16 (26.2%) | 117 (81.2%) |
Disability Class by Sex by Age in Masontown borough
Disability Class: Hearing Difficulty
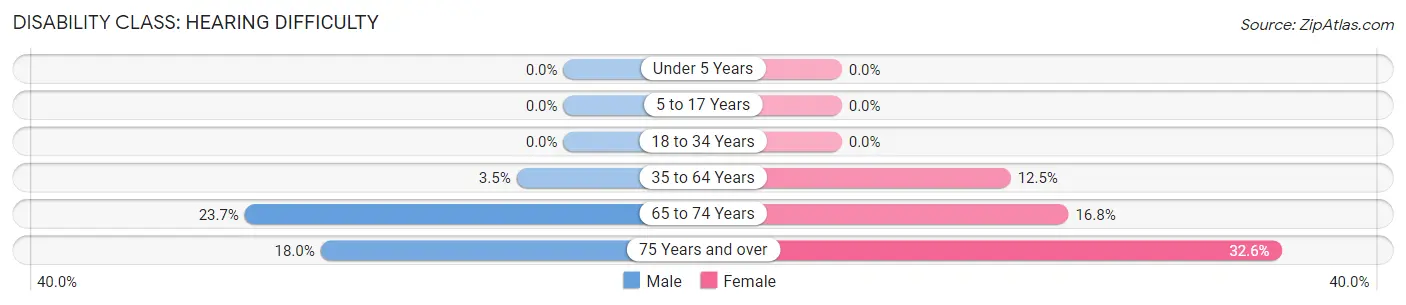
| Age Bracket | Male | Female |
| Under 5 Years | 0 (0.0%) | 0 (0.0%) |
| 5 to 17 Years | 0 (0.0%) | 0 (0.0%) |
| 18 to 34 Years | 0 (0.0%) | 0 (0.0%) |
| 35 to 64 Years | 23 (3.5%) | 77 (12.5%) |
| 65 to 74 Years | 31 (23.7%) | 34 (16.8%) |
| 75 Years and over | 11 (18.0%) | 47 (32.6%) |
Disability Class: Vision Difficulty
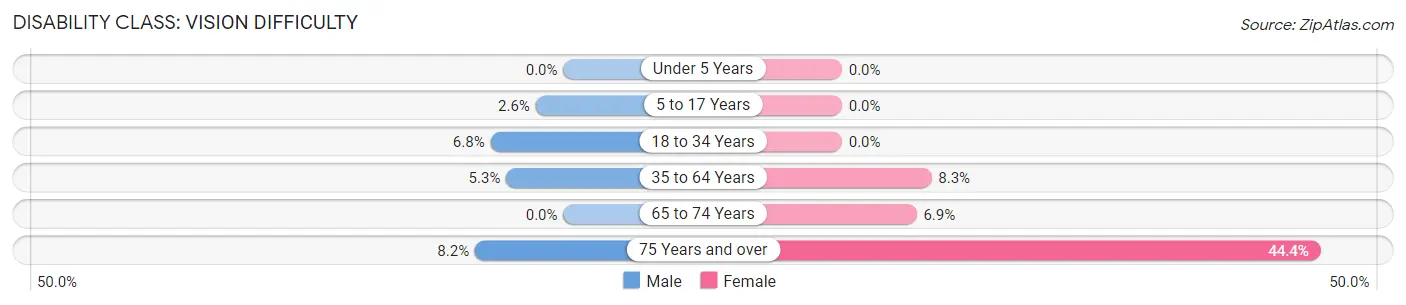
| Age Bracket | Male | Female |
| Under 5 Years | 0 (0.0%) | 0 (0.0%) |
| 5 to 17 Years | 11 (2.6%) | 0 (0.0%) |
| 18 to 34 Years | 24 (6.8%) | 0 (0.0%) |
| 35 to 64 Years | 35 (5.3%) | 51 (8.3%) |
| 65 to 74 Years | 0 (0.0%) | 14 (6.9%) |
| 75 Years and over | 5 (8.2%) | 64 (44.4%) |
Disability Class: Cognitive Difficulty
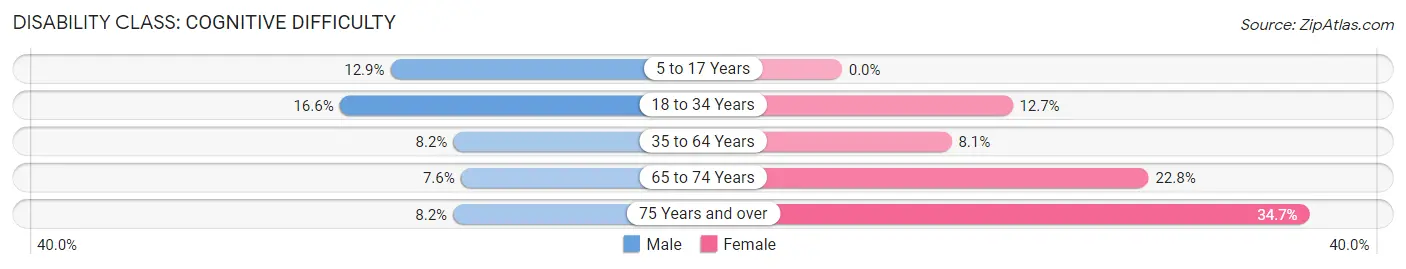
| Age Bracket | Male | Female |
| 5 to 17 Years | 55 (12.9%) | 0 (0.0%) |
| 18 to 34 Years | 59 (16.6%) | 37 (12.7%) |
| 35 to 64 Years | 54 (8.2%) | 50 (8.1%) |
| 65 to 74 Years | 10 (7.6%) | 46 (22.8%) |
| 75 Years and over | 5 (8.2%) | 50 (34.7%) |
Disability Class: Ambulatory Difficulty
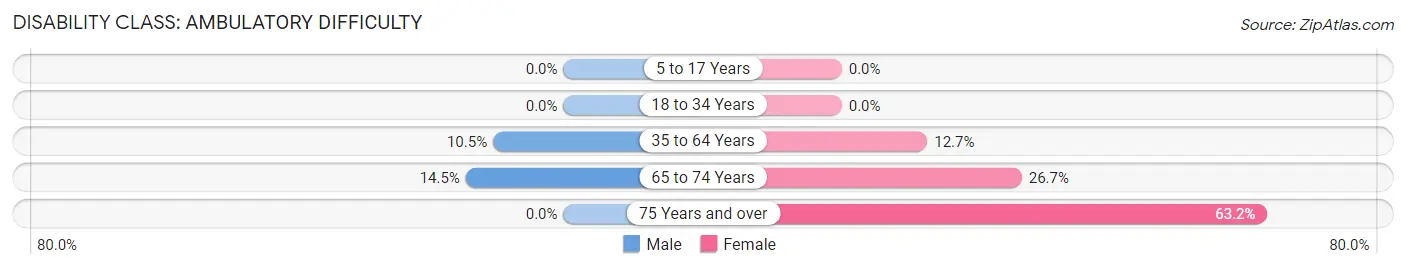
| Age Bracket | Male | Female |
| 5 to 17 Years | 0 (0.0%) | 0 (0.0%) |
| 18 to 34 Years | 0 (0.0%) | 0 (0.0%) |
| 35 to 64 Years | 69 (10.4%) | 78 (12.7%) |
| 65 to 74 Years | 19 (14.5%) | 54 (26.7%) |
| 75 Years and over | 0 (0.0%) | 91 (63.2%) |
Disability Class: Self-Care Difficulty
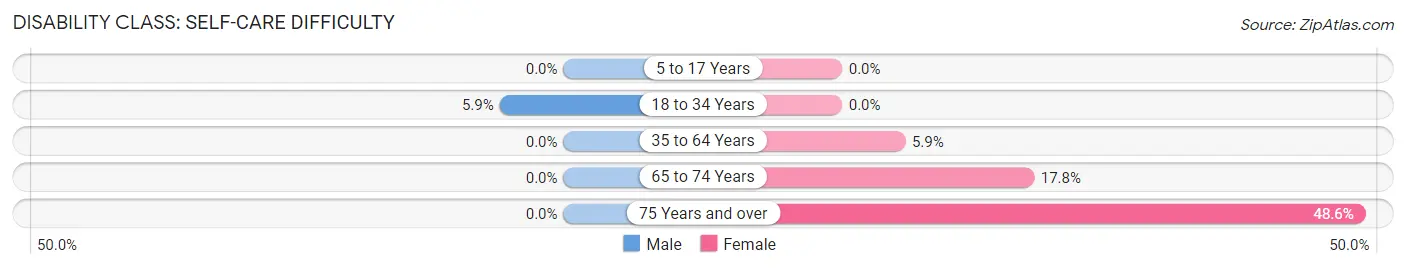
| Age Bracket | Male | Female |
| 5 to 17 Years | 0 (0.0%) | 0 (0.0%) |
| 18 to 34 Years | 21 (5.9%) | 0 (0.0%) |
| 35 to 64 Years | 0 (0.0%) | 36 (5.9%) |
| 65 to 74 Years | 0 (0.0%) | 36 (17.8%) |
| 75 Years and over | 0 (0.0%) | 70 (48.6%) |
Technology Access in Masontown borough
Computing Device Access in Masontown borough
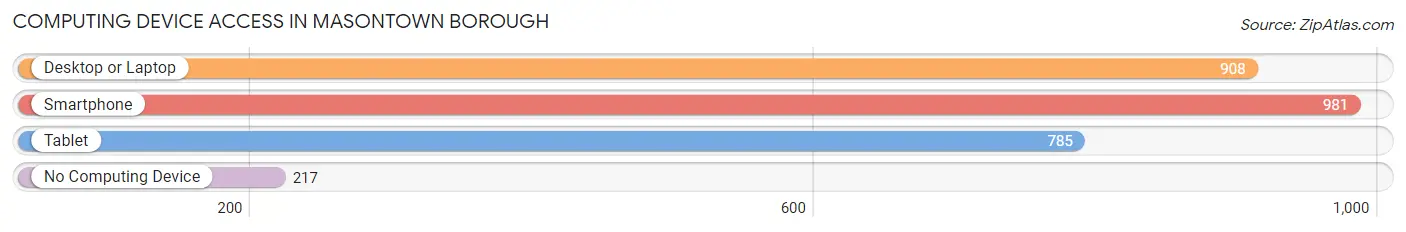
| Device Type | # Households | % Households |
| Desktop or Laptop | 908 | 67.6% |
| Smartphone | 981 | 73.0% |
| Tablet | 785 | 58.4% |
| No Computing Device | 217 | 16.2% |
| Total | 1,344 | 100.0% |
Internet Access in Masontown borough
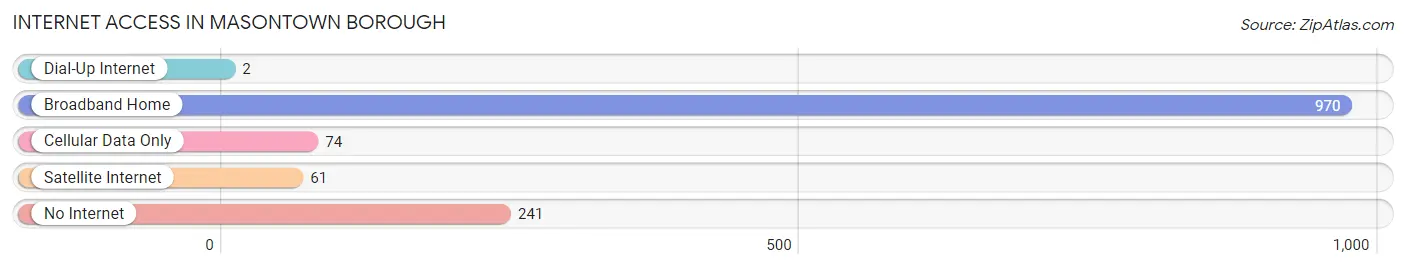
| Internet Type | # Households | % Households |
| Dial-Up Internet | 2 | 0.2% |
| Broadband Home | 970 | 72.2% |
| Cellular Data Only | 74 | 5.5% |
| Satellite Internet | 61 | 4.5% |
| No Internet | 241 | 17.9% |
| Total | 1,344 | 100.0% |
Masontown borough Summary
Introduction
Masontown Borough is a small borough located in Fayette County, Pennsylvania. It is situated in the southwestern corner of the state, approximately 40 miles south of Pittsburgh. The borough is home to a population of 1,717 people, according to the 2010 census. The borough is known for its rich history, diverse geography, and vibrant economy. This paper will explore the history, geography, economy, and demographics of Masontown Borough in 2000 words.
History
Masontown Borough was founded in 1817 by John Mason, a Revolutionary War veteran. Mason purchased the land from the local Native American tribes and named the area after himself. The borough was officially incorporated in 1832.
The borough was an important stop on the National Road, which was the first federally funded highway in the United States. The road connected the east coast to the west coast and was a major factor in the growth of the borough.
The borough was also an important stop on the Underground Railroad. The borough was home to several abolitionists who helped runaway slaves escape to freedom.
Geography
Masontown Borough is located in the southwestern corner of Fayette County, Pennsylvania. The borough is situated on the banks of the Monongahela River and is surrounded by rolling hills and forests. The borough is approximately 40 miles south of Pittsburgh and is accessible by the Pennsylvania Turnpike and Interstate 70.
The borough has a total area of 1.2 square miles, all of which is land. The borough is home to several parks, including Masontown Park, which features a playground, picnic area, and walking trails.
Economy
Masontown Borough has a vibrant economy that is driven by the local manufacturing industry. The borough is home to several factories that produce a variety of products, including furniture, clothing, and automotive parts.
The borough is also home to several small businesses, including restaurants, shops, and service providers. The borough is home to several banks, including First National Bank of Masontown and Citizens Bank of Masontown.
Demographics
According to the 2010 census, Masontown Borough has a population of 1,717 people. The population is predominantly white (94.3%), with small percentages of African American (2.7%), Hispanic (1.2%), and Asian (1.1%) residents.
The median household income in the borough is $37,917, and the median age is 41. The borough has a high rate of homeownership (77.3%), and the majority of residents (90.3%) are high school graduates.
Conclusion
Masontown Borough is a small borough located in Fayette County, Pennsylvania. The borough is known for its rich history, diverse geography, and vibrant economy. The borough is home to a population of 1,717 people, and the majority of residents are white. The borough has a vibrant economy that is driven by the local manufacturing industry, and the median household income is $37,917. Masontown Borough is an important part of the history and culture of Pennsylvania.
Common Questions
What is Per Capita Income in Masontown borough?
Per Capita income in Masontown borough is $26,275.
What is the Median Family Income in Masontown borough?
Median Family Income in Masontown borough is $77,500.
What is the Median Household income in Masontown borough?
Median Household Income in Masontown borough is $52,692.
What is Income or Wage Gap in Masontown borough?
Income or Wage Gap in Masontown borough is 50.0%.
Women in Masontown borough earn 50.0 cents for every dollar earned by a man.
What is Inequality or Gini Index in Masontown borough?
Inequality or Gini Index in Masontown borough is 0.41.
What is the Total Population of Masontown borough?
Total Population of Masontown borough is 3,263.
What is the Total Male Population of Masontown borough?
Total Male Population of Masontown borough is 1,850.
What is the Total Female Population of Masontown borough?
Total Female Population of Masontown borough is 1,413.
What is the Ratio of Males per 100 Females in Masontown borough?
There are 130.93 Males per 100 Females in Masontown borough.
What is the Ratio of Females per 100 Males in Masontown borough?
There are 76.38 Females per 100 Males in Masontown borough.
What is the Median Population Age in Masontown borough?
Median Population Age in Masontown borough is 39.0 Years.
What is the Average Family Size in Masontown borough
Average Family Size in Masontown borough is 3.3 People.
What is the Average Household Size in Masontown borough
Average Household Size in Masontown borough is 2.4 People.
How Large is the Labor Force in Masontown borough?
There are 1,310 People in the Labor Forcein in Masontown borough.
What is the Percentage of People in the Labor Force in Masontown borough?
51.1% of People are in the Labor Force in Masontown borough.
What is the Unemployment Rate in Masontown borough?
Unemployment Rate in Masontown borough is 9.5%.