Millbourne borough, PA Map & Demographics
Millbourne borough Overview
$28,291
PER CAPITA INCOME
$80,156
AVG FAMILY INCOME
$58,750
AVG HOUSEHOLD INCOME
16.2%
WAGE / INCOME GAP [ % ]
83.8¢/ $1
WAGE / INCOME GAP [ $ ]
0.45
INEQUALITY / GINI INDEX
1,425
TOTAL POPULATION
699
MALE POPULATION
726
FEMALE POPULATION
96.28
MALES / 100 FEMALES
103.86
FEMALES / 100 MALES
34.4
MEDIAN AGE
3.7
AVG FAMILY SIZE
2.9
AVG HOUSEHOLD SIZE
752
LABOR FORCE [ PEOPLE ]
64.0%
PERCENT IN LABOR FORCE
3.5%
UNEMPLOYMENT RATE
Income in Millbourne borough
Income Overview in Millbourne borough
Per Capita Income in Millbourne borough is $28,291, while median incomes of families and households are $80,156 and $58,750 respectively.
| Characteristic | Number | Measure |
| Per Capita Income | 1,425 | $28,291 |
| Median Family Income | 297 | $80,156 |
| Mean Family Income | 297 | $104,004 |
| Median Household Income | 486 | $58,750 |
| Mean Household Income | 486 | $83,503 |
| Income Deficit | 297 | $0 |
| Wage / Income Gap (%) | 1,425 | 16.22% |
| Wage / Income Gap ($) | 1,425 | 83.78¢ per $1 |
| Gini / Inequality Index | 1,425 | 0.45 |
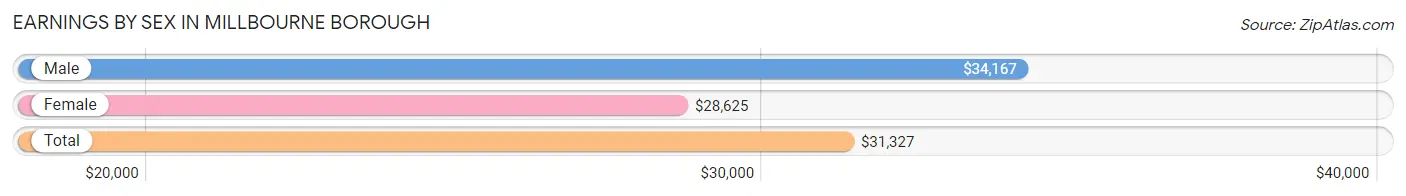
Earnings by Sex in Millbourne borough
Average Earnings in Millbourne borough are $31,327, $34,167 for men and $28,625 for women, a difference of 16.2%.
| Sex | Number | Average Earnings |
| Male | 462 (58.0%) | $34,167 |
| Female | 334 (42.0%) | $28,625 |
| Total | 796 (100.0%) | $31,327 |
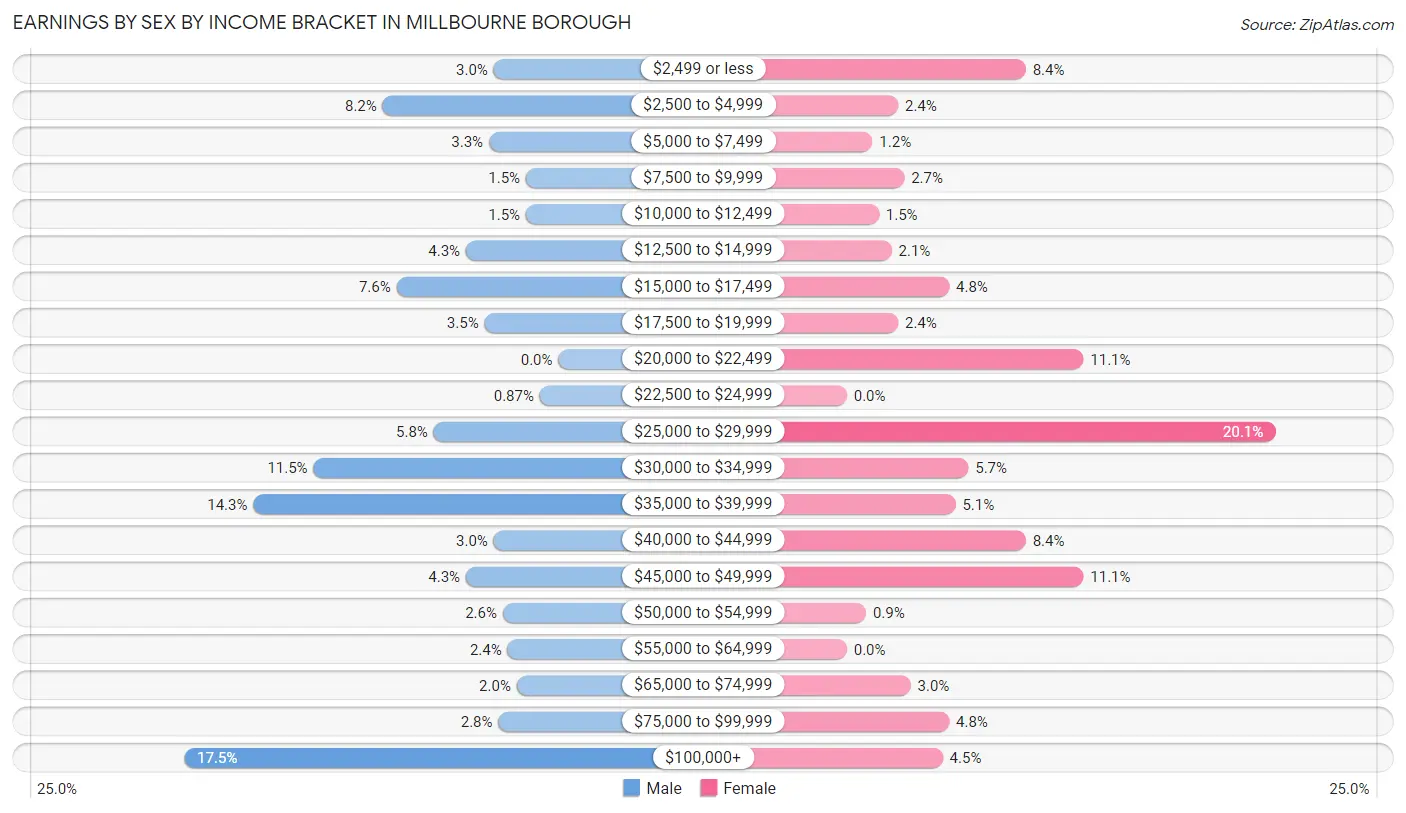
Earnings by Sex by Income Bracket in Millbourne borough
The most common earnings brackets in Millbourne borough are $100,000+ for men (81 | 17.5%) and $25,000 to $29,999 for women (67 | 20.1%).
| Income | Male | Female |
| $2,499 or less | 14 (3.0%) | 28 (8.4%) |
| $2,500 to $4,999 | 38 (8.2%) | 8 (2.4%) |
| $5,000 to $7,499 | 15 (3.3%) | 4 (1.2%) |
| $7,500 to $9,999 | 7 (1.5%) | 9 (2.7%) |
| $10,000 to $12,499 | 7 (1.5%) | 5 (1.5%) |
| $12,500 to $14,999 | 20 (4.3%) | 7 (2.1%) |
| $15,000 to $17,499 | 35 (7.6%) | 16 (4.8%) |
| $17,500 to $19,999 | 16 (3.5%) | 8 (2.4%) |
| $20,000 to $22,499 | 0 (0.0%) | 37 (11.1%) |
| $22,500 to $24,999 | 4 (0.9%) | 0 (0.0%) |
| $25,000 to $29,999 | 27 (5.8%) | 67 (20.1%) |
| $30,000 to $34,999 | 53 (11.5%) | 19 (5.7%) |
| $35,000 to $39,999 | 66 (14.3%) | 17 (5.1%) |
| $40,000 to $44,999 | 14 (3.0%) | 28 (8.4%) |
| $45,000 to $49,999 | 20 (4.3%) | 37 (11.1%) |
| $50,000 to $54,999 | 12 (2.6%) | 3 (0.9%) |
| $55,000 to $64,999 | 11 (2.4%) | 0 (0.0%) |
| $65,000 to $74,999 | 9 (1.9%) | 10 (3.0%) |
| $75,000 to $99,999 | 13 (2.8%) | 16 (4.8%) |
| $100,000+ | 81 (17.5%) | 15 (4.5%) |
| Total | 462 (100.0%) | 334 (100.0%) |
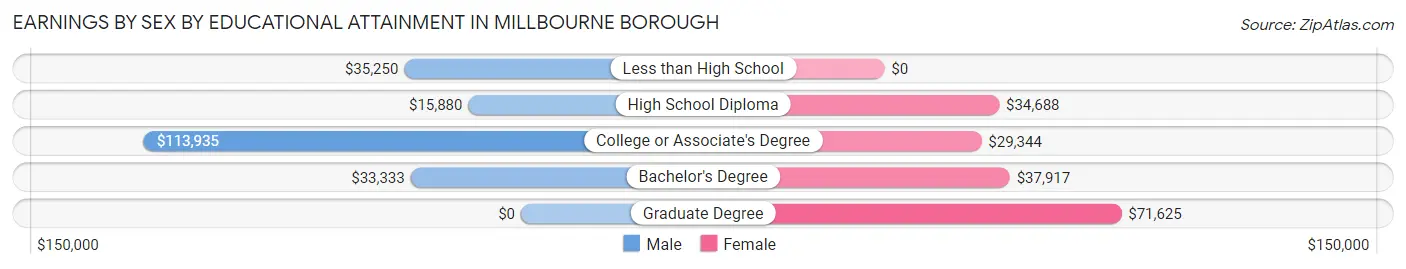
Earnings by Sex by Educational Attainment in Millbourne borough
Average earnings in Millbourne borough are $35,459 for men and $29,875 for women, a difference of 15.8%. Men with an educational attainment of college or associate's degree enjoy the highest average annual earnings of $113,935, while those with high school diploma education earn the least with $15,880. Women with an educational attainment of graduate degree earn the most with the average annual earnings of $71,625, while those with college or associate's degree education have the smallest earnings of $29,344.
| Educational Attainment | Male Income | Female Income |
| Less than High School | $35,250 | $0 |
| High School Diploma | $15,880 | $34,688 |
| College or Associate's Degree | $113,935 | $29,344 |
| Bachelor's Degree | $33,333 | $37,917 |
| Graduate Degree | - | - |
| Total | $35,459 | $29,875 |
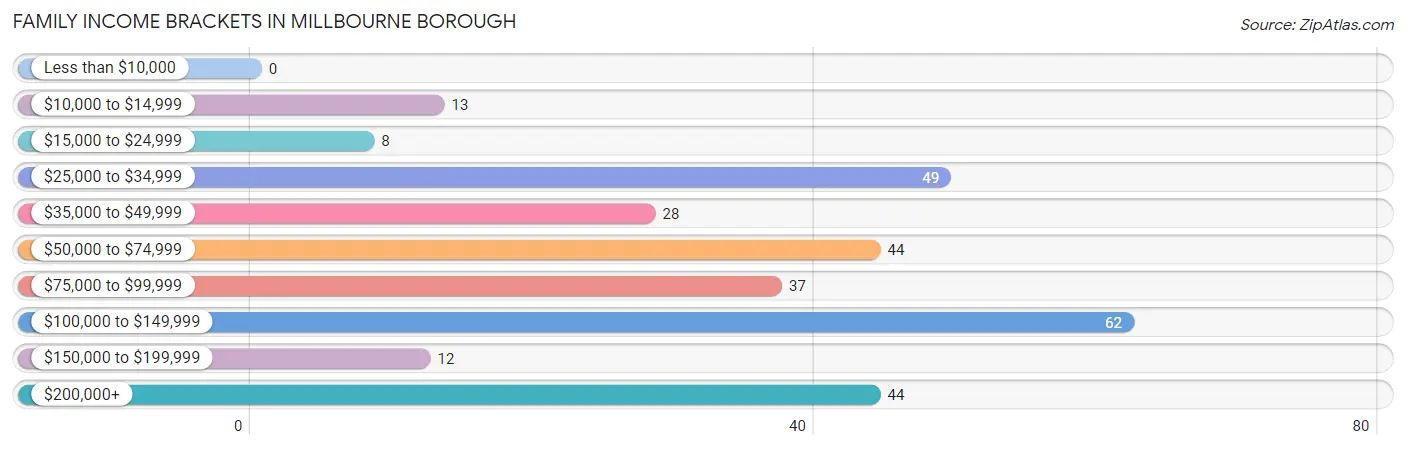
Family Income in Millbourne borough
Family Income Brackets in Millbourne borough
According to the Millbourne borough family income data, there are 62 families falling into the $100,000 to $149,999 income range, which is the most common income bracket and makes up 20.9% of all families.
| Income Bracket | # Families | % Families |
| Less than $10,000 | 0 | 0.0% |
| $10,000 to $14,999 | 13 | 4.4% |
| $15,000 to $24,999 | 8 | 2.7% |
| $25,000 to $34,999 | 49 | 16.5% |
| $35,000 to $49,999 | 28 | 9.4% |
| $50,000 to $74,999 | 44 | 14.8% |
| $75,000 to $99,999 | 37 | 12.5% |
| $100,000 to $149,999 | 62 | 20.9% |
| $150,000 to $199,999 | 12 | 4.0% |
| $200,000+ | 44 | 14.8% |
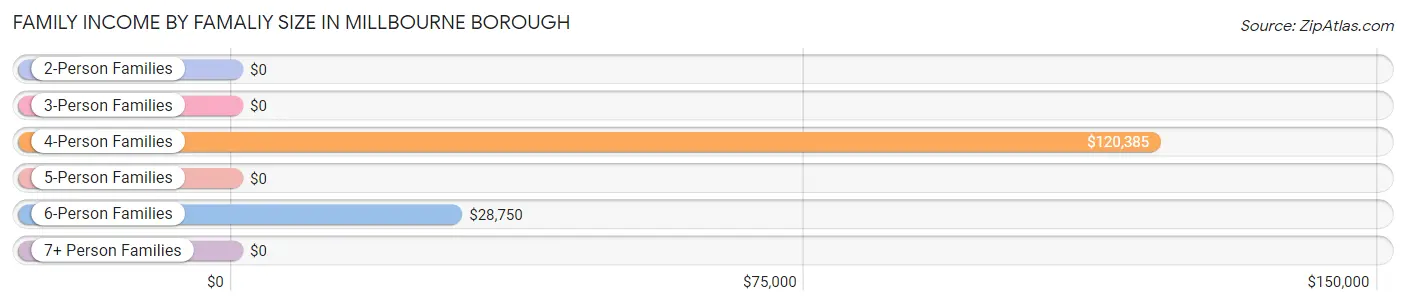
Family Income by Famaliy Size in Millbourne borough
4-person families (42 | 14.1%) account for the highest median family income in Millbourne borough with $120,385 per family, while 4-person families (42 | 14.1%) have the highest median income of $30,096 per family member.
| Income Bracket | # Families | Median Income |
| 2-Person Families | 77 (25.9%) | $0 |
| 3-Person Families | 94 (31.7%) | $0 |
| 4-Person Families | 42 (14.1%) | $120,385 |
| 5-Person Families | 54 (18.2%) | $0 |
| 6-Person Families | 30 (10.1%) | $28,750 |
| 7+ Person Families | 0 (0.0%) | $0 |
| Total | 297 (100.0%) | $80,156 |
Family Income by Number of Earners in Millbourne borough
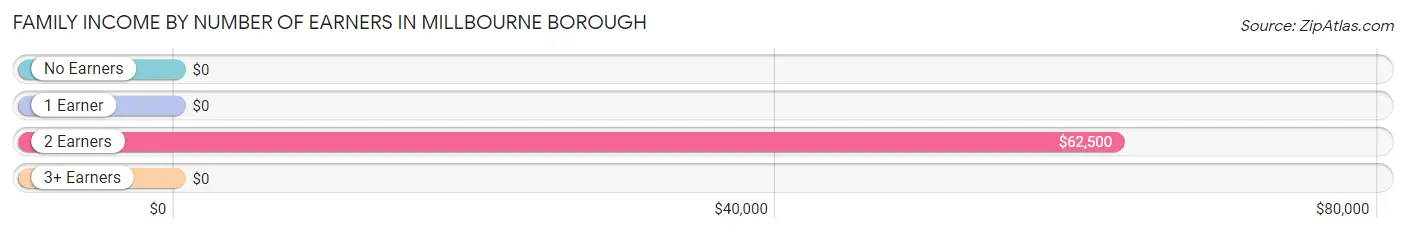
| Number of Earners | # Families | Median Income |
| No Earners | 15 (5.1%) | $0 |
| 1 Earner | 84 (28.3%) | $0 |
| 2 Earners | 108 (36.4%) | $62,500 |
| 3+ Earners | 90 (30.3%) | $0 |
| Total | 297 (100.0%) | $80,156 |
Household Income in Millbourne borough
Household Income Brackets in Millbourne borough
With 97 households falling in the category, the $25,000 to $34,999 income range is the most frequent in Millbourne borough, accounting for 20.0% of all households. In contrast, only 2 households (0.4%) fall into the less than $10,000 income bracket, making it the least populous group.
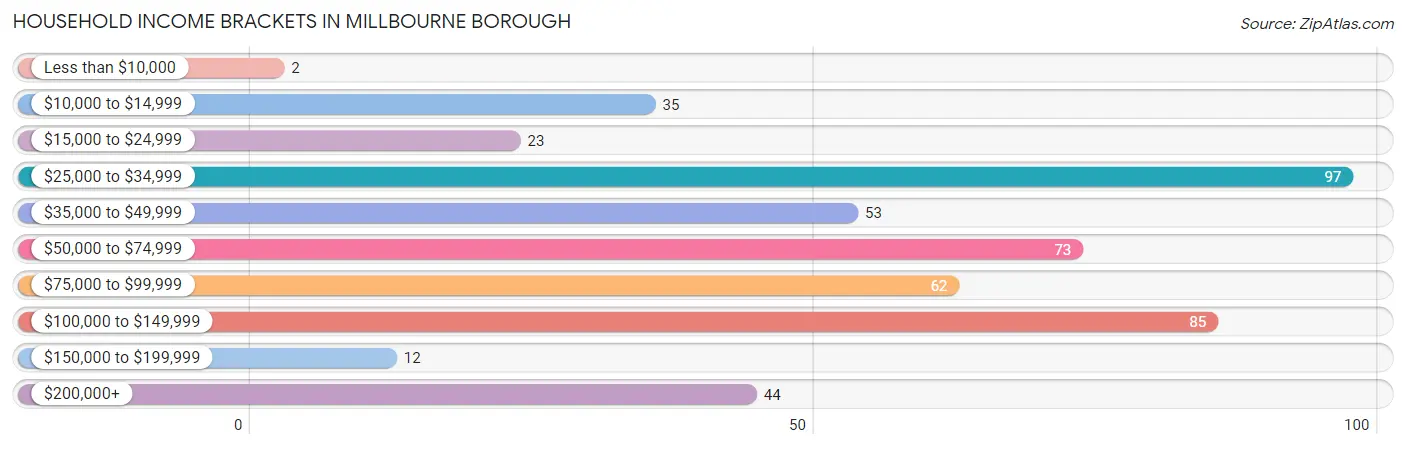
| Income Bracket | # Households | % Households |
| Less than $10,000 | 2 | 0.4% |
| $10,000 to $14,999 | 35 | 7.2% |
| $15,000 to $24,999 | 23 | 4.7% |
| $25,000 to $34,999 | 97 | 20.0% |
| $35,000 to $49,999 | 53 | 10.9% |
| $50,000 to $74,999 | 73 | 15.0% |
| $75,000 to $99,999 | 62 | 12.8% |
| $100,000 to $149,999 | 85 | 17.5% |
| $150,000 to $199,999 | 12 | 2.5% |
| $200,000+ | 44 | 9.1% |
Household Income by Householder Age in Millbourne borough
The median household income in Millbourne borough is $58,750, with the highest median household income of $52,604 found in the 25 to 44 years age bracket for the primary householder. A total of 171 households (35.2%) fall into this category. Meanwhile, the 15 to 24 years age bracket for the primary householder has the lowest median household income of $0, with 7 households (1.4%) in this group.
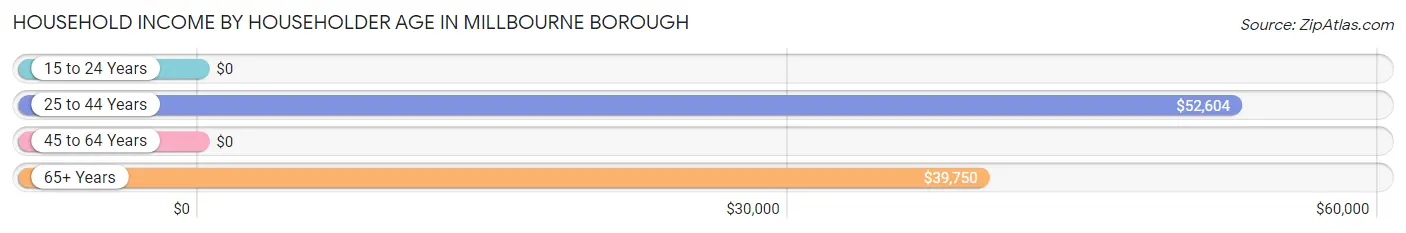
| Income Bracket | # Households | Median Income |
| 15 to 24 Years | 7 (1.4%) | $0 |
| 25 to 44 Years | 171 (35.2%) | $52,604 |
| 45 to 64 Years | 233 (47.9%) | $0 |
| 65+ Years | 75 (15.4%) | $39,750 |
| Total | 486 (100.0%) | $58,750 |
Poverty in Millbourne borough
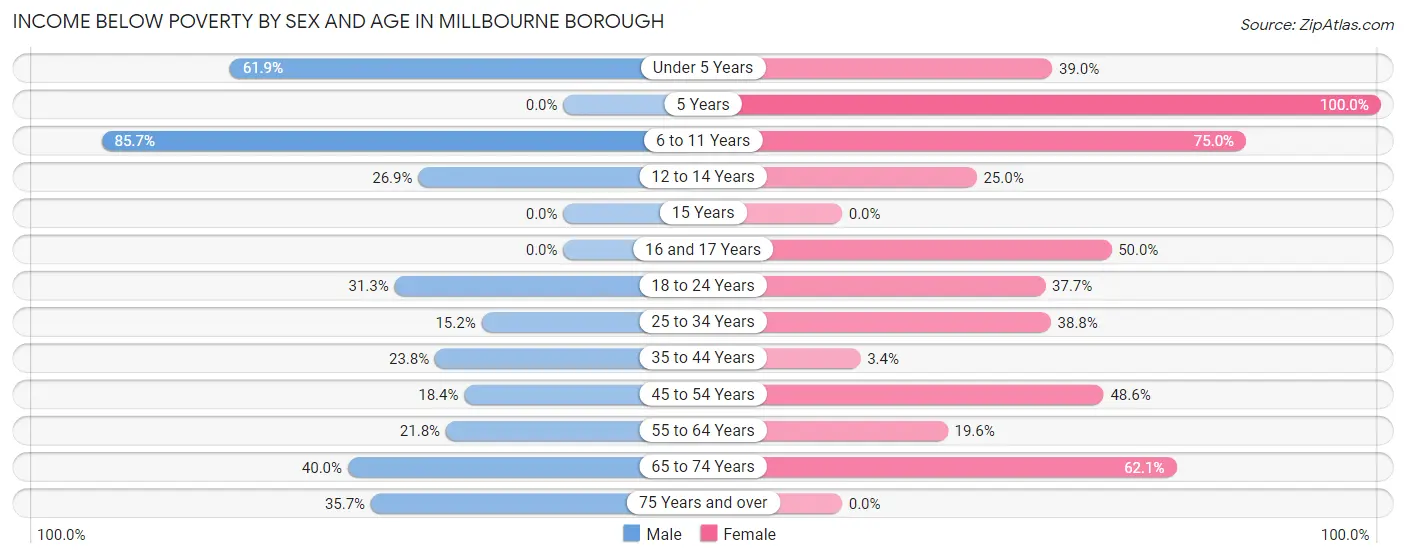
Income Below Poverty by Sex and Age in Millbourne borough
With 26.0% poverty level for males and 30.8% for females among the residents of Millbourne borough, 6 to 11 year old males and 5 year old females are the most vulnerable to poverty, with 12 males (85.7%) and 24 females (100.0%) in their respective age groups living below the poverty level.
| Age Bracket | Male | Female |
| Under 5 Years | 26 (61.9%) | 16 (39.0%) |
| 5 Years | 0 (0.0%) | 24 (100.0%) |
| 6 to 11 Years | 12 (85.7%) | 27 (75.0%) |
| 12 to 14 Years | 7 (26.9%) | 12 (25.0%) |
| 15 Years | 0 (0.0%) | 0 (0.0%) |
| 16 and 17 Years | 0 (0.0%) | 15 (50.0%) |
| 18 to 24 Years | 26 (31.3%) | 20 (37.7%) |
| 25 to 34 Years | 26 (15.2%) | 50 (38.8%) |
| 35 to 44 Years | 10 (23.8%) | 4 (3.4%) |
| 45 to 54 Years | 16 (18.4%) | 17 (48.6%) |
| 55 to 64 Years | 29 (21.8%) | 21 (19.6%) |
| 65 to 74 Years | 20 (40.0%) | 18 (62.1%) |
| 75 Years and over | 10 (35.7%) | 0 (0.0%) |
| Total | 182 (26.0%) | 224 (30.8%) |
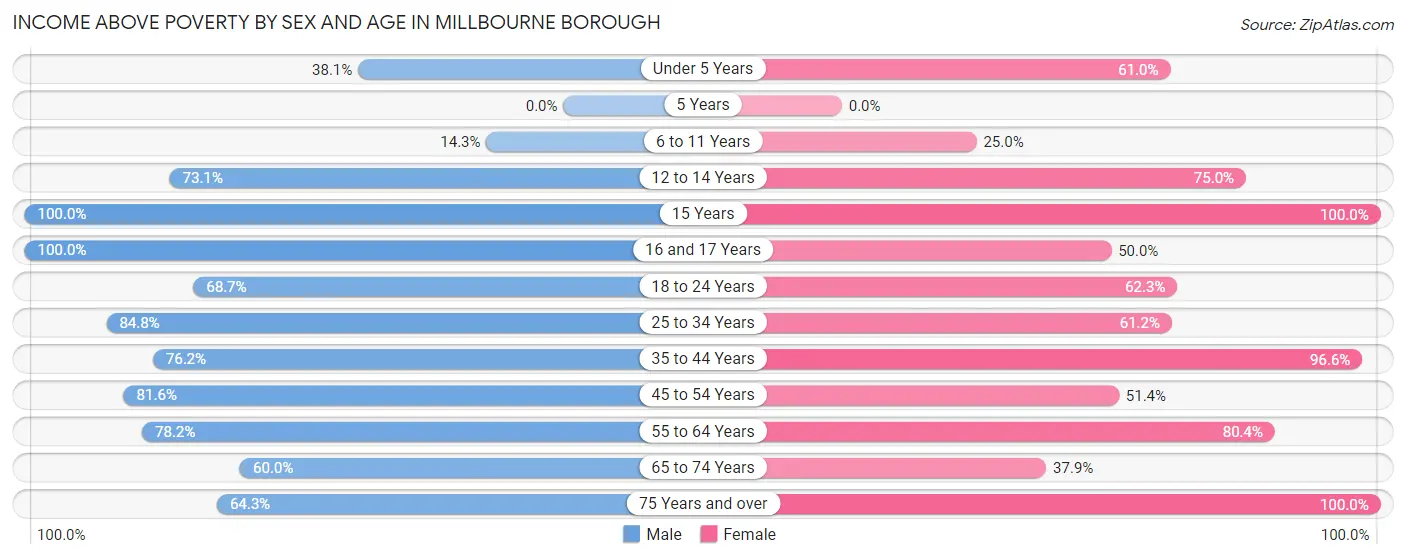
Income Above Poverty by Sex and Age in Millbourne borough
According to the poverty statistics in Millbourne borough, males aged 15 years and females aged 15 years are the age groups that are most secure financially, with 100.0% of males and 100.0% of females in these age groups living above the poverty line.
| Age Bracket | Male | Female |
| Under 5 Years | 16 (38.1%) | 25 (61.0%) |
| 5 Years | 0 (0.0%) | 0 (0.0%) |
| 6 to 11 Years | 2 (14.3%) | 9 (25.0%) |
| 12 to 14 Years | 19 (73.1%) | 36 (75.0%) |
| 15 Years | 9 (100.0%) | 10 (100.0%) |
| 16 and 17 Years | 14 (100.0%) | 15 (50.0%) |
| 18 to 24 Years | 57 (68.7%) | 33 (62.3%) |
| 25 to 34 Years | 145 (84.8%) | 79 (61.2%) |
| 35 to 44 Years | 32 (76.2%) | 113 (96.6%) |
| 45 to 54 Years | 71 (81.6%) | 18 (51.4%) |
| 55 to 64 Years | 104 (78.2%) | 86 (80.4%) |
| 65 to 74 Years | 30 (60.0%) | 11 (37.9%) |
| 75 Years and over | 18 (64.3%) | 67 (100.0%) |
| Total | 517 (74.0%) | 502 (69.2%) |
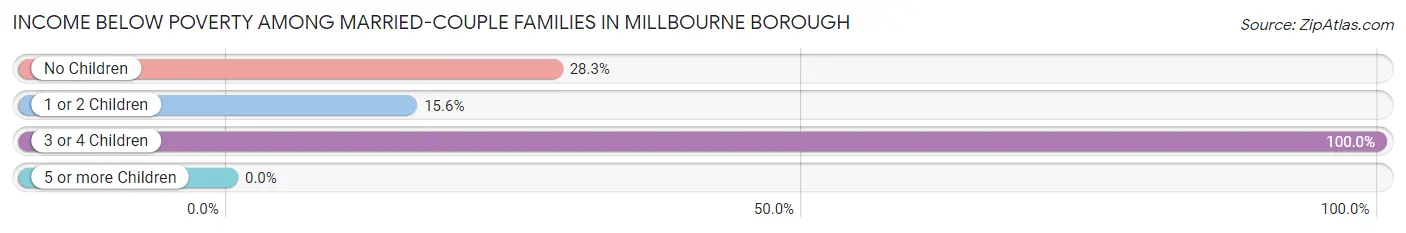
Income Below Poverty Among Married-Couple Families in Millbourne borough
The poverty statistics for married-couple families in Millbourne borough show that 29.8% or 53 of the total 178 families live below the poverty line. Families with 3 or 4 children have the highest poverty rate of 100.0%, comprising of 23 families. On the other hand, families with 1 or 2 children have the lowest poverty rate of 15.6%, which includes 17 families.
| Children | Above Poverty | Below Poverty |
| No Children | 33 (71.7%) | 13 (28.3%) |
| 1 or 2 Children | 92 (84.4%) | 17 (15.6%) |
| 3 or 4 Children | 0 (0.0%) | 23 (100.0%) |
| 5 or more Children | 0 (0.0%) | 0 (0.0%) |
| Total | 125 (70.2%) | 53 (29.8%) |
Income Below Poverty Among Single-Parent Households in Millbourne borough
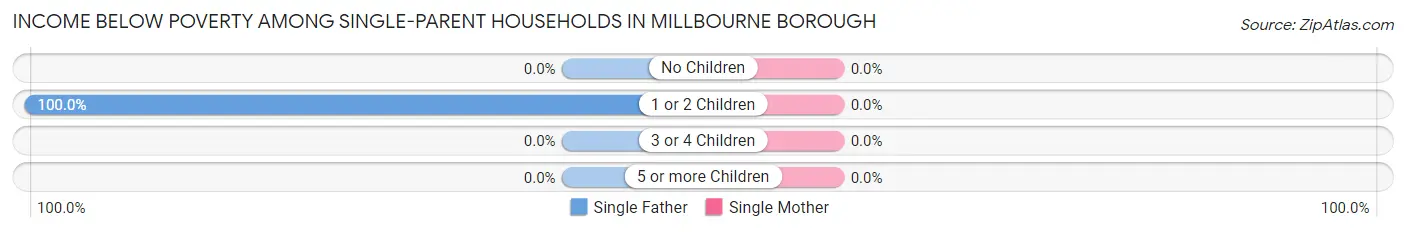
| Children | Single Father | Single Mother |
| No Children | 0 (0.0%) | 0 (0.0%) |
| 1 or 2 Children | 12 (100.0%) | 0 (0.0%) |
| 3 or 4 Children | 0 (0.0%) | 0 (0.0%) |
| 5 or more Children | 0 (0.0%) | 0 (0.0%) |
| Total | 12 (12.1%) | 0 (0.0%) |
Income Below Poverty Among Married-Couple vs Single-Parent Households in Millbourne borough
The poverty data for Millbourne borough shows that 53 of the married-couple family households (29.8%) and 12 of the single-parent households (10.1%) are living below the poverty level. Within the married-couple family households, those with 3 or 4 children have the highest poverty rate, with 23 households (100.0%) falling below the poverty line. Among the single-parent households, those with 1 or 2 children have the highest poverty rate, with 12 household (44.4%) living below poverty.
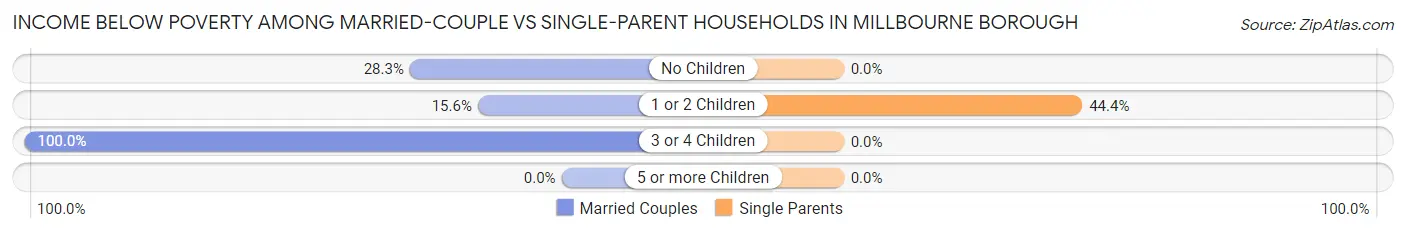
| Children | Married-Couple Families | Single-Parent Households |
| No Children | 13 (28.3%) | 0 (0.0%) |
| 1 or 2 Children | 17 (15.6%) | 12 (44.4%) |
| 3 or 4 Children | 23 (100.0%) | 0 (0.0%) |
| 5 or more Children | 0 (0.0%) | 0 (0.0%) |
| Total | 53 (29.8%) | 12 (10.1%) |
Race in Millbourne borough
The most populous races in Millbourne borough are Asian (832 | 58.4%), Black / African American (409 | 28.7%), and White / Caucasian (137 | 9.6%).
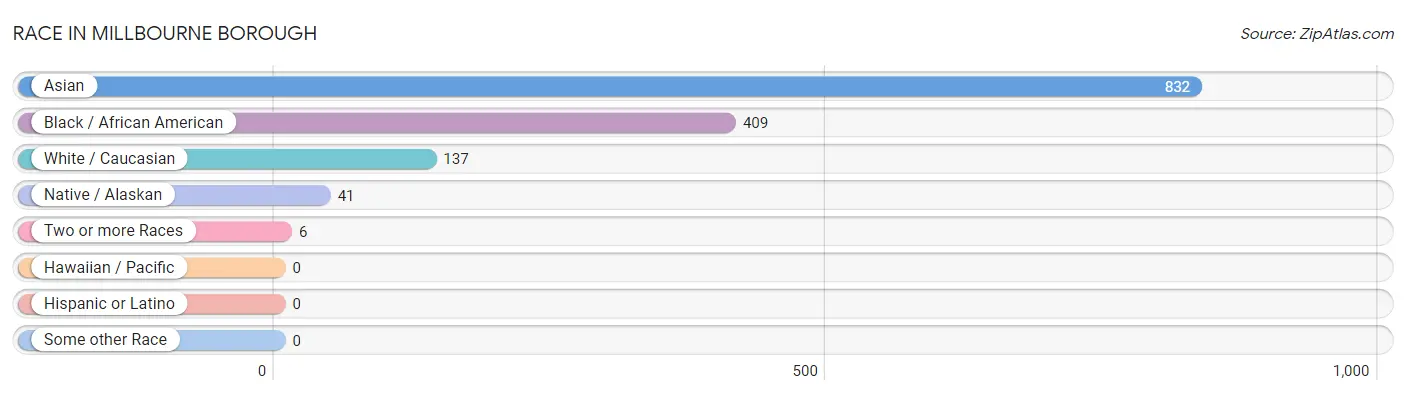
| Race | # Population | % Population |
| Asian | 832 | 58.4% |
| Black / African American | 409 | 28.7% |
| Hawaiian / Pacific | 0 | 0.0% |
| Hispanic or Latino | 0 | 0.0% |
| Native / Alaskan | 41 | 2.9% |
| White / Caucasian | 137 | 9.6% |
| Two or more Races | 6 | 0.4% |
| Some other Race | 0 | 0.0% |
| Total | 1,425 | 100.0% |
Ancestry in Millbourne borough
The most populous ancestries reported in Millbourne borough are Thai (525 | 36.8%), Subsaharan African (143 | 10.0%), Indian (Asian) (113 | 7.9%), African (64 | 4.5%), and Vietnamese (64 | 4.5%), together accounting for 63.8% of all Millbourne borough residents.
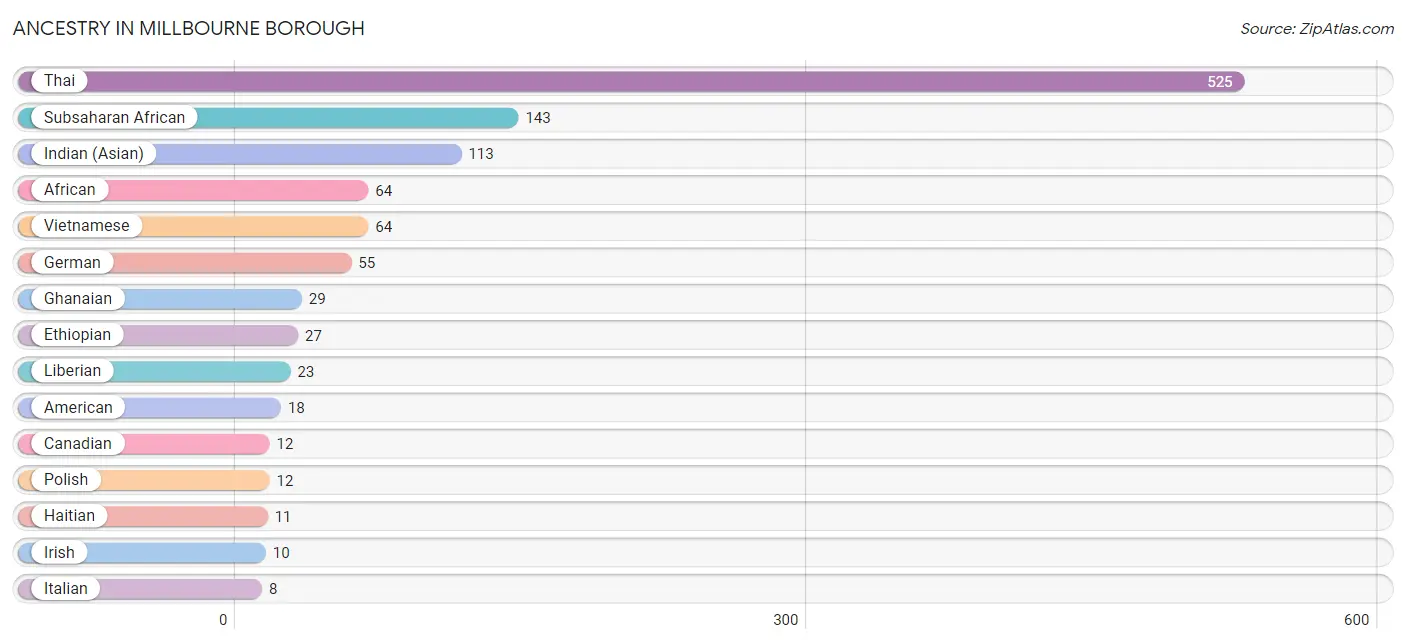
| Ancestry | # Population | % Population |
| African | 64 | 4.5% |
| American | 18 | 1.3% |
| Canadian | 12 | 0.8% |
| English | 2 | 0.1% |
| Ethiopian | 27 | 1.9% |
| German | 55 | 3.9% |
| Ghanaian | 29 | 2.0% |
| Greek | 3 | 0.2% |
| Haitian | 11 | 0.8% |
| Indian (Asian) | 113 | 7.9% |
| Irish | 10 | 0.7% |
| Italian | 8 | 0.6% |
| Liberian | 23 | 1.6% |
| Pakistani | 3 | 0.2% |
| Polish | 12 | 0.8% |
| Subsaharan African | 143 | 10.0% |
| Thai | 525 | 36.8% |
| Vietnamese | 64 | 4.5% | View All 18 Rows |
Immigrants in Millbourne borough
The most numerous immigrant groups reported in Millbourne borough came from Asia (603 | 42.3%), South Central Asia (503 | 35.3%), Bangladesh (235 | 16.5%), India (227 | 15.9%), and Africa (191 | 13.4%), together accounting for 123.4% of all Millbourne borough residents.
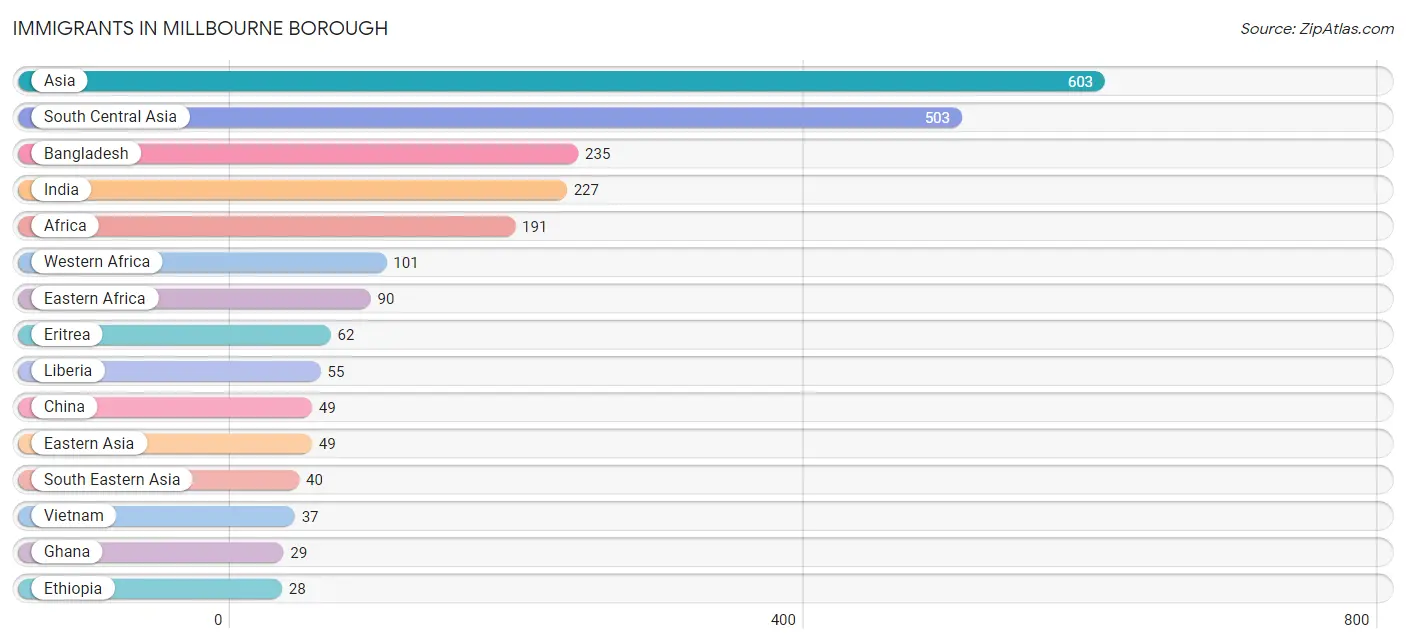
| Immigration Origin | # Population | % Population |
| Africa | 191 | 13.4% |
| Asia | 603 | 42.3% |
| Bangladesh | 235 | 16.5% |
| Caribbean | 5 | 0.4% |
| China | 49 | 3.4% |
| Eastern Africa | 90 | 6.3% |
| Eastern Asia | 49 | 3.4% |
| Eritrea | 62 | 4.3% |
| Ethiopia | 28 | 2.0% |
| Ghana | 29 | 2.0% |
| Haiti | 5 | 0.4% |
| India | 227 | 15.9% |
| Latin America | 5 | 0.4% |
| Liberia | 55 | 3.9% |
| Nepal | 21 | 1.5% |
| Pakistan | 20 | 1.4% |
| South Central Asia | 503 | 35.3% |
| South Eastern Asia | 40 | 2.8% |
| Thailand | 3 | 0.2% |
| Turkey | 11 | 0.8% |
| Vietnam | 37 | 2.6% |
| Western Africa | 101 | 7.1% |
| Western Asia | 11 | 0.8% | View All 23 Rows |
Sex and Age in Millbourne borough
Sex and Age in Millbourne borough
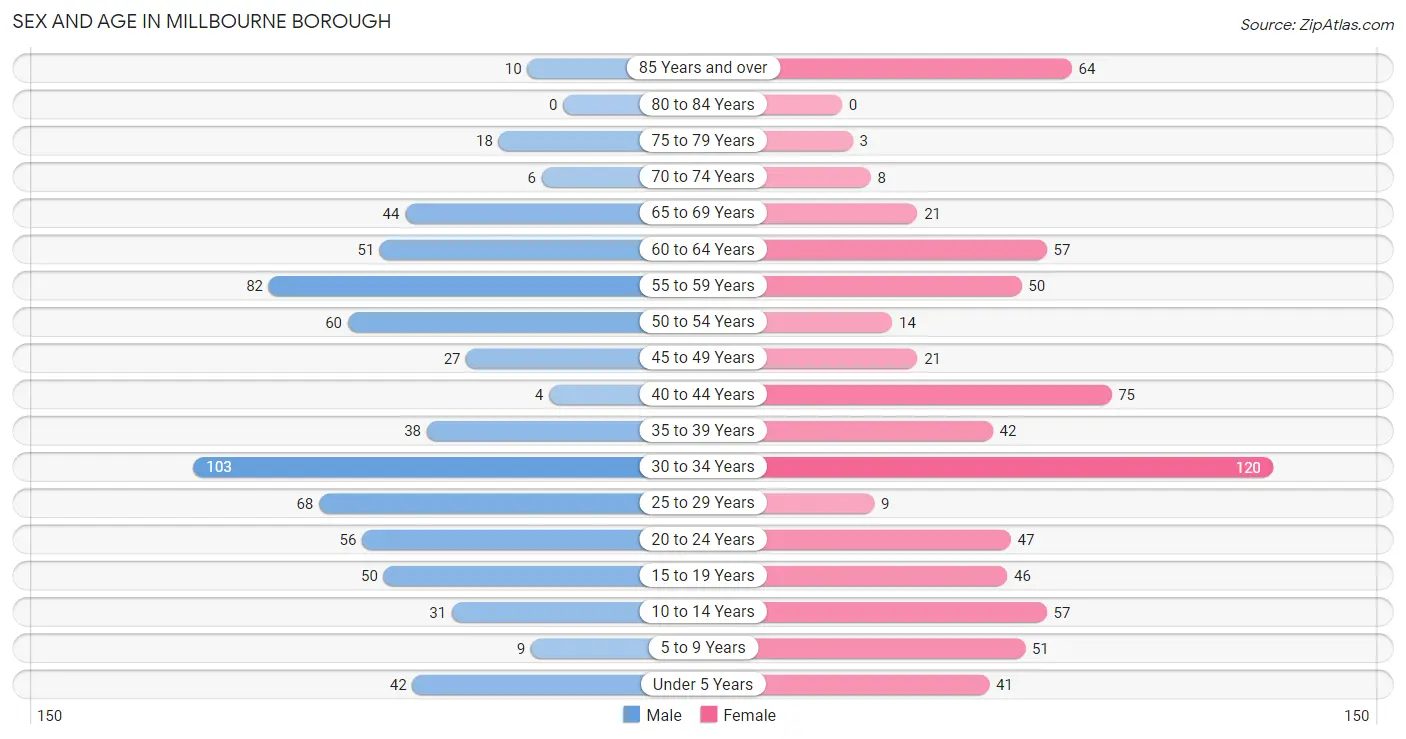
The most populous age groups in Millbourne borough are 30 to 34 Years (103 | 14.7%) for men and 30 to 34 Years (120 | 16.5%) for women.
| Age Bracket | Male | Female |
| Under 5 Years | 42 (6.0%) | 41 (5.7%) |
| 5 to 9 Years | 9 (1.3%) | 51 (7.0%) |
| 10 to 14 Years | 31 (4.4%) | 57 (7.9%) |
| 15 to 19 Years | 50 (7.1%) | 46 (6.3%) |
| 20 to 24 Years | 56 (8.0%) | 47 (6.5%) |
| 25 to 29 Years | 68 (9.7%) | 9 (1.2%) |
| 30 to 34 Years | 103 (14.7%) | 120 (16.5%) |
| 35 to 39 Years | 38 (5.4%) | 42 (5.8%) |
| 40 to 44 Years | 4 (0.6%) | 75 (10.3%) |
| 45 to 49 Years | 27 (3.9%) | 21 (2.9%) |
| 50 to 54 Years | 60 (8.6%) | 14 (1.9%) |
| 55 to 59 Years | 82 (11.7%) | 50 (6.9%) |
| 60 to 64 Years | 51 (7.3%) | 57 (7.9%) |
| 65 to 69 Years | 44 (6.3%) | 21 (2.9%) |
| 70 to 74 Years | 6 (0.9%) | 8 (1.1%) |
| 75 to 79 Years | 18 (2.6%) | 3 (0.4%) |
| 80 to 84 Years | 0 (0.0%) | 0 (0.0%) |
| 85 Years and over | 10 (1.4%) | 64 (8.8%) |
| Total | 699 (100.0%) | 726 (100.0%) |
Families and Households in Millbourne borough
Median Family Size in Millbourne borough
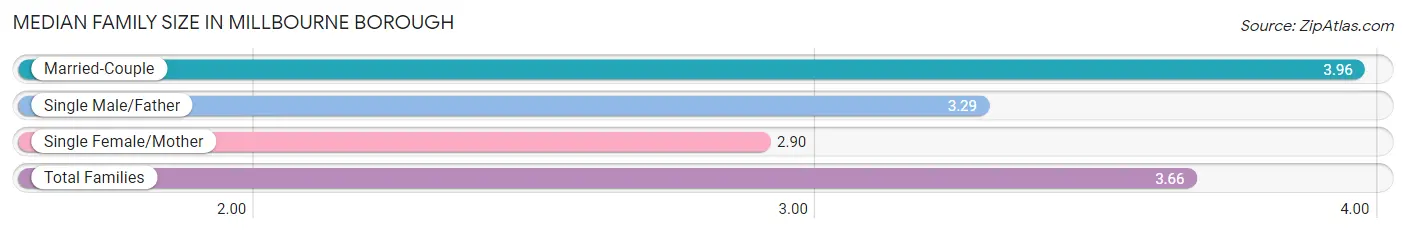
The median family size in Millbourne borough is 3.66 persons per family, with married-couple families (178 | 59.9%) accounting for the largest median family size of 3.96 persons per family. On the other hand, single female/mother families (20 | 6.7%) represent the smallest median family size with 2.90 persons per family.
| Family Type | # Families | Family Size |
| Married-Couple | 178 (59.9%) | 3.96 |
| Single Male/Father | 99 (33.3%) | 3.29 |
| Single Female/Mother | 20 (6.7%) | 2.90 |
| Total Families | 297 (100.0%) | 3.66 |
Median Household Size in Millbourne borough
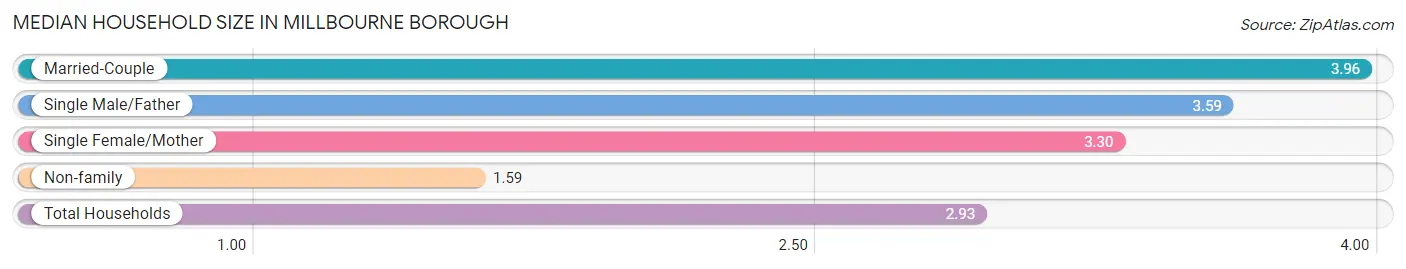
The median household size in Millbourne borough is 2.93 persons per household, with married-couple households (178 | 36.6%) accounting for the largest median household size of 3.96 persons per household. non-family households (189 | 38.9%) represent the smallest median household size with 1.59 persons per household.
| Household Type | # Households | Household Size |
| Married-Couple | 178 (36.6%) | 3.96 |
| Single Male/Father | 99 (20.4%) | 3.59 |
| Single Female/Mother | 20 (4.1%) | 3.30 |
| Non-family | 189 (38.9%) | 1.59 |
| Total Households | 486 (100.0%) | 2.93 |
Household Size by Marriage Status in Millbourne borough
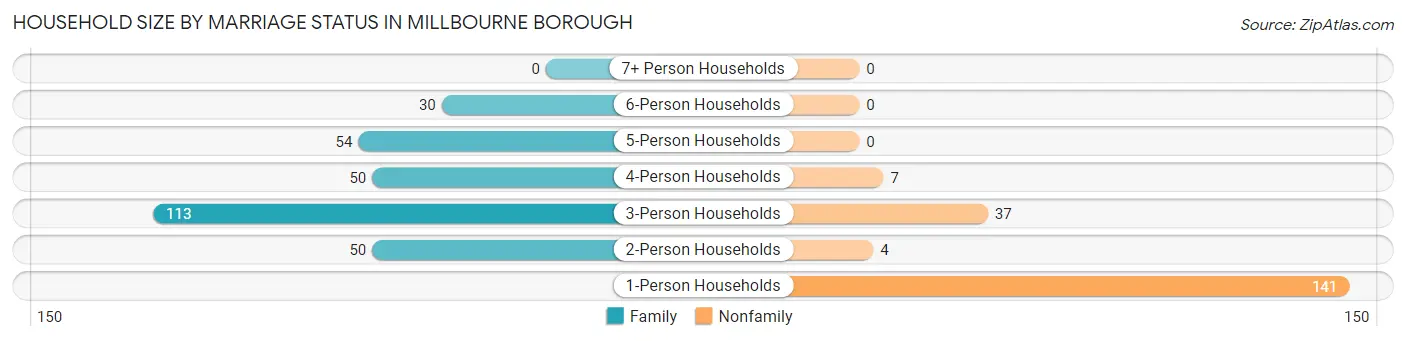
Out of a total of 486 households in Millbourne borough, 297 (61.1%) are family households, while 189 (38.9%) are nonfamily households. The most numerous type of family households are 3-person households, comprising 113, and the most common type of nonfamily households are 1-person households, comprising 141.
| Household Size | Family Households | Nonfamily Households |
| 1-Person Households | - | 141 (29.0%) |
| 2-Person Households | 50 (10.3%) | 4 (0.8%) |
| 3-Person Households | 113 (23.3%) | 37 (7.6%) |
| 4-Person Households | 50 (10.3%) | 7 (1.4%) |
| 5-Person Households | 54 (11.1%) | 0 (0.0%) |
| 6-Person Households | 30 (6.2%) | 0 (0.0%) |
| 7+ Person Households | 0 (0.0%) | 0 (0.0%) |
| Total | 297 (61.1%) | 189 (38.9%) |
Female Fertility in Millbourne borough
Fertility by Age in Millbourne borough
Average fertility rate in Millbourne borough is 42.0 births per 1,000 women. Women in the age bracket of 20 to 34 years have the highest fertility rate with 85.0 births per 1,000 women. Women in the age bracket of 20 to 34 years acount for 100.0% of all women with births.
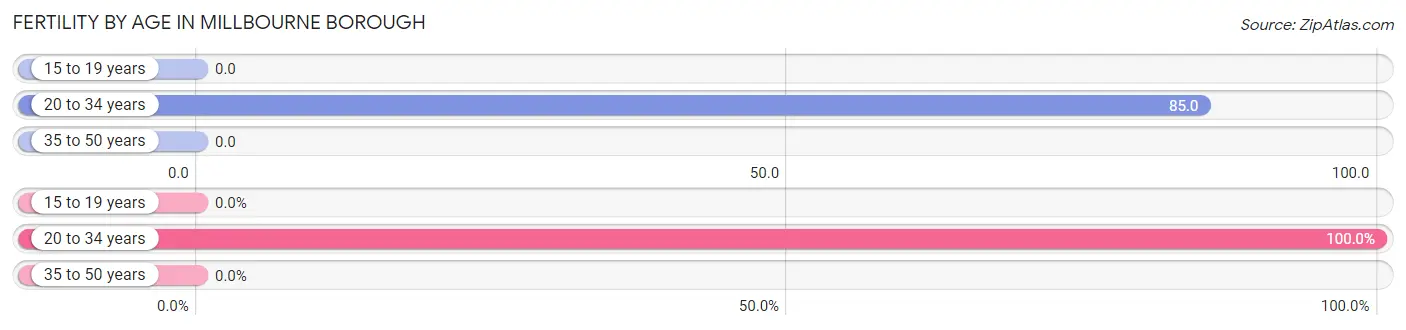
| Age Bracket | Women with Births | Births / 1,000 Women |
| 15 to 19 years | 0 (0.0%) | 0.0 |
| 20 to 34 years | 15 (100.0%) | 85.0 |
| 35 to 50 years | 0 (0.0%) | 0.0 |
| Total | 15 (100.0%) | 42.0 |
Fertility by Age by Marriage Status in Millbourne borough
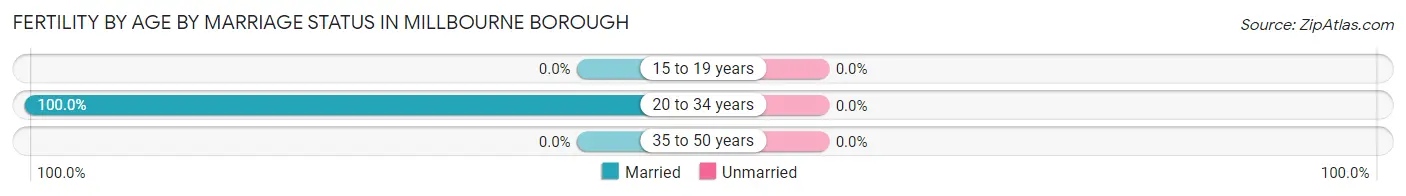
| Age Bracket | Married | Unmarried |
| 15 to 19 years | 0 (0.0%) | 0 (0.0%) |
| 20 to 34 years | 15 (100.0%) | 0 (0.0%) |
| 35 to 50 years | 0 (0.0%) | 0 (0.0%) |
| Total | 15 (100.0%) | 0 (0.0%) |
Fertility by Education in Millbourne borough
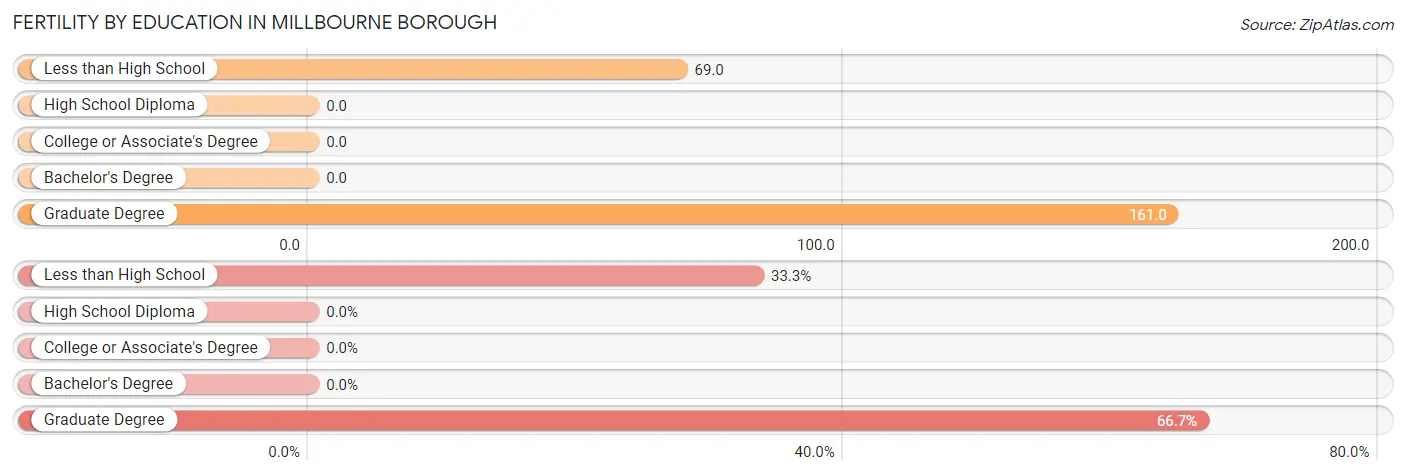
| Educational Attainment | Women with Births | Births / 1,000 Women |
| Less than High School | 5 (33.3%) | 69.0 |
| High School Diploma | 0 (0.0%) | 0.0 |
| College or Associate's Degree | 0 (0.0%) | 0.0 |
| Bachelor's Degree | 0 (0.0%) | 0.0 |
| Graduate Degree | 10 (66.7%) | 161.0 |
| Total | 15 (100.0%) | 42.0 |
Fertility by Education by Marriage Status in Millbourne borough
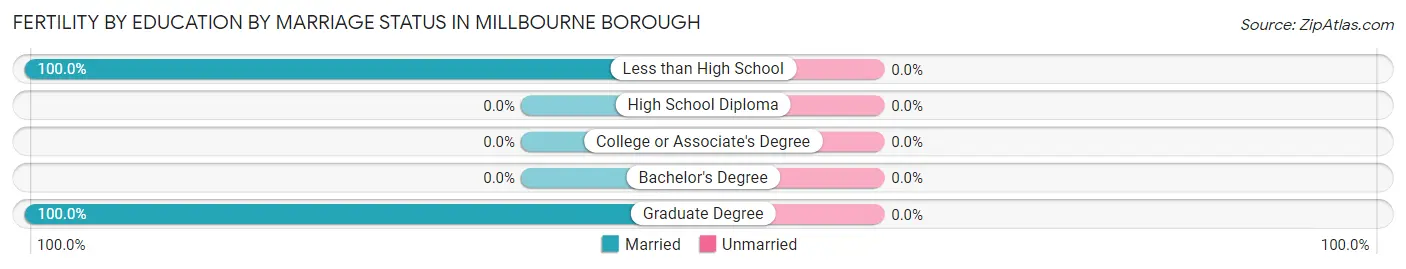
| Educational Attainment | Married | Unmarried |
| Less than High School | 5 (100.0%) | 0 (0.0%) |
| High School Diploma | 0 (0.0%) | 0 (0.0%) |
| College or Associate's Degree | 0 (0.0%) | 0 (0.0%) |
| Bachelor's Degree | 0 (0.0%) | 0 (0.0%) |
| Graduate Degree | 10 (100.0%) | 0 (0.0%) |
| Total | 15 (100.0%) | 0 (0.0%) |
Employment Characteristics in Millbourne borough
Employment by Class of Employer in Millbourne borough
Among the 721 employed individuals in Millbourne borough, private company employees (501 | 69.5%), state government employees (56 | 7.8%), and self-employed (not incorporated) (45 | 6.2%) make up the most common classes of employment.
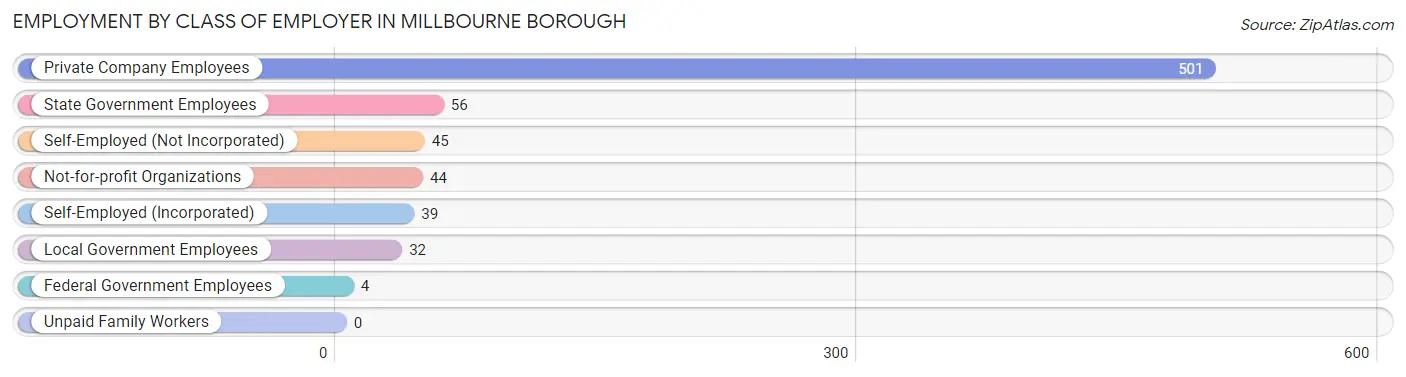
| Employer Class | # Employees | % Employees |
| Private Company Employees | 501 | 69.5% |
| Self-Employed (Incorporated) | 39 | 5.4% |
| Self-Employed (Not Incorporated) | 45 | 6.2% |
| Not-for-profit Organizations | 44 | 6.1% |
| Local Government Employees | 32 | 4.4% |
| State Government Employees | 56 | 7.8% |
| Federal Government Employees | 4 | 0.5% |
| Unpaid Family Workers | 0 | 0.0% |
| Total | 721 | 100.0% |
Employment Status by Age in Millbourne borough
According to the labor force statistics for Millbourne borough, out of the total population over 16 years of age (1,175), 64.0% or 752 individuals are in the labor force, with 3.5% or 26 of them unemployed. The age group with the highest labor force participation rate is 35 to 44 years, with 91.8% or 146 individuals in the labor force. Within the labor force, the 30 to 34 years age range has the highest percentage of unemployed individuals, with 8.9% or 16 of them being unemployed.
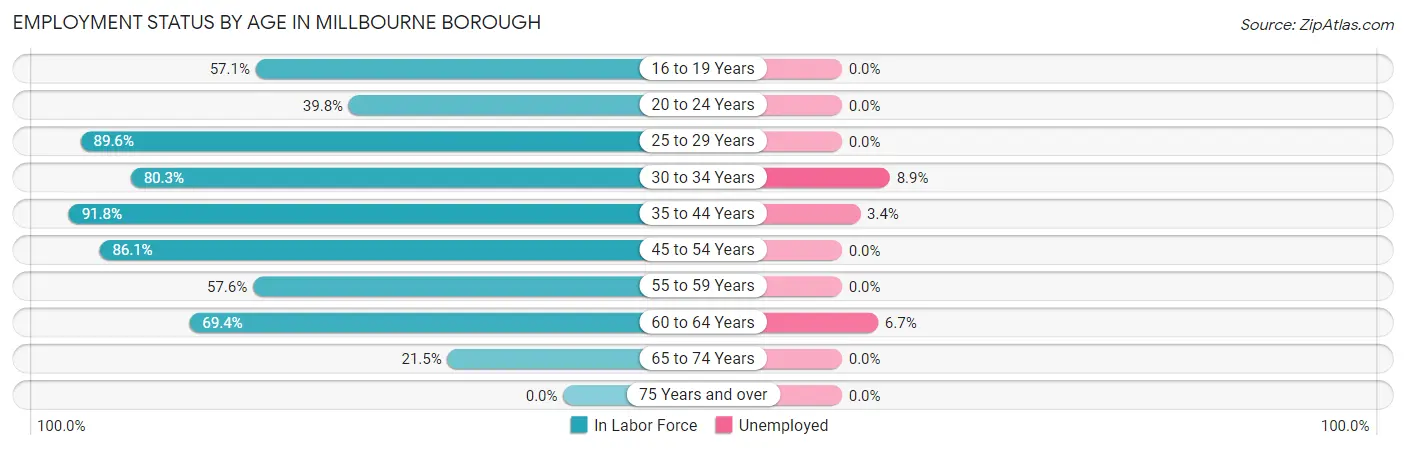
| Age Bracket | In Labor Force | Unemployed |
| 16 to 19 Years | 44 (57.1%) | 0 (0.0%) |
| 20 to 24 Years | 41 (39.8%) | 0 (0.0%) |
| 25 to 29 Years | 69 (89.6%) | 0 (0.0%) |
| 30 to 34 Years | 179 (80.3%) | 16 (8.9%) |
| 35 to 44 Years | 146 (91.8%) | 5 (3.4%) |
| 45 to 54 Years | 105 (86.1%) | 0 (0.0%) |
| 55 to 59 Years | 76 (57.6%) | 0 (0.0%) |
| 60 to 64 Years | 75 (69.4%) | 5 (6.7%) |
| 65 to 74 Years | 17 (21.5%) | 0 (0.0%) |
| 75 Years and over | 0 (0.0%) | 0 (0.0%) |
| Total | 752 (64.0%) | 26 (3.5%) |
Employment Status by Educational Attainment in Millbourne borough
According to labor force statistics for Millbourne borough, 79.2% of individuals (650) out of the total population between 25 and 64 years of age (821) are in the labor force, with 4.0% or 26 of them being unemployed. The group with the highest labor force participation rate are those with the educational attainment of college / associate degree, with 92.1% or 186 individuals in the labor force. Within the labor force, individuals with high school diploma education have the highest percentage of unemployment, with 11.5% or 21 of them being unemployed.
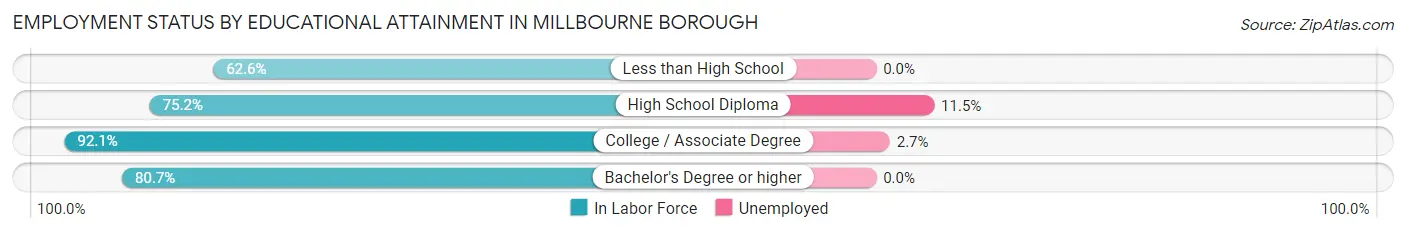
| Educational Attainment | In Labor Force | Unemployed |
| Less than High School | 77 (62.6%) | 0 (0.0%) |
| High School Diploma | 182 (75.2%) | 28 (11.5%) |
| College / Associate Degree | 186 (92.1%) | 5 (2.7%) |
| Bachelor's Degree or higher | 205 (80.7%) | 0 (0.0%) |
| Total | 650 (79.2%) | 33 (4.0%) |
Employment Occupations by Sex in Millbourne borough
Management, Business, Science and Arts Occupations
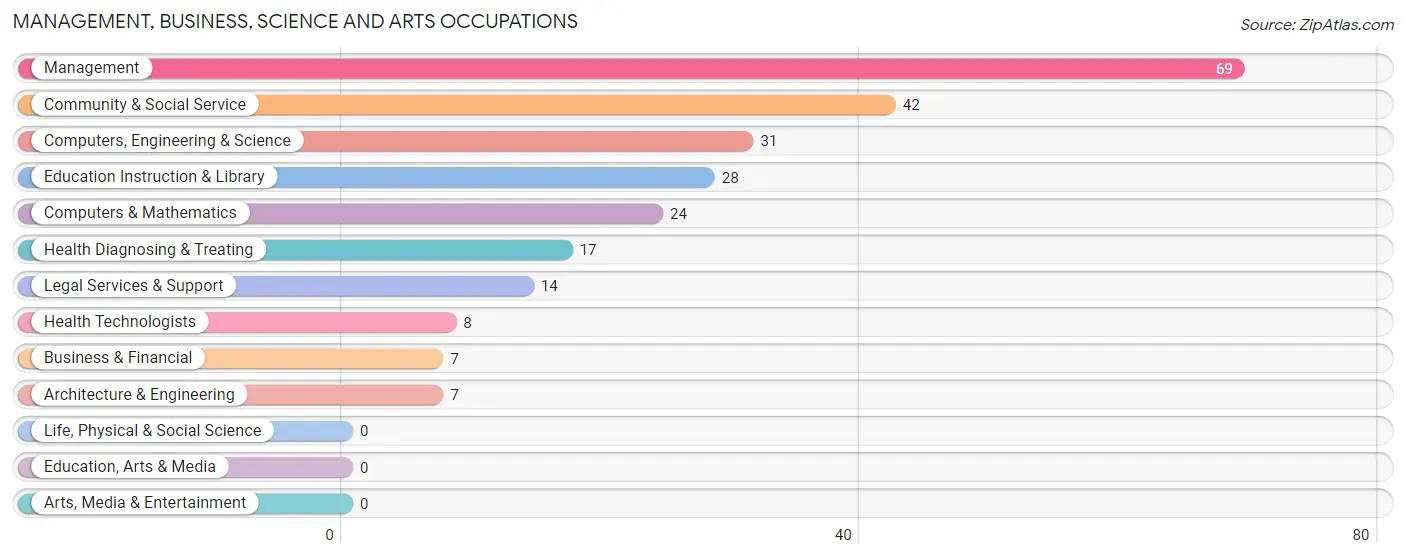
The most common Management, Business, Science and Arts occupations in Millbourne borough are Management (69 | 9.5%), Community & Social Service (42 | 5.8%), Computers, Engineering & Science (31 | 4.3%), Education Instruction & Library (28 | 3.9%), and Computers & Mathematics (24 | 3.3%).
Management, Business, Science and Arts Occupations by Sex
Within the Management, Business, Science and Arts occupations in Millbourne borough, the most male-oriented occupations are Management (100.0%), Architecture & Engineering (100.0%), and Legal Services & Support (100.0%), while the most female-oriented occupations are Business & Financial (100.0%), Health Diagnosing & Treating (100.0%), and Health Technologists (100.0%).
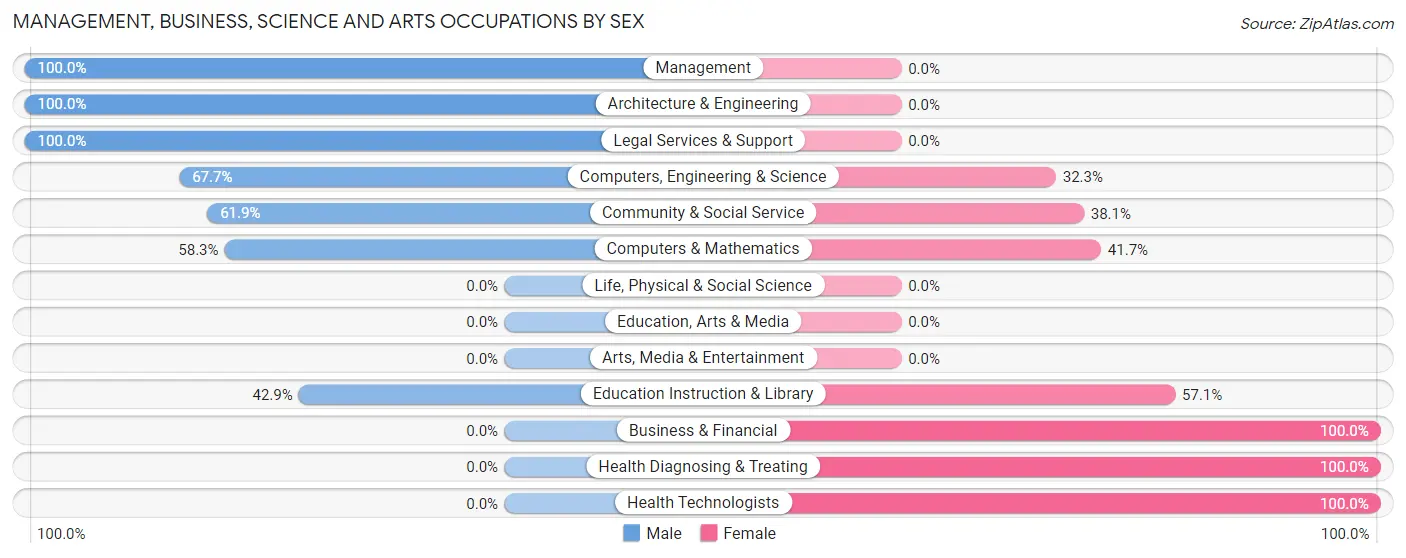
| Occupation | Male | Female |
| Management | 69 (100.0%) | 0 (0.0%) |
| Business & Financial | 0 (0.0%) | 7 (100.0%) |
| Computers, Engineering & Science | 21 (67.7%) | 10 (32.3%) |
| Computers & Mathematics | 14 (58.3%) | 10 (41.7%) |
| Architecture & Engineering | 7 (100.0%) | 0 (0.0%) |
| Life, Physical & Social Science | 0 (0.0%) | 0 (0.0%) |
| Community & Social Service | 26 (61.9%) | 16 (38.1%) |
| Education, Arts & Media | 0 (0.0%) | 0 (0.0%) |
| Legal Services & Support | 14 (100.0%) | 0 (0.0%) |
| Education Instruction & Library | 12 (42.9%) | 16 (57.1%) |
| Arts, Media & Entertainment | 0 (0.0%) | 0 (0.0%) |
| Health Diagnosing & Treating | 0 (0.0%) | 17 (100.0%) |
| Health Technologists | 0 (0.0%) | 8 (100.0%) |
| Total (Category) | 116 (69.9%) | 50 (30.1%) |
| Total (Overall) | 430 (59.2%) | 296 (40.8%) |
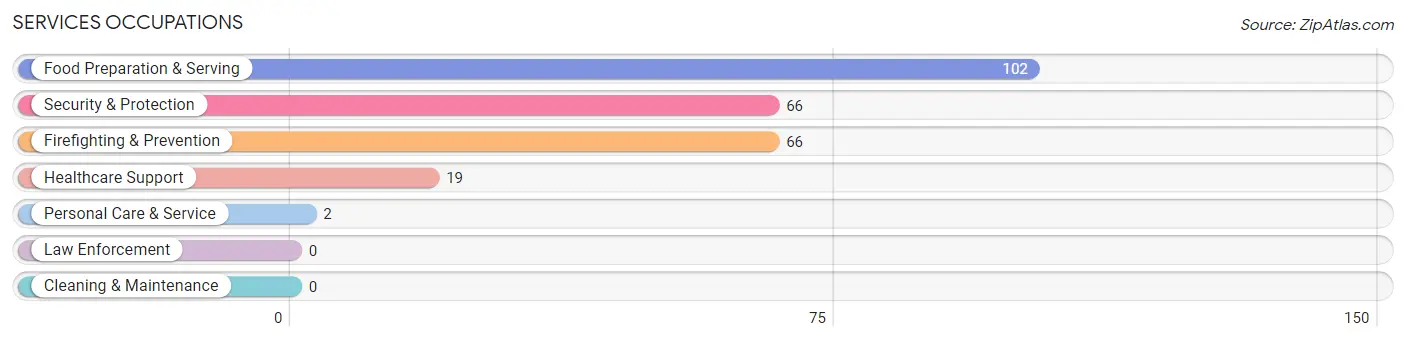
Services Occupations
The most common Services occupations in Millbourne borough are Food Preparation & Serving (102 | 14.1%), Security & Protection (66 | 9.1%), Firefighting & Prevention (66 | 9.1%), Healthcare Support (19 | 2.6%), and Personal Care & Service (2 | 0.3%).
Services Occupations by Sex
Within the Services occupations in Millbourne borough, the most male-oriented occupations are Security & Protection (100.0%), Firefighting & Prevention (100.0%), and Personal Care & Service (100.0%), while the most female-oriented occupations are Healthcare Support (100.0%), and Food Preparation & Serving (30.4%).
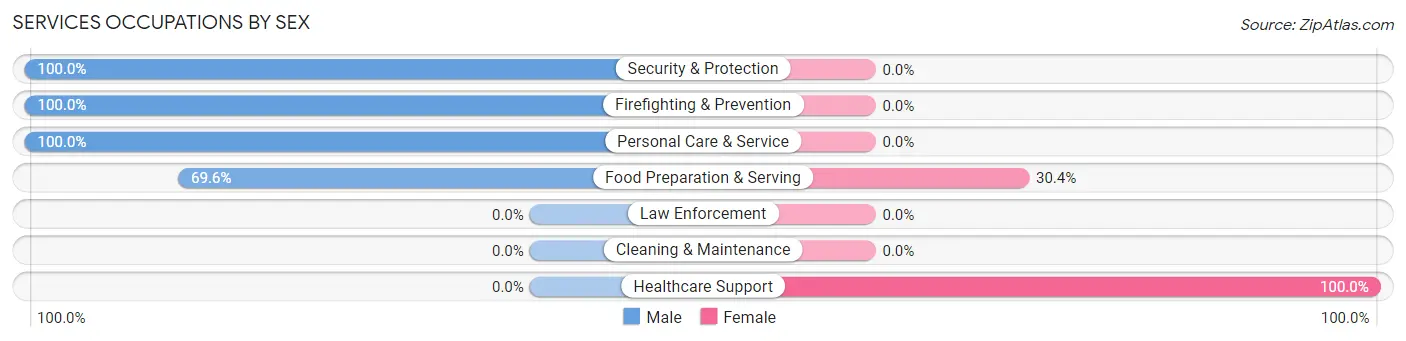
| Occupation | Male | Female |
| Healthcare Support | 0 (0.0%) | 19 (100.0%) |
| Security & Protection | 66 (100.0%) | 0 (0.0%) |
| Firefighting & Prevention | 66 (100.0%) | 0 (0.0%) |
| Law Enforcement | 0 (0.0%) | 0 (0.0%) |
| Food Preparation & Serving | 71 (69.6%) | 31 (30.4%) |
| Cleaning & Maintenance | 0 (0.0%) | 0 (0.0%) |
| Personal Care & Service | 2 (100.0%) | 0 (0.0%) |
| Total (Category) | 139 (73.5%) | 50 (26.5%) |
| Total (Overall) | 430 (59.2%) | 296 (40.8%) |
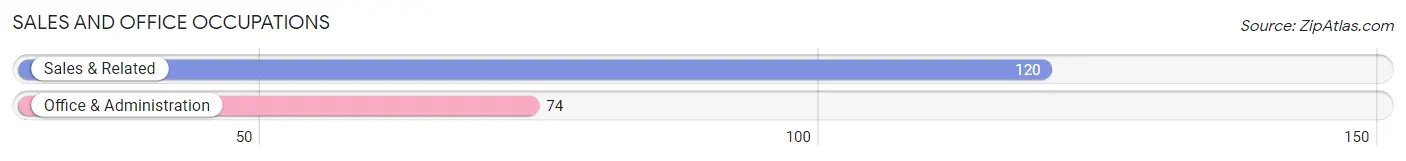
Sales and Office Occupations
The most common Sales and Office occupations in Millbourne borough are Sales & Related (120 | 16.5%), and Office & Administration (74 | 10.2%).
Sales and Office Occupations by Sex
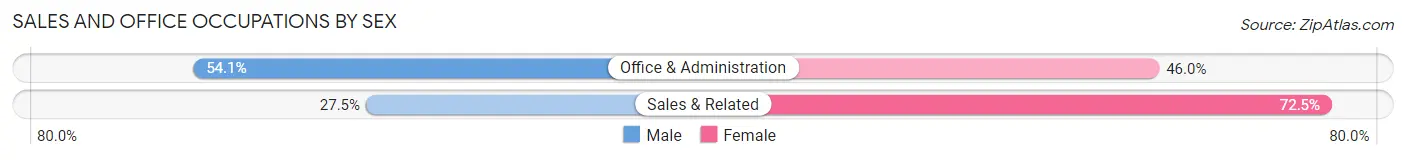
| Occupation | Male | Female |
| Sales & Related | 33 (27.5%) | 87 (72.5%) |
| Office & Administration | 40 (54.0%) | 34 (46.0%) |
| Total (Category) | 73 (37.6%) | 121 (62.4%) |
| Total (Overall) | 430 (59.2%) | 296 (40.8%) |
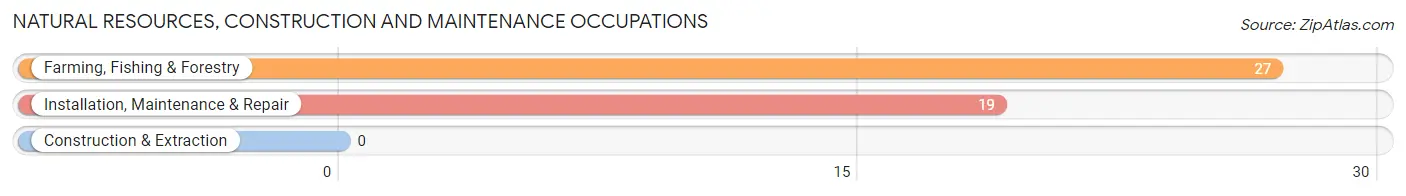
Natural Resources, Construction and Maintenance Occupations
The most common Natural Resources, Construction and Maintenance occupations in Millbourne borough are Farming, Fishing & Forestry (27 | 3.7%), and Installation, Maintenance & Repair (19 | 2.6%).
Natural Resources, Construction and Maintenance Occupations by Sex
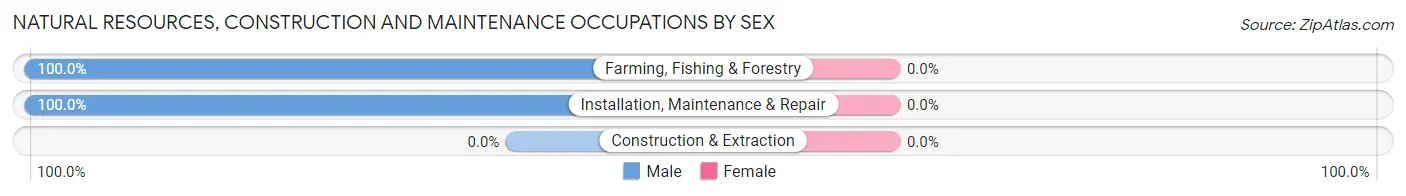
| Occupation | Male | Female |
| Farming, Fishing & Forestry | 27 (100.0%) | 0 (0.0%) |
| Construction & Extraction | 0 (0.0%) | 0 (0.0%) |
| Installation, Maintenance & Repair | 19 (100.0%) | 0 (0.0%) |
| Total (Category) | 46 (100.0%) | 0 (0.0%) |
| Total (Overall) | 430 (59.2%) | 296 (40.8%) |
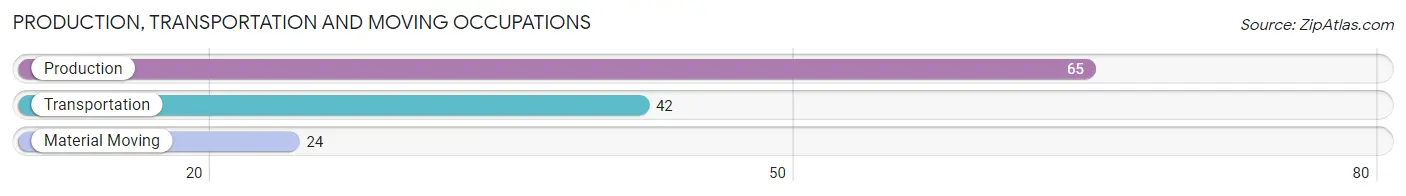
Production, Transportation and Moving Occupations
The most common Production, Transportation and Moving occupations in Millbourne borough are Production (65 | 8.9%), Transportation (42 | 5.8%), and Material Moving (24 | 3.3%).
Production, Transportation and Moving Occupations by Sex
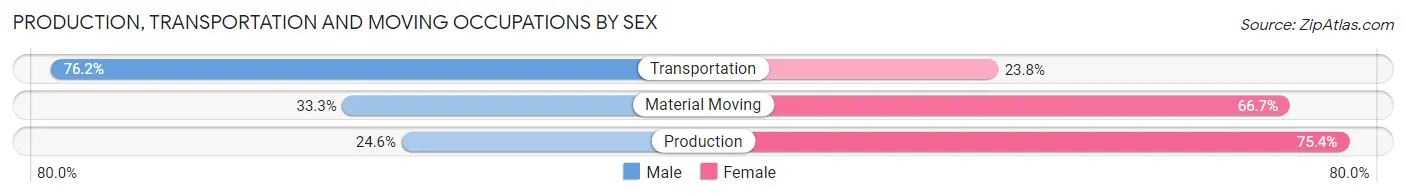
| Occupation | Male | Female |
| Production | 16 (24.6%) | 49 (75.4%) |
| Transportation | 32 (76.2%) | 10 (23.8%) |
| Material Moving | 8 (33.3%) | 16 (66.7%) |
| Total (Category) | 56 (42.7%) | 75 (57.3%) |
| Total (Overall) | 430 (59.2%) | 296 (40.8%) |
Employment Industries by Sex in Millbourne borough
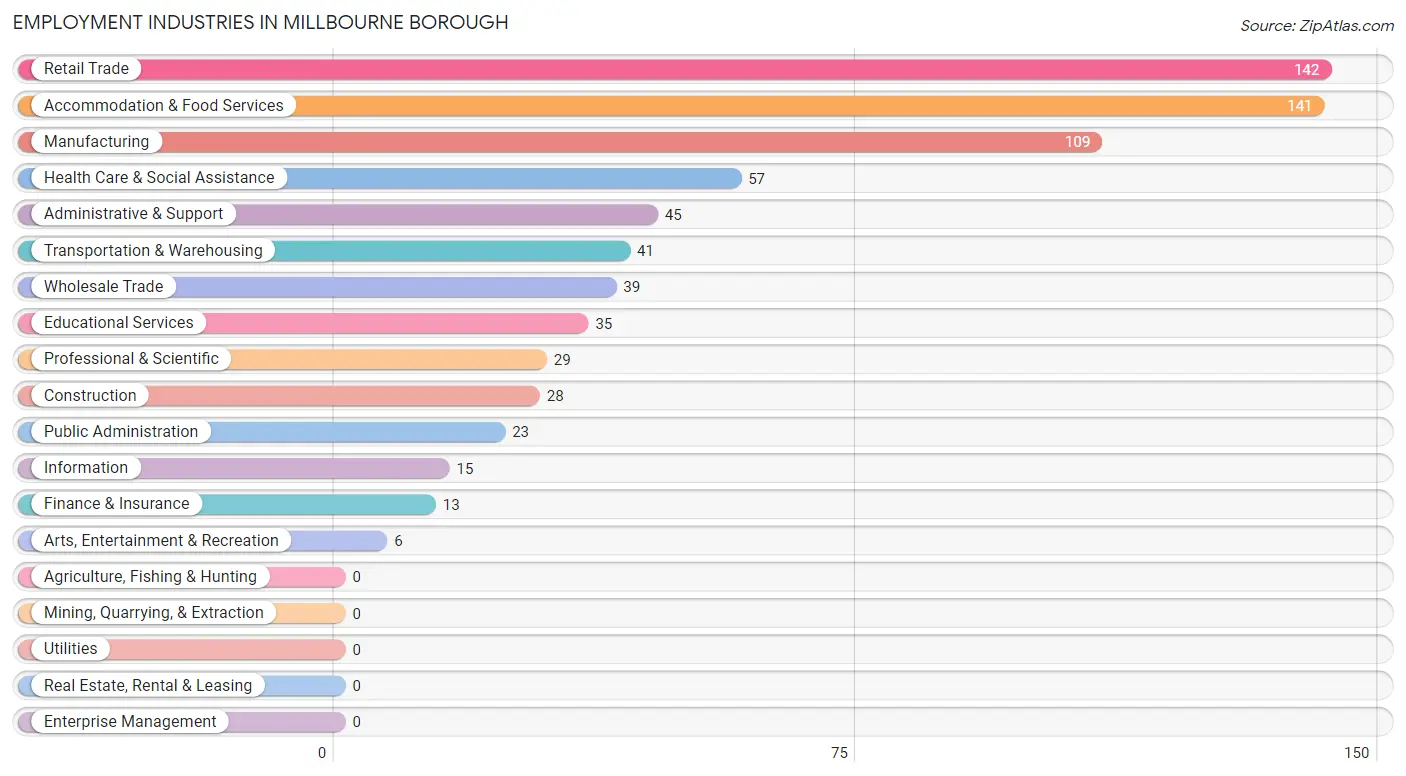
Employment Industries in Millbourne borough
The major employment industries in Millbourne borough include Retail Trade (142 | 19.6%), Accommodation & Food Services (141 | 19.4%), Manufacturing (109 | 15.0%), Health Care & Social Assistance (57 | 7.9%), and Administrative & Support (45 | 6.2%).
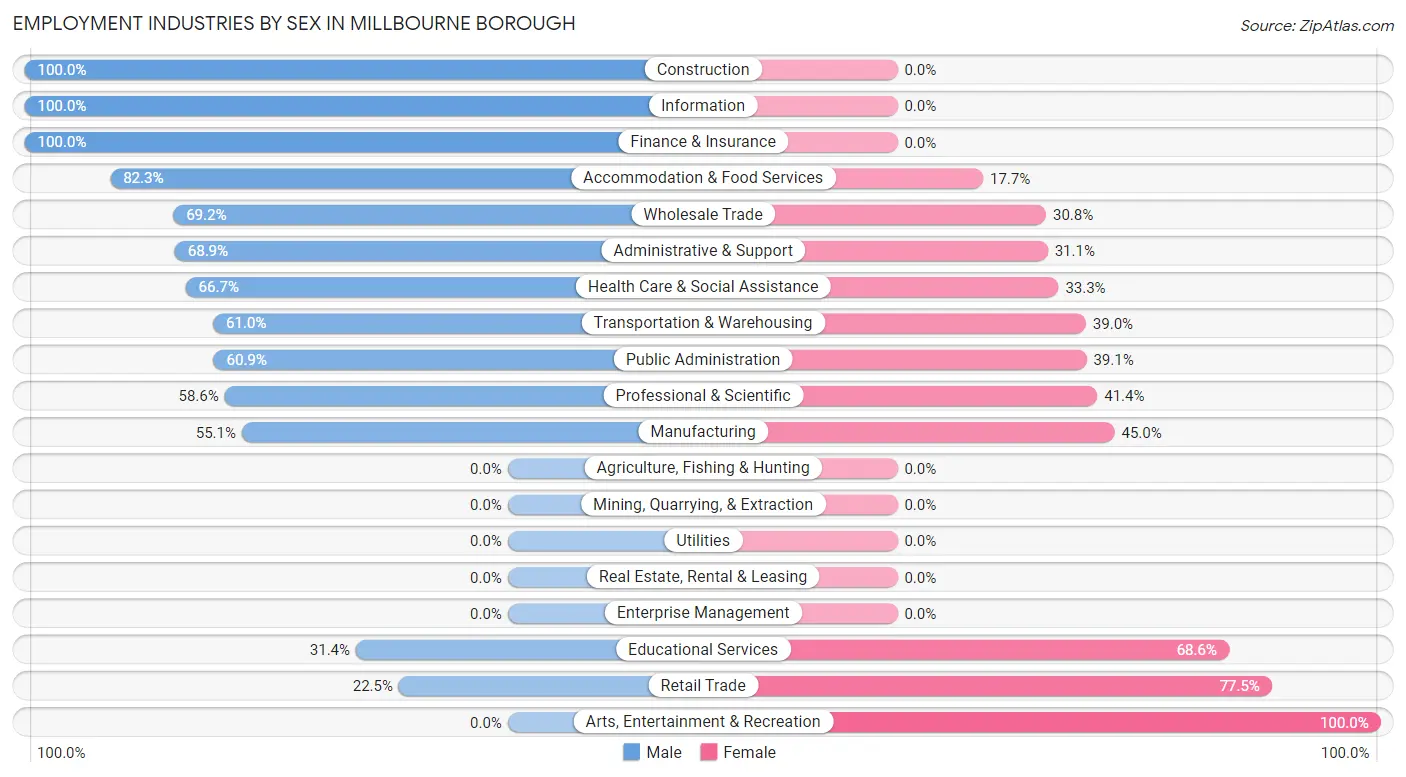
Employment Industries by Sex in Millbourne borough
The Millbourne borough industries that see more men than women are Construction (100.0%), Information (100.0%), and Finance & Insurance (100.0%), whereas the industries that tend to have a higher number of women are Arts, Entertainment & Recreation (100.0%), Retail Trade (77.5%), and Educational Services (68.6%).
| Industry | Male | Female |
| Agriculture, Fishing & Hunting | 0 (0.0%) | 0 (0.0%) |
| Mining, Quarrying, & Extraction | 0 (0.0%) | 0 (0.0%) |
| Construction | 28 (100.0%) | 0 (0.0%) |
| Manufacturing | 60 (55.0%) | 49 (45.0%) |
| Wholesale Trade | 27 (69.2%) | 12 (30.8%) |
| Retail Trade | 32 (22.5%) | 110 (77.5%) |
| Transportation & Warehousing | 25 (61.0%) | 16 (39.0%) |
| Utilities | 0 (0.0%) | 0 (0.0%) |
| Information | 15 (100.0%) | 0 (0.0%) |
| Finance & Insurance | 13 (100.0%) | 0 (0.0%) |
| Real Estate, Rental & Leasing | 0 (0.0%) | 0 (0.0%) |
| Professional & Scientific | 17 (58.6%) | 12 (41.4%) |
| Enterprise Management | 0 (0.0%) | 0 (0.0%) |
| Administrative & Support | 31 (68.9%) | 14 (31.1%) |
| Educational Services | 11 (31.4%) | 24 (68.6%) |
| Health Care & Social Assistance | 38 (66.7%) | 19 (33.3%) |
| Arts, Entertainment & Recreation | 0 (0.0%) | 6 (100.0%) |
| Accommodation & Food Services | 116 (82.3%) | 25 (17.7%) |
| Public Administration | 14 (60.9%) | 9 (39.1%) |
| Total | 430 (59.2%) | 296 (40.8%) |
Education in Millbourne borough
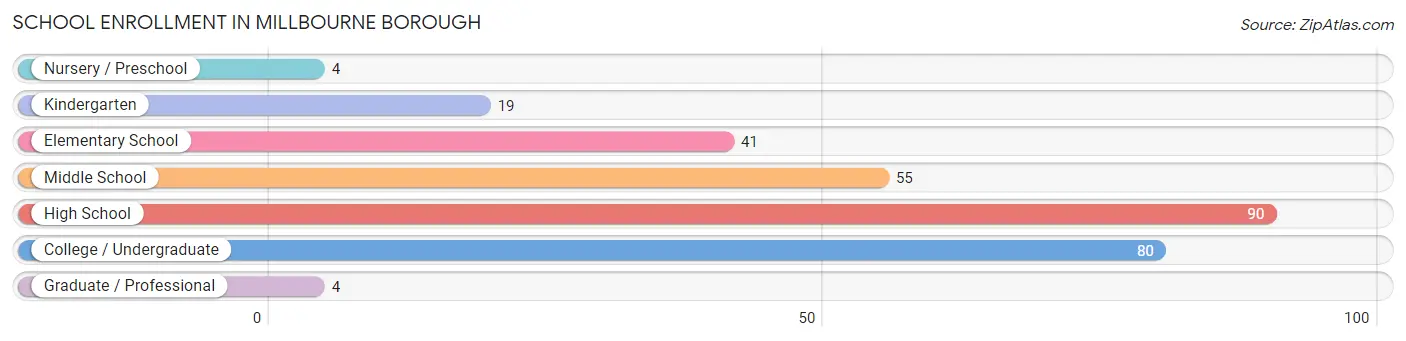
School Enrollment in Millbourne borough
The most common levels of schooling among the 293 students in Millbourne borough are high school (90 | 30.7%), college / undergraduate (80 | 27.3%), and middle school (55 | 18.8%).
| School Level | # Students | % Students |
| Nursery / Preschool | 4 | 1.4% |
| Kindergarten | 19 | 6.5% |
| Elementary School | 41 | 14.0% |
| Middle School | 55 | 18.8% |
| High School | 90 | 30.7% |
| College / Undergraduate | 80 | 27.3% |
| Graduate / Professional | 4 | 1.4% |
| Total | 293 | 100.0% |
School Enrollment by Age by Funding Source in Millbourne borough
Out of a total of 293 students who are enrolled in schools in Millbourne borough, 24 (8.2%) attend a private institution, while the remaining 269 (91.8%) are enrolled in public schools. The age group of 25 to 34 year olds has the highest likelihood of being enrolled in private schools, with 4 (100.0% in the age bracket) enrolled. Conversely, the age group of 5 to 9 year old has the lowest likelihood of being enrolled in a private school, with 45 (100.0% in the age bracket) attending a public institution.
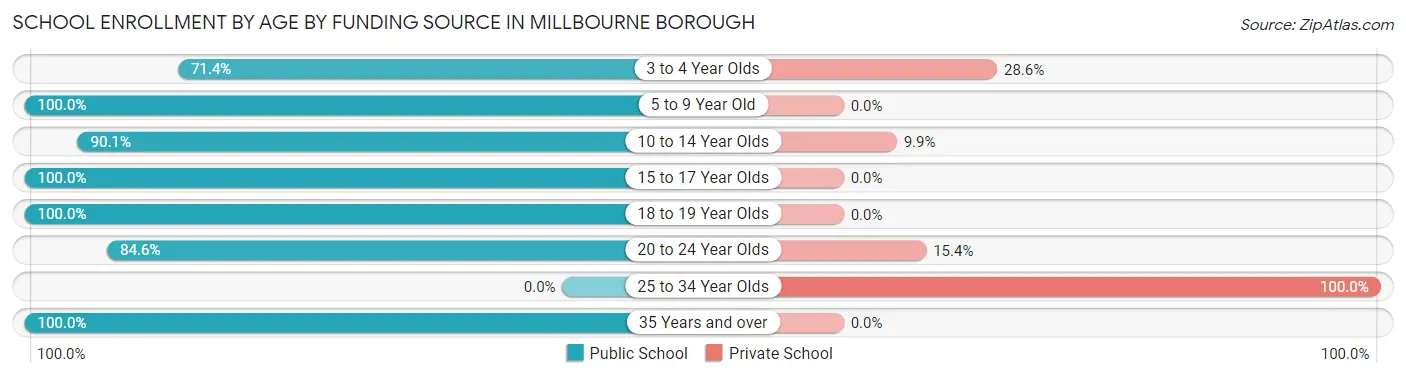
| Age Bracket | Public School | Private School |
| 3 to 4 Year Olds | 10 (71.4%) | 4 (28.6%) |
| 5 to 9 Year Old | 45 (100.0%) | 0 (0.0%) |
| 10 to 14 Year Olds | 73 (90.1%) | 8 (9.9%) |
| 15 to 17 Year Olds | 63 (100.0%) | 0 (0.0%) |
| 18 to 19 Year Olds | 26 (100.0%) | 0 (0.0%) |
| 20 to 24 Year Olds | 44 (84.6%) | 8 (15.4%) |
| 25 to 34 Year Olds | 0 (0.0%) | 4 (100.0%) |
| 35 Years and over | 8 (100.0%) | 0 (0.0%) |
| Total | 269 (91.8%) | 24 (8.2%) |
Educational Attainment by Field of Study in Millbourne borough
Business (82 | 27.4%), engineering (46 | 15.4%), science & technology (43 | 14.4%), education (37 | 12.4%), and physical & health sciences (21 | 7.0%) are the most common fields of study among 299 individuals in Millbourne borough who have obtained a bachelor's degree or higher.
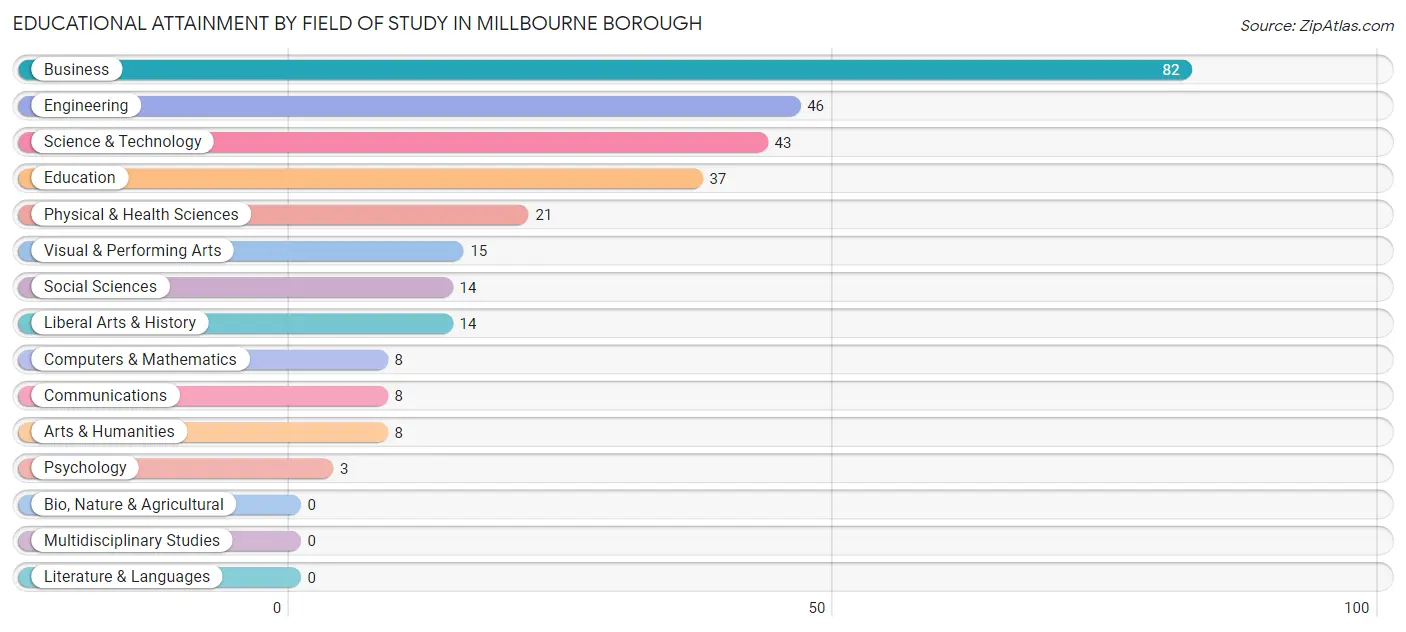
| Field of Study | # Graduates | % Graduates |
| Computers & Mathematics | 8 | 2.7% |
| Bio, Nature & Agricultural | 0 | 0.0% |
| Physical & Health Sciences | 21 | 7.0% |
| Psychology | 3 | 1.0% |
| Social Sciences | 14 | 4.7% |
| Engineering | 46 | 15.4% |
| Multidisciplinary Studies | 0 | 0.0% |
| Science & Technology | 43 | 14.4% |
| Business | 82 | 27.4% |
| Education | 37 | 12.4% |
| Literature & Languages | 0 | 0.0% |
| Liberal Arts & History | 14 | 4.7% |
| Visual & Performing Arts | 15 | 5.0% |
| Communications | 8 | 2.7% |
| Arts & Humanities | 8 | 2.7% |
| Total | 299 | 100.0% |
Transportation & Commute in Millbourne borough
Vehicle Availability by Sex in Millbourne borough
The most prevalent vehicle ownership categories in Millbourne borough are males with 1 vehicle (149, accounting for 34.6%) and females with 1 vehicle (173, making up 51.2%).
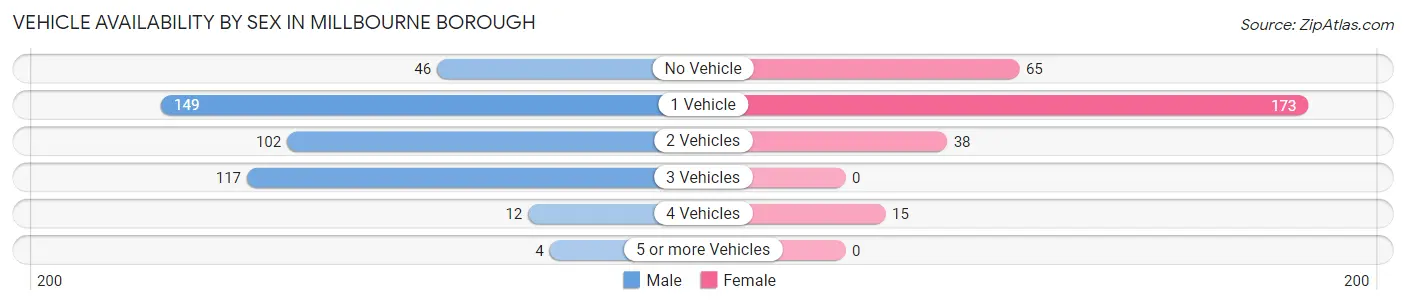
| Vehicles Available | Male | Female |
| No Vehicle | 46 (10.7%) | 65 (22.3%) |
| 1 Vehicle | 149 (34.6%) | 173 (59.5%) |
| 2 Vehicles | 102 (23.7%) | 38 (13.1%) |
| 3 Vehicles | 117 (27.2%) | 0 (0.0%) |
| 4 Vehicles | 12 (2.8%) | 15 (5.1%) |
| 5 or more Vehicles | 4 (0.9%) | 0 (0.0%) |
| Total | 430 (100.0%) | 291 (100.0%) |
Commute Time in Millbourne borough
The most frequently occuring commute durations in Millbourne borough are 45 to 59 minutes (200 commuters, 28.1%), 30 to 34 minutes (112 commuters, 15.8%), and 60 to 89 minutes (83 commuters, 11.7%).
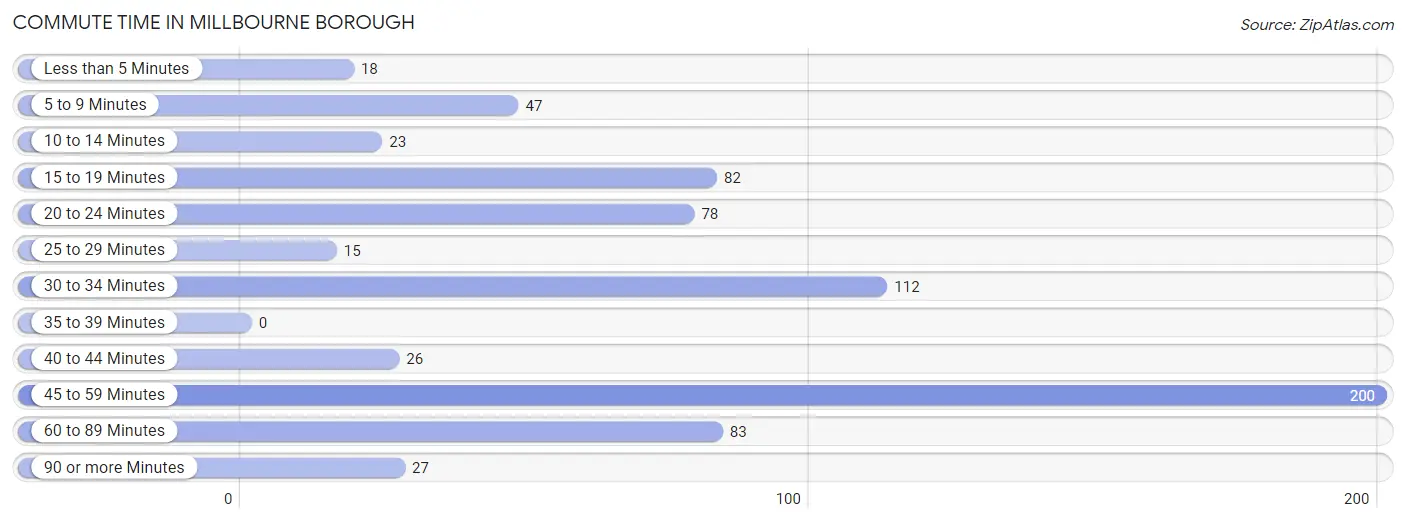
| Commute Time | # Commuters | % Commuters |
| Less than 5 Minutes | 18 | 2.5% |
| 5 to 9 Minutes | 47 | 6.6% |
| 10 to 14 Minutes | 23 | 3.2% |
| 15 to 19 Minutes | 82 | 11.5% |
| 20 to 24 Minutes | 78 | 11.0% |
| 25 to 29 Minutes | 15 | 2.1% |
| 30 to 34 Minutes | 112 | 15.8% |
| 35 to 39 Minutes | 0 | 0.0% |
| 40 to 44 Minutes | 26 | 3.7% |
| 45 to 59 Minutes | 200 | 28.1% |
| 60 to 89 Minutes | 83 | 11.7% |
| 90 or more Minutes | 27 | 3.8% |
Commute Time by Sex in Millbourne borough
The most common commute times in Millbourne borough are 45 to 59 minutes (128 commuters, 30.0%) for males and 45 to 59 minutes (72 commuters, 25.4%) for females.
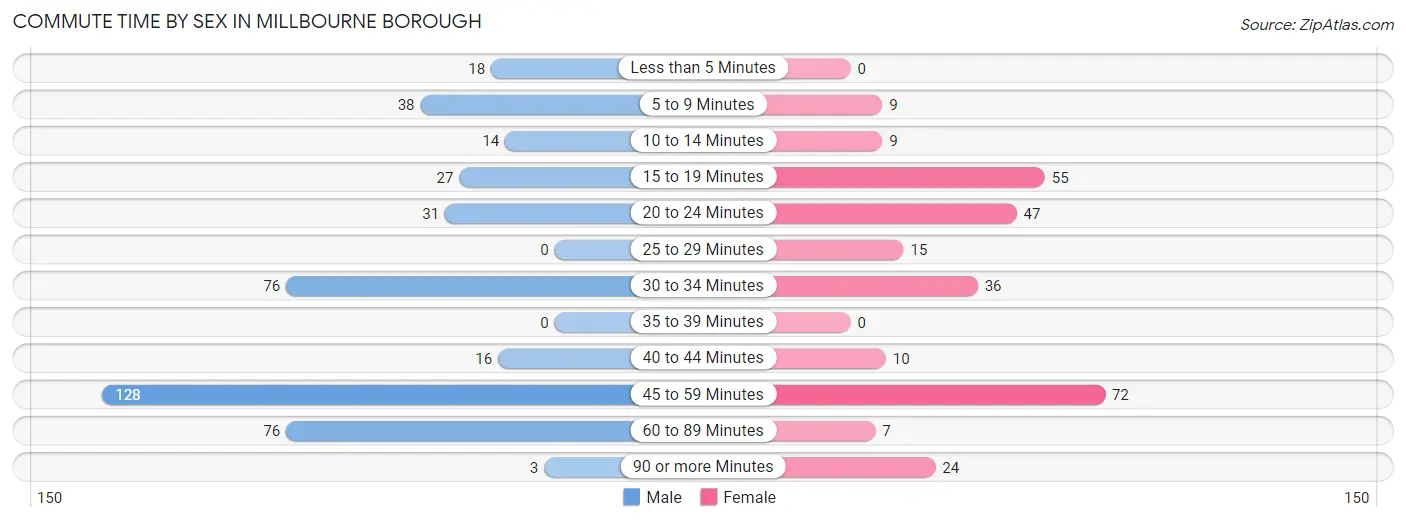
| Commute Time | Male | Female |
| Less than 5 Minutes | 18 (4.2%) | 0 (0.0%) |
| 5 to 9 Minutes | 38 (8.9%) | 9 (3.2%) |
| 10 to 14 Minutes | 14 (3.3%) | 9 (3.2%) |
| 15 to 19 Minutes | 27 (6.3%) | 55 (19.4%) |
| 20 to 24 Minutes | 31 (7.3%) | 47 (16.6%) |
| 25 to 29 Minutes | 0 (0.0%) | 15 (5.3%) |
| 30 to 34 Minutes | 76 (17.8%) | 36 (12.7%) |
| 35 to 39 Minutes | 0 (0.0%) | 0 (0.0%) |
| 40 to 44 Minutes | 16 (3.7%) | 10 (3.5%) |
| 45 to 59 Minutes | 128 (30.0%) | 72 (25.4%) |
| 60 to 89 Minutes | 76 (17.8%) | 7 (2.5%) |
| 90 or more Minutes | 3 (0.7%) | 24 (8.5%) |
Time of Departure to Work by Sex in Millbourne borough
The most frequent times of departure to work in Millbourne borough are 12:00 PM to 3:59 PM (81, 19.0%) for males and 7:00 AM to 7:29 AM (56, 19.7%) for females.
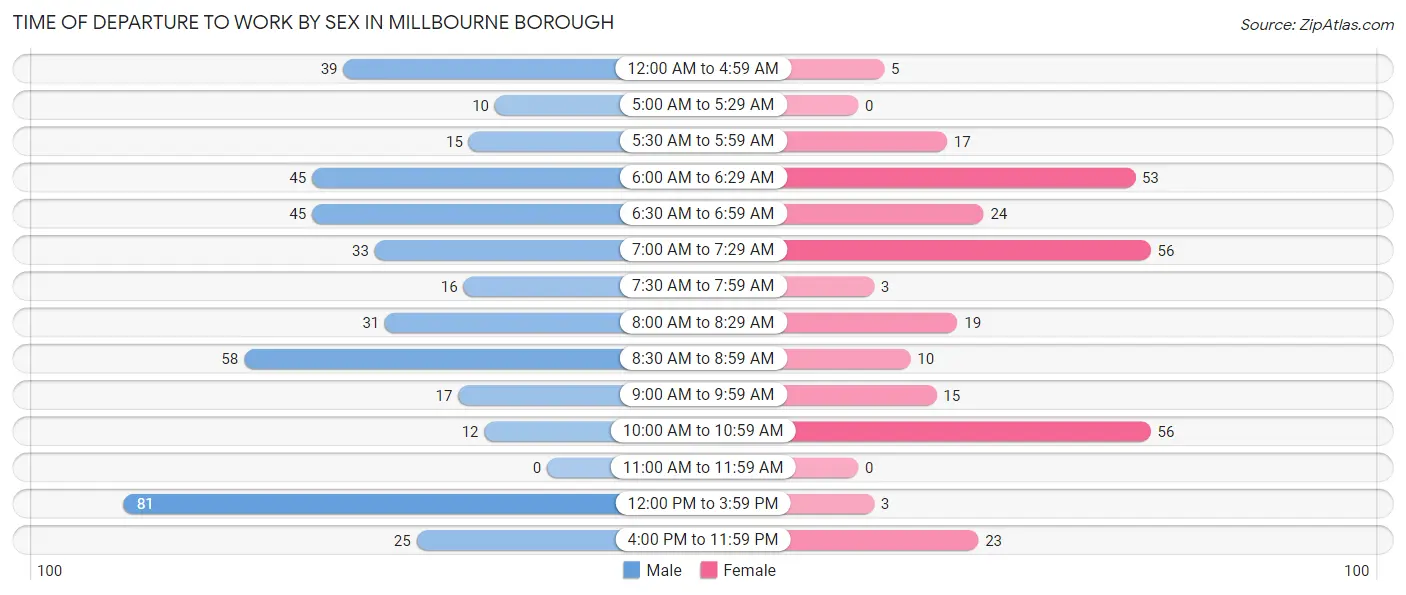
| Time of Departure | Male | Female |
| 12:00 AM to 4:59 AM | 39 (9.1%) | 5 (1.8%) |
| 5:00 AM to 5:29 AM | 10 (2.3%) | 0 (0.0%) |
| 5:30 AM to 5:59 AM | 15 (3.5%) | 17 (6.0%) |
| 6:00 AM to 6:29 AM | 45 (10.5%) | 53 (18.7%) |
| 6:30 AM to 6:59 AM | 45 (10.5%) | 24 (8.5%) |
| 7:00 AM to 7:29 AM | 33 (7.7%) | 56 (19.7%) |
| 7:30 AM to 7:59 AM | 16 (3.7%) | 3 (1.1%) |
| 8:00 AM to 8:29 AM | 31 (7.3%) | 19 (6.7%) |
| 8:30 AM to 8:59 AM | 58 (13.6%) | 10 (3.5%) |
| 9:00 AM to 9:59 AM | 17 (4.0%) | 15 (5.3%) |
| 10:00 AM to 10:59 AM | 12 (2.8%) | 56 (19.7%) |
| 11:00 AM to 11:59 AM | 0 (0.0%) | 0 (0.0%) |
| 12:00 PM to 3:59 PM | 81 (19.0%) | 3 (1.1%) |
| 4:00 PM to 11:59 PM | 25 (5.9%) | 23 (8.1%) |
| Total | 427 (100.0%) | 284 (100.0%) |
Housing Occupancy in Millbourne borough
Occupancy by Ownership in Millbourne borough
Of the total 486 dwellings in Millbourne borough, owner-occupied units account for 156 (32.1%), while renter-occupied units make up 330 (67.9%).
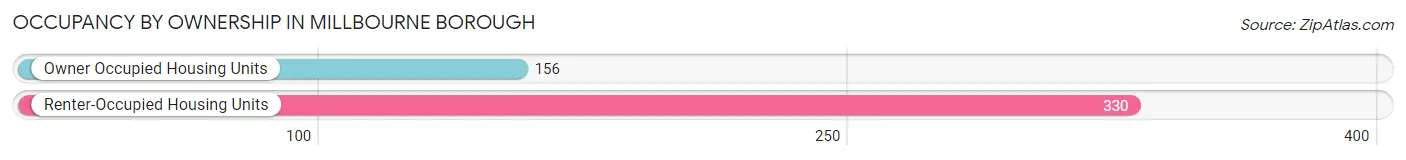
| Occupancy | # Housing Units | % Housing Units |
| Owner Occupied Housing Units | 156 | 32.1% |
| Renter-Occupied Housing Units | 330 | 67.9% |
| Total Occupied Housing Units | 486 | 100.0% |
Occupancy by Household Size in Millbourne borough
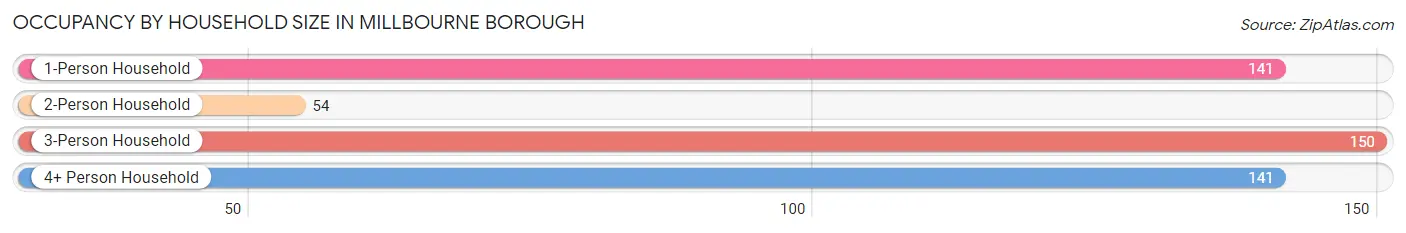
| Household Size | # Housing Units | % Housing Units |
| 1-Person Household | 141 | 29.0% |
| 2-Person Household | 54 | 11.1% |
| 3-Person Household | 150 | 30.9% |
| 4+ Person Household | 141 | 29.0% |
| Total Housing Units | 486 | 100.0% |
Occupancy by Ownership by Household Size in Millbourne borough
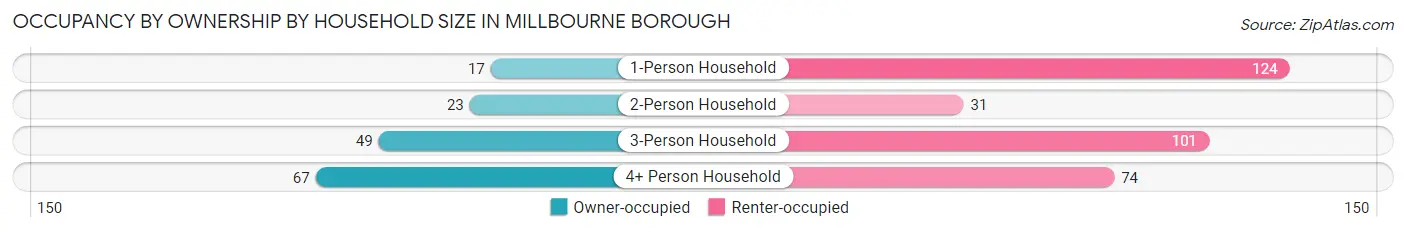
| Household Size | Owner-occupied | Renter-occupied |
| 1-Person Household | 17 (12.1%) | 124 (87.9%) |
| 2-Person Household | 23 (42.6%) | 31 (57.4%) |
| 3-Person Household | 49 (32.7%) | 101 (67.3%) |
| 4+ Person Household | 67 (47.5%) | 74 (52.5%) |
| Total Housing Units | 156 (32.1%) | 330 (67.9%) |
Occupancy by Educational Attainment in Millbourne borough
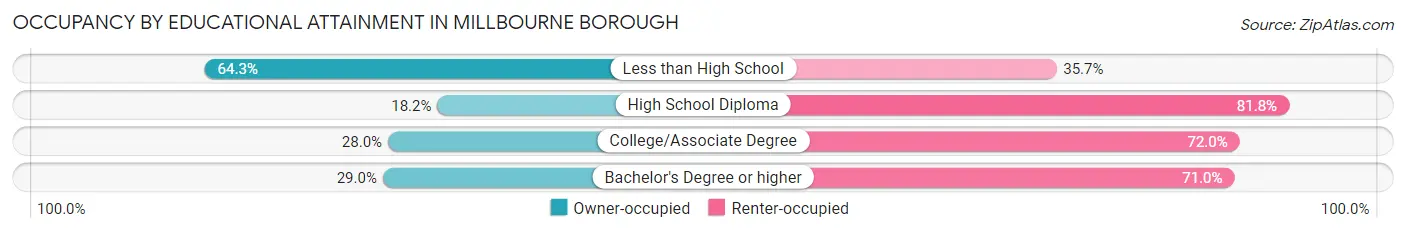
| Household Size | Owner-occupied | Renter-occupied |
| Less than High School | 54 (64.3%) | 30 (35.7%) |
| High School Diploma | 22 (18.2%) | 99 (81.8%) |
| College/Associate Degree | 40 (28.0%) | 103 (72.0%) |
| Bachelor's Degree or higher | 40 (29.0%) | 98 (71.0%) |
Occupancy by Age of Householder in Millbourne borough
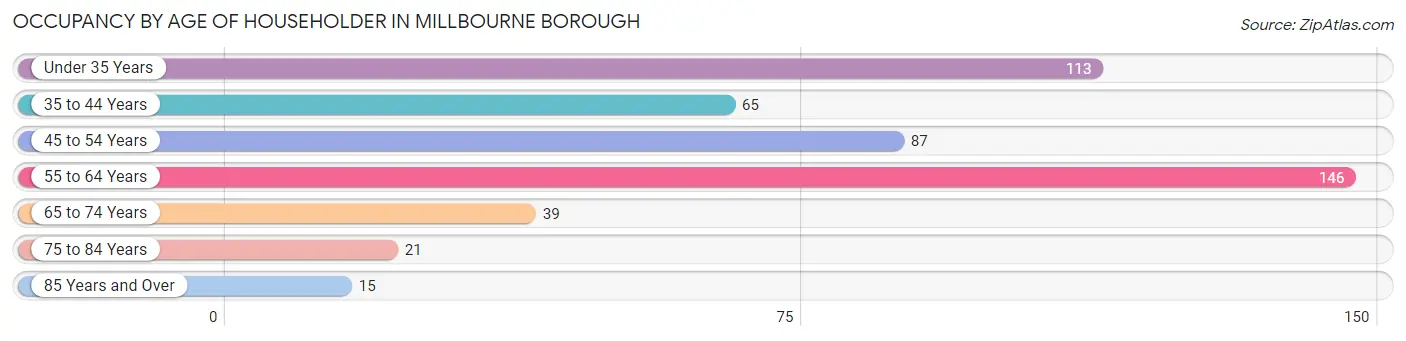
| Age Bracket | # Households | % Households |
| Under 35 Years | 113 | 23.3% |
| 35 to 44 Years | 65 | 13.4% |
| 45 to 54 Years | 87 | 17.9% |
| 55 to 64 Years | 146 | 30.0% |
| 65 to 74 Years | 39 | 8.0% |
| 75 to 84 Years | 21 | 4.3% |
| 85 Years and Over | 15 | 3.1% |
| Total | 486 | 100.0% |
Housing Finances in Millbourne borough
Median Income by Occupancy in Millbourne borough
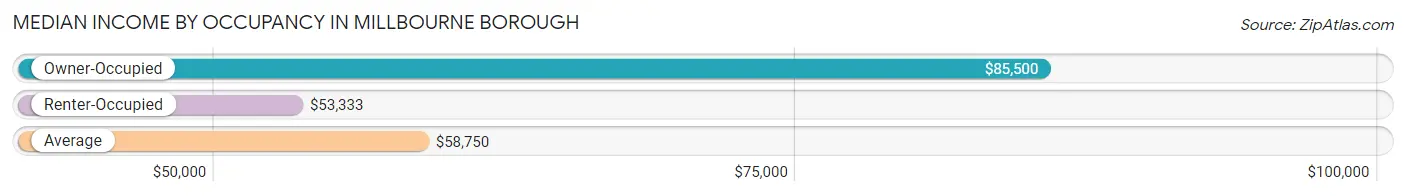
| Occupancy Type | # Households | Median Income |
| Owner-Occupied | 156 (32.1%) | $85,500 |
| Renter-Occupied | 330 (67.9%) | $53,333 |
| Average | 486 (100.0%) | $58,750 |
Occupancy by Householder Income Bracket in Millbourne borough
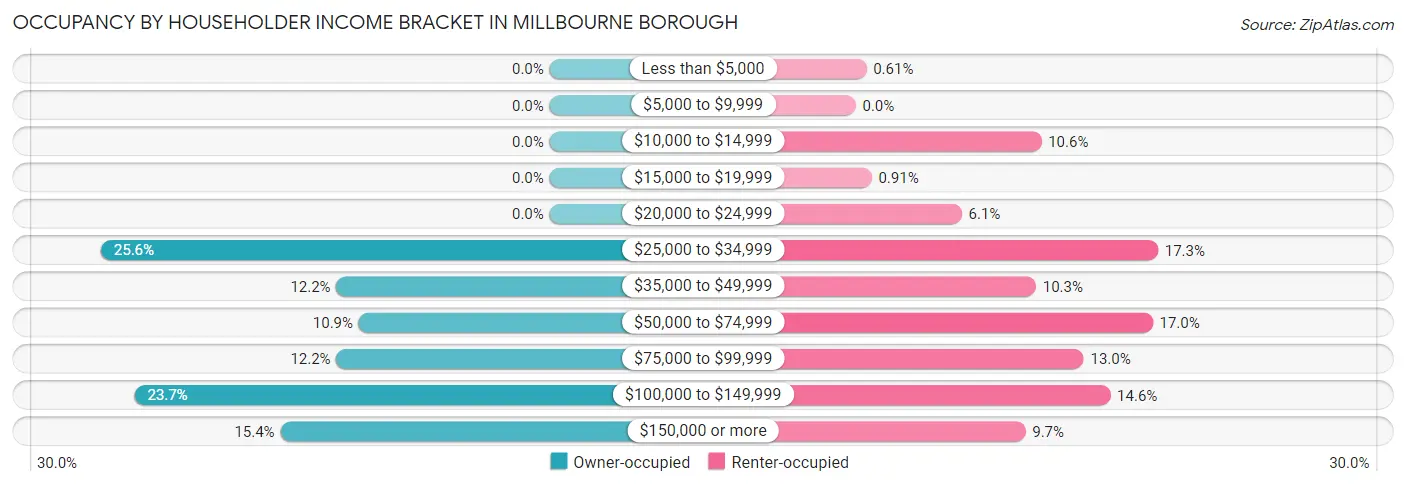
| Income Bracket | Owner-occupied | Renter-occupied |
| Less than $5,000 | 0 (0.0%) | 2 (0.6%) |
| $5,000 to $9,999 | 0 (0.0%) | 0 (0.0%) |
| $10,000 to $14,999 | 0 (0.0%) | 35 (10.6%) |
| $15,000 to $19,999 | 0 (0.0%) | 3 (0.9%) |
| $20,000 to $24,999 | 0 (0.0%) | 20 (6.1%) |
| $25,000 to $34,999 | 40 (25.6%) | 57 (17.3%) |
| $35,000 to $49,999 | 19 (12.2%) | 34 (10.3%) |
| $50,000 to $74,999 | 17 (10.9%) | 56 (17.0%) |
| $75,000 to $99,999 | 19 (12.2%) | 43 (13.0%) |
| $100,000 to $149,999 | 37 (23.7%) | 48 (14.5%) |
| $150,000 or more | 24 (15.4%) | 32 (9.7%) |
| Total | 156 (100.0%) | 330 (100.0%) |
Monthly Housing Cost Tiers in Millbourne borough
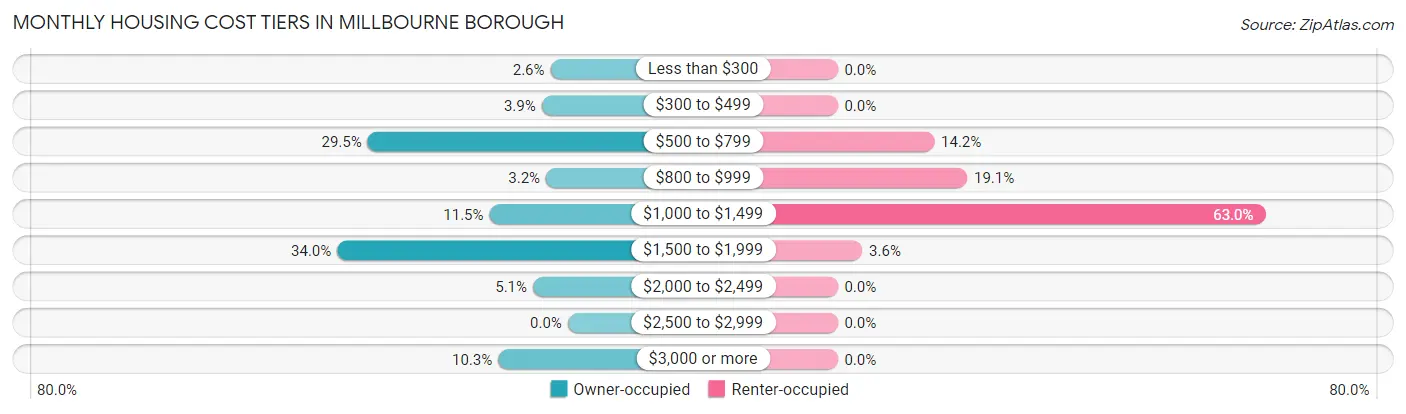
| Monthly Cost | Owner-occupied | Renter-occupied |
| Less than $300 | 4 (2.6%) | 0 (0.0%) |
| $300 to $499 | 6 (3.8%) | 0 (0.0%) |
| $500 to $799 | 46 (29.5%) | 47 (14.2%) |
| $800 to $999 | 5 (3.2%) | 63 (19.1%) |
| $1,000 to $1,499 | 18 (11.5%) | 208 (63.0%) |
| $1,500 to $1,999 | 53 (34.0%) | 12 (3.6%) |
| $2,000 to $2,499 | 8 (5.1%) | 0 (0.0%) |
| $2,500 to $2,999 | 0 (0.0%) | 0 (0.0%) |
| $3,000 or more | 16 (10.3%) | 0 (0.0%) |
| Total | 156 (100.0%) | 330 (100.0%) |
Physical Housing Characteristics in Millbourne borough
Housing Structures in Millbourne borough
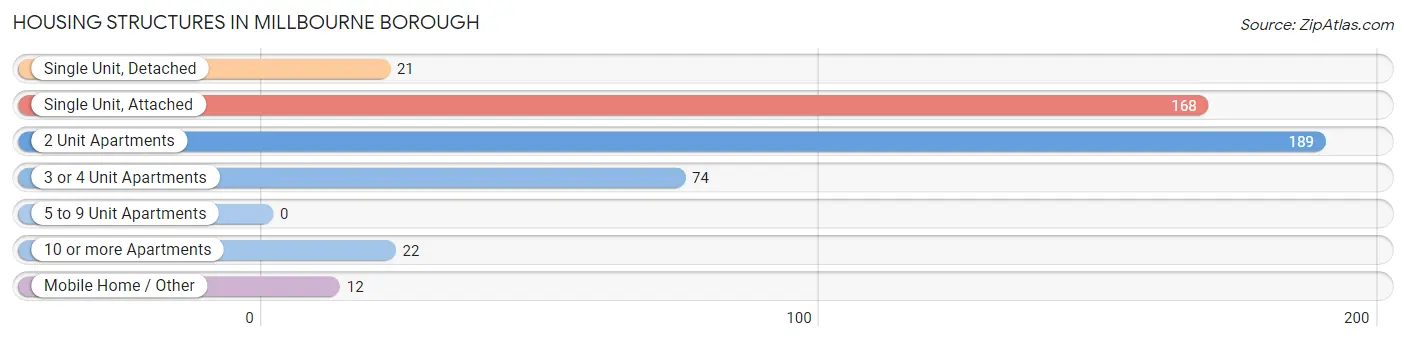
| Structure Type | # Housing Units | % Housing Units |
| Single Unit, Detached | 21 | 4.3% |
| Single Unit, Attached | 168 | 34.6% |
| 2 Unit Apartments | 189 | 38.9% |
| 3 or 4 Unit Apartments | 74 | 15.2% |
| 5 to 9 Unit Apartments | 0 | 0.0% |
| 10 or more Apartments | 22 | 4.5% |
| Mobile Home / Other | 12 | 2.5% |
| Total | 486 | 100.0% |
Housing Structures by Occupancy in Millbourne borough
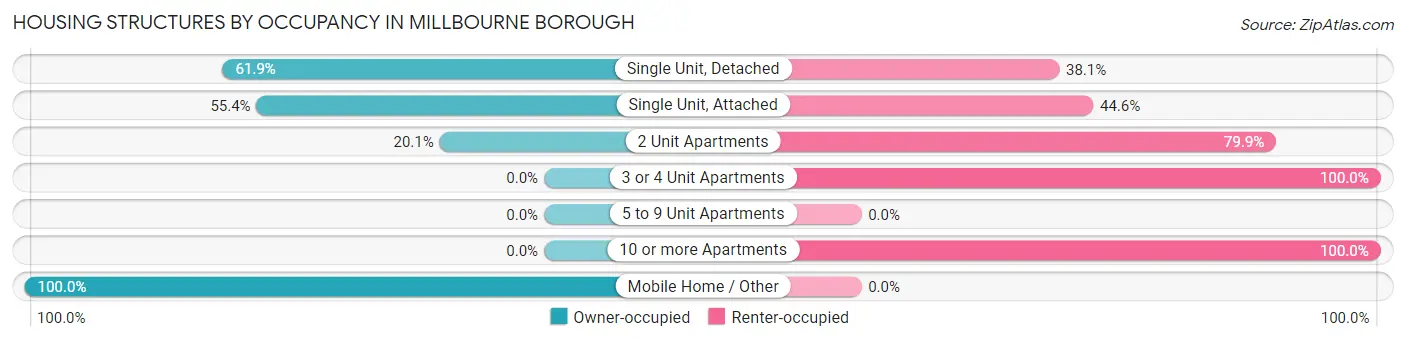
| Structure Type | Owner-occupied | Renter-occupied |
| Single Unit, Detached | 13 (61.9%) | 8 (38.1%) |
| Single Unit, Attached | 93 (55.4%) | 75 (44.6%) |
| 2 Unit Apartments | 38 (20.1%) | 151 (79.9%) |
| 3 or 4 Unit Apartments | 0 (0.0%) | 74 (100.0%) |
| 5 to 9 Unit Apartments | 0 (0.0%) | 0 (0.0%) |
| 10 or more Apartments | 0 (0.0%) | 22 (100.0%) |
| Mobile Home / Other | 12 (100.0%) | 0 (0.0%) |
| Total | 156 (32.1%) | 330 (67.9%) |
Housing Structures by Number of Rooms in Millbourne borough
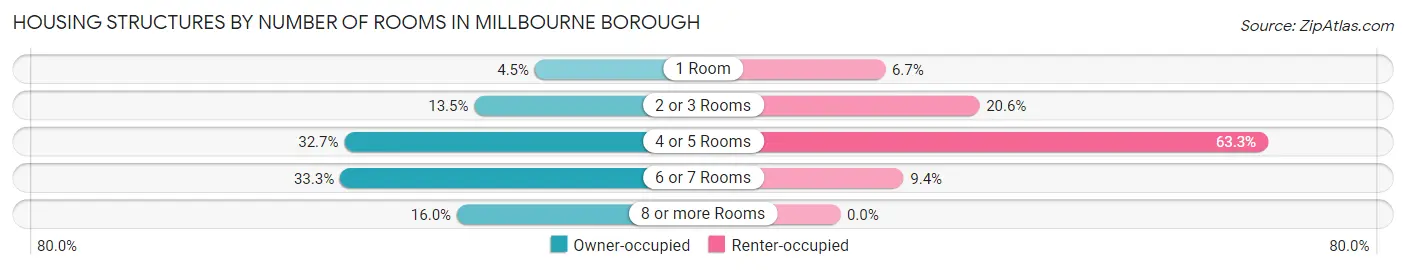
| Number of Rooms | Owner-occupied | Renter-occupied |
| 1 Room | 7 (4.5%) | 22 (6.7%) |
| 2 or 3 Rooms | 21 (13.5%) | 68 (20.6%) |
| 4 or 5 Rooms | 51 (32.7%) | 209 (63.3%) |
| 6 or 7 Rooms | 52 (33.3%) | 31 (9.4%) |
| 8 or more Rooms | 25 (16.0%) | 0 (0.0%) |
| Total | 156 (100.0%) | 330 (100.0%) |
Housing Structure by Heating Type in Millbourne borough
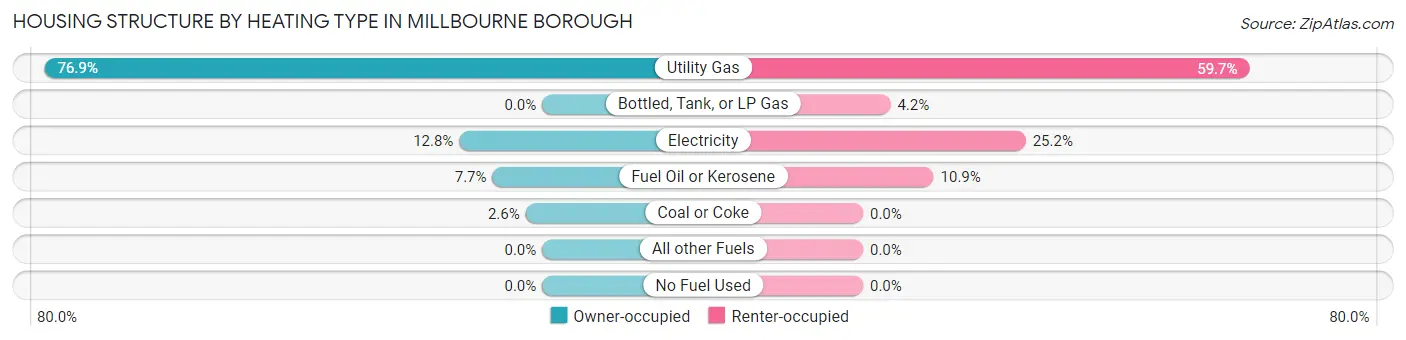
| Heating Type | Owner-occupied | Renter-occupied |
| Utility Gas | 120 (76.9%) | 197 (59.7%) |
| Bottled, Tank, or LP Gas | 0 (0.0%) | 14 (4.2%) |
| Electricity | 20 (12.8%) | 83 (25.2%) |
| Fuel Oil or Kerosene | 12 (7.7%) | 36 (10.9%) |
| Coal or Coke | 4 (2.6%) | 0 (0.0%) |
| All other Fuels | 0 (0.0%) | 0 (0.0%) |
| No Fuel Used | 0 (0.0%) | 0 (0.0%) |
| Total | 156 (100.0%) | 330 (100.0%) |
Household Vehicle Usage in Millbourne borough
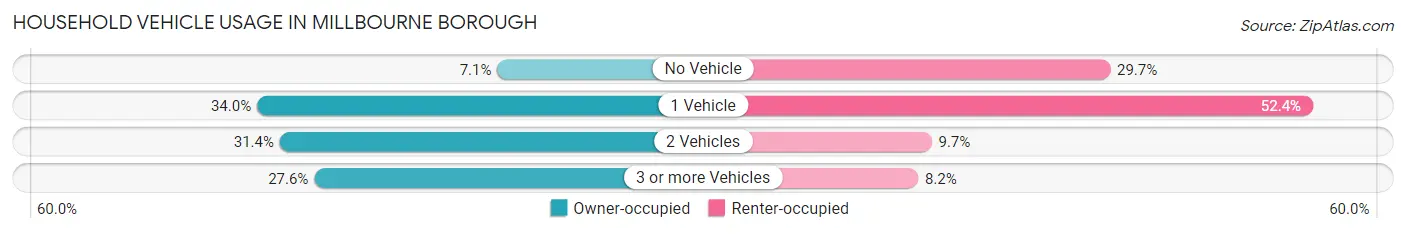
| Vehicles per Household | Owner-occupied | Renter-occupied |
| No Vehicle | 11 (7.0%) | 98 (29.7%) |
| 1 Vehicle | 53 (34.0%) | 173 (52.4%) |
| 2 Vehicles | 49 (31.4%) | 32 (9.7%) |
| 3 or more Vehicles | 43 (27.6%) | 27 (8.2%) |
| Total | 156 (100.0%) | 330 (100.0%) |
Real Estate & Mortgages in Millbourne borough
Real Estate and Mortgage Overview in Millbourne borough
| Characteristic | Without Mortgage | With Mortgage |
| Housing Units | 75 | 81 |
| Median Property Value | $137,500 | $0 |
| Median Household Income | $85,125 | $9 |
| Monthly Housing Costs | $589 | $12 |
| Real Estate Taxes | - | - |
Property Value by Mortgage Status in Millbourne borough
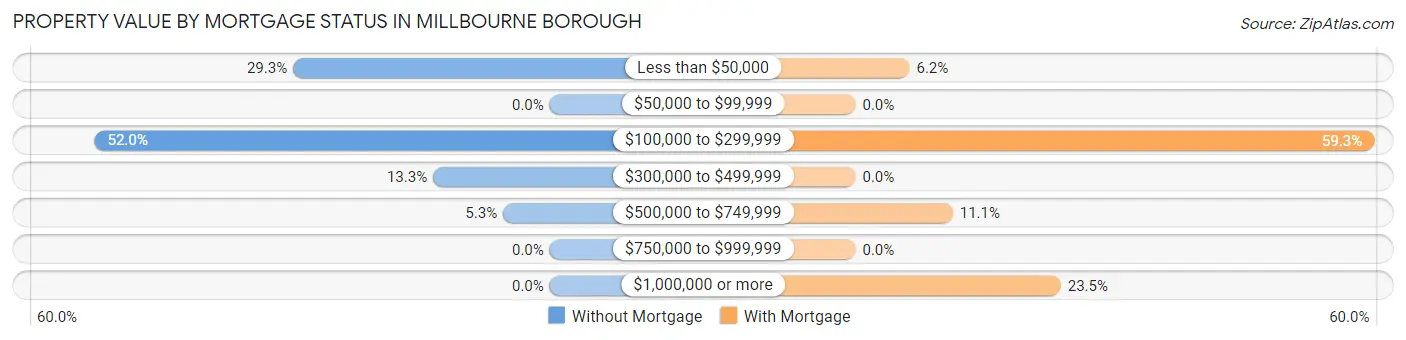
| Property Value | Without Mortgage | With Mortgage |
| Less than $50,000 | 22 (29.3%) | 5 (6.2%) |
| $50,000 to $99,999 | 0 (0.0%) | 0 (0.0%) |
| $100,000 to $299,999 | 39 (52.0%) | 48 (59.3%) |
| $300,000 to $499,999 | 10 (13.3%) | 0 (0.0%) |
| $500,000 to $749,999 | 4 (5.3%) | 9 (11.1%) |
| $750,000 to $999,999 | 0 (0.0%) | 0 (0.0%) |
| $1,000,000 or more | 0 (0.0%) | 19 (23.5%) |
| Total | 75 (100.0%) | 81 (100.0%) |
Household Income by Mortgage Status in Millbourne borough
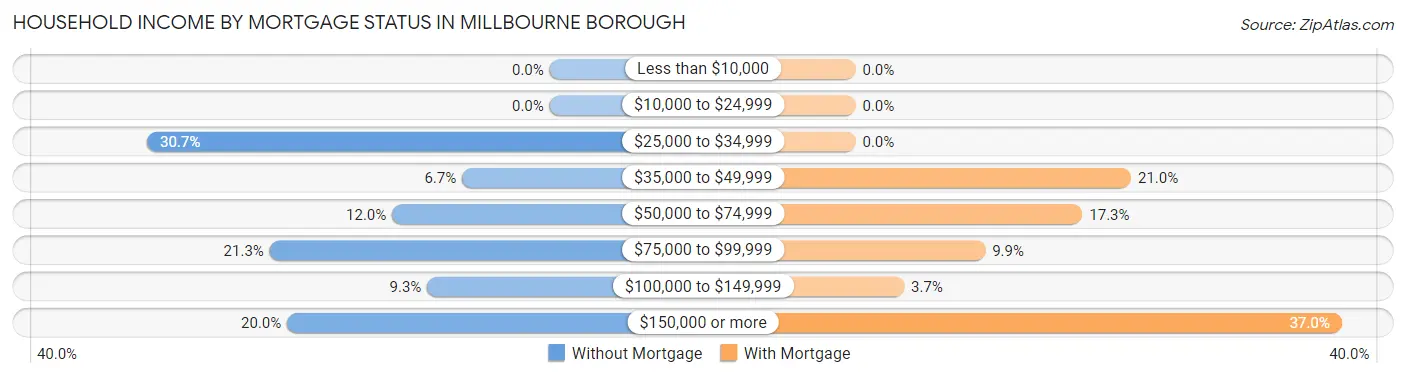
| Household Income | Without Mortgage | With Mortgage |
| Less than $10,000 | 0 (0.0%) | 0 (0.0%) |
| $10,000 to $24,999 | 0 (0.0%) | 0 (0.0%) |
| $25,000 to $34,999 | 23 (30.7%) | 0 (0.0%) |
| $35,000 to $49,999 | 5 (6.7%) | 17 (21.0%) |
| $50,000 to $74,999 | 9 (12.0%) | 14 (17.3%) |
| $75,000 to $99,999 | 16 (21.3%) | 8 (9.9%) |
| $100,000 to $149,999 | 7 (9.3%) | 3 (3.7%) |
| $150,000 or more | 15 (20.0%) | 30 (37.0%) |
| Total | 75 (100.0%) | 81 (100.0%) |
Property Value to Household Income Ratio in Millbourne borough
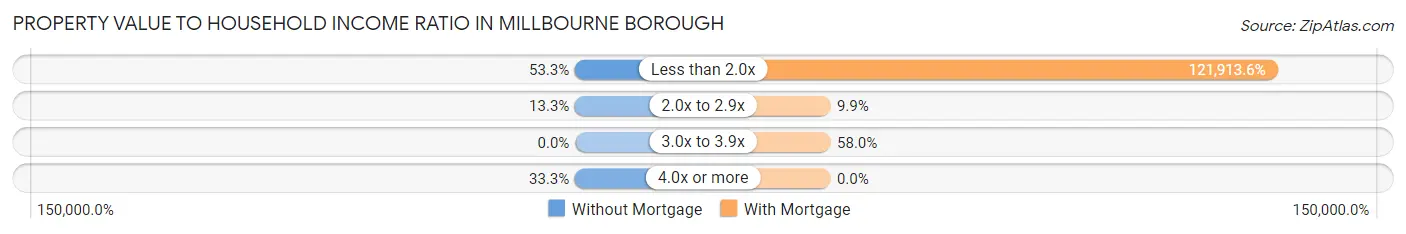
| Value-to-Income Ratio | Without Mortgage | With Mortgage |
| Less than 2.0x | 40 (53.3%) | 98,750 (121,913.6%) |
| 2.0x to 2.9x | 10 (13.3%) | 8 (9.9%) |
| 3.0x to 3.9x | 0 (0.0%) | 47 (58.0%) |
| 4.0x or more | 25 (33.3%) | 0 (0.0%) |
| Total | 75 (100.0%) | 81 (100.0%) |
Real Estate Taxes by Mortgage Status in Millbourne borough
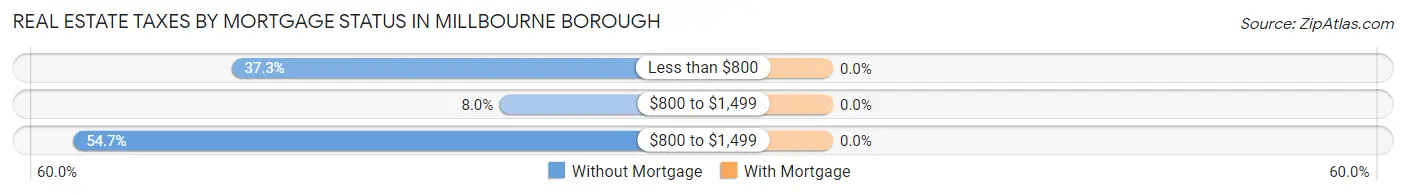
| Property Taxes | Without Mortgage | With Mortgage |
| Less than $800 | 28 (37.3%) | 0 (0.0%) |
| $800 to $1,499 | 6 (8.0%) | 0 (0.0%) |
| $800 to $1,499 | 41 (54.7%) | 0 (0.0%) |
| Total | 75 (100.0%) | 81 (100.0%) |
Health & Disability in Millbourne borough
Health Insurance Coverage by Age in Millbourne borough
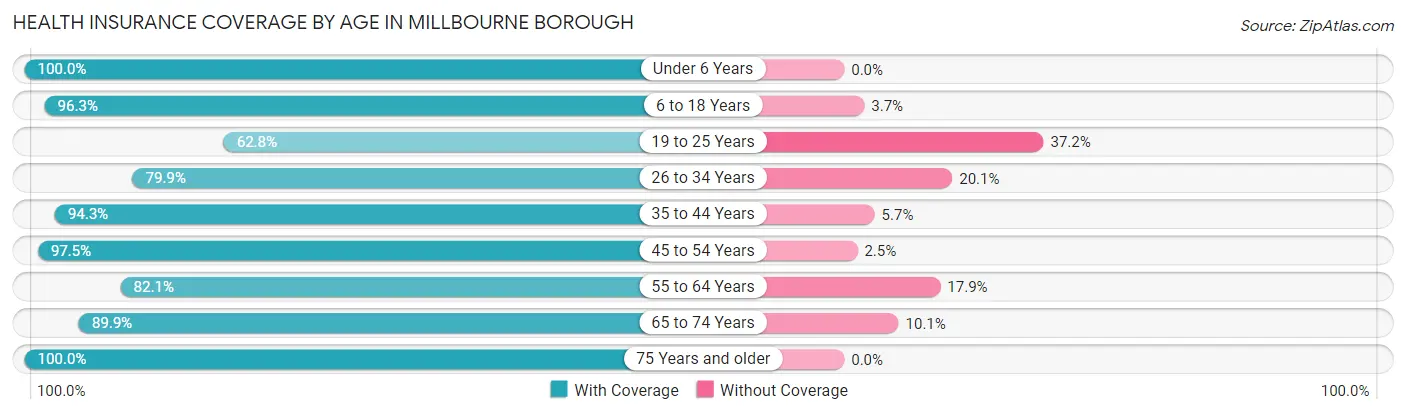
| Age Bracket | With Coverage | Without Coverage |
| Under 6 Years | 107 (100.0%) | 0 (0.0%) |
| 6 to 18 Years | 180 (96.3%) | 7 (3.7%) |
| 19 to 25 Years | 93 (62.8%) | 55 (37.2%) |
| 26 to 34 Years | 230 (79.9%) | 58 (20.1%) |
| 35 to 44 Years | 150 (94.3%) | 9 (5.7%) |
| 45 to 54 Years | 119 (97.5%) | 3 (2.5%) |
| 55 to 64 Years | 197 (82.1%) | 43 (17.9%) |
| 65 to 74 Years | 71 (89.9%) | 8 (10.1%) |
| 75 Years and older | 95 (100.0%) | 0 (0.0%) |
| Total | 1,242 (87.2%) | 183 (12.8%) |
Health Insurance Coverage by Citizenship Status in Millbourne borough
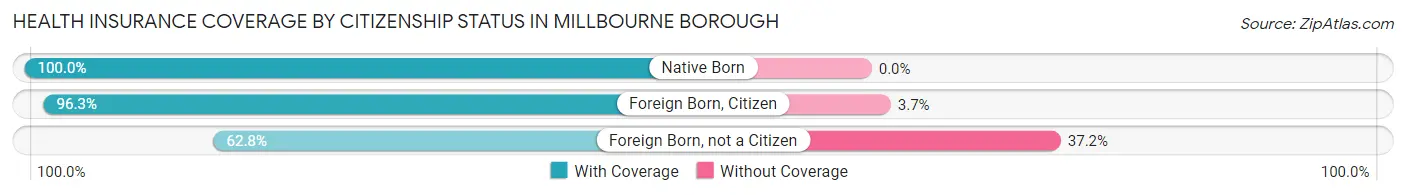
| Citizenship Status | With Coverage | Without Coverage |
| Native Born | 107 (100.0%) | 0 (0.0%) |
| Foreign Born, Citizen | 180 (96.3%) | 7 (3.7%) |
| Foreign Born, not a Citizen | 93 (62.8%) | 55 (37.2%) |
Health Insurance Coverage by Household Income in Millbourne borough
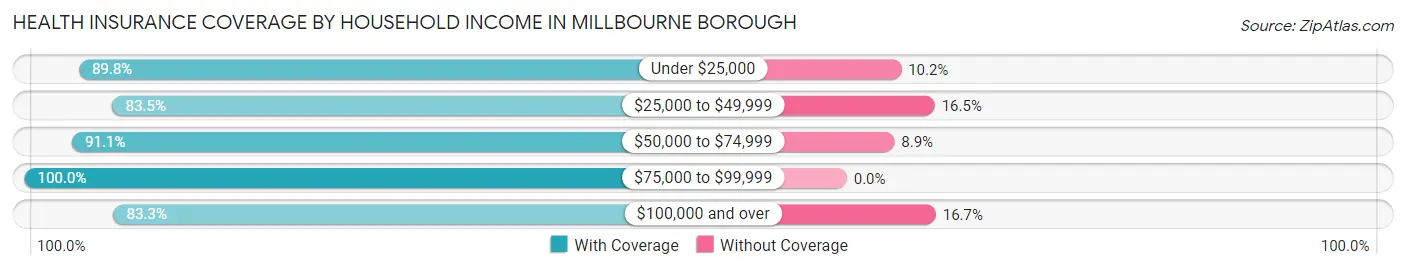
| Household Income | With Coverage | Without Coverage |
| Under $25,000 | 97 (89.8%) | 11 (10.2%) |
| $25,000 to $49,999 | 380 (83.5%) | 75 (16.5%) |
| $50,000 to $74,999 | 184 (91.1%) | 18 (8.9%) |
| $75,000 to $99,999 | 186 (100.0%) | 0 (0.0%) |
| $100,000 and over | 395 (83.3%) | 79 (16.7%) |
Public vs Private Health Insurance Coverage by Age in Millbourne borough
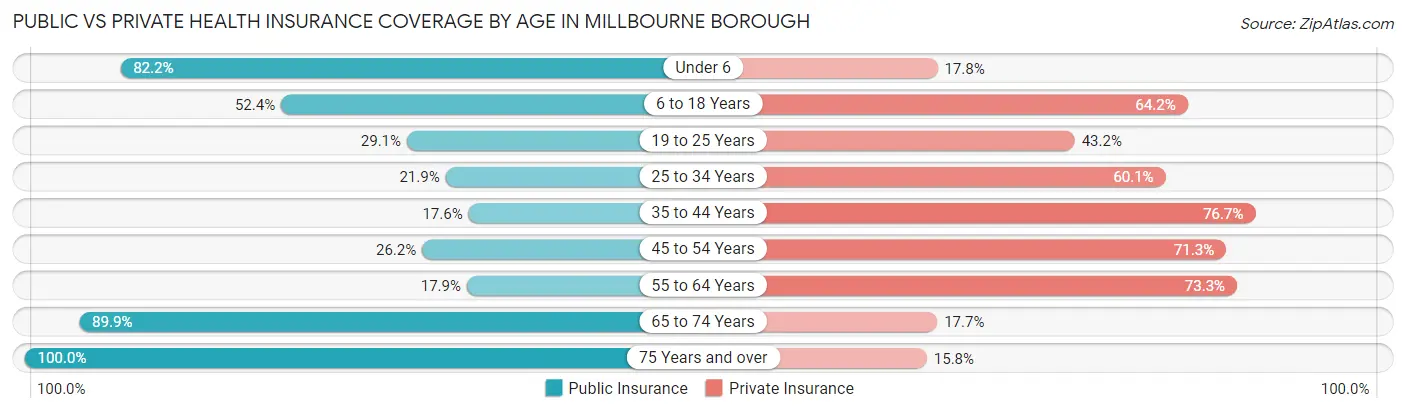
| Age Bracket | Public Insurance | Private Insurance |
| Under 6 | 88 (82.2%) | 19 (17.8%) |
| 6 to 18 Years | 98 (52.4%) | 120 (64.2%) |
| 19 to 25 Years | 43 (29.0%) | 64 (43.2%) |
| 25 to 34 Years | 63 (21.9%) | 173 (60.1%) |
| 35 to 44 Years | 28 (17.6%) | 122 (76.7%) |
| 45 to 54 Years | 32 (26.2%) | 87 (71.3%) |
| 55 to 64 Years | 43 (17.9%) | 176 (73.3%) |
| 65 to 74 Years | 71 (89.9%) | 14 (17.7%) |
| 75 Years and over | 95 (100.0%) | 15 (15.8%) |
| Total | 561 (39.4%) | 790 (55.4%) |
Disability Status by Sex by Age in Millbourne borough
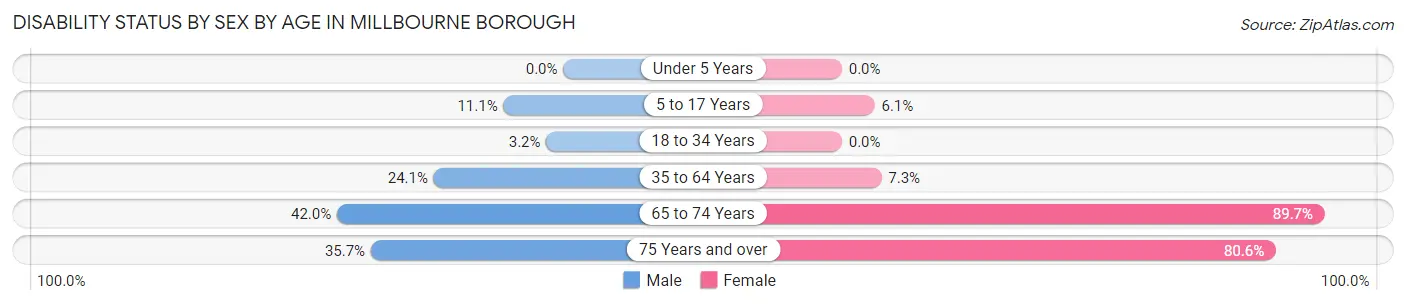
| Age Bracket | Male | Female |
| Under 5 Years | 0 (0.0%) | 0 (0.0%) |
| 5 to 17 Years | 7 (11.1%) | 9 (6.1%) |
| 18 to 34 Years | 8 (3.2%) | 0 (0.0%) |
| 35 to 64 Years | 63 (24.0%) | 19 (7.3%) |
| 65 to 74 Years | 21 (42.0%) | 26 (89.7%) |
| 75 Years and over | 10 (35.7%) | 54 (80.6%) |
Disability Class by Sex by Age in Millbourne borough
Disability Class: Hearing Difficulty
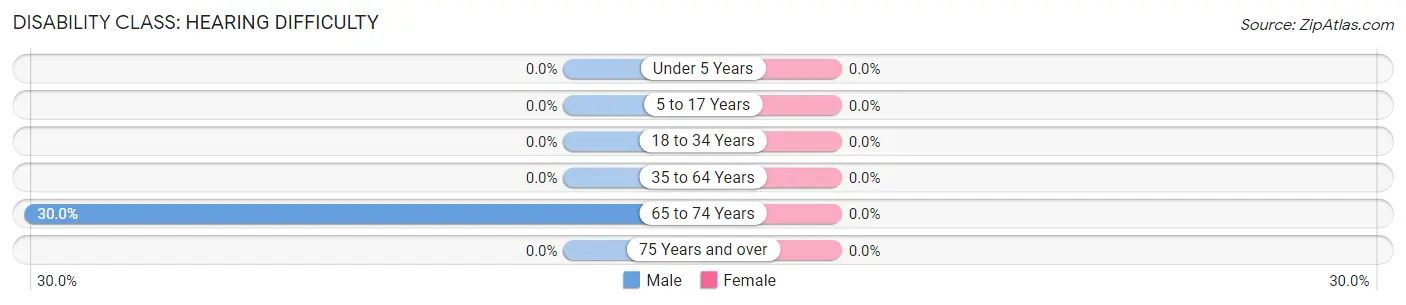
| Age Bracket | Male | Female |
| Under 5 Years | 0 (0.0%) | 0 (0.0%) |
| 5 to 17 Years | 0 (0.0%) | 0 (0.0%) |
| 18 to 34 Years | 0 (0.0%) | 0 (0.0%) |
| 35 to 64 Years | 0 (0.0%) | 0 (0.0%) |
| 65 to 74 Years | 15 (30.0%) | 0 (0.0%) |
| 75 Years and over | 0 (0.0%) | 0 (0.0%) |
Disability Class: Vision Difficulty
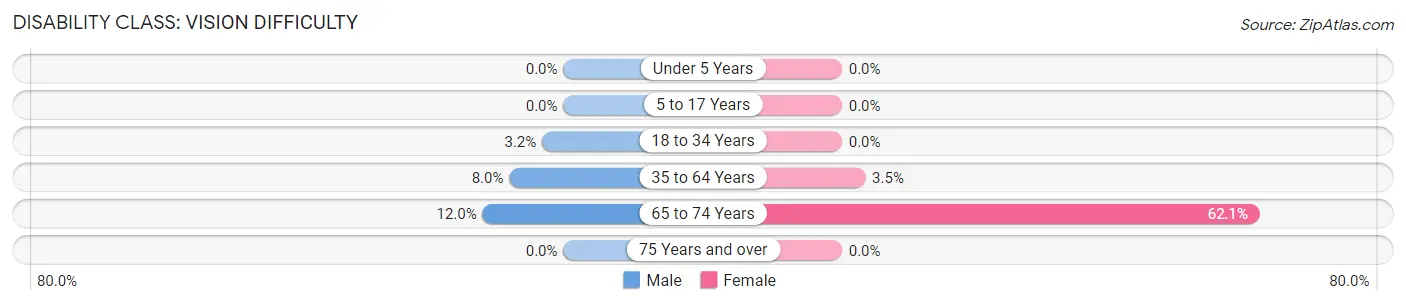
| Age Bracket | Male | Female |
| Under 5 Years | 0 (0.0%) | 0 (0.0%) |
| 5 to 17 Years | 0 (0.0%) | 0 (0.0%) |
| 18 to 34 Years | 8 (3.2%) | 0 (0.0%) |
| 35 to 64 Years | 21 (8.0%) | 9 (3.5%) |
| 65 to 74 Years | 6 (12.0%) | 18 (62.1%) |
| 75 Years and over | 0 (0.0%) | 0 (0.0%) |
Disability Class: Cognitive Difficulty
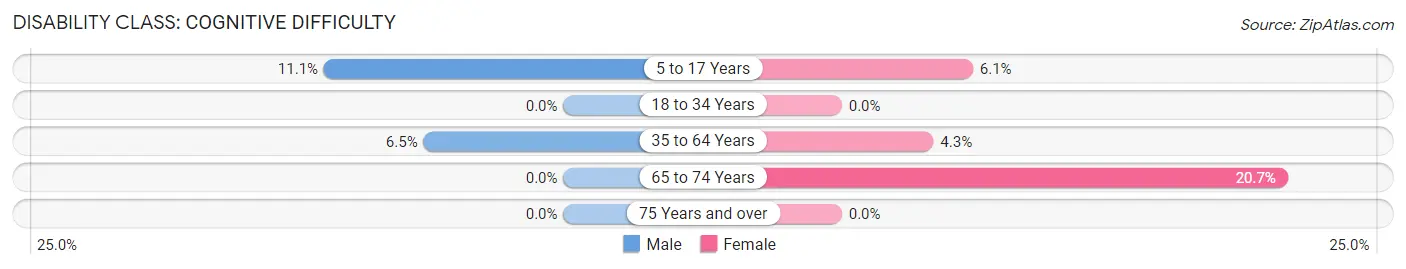
| Age Bracket | Male | Female |
| 5 to 17 Years | 7 (11.1%) | 9 (6.1%) |
| 18 to 34 Years | 0 (0.0%) | 0 (0.0%) |
| 35 to 64 Years | 17 (6.5%) | 11 (4.3%) |
| 65 to 74 Years | 0 (0.0%) | 6 (20.7%) |
| 75 Years and over | 0 (0.0%) | 0 (0.0%) |
Disability Class: Ambulatory Difficulty
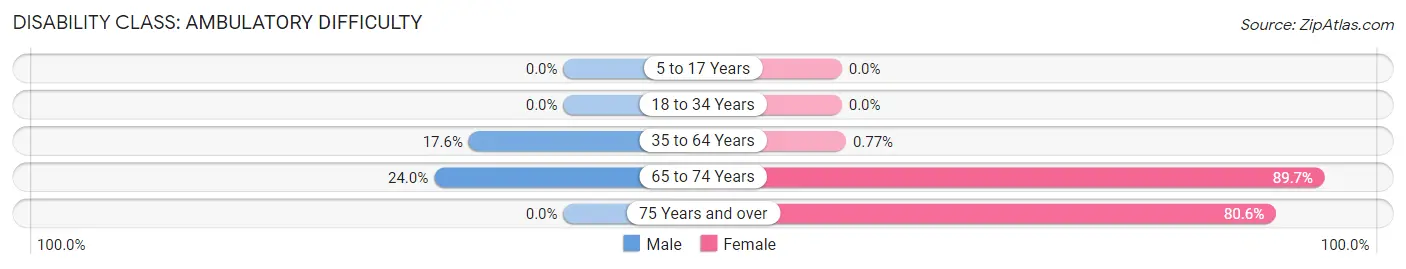
| Age Bracket | Male | Female |
| 5 to 17 Years | 0 (0.0%) | 0 (0.0%) |
| 18 to 34 Years | 0 (0.0%) | 0 (0.0%) |
| 35 to 64 Years | 46 (17.6%) | 2 (0.8%) |
| 65 to 74 Years | 12 (24.0%) | 26 (89.7%) |
| 75 Years and over | 0 (0.0%) | 54 (80.6%) |
Disability Class: Self-Care Difficulty
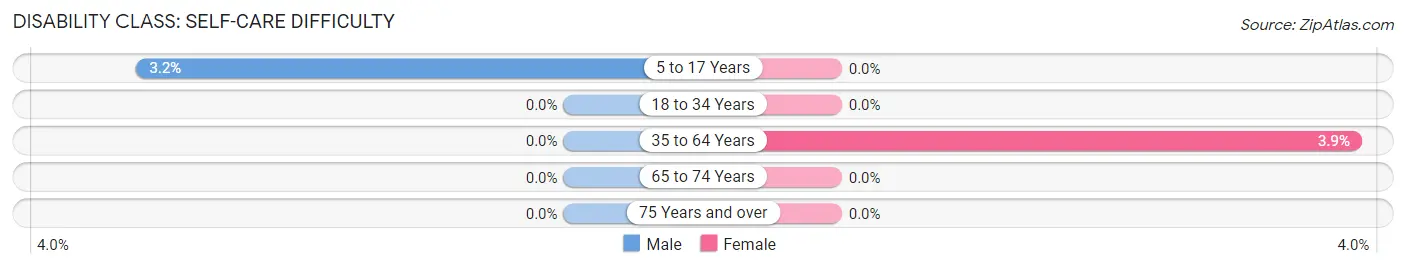
| Age Bracket | Male | Female |
| 5 to 17 Years | 2 (3.2%) | 0 (0.0%) |
| 18 to 34 Years | 0 (0.0%) | 0 (0.0%) |
| 35 to 64 Years | 0 (0.0%) | 10 (3.9%) |
| 65 to 74 Years | 0 (0.0%) | 0 (0.0%) |
| 75 Years and over | 0 (0.0%) | 0 (0.0%) |
Technology Access in Millbourne borough
Computing Device Access in Millbourne borough
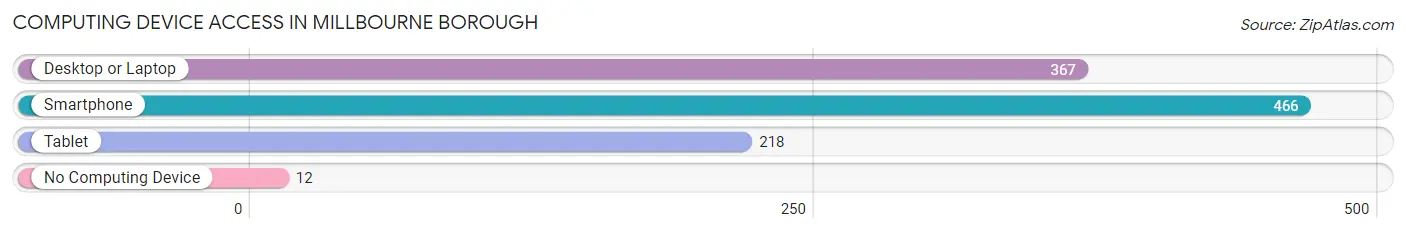
| Device Type | # Households | % Households |
| Desktop or Laptop | 367 | 75.5% |
| Smartphone | 466 | 95.9% |
| Tablet | 218 | 44.9% |
| No Computing Device | 12 | 2.5% |
| Total | 486 | 100.0% |
Internet Access in Millbourne borough
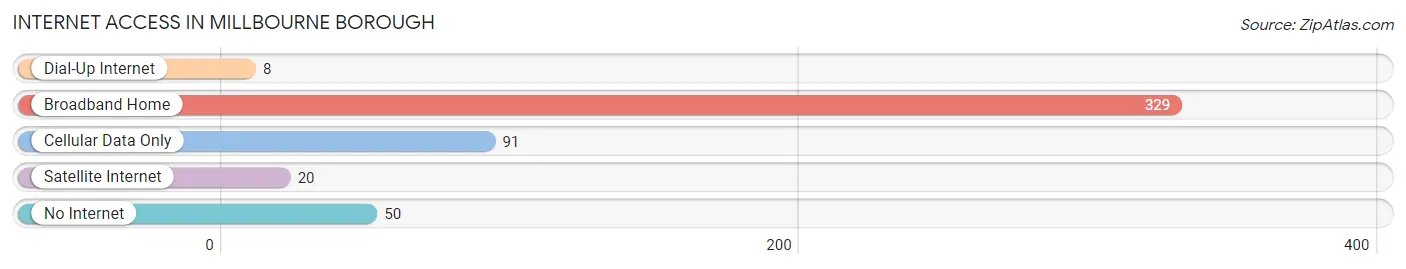
| Internet Type | # Households | % Households |
| Dial-Up Internet | 8 | 1.7% |
| Broadband Home | 329 | 67.7% |
| Cellular Data Only | 91 | 18.7% |
| Satellite Internet | 20 | 4.1% |
| No Internet | 50 | 10.3% |
| Total | 486 | 100.0% |
Millbourne borough Summary
Millbourne Borough is a small borough located in Delaware County, Pennsylvania. It is situated just outside of Philadelphia and is part of the Philadelphia metropolitan area. The borough is home to a population of approximately 2,000 people and is known for its small-town charm and close-knit community.
History
Millbourne Borough was first settled in the late 1700s by a group of Quakers from England. The area was originally known as Mill Creek, and the name was changed to Millbourne in 1853. The borough was officially incorporated in 1874.
In the late 1800s, Millbourne was a thriving industrial center, with several factories and mills located in the area. The borough was also home to a number of small businesses, including a blacksmith, a tannery, and a general store.
In the early 1900s, Millbourne began to experience a decline in industry and population. The borough was hit hard by the Great Depression, and many of the factories and mills closed. The population of the borough decreased significantly during this time.
In the 1950s, Millbourne began to experience a resurgence in population and industry. The borough was home to several new businesses, including a grocery store, a hardware store, and a pharmacy. The population of the borough began to increase, and by the 1970s, the population had reached its current level of approximately 2,000 people.
Geography
Millbourne Borough is located in southeastern Pennsylvania, just outside of Philadelphia. The borough is situated in Delaware County, and is bordered by the boroughs of Darby, Yeadon, and Upper Darby. The borough is located on the west bank of the Delaware River, and is approximately 8 miles from downtown Philadelphia.
The borough is primarily residential, with a few small businesses located in the area. The borough is home to several parks, including Millbourne Park, which features a playground, basketball courts, and a baseball field.
Economy
Millbourne Borough has a small, but diverse economy. The borough is home to several small businesses, including a grocery store, a hardware store, and a pharmacy. The borough is also home to a number of professional services, including a law firm, an accounting firm, and a real estate agency.
The borough is also home to a number of manufacturing and industrial businesses, including a printing company, a plastics manufacturer, and a metal fabrication company. The borough is also home to a number of restaurants, including a pizza shop, a Chinese restaurant, and a Mexican restaurant.
Demographics
As of the 2010 census, the population of Millbourne Borough was 2,000 people. The racial makeup of the borough was 79.2% White, 15.2% African American, 0.7% Asian, and 4.9% from other races. The median household income in the borough was $41,250, and the median family income was $50,000.
The borough is home to a number of religious institutions, including a Catholic church, a Baptist church, and a Methodist church. The borough is also home to a number of public schools, including Millbourne Elementary School, Millbourne Middle School, and Millbourne High School.
Conclusion
Millbourne Borough is a small borough located in Delaware County, Pennsylvania. It is situated just outside of Philadelphia and is part of the Philadelphia metropolitan area. The borough is home to a population of approximately 2,000 people and is known for its small-town charm and close-knit community. The borough has a small, but diverse economy, and is home to a number of small businesses, manufacturing and industrial businesses, and restaurants. The borough is also home to a number of religious institutions and public schools.
Common Questions
What is Per Capita Income in Millbourne borough?
Per Capita income in Millbourne borough is $28,291.
What is the Median Family Income in Millbourne borough?
Median Family Income in Millbourne borough is $80,156.
What is the Median Household income in Millbourne borough?
Median Household Income in Millbourne borough is $58,750.
What is Income or Wage Gap in Millbourne borough?
Income or Wage Gap in Millbourne borough is 16.2%.
Women in Millbourne borough earn 83.8 cents for every dollar earned by a man.
What is Inequality or Gini Index in Millbourne borough?
Inequality or Gini Index in Millbourne borough is 0.45.
What is the Total Population of Millbourne borough?
Total Population of Millbourne borough is 1,425.
What is the Total Male Population of Millbourne borough?
Total Male Population of Millbourne borough is 699.
What is the Total Female Population of Millbourne borough?
Total Female Population of Millbourne borough is 726.
What is the Ratio of Males per 100 Females in Millbourne borough?
There are 96.28 Males per 100 Females in Millbourne borough.
What is the Ratio of Females per 100 Males in Millbourne borough?
There are 103.86 Females per 100 Males in Millbourne borough.
What is the Median Population Age in Millbourne borough?
Median Population Age in Millbourne borough is 34.4 Years.
What is the Average Family Size in Millbourne borough
Average Family Size in Millbourne borough is 3.7 People.
What is the Average Household Size in Millbourne borough
Average Household Size in Millbourne borough is 2.9 People.
How Large is the Labor Force in Millbourne borough?
There are 752 People in the Labor Forcein in Millbourne borough.
What is the Percentage of People in the Labor Force in Millbourne borough?
64.0% of People are in the Labor Force in Millbourne borough.
What is the Unemployment Rate in Millbourne borough?
Unemployment Rate in Millbourne borough is 3.5%.