Port Trevorton, PA Map & Demographics
Port Trevorton Map
Port Trevorton Overview
$27,063
PER CAPITA INCOME
$69,375
AVG FAMILY INCOME
$67,917
AVG HOUSEHOLD INCOME
43.4%
WAGE / INCOME GAP [ % ]
56.6¢/ $1
WAGE / INCOME GAP [ $ ]
0.36
INEQUALITY / GINI INDEX
629
TOTAL POPULATION
374
MALE POPULATION
255
FEMALE POPULATION
146.67
MALES / 100 FEMALES
68.18
FEMALES / 100 MALES
36.9
MEDIAN AGE
3.5
AVG FAMILY SIZE
3.2
AVG HOUSEHOLD SIZE
321
LABOR FORCE [ PEOPLE ]
63.3%
PERCENT IN LABOR FORCE
2.5%
UNEMPLOYMENT RATE
Port Trevorton Zip Codes
Port Trevorton Area Codes
Income in Port Trevorton
Income Overview in Port Trevorton
Per Capita Income in Port Trevorton is $27,063, while median incomes of families and households are $69,375 and $67,917 respectively.
| Characteristic | Number | Measure |
| Per Capita Income | 629 | $27,063 |
| Median Family Income | 165 | $69,375 |
| Mean Family Income | 165 | $83,312 |
| Median Household Income | 199 | $67,917 |
| Mean Household Income | 199 | $78,953 |
| Income Deficit | 165 | $0 |
| Wage / Income Gap (%) | 629 | 43.39% |
| Wage / Income Gap ($) | 629 | 56.61¢ per $1 |
| Gini / Inequality Index | 629 | 0.36 |
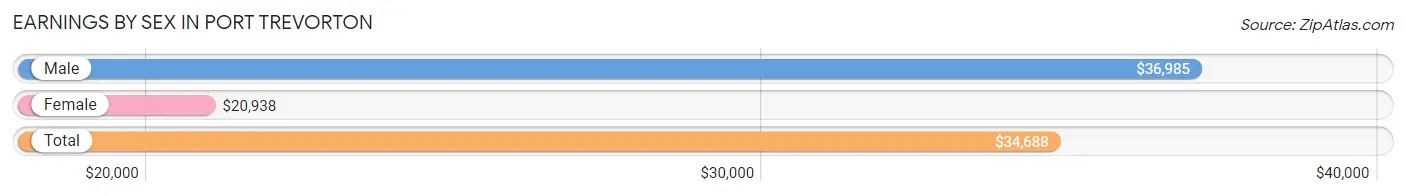
Earnings by Sex in Port Trevorton
Average Earnings in Port Trevorton are $34,688, $36,985 for men and $20,938 for women, a difference of 43.4%.
| Sex | Number | Average Earnings |
| Male | 208 (60.5%) | $36,985 |
| Female | 136 (39.5%) | $20,938 |
| Total | 344 (100.0%) | $34,688 |
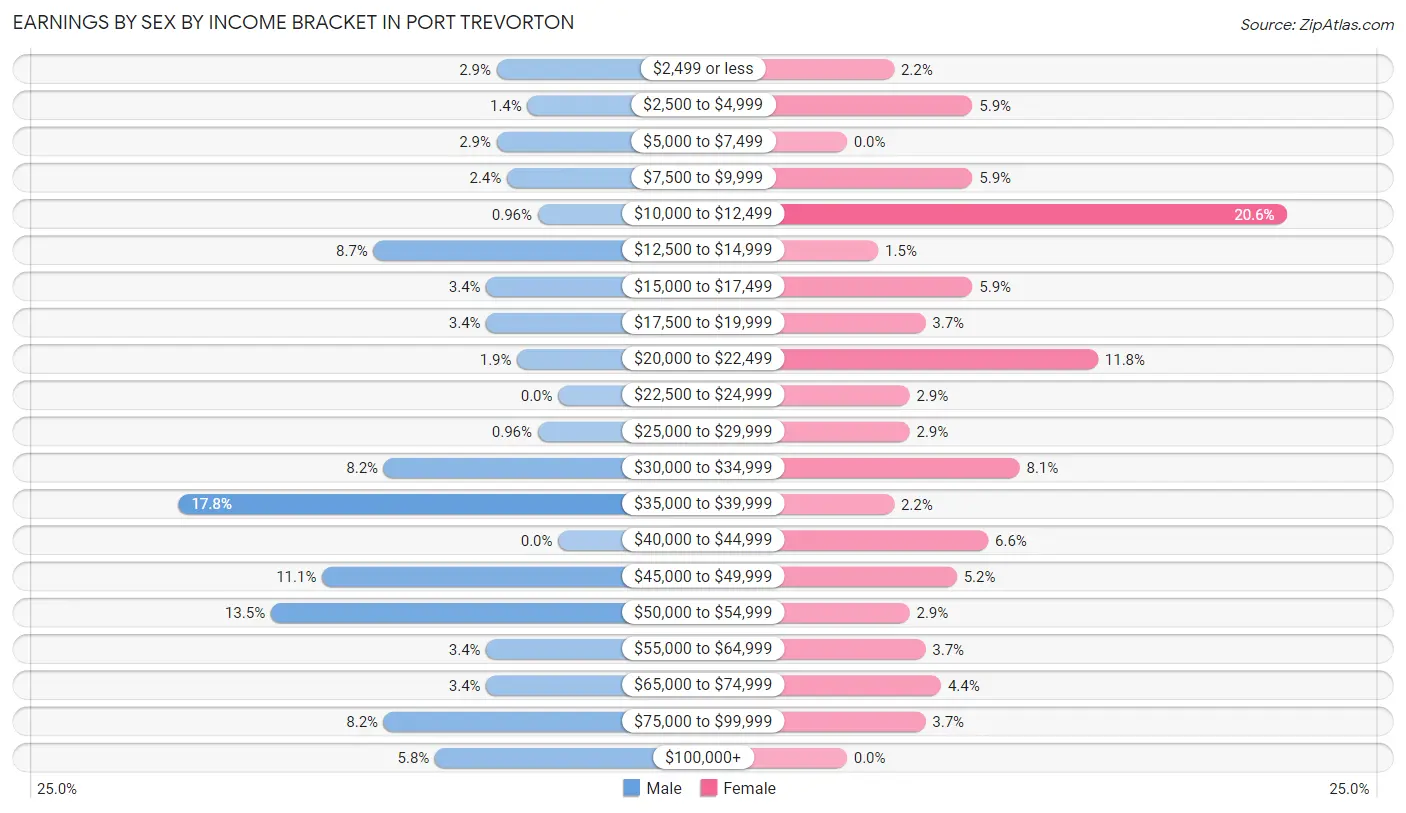
Earnings by Sex by Income Bracket in Port Trevorton
The most common earnings brackets in Port Trevorton are $35,000 to $39,999 for men (37 | 17.8%) and $10,000 to $12,499 for women (28 | 20.6%).
| Income | Male | Female |
| $2,499 or less | 6 (2.9%) | 3 (2.2%) |
| $2,500 to $4,999 | 3 (1.4%) | 8 (5.9%) |
| $5,000 to $7,499 | 6 (2.9%) | 0 (0.0%) |
| $7,500 to $9,999 | 5 (2.4%) | 8 (5.9%) |
| $10,000 to $12,499 | 2 (1.0%) | 28 (20.6%) |
| $12,500 to $14,999 | 18 (8.6%) | 2 (1.5%) |
| $15,000 to $17,499 | 7 (3.4%) | 8 (5.9%) |
| $17,500 to $19,999 | 7 (3.4%) | 5 (3.7%) |
| $20,000 to $22,499 | 4 (1.9%) | 16 (11.8%) |
| $22,500 to $24,999 | 0 (0.0%) | 4 (2.9%) |
| $25,000 to $29,999 | 2 (1.0%) | 4 (2.9%) |
| $30,000 to $34,999 | 17 (8.2%) | 11 (8.1%) |
| $35,000 to $39,999 | 37 (17.8%) | 3 (2.2%) |
| $40,000 to $44,999 | 0 (0.0%) | 9 (6.6%) |
| $45,000 to $49,999 | 23 (11.1%) | 7 (5.1%) |
| $50,000 to $54,999 | 28 (13.5%) | 4 (2.9%) |
| $55,000 to $64,999 | 7 (3.4%) | 5 (3.7%) |
| $65,000 to $74,999 | 7 (3.4%) | 6 (4.4%) |
| $75,000 to $99,999 | 17 (8.2%) | 5 (3.7%) |
| $100,000+ | 12 (5.8%) | 0 (0.0%) |
| Total | 208 (100.0%) | 136 (100.0%) |
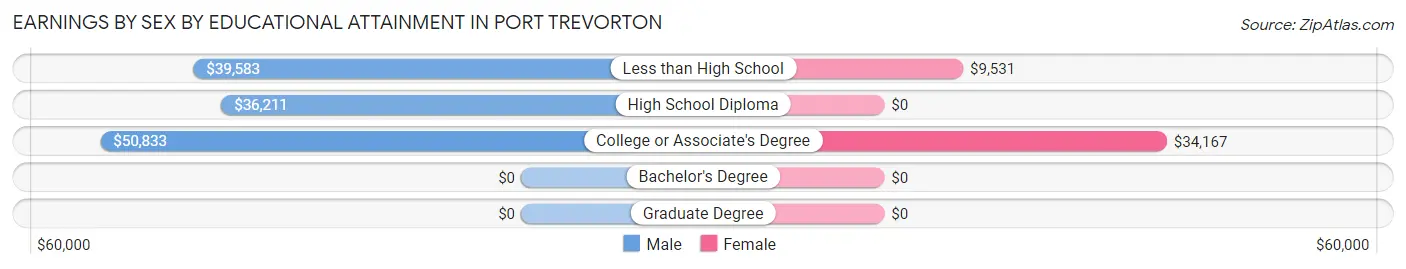
Earnings by Sex by Educational Attainment in Port Trevorton
Average earnings in Port Trevorton are $37,243 for men and $21,071 for women, a difference of 43.4%. Men with an educational attainment of college or associate's degree enjoy the highest average annual earnings of $50,833, while those with high school diploma education earn the least with $36,211. Women with an educational attainment of college or associate's degree earn the most with the average annual earnings of $34,167, while those with less than high school education have the smallest earnings of $9,531.
| Educational Attainment | Male Income | Female Income |
| Less than High School | $39,583 | $9,531 |
| High School Diploma | $36,211 | $0 |
| College or Associate's Degree | $50,833 | $34,167 |
| Bachelor's Degree | - | - |
| Graduate Degree | - | - |
| Total | $37,243 | $21,071 |
Family Income in Port Trevorton
Family Income Brackets in Port Trevorton
According to the Port Trevorton family income data, there are 55 families falling into the $100,000 to $149,999 income range, which is the most common income bracket and makes up 33.3% of all families.
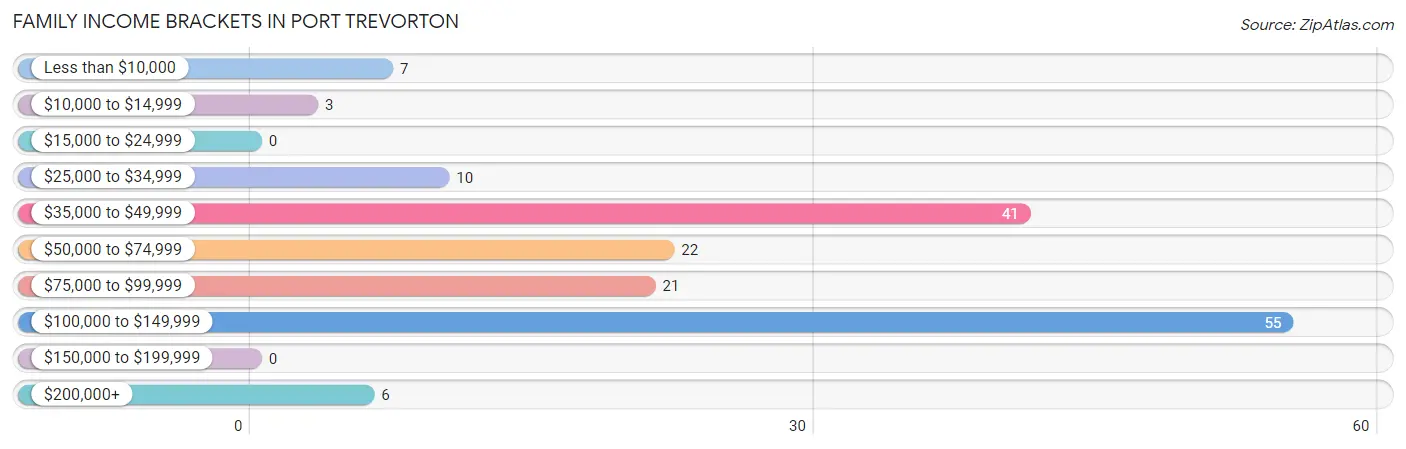
| Income Bracket | # Families | % Families |
| Less than $10,000 | 7 | 4.2% |
| $10,000 to $14,999 | 3 | 1.8% |
| $15,000 to $24,999 | 0 | 0.0% |
| $25,000 to $34,999 | 10 | 6.1% |
| $35,000 to $49,999 | 41 | 24.8% |
| $50,000 to $74,999 | 22 | 13.3% |
| $75,000 to $99,999 | 21 | 12.7% |
| $100,000 to $149,999 | 55 | 33.3% |
| $150,000 to $199,999 | 0 | 0.0% |
| $200,000+ | 6 | 3.6% |
Family Income by Famaliy Size in Port Trevorton
3-person families (24 | 14.5%) account for the highest median family income in Port Trevorton with $100,833 per family, while 3-person families (24 | 14.5%) have the highest median income of $33,611 per family member.
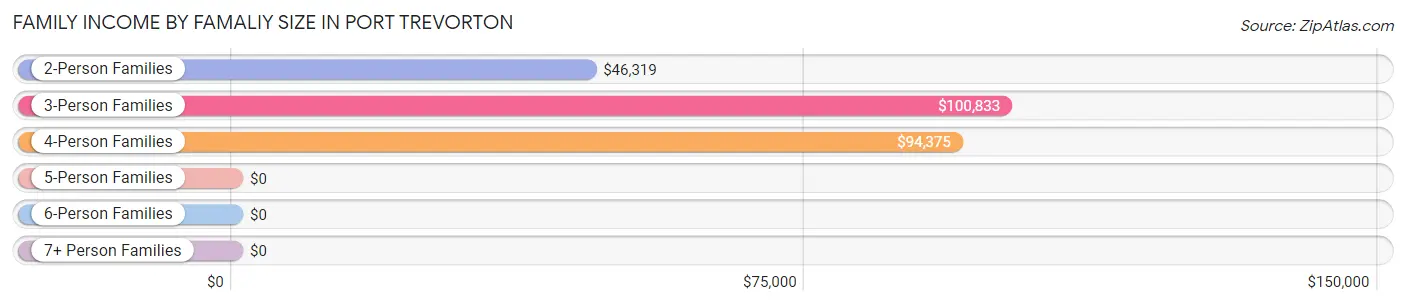
| Income Bracket | # Families | Median Income |
| 2-Person Families | 91 (55.1%) | $46,319 |
| 3-Person Families | 24 (14.5%) | $100,833 |
| 4-Person Families | 28 (17.0%) | $94,375 |
| 5-Person Families | 1 (0.6%) | $0 |
| 6-Person Families | 3 (1.8%) | $0 |
| 7+ Person Families | 18 (10.9%) | $0 |
| Total | 165 (100.0%) | $69,375 |
Family Income by Number of Earners in Port Trevorton
The median family income in Port Trevorton is $69,375, with families comprising 3+ earners (28) having the highest median family income of $132,857, while families with no earners (35) have the lowest median family income of $37,292, accounting for 17.0% and 21.2% of families, respectively.
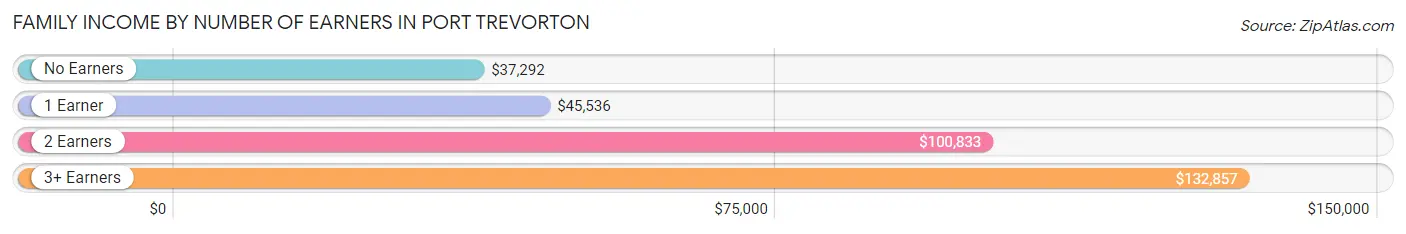
| Number of Earners | # Families | Median Income |
| No Earners | 35 (21.2%) | $37,292 |
| 1 Earner | 36 (21.8%) | $45,536 |
| 2 Earners | 66 (40.0%) | $100,833 |
| 3+ Earners | 28 (17.0%) | $132,857 |
| Total | 165 (100.0%) | $69,375 |
Household Income in Port Trevorton
Household Income Brackets in Port Trevorton
With 55 households falling in the category, the $100,000 to $149,999 income range is the most frequent in Port Trevorton, accounting for 27.6% of all households.
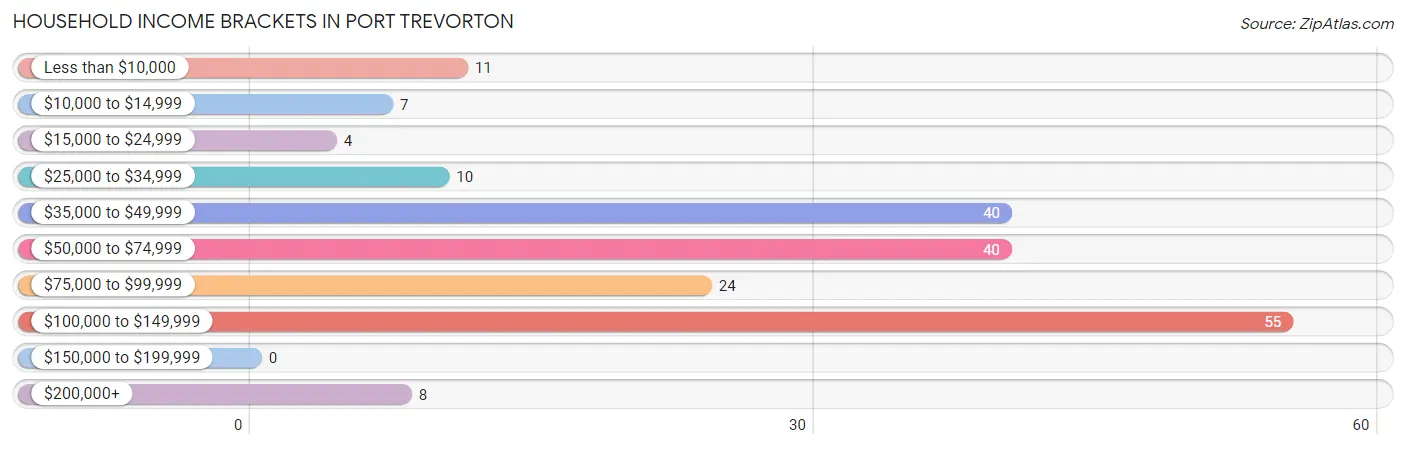
| Income Bracket | # Households | % Households |
| Less than $10,000 | 11 | 5.5% |
| $10,000 to $14,999 | 7 | 3.5% |
| $15,000 to $24,999 | 4 | 2.0% |
| $25,000 to $34,999 | 10 | 5.0% |
| $35,000 to $49,999 | 40 | 20.1% |
| $50,000 to $74,999 | 40 | 20.1% |
| $75,000 to $99,999 | 24 | 12.1% |
| $100,000 to $149,999 | 55 | 27.6% |
| $150,000 to $199,999 | 0 | 0.0% |
| $200,000+ | 8 | 4.0% |
Household Income by Householder Age in Port Trevorton
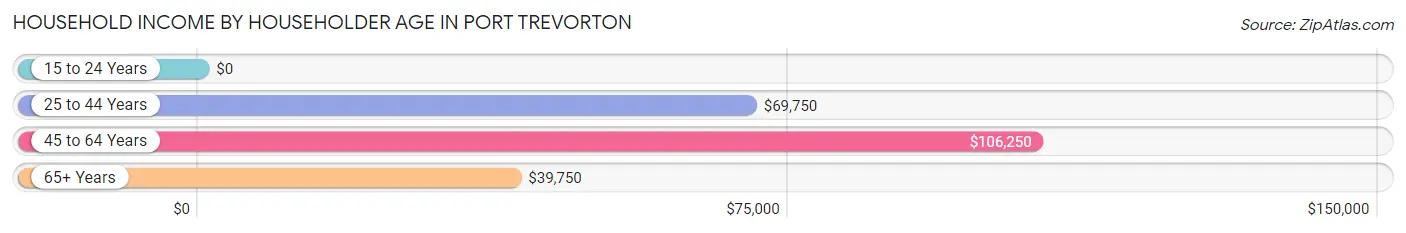
The median household income in Port Trevorton is $67,917, with the highest median household income of $106,250 found in the 45 to 64 years age bracket for the primary householder. A total of 74 households (37.2%) fall into this category. Meanwhile, the 15 to 24 years age bracket for the primary householder has the lowest median household income of $0, with 5 households (2.5%) in this group.
| Income Bracket | # Households | Median Income |
| 15 to 24 Years | 5 (2.5%) | $0 |
| 25 to 44 Years | 65 (32.7%) | $69,750 |
| 45 to 64 Years | 74 (37.2%) | $106,250 |
| 65+ Years | 55 (27.6%) | $39,750 |
| Total | 199 (100.0%) | $67,917 |
Poverty in Port Trevorton
Income Below Poverty by Sex and Age in Port Trevorton
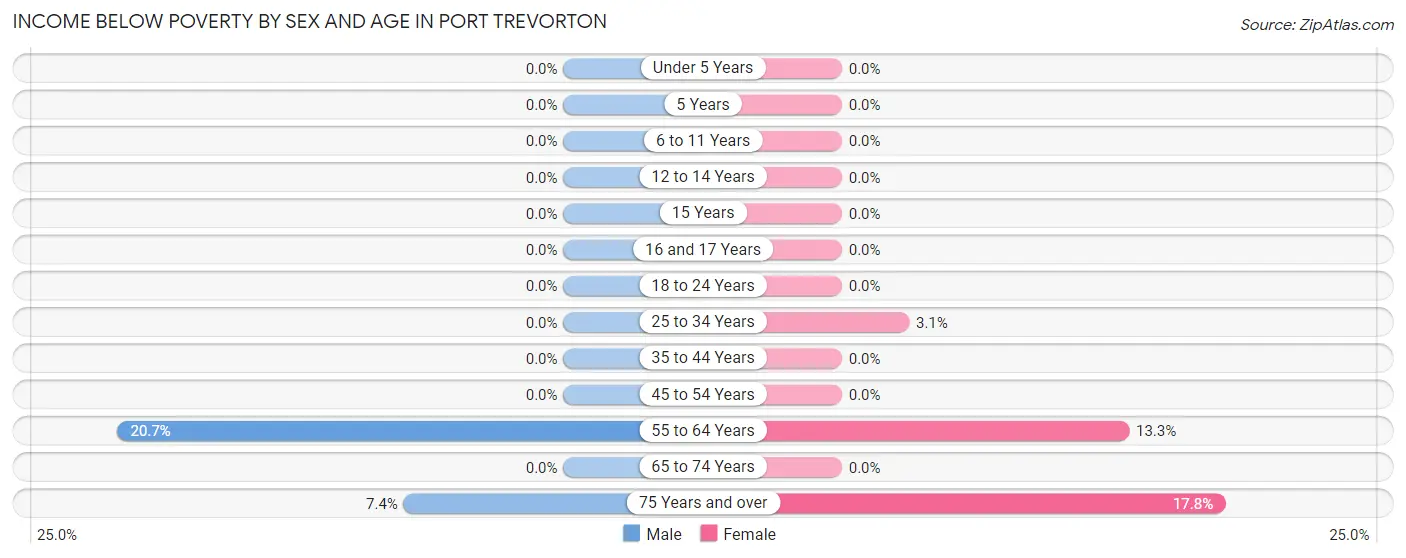
With 3.7% poverty level for males and 6.3% for females among the residents of Port Trevorton, 55 to 64 year old males and 75 year old and over females are the most vulnerable to poverty, with 12 males (20.7%) and 8 females (17.8%) in their respective age groups living below the poverty level.
| Age Bracket | Male | Female |
| Under 5 Years | 0 (0.0%) | 0 (0.0%) |
| 5 Years | 0 (0.0%) | 0 (0.0%) |
| 6 to 11 Years | 0 (0.0%) | 0 (0.0%) |
| 12 to 14 Years | 0 (0.0%) | 0 (0.0%) |
| 15 Years | 0 (0.0%) | 0 (0.0%) |
| 16 and 17 Years | 0 (0.0%) | 0 (0.0%) |
| 18 to 24 Years | 0 (0.0%) | 0 (0.0%) |
| 25 to 34 Years | 0 (0.0%) | 2 (3.1%) |
| 35 to 44 Years | 0 (0.0%) | 0 (0.0%) |
| 45 to 54 Years | 0 (0.0%) | 0 (0.0%) |
| 55 to 64 Years | 12 (20.7%) | 6 (13.3%) |
| 65 to 74 Years | 0 (0.0%) | 0 (0.0%) |
| 75 Years and over | 2 (7.4%) | 8 (17.8%) |
| Total | 14 (3.7%) | 16 (6.3%) |
Income Above Poverty by Sex and Age in Port Trevorton
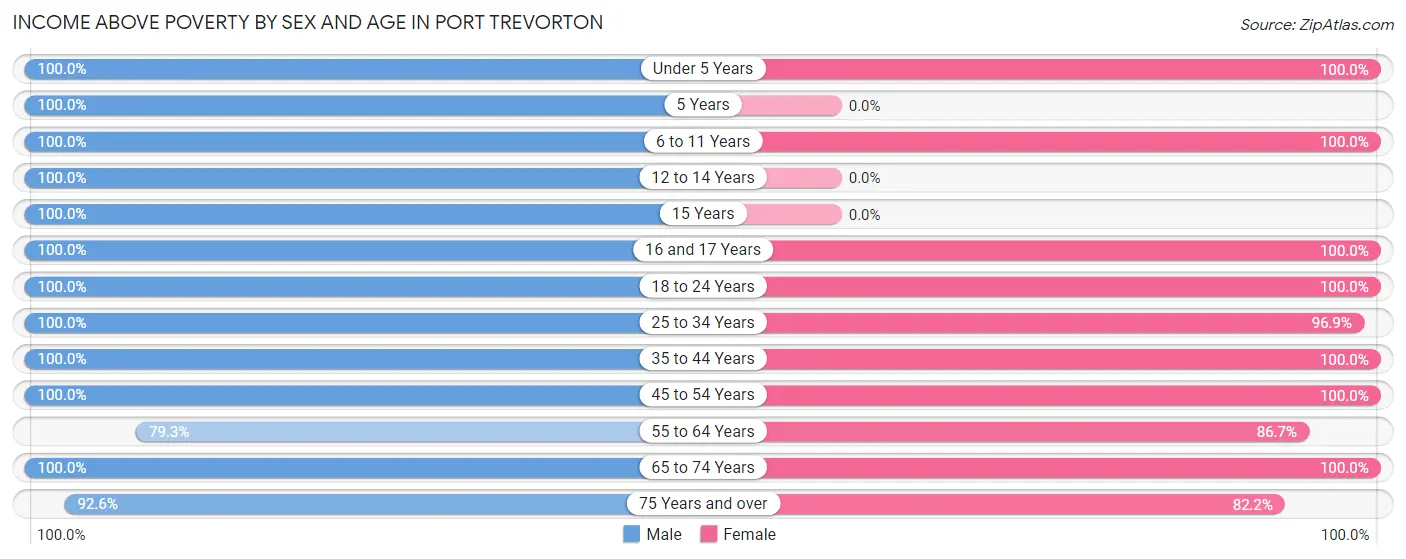
According to the poverty statistics in Port Trevorton, males aged under 5 years and females aged under 5 years are the age groups that are most secure financially, with 100.0% of males and 100.0% of females in these age groups living above the poverty line.
| Age Bracket | Male | Female |
| Under 5 Years | 33 (100.0%) | 10 (100.0%) |
| 5 Years | 12 (100.0%) | 0 (0.0%) |
| 6 to 11 Years | 46 (100.0%) | 4 (100.0%) |
| 12 to 14 Years | 5 (100.0%) | 0 (0.0%) |
| 15 Years | 12 (100.0%) | 0 (0.0%) |
| 16 and 17 Years | 17 (100.0%) | 5 (100.0%) |
| 18 to 24 Years | 10 (100.0%) | 13 (100.0%) |
| 25 to 34 Years | 54 (100.0%) | 62 (96.9%) |
| 35 to 44 Years | 50 (100.0%) | 27 (100.0%) |
| 45 to 54 Years | 29 (100.0%) | 17 (100.0%) |
| 55 to 64 Years | 46 (79.3%) | 39 (86.7%) |
| 65 to 74 Years | 21 (100.0%) | 25 (100.0%) |
| 75 Years and over | 25 (92.6%) | 37 (82.2%) |
| Total | 360 (96.3%) | 239 (93.7%) |
Income Below Poverty Among Married-Couple Families in Port Trevorton
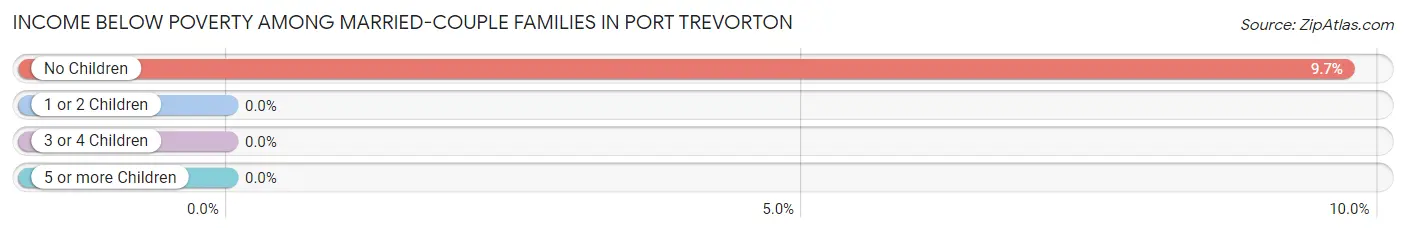
The poverty statistics for married-couple families in Port Trevorton show that 5.6% or 7 of the total 125 families live below the poverty line. Families with no children have the highest poverty rate of 9.7%, comprising of 7 families. On the other hand, families with 1 or 2 children have the lowest poverty rate of 0.0%, which includes 0 families.
| Children | Above Poverty | Below Poverty |
| No Children | 65 (90.3%) | 7 (9.7%) |
| 1 or 2 Children | 46 (100.0%) | 0 (0.0%) |
| 3 or 4 Children | 3 (100.0%) | 0 (0.0%) |
| 5 or more Children | 4 (100.0%) | 0 (0.0%) |
| Total | 118 (94.4%) | 7 (5.6%) |
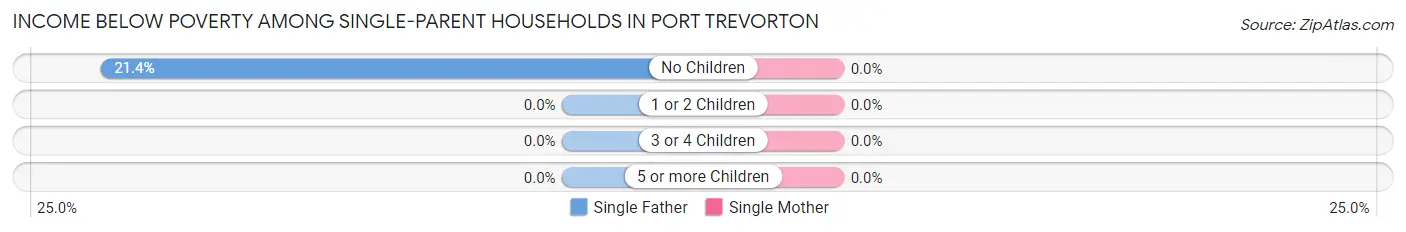
Income Below Poverty Among Single-Parent Households in Port Trevorton
| Children | Single Father | Single Mother |
| No Children | 3 (21.4%) | 0 (0.0%) |
| 1 or 2 Children | 0 (0.0%) | 0 (0.0%) |
| 3 or 4 Children | 0 (0.0%) | 0 (0.0%) |
| 5 or more Children | 0 (0.0%) | 0 (0.0%) |
| Total | 3 (17.6%) | 0 (0.0%) |
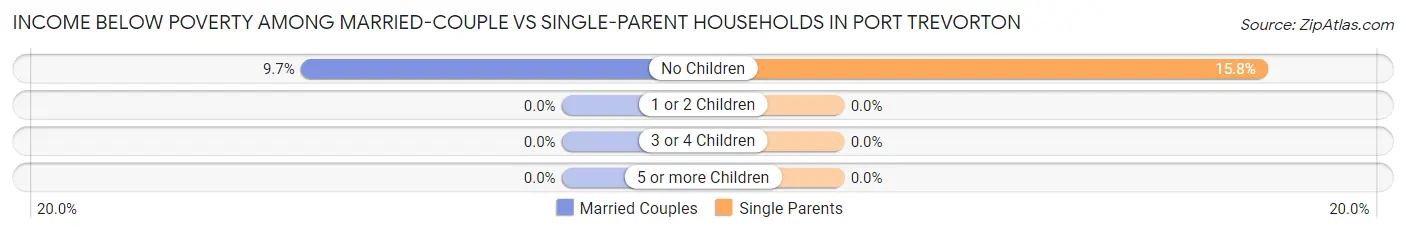
Income Below Poverty Among Married-Couple vs Single-Parent Households in Port Trevorton
The poverty data for Port Trevorton shows that 7 of the married-couple family households (5.6%) and 3 of the single-parent households (7.5%) are living below the poverty level. Within the married-couple family households, those with no children have the highest poverty rate, with 7 households (9.7%) falling below the poverty line. Among the single-parent households, those with no children have the highest poverty rate, with 3 household (15.8%) living below poverty.
| Children | Married-Couple Families | Single-Parent Households |
| No Children | 7 (9.7%) | 3 (15.8%) |
| 1 or 2 Children | 0 (0.0%) | 0 (0.0%) |
| 3 or 4 Children | 0 (0.0%) | 0 (0.0%) |
| 5 or more Children | 0 (0.0%) | 0 (0.0%) |
| Total | 7 (5.6%) | 3 (7.5%) |
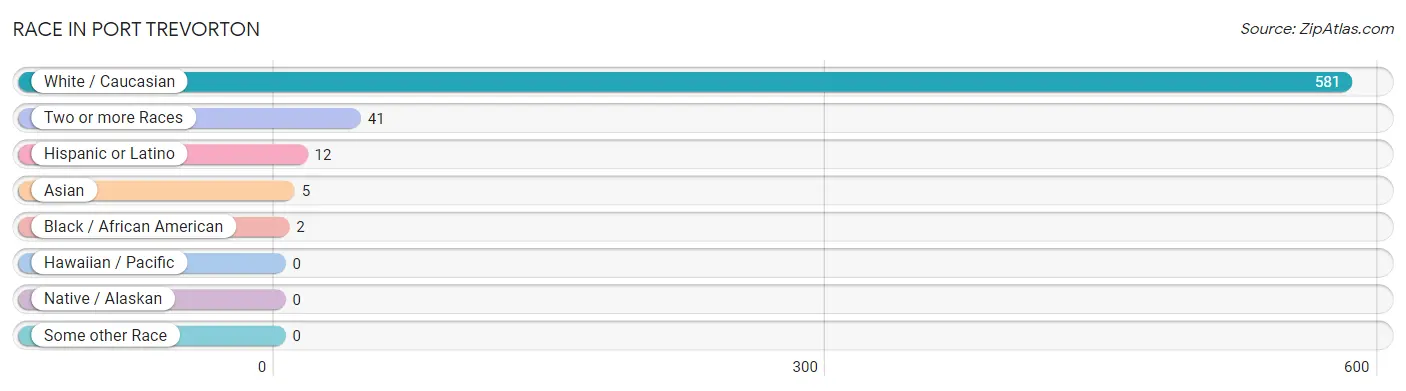
Race in Port Trevorton
The most populous races in Port Trevorton are White / Caucasian (581 | 92.4%), Two or more Races (41 | 6.5%), and Hispanic or Latino (12 | 1.9%).
| Race | # Population | % Population |
| Asian | 5 | 0.8% |
| Black / African American | 2 | 0.3% |
| Hawaiian / Pacific | 0 | 0.0% |
| Hispanic or Latino | 12 | 1.9% |
| Native / Alaskan | 0 | 0.0% |
| White / Caucasian | 581 | 92.4% |
| Two or more Races | 41 | 6.5% |
| Some other Race | 0 | 0.0% |
| Total | 629 | 100.0% |
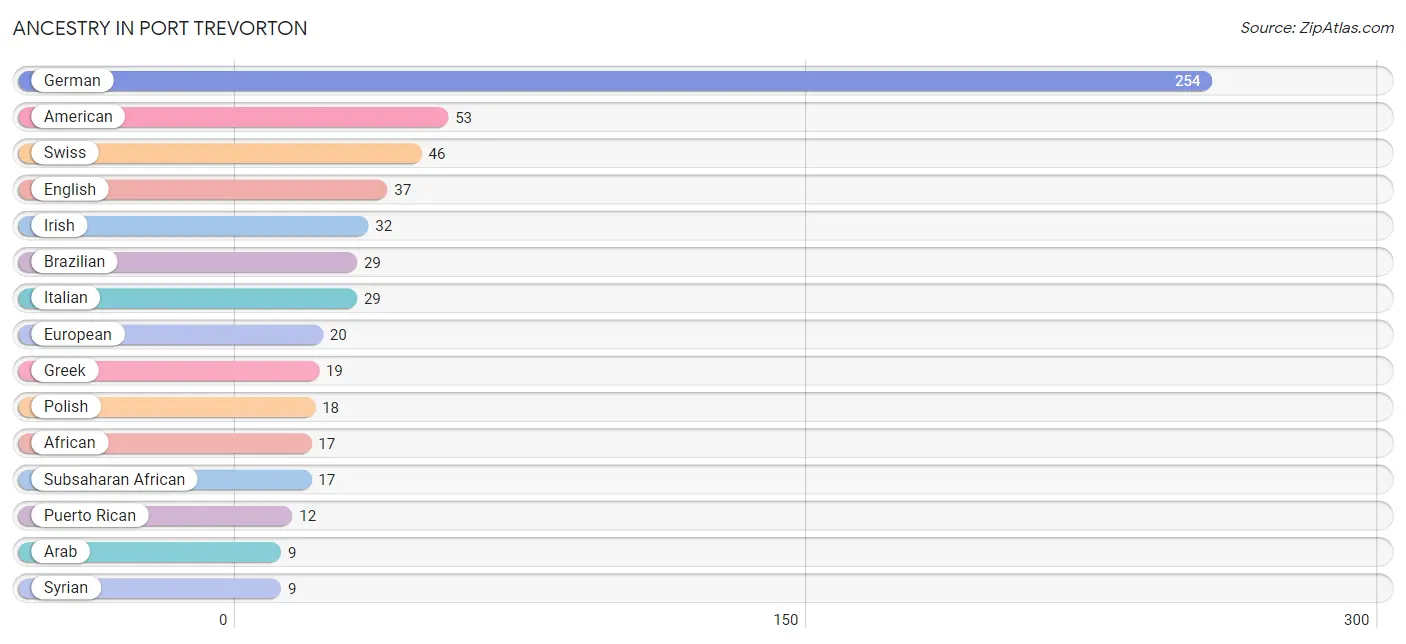
Ancestry in Port Trevorton
The most populous ancestries reported in Port Trevorton are German (254 | 40.4%), American (53 | 8.4%), Swiss (46 | 7.3%), English (37 | 5.9%), and Irish (32 | 5.1%), together accounting for 67.1% of all Port Trevorton residents.
| Ancestry | # Population | % Population |
| African | 17 | 2.7% |
| American | 53 | 8.4% |
| Arab | 9 | 1.4% |
| Brazilian | 29 | 4.6% |
| British | 3 | 0.5% |
| Dutch | 2 | 0.3% |
| Eastern European | 3 | 0.5% |
| English | 37 | 5.9% |
| European | 20 | 3.2% |
| French | 1 | 0.2% |
| German | 254 | 40.4% |
| Greek | 19 | 3.0% |
| Indian (Asian) | 3 | 0.5% |
| Irish | 32 | 5.1% |
| Italian | 29 | 4.6% |
| Pennsylvania German | 2 | 0.3% |
| Polish | 18 | 2.9% |
| Puerto Rican | 12 | 1.9% |
| Russian | 2 | 0.3% |
| Scandinavian | 5 | 0.8% |
| Scottish | 2 | 0.3% |
| Subsaharan African | 17 | 2.7% |
| Swedish | 3 | 0.5% |
| Swiss | 46 | 7.3% |
| Syrian | 9 | 1.4% |
| Thai | 2 | 0.3% |
| Welsh | 2 | 0.3% | View All 27 Rows |
Immigrants in Port Trevorton
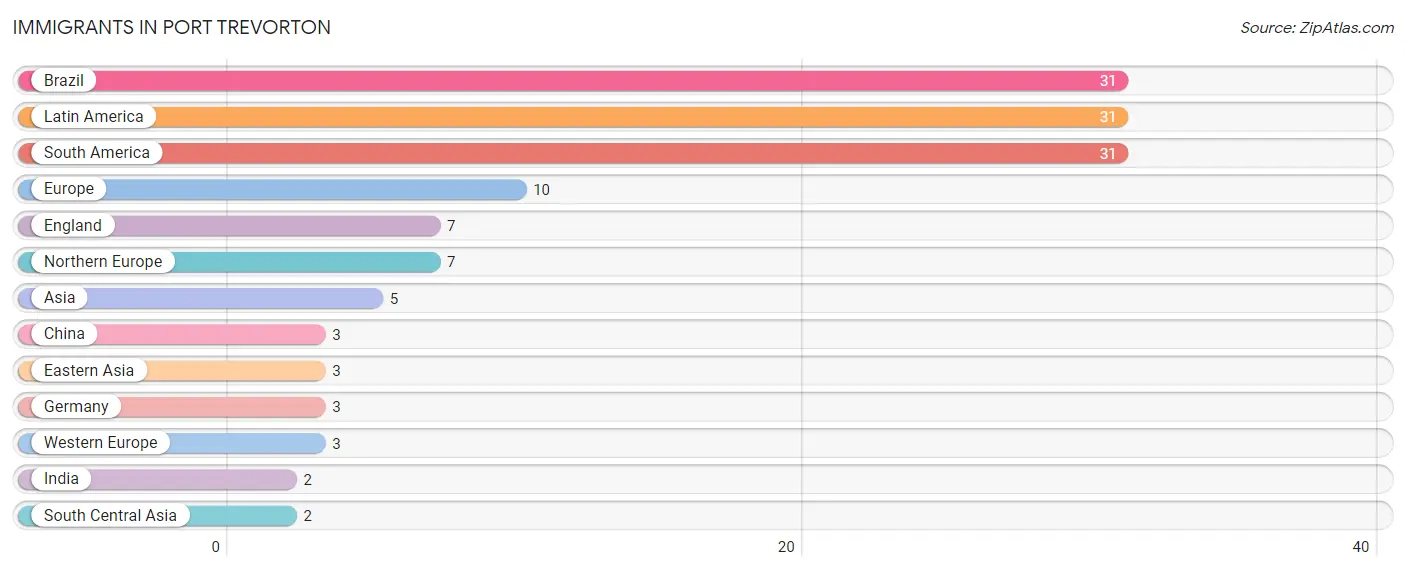
The most numerous immigrant groups reported in Port Trevorton came from Brazil (31 | 4.9%), Latin America (31 | 4.9%), South America (31 | 4.9%), Europe (10 | 1.6%), and England (7 | 1.1%), together accounting for 17.5% of all Port Trevorton residents.
| Immigration Origin | # Population | % Population |
| Asia | 5 | 0.8% |
| Brazil | 31 | 4.9% |
| China | 3 | 0.5% |
| Eastern Asia | 3 | 0.5% |
| England | 7 | 1.1% |
| Europe | 10 | 1.6% |
| Germany | 3 | 0.5% |
| India | 2 | 0.3% |
| Latin America | 31 | 4.9% |
| Northern Europe | 7 | 1.1% |
| South America | 31 | 4.9% |
| South Central Asia | 2 | 0.3% |
| Western Europe | 3 | 0.5% | View All 13 Rows |
Sex and Age in Port Trevorton
Sex and Age in Port Trevorton
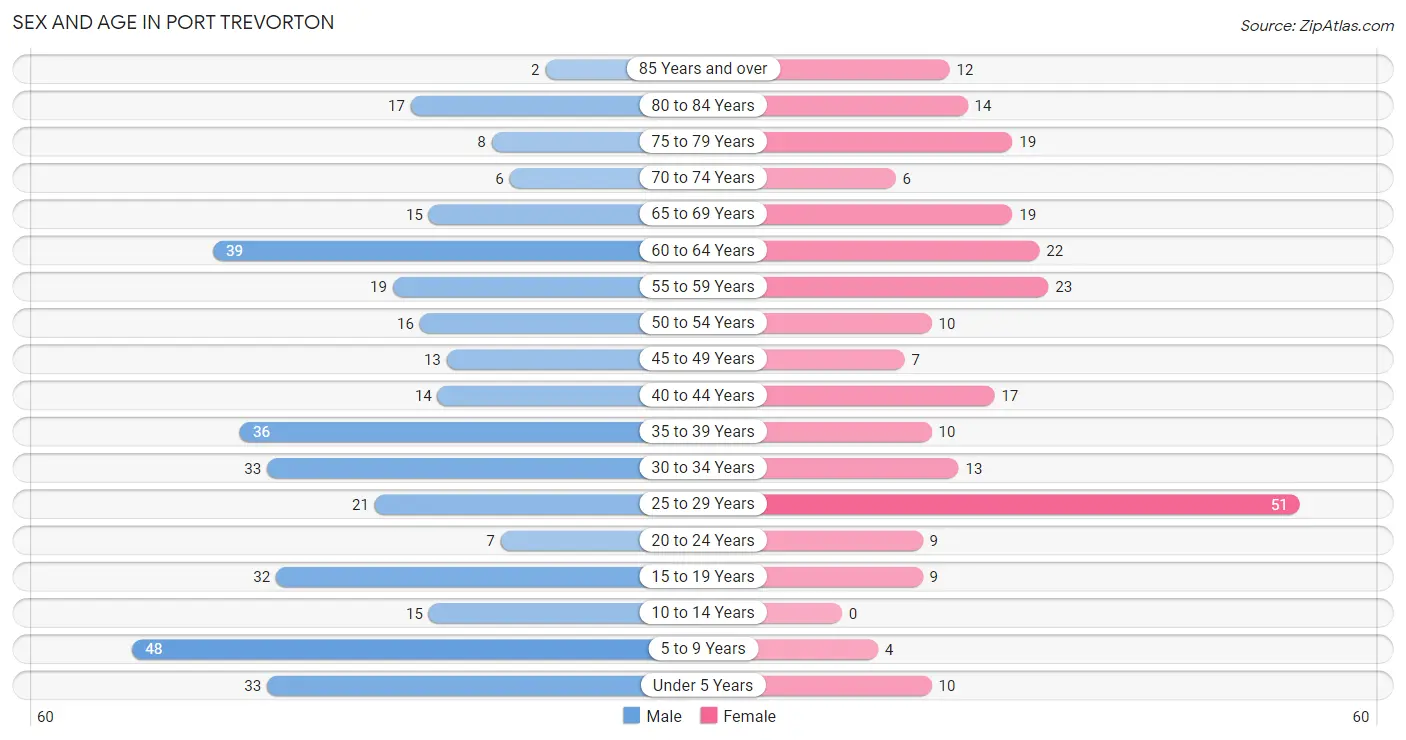
The most populous age groups in Port Trevorton are 5 to 9 Years (48 | 12.8%) for men and 25 to 29 Years (51 | 20.0%) for women.
| Age Bracket | Male | Female |
| Under 5 Years | 33 (8.8%) | 10 (3.9%) |
| 5 to 9 Years | 48 (12.8%) | 4 (1.6%) |
| 10 to 14 Years | 15 (4.0%) | 0 (0.0%) |
| 15 to 19 Years | 32 (8.6%) | 9 (3.5%) |
| 20 to 24 Years | 7 (1.9%) | 9 (3.5%) |
| 25 to 29 Years | 21 (5.6%) | 51 (20.0%) |
| 30 to 34 Years | 33 (8.8%) | 13 (5.1%) |
| 35 to 39 Years | 36 (9.6%) | 10 (3.9%) |
| 40 to 44 Years | 14 (3.7%) | 17 (6.7%) |
| 45 to 49 Years | 13 (3.5%) | 7 (2.8%) |
| 50 to 54 Years | 16 (4.3%) | 10 (3.9%) |
| 55 to 59 Years | 19 (5.1%) | 23 (9.0%) |
| 60 to 64 Years | 39 (10.4%) | 22 (8.6%) |
| 65 to 69 Years | 15 (4.0%) | 19 (7.4%) |
| 70 to 74 Years | 6 (1.6%) | 6 (2.4%) |
| 75 to 79 Years | 8 (2.1%) | 19 (7.4%) |
| 80 to 84 Years | 17 (4.5%) | 14 (5.5%) |
| 85 Years and over | 2 (0.5%) | 12 (4.7%) |
| Total | 374 (100.0%) | 255 (100.0%) |
Families and Households in Port Trevorton
Median Family Size in Port Trevorton
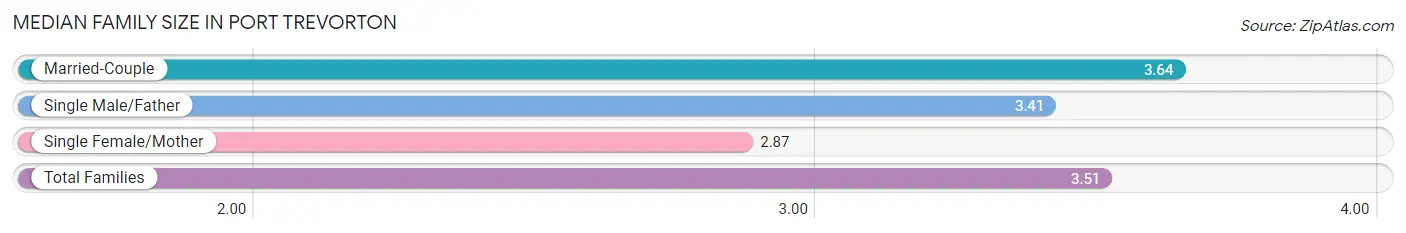
The median family size in Port Trevorton is 3.51 persons per family, with married-couple families (125 | 75.8%) accounting for the largest median family size of 3.64 persons per family. On the other hand, single female/mother families (23 | 13.9%) represent the smallest median family size with 2.87 persons per family.
| Family Type | # Families | Family Size |
| Married-Couple | 125 (75.8%) | 3.64 |
| Single Male/Father | 17 (10.3%) | 3.41 |
| Single Female/Mother | 23 (13.9%) | 2.87 |
| Total Families | 165 (100.0%) | 3.51 |
Median Household Size in Port Trevorton
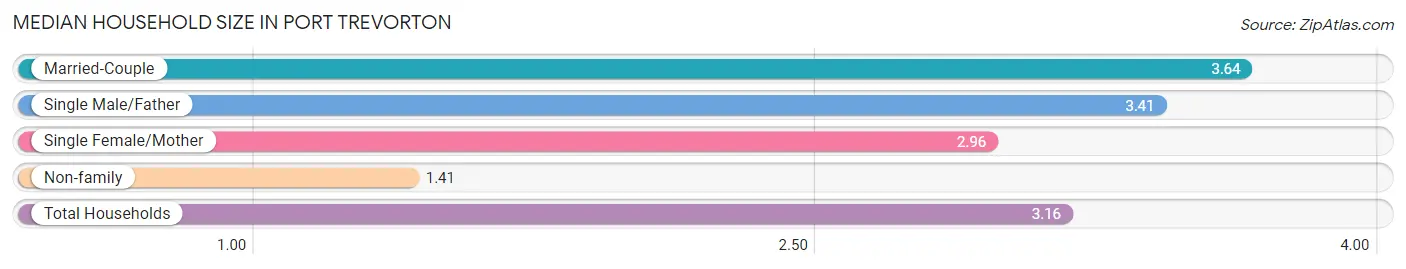
The median household size in Port Trevorton is 3.16 persons per household, with married-couple households (125 | 62.8%) accounting for the largest median household size of 3.64 persons per household. non-family households (34 | 17.1%) represent the smallest median household size with 1.41 persons per household.
| Household Type | # Households | Household Size |
| Married-Couple | 125 (62.8%) | 3.64 |
| Single Male/Father | 17 (8.5%) | 3.41 |
| Single Female/Mother | 23 (11.6%) | 2.96 |
| Non-family | 34 (17.1%) | 1.41 |
| Total Households | 199 (100.0%) | 3.16 |
Household Size by Marriage Status in Port Trevorton
Out of a total of 199 households in Port Trevorton, 165 (82.9%) are family households, while 34 (17.1%) are nonfamily households. The most numerous type of family households are 2-person households, comprising 86, and the most common type of nonfamily households are 1-person households, comprising 22.
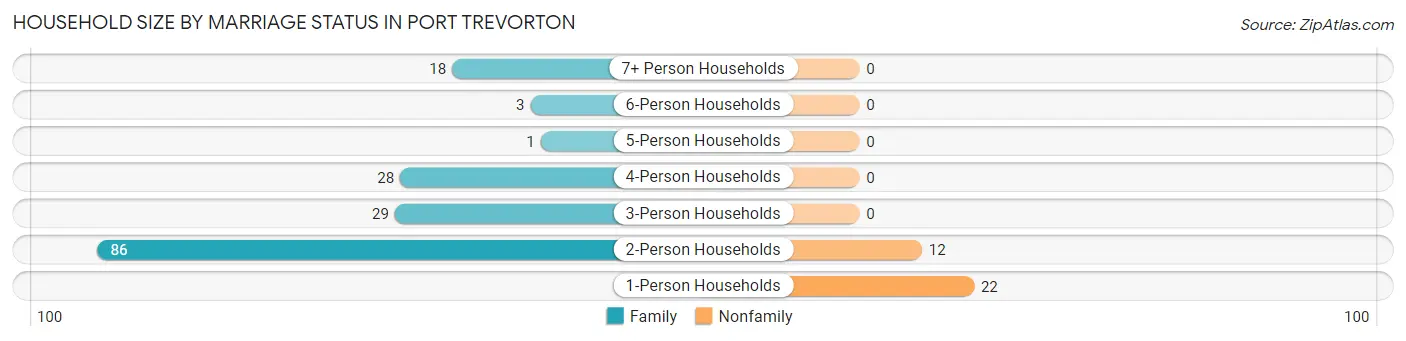
| Household Size | Family Households | Nonfamily Households |
| 1-Person Households | - | 22 (11.1%) |
| 2-Person Households | 86 (43.2%) | 12 (6.0%) |
| 3-Person Households | 29 (14.6%) | 0 (0.0%) |
| 4-Person Households | 28 (14.1%) | 0 (0.0%) |
| 5-Person Households | 1 (0.5%) | 0 (0.0%) |
| 6-Person Households | 3 (1.5%) | 0 (0.0%) |
| 7+ Person Households | 18 (9.0%) | 0 (0.0%) |
| Total | 165 (82.9%) | 34 (17.1%) |
Female Fertility in Port Trevorton
Fertility by Age in Port Trevorton
Average fertility rate in Port Trevorton is 43.0 births per 1,000 women. Women in the age bracket of 20 to 34 years have the highest fertility rate with 68.0 births per 1,000 women. Women in the age bracket of 20 to 34 years acount for 100.0% of all women with births.
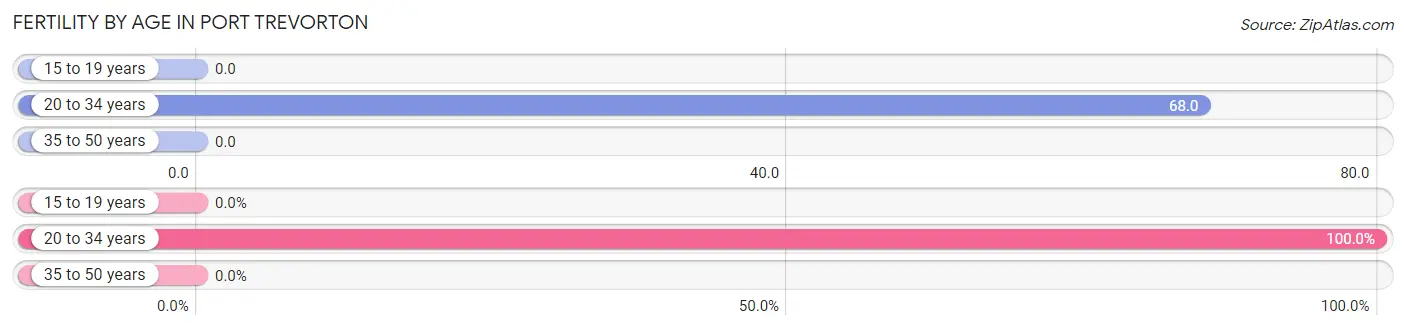
| Age Bracket | Women with Births | Births / 1,000 Women |
| 15 to 19 years | 0 (0.0%) | 0.0 |
| 20 to 34 years | 5 (100.0%) | 68.0 |
| 35 to 50 years | 0 (0.0%) | 0.0 |
| Total | 5 (100.0%) | 43.0 |
Fertility by Age by Marriage Status in Port Trevorton
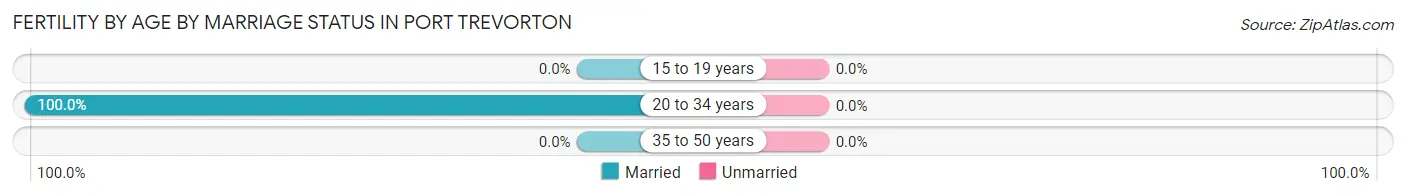
| Age Bracket | Married | Unmarried |
| 15 to 19 years | 0 (0.0%) | 0 (0.0%) |
| 20 to 34 years | 5 (100.0%) | 0 (0.0%) |
| 35 to 50 years | 0 (0.0%) | 0 (0.0%) |
| Total | 5 (100.0%) | 0 (0.0%) |
Fertility by Education in Port Trevorton
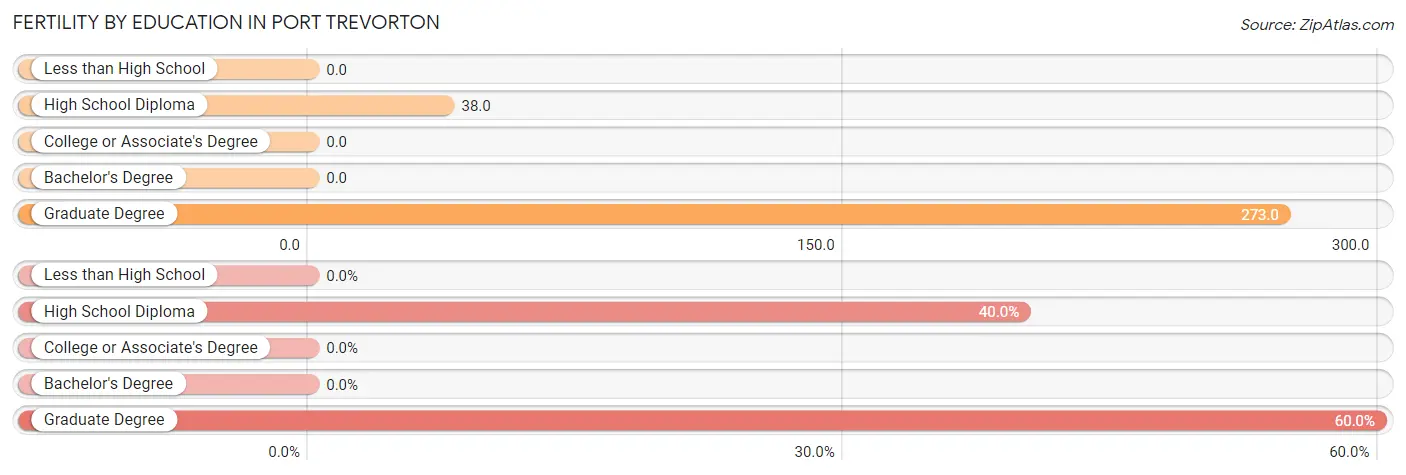
| Educational Attainment | Women with Births | Births / 1,000 Women |
| Less than High School | 0 (0.0%) | 0.0 |
| High School Diploma | 2 (40.0%) | 38.0 |
| College or Associate's Degree | 0 (0.0%) | 0.0 |
| Bachelor's Degree | 0 (0.0%) | 0.0 |
| Graduate Degree | 3 (60.0%) | 273.0 |
| Total | 5 (100.0%) | 43.0 |
Fertility by Education by Marriage Status in Port Trevorton
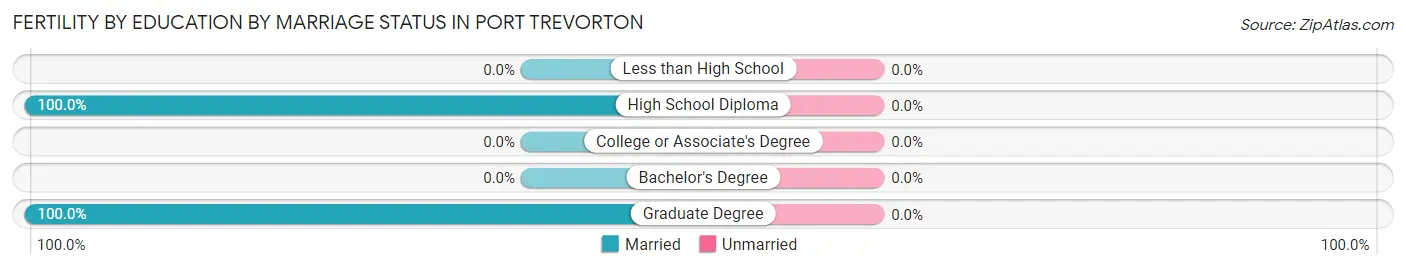
| Educational Attainment | Married | Unmarried |
| Less than High School | 0 (0.0%) | 0 (0.0%) |
| High School Diploma | 2 (100.0%) | 0 (0.0%) |
| College or Associate's Degree | 0 (0.0%) | 0 (0.0%) |
| Bachelor's Degree | 0 (0.0%) | 0 (0.0%) |
| Graduate Degree | 3 (100.0%) | 0 (0.0%) |
| Total | 5 (100.0%) | 0 (0.0%) |
Employment Characteristics in Port Trevorton
Employment by Class of Employer in Port Trevorton
Among the 308 employed individuals in Port Trevorton, private company employees (229 | 74.4%), not-for-profit organizations (25 | 8.1%), and self-employed (not incorporated) (24 | 7.8%) make up the most common classes of employment.
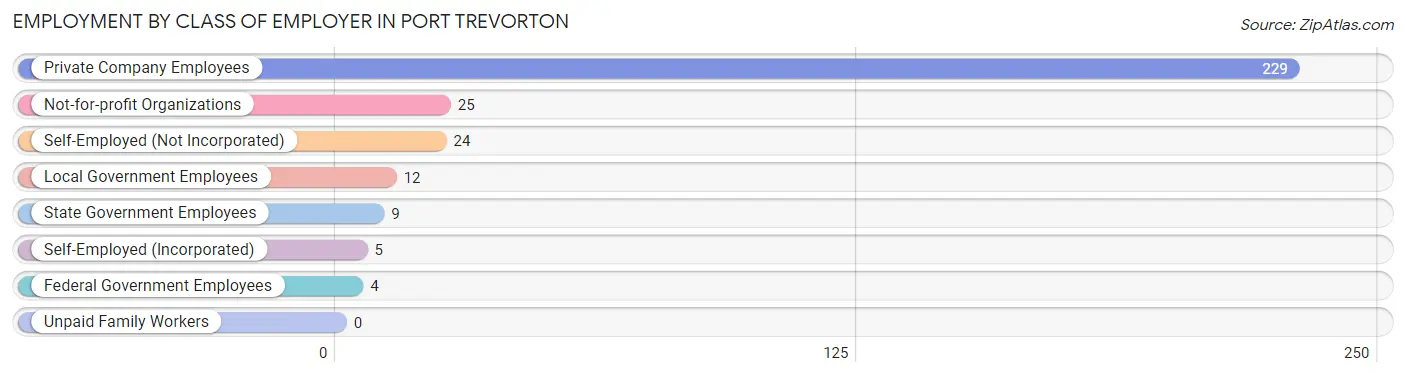
| Employer Class | # Employees | % Employees |
| Private Company Employees | 229 | 74.4% |
| Self-Employed (Incorporated) | 5 | 1.6% |
| Self-Employed (Not Incorporated) | 24 | 7.8% |
| Not-for-profit Organizations | 25 | 8.1% |
| Local Government Employees | 12 | 3.9% |
| State Government Employees | 9 | 2.9% |
| Federal Government Employees | 4 | 1.3% |
| Unpaid Family Workers | 0 | 0.0% |
| Total | 308 | 100.0% |
Employment Status by Age in Port Trevorton
According to the labor force statistics for Port Trevorton, out of the total population over 16 years of age (507), 63.3% or 321 individuals are in the labor force, with 2.5% or 8 of them unemployed. The age group with the highest labor force participation rate is 20 to 24 years, with 100.0% or 16 individuals in the labor force. Within the labor force, the 30 to 34 years age range has the highest percentage of unemployed individuals, with 13.3% or 6 of them being unemployed.
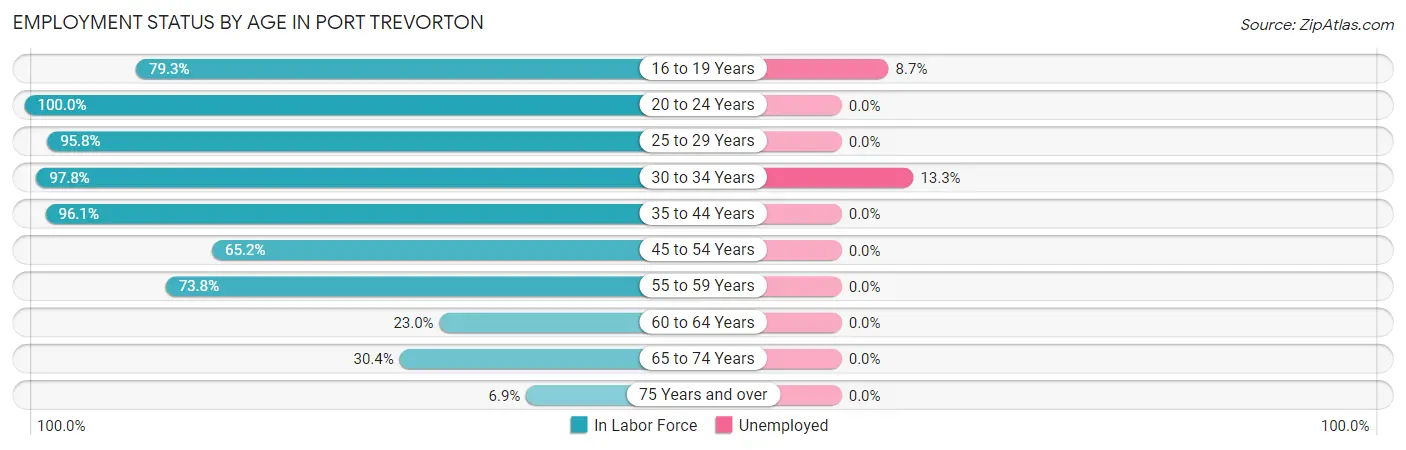
| Age Bracket | In Labor Force | Unemployed |
| 16 to 19 Years | 23 (79.3%) | 2 (8.7%) |
| 20 to 24 Years | 16 (100.0%) | 0 (0.0%) |
| 25 to 29 Years | 69 (95.8%) | 0 (0.0%) |
| 30 to 34 Years | 45 (97.8%) | 6 (13.3%) |
| 35 to 44 Years | 74 (96.1%) | 0 (0.0%) |
| 45 to 54 Years | 30 (65.2%) | 0 (0.0%) |
| 55 to 59 Years | 31 (73.8%) | 0 (0.0%) |
| 60 to 64 Years | 14 (23.0%) | 0 (0.0%) |
| 65 to 74 Years | 14 (30.4%) | 0 (0.0%) |
| 75 Years and over | 5 (6.9%) | 0 (0.0%) |
| Total | 321 (63.3%) | 8 (2.5%) |
Employment Status by Educational Attainment in Port Trevorton
According to labor force statistics for Port Trevorton, 76.5% of individuals (263) out of the total population between 25 and 64 years of age (344) are in the labor force, with 2.3% or 6 of them being unemployed. The group with the highest labor force participation rate are those with the educational attainment of bachelor's degree or higher, with 97.1% or 34 individuals in the labor force. Within the labor force, individuals with high school diploma education have the highest percentage of unemployment, with 4.6% or 6 of them being unemployed.
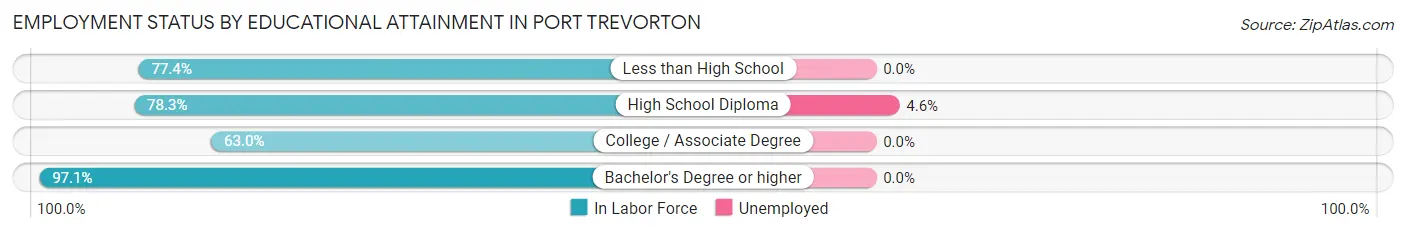
| Educational Attainment | In Labor Force | Unemployed |
| Less than High School | 48 (77.4%) | 0 (0.0%) |
| High School Diploma | 130 (78.3%) | 8 (4.6%) |
| College / Associate Degree | 51 (63.0%) | 0 (0.0%) |
| Bachelor's Degree or higher | 34 (97.1%) | 0 (0.0%) |
| Total | 263 (76.5%) | 8 (2.3%) |
Employment Occupations by Sex in Port Trevorton
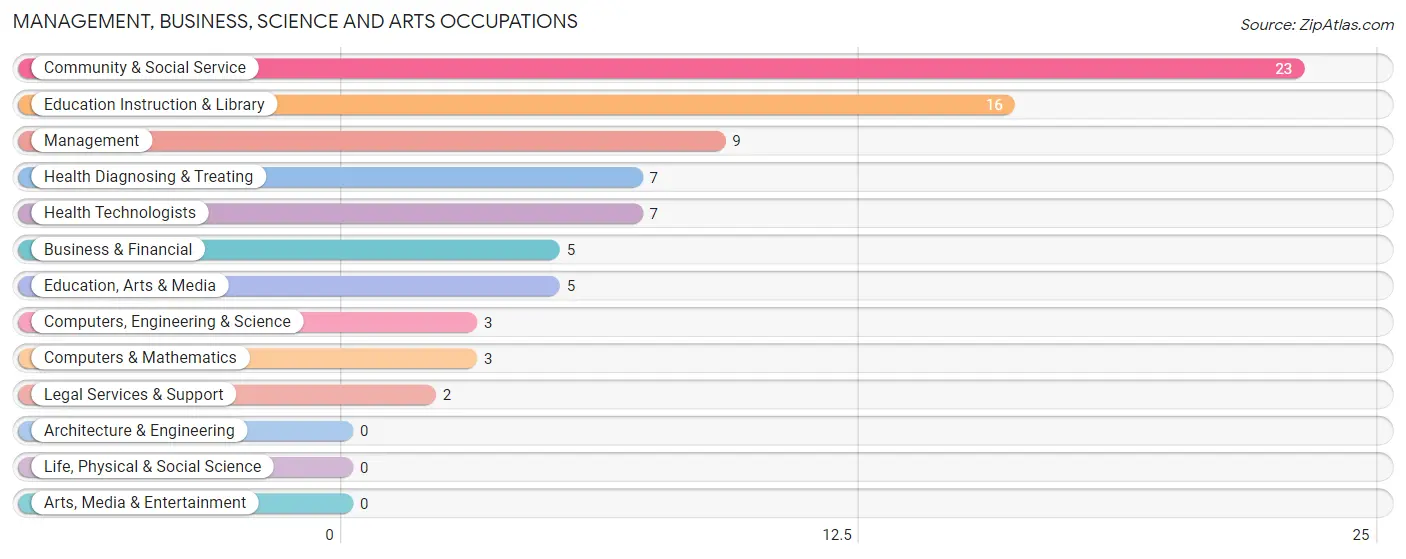
Management, Business, Science and Arts Occupations
The most common Management, Business, Science and Arts occupations in Port Trevorton are Community & Social Service (23 | 7.3%), Education Instruction & Library (16 | 5.1%), Management (9 | 2.9%), Health Diagnosing & Treating (7 | 2.2%), and Health Technologists (7 | 2.2%).
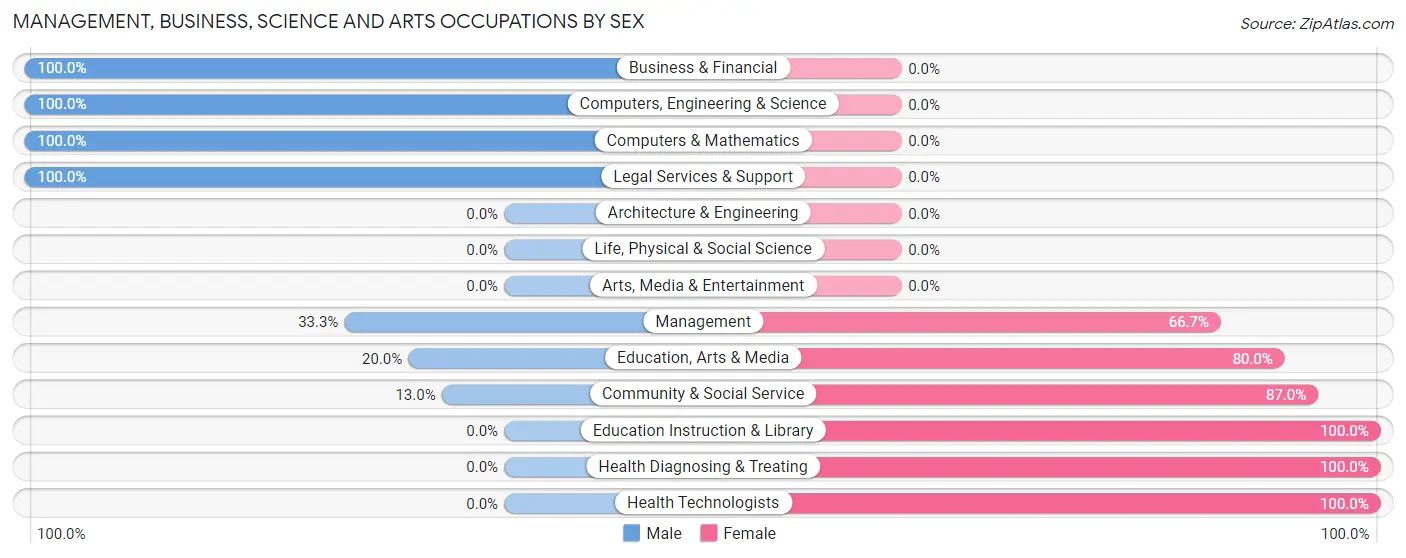
Management, Business, Science and Arts Occupations by Sex
Within the Management, Business, Science and Arts occupations in Port Trevorton, the most male-oriented occupations are Business & Financial (100.0%), Computers, Engineering & Science (100.0%), and Computers & Mathematics (100.0%), while the most female-oriented occupations are Education Instruction & Library (100.0%), Health Diagnosing & Treating (100.0%), and Health Technologists (100.0%).
| Occupation | Male | Female |
| Management | 3 (33.3%) | 6 (66.7%) |
| Business & Financial | 5 (100.0%) | 0 (0.0%) |
| Computers, Engineering & Science | 3 (100.0%) | 0 (0.0%) |
| Computers & Mathematics | 3 (100.0%) | 0 (0.0%) |
| Architecture & Engineering | 0 (0.0%) | 0 (0.0%) |
| Life, Physical & Social Science | 0 (0.0%) | 0 (0.0%) |
| Community & Social Service | 3 (13.0%) | 20 (87.0%) |
| Education, Arts & Media | 1 (20.0%) | 4 (80.0%) |
| Legal Services & Support | 2 (100.0%) | 0 (0.0%) |
| Education Instruction & Library | 0 (0.0%) | 16 (100.0%) |
| Arts, Media & Entertainment | 0 (0.0%) | 0 (0.0%) |
| Health Diagnosing & Treating | 0 (0.0%) | 7 (100.0%) |
| Health Technologists | 0 (0.0%) | 7 (100.0%) |
| Total (Category) | 14 (29.8%) | 33 (70.2%) |
| Total (Overall) | 187 (59.7%) | 126 (40.3%) |
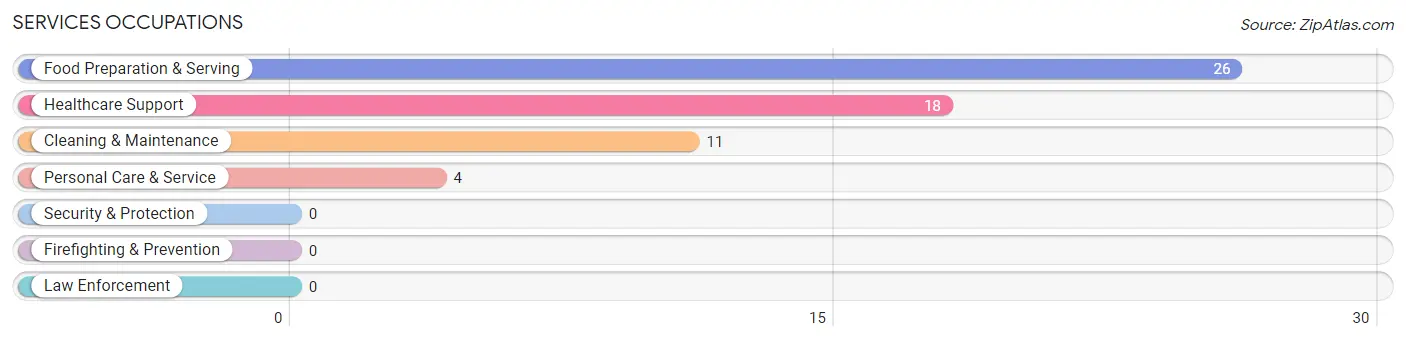
Services Occupations
The most common Services occupations in Port Trevorton are Food Preparation & Serving (26 | 8.3%), Healthcare Support (18 | 5.8%), Cleaning & Maintenance (11 | 3.5%), and Personal Care & Service (4 | 1.3%).
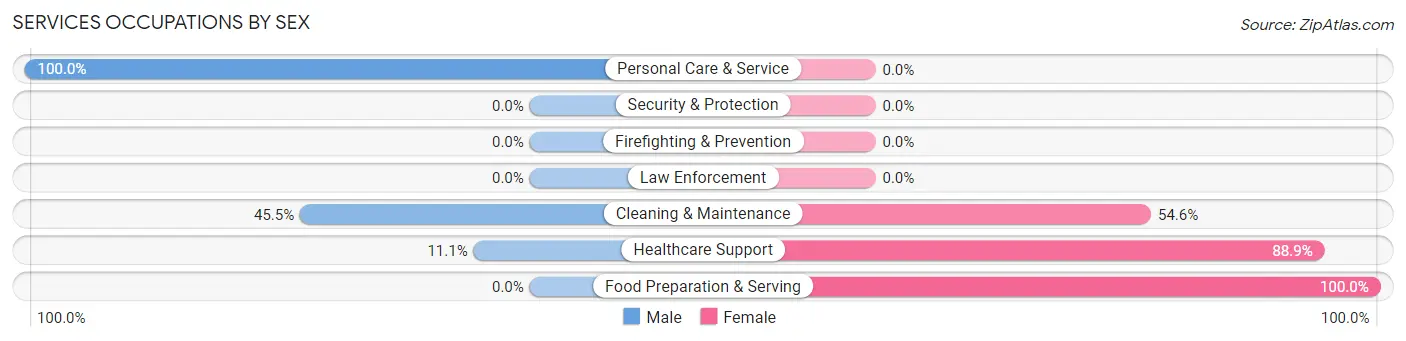
Services Occupations by Sex
Within the Services occupations in Port Trevorton, the most male-oriented occupations are Personal Care & Service (100.0%), Cleaning & Maintenance (45.5%), and Healthcare Support (11.1%), while the most female-oriented occupations are Food Preparation & Serving (100.0%), Healthcare Support (88.9%), and Cleaning & Maintenance (54.5%).
| Occupation | Male | Female |
| Healthcare Support | 2 (11.1%) | 16 (88.9%) |
| Security & Protection | 0 (0.0%) | 0 (0.0%) |
| Firefighting & Prevention | 0 (0.0%) | 0 (0.0%) |
| Law Enforcement | 0 (0.0%) | 0 (0.0%) |
| Food Preparation & Serving | 0 (0.0%) | 26 (100.0%) |
| Cleaning & Maintenance | 5 (45.5%) | 6 (54.5%) |
| Personal Care & Service | 4 (100.0%) | 0 (0.0%) |
| Total (Category) | 11 (18.6%) | 48 (81.4%) |
| Total (Overall) | 187 (59.7%) | 126 (40.3%) |
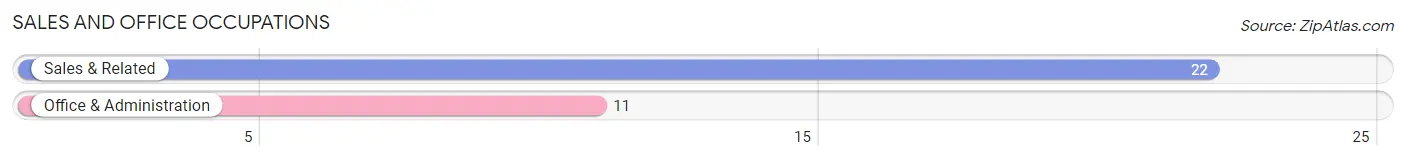
Sales and Office Occupations
The most common Sales and Office occupations in Port Trevorton are Sales & Related (22 | 7.0%), and Office & Administration (11 | 3.5%).
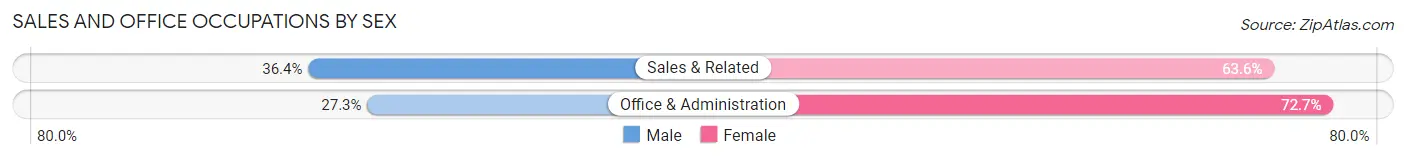
Sales and Office Occupations by Sex
| Occupation | Male | Female |
| Sales & Related | 8 (36.4%) | 14 (63.6%) |
| Office & Administration | 3 (27.3%) | 8 (72.7%) |
| Total (Category) | 11 (33.3%) | 22 (66.7%) |
| Total (Overall) | 187 (59.7%) | 126 (40.3%) |
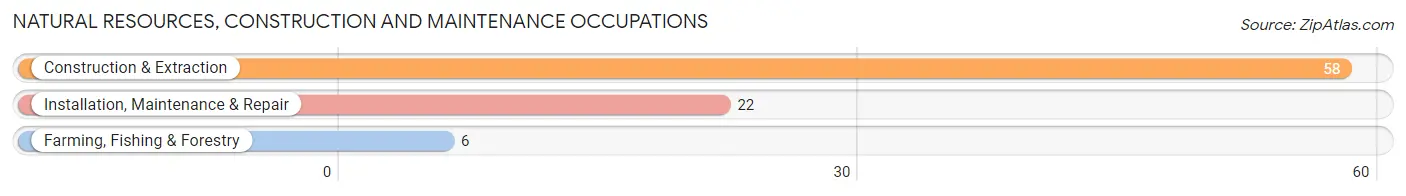
Natural Resources, Construction and Maintenance Occupations
The most common Natural Resources, Construction and Maintenance occupations in Port Trevorton are Construction & Extraction (58 | 18.5%), Installation, Maintenance & Repair (22 | 7.0%), and Farming, Fishing & Forestry (6 | 1.9%).
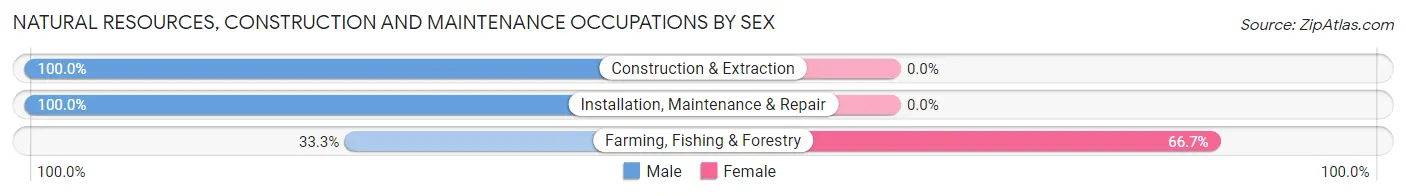
Natural Resources, Construction and Maintenance Occupations by Sex
| Occupation | Male | Female |
| Farming, Fishing & Forestry | 2 (33.3%) | 4 (66.7%) |
| Construction & Extraction | 58 (100.0%) | 0 (0.0%) |
| Installation, Maintenance & Repair | 22 (100.0%) | 0 (0.0%) |
| Total (Category) | 82 (95.4%) | 4 (4.6%) |
| Total (Overall) | 187 (59.7%) | 126 (40.3%) |
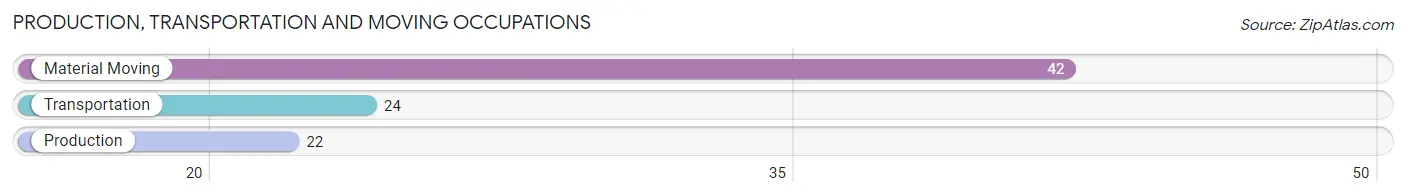
Production, Transportation and Moving Occupations
The most common Production, Transportation and Moving occupations in Port Trevorton are Material Moving (42 | 13.4%), Transportation (24 | 7.7%), and Production (22 | 7.0%).
Production, Transportation and Moving Occupations by Sex
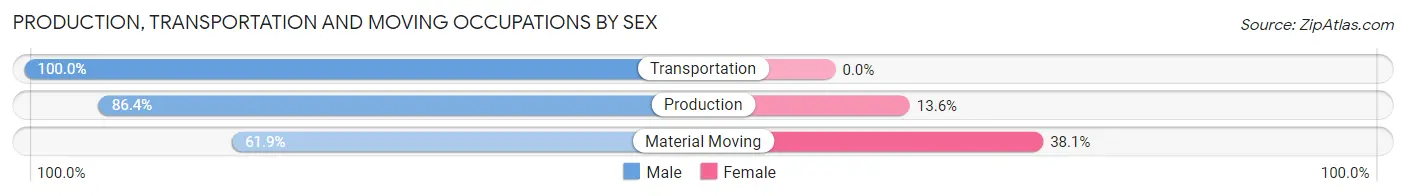
| Occupation | Male | Female |
| Production | 19 (86.4%) | 3 (13.6%) |
| Transportation | 24 (100.0%) | 0 (0.0%) |
| Material Moving | 26 (61.9%) | 16 (38.1%) |
| Total (Category) | 69 (78.4%) | 19 (21.6%) |
| Total (Overall) | 187 (59.7%) | 126 (40.3%) |
Employment Industries by Sex in Port Trevorton
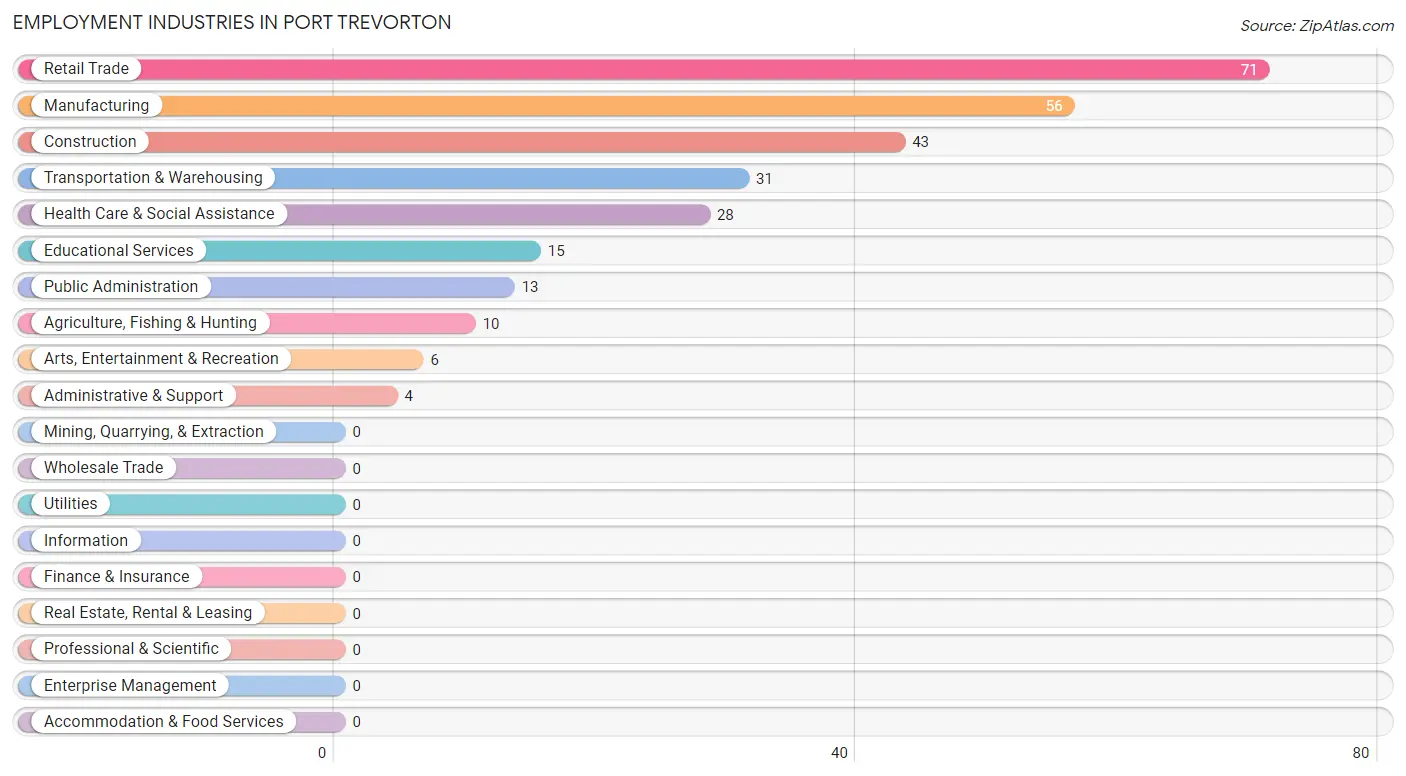
Employment Industries in Port Trevorton
The major employment industries in Port Trevorton include Retail Trade (71 | 22.7%), Manufacturing (56 | 17.9%), Construction (43 | 13.7%), Transportation & Warehousing (31 | 9.9%), and Health Care & Social Assistance (28 | 8.9%).
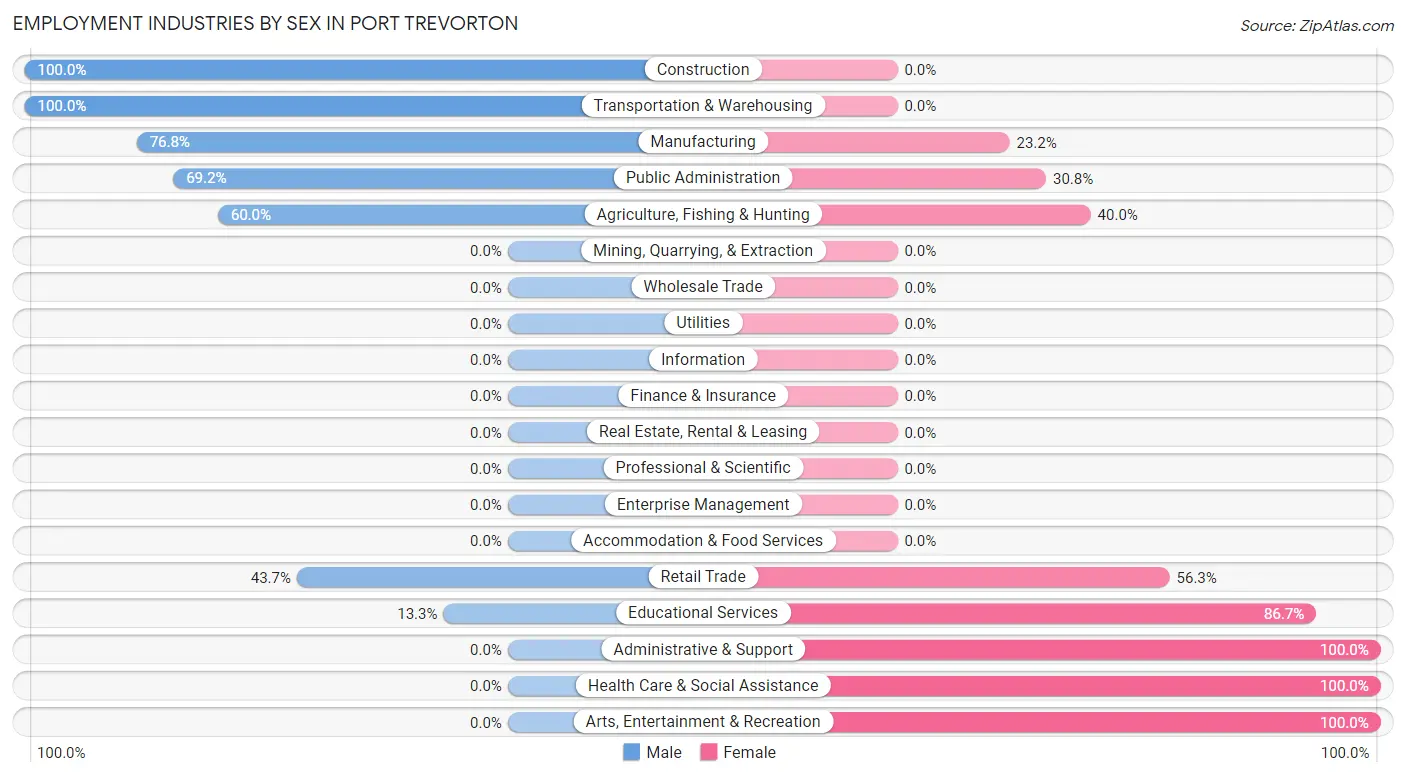
Employment Industries by Sex in Port Trevorton
The Port Trevorton industries that see more men than women are Construction (100.0%), Transportation & Warehousing (100.0%), and Manufacturing (76.8%), whereas the industries that tend to have a higher number of women are Administrative & Support (100.0%), Health Care & Social Assistance (100.0%), and Arts, Entertainment & Recreation (100.0%).
| Industry | Male | Female |
| Agriculture, Fishing & Hunting | 6 (60.0%) | 4 (40.0%) |
| Mining, Quarrying, & Extraction | 0 (0.0%) | 0 (0.0%) |
| Construction | 43 (100.0%) | 0 (0.0%) |
| Manufacturing | 43 (76.8%) | 13 (23.2%) |
| Wholesale Trade | 0 (0.0%) | 0 (0.0%) |
| Retail Trade | 31 (43.7%) | 40 (56.3%) |
| Transportation & Warehousing | 31 (100.0%) | 0 (0.0%) |
| Utilities | 0 (0.0%) | 0 (0.0%) |
| Information | 0 (0.0%) | 0 (0.0%) |
| Finance & Insurance | 0 (0.0%) | 0 (0.0%) |
| Real Estate, Rental & Leasing | 0 (0.0%) | 0 (0.0%) |
| Professional & Scientific | 0 (0.0%) | 0 (0.0%) |
| Enterprise Management | 0 (0.0%) | 0 (0.0%) |
| Administrative & Support | 0 (0.0%) | 4 (100.0%) |
| Educational Services | 2 (13.3%) | 13 (86.7%) |
| Health Care & Social Assistance | 0 (0.0%) | 28 (100.0%) |
| Arts, Entertainment & Recreation | 0 (0.0%) | 6 (100.0%) |
| Accommodation & Food Services | 0 (0.0%) | 0 (0.0%) |
| Public Administration | 9 (69.2%) | 4 (30.8%) |
| Total | 187 (59.7%) | 126 (40.3%) |
Education in Port Trevorton
School Enrollment in Port Trevorton
The most common levels of schooling among the 63 students in Port Trevorton are elementary school (24 | 38.1%), middle school (17 | 27.0%), and high school (12 | 19.1%).
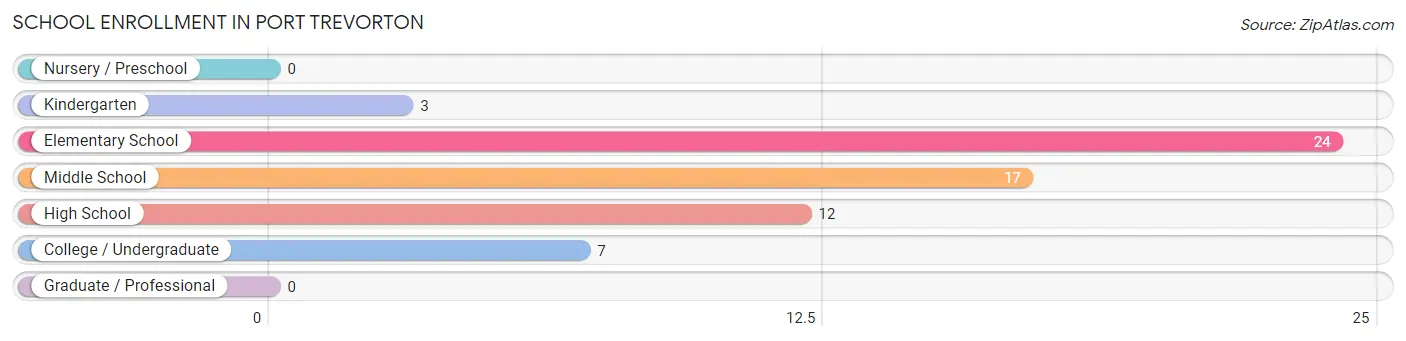
| School Level | # Students | % Students |
| Nursery / Preschool | 0 | 0.0% |
| Kindergarten | 3 | 4.8% |
| Elementary School | 24 | 38.1% |
| Middle School | 17 | 27.0% |
| High School | 12 | 19.1% |
| College / Undergraduate | 7 | 11.1% |
| Graduate / Professional | 0 | 0.0% |
| Total | 63 | 100.0% |
School Enrollment by Age by Funding Source in Port Trevorton
Out of a total of 63 students who are enrolled in schools in Port Trevorton, 16 (25.4%) attend a private institution, while the remaining 47 (74.6%) are enrolled in public schools. The age group of 10 to 14 year olds has the highest likelihood of being enrolled in private schools, with 12 (80.0% in the age bracket) enrolled. Conversely, the age group of 15 to 17 year olds has the lowest likelihood of being enrolled in a private school, with 18 (100.0% in the age bracket) attending a public institution.
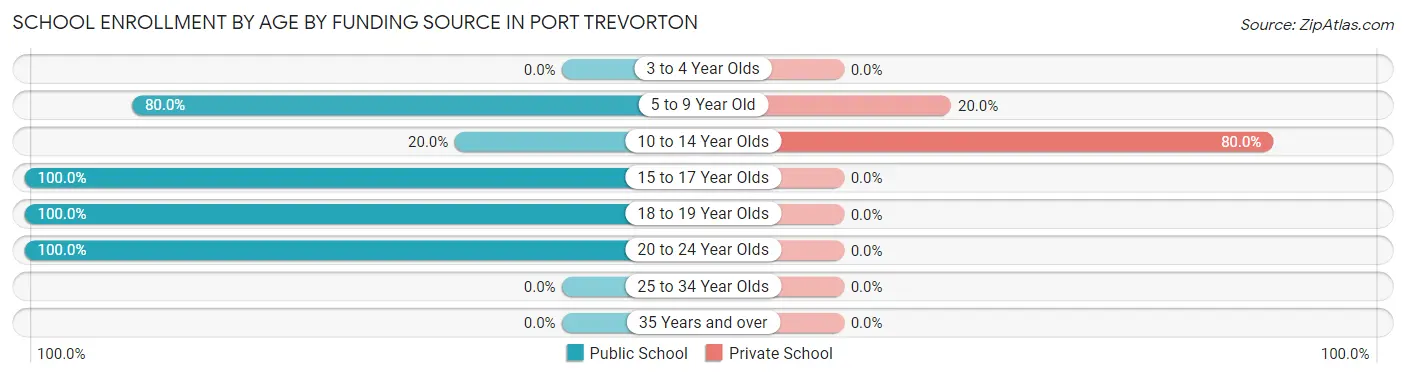
| Age Bracket | Public School | Private School |
| 3 to 4 Year Olds | 0 (0.0%) | 0 (0.0%) |
| 5 to 9 Year Old | 16 (80.0%) | 4 (20.0%) |
| 10 to 14 Year Olds | 3 (20.0%) | 12 (80.0%) |
| 15 to 17 Year Olds | 18 (100.0%) | 0 (0.0%) |
| 18 to 19 Year Olds | 3 (100.0%) | 0 (0.0%) |
| 20 to 24 Year Olds | 7 (100.0%) | 0 (0.0%) |
| 25 to 34 Year Olds | 0 (0.0%) | 0 (0.0%) |
| 35 Years and over | 0 (0.0%) | 0 (0.0%) |
| Total | 47 (74.6%) | 16 (25.4%) |
Educational Attainment by Field of Study in Port Trevorton
Education (39 | 50.6%), liberal arts & history (8 | 10.4%), business (7 | 9.1%), social sciences (6 | 7.8%), and literature & languages (6 | 7.8%) are the most common fields of study among 77 individuals in Port Trevorton who have obtained a bachelor's degree or higher.
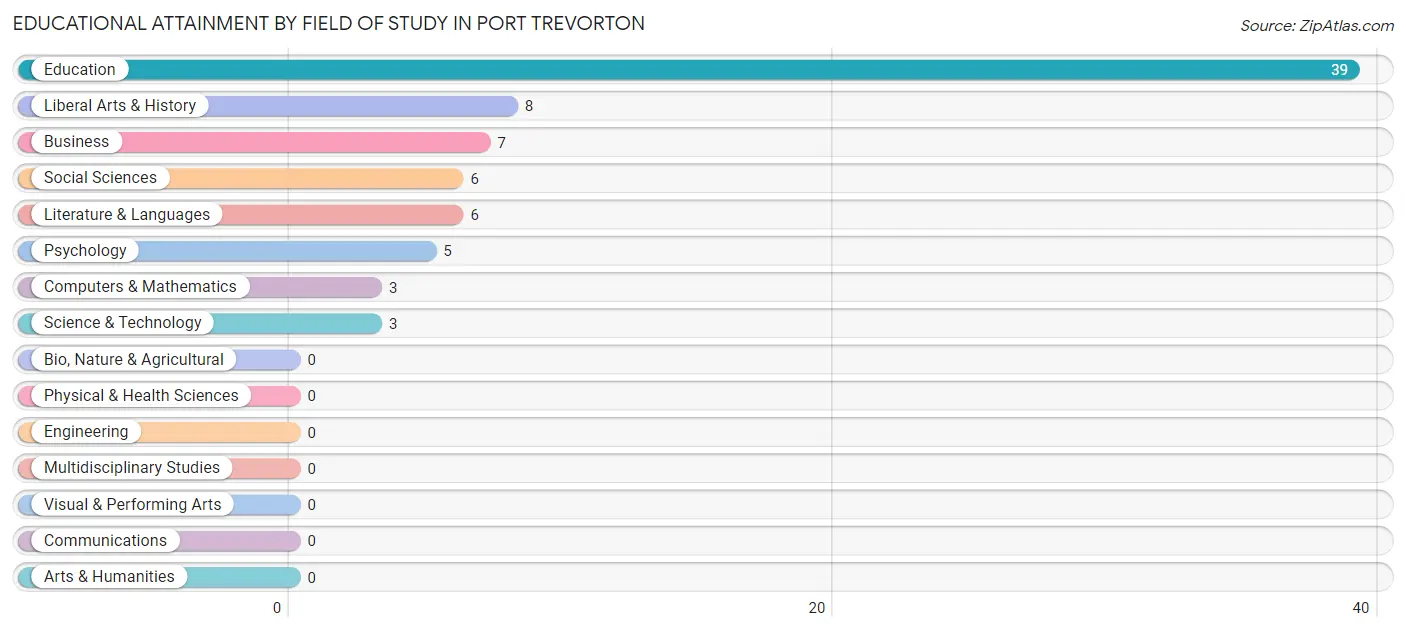
| Field of Study | # Graduates | % Graduates |
| Computers & Mathematics | 3 | 3.9% |
| Bio, Nature & Agricultural | 0 | 0.0% |
| Physical & Health Sciences | 0 | 0.0% |
| Psychology | 5 | 6.5% |
| Social Sciences | 6 | 7.8% |
| Engineering | 0 | 0.0% |
| Multidisciplinary Studies | 0 | 0.0% |
| Science & Technology | 3 | 3.9% |
| Business | 7 | 9.1% |
| Education | 39 | 50.6% |
| Literature & Languages | 6 | 7.8% |
| Liberal Arts & History | 8 | 10.4% |
| Visual & Performing Arts | 0 | 0.0% |
| Communications | 0 | 0.0% |
| Arts & Humanities | 0 | 0.0% |
| Total | 77 | 100.0% |
Transportation & Commute in Port Trevorton
Vehicle Availability by Sex in Port Trevorton
The most prevalent vehicle ownership categories in Port Trevorton are males with 5 or more vehicles (54, accounting for 29.7%) and females with 5 or more vehicles (29, making up 42.9%).
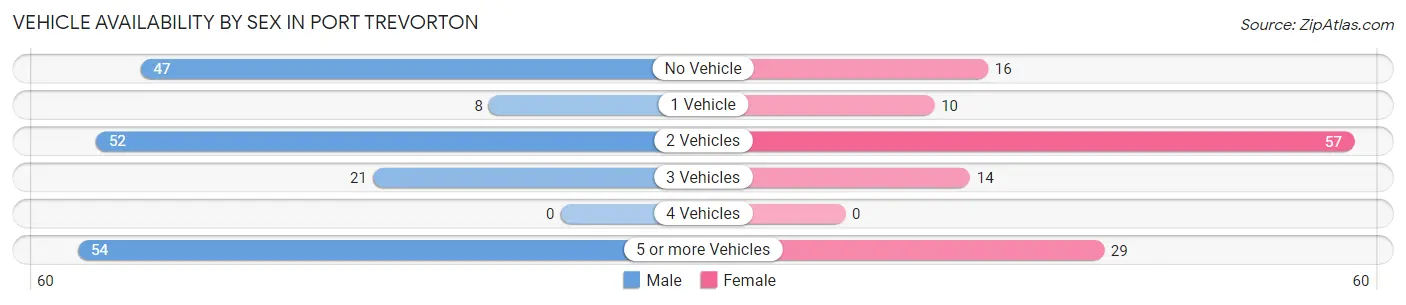
| Vehicles Available | Male | Female |
| No Vehicle | 47 (25.8%) | 16 (12.7%) |
| 1 Vehicle | 8 (4.4%) | 10 (7.9%) |
| 2 Vehicles | 52 (28.6%) | 57 (45.2%) |
| 3 Vehicles | 21 (11.5%) | 14 (11.1%) |
| 4 Vehicles | 0 (0.0%) | 0 (0.0%) |
| 5 or more Vehicles | 54 (29.7%) | 29 (23.0%) |
| Total | 182 (100.0%) | 126 (100.0%) |
Commute Time in Port Trevorton
The most frequently occuring commute durations in Port Trevorton are 45 to 59 minutes (44 commuters, 16.1%), 15 to 19 minutes (41 commuters, 15.0%), and 30 to 34 minutes (34 commuters, 12.4%).
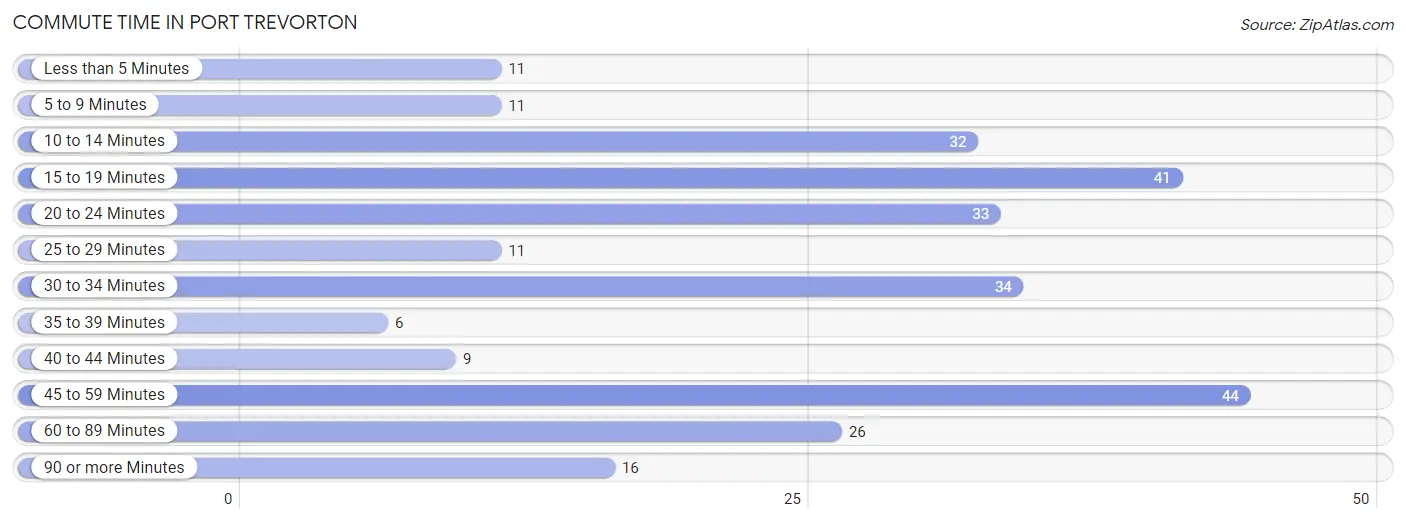
| Commute Time | # Commuters | % Commuters |
| Less than 5 Minutes | 11 | 4.0% |
| 5 to 9 Minutes | 11 | 4.0% |
| 10 to 14 Minutes | 32 | 11.7% |
| 15 to 19 Minutes | 41 | 15.0% |
| 20 to 24 Minutes | 33 | 12.0% |
| 25 to 29 Minutes | 11 | 4.0% |
| 30 to 34 Minutes | 34 | 12.4% |
| 35 to 39 Minutes | 6 | 2.2% |
| 40 to 44 Minutes | 9 | 3.3% |
| 45 to 59 Minutes | 44 | 16.1% |
| 60 to 89 Minutes | 26 | 9.5% |
| 90 or more Minutes | 16 | 5.8% |
Commute Time by Sex in Port Trevorton
The most common commute times in Port Trevorton are 20 to 24 minutes (29 commuters, 16.5%) for males and 15 to 19 minutes (29 commuters, 29.6%) for females.
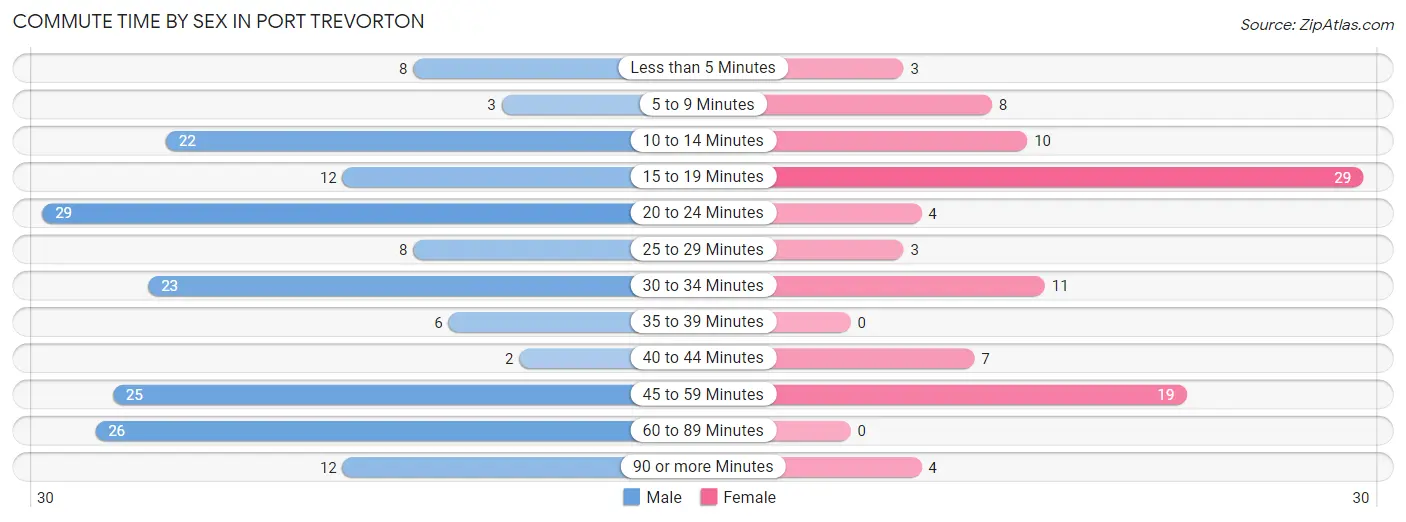
| Commute Time | Male | Female |
| Less than 5 Minutes | 8 (4.5%) | 3 (3.1%) |
| 5 to 9 Minutes | 3 (1.7%) | 8 (8.2%) |
| 10 to 14 Minutes | 22 (12.5%) | 10 (10.2%) |
| 15 to 19 Minutes | 12 (6.8%) | 29 (29.6%) |
| 20 to 24 Minutes | 29 (16.5%) | 4 (4.1%) |
| 25 to 29 Minutes | 8 (4.5%) | 3 (3.1%) |
| 30 to 34 Minutes | 23 (13.1%) | 11 (11.2%) |
| 35 to 39 Minutes | 6 (3.4%) | 0 (0.0%) |
| 40 to 44 Minutes | 2 (1.1%) | 7 (7.1%) |
| 45 to 59 Minutes | 25 (14.2%) | 19 (19.4%) |
| 60 to 89 Minutes | 26 (14.8%) | 0 (0.0%) |
| 90 or more Minutes | 12 (6.8%) | 4 (4.1%) |
Time of Departure to Work by Sex in Port Trevorton
The most frequent times of departure to work in Port Trevorton are 12:00 AM to 4:59 AM (46, 26.1%) for males and 6:30 AM to 6:59 AM (19, 19.4%) for females.
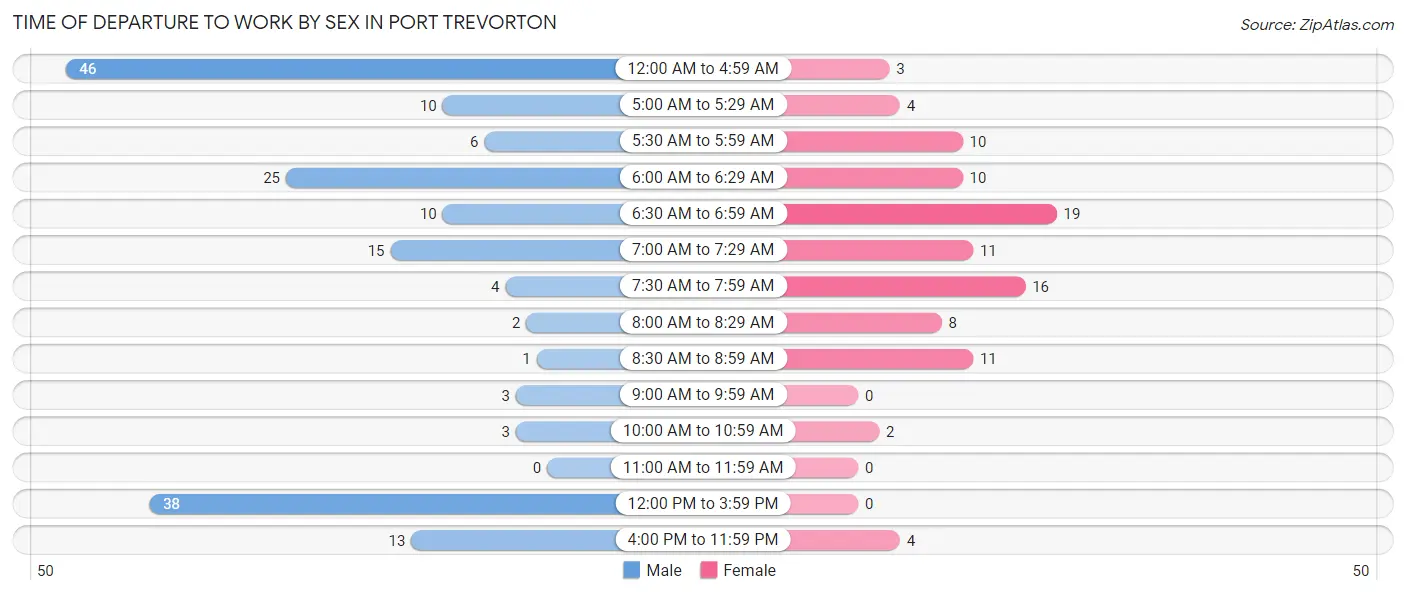
| Time of Departure | Male | Female |
| 12:00 AM to 4:59 AM | 46 (26.1%) | 3 (3.1%) |
| 5:00 AM to 5:29 AM | 10 (5.7%) | 4 (4.1%) |
| 5:30 AM to 5:59 AM | 6 (3.4%) | 10 (10.2%) |
| 6:00 AM to 6:29 AM | 25 (14.2%) | 10 (10.2%) |
| 6:30 AM to 6:59 AM | 10 (5.7%) | 19 (19.4%) |
| 7:00 AM to 7:29 AM | 15 (8.5%) | 11 (11.2%) |
| 7:30 AM to 7:59 AM | 4 (2.3%) | 16 (16.3%) |
| 8:00 AM to 8:29 AM | 2 (1.1%) | 8 (8.2%) |
| 8:30 AM to 8:59 AM | 1 (0.6%) | 11 (11.2%) |
| 9:00 AM to 9:59 AM | 3 (1.7%) | 0 (0.0%) |
| 10:00 AM to 10:59 AM | 3 (1.7%) | 2 (2.0%) |
| 11:00 AM to 11:59 AM | 0 (0.0%) | 0 (0.0%) |
| 12:00 PM to 3:59 PM | 38 (21.6%) | 0 (0.0%) |
| 4:00 PM to 11:59 PM | 13 (7.4%) | 4 (4.1%) |
| Total | 176 (100.0%) | 98 (100.0%) |
Housing Occupancy in Port Trevorton
Occupancy by Ownership in Port Trevorton
Of the total 199 dwellings in Port Trevorton, owner-occupied units account for 151 (75.9%), while renter-occupied units make up 48 (24.1%).
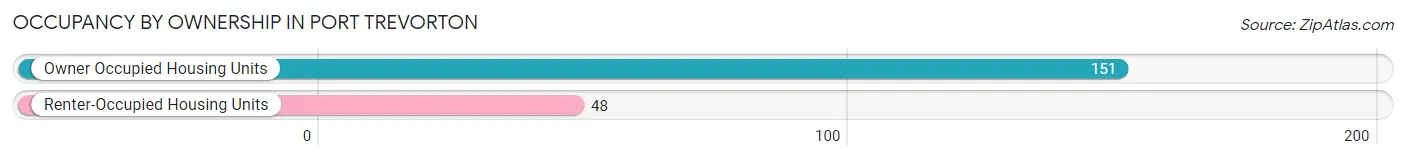
| Occupancy | # Housing Units | % Housing Units |
| Owner Occupied Housing Units | 151 | 75.9% |
| Renter-Occupied Housing Units | 48 | 24.1% |
| Total Occupied Housing Units | 199 | 100.0% |
Occupancy by Household Size in Port Trevorton
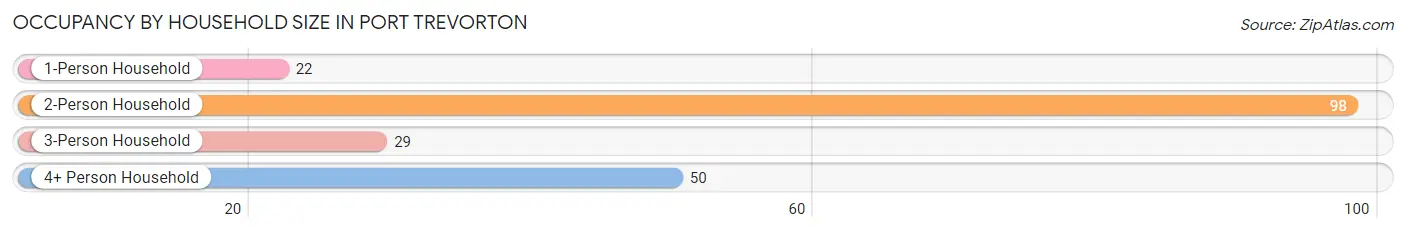
| Household Size | # Housing Units | % Housing Units |
| 1-Person Household | 22 | 11.1% |
| 2-Person Household | 98 | 49.2% |
| 3-Person Household | 29 | 14.6% |
| 4+ Person Household | 50 | 25.1% |
| Total Housing Units | 199 | 100.0% |
Occupancy by Ownership by Household Size in Port Trevorton
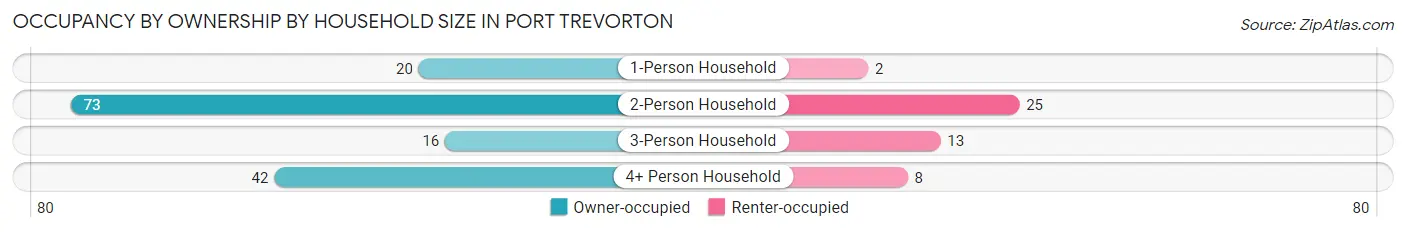
| Household Size | Owner-occupied | Renter-occupied |
| 1-Person Household | 20 (90.9%) | 2 (9.1%) |
| 2-Person Household | 73 (74.5%) | 25 (25.5%) |
| 3-Person Household | 16 (55.2%) | 13 (44.8%) |
| 4+ Person Household | 42 (84.0%) | 8 (16.0%) |
| Total Housing Units | 151 (75.9%) | 48 (24.1%) |
Occupancy by Educational Attainment in Port Trevorton
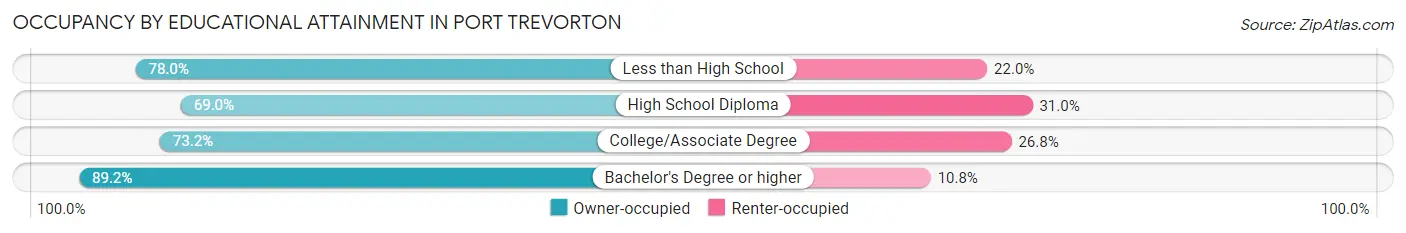
| Household Size | Owner-occupied | Renter-occupied |
| Less than High School | 39 (78.0%) | 11 (22.0%) |
| High School Diploma | 49 (69.0%) | 22 (31.0%) |
| College/Associate Degree | 30 (73.2%) | 11 (26.8%) |
| Bachelor's Degree or higher | 33 (89.2%) | 4 (10.8%) |
Occupancy by Age of Householder in Port Trevorton
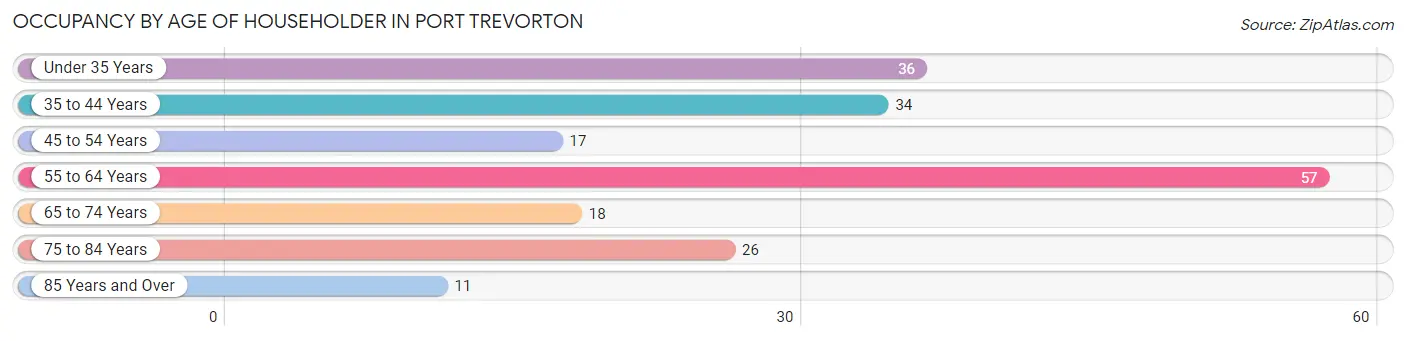
| Age Bracket | # Households | % Households |
| Under 35 Years | 36 | 18.1% |
| 35 to 44 Years | 34 | 17.1% |
| 45 to 54 Years | 17 | 8.5% |
| 55 to 64 Years | 57 | 28.6% |
| 65 to 74 Years | 18 | 9.0% |
| 75 to 84 Years | 26 | 13.1% |
| 85 Years and Over | 11 | 5.5% |
| Total | 199 | 100.0% |
Housing Finances in Port Trevorton
Median Income by Occupancy in Port Trevorton
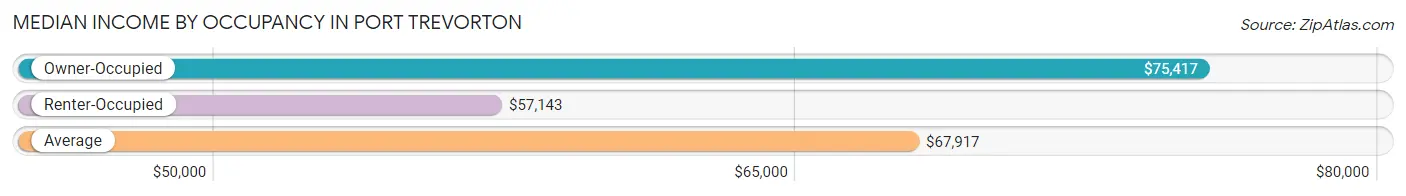
| Occupancy Type | # Households | Median Income |
| Owner-Occupied | 151 (75.9%) | $75,417 |
| Renter-Occupied | 48 (24.1%) | $57,143 |
| Average | 199 (100.0%) | $67,917 |
Occupancy by Householder Income Bracket in Port Trevorton
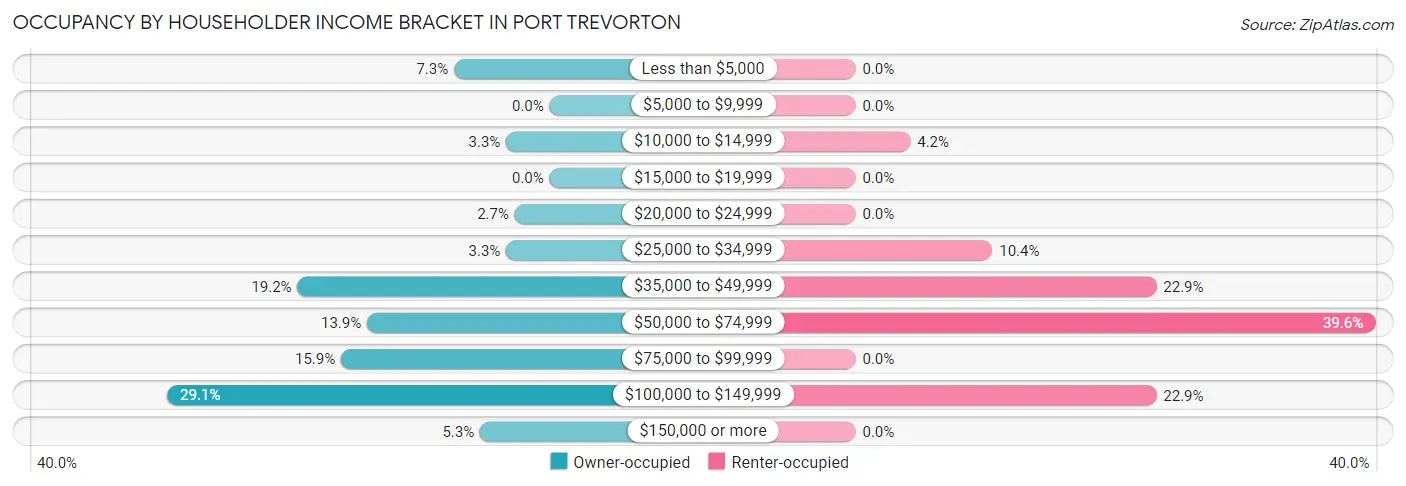
| Income Bracket | Owner-occupied | Renter-occupied |
| Less than $5,000 | 11 (7.3%) | 0 (0.0%) |
| $5,000 to $9,999 | 0 (0.0%) | 0 (0.0%) |
| $10,000 to $14,999 | 5 (3.3%) | 2 (4.2%) |
| $15,000 to $19,999 | 0 (0.0%) | 0 (0.0%) |
| $20,000 to $24,999 | 4 (2.6%) | 0 (0.0%) |
| $25,000 to $34,999 | 5 (3.3%) | 5 (10.4%) |
| $35,000 to $49,999 | 29 (19.2%) | 11 (22.9%) |
| $50,000 to $74,999 | 21 (13.9%) | 19 (39.6%) |
| $75,000 to $99,999 | 24 (15.9%) | 0 (0.0%) |
| $100,000 to $149,999 | 44 (29.1%) | 11 (22.9%) |
| $150,000 or more | 8 (5.3%) | 0 (0.0%) |
| Total | 151 (100.0%) | 48 (100.0%) |
Monthly Housing Cost Tiers in Port Trevorton
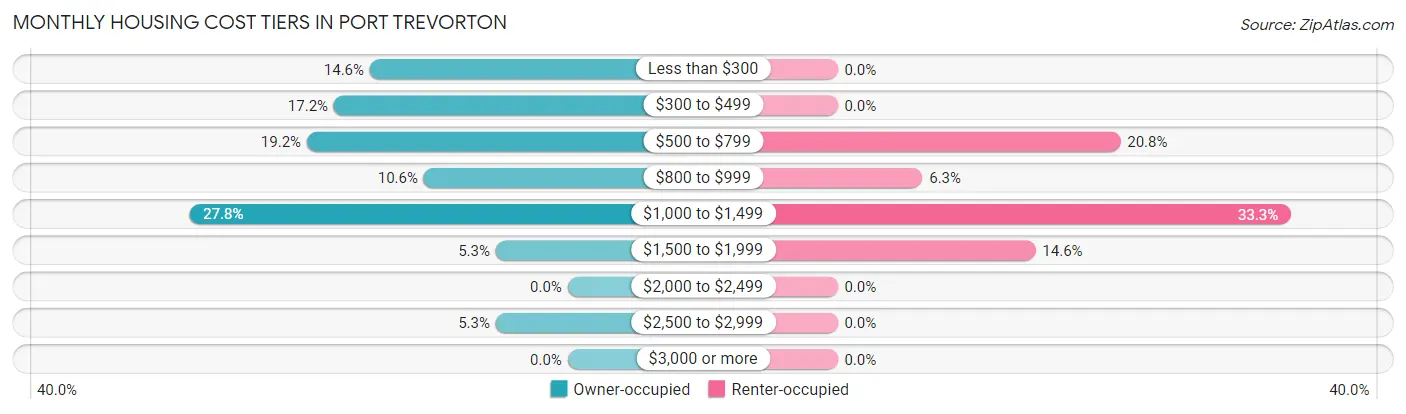
| Monthly Cost | Owner-occupied | Renter-occupied |
| Less than $300 | 22 (14.6%) | 0 (0.0%) |
| $300 to $499 | 26 (17.2%) | 0 (0.0%) |
| $500 to $799 | 29 (19.2%) | 10 (20.8%) |
| $800 to $999 | 16 (10.6%) | 3 (6.2%) |
| $1,000 to $1,499 | 42 (27.8%) | 16 (33.3%) |
| $1,500 to $1,999 | 8 (5.3%) | 7 (14.6%) |
| $2,000 to $2,499 | 0 (0.0%) | 0 (0.0%) |
| $2,500 to $2,999 | 8 (5.3%) | 0 (0.0%) |
| $3,000 or more | 0 (0.0%) | 0 (0.0%) |
| Total | 151 (100.0%) | 48 (100.0%) |
Physical Housing Characteristics in Port Trevorton
Housing Structures in Port Trevorton
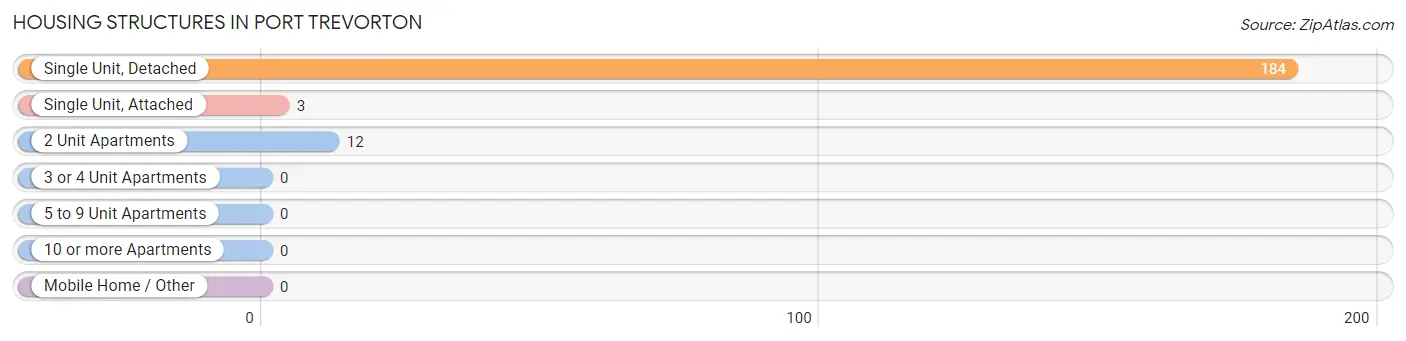
| Structure Type | # Housing Units | % Housing Units |
| Single Unit, Detached | 184 | 92.5% |
| Single Unit, Attached | 3 | 1.5% |
| 2 Unit Apartments | 12 | 6.0% |
| 3 or 4 Unit Apartments | 0 | 0.0% |
| 5 to 9 Unit Apartments | 0 | 0.0% |
| 10 or more Apartments | 0 | 0.0% |
| Mobile Home / Other | 0 | 0.0% |
| Total | 199 | 100.0% |
Housing Structures by Occupancy in Port Trevorton
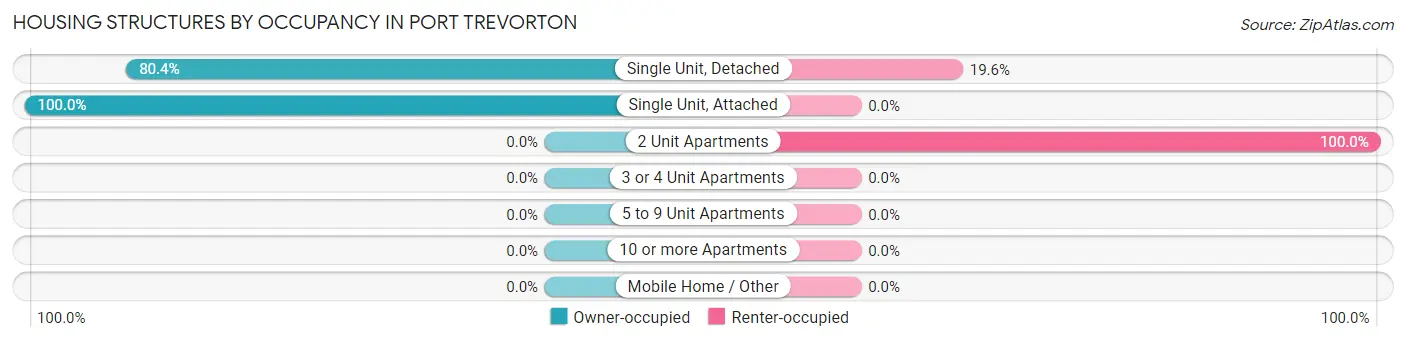
| Structure Type | Owner-occupied | Renter-occupied |
| Single Unit, Detached | 148 (80.4%) | 36 (19.6%) |
| Single Unit, Attached | 3 (100.0%) | 0 (0.0%) |
| 2 Unit Apartments | 0 (0.0%) | 12 (100.0%) |
| 3 or 4 Unit Apartments | 0 (0.0%) | 0 (0.0%) |
| 5 to 9 Unit Apartments | 0 (0.0%) | 0 (0.0%) |
| 10 or more Apartments | 0 (0.0%) | 0 (0.0%) |
| Mobile Home / Other | 0 (0.0%) | 0 (0.0%) |
| Total | 151 (75.9%) | 48 (24.1%) |
Housing Structures by Number of Rooms in Port Trevorton
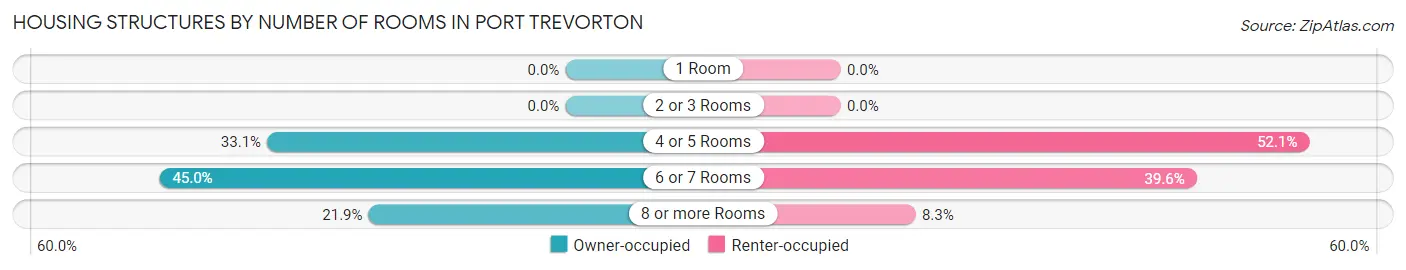
| Number of Rooms | Owner-occupied | Renter-occupied |
| 1 Room | 0 (0.0%) | 0 (0.0%) |
| 2 or 3 Rooms | 0 (0.0%) | 0 (0.0%) |
| 4 or 5 Rooms | 50 (33.1%) | 25 (52.1%) |
| 6 or 7 Rooms | 68 (45.0%) | 19 (39.6%) |
| 8 or more Rooms | 33 (21.8%) | 4 (8.3%) |
| Total | 151 (100.0%) | 48 (100.0%) |
Housing Structure by Heating Type in Port Trevorton
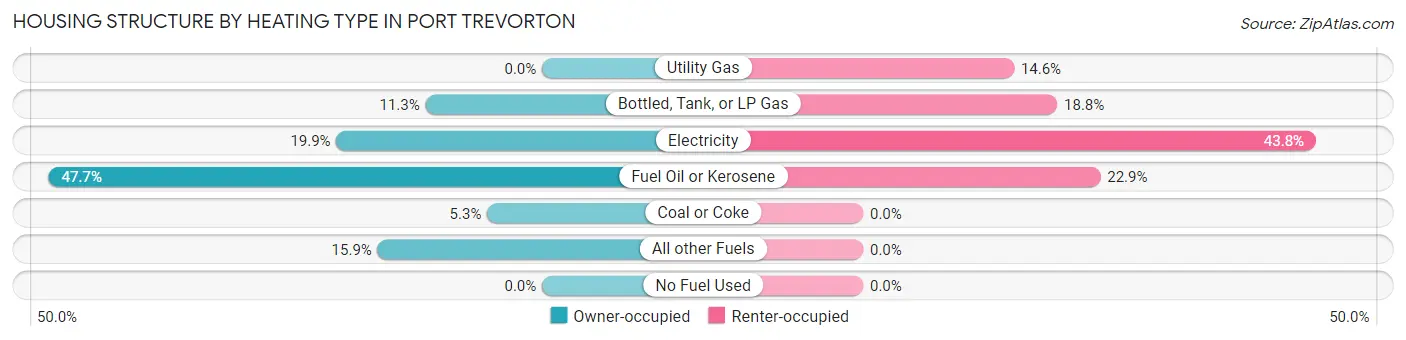
| Heating Type | Owner-occupied | Renter-occupied |
| Utility Gas | 0 (0.0%) | 7 (14.6%) |
| Bottled, Tank, or LP Gas | 17 (11.3%) | 9 (18.8%) |
| Electricity | 30 (19.9%) | 21 (43.8%) |
| Fuel Oil or Kerosene | 72 (47.7%) | 11 (22.9%) |
| Coal or Coke | 8 (5.3%) | 0 (0.0%) |
| All other Fuels | 24 (15.9%) | 0 (0.0%) |
| No Fuel Used | 0 (0.0%) | 0 (0.0%) |
| Total | 151 (100.0%) | 48 (100.0%) |
Household Vehicle Usage in Port Trevorton
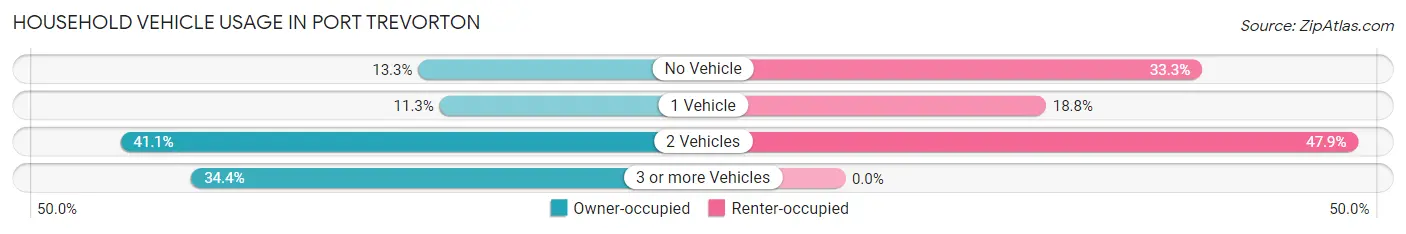
| Vehicles per Household | Owner-occupied | Renter-occupied |
| No Vehicle | 20 (13.3%) | 16 (33.3%) |
| 1 Vehicle | 17 (11.3%) | 9 (18.8%) |
| 2 Vehicles | 62 (41.1%) | 23 (47.9%) |
| 3 or more Vehicles | 52 (34.4%) | 0 (0.0%) |
| Total | 151 (100.0%) | 48 (100.0%) |
Real Estate & Mortgages in Port Trevorton
Real Estate and Mortgage Overview in Port Trevorton
| Characteristic | Without Mortgage | With Mortgage |
| Housing Units | 78 | 73 |
| Median Property Value | $158,300 | $147,900 |
| Median Household Income | $85,833 | $3 |
| Monthly Housing Costs | $440 | $0 |
| Real Estate Taxes | $1,313 | $0 |
Property Value by Mortgage Status in Port Trevorton
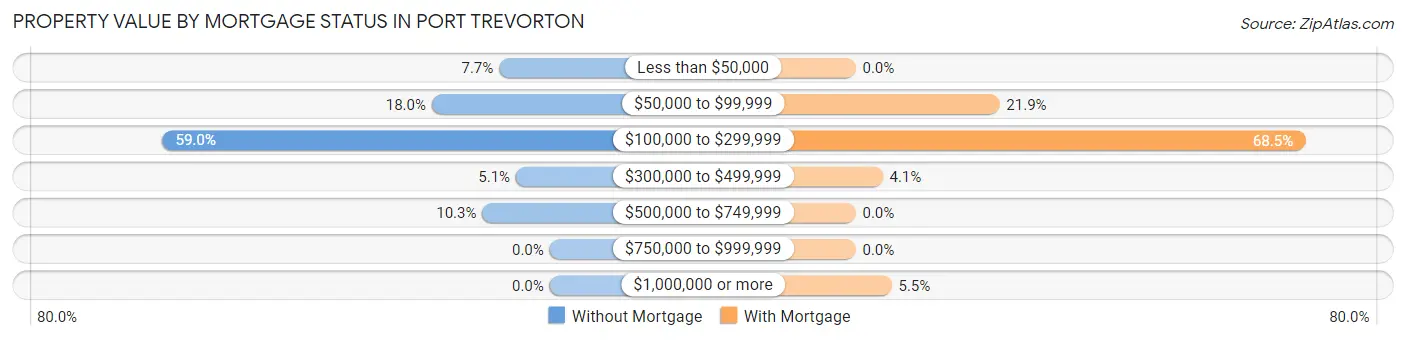
| Property Value | Without Mortgage | With Mortgage |
| Less than $50,000 | 6 (7.7%) | 0 (0.0%) |
| $50,000 to $99,999 | 14 (17.9%) | 16 (21.9%) |
| $100,000 to $299,999 | 46 (59.0%) | 50 (68.5%) |
| $300,000 to $499,999 | 4 (5.1%) | 3 (4.1%) |
| $500,000 to $749,999 | 8 (10.3%) | 0 (0.0%) |
| $750,000 to $999,999 | 0 (0.0%) | 0 (0.0%) |
| $1,000,000 or more | 0 (0.0%) | 4 (5.5%) |
| Total | 78 (100.0%) | 73 (100.0%) |
Household Income by Mortgage Status in Port Trevorton
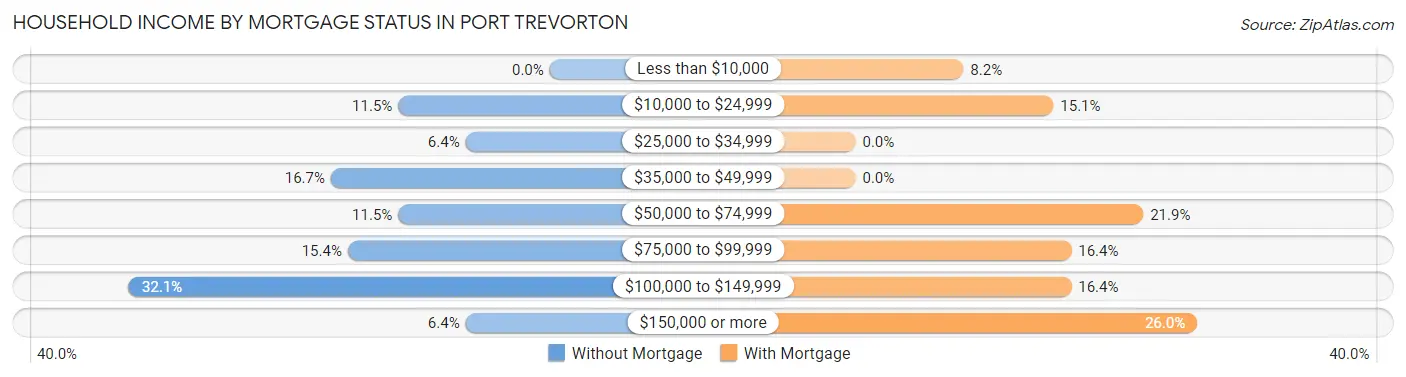
| Household Income | Without Mortgage | With Mortgage |
| Less than $10,000 | 0 (0.0%) | 6 (8.2%) |
| $10,000 to $24,999 | 9 (11.5%) | 11 (15.1%) |
| $25,000 to $34,999 | 5 (6.4%) | 0 (0.0%) |
| $35,000 to $49,999 | 13 (16.7%) | 0 (0.0%) |
| $50,000 to $74,999 | 9 (11.5%) | 16 (21.9%) |
| $75,000 to $99,999 | 12 (15.4%) | 12 (16.4%) |
| $100,000 to $149,999 | 25 (32.1%) | 12 (16.4%) |
| $150,000 or more | 5 (6.4%) | 19 (26.0%) |
| Total | 78 (100.0%) | 73 (100.0%) |
Property Value to Household Income Ratio in Port Trevorton
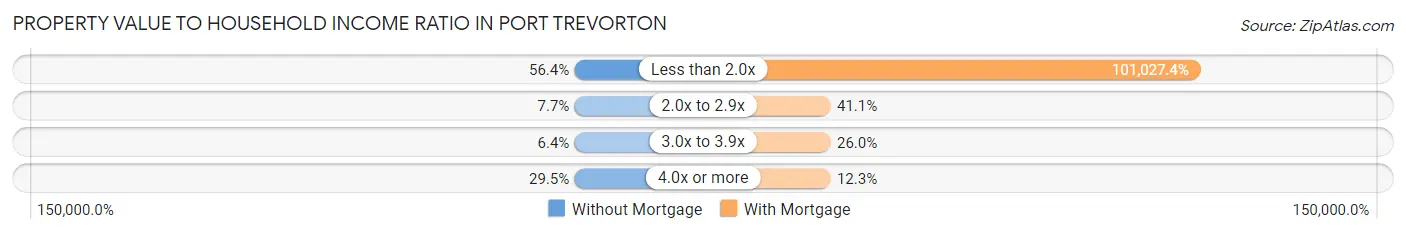
| Value-to-Income Ratio | Without Mortgage | With Mortgage |
| Less than 2.0x | 44 (56.4%) | 73,750 (101,027.4%) |
| 2.0x to 2.9x | 6 (7.7%) | 30 (41.1%) |
| 3.0x to 3.9x | 5 (6.4%) | 19 (26.0%) |
| 4.0x or more | 23 (29.5%) | 9 (12.3%) |
| Total | 78 (100.0%) | 73 (100.0%) |
Real Estate Taxes by Mortgage Status in Port Trevorton
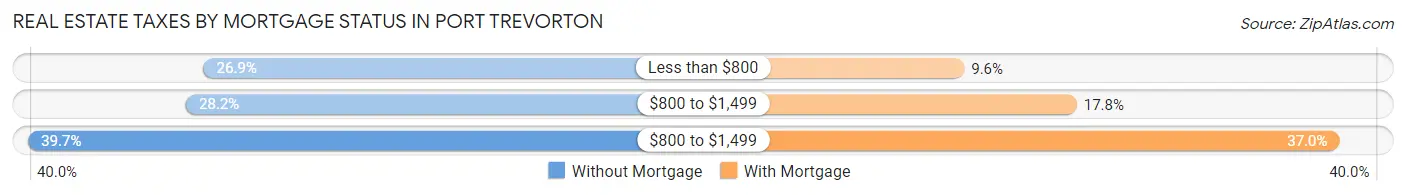
| Property Taxes | Without Mortgage | With Mortgage |
| Less than $800 | 21 (26.9%) | 7 (9.6%) |
| $800 to $1,499 | 22 (28.2%) | 13 (17.8%) |
| $800 to $1,499 | 31 (39.7%) | 27 (37.0%) |
| Total | 78 (100.0%) | 73 (100.0%) |
Health & Disability in Port Trevorton
Health Insurance Coverage by Age in Port Trevorton
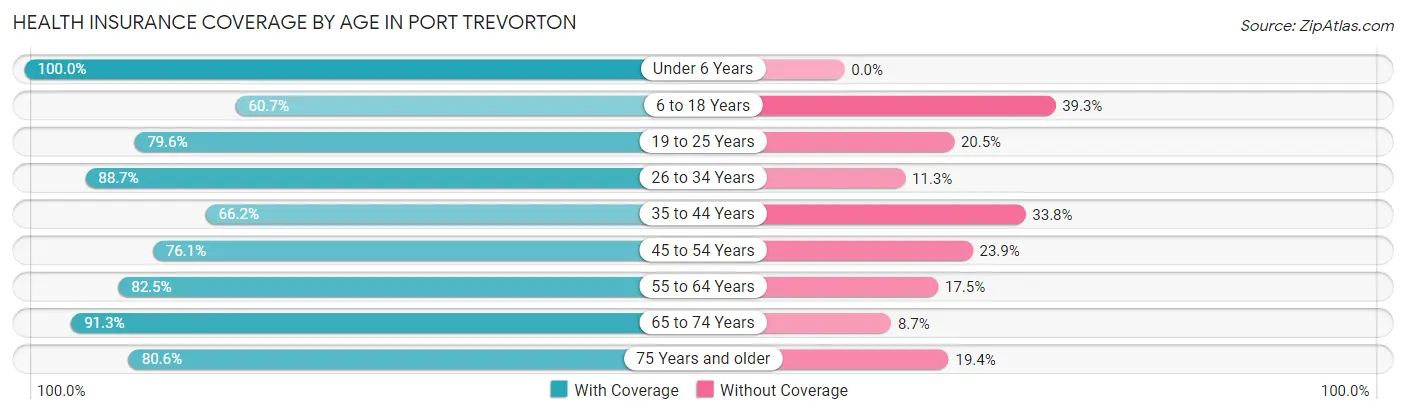
| Age Bracket | With Coverage | Without Coverage |
| Under 6 Years | 55 (100.0%) | 0 (0.0%) |
| 6 to 18 Years | 54 (60.7%) | 35 (39.3%) |
| 19 to 25 Years | 35 (79.5%) | 9 (20.4%) |
| 26 to 34 Years | 86 (88.7%) | 11 (11.3%) |
| 35 to 44 Years | 51 (66.2%) | 26 (33.8%) |
| 45 to 54 Years | 35 (76.1%) | 11 (23.9%) |
| 55 to 64 Years | 85 (82.5%) | 18 (17.5%) |
| 65 to 74 Years | 42 (91.3%) | 4 (8.7%) |
| 75 Years and older | 58 (80.6%) | 14 (19.4%) |
| Total | 501 (79.6%) | 128 (20.3%) |
Health Insurance Coverage by Citizenship Status in Port Trevorton
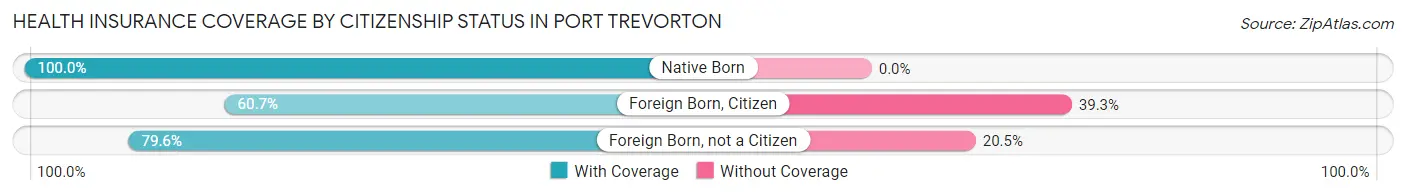
| Citizenship Status | With Coverage | Without Coverage |
| Native Born | 55 (100.0%) | 0 (0.0%) |
| Foreign Born, Citizen | 54 (60.7%) | 35 (39.3%) |
| Foreign Born, not a Citizen | 35 (79.5%) | 9 (20.4%) |
Health Insurance Coverage by Household Income in Port Trevorton
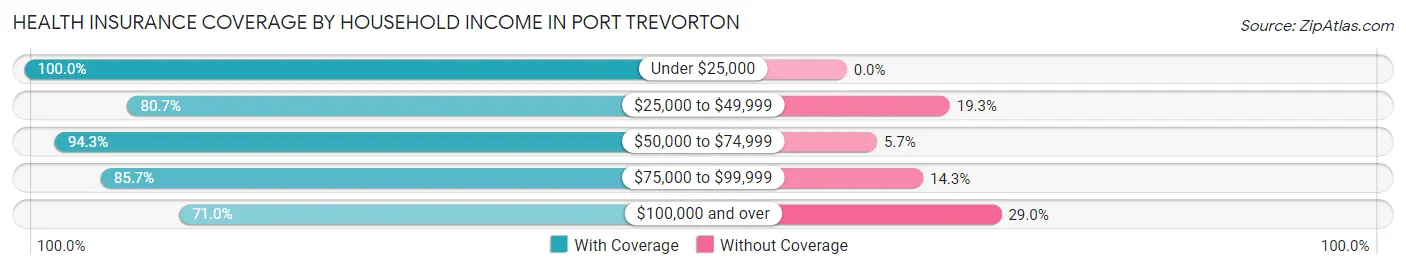
| Household Income | With Coverage | Without Coverage |
| Under $25,000 | 32 (100.0%) | 0 (0.0%) |
| $25,000 to $49,999 | 92 (80.7%) | 22 (19.3%) |
| $50,000 to $74,999 | 100 (94.3%) | 6 (5.7%) |
| $75,000 to $99,999 | 54 (85.7%) | 9 (14.3%) |
| $100,000 and over | 223 (71.0%) | 91 (29.0%) |
Public vs Private Health Insurance Coverage by Age in Port Trevorton
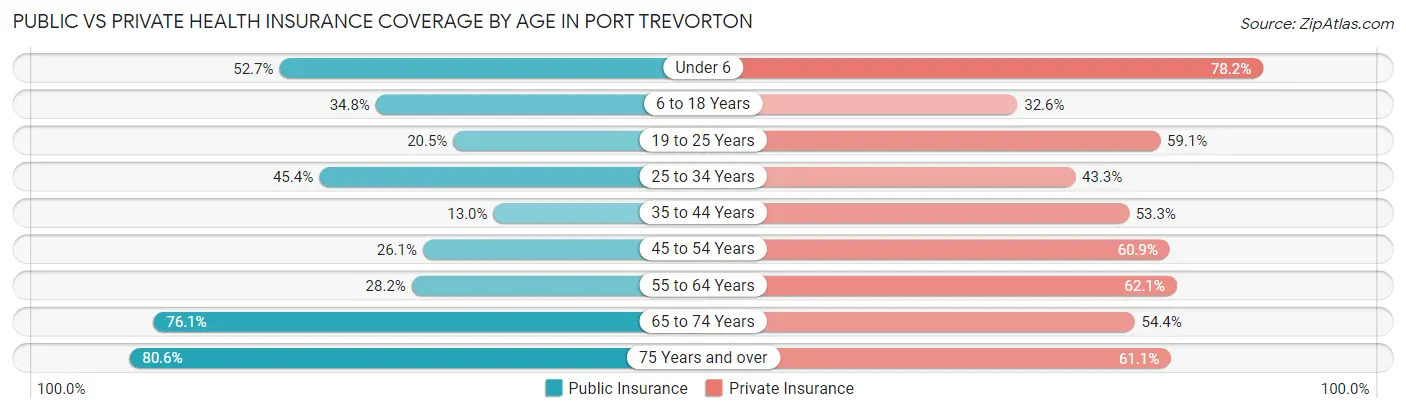
| Age Bracket | Public Insurance | Private Insurance |
| Under 6 | 29 (52.7%) | 43 (78.2%) |
| 6 to 18 Years | 31 (34.8%) | 29 (32.6%) |
| 19 to 25 Years | 9 (20.4%) | 26 (59.1%) |
| 25 to 34 Years | 44 (45.4%) | 42 (43.3%) |
| 35 to 44 Years | 10 (13.0%) | 41 (53.2%) |
| 45 to 54 Years | 12 (26.1%) | 28 (60.9%) |
| 55 to 64 Years | 29 (28.2%) | 64 (62.1%) |
| 65 to 74 Years | 35 (76.1%) | 25 (54.3%) |
| 75 Years and over | 58 (80.6%) | 44 (61.1%) |
| Total | 257 (40.9%) | 342 (54.4%) |
Disability Status by Sex by Age in Port Trevorton
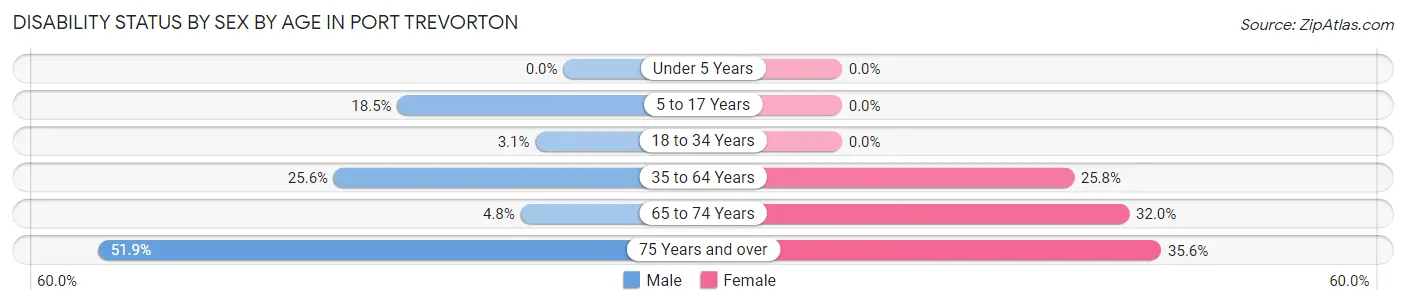
| Age Bracket | Male | Female |
| Under 5 Years | 0 (0.0%) | 0 (0.0%) |
| 5 to 17 Years | 17 (18.5%) | 0 (0.0%) |
| 18 to 34 Years | 2 (3.1%) | 0 (0.0%) |
| 35 to 64 Years | 35 (25.6%) | 23 (25.8%) |
| 65 to 74 Years | 1 (4.8%) | 8 (32.0%) |
| 75 Years and over | 14 (51.8%) | 16 (35.6%) |
Disability Class by Sex by Age in Port Trevorton
Disability Class: Hearing Difficulty
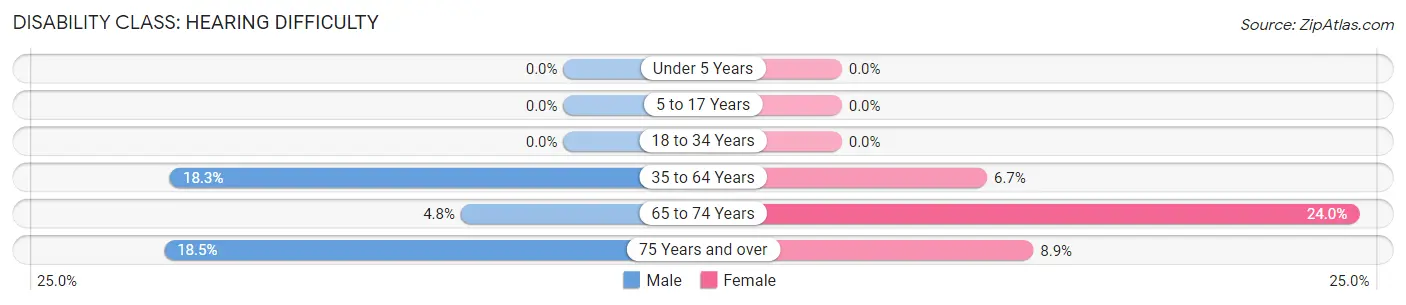
| Age Bracket | Male | Female |
| Under 5 Years | 0 (0.0%) | 0 (0.0%) |
| 5 to 17 Years | 0 (0.0%) | 0 (0.0%) |
| 18 to 34 Years | 0 (0.0%) | 0 (0.0%) |
| 35 to 64 Years | 25 (18.2%) | 6 (6.7%) |
| 65 to 74 Years | 1 (4.8%) | 6 (24.0%) |
| 75 Years and over | 5 (18.5%) | 4 (8.9%) |
Disability Class: Vision Difficulty
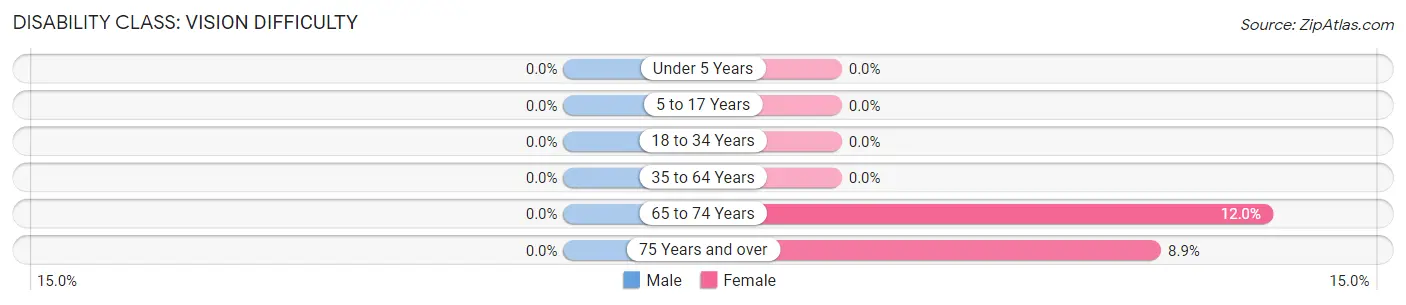
| Age Bracket | Male | Female |
| Under 5 Years | 0 (0.0%) | 0 (0.0%) |
| 5 to 17 Years | 0 (0.0%) | 0 (0.0%) |
| 18 to 34 Years | 0 (0.0%) | 0 (0.0%) |
| 35 to 64 Years | 0 (0.0%) | 0 (0.0%) |
| 65 to 74 Years | 0 (0.0%) | 3 (12.0%) |
| 75 Years and over | 0 (0.0%) | 4 (8.9%) |
Disability Class: Cognitive Difficulty
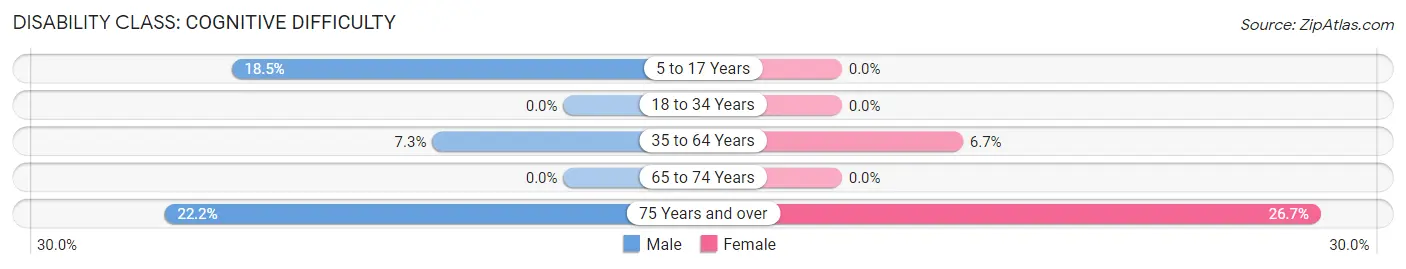
| Age Bracket | Male | Female |
| 5 to 17 Years | 17 (18.5%) | 0 (0.0%) |
| 18 to 34 Years | 0 (0.0%) | 0 (0.0%) |
| 35 to 64 Years | 10 (7.3%) | 6 (6.7%) |
| 65 to 74 Years | 0 (0.0%) | 0 (0.0%) |
| 75 Years and over | 6 (22.2%) | 12 (26.7%) |
Disability Class: Ambulatory Difficulty
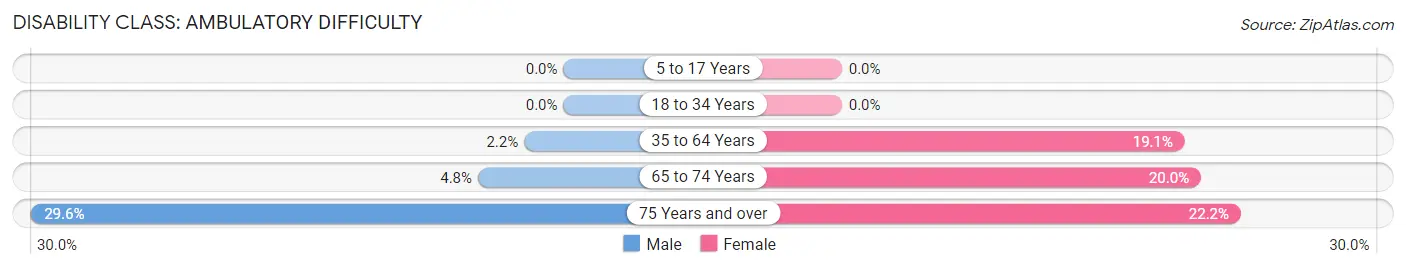
| Age Bracket | Male | Female |
| 5 to 17 Years | 0 (0.0%) | 0 (0.0%) |
| 18 to 34 Years | 0 (0.0%) | 0 (0.0%) |
| 35 to 64 Years | 3 (2.2%) | 17 (19.1%) |
| 65 to 74 Years | 1 (4.8%) | 5 (20.0%) |
| 75 Years and over | 8 (29.6%) | 10 (22.2%) |
Disability Class: Self-Care Difficulty
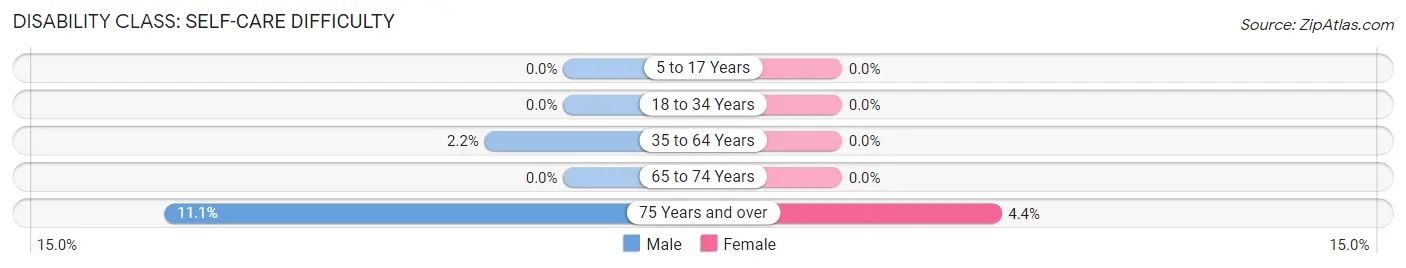
| Age Bracket | Male | Female |
| 5 to 17 Years | 0 (0.0%) | 0 (0.0%) |
| 18 to 34 Years | 0 (0.0%) | 0 (0.0%) |
| 35 to 64 Years | 3 (2.2%) | 0 (0.0%) |
| 65 to 74 Years | 0 (0.0%) | 0 (0.0%) |
| 75 Years and over | 3 (11.1%) | 2 (4.4%) |
Technology Access in Port Trevorton
Computing Device Access in Port Trevorton
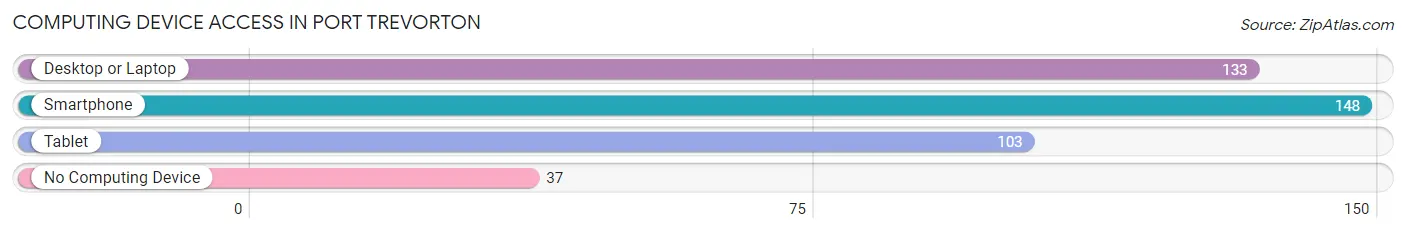
| Device Type | # Households | % Households |
| Desktop or Laptop | 133 | 66.8% |
| Smartphone | 148 | 74.4% |
| Tablet | 103 | 51.8% |
| No Computing Device | 37 | 18.6% |
| Total | 199 | 100.0% |
Internet Access in Port Trevorton
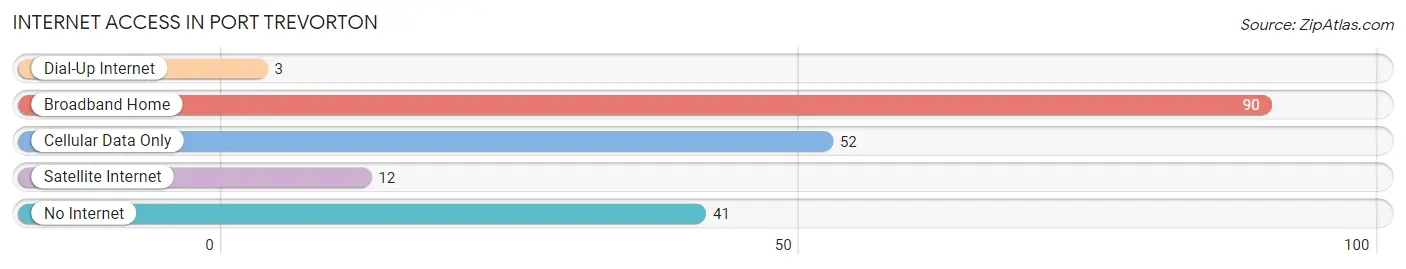
| Internet Type | # Households | % Households |
| Dial-Up Internet | 3 | 1.5% |
| Broadband Home | 90 | 45.2% |
| Cellular Data Only | 52 | 26.1% |
| Satellite Internet | 12 | 6.0% |
| No Internet | 41 | 20.6% |
| Total | 199 | 100.0% |
Port Trevorton Summary
History
The small town of Port Trevorton, Pennsylvania is located in the Susquehanna Valley, in the southeastern part of the state. It is situated on the banks of the Susquehanna River, and is part of the larger Susquehanna Valley region. The town was founded in 1790 by William Trevorton, a Quaker from Philadelphia. Trevorton purchased the land from the Iroquois Indians, and named the town after himself.
The town was originally a small farming community, and the main industry was agriculture. The town was also home to a number of small businesses, including a grist mill, a saw mill, a tannery, and a blacksmith shop. The town was also home to a number of churches, including the First Presbyterian Church, which was founded in 1802.
In the late 19th century, the town began to grow and develop. The Susquehanna Valley Railroad was built in 1871, connecting Port Trevorton to the larger cities of Harrisburg and Williamsport. This allowed for the transportation of goods and people, and helped to spur the growth of the town.
In the early 20th century, the town continued to grow and develop. The Susquehanna Valley Canal was built in 1906, connecting Port Trevorton to the larger cities of Harrisburg and Williamsport. This allowed for the transportation of goods and people, and helped to spur the growth of the town.
The town was also home to a number of industries, including a brickyard, a furniture factory, and a canning factory. The town was also home to a number of schools, including the Port Trevorton High School, which was founded in 1910.
The town continued to grow and develop throughout the 20th century. In the 1950s, the town was home to a number of businesses, including a grocery store, a hardware store, and a movie theater. The town was also home to a number of churches, including the First Presbyterian Church, which was founded in 1802.
Geography
Port Trevorton is located in the Susquehanna Valley, in the southeastern part of the state. It is situated on the banks of the Susquehanna River, and is part of the larger Susquehanna Valley region. The town is located in Snyder County, and is bordered by the towns of Middleburg, Freeburg, and Selinsgrove.
The town is located at an elevation of approximately 500 feet above sea level. The climate in the area is generally mild, with temperatures ranging from the low 30s in the winter to the mid-80s in the summer. The town receives an average of 40 inches of precipitation per year.
Economy
The economy of Port Trevorton is largely based on agriculture and tourism. The town is home to a number of farms, which produce a variety of crops, including corn, soybeans, wheat, and hay. The town is also home to a number of small businesses, including a grocery store, a hardware store, and a movie theater.
The town is also home to a number of tourist attractions, including the Susquehanna Valley Canal, which was built in 1906. The canal is a popular destination for boaters, fishermen, and hikers. The town is also home to a number of historic sites, including the First Presbyterian Church, which was founded in 1802.
Demographics
As of the 2010 census, the population of Port Trevorton was 1,845. The population is largely white (96.2%), with a small percentage of African Americans (1.2%) and Hispanics (1.2%). The median household income in the town is $45,000, and the median age is 43.
The town is home to a number of churches, including the First Presbyterian Church, which was founded in 1802. The town is also home to a number of schools, including the Port Trevorton High School, which was founded in 1910. The town is served by the Selinsgrove Area School District.
Common Questions
What is Per Capita Income in Port Trevorton?
Per Capita income in Port Trevorton is $27,063.
What is the Median Family Income in Port Trevorton?
Median Family Income in Port Trevorton is $69,375.
What is the Median Household income in Port Trevorton?
Median Household Income in Port Trevorton is $67,917.
What is Income or Wage Gap in Port Trevorton?
Income or Wage Gap in Port Trevorton is 43.4%.
Women in Port Trevorton earn 56.6 cents for every dollar earned by a man.
What is Inequality or Gini Index in Port Trevorton?
Inequality or Gini Index in Port Trevorton is 0.36.
What is the Total Population of Port Trevorton?
Total Population of Port Trevorton is 629.
What is the Total Male Population of Port Trevorton?
Total Male Population of Port Trevorton is 374.
What is the Total Female Population of Port Trevorton?
Total Female Population of Port Trevorton is 255.
What is the Ratio of Males per 100 Females in Port Trevorton?
There are 146.67 Males per 100 Females in Port Trevorton.
What is the Ratio of Females per 100 Males in Port Trevorton?
There are 68.18 Females per 100 Males in Port Trevorton.
What is the Median Population Age in Port Trevorton?
Median Population Age in Port Trevorton is 36.9 Years.
What is the Average Family Size in Port Trevorton
Average Family Size in Port Trevorton is 3.5 People.
What is the Average Household Size in Port Trevorton
Average Household Size in Port Trevorton is 3.2 People.
How Large is the Labor Force in Port Trevorton?
There are 321 People in the Labor Forcein in Port Trevorton.
What is the Percentage of People in the Labor Force in Port Trevorton?
63.3% of People are in the Labor Force in Port Trevorton.
What is the Unemployment Rate in Port Trevorton?
Unemployment Rate in Port Trevorton is 2.5%.