Wayne Heights, PA Map & Demographics
Wayne Heights Map
Wayne Heights Overview
$40,741
PER CAPITA INCOME
$107,900
AVG FAMILY INCOME
$85,880
AVG HOUSEHOLD INCOME
48.7%
WAGE / INCOME GAP [ % ]
51.3¢/ $1
WAGE / INCOME GAP [ $ ]
0.37
INEQUALITY / GINI INDEX
3,147
TOTAL POPULATION
1,601
MALE POPULATION
1,546
FEMALE POPULATION
103.56
MALES / 100 FEMALES
96.56
FEMALES / 100 MALES
39.3
MEDIAN AGE
3.0
AVG FAMILY SIZE
2.5
AVG HOUSEHOLD SIZE
1,715
LABOR FORCE [ PEOPLE ]
69.6%
PERCENT IN LABOR FORCE
2.3%
UNEMPLOYMENT RATE
Income in Wayne Heights
Income Overview in Wayne Heights
Per Capita Income in Wayne Heights is $40,741, while median incomes of families and households are $107,900 and $85,880 respectively.
| Characteristic | Number | Measure |
| Per Capita Income | 3,147 | $40,741 |
| Median Family Income | 922 | $107,900 |
| Mean Family Income | 922 | $112,922 |
| Median Household Income | 1,255 | $85,880 |
| Mean Household Income | 1,255 | $99,011 |
| Income Deficit | 922 | $0 |
| Wage / Income Gap (%) | 3,147 | 48.68% |
| Wage / Income Gap ($) | 3,147 | 51.32¢ per $1 |
| Gini / Inequality Index | 3,147 | 0.37 |
Earnings by Sex in Wayne Heights
Average Earnings in Wayne Heights are $43,259, $57,384 for men and $29,447 for women, a difference of 48.7%.
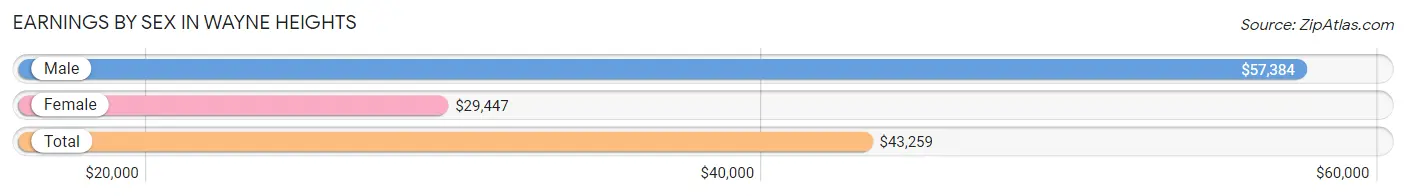
| Sex | Number | Average Earnings |
| Male | 1,026 (56.9%) | $57,384 |
| Female | 778 (43.1%) | $29,447 |
| Total | 1,804 (100.0%) | $43,259 |
Earnings by Sex by Income Bracket in Wayne Heights
The most common earnings brackets in Wayne Heights are $100,000+ for men (194 | 18.9%) and $25,000 to $29,999 for women (180 | 23.1%).
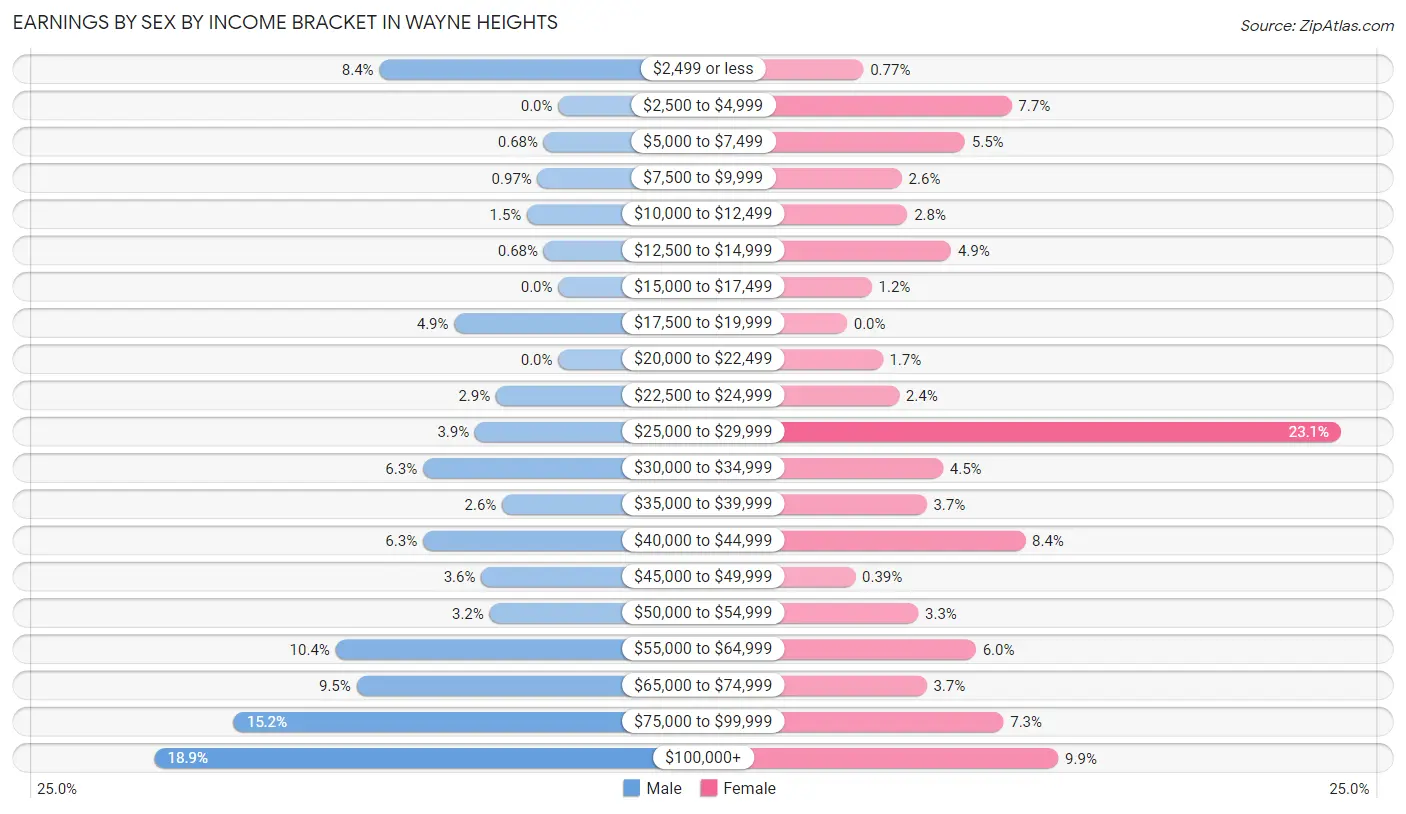
| Income | Male | Female |
| $2,499 or less | 86 (8.4%) | 6 (0.8%) |
| $2,500 to $4,999 | 0 (0.0%) | 60 (7.7%) |
| $5,000 to $7,499 | 7 (0.7%) | 43 (5.5%) |
| $7,500 to $9,999 | 10 (1.0%) | 20 (2.6%) |
| $10,000 to $12,499 | 15 (1.5%) | 22 (2.8%) |
| $12,500 to $14,999 | 7 (0.7%) | 38 (4.9%) |
| $15,000 to $17,499 | 0 (0.0%) | 9 (1.2%) |
| $17,500 to $19,999 | 50 (4.9%) | 0 (0.0%) |
| $20,000 to $22,499 | 0 (0.0%) | 13 (1.7%) |
| $22,500 to $24,999 | 30 (2.9%) | 19 (2.4%) |
| $25,000 to $29,999 | 40 (3.9%) | 180 (23.1%) |
| $30,000 to $34,999 | 65 (6.3%) | 35 (4.5%) |
| $35,000 to $39,999 | 27 (2.6%) | 29 (3.7%) |
| $40,000 to $44,999 | 65 (6.3%) | 65 (8.4%) |
| $45,000 to $49,999 | 37 (3.6%) | 3 (0.4%) |
| $50,000 to $54,999 | 33 (3.2%) | 26 (3.3%) |
| $55,000 to $64,999 | 107 (10.4%) | 47 (6.0%) |
| $65,000 to $74,999 | 97 (9.5%) | 29 (3.7%) |
| $75,000 to $99,999 | 156 (15.2%) | 57 (7.3%) |
| $100,000+ | 194 (18.9%) | 77 (9.9%) |
| Total | 1,026 (100.0%) | 778 (100.0%) |
Earnings by Sex by Educational Attainment in Wayne Heights
Average earnings in Wayne Heights are $67,614 for men and $30,417 for women, a difference of 55.0%. Men with an educational attainment of graduate degree enjoy the highest average annual earnings of $75,769, while those with high school diploma education earn the least with $49,375. Women with an educational attainment of college or associate's degree earn the most with the average annual earnings of $32,589, while those with high school diploma education have the smallest earnings of $28,218.
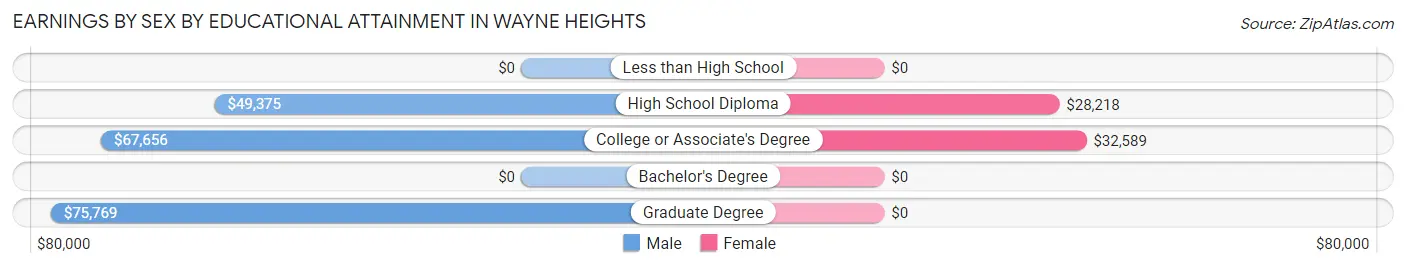
| Educational Attainment | Male Income | Female Income |
| Less than High School | - | - |
| High School Diploma | $49,375 | $28,218 |
| College or Associate's Degree | $67,656 | $32,589 |
| Bachelor's Degree | - | - |
| Graduate Degree | $75,769 | $0 |
| Total | $67,614 | $30,417 |
Family Income in Wayne Heights
Family Income Brackets in Wayne Heights
According to the Wayne Heights family income data, there are 241 families falling into the $100,000 to $149,999 income range, which is the most common income bracket and makes up 26.1% of all families.
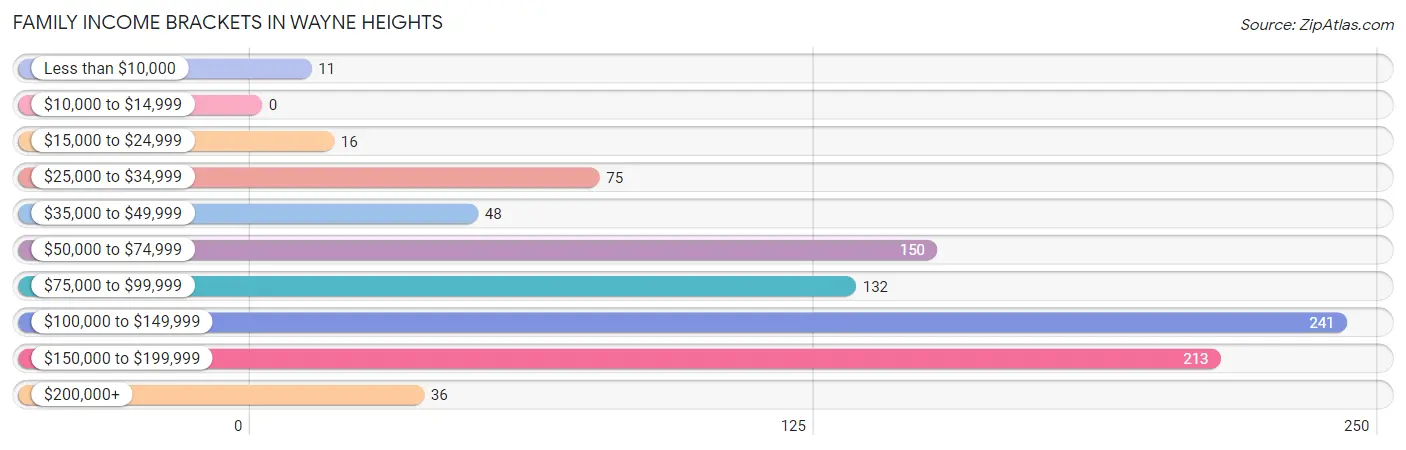
| Income Bracket | # Families | % Families |
| Less than $10,000 | 11 | 1.2% |
| $10,000 to $14,999 | 0 | 0.0% |
| $15,000 to $24,999 | 16 | 1.7% |
| $25,000 to $34,999 | 75 | 8.1% |
| $35,000 to $49,999 | 48 | 5.2% |
| $50,000 to $74,999 | 150 | 16.3% |
| $75,000 to $99,999 | 132 | 14.3% |
| $100,000 to $149,999 | 241 | 26.1% |
| $150,000 to $199,999 | 213 | 23.1% |
| $200,000+ | 36 | 3.9% |
Family Income by Famaliy Size in Wayne Heights
4-person families (177 | 19.2%) account for the highest median family income in Wayne Heights with $153,401 per family, while 3-person families (147 | 15.9%) have the highest median income of $40,739 per family member.
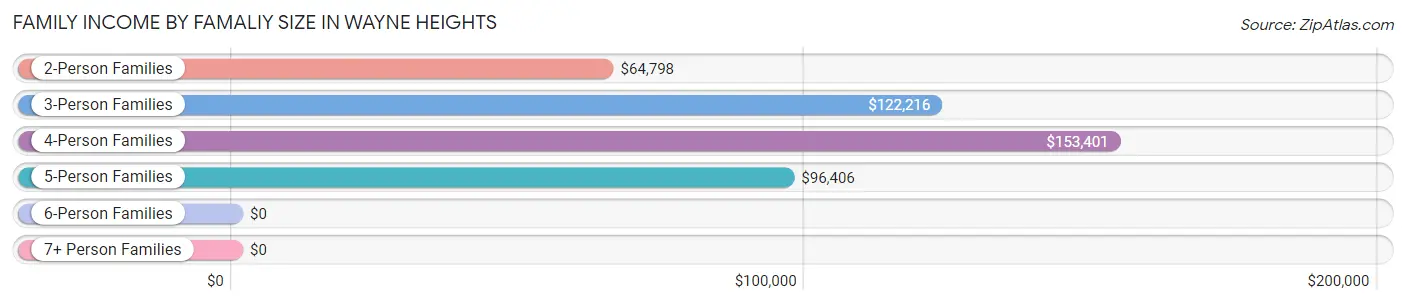
| Income Bracket | # Families | Median Income |
| 2-Person Families | 480 (52.1%) | $64,798 |
| 3-Person Families | 147 (15.9%) | $122,216 |
| 4-Person Families | 177 (19.2%) | $153,401 |
| 5-Person Families | 83 (9.0%) | $96,406 |
| 6-Person Families | 11 (1.2%) | $0 |
| 7+ Person Families | 24 (2.6%) | $0 |
| Total | 922 (100.0%) | $107,900 |
Family Income by Number of Earners in Wayne Heights
The median family income in Wayne Heights is $107,900, with families comprising 3+ earners (98) having the highest median family income of $128,917, while families with no earners (92) have the lowest median family income of $53,750, accounting for 10.6% and 10.0% of families, respectively.
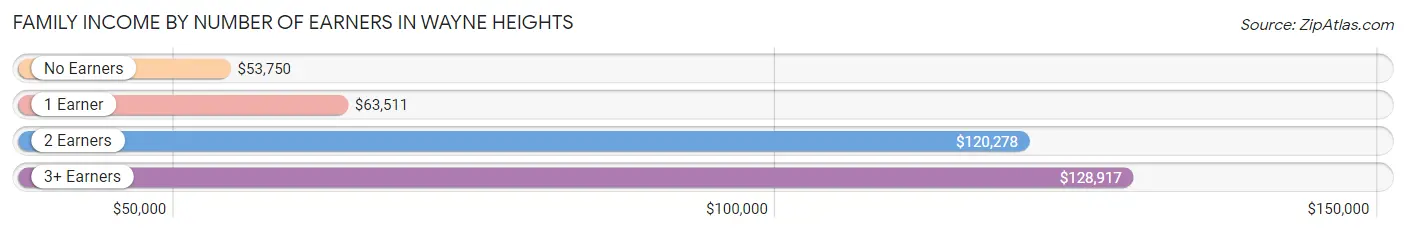
| Number of Earners | # Families | Median Income |
| No Earners | 92 (10.0%) | $53,750 |
| 1 Earner | 256 (27.8%) | $63,511 |
| 2 Earners | 476 (51.6%) | $120,278 |
| 3+ Earners | 98 (10.6%) | $128,917 |
| Total | 922 (100.0%) | $107,900 |
Household Income in Wayne Heights
Household Income Brackets in Wayne Heights
With 251 households falling in the category, the $100,000 to $149,999 income range is the most frequent in Wayne Heights, accounting for 20.0% of all households. In contrast, only 9 households (0.7%) fall into the $10,000 to $14,999 income bracket, making it the least populous group.
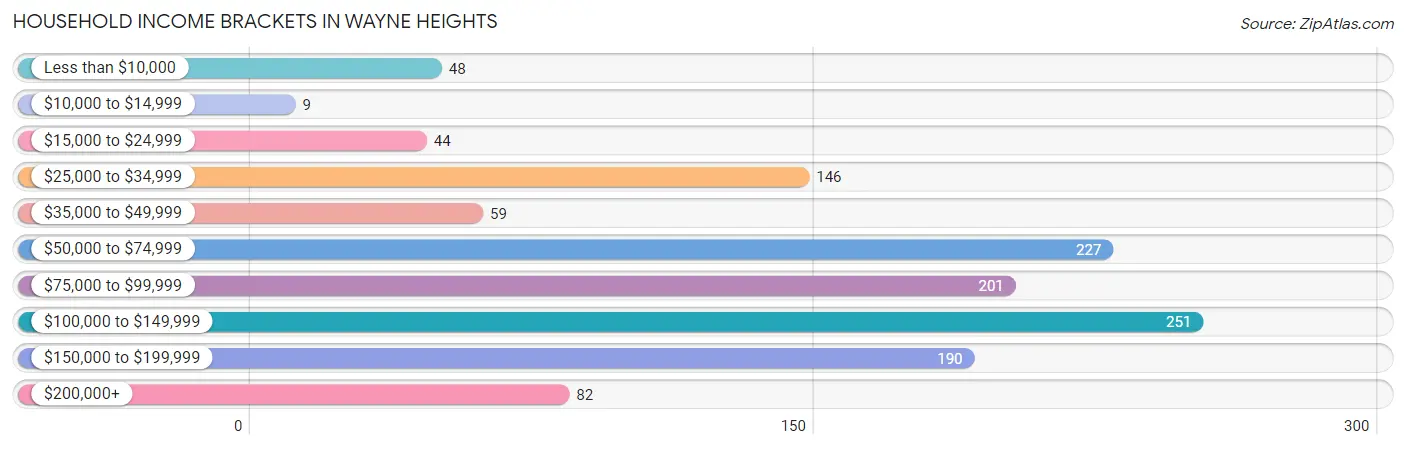
| Income Bracket | # Households | % Households |
| Less than $10,000 | 48 | 3.8% |
| $10,000 to $14,999 | 9 | 0.7% |
| $15,000 to $24,999 | 44 | 3.5% |
| $25,000 to $34,999 | 146 | 11.6% |
| $35,000 to $49,999 | 59 | 4.7% |
| $50,000 to $74,999 | 227 | 18.1% |
| $75,000 to $99,999 | 201 | 16.0% |
| $100,000 to $149,999 | 251 | 20.0% |
| $150,000 to $199,999 | 190 | 15.1% |
| $200,000+ | 82 | 6.5% |
Household Income by Householder Age in Wayne Heights
The median household income in Wayne Heights is $85,880, with the highest median household income of $107,667 found in the 25 to 44 years age bracket for the primary householder. A total of 392 households (31.2%) fall into this category. Meanwhile, the 15 to 24 years age bracket for the primary householder has the lowest median household income of $0, with 25 households (2.0%) in this group.
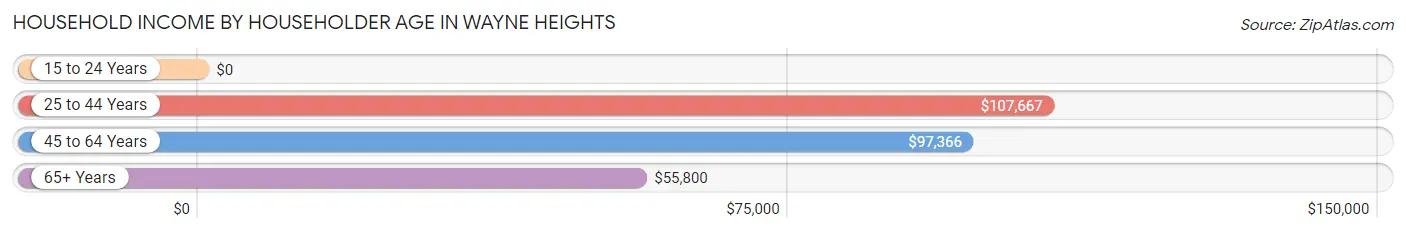
| Income Bracket | # Households | Median Income |
| 15 to 24 Years | 25 (2.0%) | $0 |
| 25 to 44 Years | 392 (31.2%) | $107,667 |
| 45 to 64 Years | 502 (40.0%) | $97,366 |
| 65+ Years | 336 (26.8%) | $55,800 |
| Total | 1,255 (100.0%) | $85,880 |
Poverty in Wayne Heights
Income Below Poverty by Sex and Age in Wayne Heights
With 0.7% poverty level for males and 3.7% for females among the residents of Wayne Heights, 55 to 64 year old males and 75 year old and over females are the most vulnerable to poverty, with 11 males (9.3%) and 37 females (20.1%) in their respective age groups living below the poverty level.
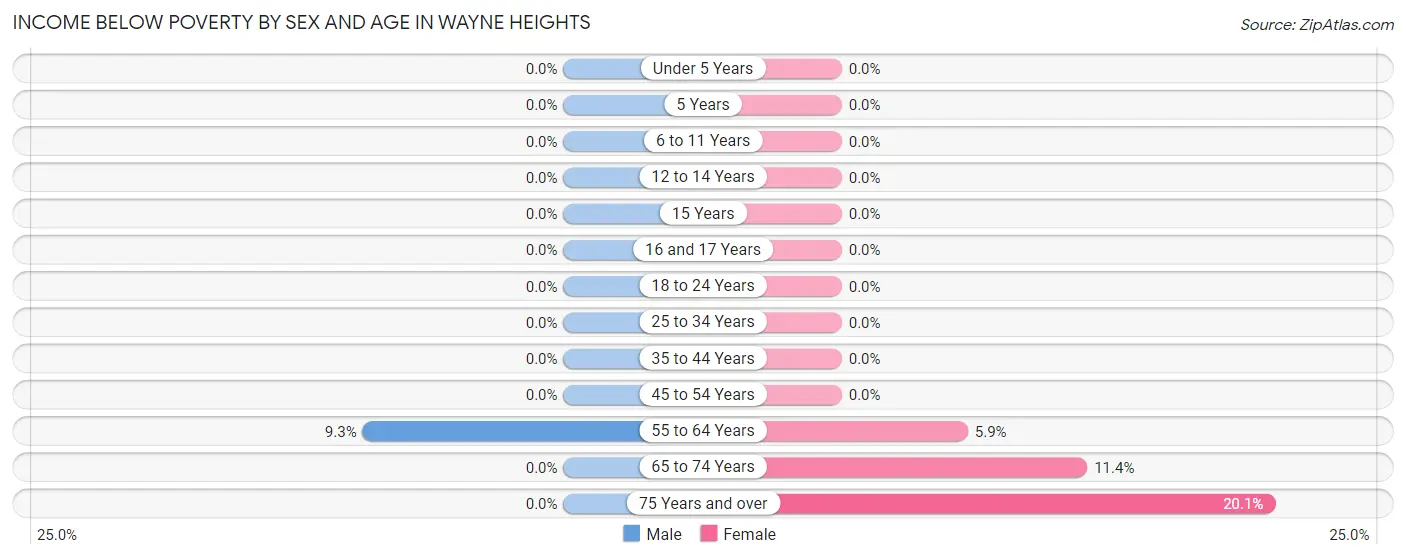
| Age Bracket | Male | Female |
| Under 5 Years | 0 (0.0%) | 0 (0.0%) |
| 5 Years | 0 (0.0%) | 0 (0.0%) |
| 6 to 11 Years | 0 (0.0%) | 0 (0.0%) |
| 12 to 14 Years | 0 (0.0%) | 0 (0.0%) |
| 15 Years | 0 (0.0%) | 0 (0.0%) |
| 16 and 17 Years | 0 (0.0%) | 0 (0.0%) |
| 18 to 24 Years | 0 (0.0%) | 0 (0.0%) |
| 25 to 34 Years | 0 (0.0%) | 0 (0.0%) |
| 35 to 44 Years | 0 (0.0%) | 0 (0.0%) |
| 45 to 54 Years | 0 (0.0%) | 0 (0.0%) |
| 55 to 64 Years | 11 (9.3%) | 12 (5.9%) |
| 65 to 74 Years | 0 (0.0%) | 9 (11.4%) |
| 75 Years and over | 0 (0.0%) | 37 (20.1%) |
| Total | 11 (0.7%) | 58 (3.7%) |
Income Above Poverty by Sex and Age in Wayne Heights
According to the poverty statistics in Wayne Heights, males aged under 5 years and females aged under 5 years are the age groups that are most secure financially, with 100.0% of males and 100.0% of females in these age groups living above the poverty line.
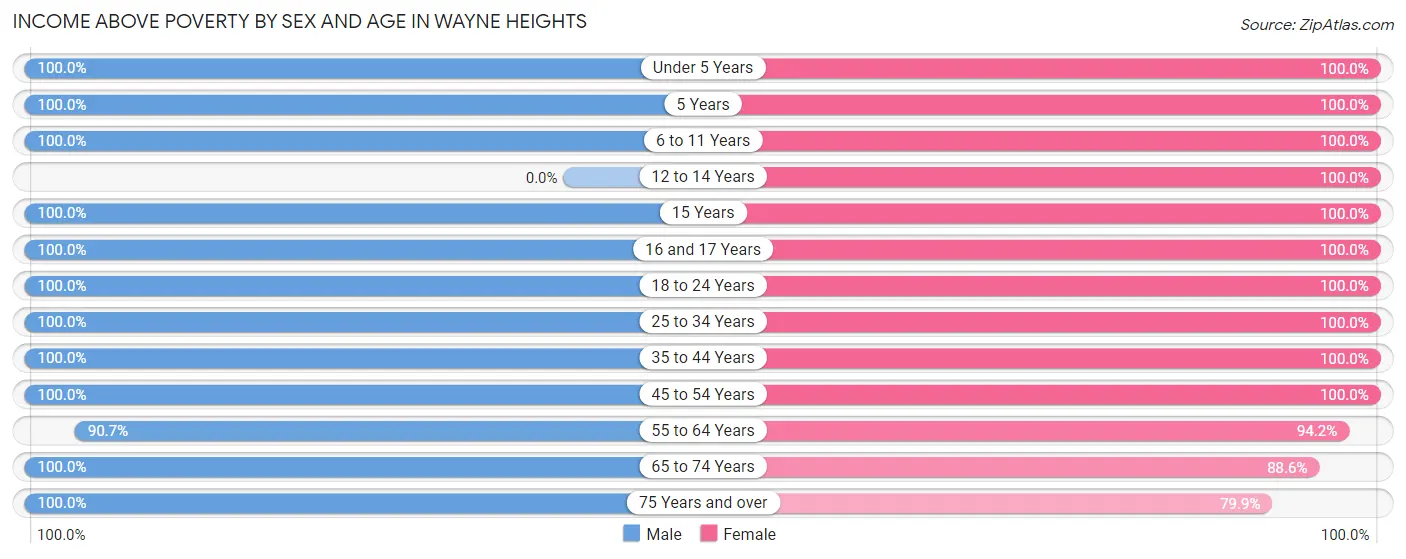
| Age Bracket | Male | Female |
| Under 5 Years | 85 (100.0%) | 25 (100.0%) |
| 5 Years | 49 (100.0%) | 11 (100.0%) |
| 6 to 11 Years | 163 (100.0%) | 138 (100.0%) |
| 12 to 14 Years | 0 (0.0%) | 86 (100.0%) |
| 15 Years | 60 (100.0%) | 66 (100.0%) |
| 16 and 17 Years | 40 (100.0%) | 31 (100.0%) |
| 18 to 24 Years | 158 (100.0%) | 74 (100.0%) |
| 25 to 34 Years | 154 (100.0%) | 211 (100.0%) |
| 35 to 44 Years | 247 (100.0%) | 276 (100.0%) |
| 45 to 54 Years | 361 (100.0%) | 160 (100.0%) |
| 55 to 64 Years | 107 (90.7%) | 193 (94.2%) |
| 65 to 74 Years | 78 (100.0%) | 70 (88.6%) |
| 75 Years and over | 88 (100.0%) | 147 (79.9%) |
| Total | 1,590 (99.3%) | 1,488 (96.3%) |
Income Below Poverty Among Married-Couple Families in Wayne Heights
The poverty statistics for married-couple families in Wayne Heights show that 1.5% or 11 of the total 730 families live below the poverty line. Families with no children have the highest poverty rate of 2.6%, comprising of 11 families. On the other hand, families with 1 or 2 children have the lowest poverty rate of 0.0%, which includes 0 families.
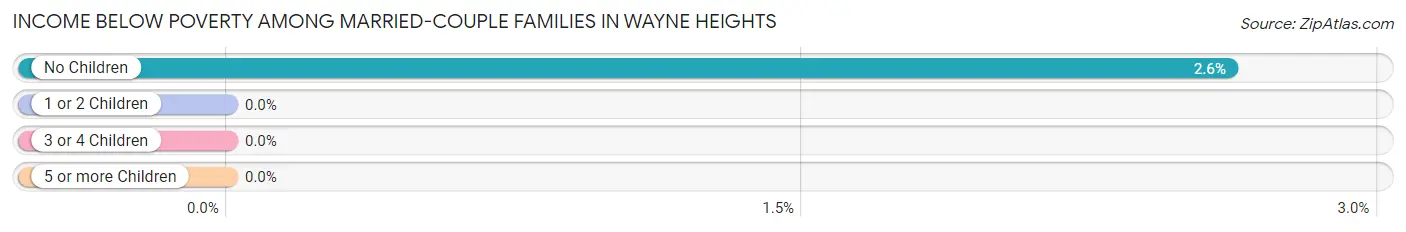
| Children | Above Poverty | Below Poverty |
| No Children | 410 (97.4%) | 11 (2.6%) |
| 1 or 2 Children | 212 (100.0%) | 0 (0.0%) |
| 3 or 4 Children | 73 (100.0%) | 0 (0.0%) |
| 5 or more Children | 24 (100.0%) | 0 (0.0%) |
| Total | 719 (98.5%) | 11 (1.5%) |
Income Below Poverty Among Single-Parent Households in Wayne Heights
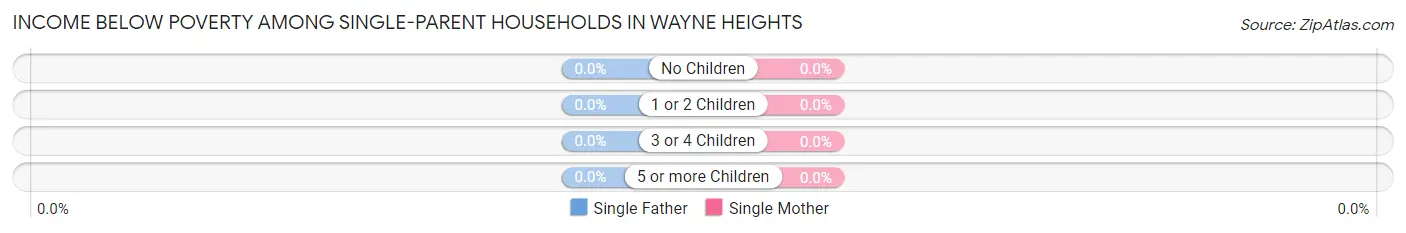
| Children | Single Father | Single Mother |
| No Children | 0 (0.0%) | 0 (0.0%) |
| 1 or 2 Children | 0 (0.0%) | 0 (0.0%) |
| 3 or 4 Children | 0 (0.0%) | 0 (0.0%) |
| 5 or more Children | 0 (0.0%) | 0 (0.0%) |
| Total | 0 (0.0%) | 0 (0.0%) |
Income Below Poverty Among Married-Couple vs Single-Parent Households in Wayne Heights
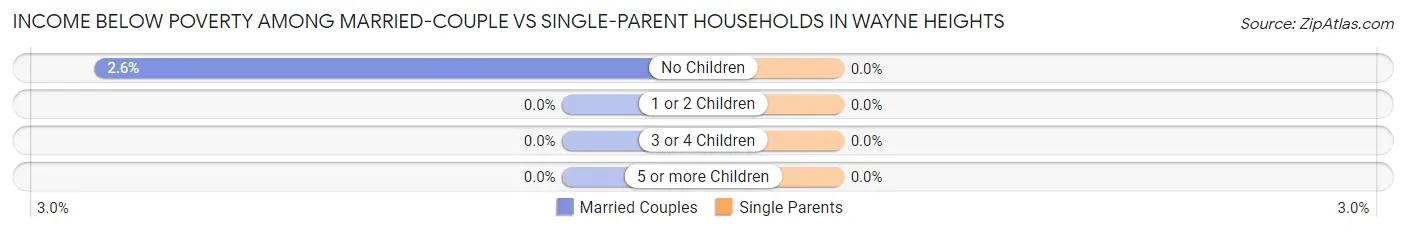
| Children | Married-Couple Families | Single-Parent Households |
| No Children | 11 (2.6%) | 0 (0.0%) |
| 1 or 2 Children | 0 (0.0%) | 0 (0.0%) |
| 3 or 4 Children | 0 (0.0%) | 0 (0.0%) |
| 5 or more Children | 0 (0.0%) | 0 (0.0%) |
| Total | 11 (1.5%) | 0 (0.0%) |
Race in Wayne Heights
The most populous races in Wayne Heights are White / Caucasian (2,803 | 89.1%), Two or more Races (210 | 6.7%), and Hispanic or Latino (170 | 5.4%).
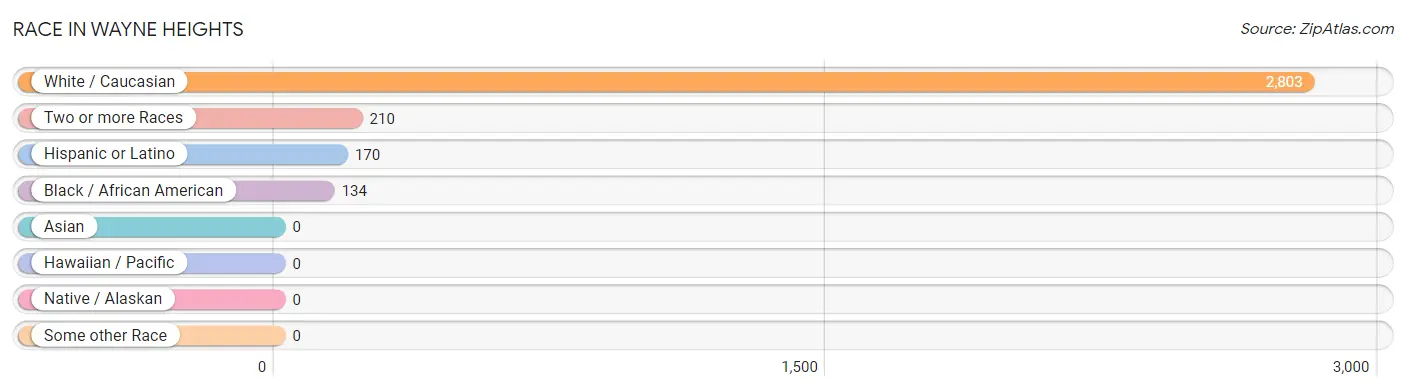
| Race | # Population | % Population |
| Asian | 0 | 0.0% |
| Black / African American | 134 | 4.3% |
| Hawaiian / Pacific | 0 | 0.0% |
| Hispanic or Latino | 170 | 5.4% |
| Native / Alaskan | 0 | 0.0% |
| White / Caucasian | 2,803 | 89.1% |
| Two or more Races | 210 | 6.7% |
| Some other Race | 0 | 0.0% |
| Total | 3,147 | 100.0% |
Ancestry in Wayne Heights
The most populous ancestries reported in Wayne Heights are German (1,026 | 32.6%), Irish (363 | 11.5%), Scottish (343 | 10.9%), American (237 | 7.5%), and French (199 | 6.3%), together accounting for 68.9% of all Wayne Heights residents.
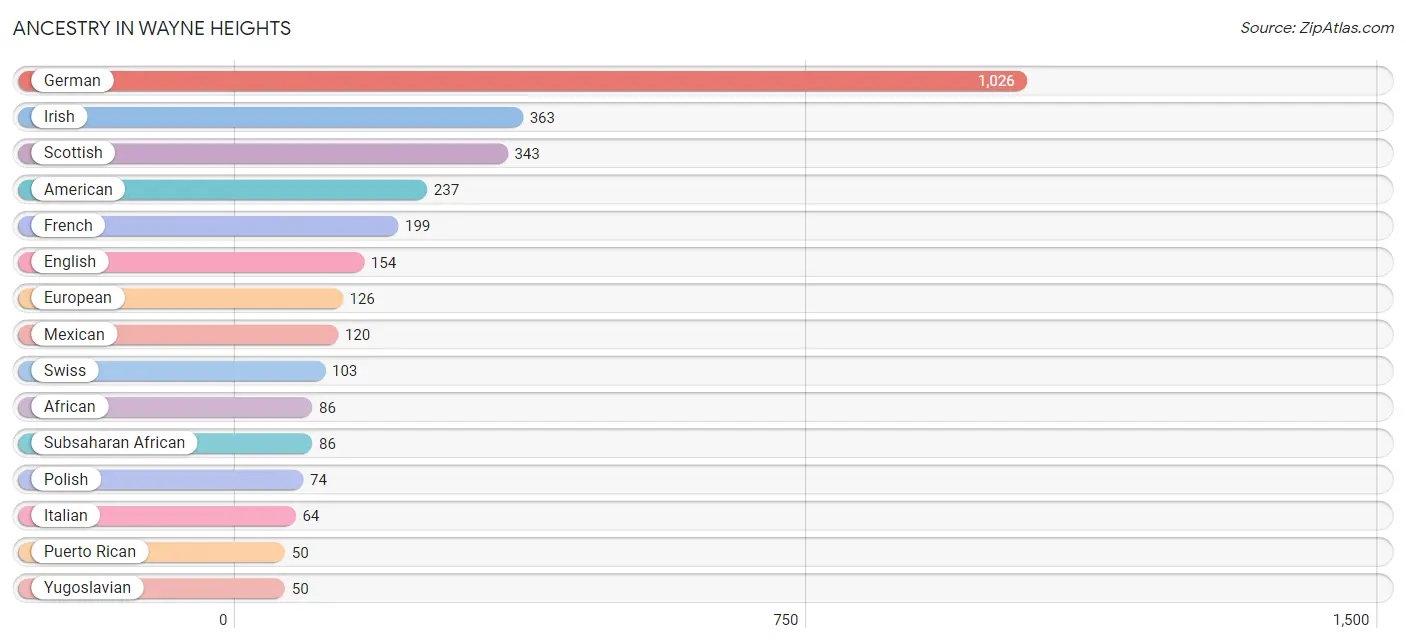
| Ancestry | # Population | % Population |
| African | 86 | 2.7% |
| American | 237 | 7.5% |
| Arab | 7 | 0.2% |
| British | 23 | 0.7% |
| Croatian | 7 | 0.2% |
| English | 154 | 4.9% |
| European | 126 | 4.0% |
| Finnish | 10 | 0.3% |
| French | 199 | 6.3% |
| French Canadian | 24 | 0.8% |
| German | 1,026 | 32.6% |
| Iranian | 11 | 0.4% |
| Irish | 363 | 11.5% |
| Italian | 64 | 2.0% |
| Lebanese | 7 | 0.2% |
| Mexican | 120 | 3.8% |
| Norwegian | 14 | 0.4% |
| Polish | 74 | 2.4% |
| Puerto Rican | 50 | 1.6% |
| Scottish | 343 | 10.9% |
| Slavic | 4 | 0.1% |
| Subsaharan African | 86 | 2.7% |
| Swedish | 6 | 0.2% |
| Swiss | 103 | 3.3% |
| Welsh | 18 | 0.6% |
| Yugoslavian | 50 | 1.6% | View All 26 Rows |
Immigrants in Wayne Heights
The most numerous immigrant groups reported in Wayne Heights came from Central America (66 | 2.1%), Latin America (66 | 2.1%), Mexico (66 | 2.1%), Eastern Europe (17 | 0.5%), and Europe (17 | 0.5%), together accounting for 7.4% of all Wayne Heights residents.
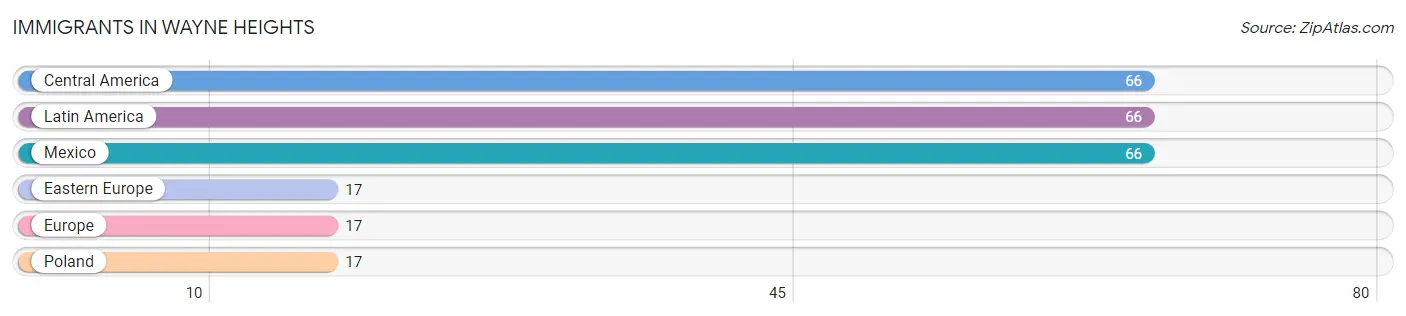
| Immigration Origin | # Population | % Population |
| Central America | 66 | 2.1% |
| Eastern Europe | 17 | 0.5% |
| Europe | 17 | 0.5% |
| Latin America | 66 | 2.1% |
| Mexico | 66 | 2.1% |
| Poland | 17 | 0.5% | View All 6 Rows |
Sex and Age in Wayne Heights
Sex and Age in Wayne Heights
The most populous age groups in Wayne Heights are 15 to 19 Years (201 | 12.6%) for men and 35 to 39 Years (177 | 11.5%) for women.
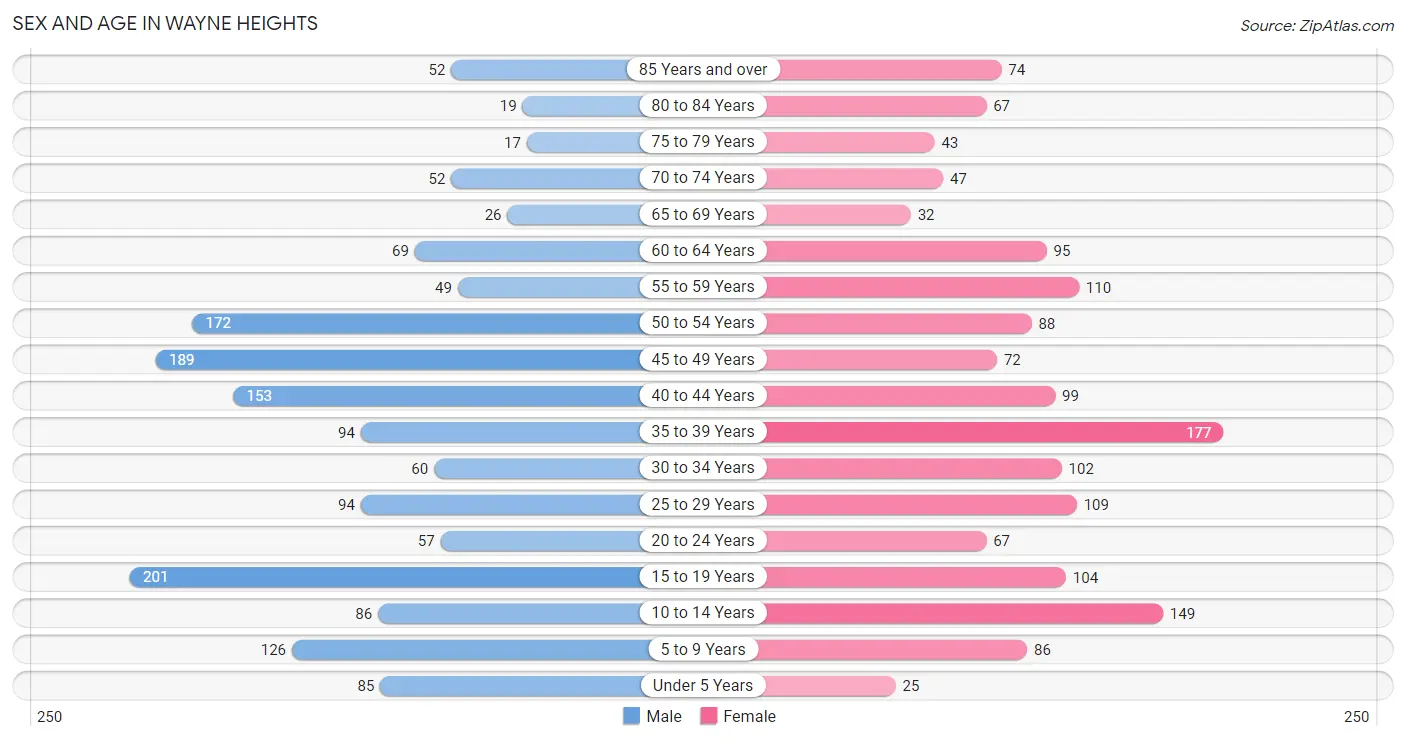
| Age Bracket | Male | Female |
| Under 5 Years | 85 (5.3%) | 25 (1.6%) |
| 5 to 9 Years | 126 (7.9%) | 86 (5.6%) |
| 10 to 14 Years | 86 (5.4%) | 149 (9.6%) |
| 15 to 19 Years | 201 (12.6%) | 104 (6.7%) |
| 20 to 24 Years | 57 (3.6%) | 67 (4.3%) |
| 25 to 29 Years | 94 (5.9%) | 109 (7.0%) |
| 30 to 34 Years | 60 (3.7%) | 102 (6.6%) |
| 35 to 39 Years | 94 (5.9%) | 177 (11.5%) |
| 40 to 44 Years | 153 (9.6%) | 99 (6.4%) |
| 45 to 49 Years | 189 (11.8%) | 72 (4.7%) |
| 50 to 54 Years | 172 (10.7%) | 88 (5.7%) |
| 55 to 59 Years | 49 (3.1%) | 110 (7.1%) |
| 60 to 64 Years | 69 (4.3%) | 95 (6.1%) |
| 65 to 69 Years | 26 (1.6%) | 32 (2.1%) |
| 70 to 74 Years | 52 (3.3%) | 47 (3.0%) |
| 75 to 79 Years | 17 (1.1%) | 43 (2.8%) |
| 80 to 84 Years | 19 (1.2%) | 67 (4.3%) |
| 85 Years and over | 52 (3.3%) | 74 (4.8%) |
| Total | 1,601 (100.0%) | 1,546 (100.0%) |
Families and Households in Wayne Heights
Median Family Size in Wayne Heights
The median family size in Wayne Heights is 2.95 persons per family, with married-couple families (730 | 79.2%) accounting for the largest median family size of 3.06 persons per family. On the other hand, single female/mother families (77 | 8.4%) represent the smallest median family size with 1.91 persons per family.
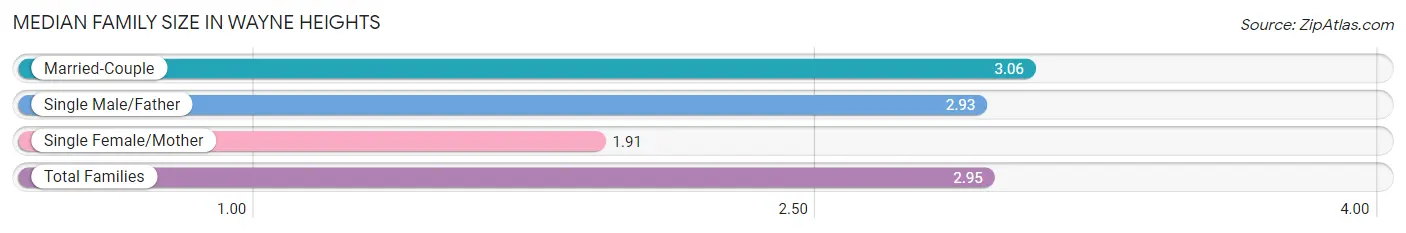
| Family Type | # Families | Family Size |
| Married-Couple | 730 (79.2%) | 3.06 |
| Single Male/Father | 115 (12.5%) | 2.93 |
| Single Female/Mother | 77 (8.4%) | 1.91 |
| Total Families | 922 (100.0%) | 2.95 |
Median Household Size in Wayne Heights
The median household size in Wayne Heights is 2.51 persons per household, with single male/father households (115 | 9.2%) accounting for the largest median household size of 3.45 persons per household. non-family households (333 | 26.5%) represent the smallest median household size with 1.10 persons per household.
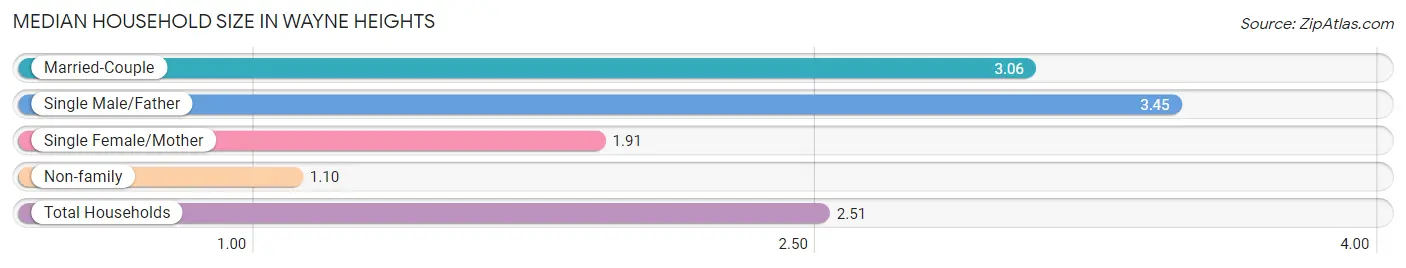
| Household Type | # Households | Household Size |
| Married-Couple | 730 (58.2%) | 3.06 |
| Single Male/Father | 115 (9.2%) | 3.45 |
| Single Female/Mother | 77 (6.1%) | 1.91 |
| Non-family | 333 (26.5%) | 1.10 |
| Total Households | 1,255 (100.0%) | 2.51 |
Household Size by Marriage Status in Wayne Heights
Out of a total of 1,255 households in Wayne Heights, 922 (73.5%) are family households, while 333 (26.5%) are nonfamily households. The most numerous type of family households are 2-person households, comprising 480, and the most common type of nonfamily households are 1-person households, comprising 301.
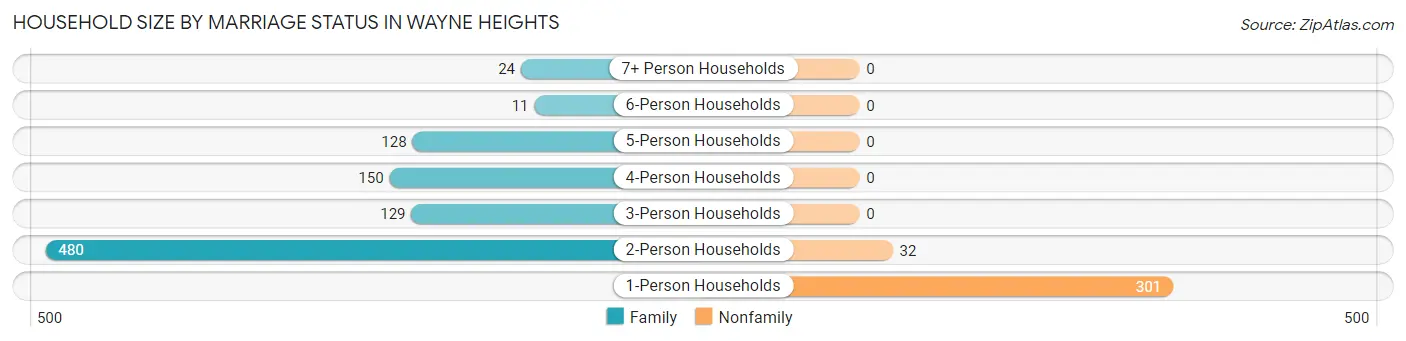
| Household Size | Family Households | Nonfamily Households |
| 1-Person Households | - | 301 (24.0%) |
| 2-Person Households | 480 (38.3%) | 32 (2.5%) |
| 3-Person Households | 129 (10.3%) | 0 (0.0%) |
| 4-Person Households | 150 (11.9%) | 0 (0.0%) |
| 5-Person Households | 128 (10.2%) | 0 (0.0%) |
| 6-Person Households | 11 (0.9%) | 0 (0.0%) |
| 7+ Person Households | 24 (1.9%) | 0 (0.0%) |
| Total | 922 (73.5%) | 333 (26.5%) |
Female Fertility in Wayne Heights
Fertility by Age in Wayne Heights
Average fertility rate in Wayne Heights is 38.0 births per 1,000 women. Women in the age bracket of 20 to 34 years have the highest fertility rate with 76.0 births per 1,000 women. Women in the age bracket of 20 to 34 years acount for 75.0% of all women with births.
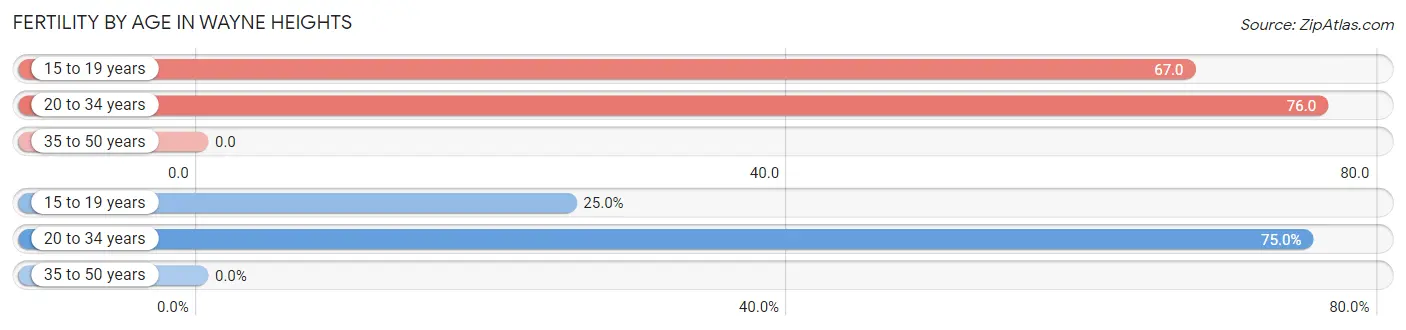
| Age Bracket | Women with Births | Births / 1,000 Women |
| 15 to 19 years | 7 (25.0%) | 67.0 |
| 20 to 34 years | 21 (75.0%) | 76.0 |
| 35 to 50 years | 0 (0.0%) | 0.0 |
| Total | 28 (100.0%) | 38.0 |
Fertility by Age by Marriage Status in Wayne Heights
75.0% of women with births (28) in Wayne Heights are married. The highest percentage of unmarried women with births falls into 15 to 19 years age bracket with 100.0% of them unmarried at the time of birth, while the lowest percentage of unmarried women with births belong to 20 to 34 years age bracket with 0.0% of them unmarried.
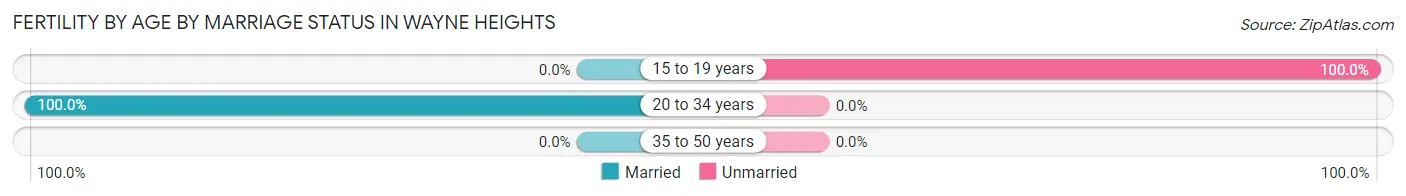
| Age Bracket | Married | Unmarried |
| 15 to 19 years | 0 (0.0%) | 7 (100.0%) |
| 20 to 34 years | 21 (100.0%) | 0 (0.0%) |
| 35 to 50 years | 0 (0.0%) | 0 (0.0%) |
| Total | 21 (75.0%) | 7 (25.0%) |
Fertility by Education in Wayne Heights
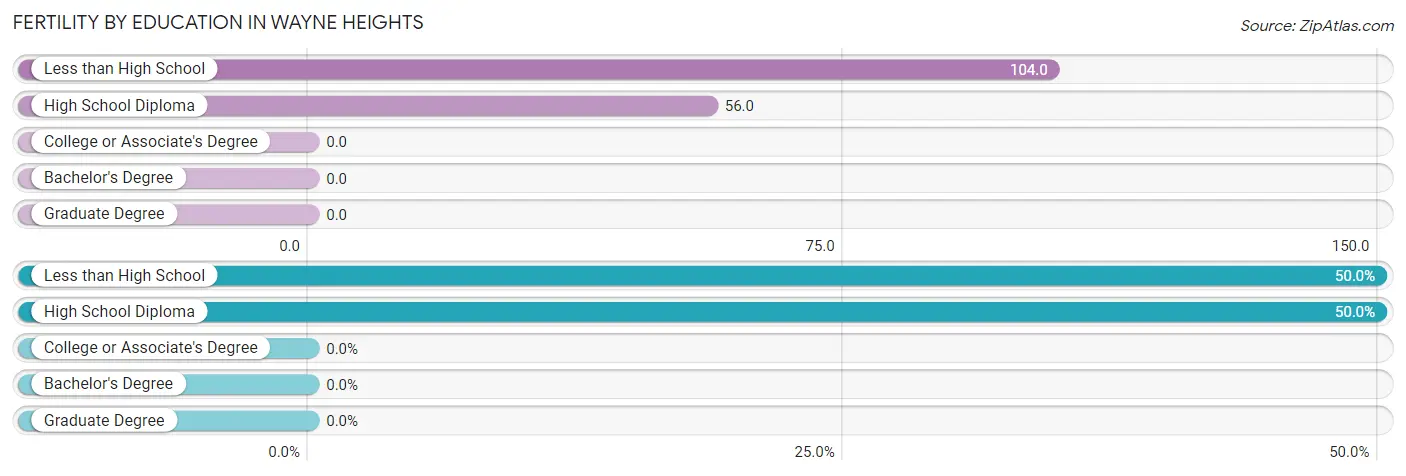
| Educational Attainment | Women with Births | Births / 1,000 Women |
| Less than High School | 14 (50.0%) | 104.0 |
| High School Diploma | 14 (50.0%) | 56.0 |
| College or Associate's Degree | 0 (0.0%) | 0.0 |
| Bachelor's Degree | 0 (0.0%) | 0.0 |
| Graduate Degree | 0 (0.0%) | 0.0 |
| Total | 28 (100.0%) | 38.0 |
Fertility by Education by Marriage Status in Wayne Heights
25.0% of women with births in Wayne Heights are unmarried. Women with the educational attainment of high school diploma are most likely to be married with 100.0% of them married at childbirth, while women with the educational attainment of less than high school are least likely to be married with 50.0% of them unmarried at childbirth.
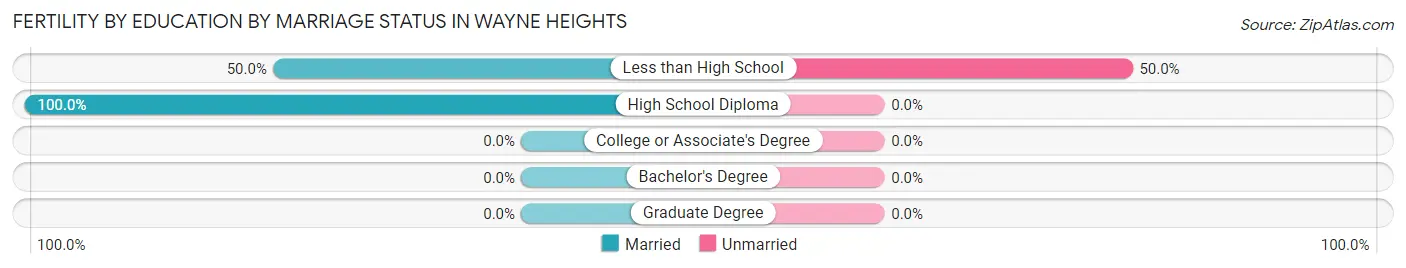
| Educational Attainment | Married | Unmarried |
| Less than High School | 7 (50.0%) | 7 (50.0%) |
| High School Diploma | 14 (100.0%) | 0 (0.0%) |
| College or Associate's Degree | 0 (0.0%) | 0 (0.0%) |
| Bachelor's Degree | 0 (0.0%) | 0 (0.0%) |
| Graduate Degree | 0 (0.0%) | 0 (0.0%) |
| Total | 21 (75.0%) | 7 (25.0%) |
Employment Characteristics in Wayne Heights
Employment by Class of Employer in Wayne Heights
Among the 1,674 employed individuals in Wayne Heights, private company employees (1,238 | 74.0%), not-for-profit organizations (110 | 6.6%), and local government employees (100 | 6.0%) make up the most common classes of employment.
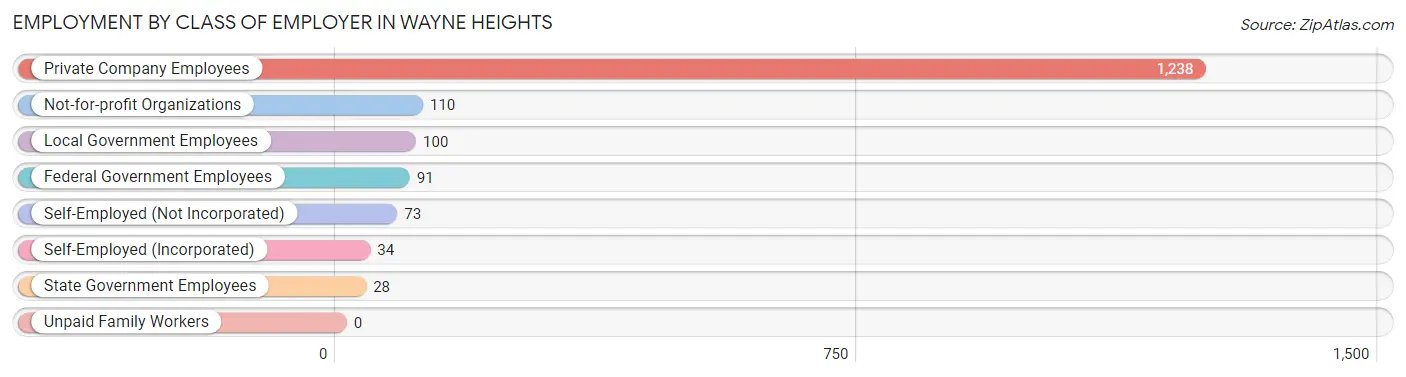
| Employer Class | # Employees | % Employees |
| Private Company Employees | 1,238 | 74.0% |
| Self-Employed (Incorporated) | 34 | 2.0% |
| Self-Employed (Not Incorporated) | 73 | 4.4% |
| Not-for-profit Organizations | 110 | 6.6% |
| Local Government Employees | 100 | 6.0% |
| State Government Employees | 28 | 1.7% |
| Federal Government Employees | 91 | 5.4% |
| Unpaid Family Workers | 0 | 0.0% |
| Total | 1,674 | 100.0% |
Employment Status by Age in Wayne Heights
According to the labor force statistics for Wayne Heights, out of the total population over 16 years of age (2,464), 69.6% or 1,715 individuals are in the labor force, with 2.3% or 39 of them unemployed. The age group with the highest labor force participation rate is 30 to 34 years, with 100.0% or 162 individuals in the labor force. Within the labor force, the 16 to 19 years age range has the highest percentage of unemployed individuals, with 51.6% or 33 of them being unemployed.
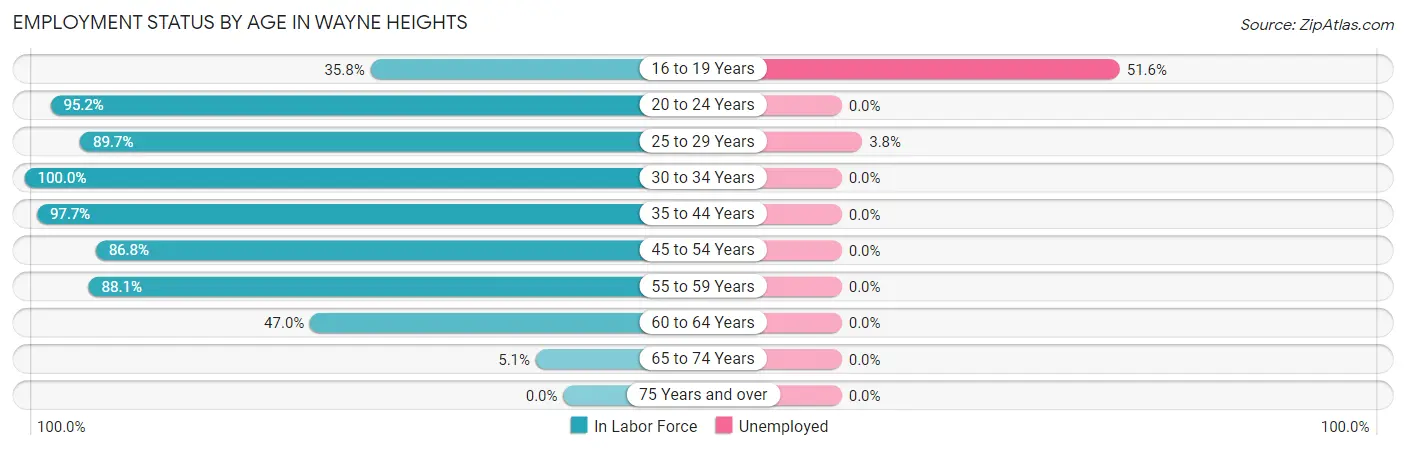
| Age Bracket | In Labor Force | Unemployed |
| 16 to 19 Years | 64 (35.8%) | 33 (51.6%) |
| 20 to 24 Years | 118 (95.2%) | 0 (0.0%) |
| 25 to 29 Years | 182 (89.7%) | 7 (3.8%) |
| 30 to 34 Years | 162 (100.0%) | 0 (0.0%) |
| 35 to 44 Years | 511 (97.7%) | 0 (0.0%) |
| 45 to 54 Years | 452 (86.8%) | 0 (0.0%) |
| 55 to 59 Years | 140 (88.1%) | 0 (0.0%) |
| 60 to 64 Years | 77 (47.0%) | 0 (0.0%) |
| 65 to 74 Years | 8 (5.1%) | 0 (0.0%) |
| 75 Years and over | 0 (0.0%) | 0 (0.0%) |
| Total | 1,715 (69.6%) | 39 (2.3%) |
Employment Status by Educational Attainment in Wayne Heights
According to labor force statistics for Wayne Heights, 88.0% of individuals (1,524) out of the total population between 25 and 64 years of age (1,732) are in the labor force, with 0.5% or 8 of them being unemployed. The group with the highest labor force participation rate are those with the educational attainment of bachelor's degree or higher, with 93.4% or 356 individuals in the labor force. Within the labor force, individuals with high school diploma education have the highest percentage of unemployment, with 1.2% or 7 of them being unemployed.
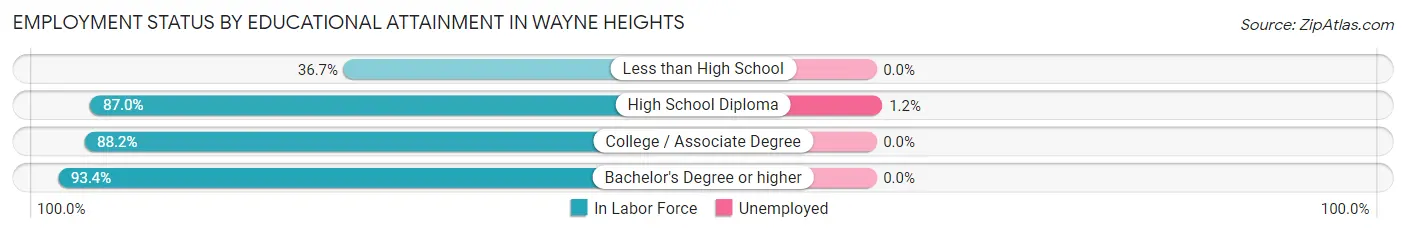
| Educational Attainment | In Labor Force | Unemployed |
| Less than High School | 11 (36.7%) | 0 (0.0%) |
| High School Diploma | 602 (87.0%) | 8 (1.2%) |
| College / Associate Degree | 555 (88.2%) | 0 (0.0%) |
| Bachelor's Degree or higher | 356 (93.4%) | 0 (0.0%) |
| Total | 1,524 (88.0%) | 9 (0.5%) |
Employment Occupations by Sex in Wayne Heights
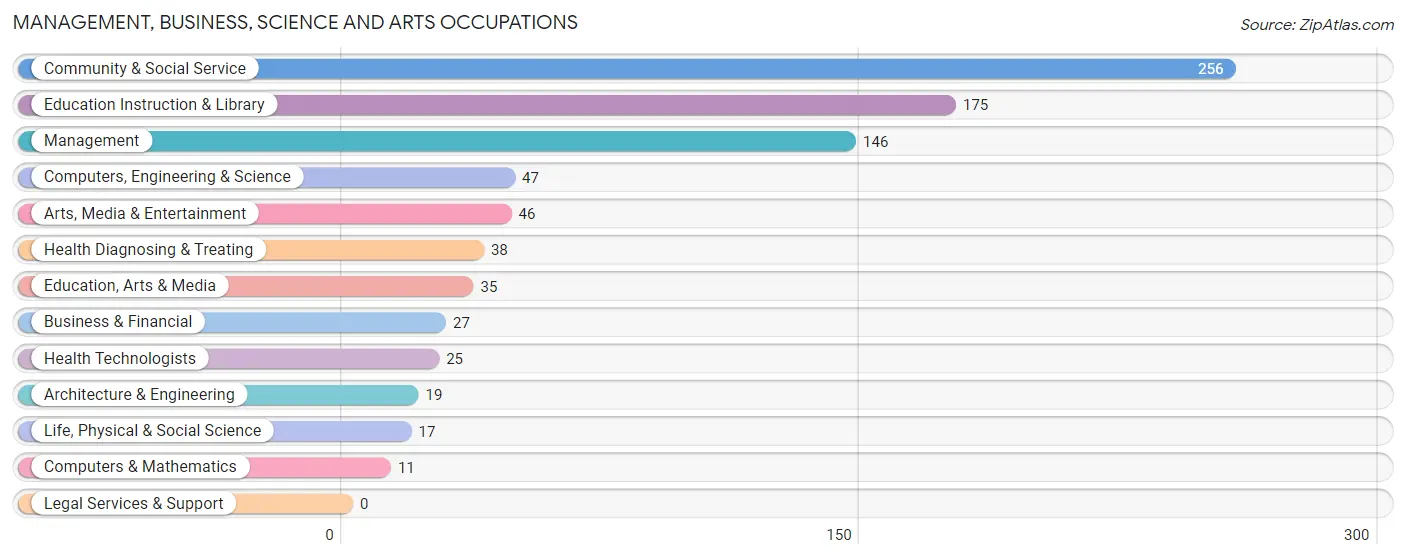
Management, Business, Science and Arts Occupations
The most common Management, Business, Science and Arts occupations in Wayne Heights are Community & Social Service (256 | 15.3%), Education Instruction & Library (175 | 10.4%), Management (146 | 8.7%), Computers, Engineering & Science (47 | 2.8%), and Arts, Media & Entertainment (46 | 2.8%).
Management, Business, Science and Arts Occupations by Sex
Within the Management, Business, Science and Arts occupations in Wayne Heights, the most male-oriented occupations are Computers & Mathematics (100.0%), Architecture & Engineering (100.0%), and Computers, Engineering & Science (63.8%), while the most female-oriented occupations are Life, Physical & Social Science (100.0%), Health Diagnosing & Treating (100.0%), and Health Technologists (100.0%).
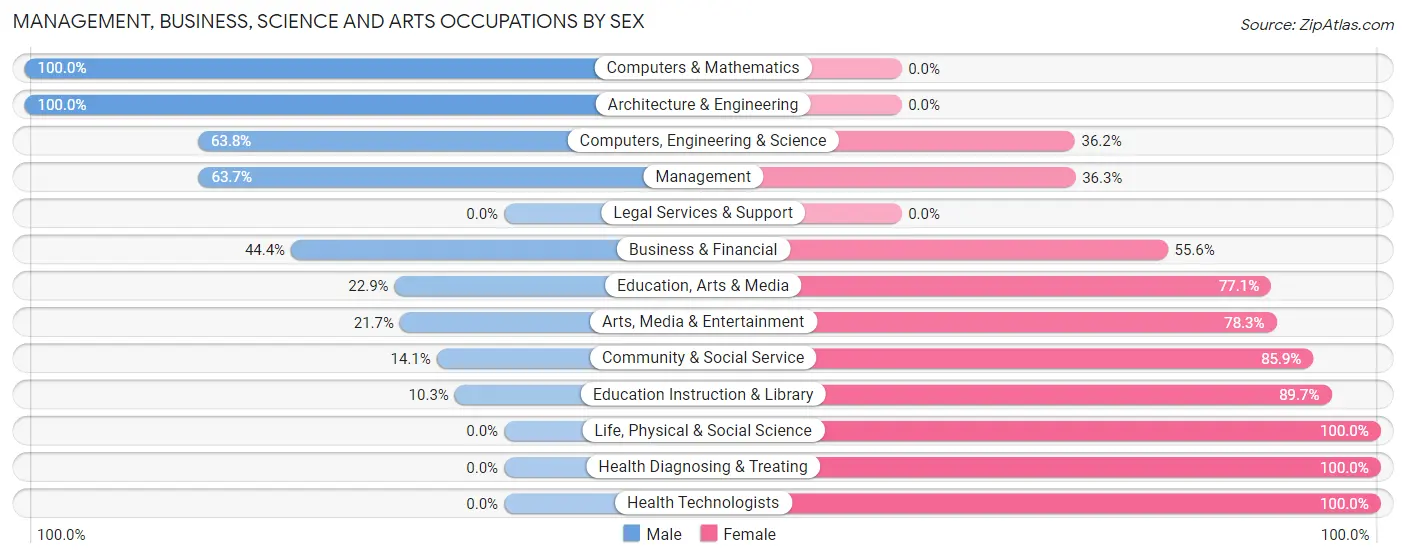
| Occupation | Male | Female |
| Management | 93 (63.7%) | 53 (36.3%) |
| Business & Financial | 12 (44.4%) | 15 (55.6%) |
| Computers, Engineering & Science | 30 (63.8%) | 17 (36.2%) |
| Computers & Mathematics | 11 (100.0%) | 0 (0.0%) |
| Architecture & Engineering | 19 (100.0%) | 0 (0.0%) |
| Life, Physical & Social Science | 0 (0.0%) | 17 (100.0%) |
| Community & Social Service | 36 (14.1%) | 220 (85.9%) |
| Education, Arts & Media | 8 (22.9%) | 27 (77.1%) |
| Legal Services & Support | 0 (0.0%) | 0 (0.0%) |
| Education Instruction & Library | 18 (10.3%) | 157 (89.7%) |
| Arts, Media & Entertainment | 10 (21.7%) | 36 (78.3%) |
| Health Diagnosing & Treating | 0 (0.0%) | 38 (100.0%) |
| Health Technologists | 0 (0.0%) | 25 (100.0%) |
| Total (Category) | 171 (33.3%) | 343 (66.7%) |
| Total (Overall) | 915 (54.7%) | 759 (45.3%) |
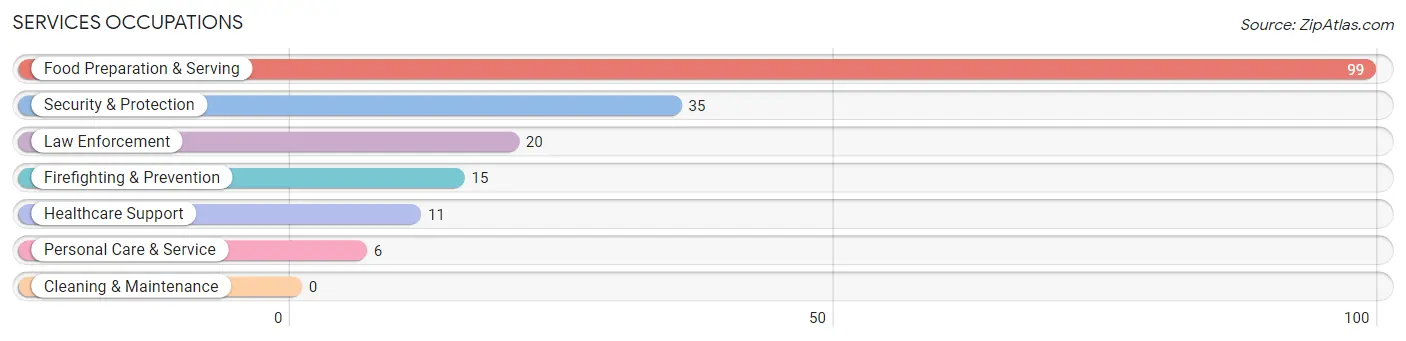
Services Occupations
The most common Services occupations in Wayne Heights are Food Preparation & Serving (99 | 5.9%), Security & Protection (35 | 2.1%), Law Enforcement (20 | 1.2%), Firefighting & Prevention (15 | 0.9%), and Healthcare Support (11 | 0.7%).
Services Occupations by Sex
Within the Services occupations in Wayne Heights, the most male-oriented occupations are Security & Protection (100.0%), Firefighting & Prevention (100.0%), and Law Enforcement (100.0%), while the most female-oriented occupations are Healthcare Support (100.0%), Personal Care & Service (100.0%), and Food Preparation & Serving (61.6%).
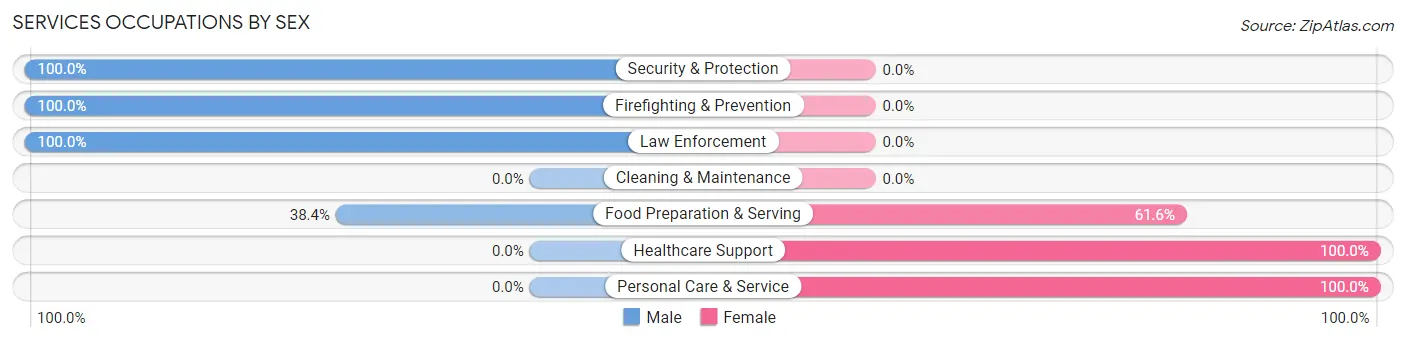
| Occupation | Male | Female |
| Healthcare Support | 0 (0.0%) | 11 (100.0%) |
| Security & Protection | 35 (100.0%) | 0 (0.0%) |
| Firefighting & Prevention | 15 (100.0%) | 0 (0.0%) |
| Law Enforcement | 20 (100.0%) | 0 (0.0%) |
| Food Preparation & Serving | 38 (38.4%) | 61 (61.6%) |
| Cleaning & Maintenance | 0 (0.0%) | 0 (0.0%) |
| Personal Care & Service | 0 (0.0%) | 6 (100.0%) |
| Total (Category) | 73 (48.3%) | 78 (51.7%) |
| Total (Overall) | 915 (54.7%) | 759 (45.3%) |
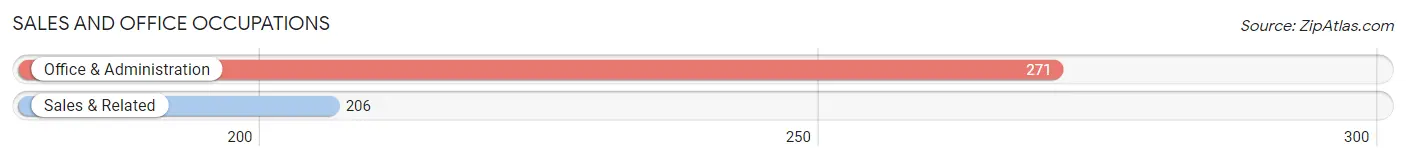
Sales and Office Occupations
The most common Sales and Office occupations in Wayne Heights are Office & Administration (271 | 16.2%), and Sales & Related (206 | 12.3%).
Sales and Office Occupations by Sex
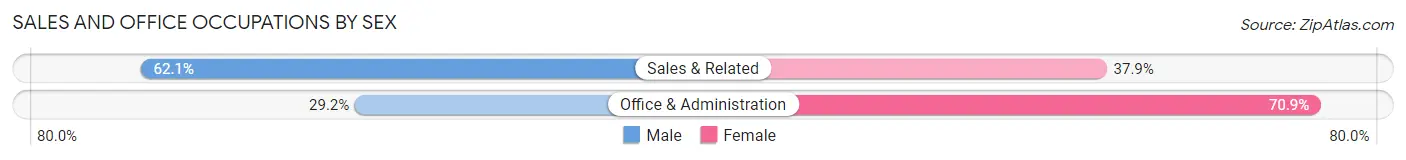
| Occupation | Male | Female |
| Sales & Related | 128 (62.1%) | 78 (37.9%) |
| Office & Administration | 79 (29.1%) | 192 (70.9%) |
| Total (Category) | 207 (43.4%) | 270 (56.6%) |
| Total (Overall) | 915 (54.7%) | 759 (45.3%) |
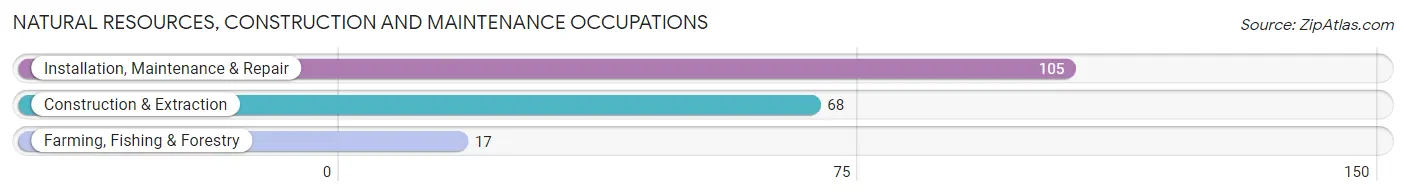
Natural Resources, Construction and Maintenance Occupations
The most common Natural Resources, Construction and Maintenance occupations in Wayne Heights are Installation, Maintenance & Repair (105 | 6.3%), Construction & Extraction (68 | 4.1%), and Farming, Fishing & Forestry (17 | 1.0%).
Natural Resources, Construction and Maintenance Occupations by Sex
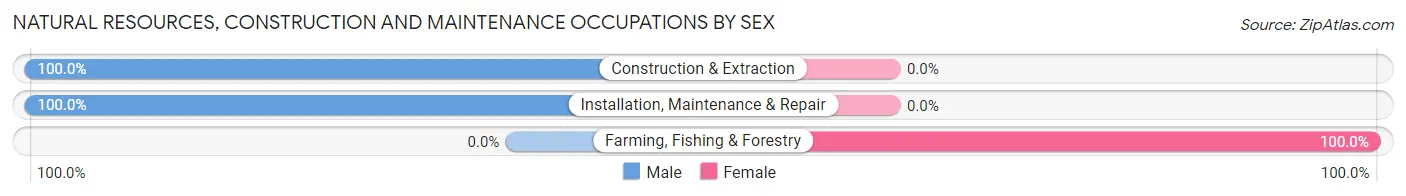
| Occupation | Male | Female |
| Farming, Fishing & Forestry | 0 (0.0%) | 17 (100.0%) |
| Construction & Extraction | 68 (100.0%) | 0 (0.0%) |
| Installation, Maintenance & Repair | 105 (100.0%) | 0 (0.0%) |
| Total (Category) | 173 (91.0%) | 17 (8.9%) |
| Total (Overall) | 915 (54.7%) | 759 (45.3%) |
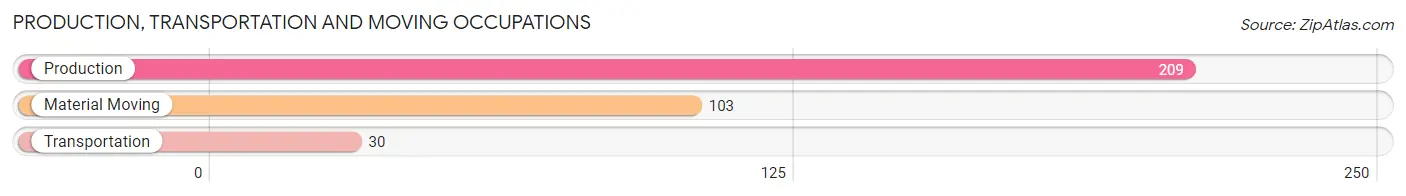
Production, Transportation and Moving Occupations
The most common Production, Transportation and Moving occupations in Wayne Heights are Production (209 | 12.5%), Material Moving (103 | 6.1%), and Transportation (30 | 1.8%).
Production, Transportation and Moving Occupations by Sex
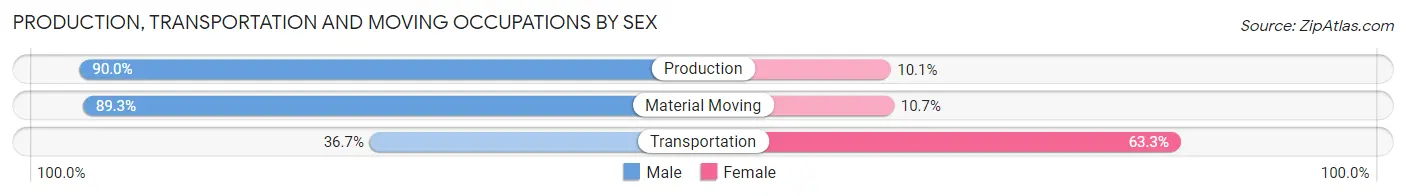
| Occupation | Male | Female |
| Production | 188 (89.9%) | 21 (10.1%) |
| Transportation | 11 (36.7%) | 19 (63.3%) |
| Material Moving | 92 (89.3%) | 11 (10.7%) |
| Total (Category) | 291 (85.1%) | 51 (14.9%) |
| Total (Overall) | 915 (54.7%) | 759 (45.3%) |
Employment Industries by Sex in Wayne Heights
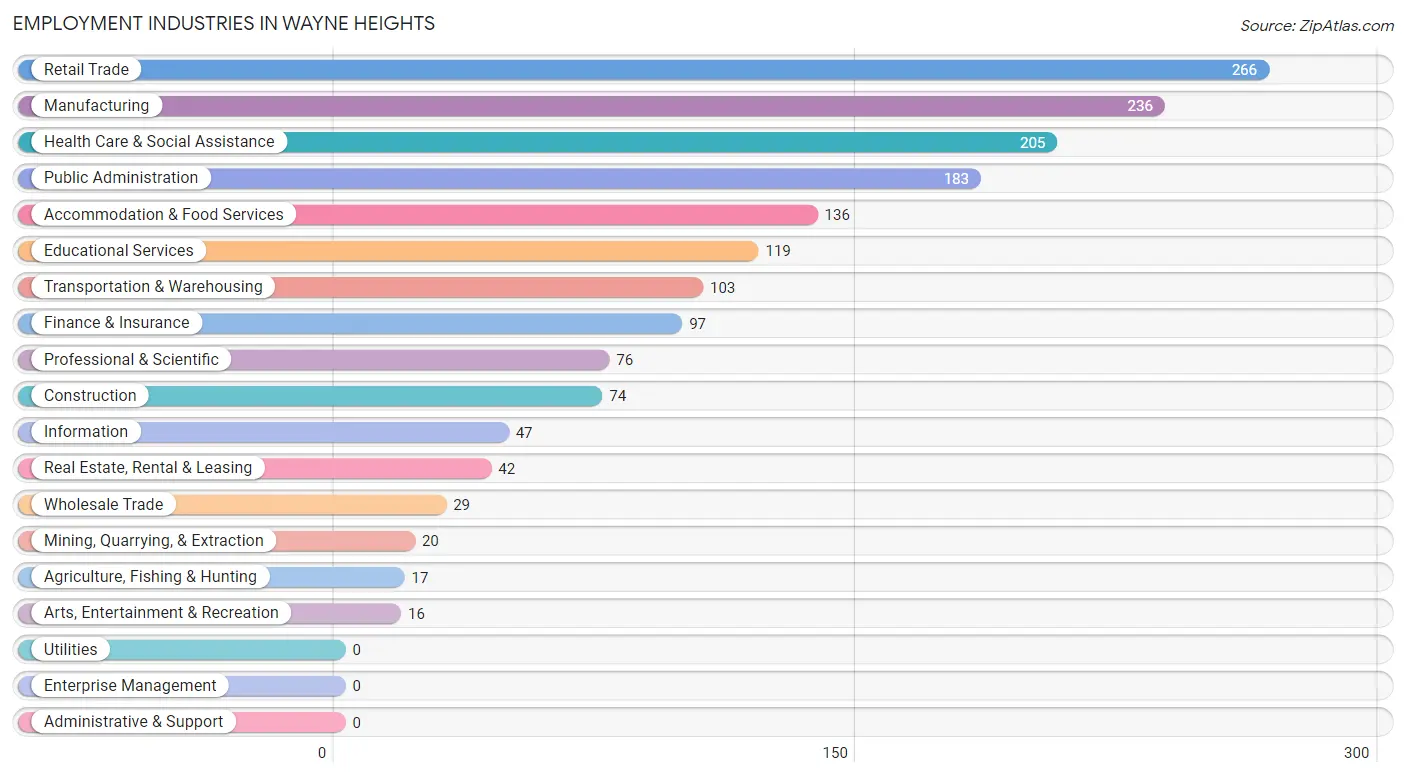
Employment Industries in Wayne Heights
The major employment industries in Wayne Heights include Retail Trade (266 | 15.9%), Manufacturing (236 | 14.1%), Health Care & Social Assistance (205 | 12.2%), Public Administration (183 | 10.9%), and Accommodation & Food Services (136 | 8.1%).
Employment Industries by Sex in Wayne Heights
The Wayne Heights industries that see more men than women are Mining, Quarrying, & Extraction (100.0%), Construction (100.0%), and Wholesale Trade (100.0%), whereas the industries that tend to have a higher number of women are Agriculture, Fishing & Hunting (100.0%), Real Estate, Rental & Leasing (100.0%), and Arts, Entertainment & Recreation (100.0%).
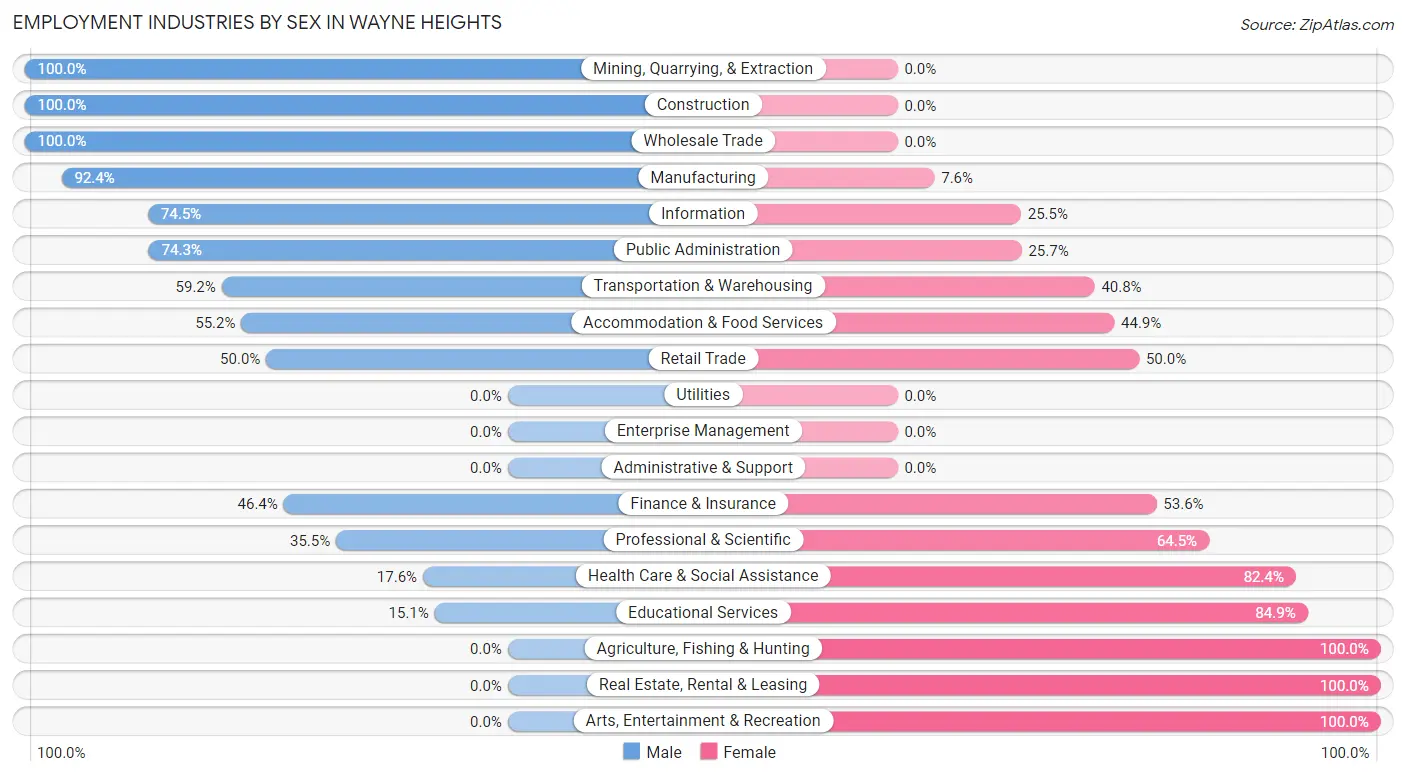
| Industry | Male | Female |
| Agriculture, Fishing & Hunting | 0 (0.0%) | 17 (100.0%) |
| Mining, Quarrying, & Extraction | 20 (100.0%) | 0 (0.0%) |
| Construction | 74 (100.0%) | 0 (0.0%) |
| Manufacturing | 218 (92.4%) | 18 (7.6%) |
| Wholesale Trade | 29 (100.0%) | 0 (0.0%) |
| Retail Trade | 133 (50.0%) | 133 (50.0%) |
| Transportation & Warehousing | 61 (59.2%) | 42 (40.8%) |
| Utilities | 0 (0.0%) | 0 (0.0%) |
| Information | 35 (74.5%) | 12 (25.5%) |
| Finance & Insurance | 45 (46.4%) | 52 (53.6%) |
| Real Estate, Rental & Leasing | 0 (0.0%) | 42 (100.0%) |
| Professional & Scientific | 27 (35.5%) | 49 (64.5%) |
| Enterprise Management | 0 (0.0%) | 0 (0.0%) |
| Administrative & Support | 0 (0.0%) | 0 (0.0%) |
| Educational Services | 18 (15.1%) | 101 (84.9%) |
| Health Care & Social Assistance | 36 (17.6%) | 169 (82.4%) |
| Arts, Entertainment & Recreation | 0 (0.0%) | 16 (100.0%) |
| Accommodation & Food Services | 75 (55.1%) | 61 (44.9%) |
| Public Administration | 136 (74.3%) | 47 (25.7%) |
| Total | 915 (54.7%) | 759 (45.3%) |
Education in Wayne Heights
School Enrollment in Wayne Heights
The most common levels of schooling among the 958 students in Wayne Heights are high school (226 | 23.6%), college / undergraduate (220 | 23.0%), and middle school (203 | 21.2%).
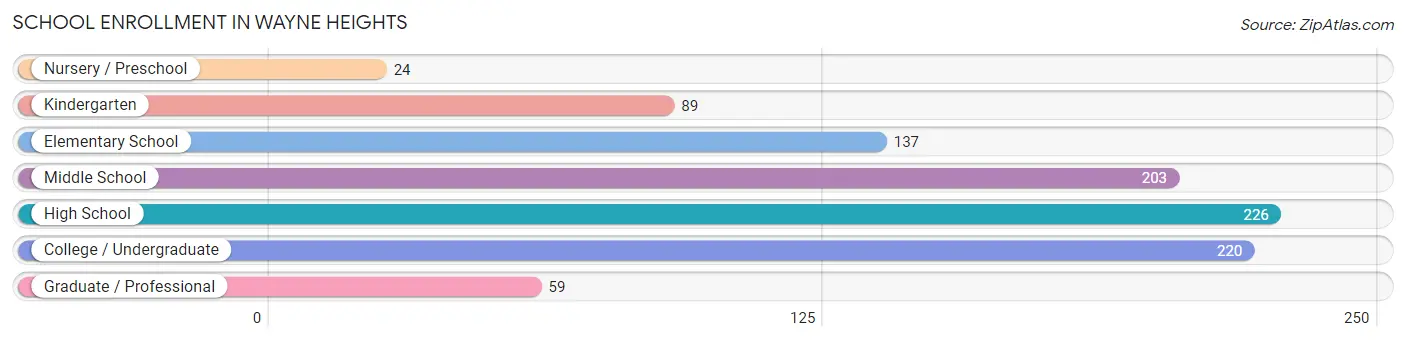
| School Level | # Students | % Students |
| Nursery / Preschool | 24 | 2.5% |
| Kindergarten | 89 | 9.3% |
| Elementary School | 137 | 14.3% |
| Middle School | 203 | 21.2% |
| High School | 226 | 23.6% |
| College / Undergraduate | 220 | 23.0% |
| Graduate / Professional | 59 | 6.2% |
| Total | 958 | 100.0% |
School Enrollment by Age by Funding Source in Wayne Heights
Out of a total of 958 students who are enrolled in schools in Wayne Heights, 165 (17.2%) attend a private institution, while the remaining 793 (82.8%) are enrolled in public schools. The age group of 25 to 34 year olds has the highest likelihood of being enrolled in private schools, with 52 (100.0% in the age bracket) enrolled. Conversely, the age group of 15 to 17 year olds has the lowest likelihood of being enrolled in a private school, with 197 (100.0% in the age bracket) attending a public institution.
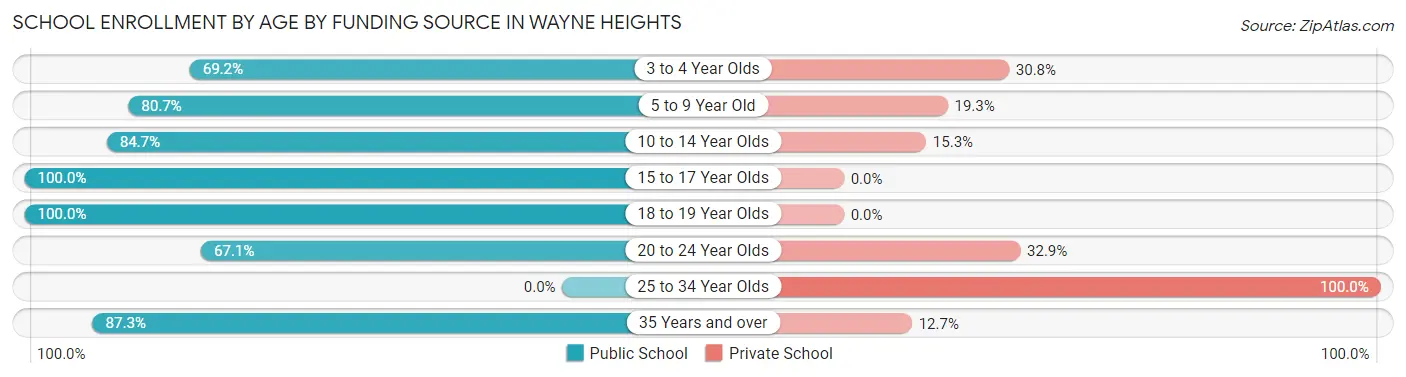
| Age Bracket | Public School | Private School |
| 3 to 4 Year Olds | 9 (69.2%) | 4 (30.8%) |
| 5 to 9 Year Old | 171 (80.7%) | 41 (19.3%) |
| 10 to 14 Year Olds | 199 (84.7%) | 36 (15.3%) |
| 15 to 17 Year Olds | 197 (100.0%) | 0 (0.0%) |
| 18 to 19 Year Olds | 108 (100.0%) | 0 (0.0%) |
| 20 to 24 Year Olds | 47 (67.1%) | 23 (32.9%) |
| 25 to 34 Year Olds | 0 (0.0%) | 52 (100.0%) |
| 35 Years and over | 62 (87.3%) | 9 (12.7%) |
| Total | 793 (82.8%) | 165 (17.2%) |
Educational Attainment by Field of Study in Wayne Heights
Business (115 | 22.9%), education (94 | 18.7%), arts & humanities (74 | 14.7%), science & technology (50 | 10.0%), and psychology (39 | 7.8%) are the most common fields of study among 502 individuals in Wayne Heights who have obtained a bachelor's degree or higher.
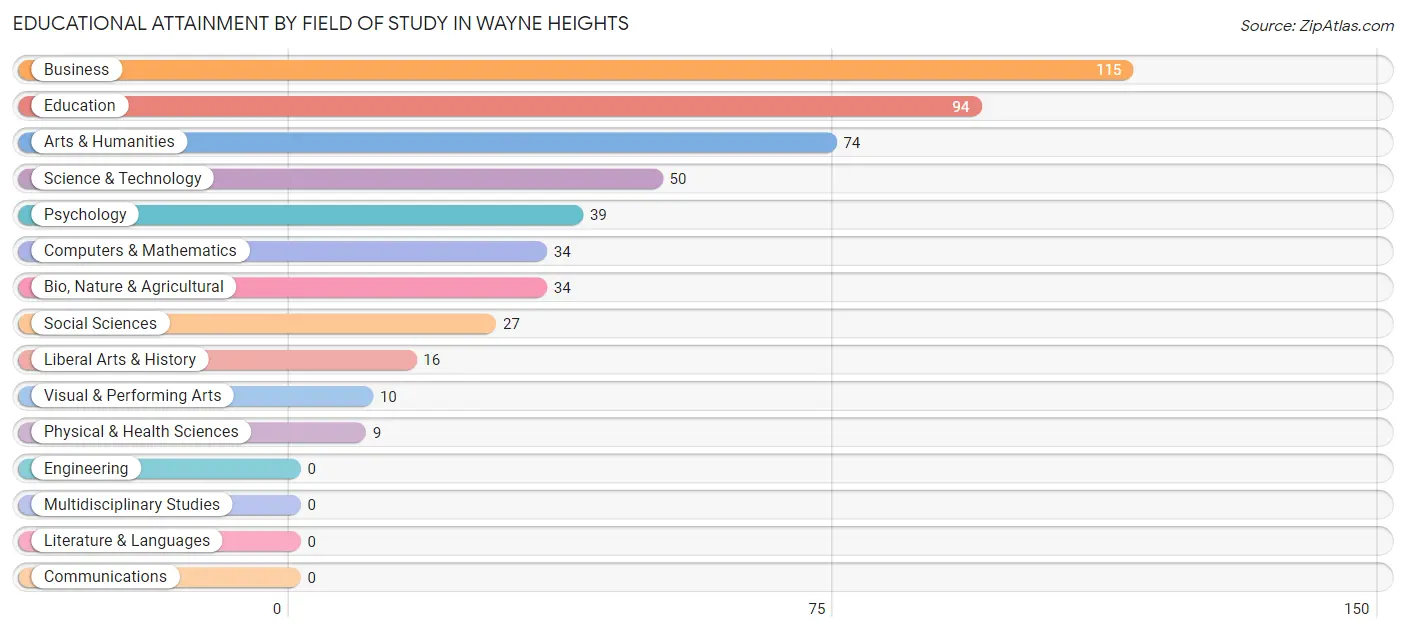
| Field of Study | # Graduates | % Graduates |
| Computers & Mathematics | 34 | 6.8% |
| Bio, Nature & Agricultural | 34 | 6.8% |
| Physical & Health Sciences | 9 | 1.8% |
| Psychology | 39 | 7.8% |
| Social Sciences | 27 | 5.4% |
| Engineering | 0 | 0.0% |
| Multidisciplinary Studies | 0 | 0.0% |
| Science & Technology | 50 | 10.0% |
| Business | 115 | 22.9% |
| Education | 94 | 18.7% |
| Literature & Languages | 0 | 0.0% |
| Liberal Arts & History | 16 | 3.2% |
| Visual & Performing Arts | 10 | 2.0% |
| Communications | 0 | 0.0% |
| Arts & Humanities | 74 | 14.7% |
| Total | 502 | 100.0% |
Transportation & Commute in Wayne Heights
Vehicle Availability by Sex in Wayne Heights
The most prevalent vehicle ownership categories in Wayne Heights are males with 2 vehicles (409, accounting for 44.7%) and females with 2 vehicles (439, making up 53.9%).
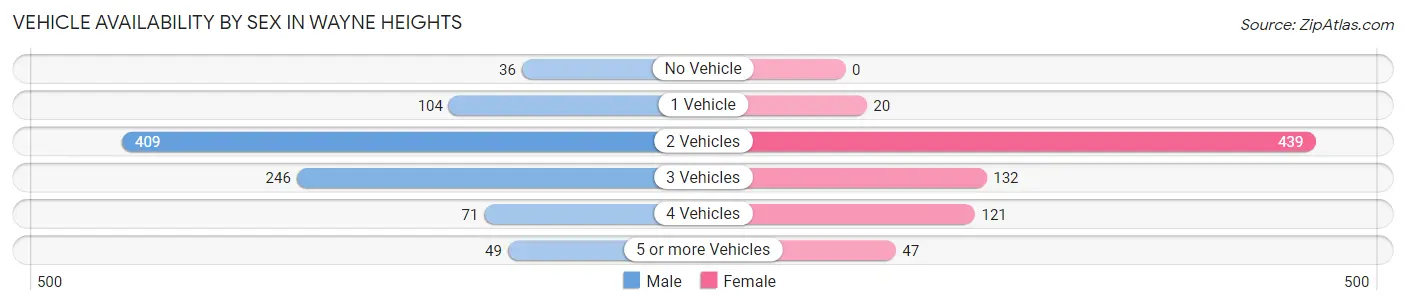
| Vehicles Available | Male | Female |
| No Vehicle | 36 (3.9%) | 0 (0.0%) |
| 1 Vehicle | 104 (11.4%) | 20 (2.6%) |
| 2 Vehicles | 409 (44.7%) | 439 (57.8%) |
| 3 Vehicles | 246 (26.9%) | 132 (17.4%) |
| 4 Vehicles | 71 (7.8%) | 121 (15.9%) |
| 5 or more Vehicles | 49 (5.4%) | 47 (6.2%) |
| Total | 915 (100.0%) | 759 (100.0%) |
Commute Time in Wayne Heights
The most frequently occuring commute durations in Wayne Heights are 30 to 34 minutes (237 commuters, 15.4%), 5 to 9 minutes (229 commuters, 14.9%), and 10 to 14 minutes (179 commuters, 11.7%).
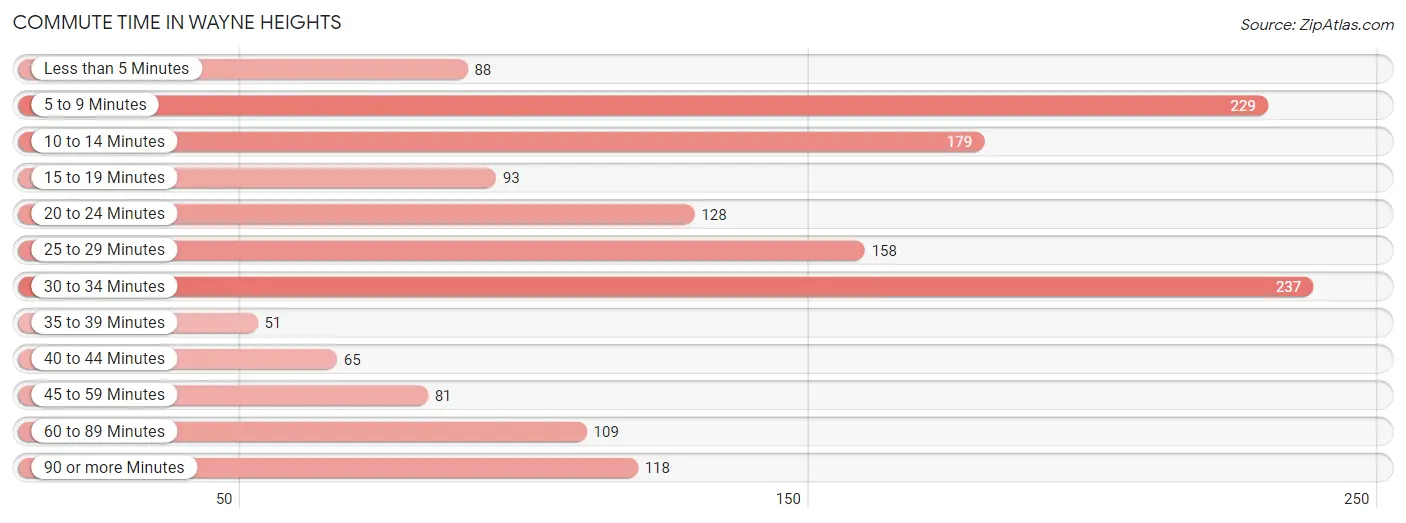
| Commute Time | # Commuters | % Commuters |
| Less than 5 Minutes | 88 | 5.7% |
| 5 to 9 Minutes | 229 | 14.9% |
| 10 to 14 Minutes | 179 | 11.7% |
| 15 to 19 Minutes | 93 | 6.0% |
| 20 to 24 Minutes | 128 | 8.3% |
| 25 to 29 Minutes | 158 | 10.3% |
| 30 to 34 Minutes | 237 | 15.4% |
| 35 to 39 Minutes | 51 | 3.3% |
| 40 to 44 Minutes | 65 | 4.2% |
| 45 to 59 Minutes | 81 | 5.3% |
| 60 to 89 Minutes | 109 | 7.1% |
| 90 or more Minutes | 118 | 7.7% |
Commute Time by Sex in Wayne Heights
The most common commute times in Wayne Heights are 25 to 29 minutes (133 commuters, 15.9%) for males and 5 to 9 minutes (186 commuters, 26.7%) for females.
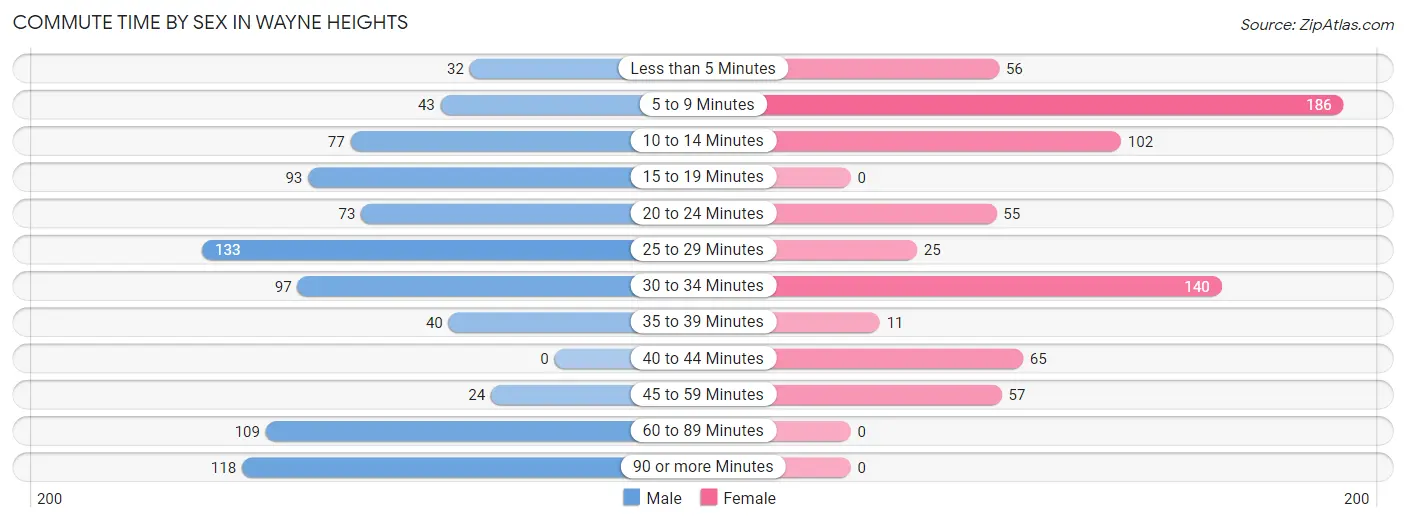
| Commute Time | Male | Female |
| Less than 5 Minutes | 32 (3.8%) | 56 (8.0%) |
| 5 to 9 Minutes | 43 (5.1%) | 186 (26.7%) |
| 10 to 14 Minutes | 77 (9.2%) | 102 (14.6%) |
| 15 to 19 Minutes | 93 (11.1%) | 0 (0.0%) |
| 20 to 24 Minutes | 73 (8.7%) | 55 (7.9%) |
| 25 to 29 Minutes | 133 (15.9%) | 25 (3.6%) |
| 30 to 34 Minutes | 97 (11.6%) | 140 (20.1%) |
| 35 to 39 Minutes | 40 (4.8%) | 11 (1.6%) |
| 40 to 44 Minutes | 0 (0.0%) | 65 (9.3%) |
| 45 to 59 Minutes | 24 (2.9%) | 57 (8.2%) |
| 60 to 89 Minutes | 109 (13.0%) | 0 (0.0%) |
| 90 or more Minutes | 118 (14.1%) | 0 (0.0%) |
Time of Departure to Work by Sex in Wayne Heights
The most frequent times of departure to work in Wayne Heights are 6:00 AM to 6:29 AM (161, 19.2%) for males and 5:30 AM to 5:59 AM (165, 23.7%) for females.
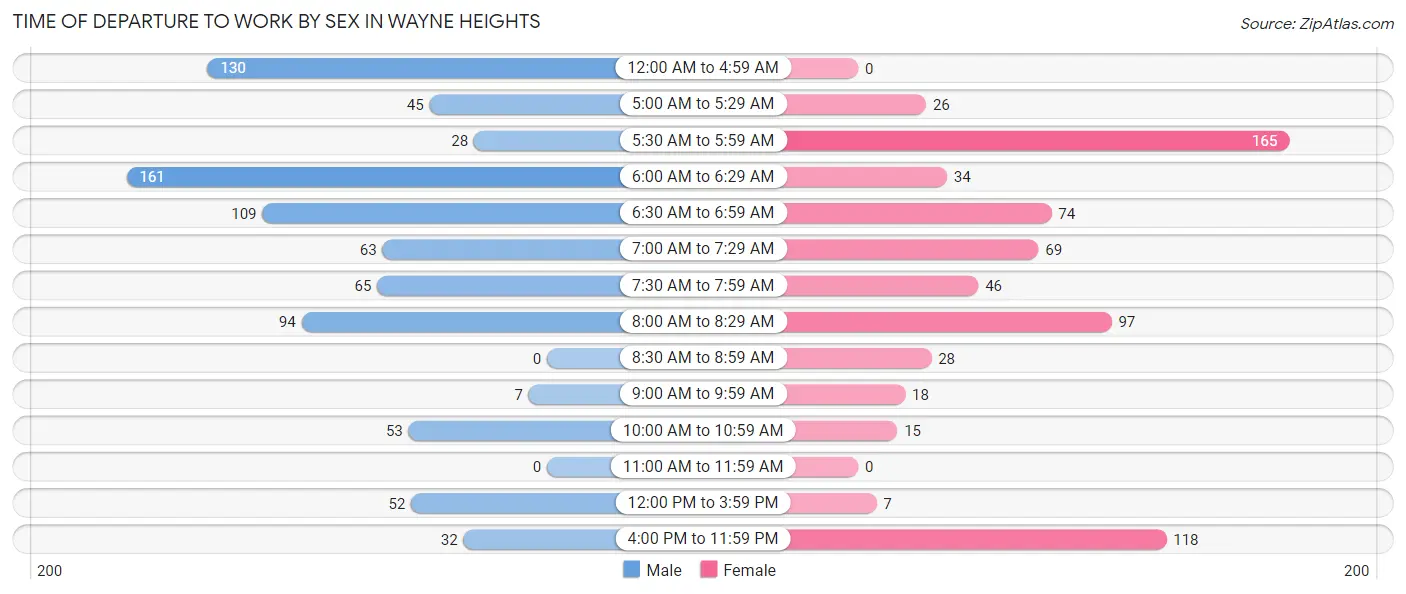
| Time of Departure | Male | Female |
| 12:00 AM to 4:59 AM | 130 (15.5%) | 0 (0.0%) |
| 5:00 AM to 5:29 AM | 45 (5.4%) | 26 (3.7%) |
| 5:30 AM to 5:59 AM | 28 (3.3%) | 165 (23.7%) |
| 6:00 AM to 6:29 AM | 161 (19.2%) | 34 (4.9%) |
| 6:30 AM to 6:59 AM | 109 (13.0%) | 74 (10.6%) |
| 7:00 AM to 7:29 AM | 63 (7.5%) | 69 (9.9%) |
| 7:30 AM to 7:59 AM | 65 (7.7%) | 46 (6.6%) |
| 8:00 AM to 8:29 AM | 94 (11.2%) | 97 (13.9%) |
| 8:30 AM to 8:59 AM | 0 (0.0%) | 28 (4.0%) |
| 9:00 AM to 9:59 AM | 7 (0.8%) | 18 (2.6%) |
| 10:00 AM to 10:59 AM | 53 (6.3%) | 15 (2.1%) |
| 11:00 AM to 11:59 AM | 0 (0.0%) | 0 (0.0%) |
| 12:00 PM to 3:59 PM | 52 (6.2%) | 7 (1.0%) |
| 4:00 PM to 11:59 PM | 32 (3.8%) | 118 (16.9%) |
| Total | 839 (100.0%) | 697 (100.0%) |
Housing Occupancy in Wayne Heights
Occupancy by Ownership in Wayne Heights
Of the total 1,255 dwellings in Wayne Heights, owner-occupied units account for 886 (70.6%), while renter-occupied units make up 369 (29.4%).
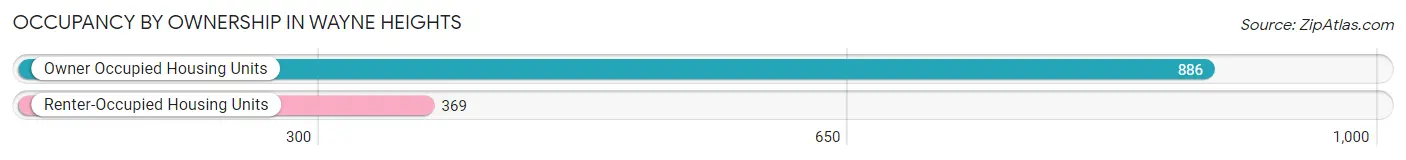
| Occupancy | # Housing Units | % Housing Units |
| Owner Occupied Housing Units | 886 | 70.6% |
| Renter-Occupied Housing Units | 369 | 29.4% |
| Total Occupied Housing Units | 1,255 | 100.0% |
Occupancy by Household Size in Wayne Heights
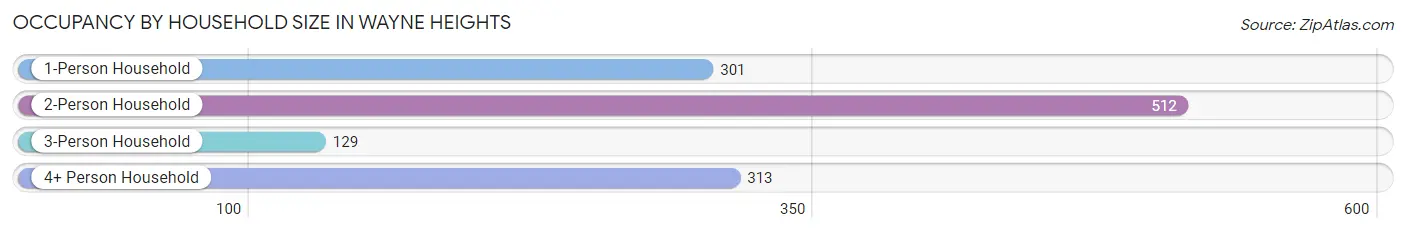
| Household Size | # Housing Units | % Housing Units |
| 1-Person Household | 301 | 24.0% |
| 2-Person Household | 512 | 40.8% |
| 3-Person Household | 129 | 10.3% |
| 4+ Person Household | 313 | 24.9% |
| Total Housing Units | 1,255 | 100.0% |
Occupancy by Ownership by Household Size in Wayne Heights
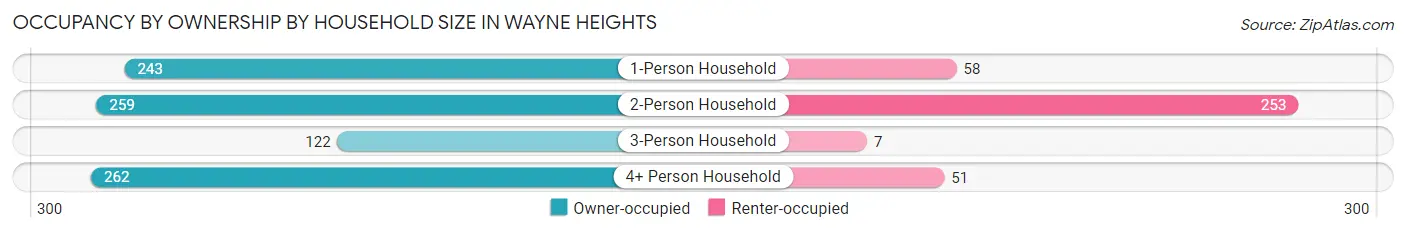
| Household Size | Owner-occupied | Renter-occupied |
| 1-Person Household | 243 (80.7%) | 58 (19.3%) |
| 2-Person Household | 259 (50.6%) | 253 (49.4%) |
| 3-Person Household | 122 (94.6%) | 7 (5.4%) |
| 4+ Person Household | 262 (83.7%) | 51 (16.3%) |
| Total Housing Units | 886 (70.6%) | 369 (29.4%) |
Occupancy by Educational Attainment in Wayne Heights
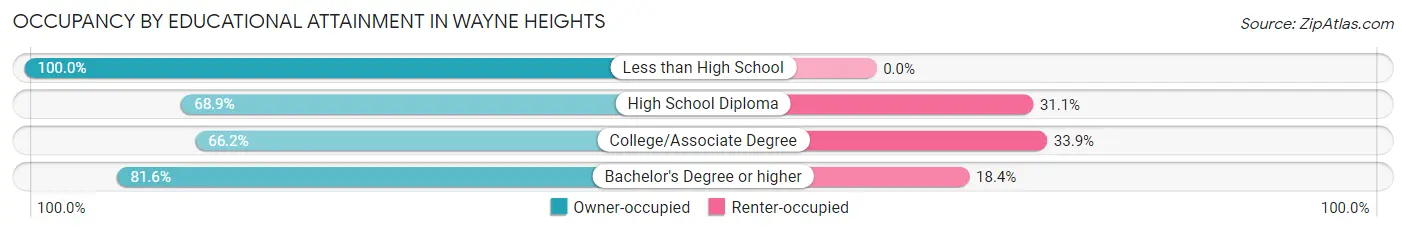
| Household Size | Owner-occupied | Renter-occupied |
| Less than High School | 10 (100.0%) | 0 (0.0%) |
| High School Diploma | 326 (68.9%) | 147 (31.1%) |
| College/Associate Degree | 342 (66.1%) | 175 (33.9%) |
| Bachelor's Degree or higher | 208 (81.6%) | 47 (18.4%) |
Occupancy by Age of Householder in Wayne Heights
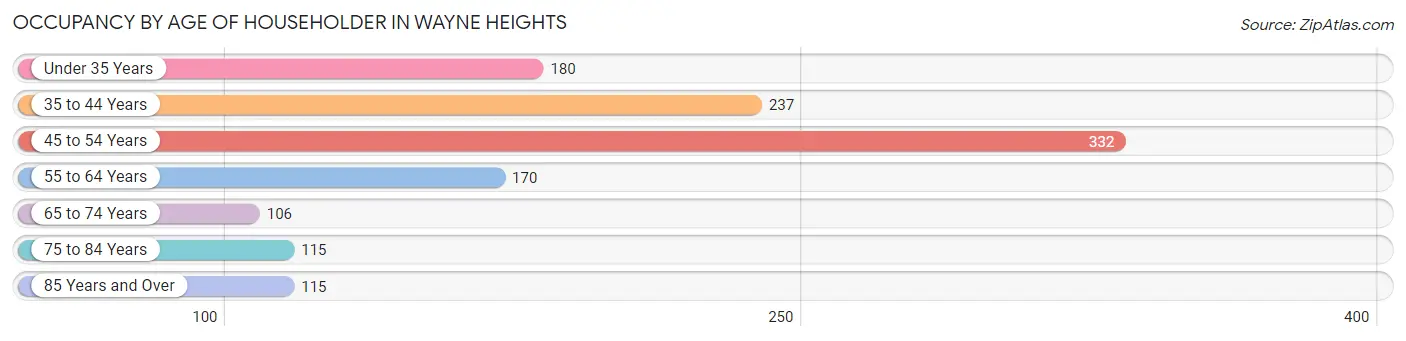
| Age Bracket | # Households | % Households |
| Under 35 Years | 180 | 14.3% |
| 35 to 44 Years | 237 | 18.9% |
| 45 to 54 Years | 332 | 26.5% |
| 55 to 64 Years | 170 | 13.6% |
| 65 to 74 Years | 106 | 8.5% |
| 75 to 84 Years | 115 | 9.2% |
| 85 Years and Over | 115 | 9.2% |
| Total | 1,255 | 100.0% |
Housing Finances in Wayne Heights
Median Income by Occupancy in Wayne Heights
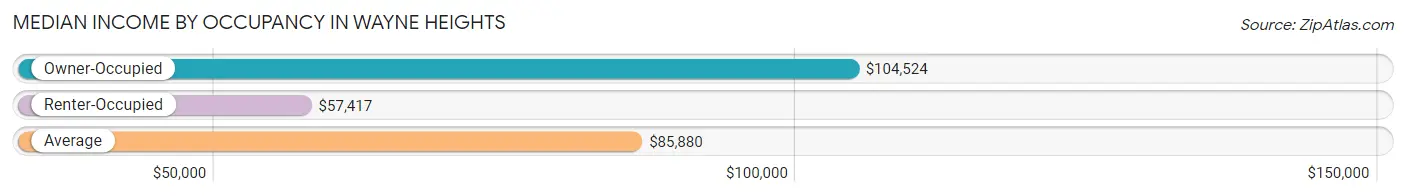
| Occupancy Type | # Households | Median Income |
| Owner-Occupied | 886 (70.6%) | $104,524 |
| Renter-Occupied | 369 (29.4%) | $57,417 |
| Average | 1,255 (100.0%) | $85,880 |
Occupancy by Householder Income Bracket in Wayne Heights
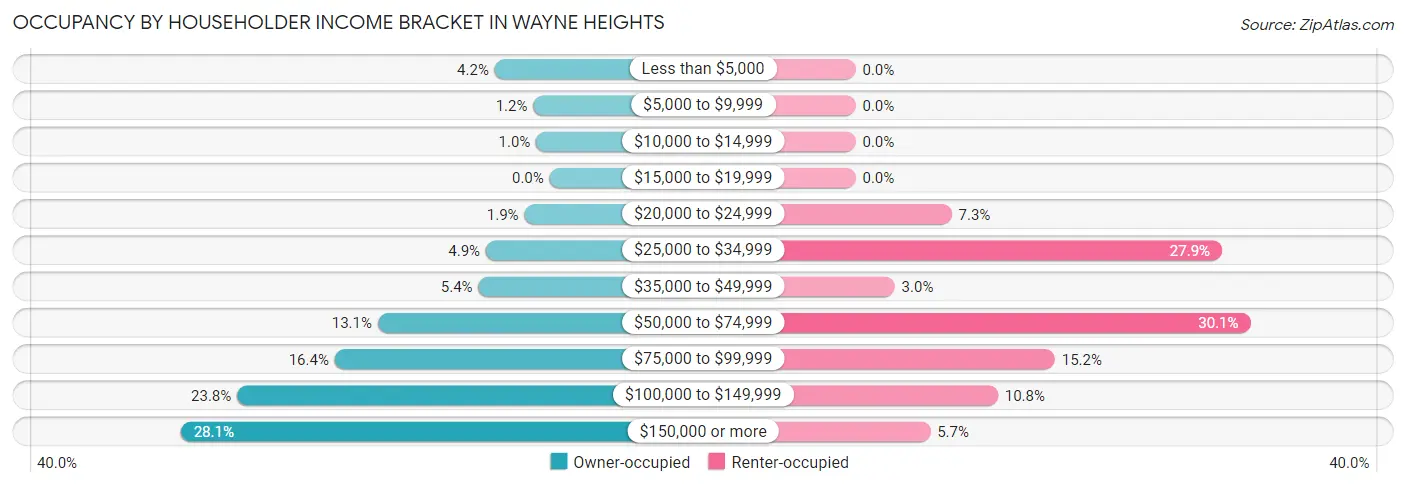
| Income Bracket | Owner-occupied | Renter-occupied |
| Less than $5,000 | 37 (4.2%) | 0 (0.0%) |
| $5,000 to $9,999 | 11 (1.2%) | 0 (0.0%) |
| $10,000 to $14,999 | 9 (1.0%) | 0 (0.0%) |
| $15,000 to $19,999 | 0 (0.0%) | 0 (0.0%) |
| $20,000 to $24,999 | 17 (1.9%) | 27 (7.3%) |
| $25,000 to $34,999 | 43 (4.9%) | 103 (27.9%) |
| $35,000 to $49,999 | 48 (5.4%) | 11 (3.0%) |
| $50,000 to $74,999 | 116 (13.1%) | 111 (30.1%) |
| $75,000 to $99,999 | 145 (16.4%) | 56 (15.2%) |
| $100,000 to $149,999 | 211 (23.8%) | 40 (10.8%) |
| $150,000 or more | 249 (28.1%) | 21 (5.7%) |
| Total | 886 (100.0%) | 369 (100.0%) |
Monthly Housing Cost Tiers in Wayne Heights
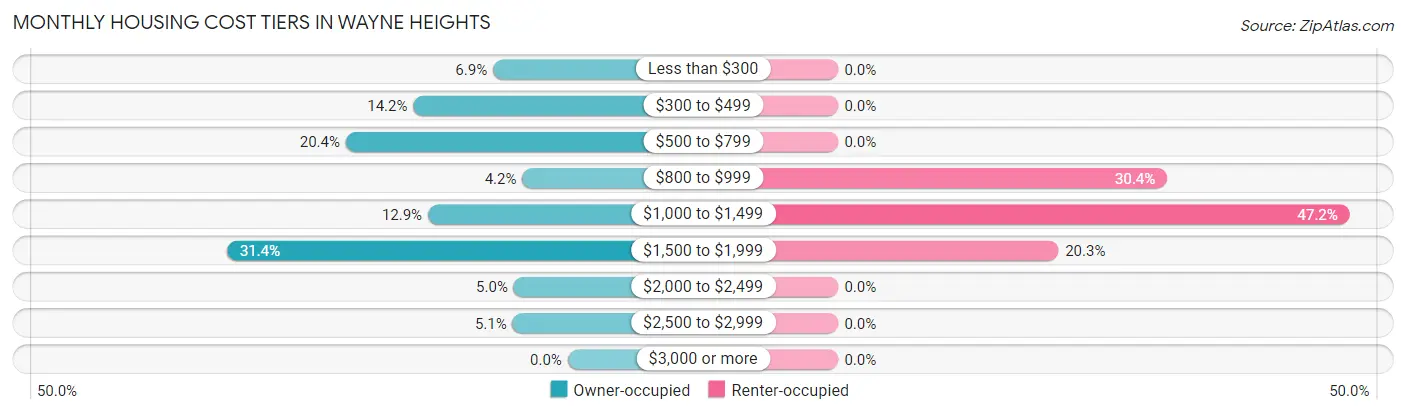
| Monthly Cost | Owner-occupied | Renter-occupied |
| Less than $300 | 61 (6.9%) | 0 (0.0%) |
| $300 to $499 | 126 (14.2%) | 0 (0.0%) |
| $500 to $799 | 181 (20.4%) | 0 (0.0%) |
| $800 to $999 | 37 (4.2%) | 112 (30.3%) |
| $1,000 to $1,499 | 114 (12.9%) | 174 (47.1%) |
| $1,500 to $1,999 | 278 (31.4%) | 75 (20.3%) |
| $2,000 to $2,499 | 44 (5.0%) | 0 (0.0%) |
| $2,500 to $2,999 | 45 (5.1%) | 0 (0.0%) |
| $3,000 or more | 0 (0.0%) | 0 (0.0%) |
| Total | 886 (100.0%) | 369 (100.0%) |
Physical Housing Characteristics in Wayne Heights
Housing Structures in Wayne Heights
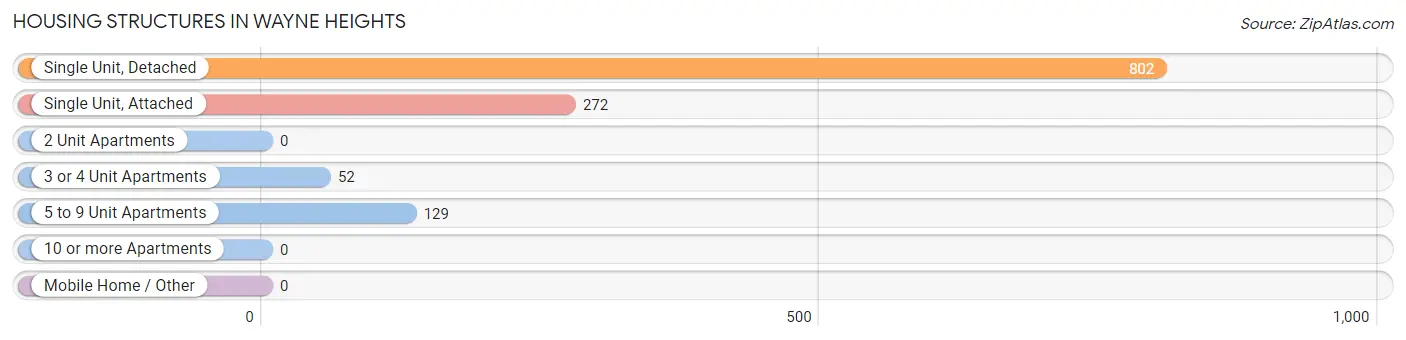
| Structure Type | # Housing Units | % Housing Units |
| Single Unit, Detached | 802 | 63.9% |
| Single Unit, Attached | 272 | 21.7% |
| 2 Unit Apartments | 0 | 0.0% |
| 3 or 4 Unit Apartments | 52 | 4.1% |
| 5 to 9 Unit Apartments | 129 | 10.3% |
| 10 or more Apartments | 0 | 0.0% |
| Mobile Home / Other | 0 | 0.0% |
| Total | 1,255 | 100.0% |
Housing Structures by Occupancy in Wayne Heights
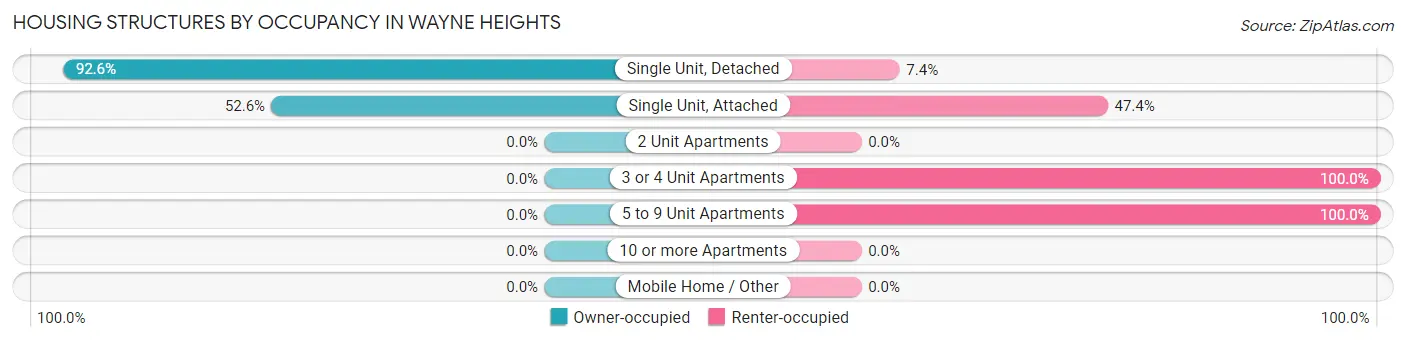
| Structure Type | Owner-occupied | Renter-occupied |
| Single Unit, Detached | 743 (92.6%) | 59 (7.4%) |
| Single Unit, Attached | 143 (52.6%) | 129 (47.4%) |
| 2 Unit Apartments | 0 (0.0%) | 0 (0.0%) |
| 3 or 4 Unit Apartments | 0 (0.0%) | 52 (100.0%) |
| 5 to 9 Unit Apartments | 0 (0.0%) | 129 (100.0%) |
| 10 or more Apartments | 0 (0.0%) | 0 (0.0%) |
| Mobile Home / Other | 0 (0.0%) | 0 (0.0%) |
| Total | 886 (70.6%) | 369 (29.4%) |
Housing Structures by Number of Rooms in Wayne Heights
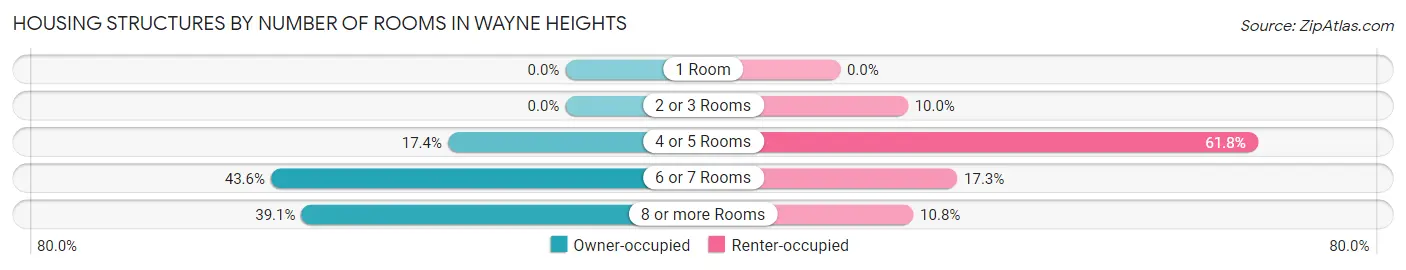
| Number of Rooms | Owner-occupied | Renter-occupied |
| 1 Room | 0 (0.0%) | 0 (0.0%) |
| 2 or 3 Rooms | 0 (0.0%) | 37 (10.0%) |
| 4 or 5 Rooms | 154 (17.4%) | 228 (61.8%) |
| 6 or 7 Rooms | 386 (43.6%) | 64 (17.3%) |
| 8 or more Rooms | 346 (39.1%) | 40 (10.8%) |
| Total | 886 (100.0%) | 369 (100.0%) |
Housing Structure by Heating Type in Wayne Heights
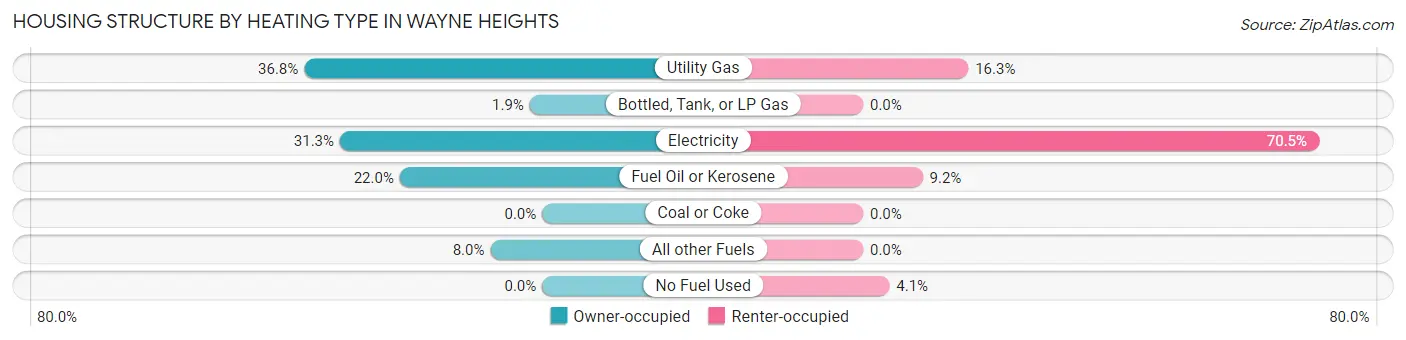
| Heating Type | Owner-occupied | Renter-occupied |
| Utility Gas | 326 (36.8%) | 60 (16.3%) |
| Bottled, Tank, or LP Gas | 17 (1.9%) | 0 (0.0%) |
| Electricity | 277 (31.3%) | 260 (70.5%) |
| Fuel Oil or Kerosene | 195 (22.0%) | 34 (9.2%) |
| Coal or Coke | 0 (0.0%) | 0 (0.0%) |
| All other Fuels | 71 (8.0%) | 0 (0.0%) |
| No Fuel Used | 0 (0.0%) | 15 (4.1%) |
| Total | 886 (100.0%) | 369 (100.0%) |
Household Vehicle Usage in Wayne Heights
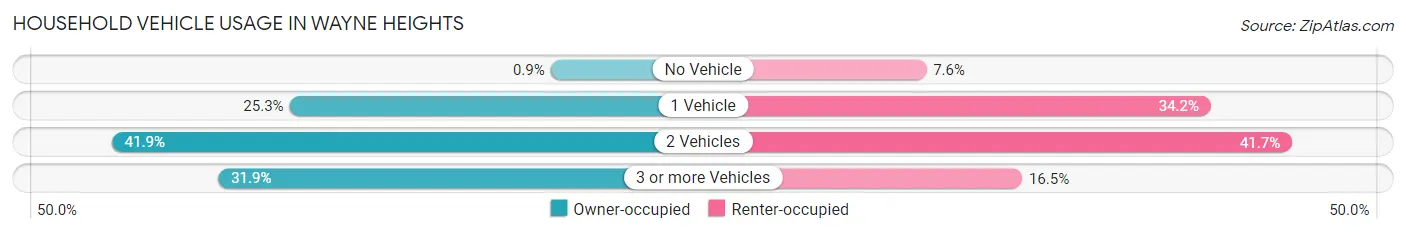
| Vehicles per Household | Owner-occupied | Renter-occupied |
| No Vehicle | 8 (0.9%) | 28 (7.6%) |
| 1 Vehicle | 224 (25.3%) | 126 (34.2%) |
| 2 Vehicles | 371 (41.9%) | 154 (41.7%) |
| 3 or more Vehicles | 283 (31.9%) | 61 (16.5%) |
| Total | 886 (100.0%) | 369 (100.0%) |
Real Estate & Mortgages in Wayne Heights
Real Estate and Mortgage Overview in Wayne Heights
| Characteristic | Without Mortgage | With Mortgage |
| Housing Units | 357 | 529 |
| Median Property Value | $231,600 | $233,100 |
| Median Household Income | $61,513 | $220 |
| Monthly Housing Costs | $492 | $0 |
| Real Estate Taxes | $1,898 | $0 |
Property Value by Mortgage Status in Wayne Heights
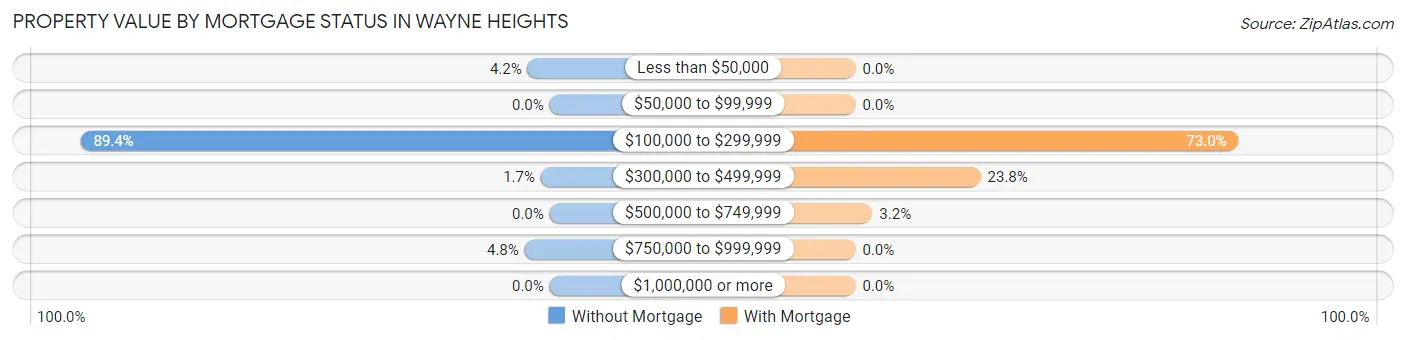
| Property Value | Without Mortgage | With Mortgage |
| Less than $50,000 | 15 (4.2%) | 0 (0.0%) |
| $50,000 to $99,999 | 0 (0.0%) | 0 (0.0%) |
| $100,000 to $299,999 | 319 (89.4%) | 386 (73.0%) |
| $300,000 to $499,999 | 6 (1.7%) | 126 (23.8%) |
| $500,000 to $749,999 | 0 (0.0%) | 17 (3.2%) |
| $750,000 to $999,999 | 17 (4.8%) | 0 (0.0%) |
| $1,000,000 or more | 0 (0.0%) | 0 (0.0%) |
| Total | 357 (100.0%) | 529 (100.0%) |
Household Income by Mortgage Status in Wayne Heights
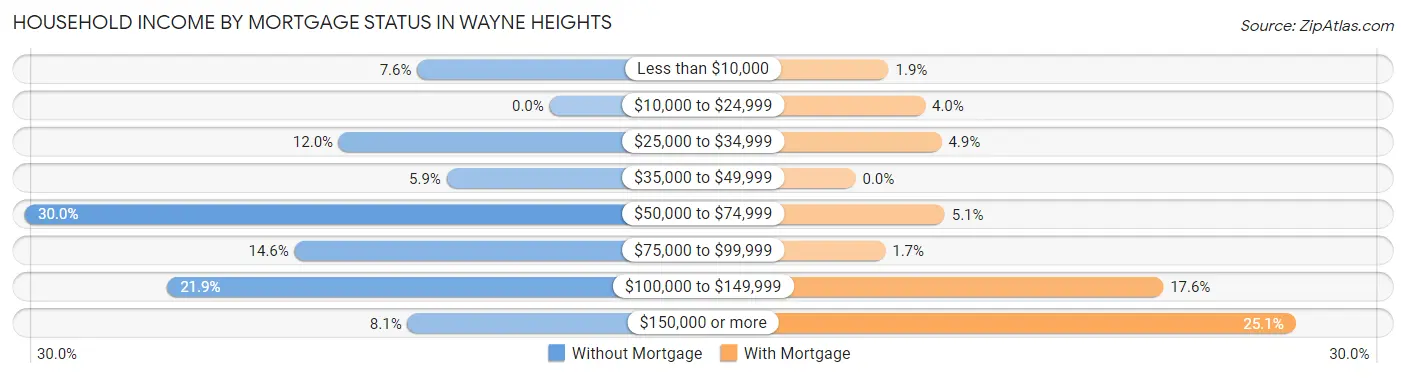
| Household Income | Without Mortgage | With Mortgage |
| Less than $10,000 | 27 (7.6%) | 10 (1.9%) |
| $10,000 to $24,999 | 0 (0.0%) | 21 (4.0%) |
| $25,000 to $34,999 | 43 (12.0%) | 26 (4.9%) |
| $35,000 to $49,999 | 21 (5.9%) | 0 (0.0%) |
| $50,000 to $74,999 | 107 (30.0%) | 27 (5.1%) |
| $75,000 to $99,999 | 52 (14.6%) | 9 (1.7%) |
| $100,000 to $149,999 | 78 (21.8%) | 93 (17.6%) |
| $150,000 or more | 29 (8.1%) | 133 (25.1%) |
| Total | 357 (100.0%) | 529 (100.0%) |
Property Value to Household Income Ratio in Wayne Heights
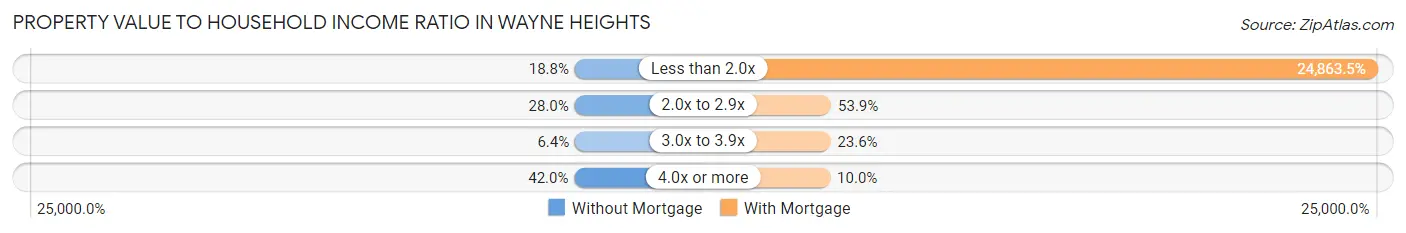
| Value-to-Income Ratio | Without Mortgage | With Mortgage |
| Less than 2.0x | 67 (18.8%) | 131,528 (24,863.5%) |
| 2.0x to 2.9x | 100 (28.0%) | 285 (53.9%) |
| 3.0x to 3.9x | 23 (6.4%) | 125 (23.6%) |
| 4.0x or more | 150 (42.0%) | 53 (10.0%) |
| Total | 357 (100.0%) | 529 (100.0%) |
Real Estate Taxes by Mortgage Status in Wayne Heights
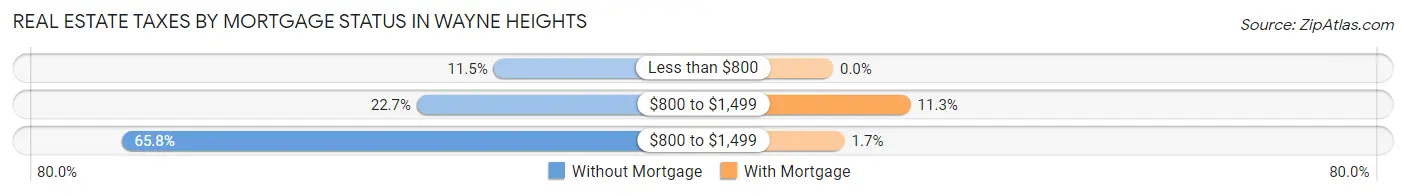
| Property Taxes | Without Mortgage | With Mortgage |
| Less than $800 | 41 (11.5%) | 0 (0.0%) |
| $800 to $1,499 | 81 (22.7%) | 60 (11.3%) |
| $800 to $1,499 | 235 (65.8%) | 9 (1.7%) |
| Total | 357 (100.0%) | 529 (100.0%) |
Health & Disability in Wayne Heights
Health Insurance Coverage by Age in Wayne Heights
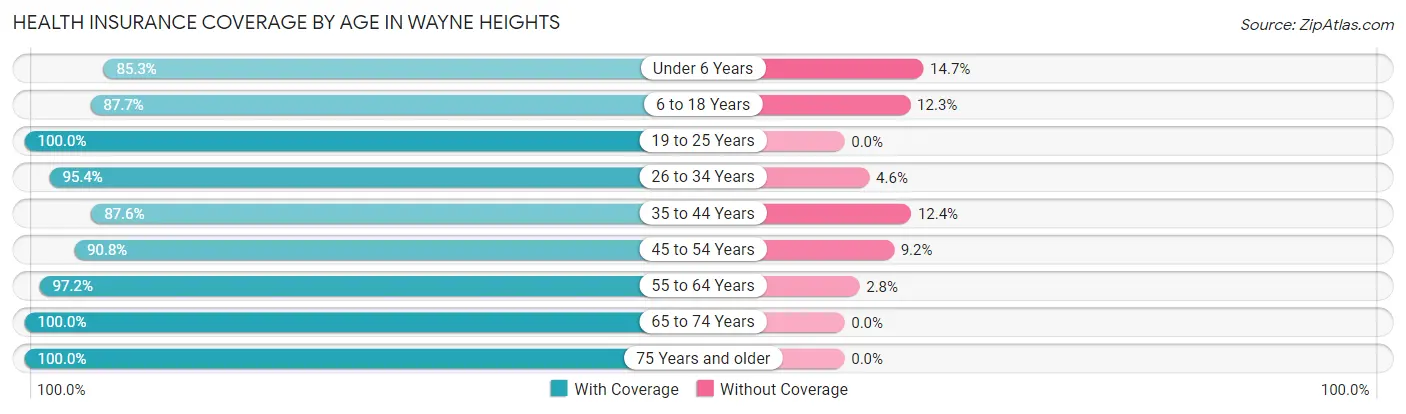
| Age Bracket | With Coverage | Without Coverage |
| Under 6 Years | 145 (85.3%) | 25 (14.7%) |
| 6 to 18 Years | 607 (87.7%) | 85 (12.3%) |
| 19 to 25 Years | 187 (100.0%) | 0 (0.0%) |
| 26 to 34 Years | 288 (95.4%) | 14 (4.6%) |
| 35 to 44 Years | 458 (87.6%) | 65 (12.4%) |
| 45 to 54 Years | 473 (90.8%) | 48 (9.2%) |
| 55 to 64 Years | 314 (97.2%) | 9 (2.8%) |
| 65 to 74 Years | 157 (100.0%) | 0 (0.0%) |
| 75 Years and older | 272 (100.0%) | 0 (0.0%) |
| Total | 2,901 (92.2%) | 246 (7.8%) |
Health Insurance Coverage by Citizenship Status in Wayne Heights
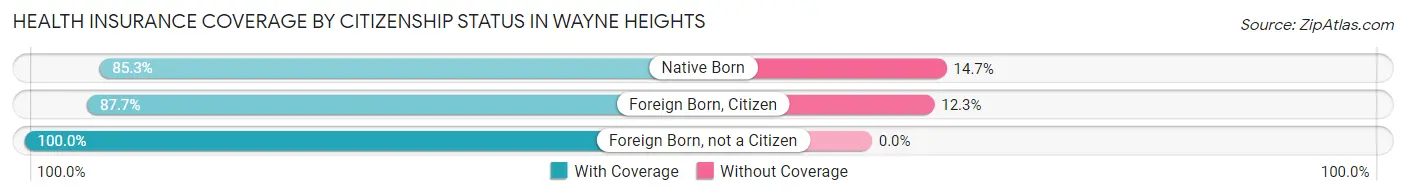
| Citizenship Status | With Coverage | Without Coverage |
| Native Born | 145 (85.3%) | 25 (14.7%) |
| Foreign Born, Citizen | 607 (87.7%) | 85 (12.3%) |
| Foreign Born, not a Citizen | 187 (100.0%) | 0 (0.0%) |
Health Insurance Coverage by Household Income in Wayne Heights
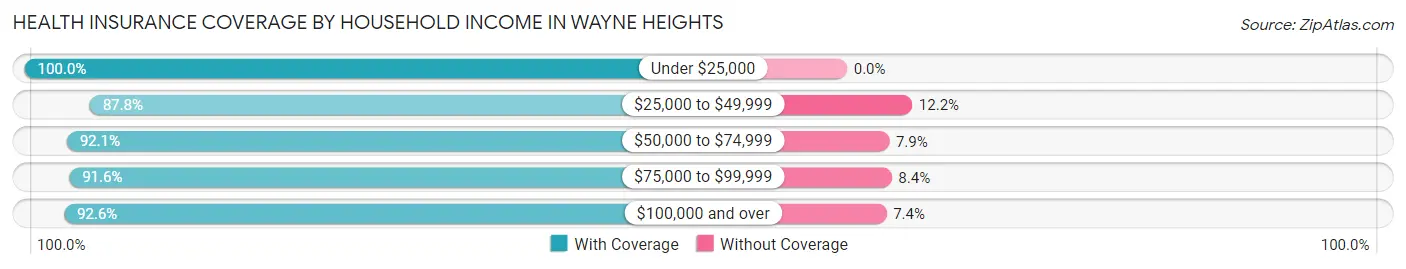
| Household Income | With Coverage | Without Coverage |
| Under $25,000 | 130 (100.0%) | 0 (0.0%) |
| $25,000 to $49,999 | 288 (87.8%) | 40 (12.2%) |
| $50,000 to $74,999 | 338 (92.1%) | 29 (7.9%) |
| $75,000 to $99,999 | 526 (91.6%) | 48 (8.4%) |
| $100,000 and over | 1,619 (92.6%) | 129 (7.4%) |
Public vs Private Health Insurance Coverage by Age in Wayne Heights
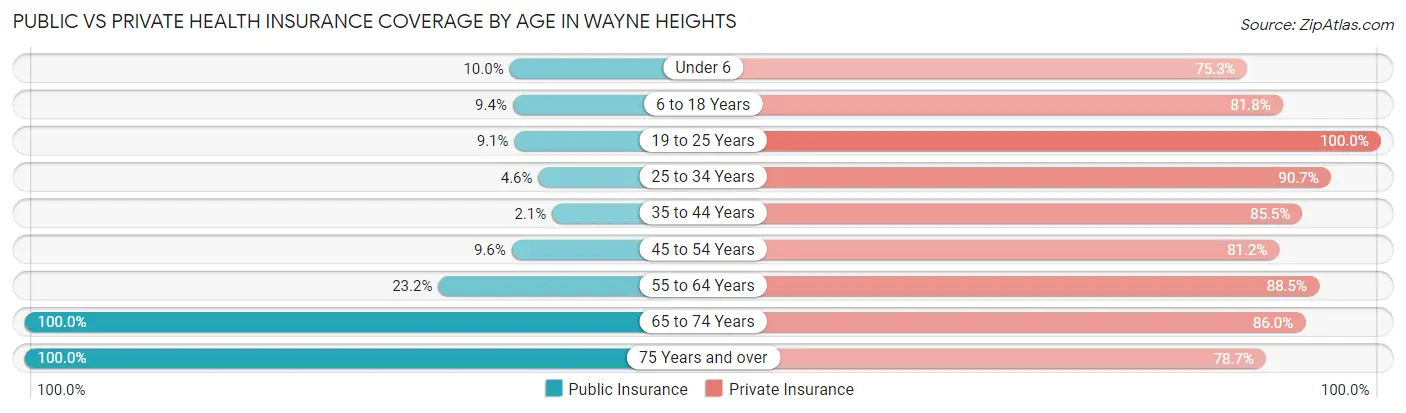
| Age Bracket | Public Insurance | Private Insurance |
| Under 6 | 17 (10.0%) | 128 (75.3%) |
| 6 to 18 Years | 65 (9.4%) | 566 (81.8%) |
| 19 to 25 Years | 17 (9.1%) | 187 (100.0%) |
| 25 to 34 Years | 14 (4.6%) | 274 (90.7%) |
| 35 to 44 Years | 11 (2.1%) | 447 (85.5%) |
| 45 to 54 Years | 50 (9.6%) | 423 (81.2%) |
| 55 to 64 Years | 75 (23.2%) | 286 (88.5%) |
| 65 to 74 Years | 157 (100.0%) | 135 (86.0%) |
| 75 Years and over | 272 (100.0%) | 214 (78.7%) |
| Total | 678 (21.5%) | 2,660 (84.5%) |
Disability Status by Sex by Age in Wayne Heights
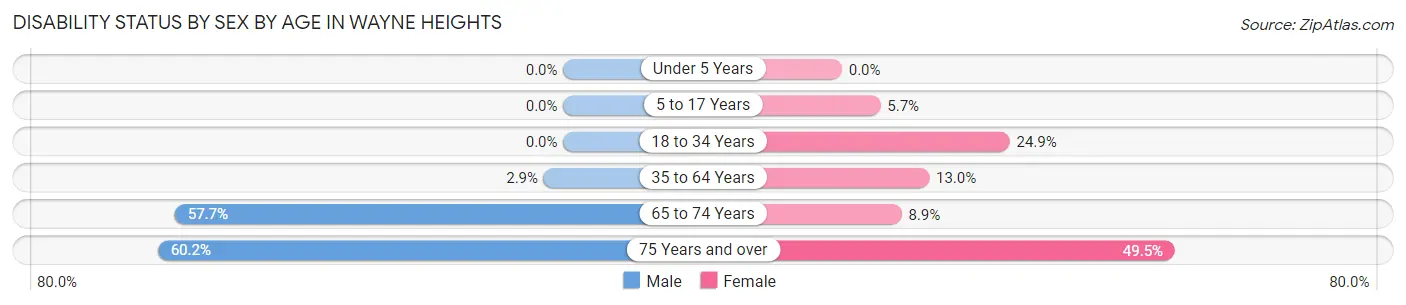
| Age Bracket | Male | Female |
| Under 5 Years | 0 (0.0%) | 0 (0.0%) |
| 5 to 17 Years | 0 (0.0%) | 19 (5.7%) |
| 18 to 34 Years | 0 (0.0%) | 71 (24.9%) |
| 35 to 64 Years | 21 (2.9%) | 83 (13.0%) |
| 65 to 74 Years | 45 (57.7%) | 7 (8.9%) |
| 75 Years and over | 53 (60.2%) | 91 (49.5%) |
Disability Class by Sex by Age in Wayne Heights
Disability Class: Hearing Difficulty
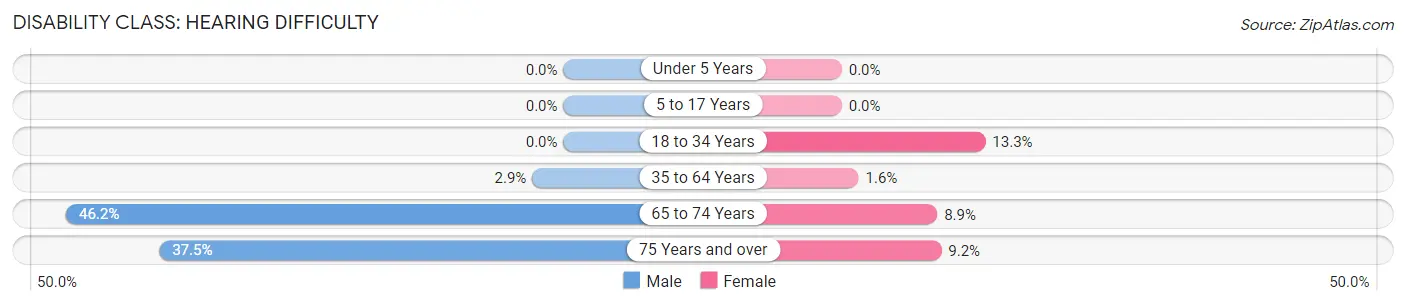
| Age Bracket | Male | Female |
| Under 5 Years | 0 (0.0%) | 0 (0.0%) |
| 5 to 17 Years | 0 (0.0%) | 0 (0.0%) |
| 18 to 34 Years | 0 (0.0%) | 38 (13.3%) |
| 35 to 64 Years | 21 (2.9%) | 10 (1.6%) |
| 65 to 74 Years | 36 (46.2%) | 7 (8.9%) |
| 75 Years and over | 33 (37.5%) | 17 (9.2%) |
Disability Class: Vision Difficulty
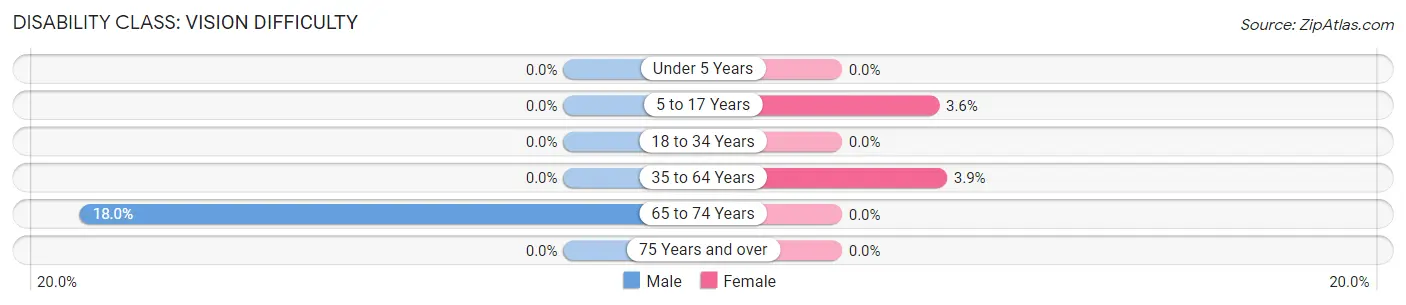
| Age Bracket | Male | Female |
| Under 5 Years | 0 (0.0%) | 0 (0.0%) |
| 5 to 17 Years | 0 (0.0%) | 12 (3.6%) |
| 18 to 34 Years | 0 (0.0%) | 0 (0.0%) |
| 35 to 64 Years | 0 (0.0%) | 25 (3.9%) |
| 65 to 74 Years | 14 (17.9%) | 0 (0.0%) |
| 75 Years and over | 0 (0.0%) | 0 (0.0%) |
Disability Class: Cognitive Difficulty
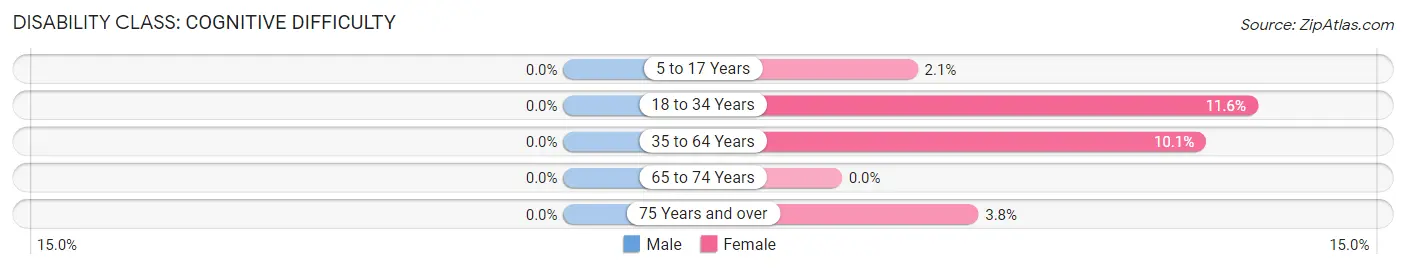
| Age Bracket | Male | Female |
| 5 to 17 Years | 0 (0.0%) | 7 (2.1%) |
| 18 to 34 Years | 0 (0.0%) | 33 (11.6%) |
| 35 to 64 Years | 0 (0.0%) | 65 (10.1%) |
| 65 to 74 Years | 0 (0.0%) | 0 (0.0%) |
| 75 Years and over | 0 (0.0%) | 7 (3.8%) |
Disability Class: Ambulatory Difficulty
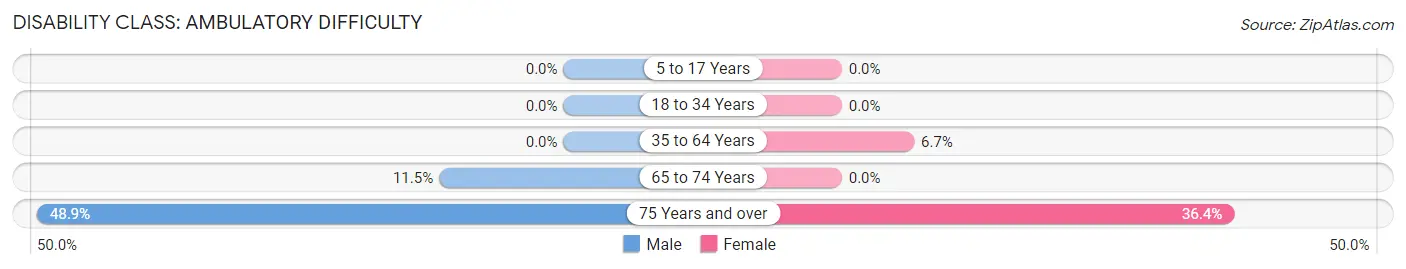
| Age Bracket | Male | Female |
| 5 to 17 Years | 0 (0.0%) | 0 (0.0%) |
| 18 to 34 Years | 0 (0.0%) | 0 (0.0%) |
| 35 to 64 Years | 0 (0.0%) | 43 (6.7%) |
| 65 to 74 Years | 9 (11.5%) | 0 (0.0%) |
| 75 Years and over | 43 (48.9%) | 67 (36.4%) |
Disability Class: Self-Care Difficulty
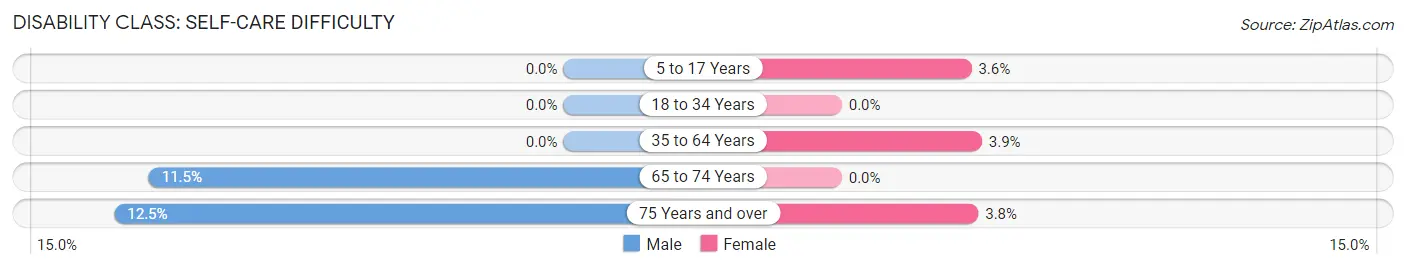
| Age Bracket | Male | Female |
| 5 to 17 Years | 0 (0.0%) | 12 (3.6%) |
| 18 to 34 Years | 0 (0.0%) | 0 (0.0%) |
| 35 to 64 Years | 0 (0.0%) | 25 (3.9%) |
| 65 to 74 Years | 9 (11.5%) | 0 (0.0%) |
| 75 Years and over | 11 (12.5%) | 7 (3.8%) |
Technology Access in Wayne Heights
Computing Device Access in Wayne Heights
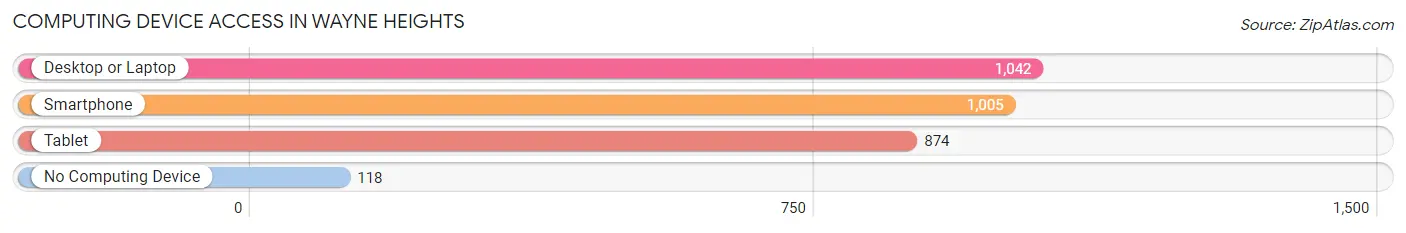
| Device Type | # Households | % Households |
| Desktop or Laptop | 1,042 | 83.0% |
| Smartphone | 1,005 | 80.1% |
| Tablet | 874 | 69.6% |
| No Computing Device | 118 | 9.4% |
| Total | 1,255 | 100.0% |
Internet Access in Wayne Heights
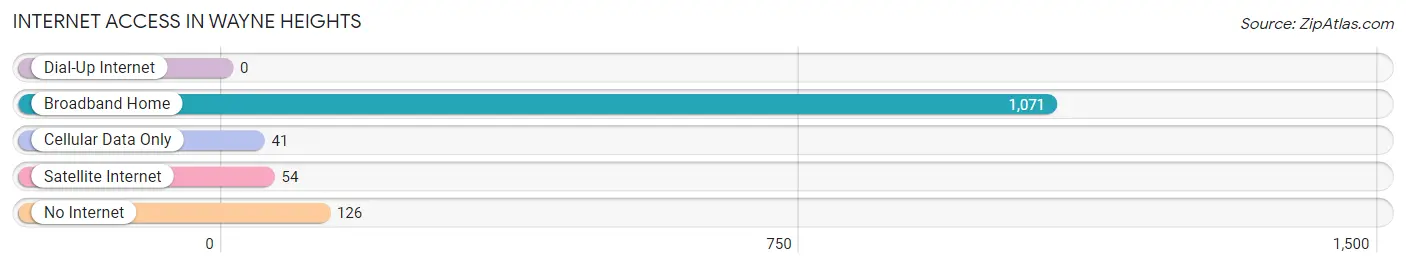
| Internet Type | # Households | % Households |
| Dial-Up Internet | 0 | 0.0% |
| Broadband Home | 1,071 | 85.3% |
| Cellular Data Only | 41 | 3.3% |
| Satellite Internet | 54 | 4.3% |
| No Internet | 126 | 10.0% |
| Total | 1,255 | 100.0% |
Wayne Heights Summary
Wayne Heights is a small unincorporated community located in Washington Township, Franklin County, Pennsylvania. It is situated in the Cumberland Valley, approximately 8 miles south of Chambersburg and 8 miles north of Waynesboro. The population of Wayne Heights was estimated to be 1,845 in 2019.
History
The area that is now Wayne Heights was first settled in the late 1700s by German immigrants. The first settlers were the families of Jacob and John Miller, who arrived in 1790. The area was originally known as Millerstown, and the Millers built a grist mill and a saw mill on the banks of the Conococheague Creek.
In 1820, the area was renamed Wayne Heights after General Anthony Wayne, a Revolutionary War hero. The name was chosen to honor Wayne's victory at the Battle of Stony Point in 1779.
Geography
Wayne Heights is located in the Cumberland Valley, which is part of the Ridge and Valley physiographic province of the Appalachian Mountains. The area is characterized by rolling hills and valleys, with elevations ranging from 500 to 1,000 feet above sea level.
The Conococheague Creek runs through the center of Wayne Heights, and the community is surrounded by farmland and woodlands. The climate is humid continental, with hot, humid summers and cold, snowy winters.
Economy
The economy of Wayne Heights is largely based on agriculture and light manufacturing. The area is home to several small farms, as well as a number of small businesses. The largest employer in the area is the Franklin County Prison, which employs over 500 people.
The area is also home to several small retail stores, restaurants, and other businesses. The community is served by the Waynesboro Area School District, which provides educational opportunities for local students.
Demographics
As of 2019, the population of Wayne Heights was estimated to be 1,845. The racial makeup of the community was 94.3% White, 2.2% African American, 0.7% Asian, 0.3% Native American, and 2.5% from other races. The median household income was $50,945, and the median age was 43.
Conclusion
Wayne Heights is a small unincorporated community located in Washington Township, Franklin County, Pennsylvania. It is situated in the Cumberland Valley, approximately 8 miles south of Chambersburg and 8 miles north of Waynesboro. The economy of Wayne Heights is largely based on agriculture and light manufacturing, and the population was estimated to be 1,845 in 2019. The area is characterized by rolling hills and valleys, with elevations ranging from 500 to 1,000 feet above sea level. The community is served by the Waynesboro Area School District, and the median household income was $50,945 in 2019.
Common Questions
What is Per Capita Income in Wayne Heights?
Per Capita income in Wayne Heights is $40,741.
What is the Median Family Income in Wayne Heights?
Median Family Income in Wayne Heights is $107,900.
What is the Median Household income in Wayne Heights?
Median Household Income in Wayne Heights is $85,880.
What is Income or Wage Gap in Wayne Heights?
Income or Wage Gap in Wayne Heights is 48.7%.
Women in Wayne Heights earn 51.3 cents for every dollar earned by a man.
What is Inequality or Gini Index in Wayne Heights?
Inequality or Gini Index in Wayne Heights is 0.37.
What is the Total Population of Wayne Heights?
Total Population of Wayne Heights is 3,147.
What is the Total Male Population of Wayne Heights?
Total Male Population of Wayne Heights is 1,601.
What is the Total Female Population of Wayne Heights?
Total Female Population of Wayne Heights is 1,546.
What is the Ratio of Males per 100 Females in Wayne Heights?
There are 103.56 Males per 100 Females in Wayne Heights.
What is the Ratio of Females per 100 Males in Wayne Heights?
There are 96.56 Females per 100 Males in Wayne Heights.
What is the Median Population Age in Wayne Heights?
Median Population Age in Wayne Heights is 39.3 Years.
What is the Average Family Size in Wayne Heights
Average Family Size in Wayne Heights is 3.0 People.
What is the Average Household Size in Wayne Heights
Average Household Size in Wayne Heights is 2.5 People.
How Large is the Labor Force in Wayne Heights?
There are 1,715 People in the Labor Forcein in Wayne Heights.
What is the Percentage of People in the Labor Force in Wayne Heights?
69.6% of People are in the Labor Force in Wayne Heights.
What is the Unemployment Rate in Wayne Heights?
Unemployment Rate in Wayne Heights is 2.3%.