Braddock borough, PA Map & Demographics
Braddock borough Overview
$17,645
PER CAPITA INCOME
$38,346
AVG FAMILY INCOME
$27,212
AVG HOUSEHOLD INCOME
0.8%
WAGE / INCOME GAP [ % ]
99.2¢/ $1
WAGE / INCOME GAP [ $ ]
0.47
INEQUALITY / GINI INDEX
1,814
TOTAL POPULATION
984
MALE POPULATION
830
FEMALE POPULATION
118.55
MALES / 100 FEMALES
84.35
FEMALES / 100 MALES
40.4
MEDIAN AGE
3.5
AVG FAMILY SIZE
2.3
AVG HOUSEHOLD SIZE
752
LABOR FORCE [ PEOPLE ]
50.2%
PERCENT IN LABOR FORCE
29.4%
UNEMPLOYMENT RATE
Income in Braddock borough
Income Overview in Braddock borough
Per Capita Income in Braddock borough is $17,645, while median incomes of families and households are $38,346 and $27,212 respectively.
| Characteristic | Number | Measure |
| Per Capita Income | 1,814 | $17,645 |
| Median Family Income | 333 | $38,346 |
| Mean Family Income | 333 | $46,354 |
| Median Household Income | 732 | $27,212 |
| Mean Household Income | 732 | $39,579 |
| Income Deficit | 333 | $0 |
| Wage / Income Gap (%) | 1,814 | 0.84% |
| Wage / Income Gap ($) | 1,814 | 99.16¢ per $1 |
| Gini / Inequality Index | 1,814 | 0.47 |
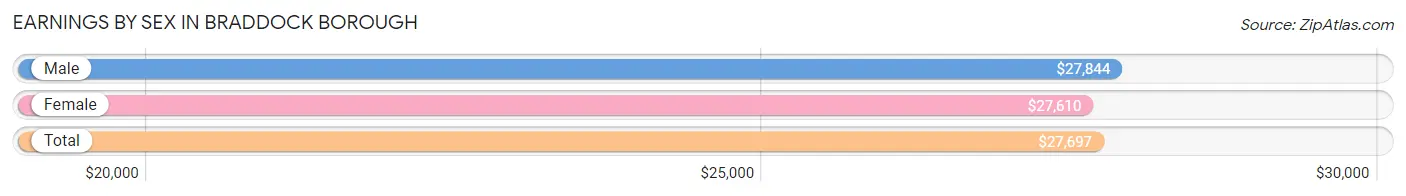
Earnings by Sex in Braddock borough
Average Earnings in Braddock borough are $27,697, $27,844 for men and $27,610 for women, a difference of 0.8%.
| Sex | Number | Average Earnings |
| Male | 317 (46.1%) | $27,844 |
| Female | 370 (53.9%) | $27,610 |
| Total | 687 (100.0%) | $27,697 |
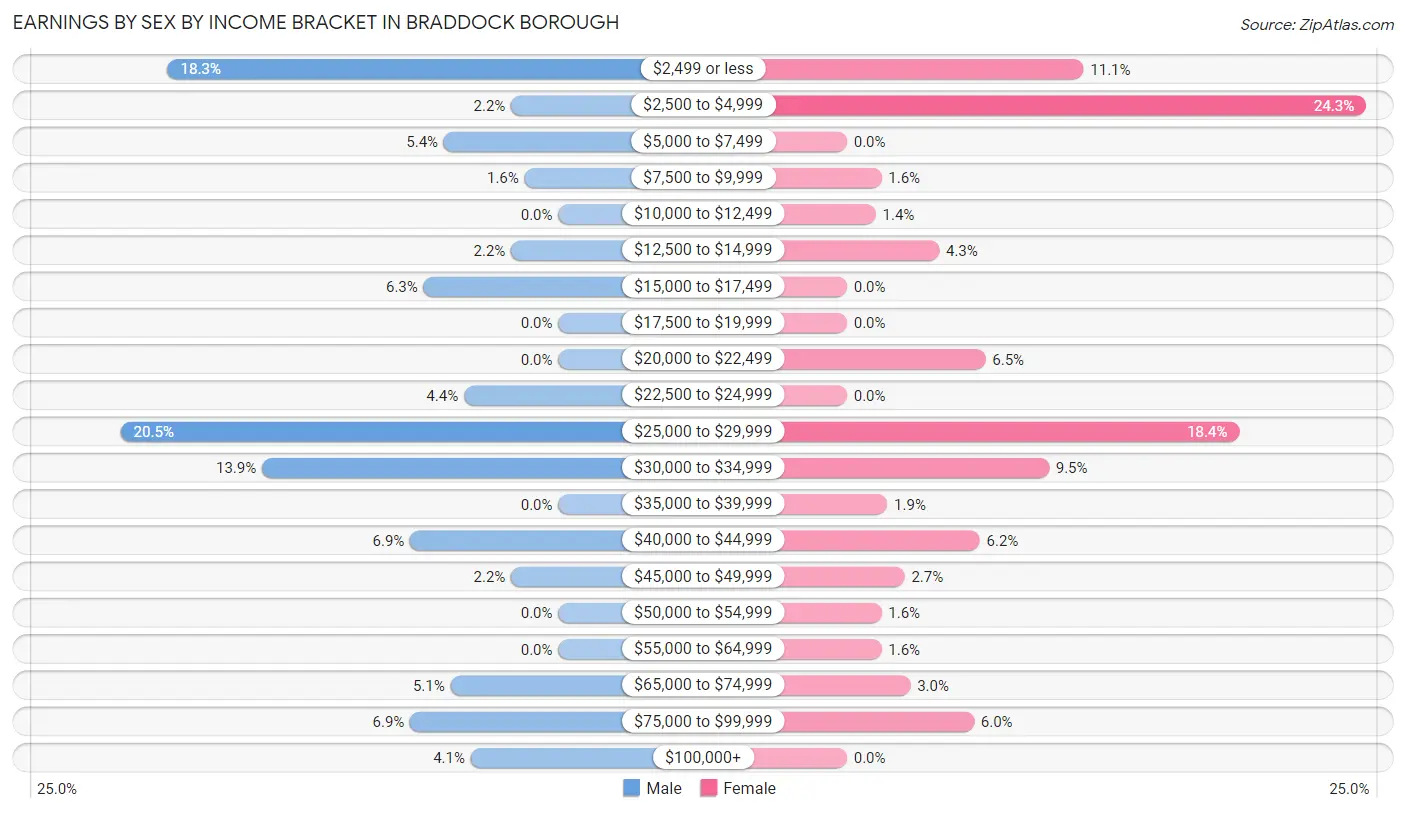
Earnings by Sex by Income Bracket in Braddock borough
The most common earnings brackets in Braddock borough are $25,000 to $29,999 for men (65 | 20.5%) and $2,500 to $4,999 for women (90 | 24.3%).
| Income | Male | Female |
| $2,499 or less | 58 (18.3%) | 41 (11.1%) |
| $2,500 to $4,999 | 7 (2.2%) | 90 (24.3%) |
| $5,000 to $7,499 | 17 (5.4%) | 0 (0.0%) |
| $7,500 to $9,999 | 5 (1.6%) | 6 (1.6%) |
| $10,000 to $12,499 | 0 (0.0%) | 5 (1.3%) |
| $12,500 to $14,999 | 7 (2.2%) | 16 (4.3%) |
| $15,000 to $17,499 | 20 (6.3%) | 0 (0.0%) |
| $17,500 to $19,999 | 0 (0.0%) | 0 (0.0%) |
| $20,000 to $22,499 | 0 (0.0%) | 24 (6.5%) |
| $22,500 to $24,999 | 14 (4.4%) | 0 (0.0%) |
| $25,000 to $29,999 | 65 (20.5%) | 68 (18.4%) |
| $30,000 to $34,999 | 44 (13.9%) | 35 (9.5%) |
| $35,000 to $39,999 | 0 (0.0%) | 7 (1.9%) |
| $40,000 to $44,999 | 22 (6.9%) | 23 (6.2%) |
| $45,000 to $49,999 | 7 (2.2%) | 10 (2.7%) |
| $50,000 to $54,999 | 0 (0.0%) | 6 (1.6%) |
| $55,000 to $64,999 | 0 (0.0%) | 6 (1.6%) |
| $65,000 to $74,999 | 16 (5.1%) | 11 (3.0%) |
| $75,000 to $99,999 | 22 (6.9%) | 22 (5.9%) |
| $100,000+ | 13 (4.1%) | 0 (0.0%) |
| Total | 317 (100.0%) | 370 (100.0%) |
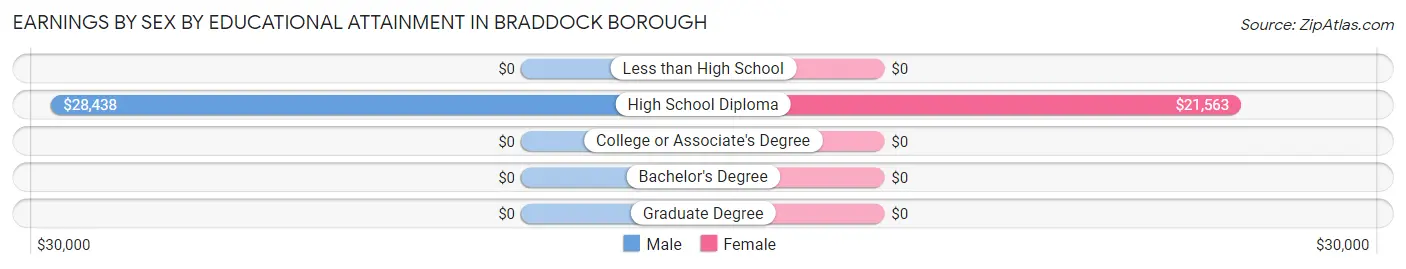
Earnings by Sex by Educational Attainment in Braddock borough
Average earnings in Braddock borough are $29,125 for men and $27,647 for women, a difference of 5.1%. Men with an educational attainment of high school diploma enjoy the highest average annual earnings of $28,438, while those with high school diploma education earn the least with $28,438. Women with an educational attainment of high school diploma earn the most with the average annual earnings of $21,563, while those with high school diploma education have the smallest earnings of $21,563.
| Educational Attainment | Male Income | Female Income |
| Less than High School | - | - |
| High School Diploma | $28,438 | $21,563 |
| College or Associate's Degree | - | - |
| Bachelor's Degree | - | - |
| Graduate Degree | - | - |
| Total | $29,125 | $27,647 |
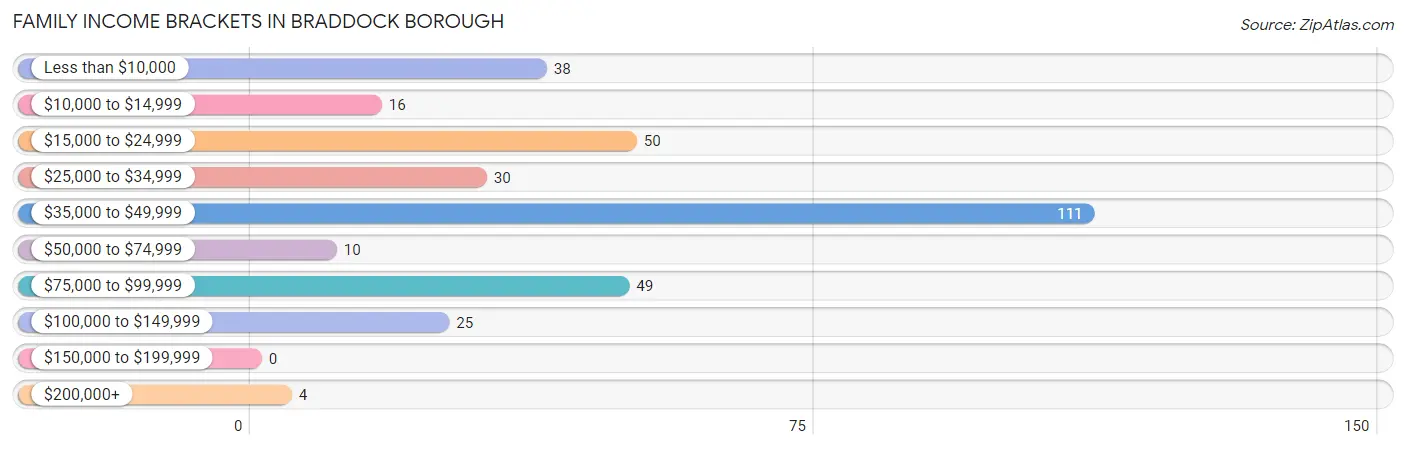
Family Income in Braddock borough
Family Income Brackets in Braddock borough
According to the Braddock borough family income data, there are 111 families falling into the $35,000 to $49,999 income range, which is the most common income bracket and makes up 33.3% of all families.
| Income Bracket | # Families | % Families |
| Less than $10,000 | 38 | 11.4% |
| $10,000 to $14,999 | 16 | 4.8% |
| $15,000 to $24,999 | 50 | 15.0% |
| $25,000 to $34,999 | 30 | 9.0% |
| $35,000 to $49,999 | 111 | 33.3% |
| $50,000 to $74,999 | 10 | 3.0% |
| $75,000 to $99,999 | 49 | 14.7% |
| $100,000 to $149,999 | 25 | 7.5% |
| $150,000 to $199,999 | 0 | 0.0% |
| $200,000+ | 4 | 1.2% |
Family Income by Famaliy Size in Braddock borough
2-person families (152 | 45.7%) account for the highest median family income in Braddock borough with $33,000 per family, while 2-person families (152 | 45.7%) have the highest median income of $16,500 per family member.
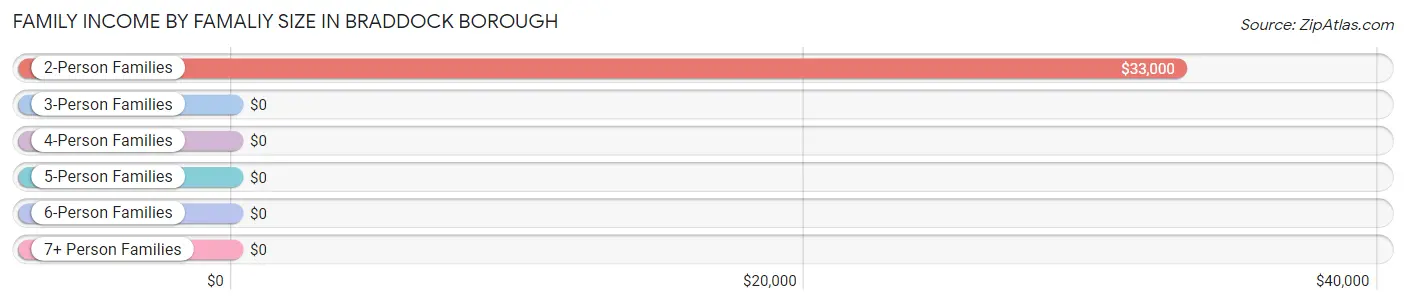
| Income Bracket | # Families | Median Income |
| 2-Person Families | 152 (45.7%) | $33,000 |
| 3-Person Families | 52 (15.6%) | $0 |
| 4-Person Families | 32 (9.6%) | $0 |
| 5-Person Families | 79 (23.7%) | $0 |
| 6-Person Families | 18 (5.4%) | $0 |
| 7+ Person Families | 0 (0.0%) | $0 |
| Total | 333 (100.0%) | $38,346 |
Family Income by Number of Earners in Braddock borough
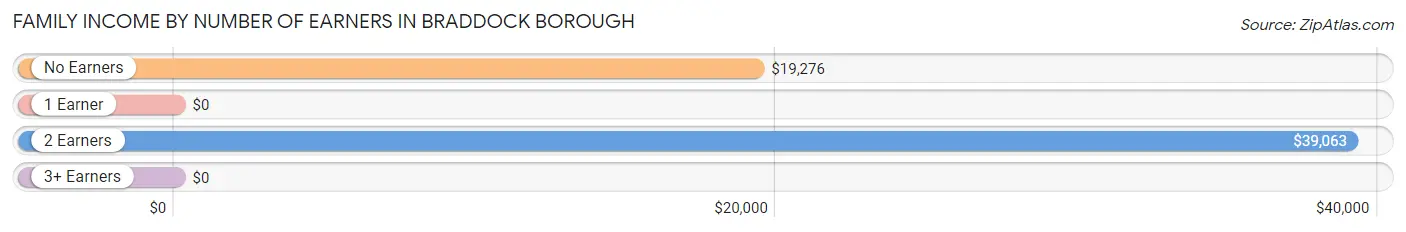
| Number of Earners | # Families | Median Income |
| No Earners | 63 (18.9%) | $19,276 |
| 1 Earner | 126 (37.8%) | $0 |
| 2 Earners | 140 (42.0%) | $39,063 |
| 3+ Earners | 4 (1.2%) | $0 |
| Total | 333 (100.0%) | $38,346 |
Household Income in Braddock borough
Household Income Brackets in Braddock borough
With 168 households falling in the category, the $15,000 to $24,999 income range is the most frequent in Braddock borough, accounting for 23.0% of all households.
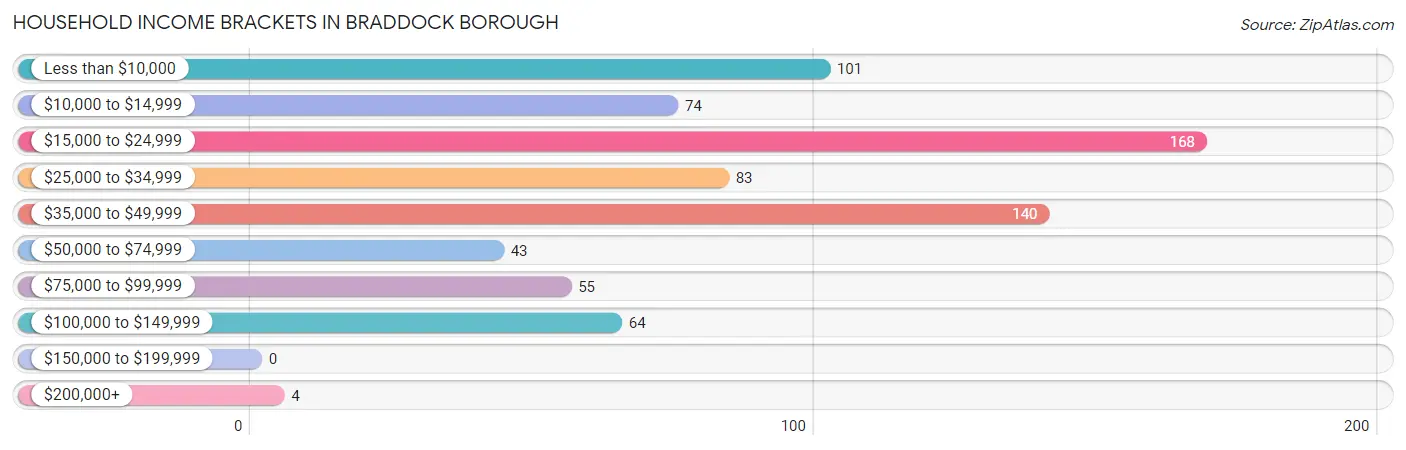
| Income Bracket | # Households | % Households |
| Less than $10,000 | 101 | 13.8% |
| $10,000 to $14,999 | 74 | 10.1% |
| $15,000 to $24,999 | 168 | 23.0% |
| $25,000 to $34,999 | 83 | 11.3% |
| $35,000 to $49,999 | 140 | 19.1% |
| $50,000 to $74,999 | 43 | 5.9% |
| $75,000 to $99,999 | 55 | 7.5% |
| $100,000 to $149,999 | 64 | 8.7% |
| $150,000 to $199,999 | 0 | 0.0% |
| $200,000+ | 4 | 0.5% |
Household Income by Householder Age in Braddock borough
The median household income in Braddock borough is $27,212, with the highest median household income of $38,321 found in the 45 to 64 years age bracket for the primary householder. A total of 303 households (41.4%) fall into this category.
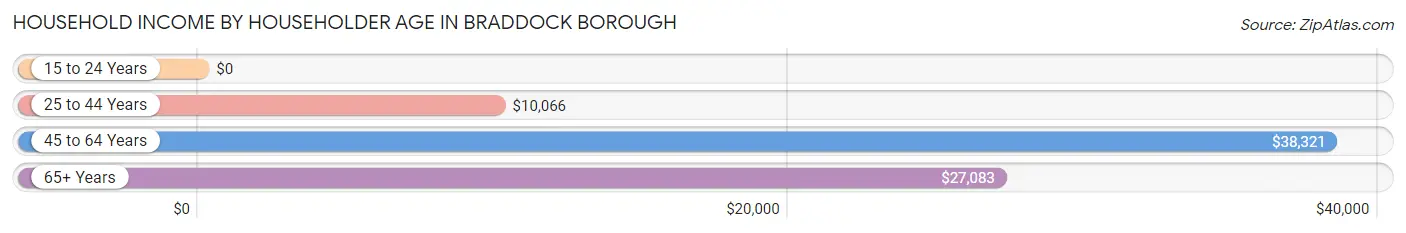
| Income Bracket | # Households | Median Income |
| 15 to 24 Years | 0 (0.0%) | $0 |
| 25 to 44 Years | 119 (16.3%) | $10,066 |
| 45 to 64 Years | 303 (41.4%) | $38,321 |
| 65+ Years | 310 (42.3%) | $27,083 |
| Total | 732 (100.0%) | $27,212 |
Poverty in Braddock borough
Income Below Poverty by Sex and Age in Braddock borough
With 37.2% poverty level for males and 24.1% for females among the residents of Braddock borough, under 5 year old males and 6 to 11 year old females are the most vulnerable to poverty, with 14 males (100.0%) and 44 females (100.0%) in their respective age groups living below the poverty level.
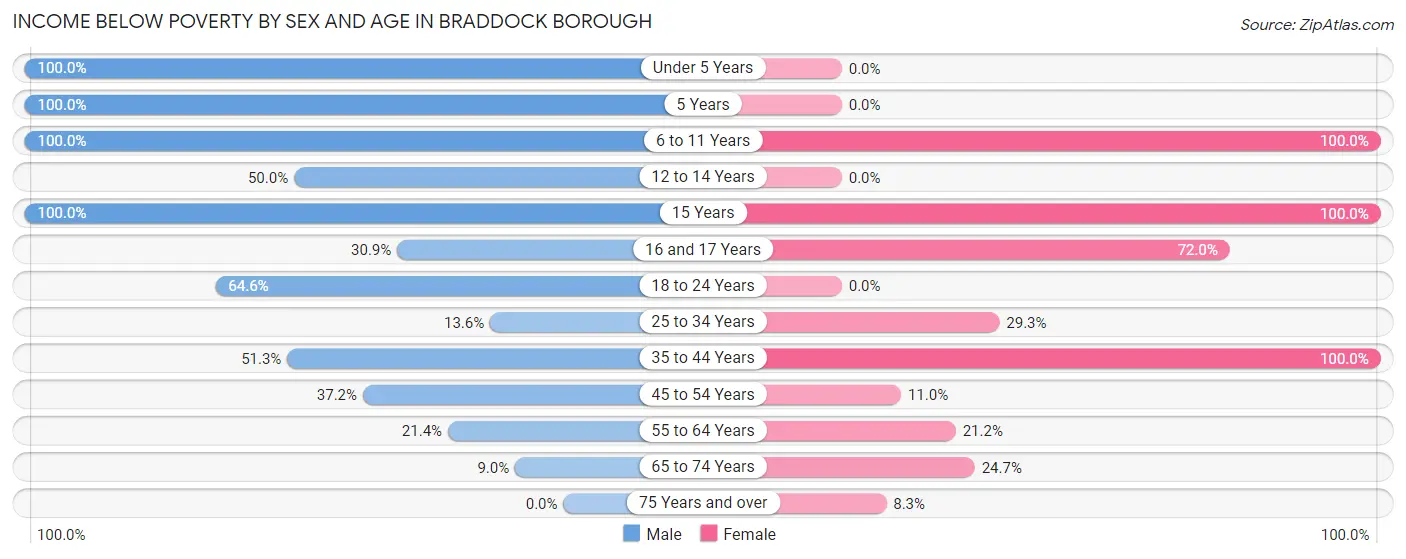
| Age Bracket | Male | Female |
| Under 5 Years | 14 (100.0%) | 0 (0.0%) |
| 5 Years | 16 (100.0%) | 0 (0.0%) |
| 6 to 11 Years | 32 (100.0%) | 44 (100.0%) |
| 12 to 14 Years | 23 (50.0%) | 0 (0.0%) |
| 15 Years | 25 (100.0%) | 18 (100.0%) |
| 16 and 17 Years | 25 (30.9%) | 18 (72.0%) |
| 18 to 24 Years | 62 (64.6%) | 0 (0.0%) |
| 25 to 34 Years | 20 (13.6%) | 31 (29.2%) |
| 35 to 44 Years | 61 (51.3%) | 18 (100.0%) |
| 45 to 54 Years | 32 (37.2%) | 20 (11.0%) |
| 55 to 64 Years | 18 (21.4%) | 22 (21.1%) |
| 65 to 74 Years | 7 (9.0%) | 19 (24.7%) |
| 75 Years and over | 0 (0.0%) | 10 (8.3%) |
| Total | 335 (37.2%) | 200 (24.1%) |
Income Above Poverty by Sex and Age in Braddock borough
According to the poverty statistics in Braddock borough, males aged 75 years and over and females aged 12 to 14 years are the age groups that are most secure financially, with 100.0% of males and 100.0% of females in these age groups living above the poverty line.
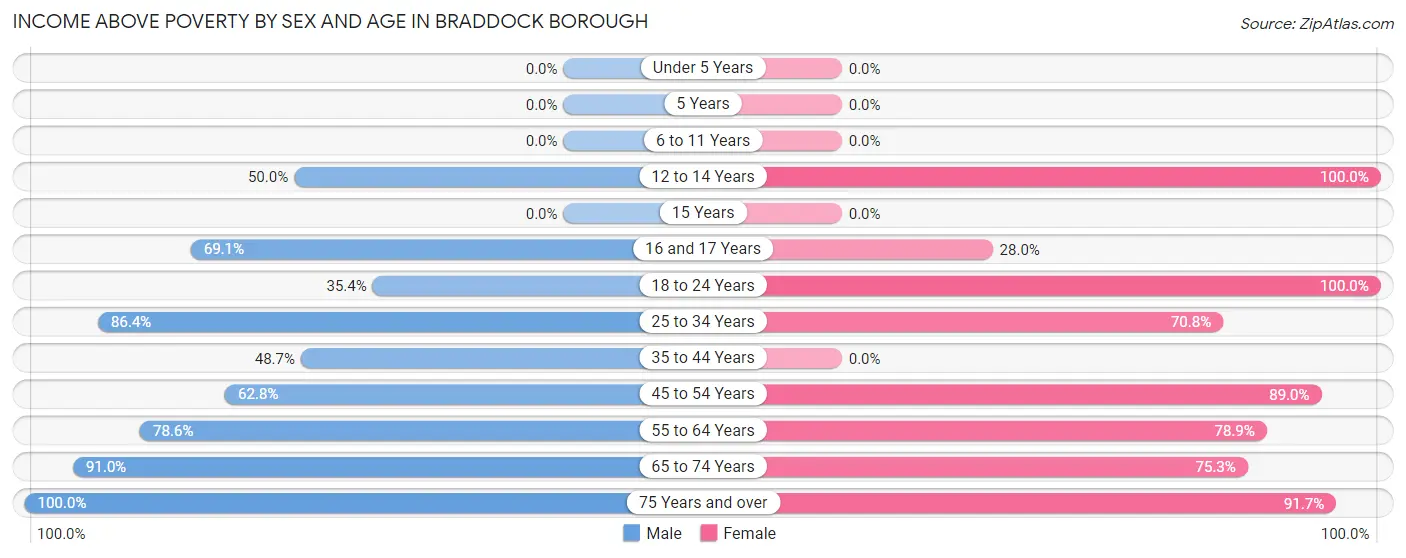
| Age Bracket | Male | Female |
| Under 5 Years | 0 (0.0%) | 0 (0.0%) |
| 5 Years | 0 (0.0%) | 0 (0.0%) |
| 6 to 11 Years | 0 (0.0%) | 0 (0.0%) |
| 12 to 14 Years | 23 (50.0%) | 121 (100.0%) |
| 15 Years | 0 (0.0%) | 0 (0.0%) |
| 16 and 17 Years | 56 (69.1%) | 7 (28.0%) |
| 18 to 24 Years | 34 (35.4%) | 14 (100.0%) |
| 25 to 34 Years | 127 (86.4%) | 75 (70.8%) |
| 35 to 44 Years | 58 (48.7%) | 0 (0.0%) |
| 45 to 54 Years | 54 (62.8%) | 162 (89.0%) |
| 55 to 64 Years | 66 (78.6%) | 82 (78.8%) |
| 65 to 74 Years | 71 (91.0%) | 58 (75.3%) |
| 75 Years and over | 76 (100.0%) | 111 (91.7%) |
| Total | 565 (62.8%) | 630 (75.9%) |
Income Below Poverty Among Married-Couple Families in Braddock borough
The poverty statistics for married-couple families in Braddock borough show that 28.1% or 16 of the total 57 families live below the poverty line. Families with 1 or 2 children have the highest poverty rate of 76.2%, comprising of 16 families. On the other hand, families with no children have the lowest poverty rate of 0.0%, which includes 0 families.
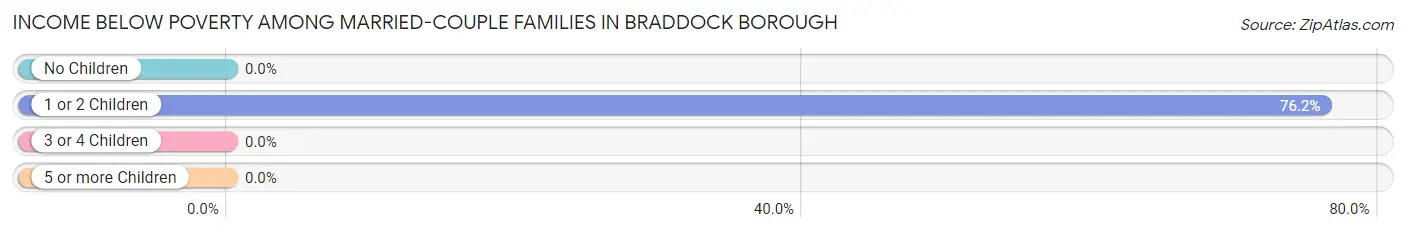
| Children | Above Poverty | Below Poverty |
| No Children | 36 (100.0%) | 0 (0.0%) |
| 1 or 2 Children | 5 (23.8%) | 16 (76.2%) |
| 3 or 4 Children | 0 (0.0%) | 0 (0.0%) |
| 5 or more Children | 0 (0.0%) | 0 (0.0%) |
| Total | 41 (71.9%) | 16 (28.1%) |
Income Below Poverty Among Single-Parent Households in Braddock borough
According to the poverty data in Braddock borough, 33.8% or 24 single-father households and 25.9% or 53 single-mother households are living below the poverty line. Among single-father households, those with 1 or 2 children have the highest poverty rate, with 19 households (55.9%) experiencing poverty. Likewise, among single-mother households, those with 5 or more children have the highest poverty rate, with 18 households (100.0%) falling below the poverty line.
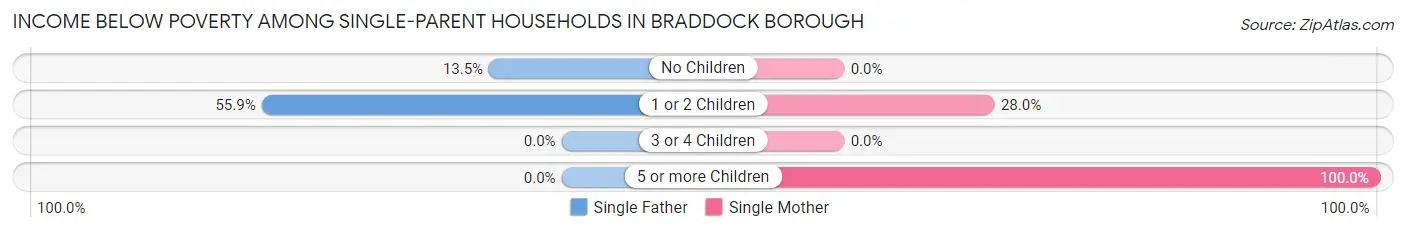
| Children | Single Father | Single Mother |
| No Children | 5 (13.5%) | 0 (0.0%) |
| 1 or 2 Children | 19 (55.9%) | 35 (28.0%) |
| 3 or 4 Children | 0 (0.0%) | 0 (0.0%) |
| 5 or more Children | 0 (0.0%) | 18 (100.0%) |
| Total | 24 (33.8%) | 53 (25.9%) |
Income Below Poverty Among Married-Couple vs Single-Parent Households in Braddock borough
The poverty data for Braddock borough shows that 16 of the married-couple family households (28.1%) and 77 of the single-parent households (27.9%) are living below the poverty level. Within the married-couple family households, those with 1 or 2 children have the highest poverty rate, with 16 households (76.2%) falling below the poverty line. Among the single-parent households, those with 5 or more children have the highest poverty rate, with 18 household (100.0%) living below poverty.
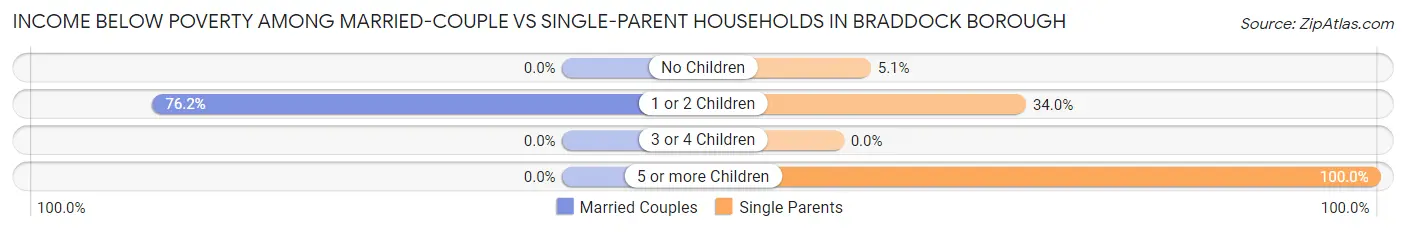
| Children | Married-Couple Families | Single-Parent Households |
| No Children | 0 (0.0%) | 5 (5.1%) |
| 1 or 2 Children | 16 (76.2%) | 54 (34.0%) |
| 3 or 4 Children | 0 (0.0%) | 0 (0.0%) |
| 5 or more Children | 0 (0.0%) | 18 (100.0%) |
| Total | 16 (28.1%) | 77 (27.9%) |
Race in Braddock borough
The most populous races in Braddock borough are Black / African American (1,443 | 79.5%), White / Caucasian (296 | 16.3%), and Two or more Races (75 | 4.1%).
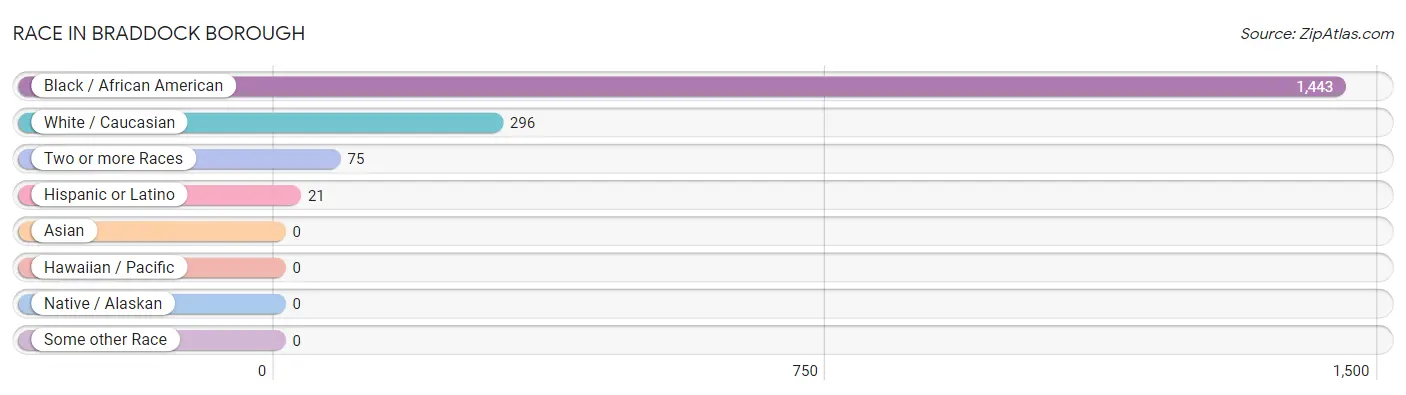
| Race | # Population | % Population |
| Asian | 0 | 0.0% |
| Black / African American | 1,443 | 79.5% |
| Hawaiian / Pacific | 0 | 0.0% |
| Hispanic or Latino | 21 | 1.2% |
| Native / Alaskan | 0 | 0.0% |
| White / Caucasian | 296 | 16.3% |
| Two or more Races | 75 | 4.1% |
| Some other Race | 0 | 0.0% |
| Total | 1,814 | 100.0% |
Ancestry in Braddock borough
The most populous ancestries reported in Braddock borough are Subsaharan African (158 | 8.7%), African (125 | 6.9%), German (72 | 4.0%), Irish (59 | 3.3%), and American (51 | 2.8%), together accounting for 25.6% of all Braddock borough residents.
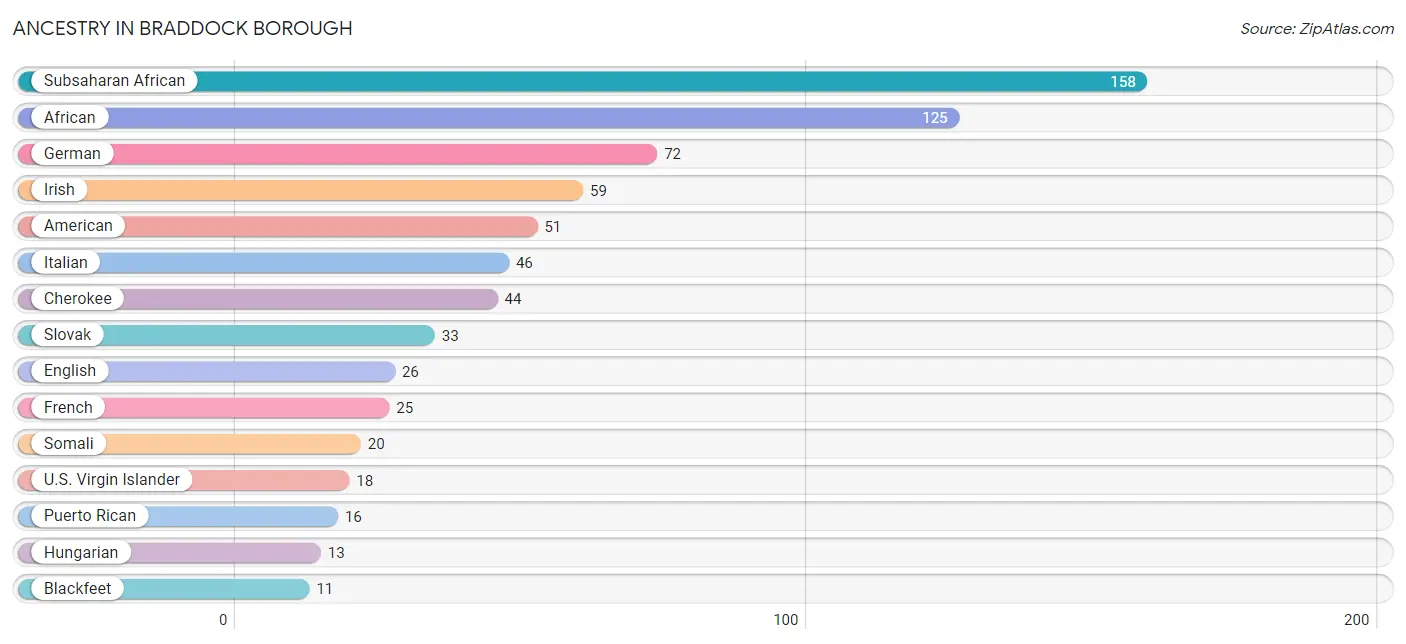
| Ancestry | # Population | % Population |
| African | 125 | 6.9% |
| American | 51 | 2.8% |
| Bhutanese | 5 | 0.3% |
| Blackfeet | 11 | 0.6% |
| Cherokee | 44 | 2.4% |
| Croatian | 6 | 0.3% |
| Eastern European | 7 | 0.4% |
| English | 26 | 1.4% |
| French | 25 | 1.4% |
| German | 72 | 4.0% |
| Greek | 6 | 0.3% |
| Hungarian | 13 | 0.7% |
| Irish | 59 | 3.3% |
| Italian | 46 | 2.5% |
| Mexican | 5 | 0.3% |
| Polish | 6 | 0.3% |
| Puerto Rican | 16 | 0.9% |
| Russian | 10 | 0.5% |
| Sioux | 7 | 0.4% |
| Slovak | 33 | 1.8% |
| Somali | 20 | 1.1% |
| Subsaharan African | 158 | 8.7% |
| U.S. Virgin Islander | 18 | 1.0% |
| Ukrainian | 5 | 0.3% | View All 24 Rows |
Immigrants in Braddock borough
The most numerous immigrant groups reported in Braddock borough came from Africa (13 | 0.7%), Cameroon (13 | 0.7%), and Middle Africa (13 | 0.7%), together accounting for 2.2% of all Braddock borough residents.
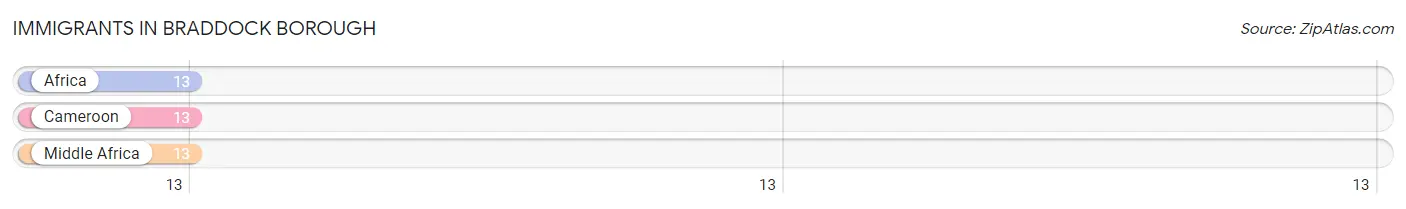
| Immigration Origin | # Population | % Population |
| Africa | 13 | 0.7% |
| Cameroon | 13 | 0.7% |
| Middle Africa | 13 | 0.7% | View All 3 Rows |
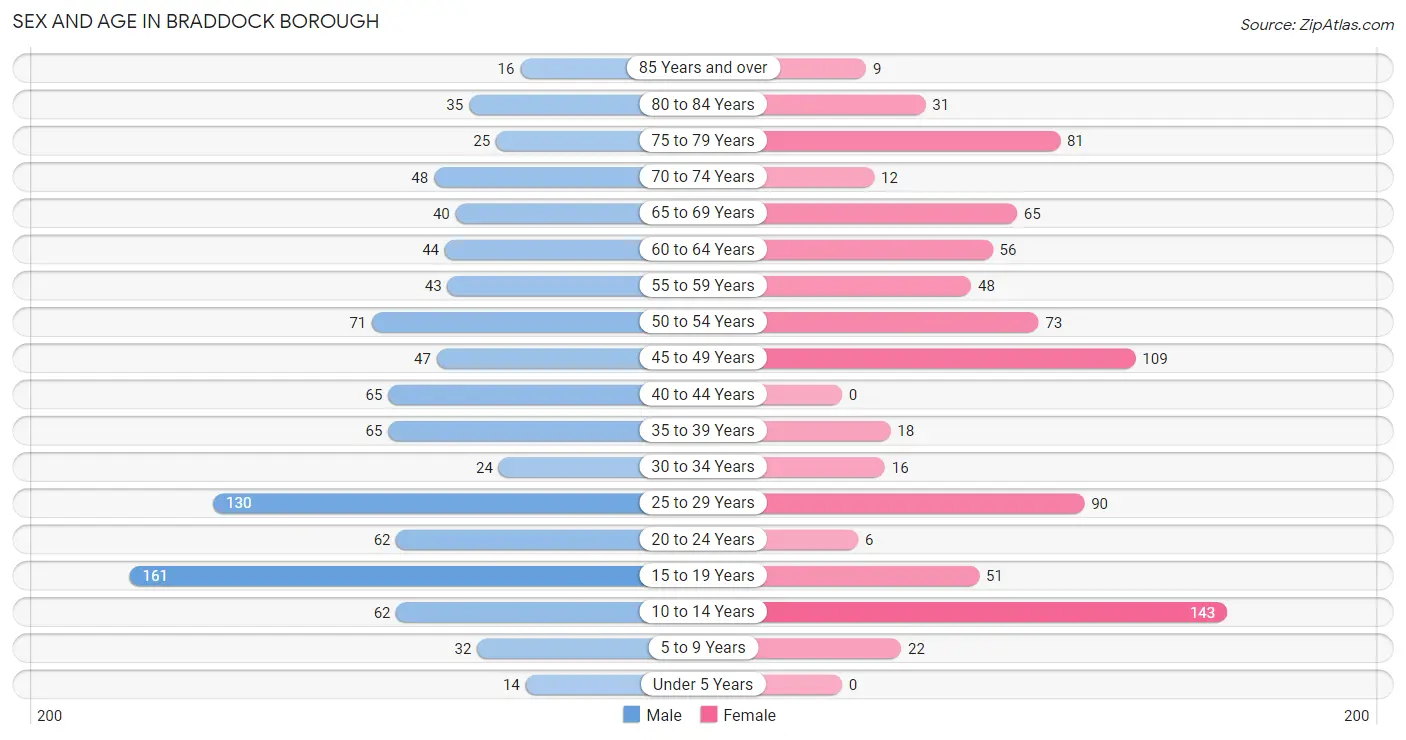
Sex and Age in Braddock borough
Sex and Age in Braddock borough
The most populous age groups in Braddock borough are 15 to 19 Years (161 | 16.4%) for men and 10 to 14 Years (143 | 17.2%) for women.
| Age Bracket | Male | Female |
| Under 5 Years | 14 (1.4%) | 0 (0.0%) |
| 5 to 9 Years | 32 (3.3%) | 22 (2.6%) |
| 10 to 14 Years | 62 (6.3%) | 143 (17.2%) |
| 15 to 19 Years | 161 (16.4%) | 51 (6.1%) |
| 20 to 24 Years | 62 (6.3%) | 6 (0.7%) |
| 25 to 29 Years | 130 (13.2%) | 90 (10.8%) |
| 30 to 34 Years | 24 (2.4%) | 16 (1.9%) |
| 35 to 39 Years | 65 (6.6%) | 18 (2.2%) |
| 40 to 44 Years | 65 (6.6%) | 0 (0.0%) |
| 45 to 49 Years | 47 (4.8%) | 109 (13.1%) |
| 50 to 54 Years | 71 (7.2%) | 73 (8.8%) |
| 55 to 59 Years | 43 (4.4%) | 48 (5.8%) |
| 60 to 64 Years | 44 (4.5%) | 56 (6.8%) |
| 65 to 69 Years | 40 (4.1%) | 65 (7.8%) |
| 70 to 74 Years | 48 (4.9%) | 12 (1.5%) |
| 75 to 79 Years | 25 (2.5%) | 81 (9.8%) |
| 80 to 84 Years | 35 (3.6%) | 31 (3.7%) |
| 85 Years and over | 16 (1.6%) | 9 (1.1%) |
| Total | 984 (100.0%) | 830 (100.0%) |
Families and Households in Braddock borough
Median Family Size in Braddock borough
The median family size in Braddock borough is 3.54 persons per family, with single female/mother families (205 | 61.6%) accounting for the largest median family size of 3.94 persons per family. On the other hand, single male/father families (71 | 21.3%) represent the smallest median family size with 2.34 persons per family.

| Family Type | # Families | Family Size |
| Married-Couple | 57 (17.1%) | 3.61 |
| Single Male/Father | 71 (21.3%) | 2.34 |
| Single Female/Mother | 205 (61.6%) | 3.94 |
| Total Families | 333 (100.0%) | 3.54 |
Median Household Size in Braddock borough
The median household size in Braddock borough is 2.29 persons per household, with single female/mother households (205 | 28.0%) accounting for the largest median household size of 3.94 persons per household. non-family households (399 | 54.5%) represent the smallest median household size with 1.20 persons per household.
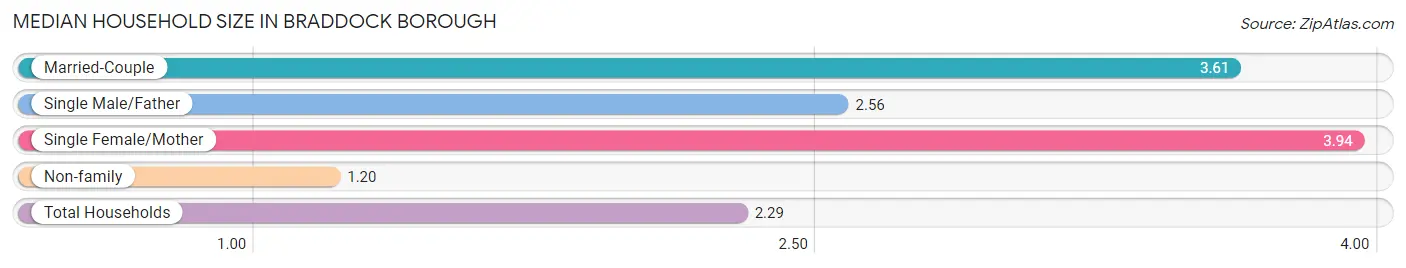
| Household Type | # Households | Household Size |
| Married-Couple | 57 (7.8%) | 3.61 |
| Single Male/Father | 71 (9.7%) | 2.56 |
| Single Female/Mother | 205 (28.0%) | 3.94 |
| Non-family | 399 (54.5%) | 1.20 |
| Total Households | 732 (100.0%) | 2.29 |
Household Size by Marriage Status in Braddock borough
Out of a total of 732 households in Braddock borough, 333 (45.5%) are family households, while 399 (54.5%) are nonfamily households. The most numerous type of family households are 2-person households, comprising 137, and the most common type of nonfamily households are 1-person households, comprising 356.
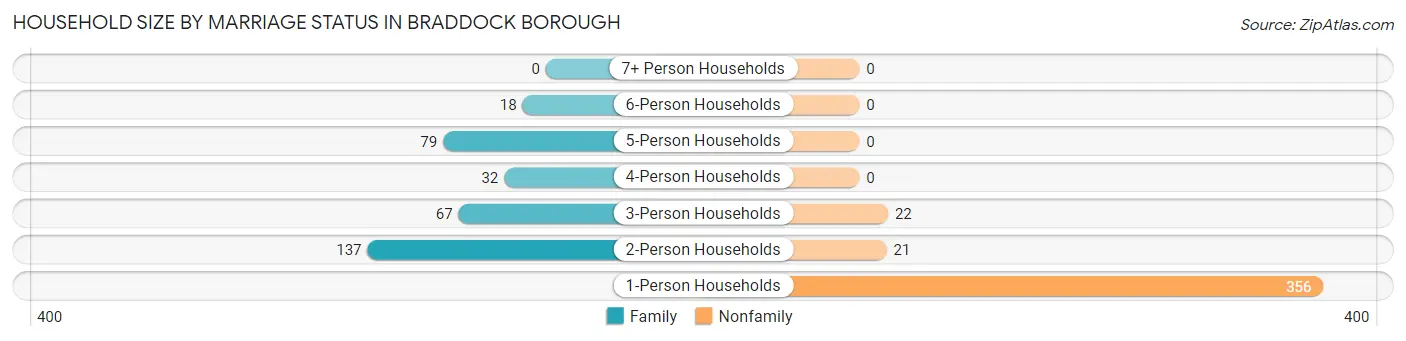
| Household Size | Family Households | Nonfamily Households |
| 1-Person Households | - | 356 (48.6%) |
| 2-Person Households | 137 (18.7%) | 21 (2.9%) |
| 3-Person Households | 67 (9.1%) | 22 (3.0%) |
| 4-Person Households | 32 (4.4%) | 0 (0.0%) |
| 5-Person Households | 79 (10.8%) | 0 (0.0%) |
| 6-Person Households | 18 (2.5%) | 0 (0.0%) |
| 7+ Person Households | 0 (0.0%) | 0 (0.0%) |
| Total | 333 (45.5%) | 399 (54.5%) |
Female Fertility in Braddock borough
Fertility by Age in Braddock borough
| Age Bracket | Women with Births | Births / 1,000 Women |
| 15 to 19 years | 0 (0.0%) | 0.0 |
| 20 to 34 years | 0 (0.0%) | 0.0 |
| 35 to 50 years | 0 (0.0%) | 0.0 |
| Total | 0 (0.0%) | 0.0 |
Fertility by Age by Marriage Status in Braddock borough
| Age Bracket | Married | Unmarried |
| 15 to 19 years | 0 (0.0%) | 0 (0.0%) |
| 20 to 34 years | 0 (0.0%) | 0 (0.0%) |
| 35 to 50 years | 0 (0.0%) | 0 (0.0%) |
| Total | 0 (0.0%) | 0 (0.0%) |
Fertility by Education in Braddock borough
| Educational Attainment | Women with Births | Births / 1,000 Women |
| Less than High School | 0 (0.0%) | 0.0 |
| High School Diploma | 0 (0.0%) | 0.0 |
| College or Associate's Degree | 0 (0.0%) | 0.0 |
| Bachelor's Degree | 0 (0.0%) | 0.0 |
| Graduate Degree | 0 (0.0%) | 0.0 |
| Total | 0 (0.0%) | 0.0 |
Fertility by Education by Marriage Status in Braddock borough
| Educational Attainment | Married | Unmarried |
| Less than High School | 0 (0.0%) | 0 (0.0%) |
| High School Diploma | 0 (0.0%) | 0 (0.0%) |
| College or Associate's Degree | 0 (0.0%) | 0 (0.0%) |
| Bachelor's Degree | 0 (0.0%) | 0 (0.0%) |
| Graduate Degree | 0 (0.0%) | 0 (0.0%) |
| Total | 0 (0.0%) | 0 (0.0%) |
Employment Characteristics in Braddock borough
Employment by Class of Employer in Braddock borough
Among the 509 employed individuals in Braddock borough, private company employees (383 | 75.2%), not-for-profit organizations (66 | 13.0%), and self-employed (not incorporated) (26 | 5.1%) make up the most common classes of employment.
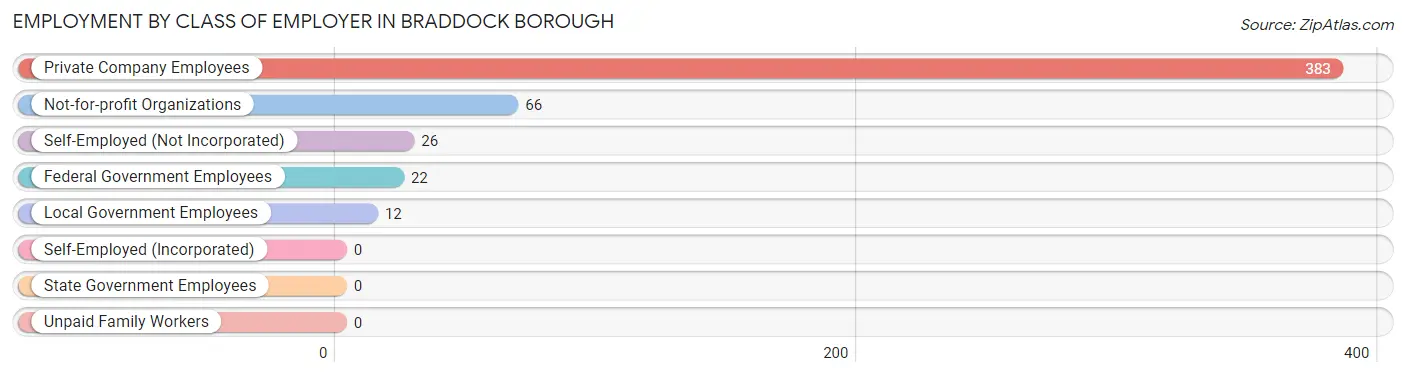
| Employer Class | # Employees | % Employees |
| Private Company Employees | 383 | 75.2% |
| Self-Employed (Incorporated) | 0 | 0.0% |
| Self-Employed (Not Incorporated) | 26 | 5.1% |
| Not-for-profit Organizations | 66 | 13.0% |
| Local Government Employees | 12 | 2.4% |
| State Government Employees | 0 | 0.0% |
| Federal Government Employees | 22 | 4.3% |
| Unpaid Family Workers | 0 | 0.0% |
| Total | 509 | 100.0% |
Employment Status by Age in Braddock borough
According to the labor force statistics for Braddock borough, out of the total population over 16 years of age (1,498), 50.2% or 752 individuals are in the labor force, with 29.4% or 221 of them unemployed. The age group with the highest labor force participation rate is 25 to 29 years, with 96.8% or 213 individuals in the labor force. Within the labor force, the 30 to 34 years age range has the highest percentage of unemployed individuals, with 51.5% or 17 of them being unemployed.
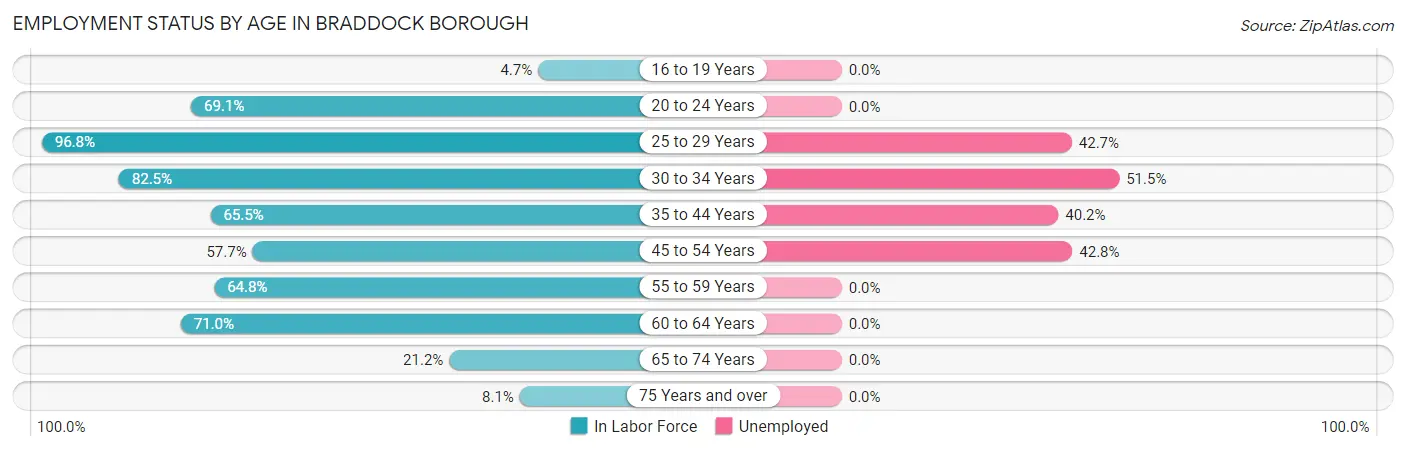
| Age Bracket | In Labor Force | Unemployed |
| 16 to 19 Years | 8 (4.7%) | 0 (0.0%) |
| 20 to 24 Years | 47 (69.1%) | 0 (0.0%) |
| 25 to 29 Years | 213 (96.8%) | 91 (42.7%) |
| 30 to 34 Years | 33 (82.5%) | 17 (51.5%) |
| 35 to 44 Years | 97 (65.5%) | 39 (40.2%) |
| 45 to 54 Years | 173 (57.7%) | 74 (42.8%) |
| 55 to 59 Years | 59 (64.8%) | 0 (0.0%) |
| 60 to 64 Years | 71 (71.0%) | 0 (0.0%) |
| 65 to 74 Years | 35 (21.2%) | 0 (0.0%) |
| 75 Years and over | 16 (8.1%) | 0 (0.0%) |
| Total | 752 (50.2%) | 221 (29.4%) |
Employment Status by Educational Attainment in Braddock borough
According to labor force statistics for Braddock borough, 71.9% of individuals (646) out of the total population between 25 and 64 years of age (899) are in the labor force, with 34.2% or 221 of them being unemployed. The group with the highest labor force participation rate are those with the educational attainment of high school diploma, with 79.5% or 385 individuals in the labor force. Within the labor force, individuals with less than high school education have the highest percentage of unemployment, with 100.0% or 17 of them being unemployed.
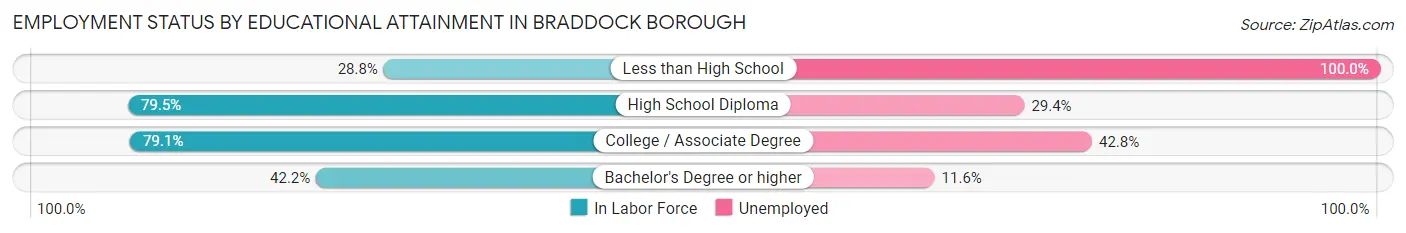
| Educational Attainment | In Labor Force | Unemployed |
| Less than High School | 17 (28.8%) | 59 (100.0%) |
| High School Diploma | 385 (79.5%) | 142 (29.4%) |
| College / Associate Degree | 201 (79.1%) | 109 (42.8%) |
| Bachelor's Degree or higher | 43 (42.2%) | 12 (11.6%) |
| Total | 646 (71.9%) | 307 (34.2%) |
Employment Occupations by Sex in Braddock borough
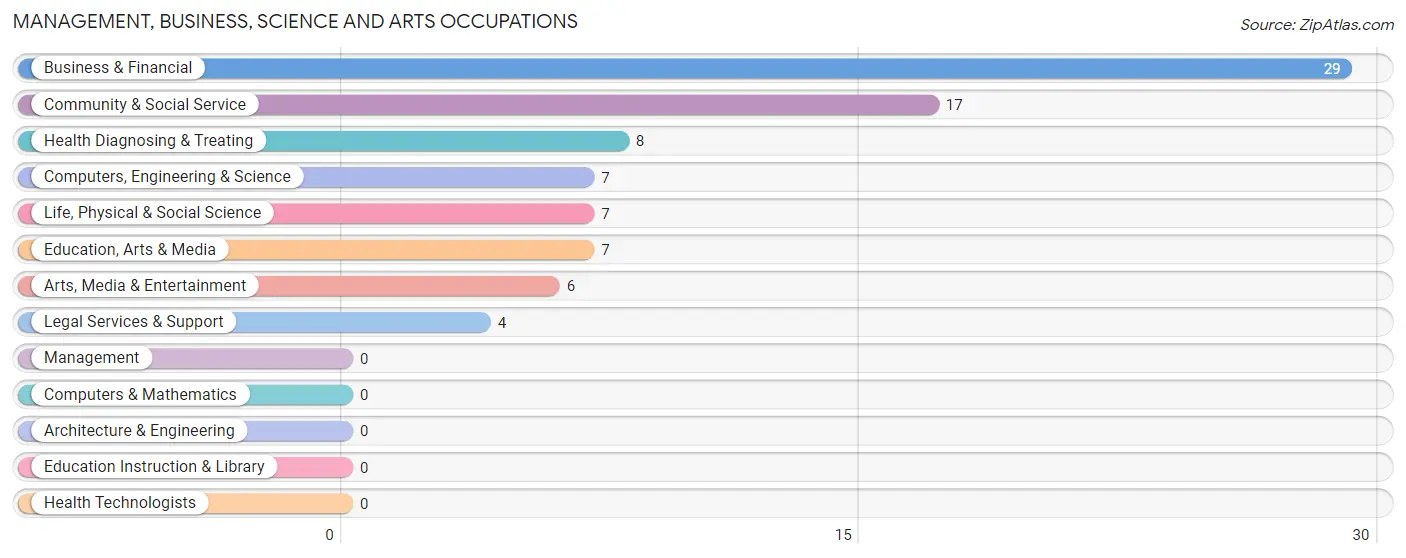
Management, Business, Science and Arts Occupations
The most common Management, Business, Science and Arts occupations in Braddock borough are Business & Financial (29 | 5.5%), Community & Social Service (17 | 3.2%), Health Diagnosing & Treating (8 | 1.5%), Computers, Engineering & Science (7 | 1.3%), and Life, Physical & Social Science (7 | 1.3%).
Management, Business, Science and Arts Occupations by Sex
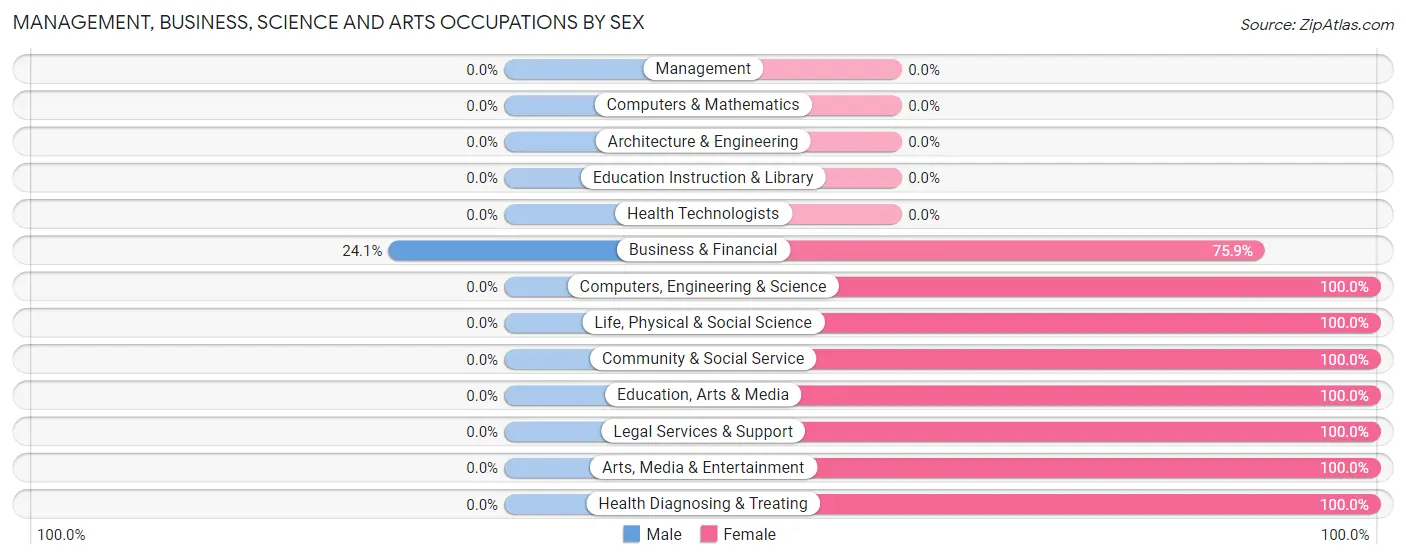
| Occupation | Male | Female |
| Management | 0 (0.0%) | 0 (0.0%) |
| Business & Financial | 7 (24.1%) | 22 (75.9%) |
| Computers, Engineering & Science | 0 (0.0%) | 7 (100.0%) |
| Computers & Mathematics | 0 (0.0%) | 0 (0.0%) |
| Architecture & Engineering | 0 (0.0%) | 0 (0.0%) |
| Life, Physical & Social Science | 0 (0.0%) | 7 (100.0%) |
| Community & Social Service | 0 (0.0%) | 17 (100.0%) |
| Education, Arts & Media | 0 (0.0%) | 7 (100.0%) |
| Legal Services & Support | 0 (0.0%) | 4 (100.0%) |
| Education Instruction & Library | 0 (0.0%) | 0 (0.0%) |
| Arts, Media & Entertainment | 0 (0.0%) | 6 (100.0%) |
| Health Diagnosing & Treating | 0 (0.0%) | 8 (100.0%) |
| Health Technologists | 0 (0.0%) | 0 (0.0%) |
| Total (Category) | 7 (11.5%) | 54 (88.5%) |
| Total (Overall) | 257 (48.4%) | 274 (51.6%) |
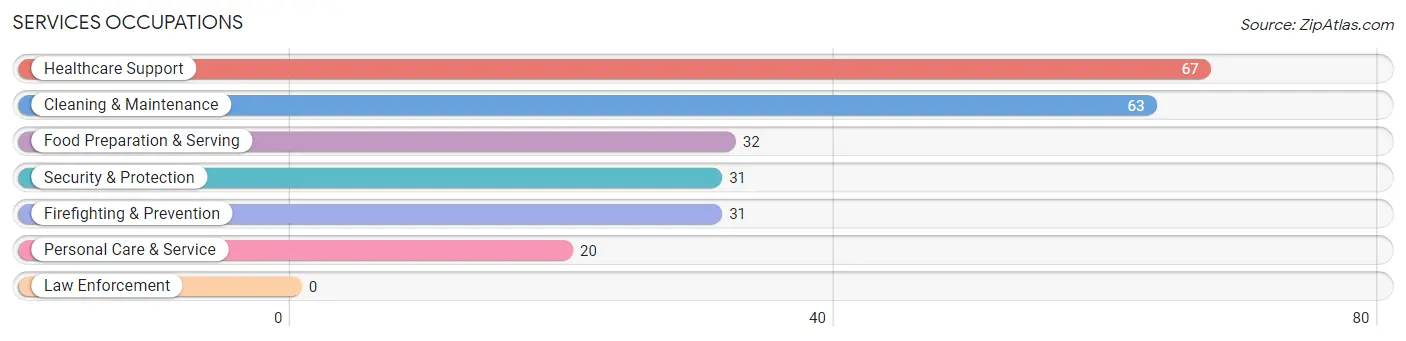
Services Occupations
The most common Services occupations in Braddock borough are Healthcare Support (67 | 12.6%), Cleaning & Maintenance (63 | 11.9%), Food Preparation & Serving (32 | 6.0%), Security & Protection (31 | 5.8%), and Firefighting & Prevention (31 | 5.8%).
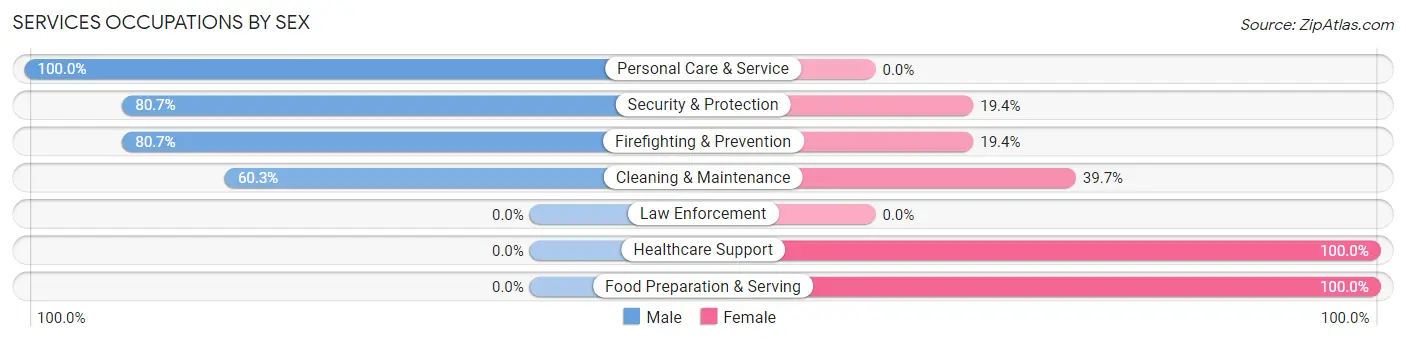
Services Occupations by Sex
Within the Services occupations in Braddock borough, the most male-oriented occupations are Personal Care & Service (100.0%), Security & Protection (80.6%), and Firefighting & Prevention (80.6%), while the most female-oriented occupations are Healthcare Support (100.0%), Food Preparation & Serving (100.0%), and Cleaning & Maintenance (39.7%).
| Occupation | Male | Female |
| Healthcare Support | 0 (0.0%) | 67 (100.0%) |
| Security & Protection | 25 (80.6%) | 6 (19.4%) |
| Firefighting & Prevention | 25 (80.6%) | 6 (19.4%) |
| Law Enforcement | 0 (0.0%) | 0 (0.0%) |
| Food Preparation & Serving | 0 (0.0%) | 32 (100.0%) |
| Cleaning & Maintenance | 38 (60.3%) | 25 (39.7%) |
| Personal Care & Service | 20 (100.0%) | 0 (0.0%) |
| Total (Category) | 83 (39.0%) | 130 (61.0%) |
| Total (Overall) | 257 (48.4%) | 274 (51.6%) |
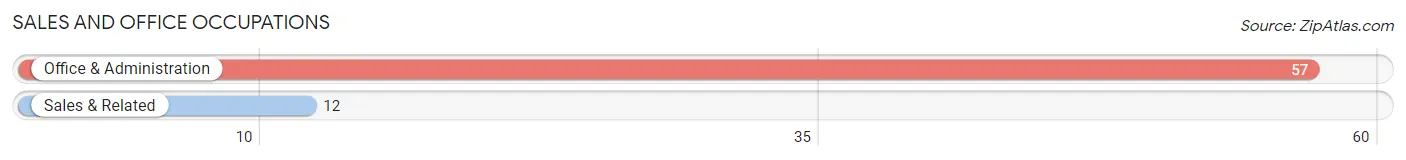
Sales and Office Occupations
The most common Sales and Office occupations in Braddock borough are Office & Administration (57 | 10.7%), and Sales & Related (12 | 2.3%).
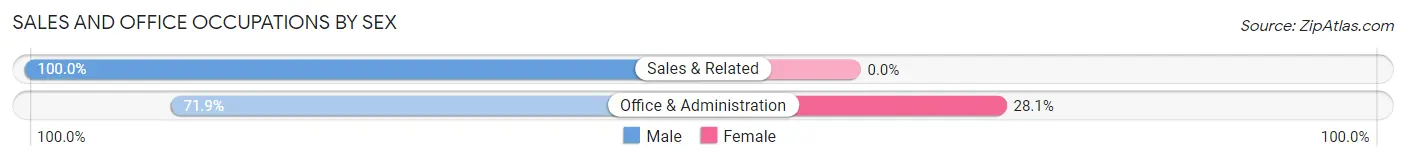
Sales and Office Occupations by Sex
| Occupation | Male | Female |
| Sales & Related | 12 (100.0%) | 0 (0.0%) |
| Office & Administration | 41 (71.9%) | 16 (28.1%) |
| Total (Category) | 53 (76.8%) | 16 (23.2%) |
| Total (Overall) | 257 (48.4%) | 274 (51.6%) |
Natural Resources, Construction and Maintenance Occupations
The most common Natural Resources, Construction and Maintenance occupations in Braddock borough are , and Construction & Extraction (16 | 3.0%).
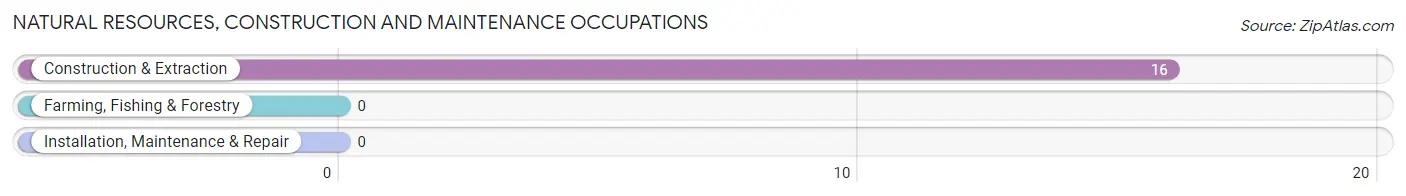
Natural Resources, Construction and Maintenance Occupations by Sex
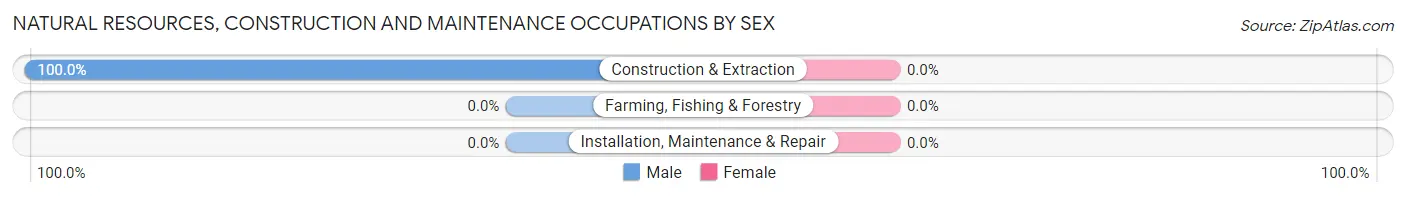
| Occupation | Male | Female |
| Farming, Fishing & Forestry | 0 (0.0%) | 0 (0.0%) |
| Construction & Extraction | 16 (100.0%) | 0 (0.0%) |
| Installation, Maintenance & Repair | 0 (0.0%) | 0 (0.0%) |
| Total (Category) | 16 (100.0%) | 0 (0.0%) |
| Total (Overall) | 257 (48.4%) | 274 (51.6%) |
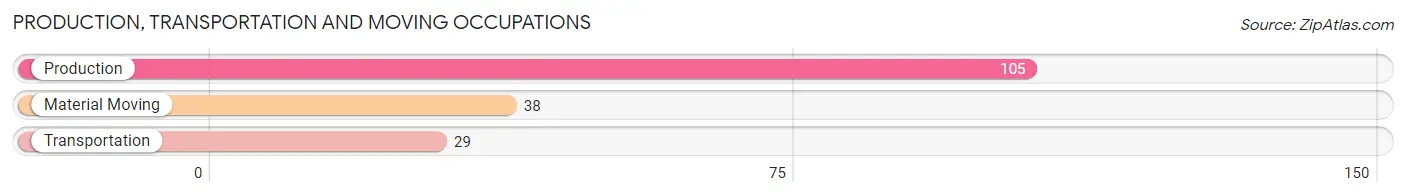
Production, Transportation and Moving Occupations
The most common Production, Transportation and Moving occupations in Braddock borough are Production (105 | 19.8%), Material Moving (38 | 7.2%), and Transportation (29 | 5.5%).
Production, Transportation and Moving Occupations by Sex
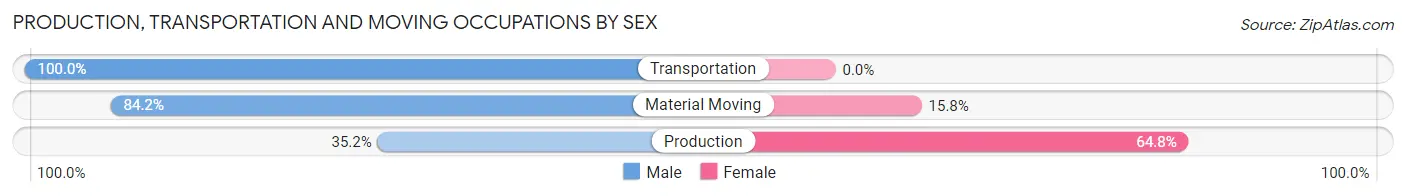
| Occupation | Male | Female |
| Production | 37 (35.2%) | 68 (64.8%) |
| Transportation | 29 (100.0%) | 0 (0.0%) |
| Material Moving | 32 (84.2%) | 6 (15.8%) |
| Total (Category) | 98 (57.0%) | 74 (43.0%) |
| Total (Overall) | 257 (48.4%) | 274 (51.6%) |
Employment Industries by Sex in Braddock borough
Employment Industries in Braddock borough
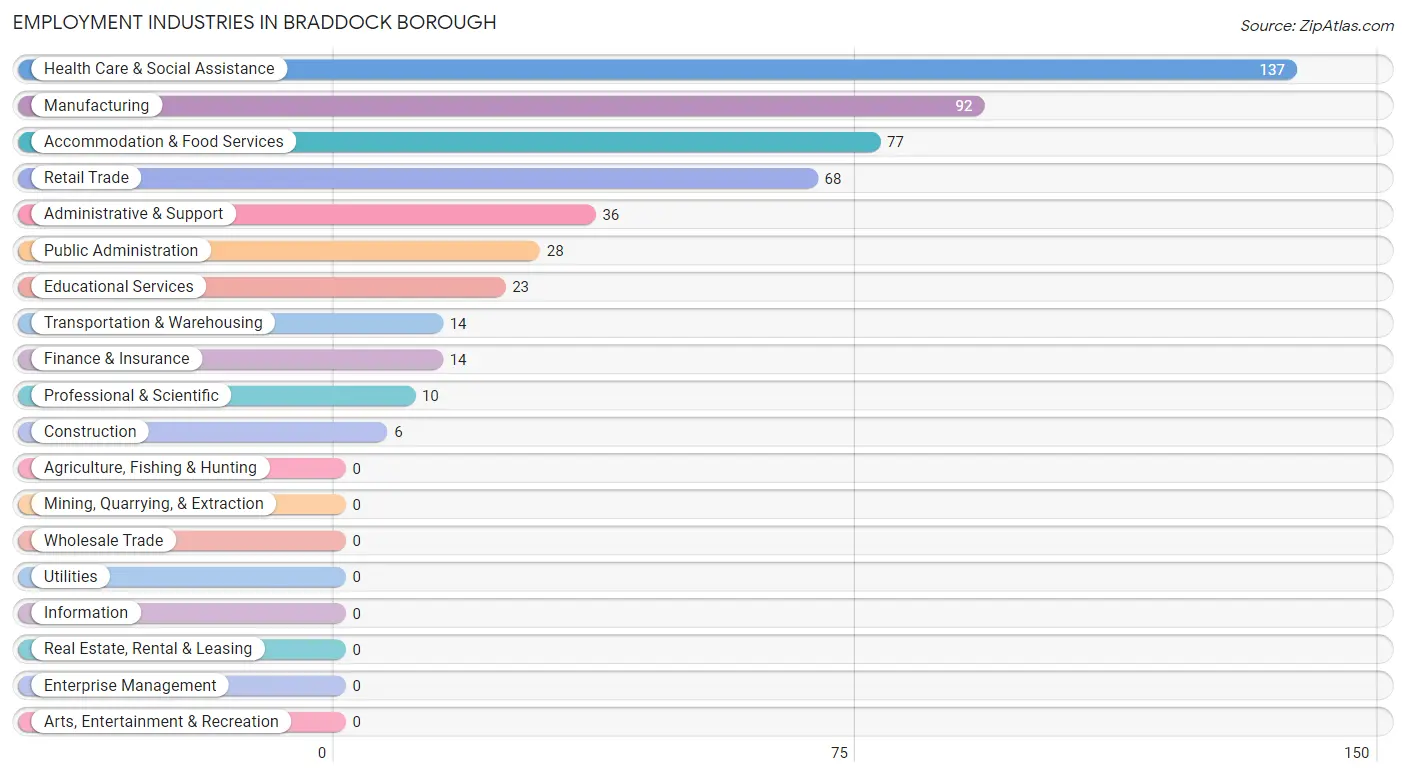
The major employment industries in Braddock borough include Health Care & Social Assistance (137 | 25.8%), Manufacturing (92 | 17.3%), Accommodation & Food Services (77 | 14.5%), Retail Trade (68 | 12.8%), and Administrative & Support (36 | 6.8%).
Employment Industries by Sex in Braddock borough
The Braddock borough industries that see more men than women are Construction (100.0%), Transportation & Warehousing (100.0%), and Retail Trade (91.2%), whereas the industries that tend to have a higher number of women are Educational Services (100.0%), Public Administration (100.0%), and Manufacturing (73.9%).
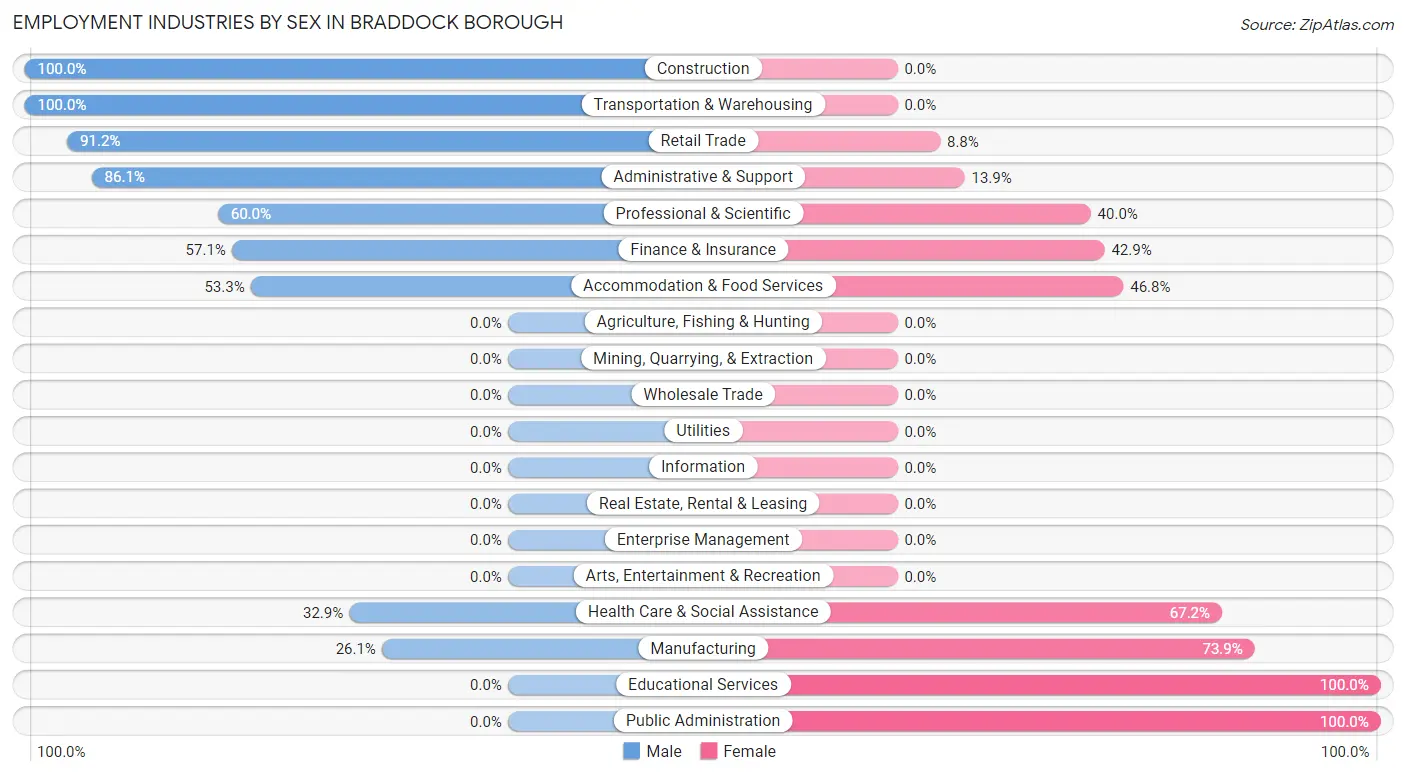
| Industry | Male | Female |
| Agriculture, Fishing & Hunting | 0 (0.0%) | 0 (0.0%) |
| Mining, Quarrying, & Extraction | 0 (0.0%) | 0 (0.0%) |
| Construction | 6 (100.0%) | 0 (0.0%) |
| Manufacturing | 24 (26.1%) | 68 (73.9%) |
| Wholesale Trade | 0 (0.0%) | 0 (0.0%) |
| Retail Trade | 62 (91.2%) | 6 (8.8%) |
| Transportation & Warehousing | 14 (100.0%) | 0 (0.0%) |
| Utilities | 0 (0.0%) | 0 (0.0%) |
| Information | 0 (0.0%) | 0 (0.0%) |
| Finance & Insurance | 8 (57.1%) | 6 (42.9%) |
| Real Estate, Rental & Leasing | 0 (0.0%) | 0 (0.0%) |
| Professional & Scientific | 6 (60.0%) | 4 (40.0%) |
| Enterprise Management | 0 (0.0%) | 0 (0.0%) |
| Administrative & Support | 31 (86.1%) | 5 (13.9%) |
| Educational Services | 0 (0.0%) | 23 (100.0%) |
| Health Care & Social Assistance | 45 (32.9%) | 92 (67.1%) |
| Arts, Entertainment & Recreation | 0 (0.0%) | 0 (0.0%) |
| Accommodation & Food Services | 41 (53.2%) | 36 (46.8%) |
| Public Administration | 0 (0.0%) | 28 (100.0%) |
| Total | 257 (48.4%) | 274 (51.6%) |
Education in Braddock borough
School Enrollment in Braddock borough
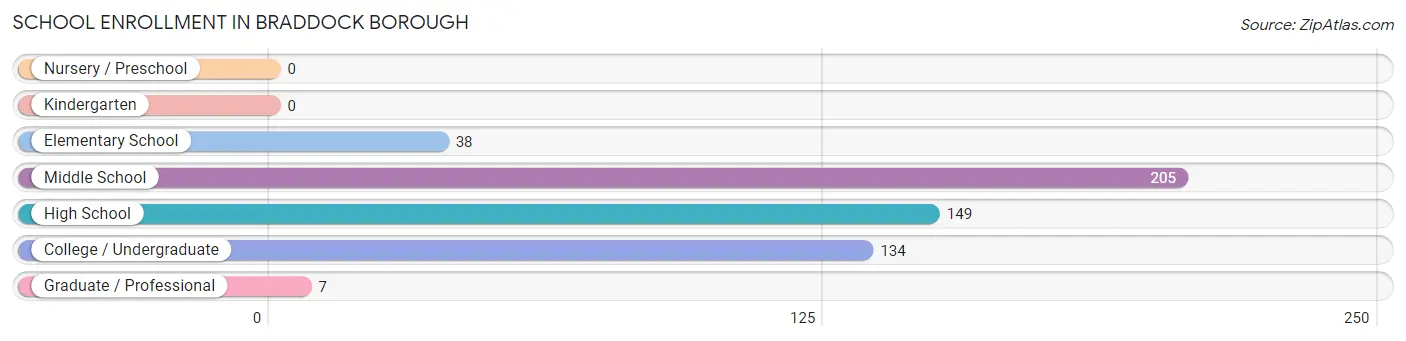
The most common levels of schooling among the 533 students in Braddock borough are middle school (205 | 38.5%), high school (149 | 28.0%), and college / undergraduate (134 | 25.1%).
| School Level | # Students | % Students |
| Nursery / Preschool | 0 | 0.0% |
| Kindergarten | 0 | 0.0% |
| Elementary School | 38 | 7.1% |
| Middle School | 205 | 38.5% |
| High School | 149 | 28.0% |
| College / Undergraduate | 134 | 25.1% |
| Graduate / Professional | 7 | 1.3% |
| Total | 533 | 100.0% |
School Enrollment by Age by Funding Source in Braddock borough
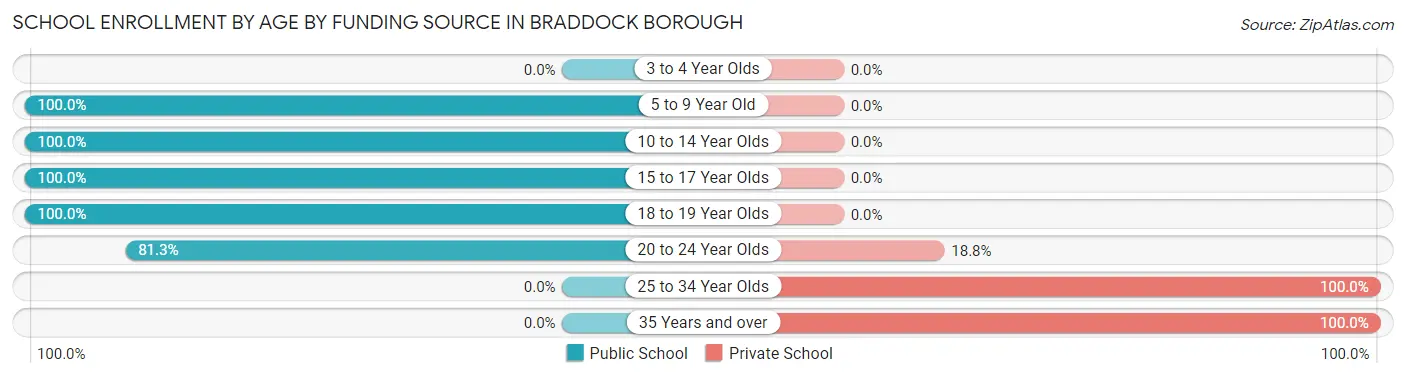
Out of a total of 533 students who are enrolled in schools in Braddock borough, 107 (20.1%) attend a private institution, while the remaining 426 (79.9%) are enrolled in public schools. The age group of 25 to 34 year olds has the highest likelihood of being enrolled in private schools, with 93 (100.0% in the age bracket) enrolled. Conversely, the age group of 5 to 9 year old has the lowest likelihood of being enrolled in a private school, with 38 (100.0% in the age bracket) attending a public institution.
| Age Bracket | Public School | Private School |
| 3 to 4 Year Olds | 0 (0.0%) | 0 (0.0%) |
| 5 to 9 Year Old | 38 (100.0%) | 0 (0.0%) |
| 10 to 14 Year Olds | 205 (100.0%) | 0 (0.0%) |
| 15 to 17 Year Olds | 149 (100.0%) | 0 (0.0%) |
| 18 to 19 Year Olds | 8 (100.0%) | 0 (0.0%) |
| 20 to 24 Year Olds | 26 (81.2%) | 6 (18.8%) |
| 25 to 34 Year Olds | 0 (0.0%) | 93 (100.0%) |
| 35 Years and over | 0 (0.0%) | 8 (100.0%) |
| Total | 426 (79.9%) | 107 (20.1%) |
Educational Attainment by Field of Study in Braddock borough
Business (66 | 41.2%), psychology (31 | 19.4%), education (24 | 15.0%), arts & humanities (18 | 11.3%), and visual & performing arts (11 | 6.9%) are the most common fields of study among 160 individuals in Braddock borough who have obtained a bachelor's degree or higher.
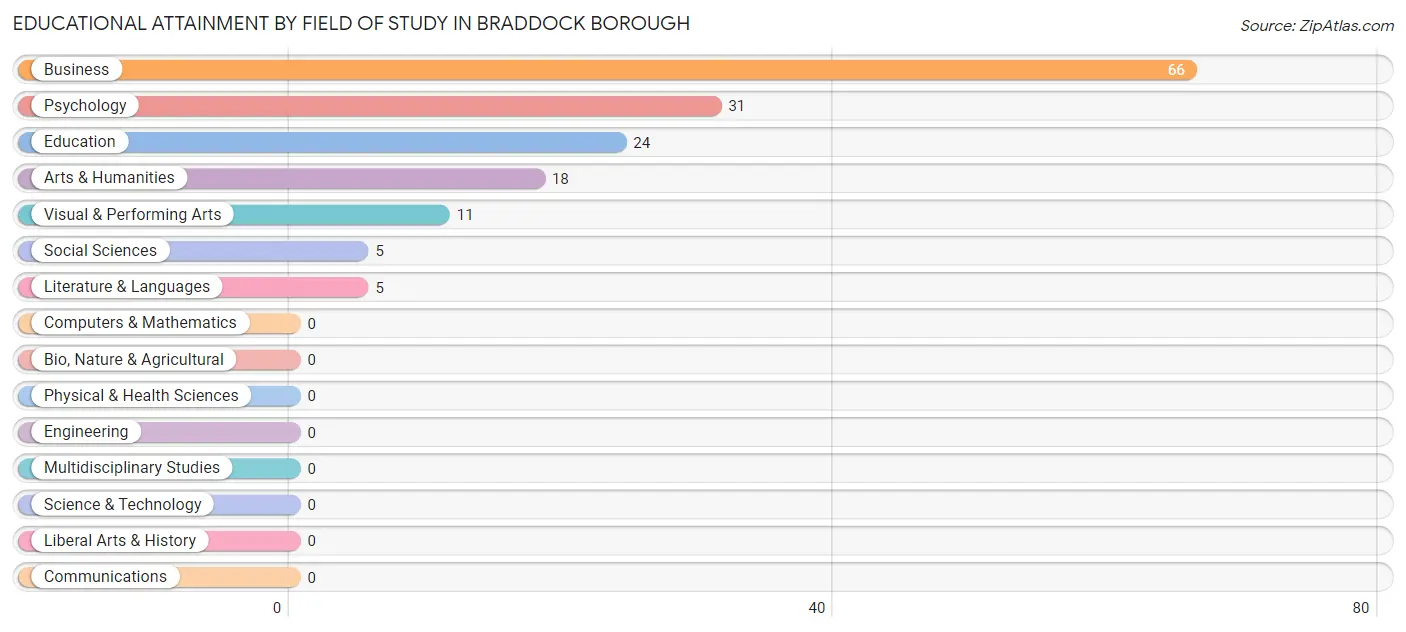
| Field of Study | # Graduates | % Graduates |
| Computers & Mathematics | 0 | 0.0% |
| Bio, Nature & Agricultural | 0 | 0.0% |
| Physical & Health Sciences | 0 | 0.0% |
| Psychology | 31 | 19.4% |
| Social Sciences | 5 | 3.1% |
| Engineering | 0 | 0.0% |
| Multidisciplinary Studies | 0 | 0.0% |
| Science & Technology | 0 | 0.0% |
| Business | 66 | 41.2% |
| Education | 24 | 15.0% |
| Literature & Languages | 5 | 3.1% |
| Liberal Arts & History | 0 | 0.0% |
| Visual & Performing Arts | 11 | 6.9% |
| Communications | 0 | 0.0% |
| Arts & Humanities | 18 | 11.3% |
| Total | 160 | 100.0% |
Transportation & Commute in Braddock borough
Vehicle Availability by Sex in Braddock borough
The most prevalent vehicle ownership categories in Braddock borough are males with 1 vehicle (100, accounting for 39.8%) and females with 1 vehicle (122, making up 38.8%).
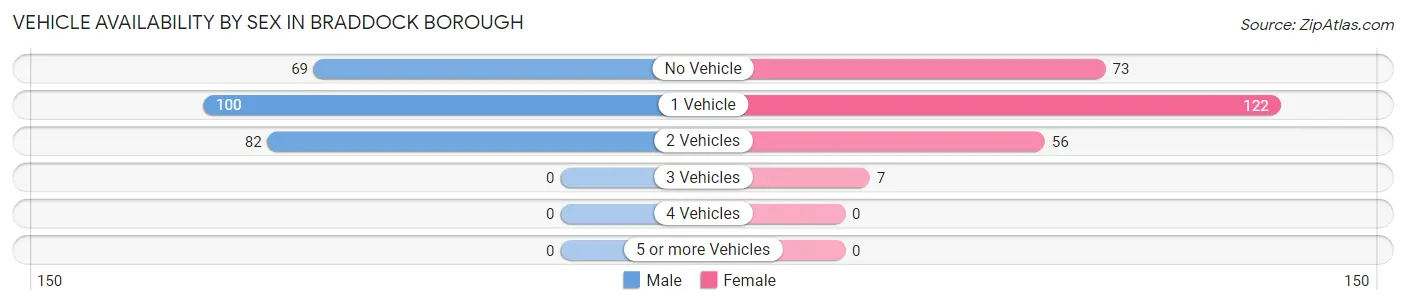
| Vehicles Available | Male | Female |
| No Vehicle | 69 (27.5%) | 73 (28.3%) |
| 1 Vehicle | 100 (39.8%) | 122 (47.3%) |
| 2 Vehicles | 82 (32.7%) | 56 (21.7%) |
| 3 Vehicles | 0 (0.0%) | 7 (2.7%) |
| 4 Vehicles | 0 (0.0%) | 0 (0.0%) |
| 5 or more Vehicles | 0 (0.0%) | 0 (0.0%) |
| Total | 251 (100.0%) | 258 (100.0%) |
Commute Time in Braddock borough
The most frequently occuring commute durations in Braddock borough are 15 to 19 minutes (146 commuters, 29.9%), 30 to 34 minutes (114 commuters, 23.3%), and 10 to 14 minutes (37 commuters, 7.6%).
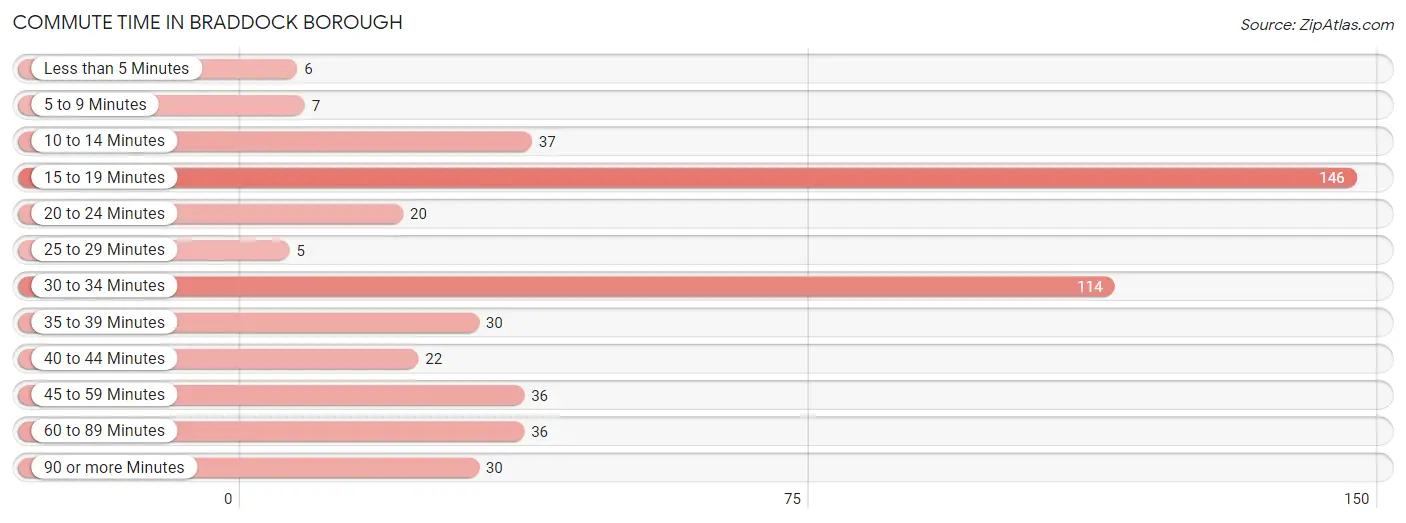
| Commute Time | # Commuters | % Commuters |
| Less than 5 Minutes | 6 | 1.2% |
| 5 to 9 Minutes | 7 | 1.4% |
| 10 to 14 Minutes | 37 | 7.6% |
| 15 to 19 Minutes | 146 | 29.9% |
| 20 to 24 Minutes | 20 | 4.1% |
| 25 to 29 Minutes | 5 | 1.0% |
| 30 to 34 Minutes | 114 | 23.3% |
| 35 to 39 Minutes | 30 | 6.1% |
| 40 to 44 Minutes | 22 | 4.5% |
| 45 to 59 Minutes | 36 | 7.4% |
| 60 to 89 Minutes | 36 | 7.4% |
| 90 or more Minutes | 30 | 6.1% |
Commute Time by Sex in Braddock borough
The most common commute times in Braddock borough are 15 to 19 minutes (59 commuters, 25.5%) for males and 15 to 19 minutes (87 commuters, 33.7%) for females.
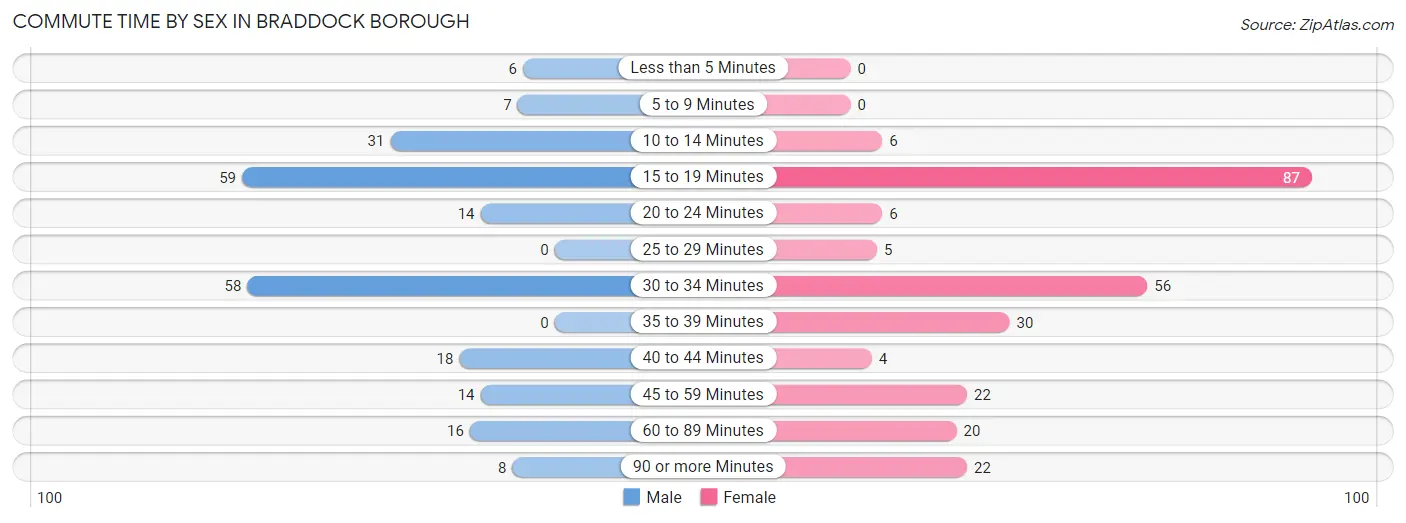
| Commute Time | Male | Female |
| Less than 5 Minutes | 6 (2.6%) | 0 (0.0%) |
| 5 to 9 Minutes | 7 (3.0%) | 0 (0.0%) |
| 10 to 14 Minutes | 31 (13.4%) | 6 (2.3%) |
| 15 to 19 Minutes | 59 (25.5%) | 87 (33.7%) |
| 20 to 24 Minutes | 14 (6.1%) | 6 (2.3%) |
| 25 to 29 Minutes | 0 (0.0%) | 5 (1.9%) |
| 30 to 34 Minutes | 58 (25.1%) | 56 (21.7%) |
| 35 to 39 Minutes | 0 (0.0%) | 30 (11.6%) |
| 40 to 44 Minutes | 18 (7.8%) | 4 (1.5%) |
| 45 to 59 Minutes | 14 (6.1%) | 22 (8.5%) |
| 60 to 89 Minutes | 16 (6.9%) | 20 (7.7%) |
| 90 or more Minutes | 8 (3.5%) | 22 (8.5%) |
Time of Departure to Work by Sex in Braddock borough
The most frequent times of departure to work in Braddock borough are 6:00 AM to 6:29 AM (72, 31.2%) for males and 7:30 AM to 7:59 AM (105, 40.7%) for females.
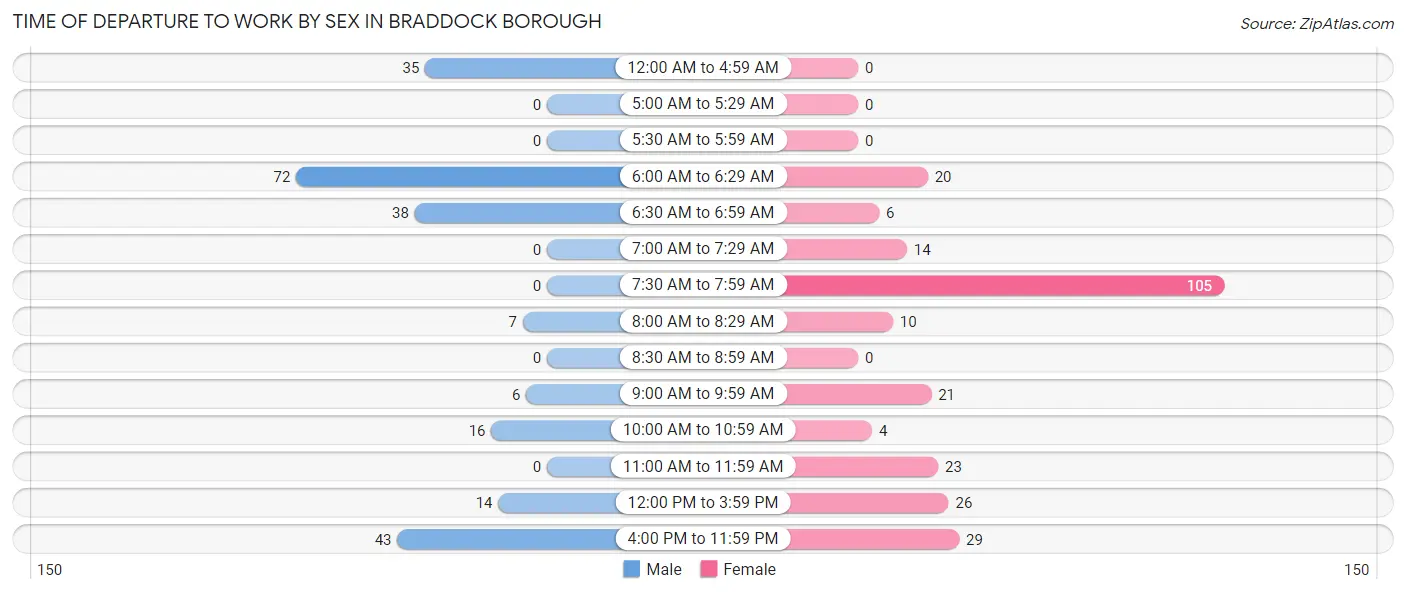
| Time of Departure | Male | Female |
| 12:00 AM to 4:59 AM | 35 (15.1%) | 0 (0.0%) |
| 5:00 AM to 5:29 AM | 0 (0.0%) | 0 (0.0%) |
| 5:30 AM to 5:59 AM | 0 (0.0%) | 0 (0.0%) |
| 6:00 AM to 6:29 AM | 72 (31.2%) | 20 (7.7%) |
| 6:30 AM to 6:59 AM | 38 (16.5%) | 6 (2.3%) |
| 7:00 AM to 7:29 AM | 0 (0.0%) | 14 (5.4%) |
| 7:30 AM to 7:59 AM | 0 (0.0%) | 105 (40.7%) |
| 8:00 AM to 8:29 AM | 7 (3.0%) | 10 (3.9%) |
| 8:30 AM to 8:59 AM | 0 (0.0%) | 0 (0.0%) |
| 9:00 AM to 9:59 AM | 6 (2.6%) | 21 (8.1%) |
| 10:00 AM to 10:59 AM | 16 (6.9%) | 4 (1.5%) |
| 11:00 AM to 11:59 AM | 0 (0.0%) | 23 (8.9%) |
| 12:00 PM to 3:59 PM | 14 (6.1%) | 26 (10.1%) |
| 4:00 PM to 11:59 PM | 43 (18.6%) | 29 (11.2%) |
| Total | 231 (100.0%) | 258 (100.0%) |
Housing Occupancy in Braddock borough
Occupancy by Ownership in Braddock borough
Of the total 732 dwellings in Braddock borough, owner-occupied units account for 271 (37.0%), while renter-occupied units make up 461 (63.0%).
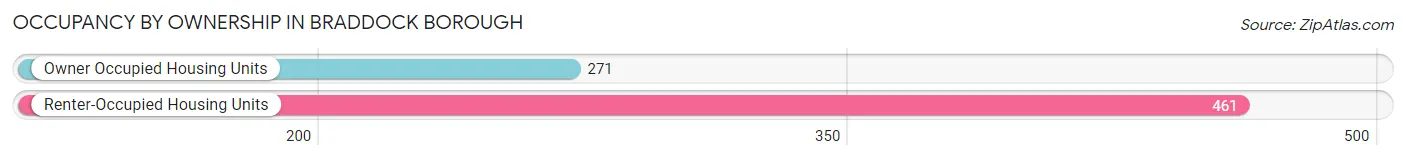
| Occupancy | # Housing Units | % Housing Units |
| Owner Occupied Housing Units | 271 | 37.0% |
| Renter-Occupied Housing Units | 461 | 63.0% |
| Total Occupied Housing Units | 732 | 100.0% |
Occupancy by Household Size in Braddock borough
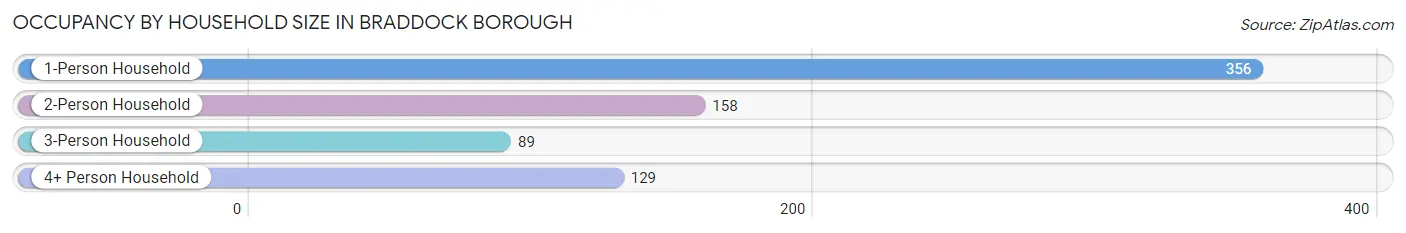
| Household Size | # Housing Units | % Housing Units |
| 1-Person Household | 356 | 48.6% |
| 2-Person Household | 158 | 21.6% |
| 3-Person Household | 89 | 12.2% |
| 4+ Person Household | 129 | 17.6% |
| Total Housing Units | 732 | 100.0% |
Occupancy by Ownership by Household Size in Braddock borough
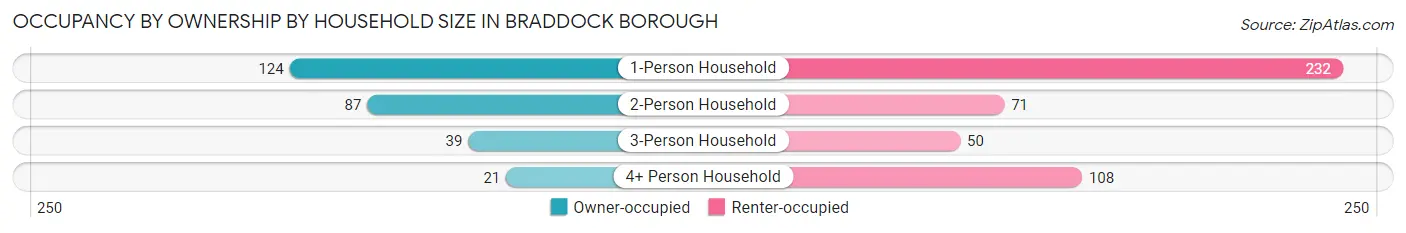
| Household Size | Owner-occupied | Renter-occupied |
| 1-Person Household | 124 (34.8%) | 232 (65.2%) |
| 2-Person Household | 87 (55.1%) | 71 (44.9%) |
| 3-Person Household | 39 (43.8%) | 50 (56.2%) |
| 4+ Person Household | 21 (16.3%) | 108 (83.7%) |
| Total Housing Units | 271 (37.0%) | 461 (63.0%) |
Occupancy by Educational Attainment in Braddock borough
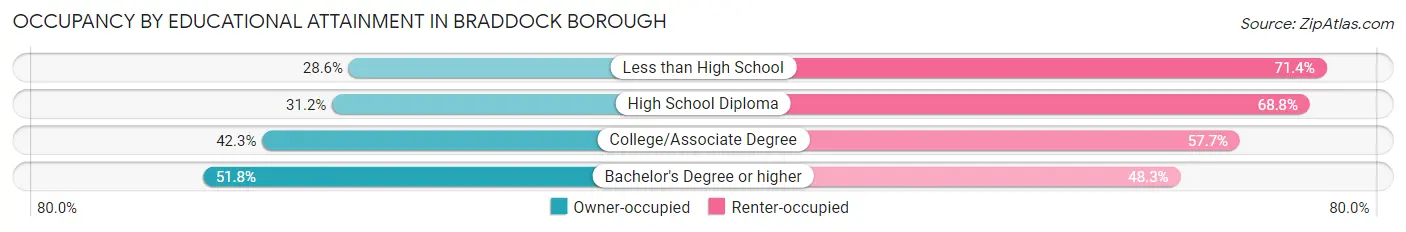
| Household Size | Owner-occupied | Renter-occupied |
| Less than High School | 12 (28.6%) | 30 (71.4%) |
| High School Diploma | 123 (31.2%) | 271 (68.8%) |
| College/Associate Degree | 77 (42.3%) | 105 (57.7%) |
| Bachelor's Degree or higher | 59 (51.7%) | 55 (48.2%) |
Occupancy by Age of Householder in Braddock borough
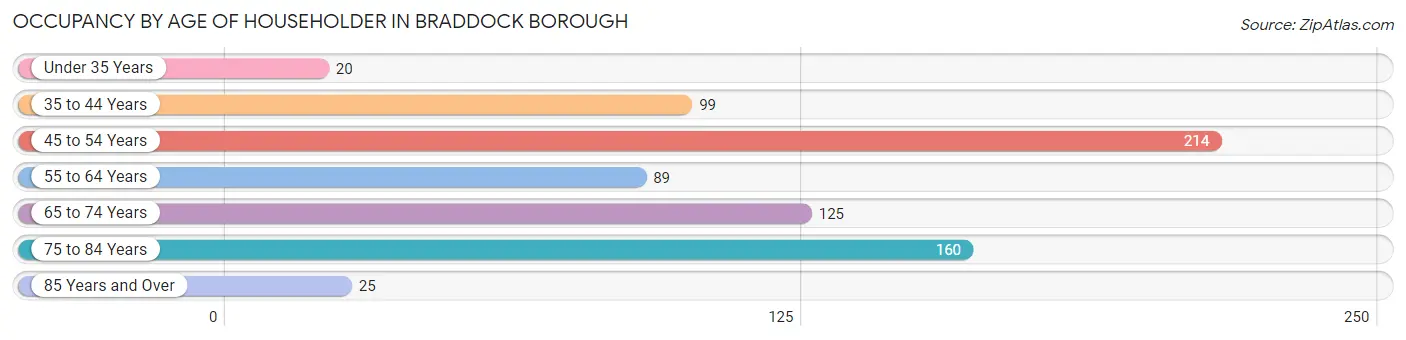
| Age Bracket | # Households | % Households |
| Under 35 Years | 20 | 2.7% |
| 35 to 44 Years | 99 | 13.5% |
| 45 to 54 Years | 214 | 29.2% |
| 55 to 64 Years | 89 | 12.2% |
| 65 to 74 Years | 125 | 17.1% |
| 75 to 84 Years | 160 | 21.9% |
| 85 Years and Over | 25 | 3.4% |
| Total | 732 | 100.0% |
Housing Finances in Braddock borough
Median Income by Occupancy in Braddock borough
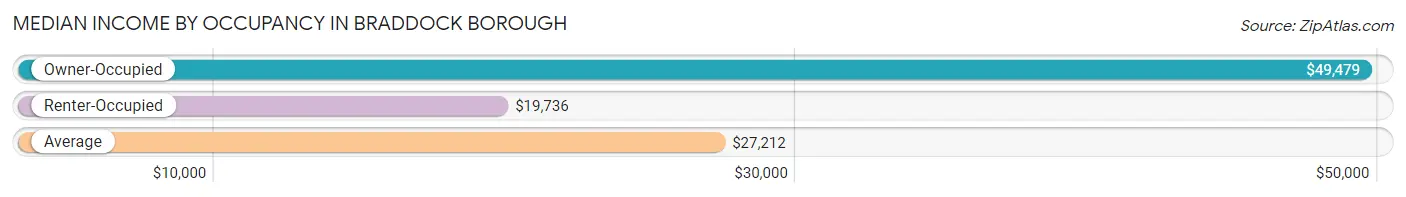
| Occupancy Type | # Households | Median Income |
| Owner-Occupied | 271 (37.0%) | $49,479 |
| Renter-Occupied | 461 (63.0%) | $19,736 |
| Average | 732 (100.0%) | $27,212 |
Occupancy by Householder Income Bracket in Braddock borough
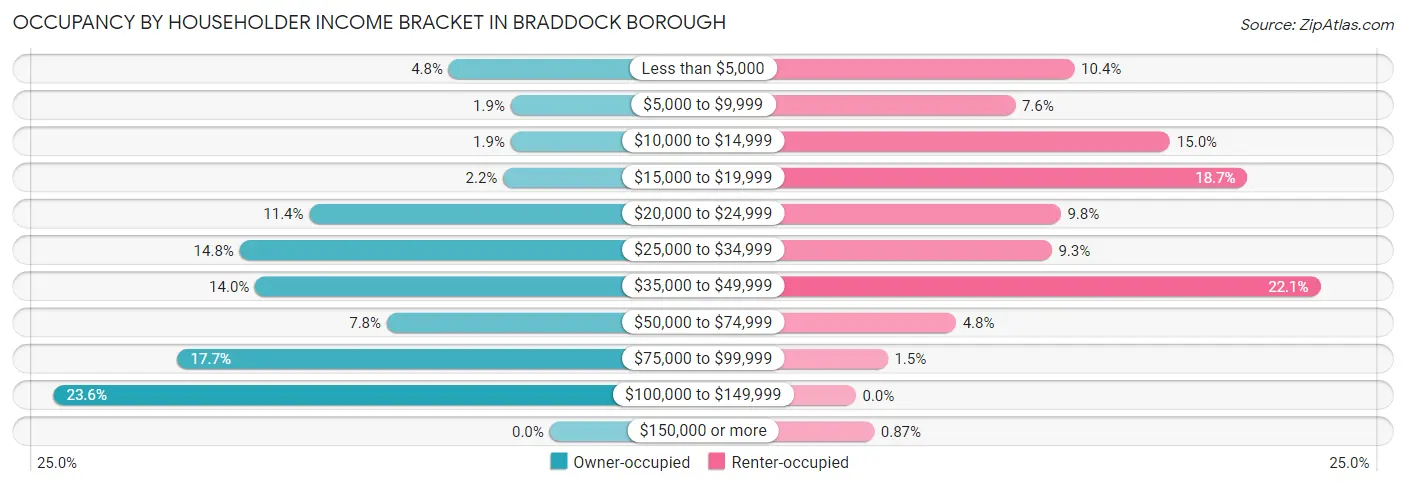
| Income Bracket | Owner-occupied | Renter-occupied |
| Less than $5,000 | 13 (4.8%) | 48 (10.4%) |
| $5,000 to $9,999 | 5 (1.8%) | 35 (7.6%) |
| $10,000 to $14,999 | 5 (1.8%) | 69 (15.0%) |
| $15,000 to $19,999 | 6 (2.2%) | 86 (18.7%) |
| $20,000 to $24,999 | 31 (11.4%) | 45 (9.8%) |
| $25,000 to $34,999 | 40 (14.8%) | 43 (9.3%) |
| $35,000 to $49,999 | 38 (14.0%) | 102 (22.1%) |
| $50,000 to $74,999 | 21 (7.7%) | 22 (4.8%) |
| $75,000 to $99,999 | 48 (17.7%) | 7 (1.5%) |
| $100,000 to $149,999 | 64 (23.6%) | 0 (0.0%) |
| $150,000 or more | 0 (0.0%) | 4 (0.9%) |
| Total | 271 (100.0%) | 461 (100.0%) |
Monthly Housing Cost Tiers in Braddock borough
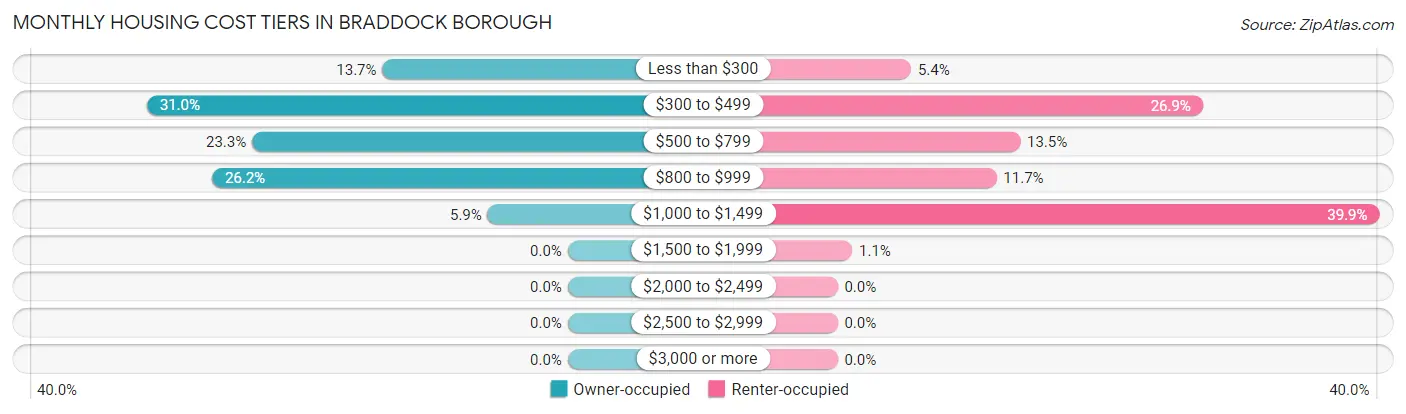
| Monthly Cost | Owner-occupied | Renter-occupied |
| Less than $300 | 37 (13.7%) | 25 (5.4%) |
| $300 to $499 | 84 (31.0%) | 124 (26.9%) |
| $500 to $799 | 63 (23.3%) | 62 (13.5%) |
| $800 to $999 | 71 (26.2%) | 54 (11.7%) |
| $1,000 to $1,499 | 16 (5.9%) | 184 (39.9%) |
| $1,500 to $1,999 | 0 (0.0%) | 5 (1.1%) |
| $2,000 to $2,499 | 0 (0.0%) | 0 (0.0%) |
| $2,500 to $2,999 | 0 (0.0%) | 0 (0.0%) |
| $3,000 or more | 0 (0.0%) | 0 (0.0%) |
| Total | 271 (100.0%) | 461 (100.0%) |
Physical Housing Characteristics in Braddock borough
Housing Structures in Braddock borough
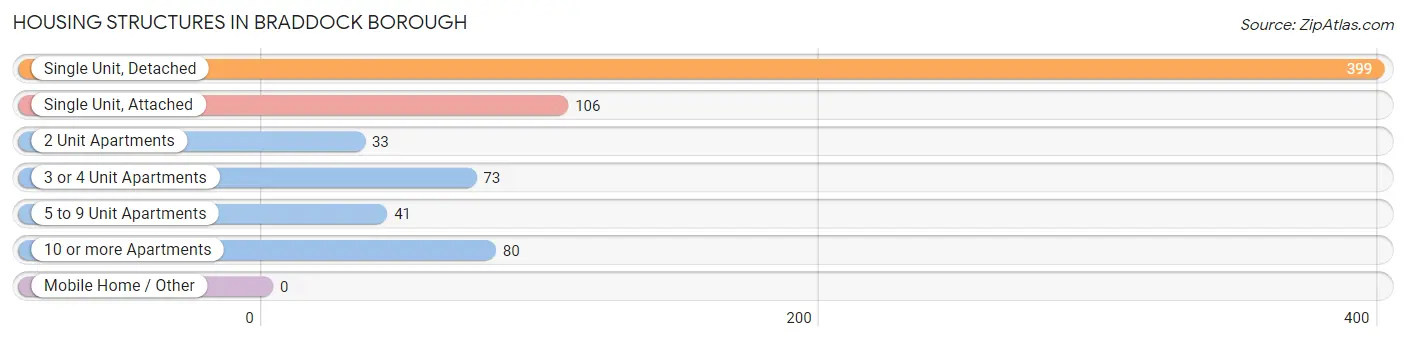
| Structure Type | # Housing Units | % Housing Units |
| Single Unit, Detached | 399 | 54.5% |
| Single Unit, Attached | 106 | 14.5% |
| 2 Unit Apartments | 33 | 4.5% |
| 3 or 4 Unit Apartments | 73 | 10.0% |
| 5 to 9 Unit Apartments | 41 | 5.6% |
| 10 or more Apartments | 80 | 10.9% |
| Mobile Home / Other | 0 | 0.0% |
| Total | 732 | 100.0% |
Housing Structures by Occupancy in Braddock borough
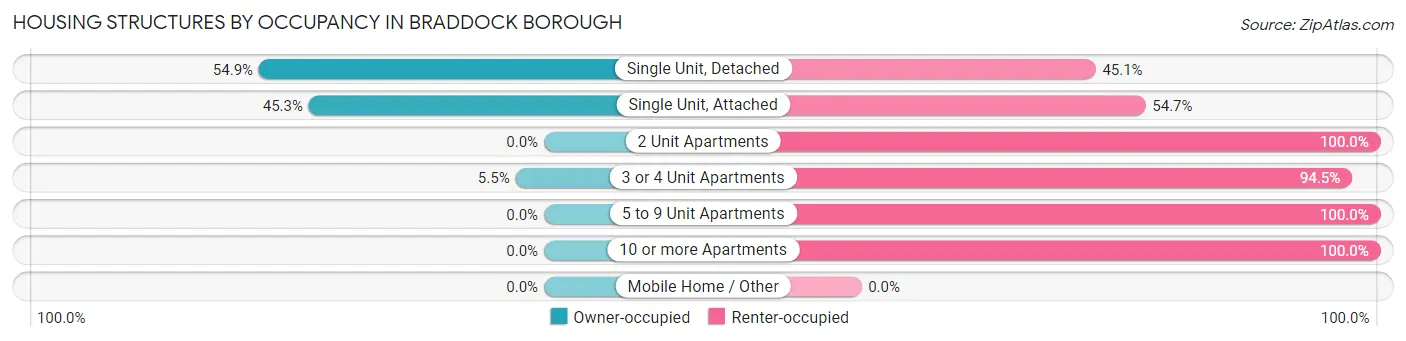
| Structure Type | Owner-occupied | Renter-occupied |
| Single Unit, Detached | 219 (54.9%) | 180 (45.1%) |
| Single Unit, Attached | 48 (45.3%) | 58 (54.7%) |
| 2 Unit Apartments | 0 (0.0%) | 33 (100.0%) |
| 3 or 4 Unit Apartments | 4 (5.5%) | 69 (94.5%) |
| 5 to 9 Unit Apartments | 0 (0.0%) | 41 (100.0%) |
| 10 or more Apartments | 0 (0.0%) | 80 (100.0%) |
| Mobile Home / Other | 0 (0.0%) | 0 (0.0%) |
| Total | 271 (37.0%) | 461 (63.0%) |
Housing Structures by Number of Rooms in Braddock borough
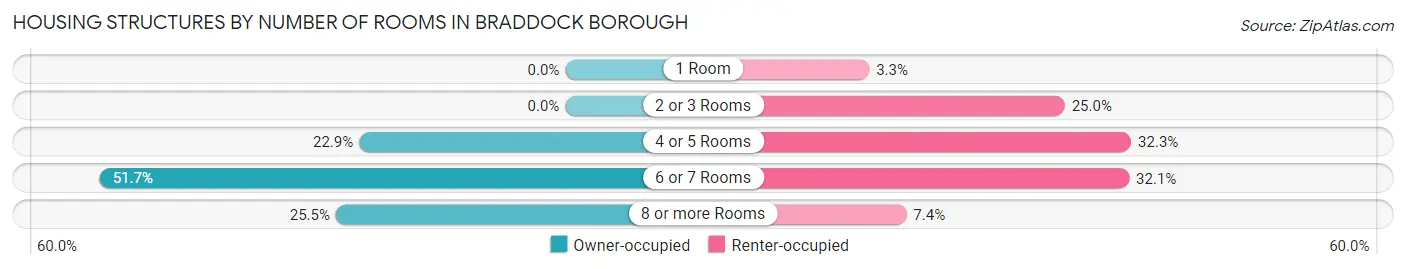
| Number of Rooms | Owner-occupied | Renter-occupied |
| 1 Room | 0 (0.0%) | 15 (3.3%) |
| 2 or 3 Rooms | 0 (0.0%) | 115 (24.9%) |
| 4 or 5 Rooms | 62 (22.9%) | 149 (32.3%) |
| 6 or 7 Rooms | 140 (51.7%) | 148 (32.1%) |
| 8 or more Rooms | 69 (25.5%) | 34 (7.4%) |
| Total | 271 (100.0%) | 461 (100.0%) |
Housing Structure by Heating Type in Braddock borough
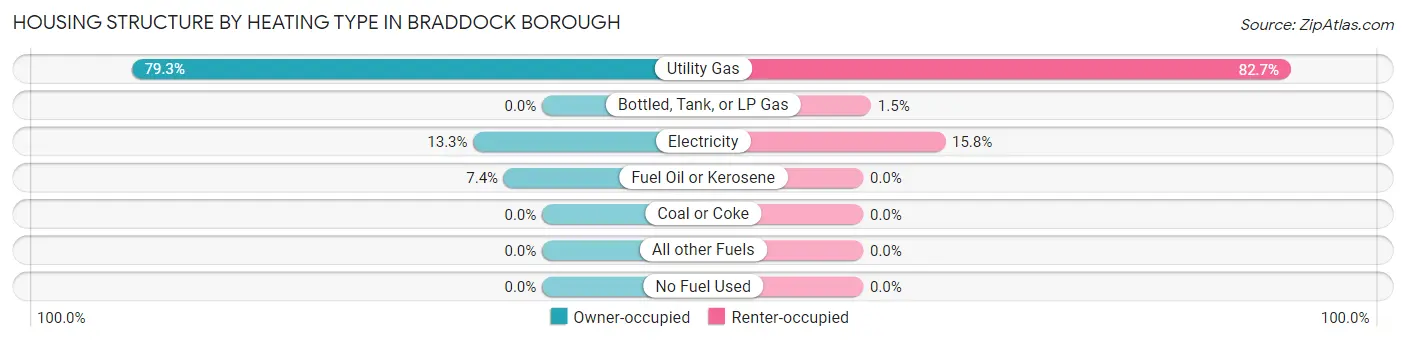
| Heating Type | Owner-occupied | Renter-occupied |
| Utility Gas | 215 (79.3%) | 381 (82.7%) |
| Bottled, Tank, or LP Gas | 0 (0.0%) | 7 (1.5%) |
| Electricity | 36 (13.3%) | 73 (15.8%) |
| Fuel Oil or Kerosene | 20 (7.4%) | 0 (0.0%) |
| Coal or Coke | 0 (0.0%) | 0 (0.0%) |
| All other Fuels | 0 (0.0%) | 0 (0.0%) |
| No Fuel Used | 0 (0.0%) | 0 (0.0%) |
| Total | 271 (100.0%) | 461 (100.0%) |
Household Vehicle Usage in Braddock borough
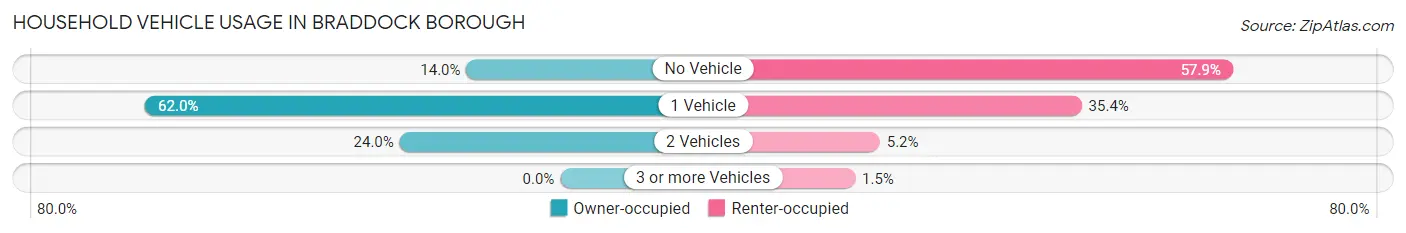
| Vehicles per Household | Owner-occupied | Renter-occupied |
| No Vehicle | 38 (14.0%) | 267 (57.9%) |
| 1 Vehicle | 168 (62.0%) | 163 (35.4%) |
| 2 Vehicles | 65 (24.0%) | 24 (5.2%) |
| 3 or more Vehicles | 0 (0.0%) | 7 (1.5%) |
| Total | 271 (100.0%) | 461 (100.0%) |
Real Estate & Mortgages in Braddock borough
Real Estate and Mortgage Overview in Braddock borough
| Characteristic | Without Mortgage | With Mortgage |
| Housing Units | 171 | 100 |
| Median Property Value | $33,800 | $83,700 |
| Median Household Income | $38,917 | $0 |
| Monthly Housing Costs | $441 | $0 |
| Real Estate Taxes | $619 | $0 |
Property Value by Mortgage Status in Braddock borough
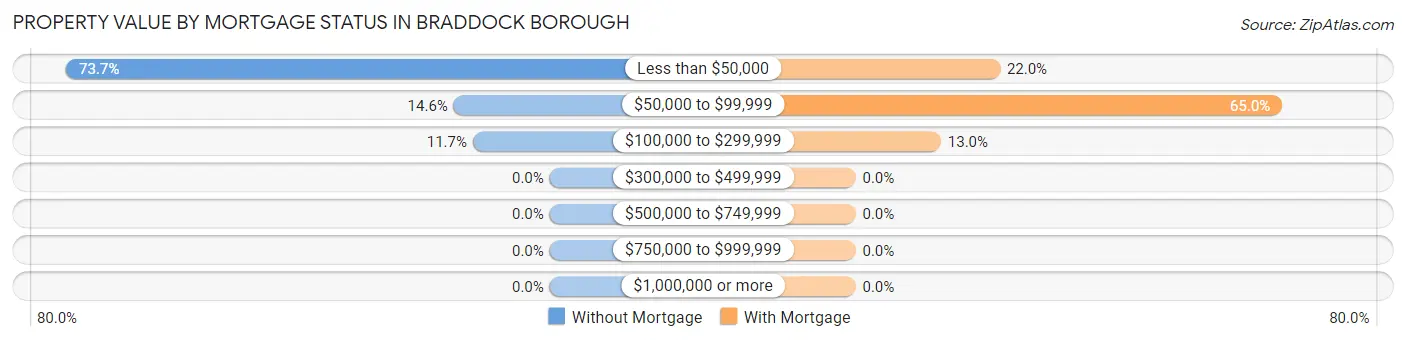
| Property Value | Without Mortgage | With Mortgage |
| Less than $50,000 | 126 (73.7%) | 22 (22.0%) |
| $50,000 to $99,999 | 25 (14.6%) | 65 (65.0%) |
| $100,000 to $299,999 | 20 (11.7%) | 13 (13.0%) |
| $300,000 to $499,999 | 0 (0.0%) | 0 (0.0%) |
| $500,000 to $749,999 | 0 (0.0%) | 0 (0.0%) |
| $750,000 to $999,999 | 0 (0.0%) | 0 (0.0%) |
| $1,000,000 or more | 0 (0.0%) | 0 (0.0%) |
| Total | 171 (100.0%) | 100 (100.0%) |
Household Income by Mortgage Status in Braddock borough
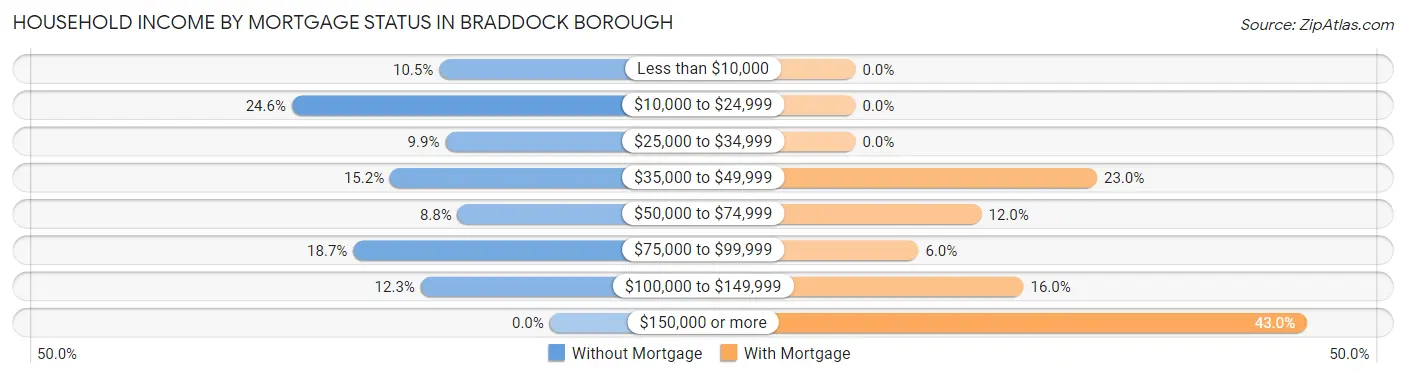
| Household Income | Without Mortgage | With Mortgage |
| Less than $10,000 | 18 (10.5%) | 0 (0.0%) |
| $10,000 to $24,999 | 42 (24.6%) | 0 (0.0%) |
| $25,000 to $34,999 | 17 (9.9%) | 0 (0.0%) |
| $35,000 to $49,999 | 26 (15.2%) | 23 (23.0%) |
| $50,000 to $74,999 | 15 (8.8%) | 12 (12.0%) |
| $75,000 to $99,999 | 32 (18.7%) | 6 (6.0%) |
| $100,000 to $149,999 | 21 (12.3%) | 16 (16.0%) |
| $150,000 or more | 0 (0.0%) | 43 (43.0%) |
| Total | 171 (100.0%) | 100 (100.0%) |
Property Value to Household Income Ratio in Braddock borough
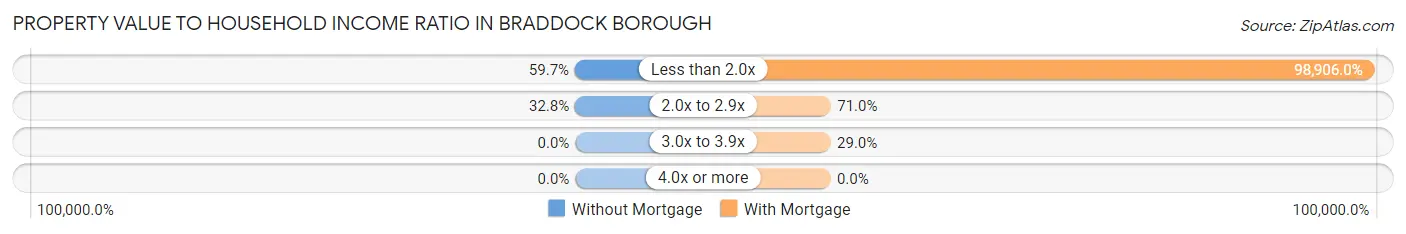
| Value-to-Income Ratio | Without Mortgage | With Mortgage |
| Less than 2.0x | 102 (59.7%) | 98,906 (98,906.0%) |
| 2.0x to 2.9x | 56 (32.8%) | 71 (71.0%) |
| 3.0x to 3.9x | 0 (0.0%) | 29 (29.0%) |
| 4.0x or more | 0 (0.0%) | 0 (0.0%) |
| Total | 171 (100.0%) | 100 (100.0%) |
Real Estate Taxes by Mortgage Status in Braddock borough
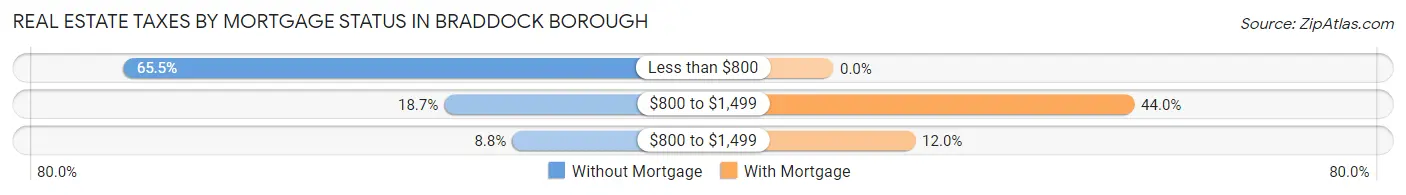
| Property Taxes | Without Mortgage | With Mortgage |
| Less than $800 | 112 (65.5%) | 0 (0.0%) |
| $800 to $1,499 | 32 (18.7%) | 44 (44.0%) |
| $800 to $1,499 | 15 (8.8%) | 12 (12.0%) |
| Total | 171 (100.0%) | 100 (100.0%) |
Health & Disability in Braddock borough
Health Insurance Coverage by Age in Braddock borough
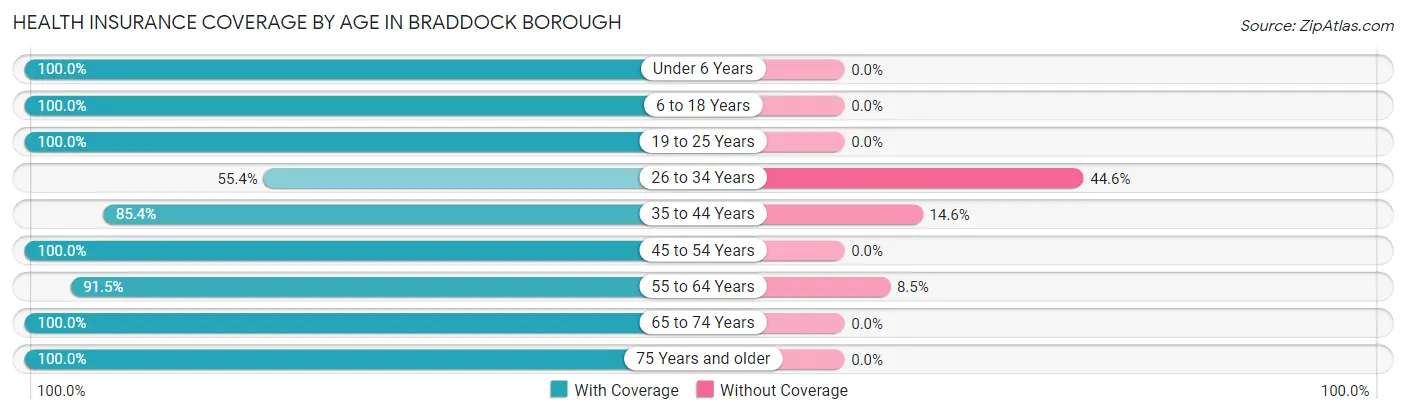
| Age Bracket | With Coverage | Without Coverage |
| Under 6 Years | 30 (100.0%) | 0 (0.0%) |
| 6 to 18 Years | 392 (100.0%) | 0 (0.0%) |
| 19 to 25 Years | 271 (100.0%) | 0 (0.0%) |
| 26 to 34 Years | 51 (55.4%) | 41 (44.6%) |
| 35 to 44 Years | 117 (85.4%) | 20 (14.6%) |
| 45 to 54 Years | 268 (100.0%) | 0 (0.0%) |
| 55 to 64 Years | 172 (91.5%) | 16 (8.5%) |
| 65 to 74 Years | 155 (100.0%) | 0 (0.0%) |
| 75 Years and older | 197 (100.0%) | 0 (0.0%) |
| Total | 1,653 (95.6%) | 77 (4.4%) |
Health Insurance Coverage by Citizenship Status in Braddock borough
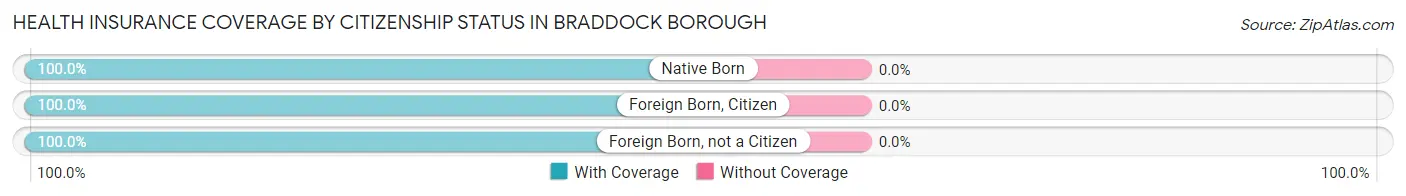
| Citizenship Status | With Coverage | Without Coverage |
| Native Born | 30 (100.0%) | 0 (0.0%) |
| Foreign Born, Citizen | 392 (100.0%) | 0 (0.0%) |
| Foreign Born, not a Citizen | 271 (100.0%) | 0 (0.0%) |
Health Insurance Coverage by Household Income in Braddock borough
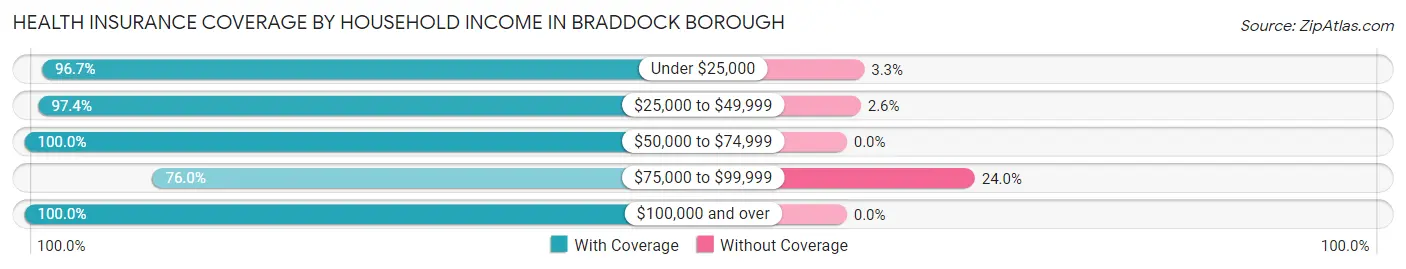
| Household Income | With Coverage | Without Coverage |
| Under $25,000 | 590 (96.7%) | 20 (3.3%) |
| $25,000 to $49,999 | 595 (97.4%) | 16 (2.6%) |
| $50,000 to $74,999 | 92 (100.0%) | 0 (0.0%) |
| $75,000 to $99,999 | 130 (76.0%) | 41 (24.0%) |
| $100,000 and over | 191 (100.0%) | 0 (0.0%) |
Public vs Private Health Insurance Coverage by Age in Braddock borough
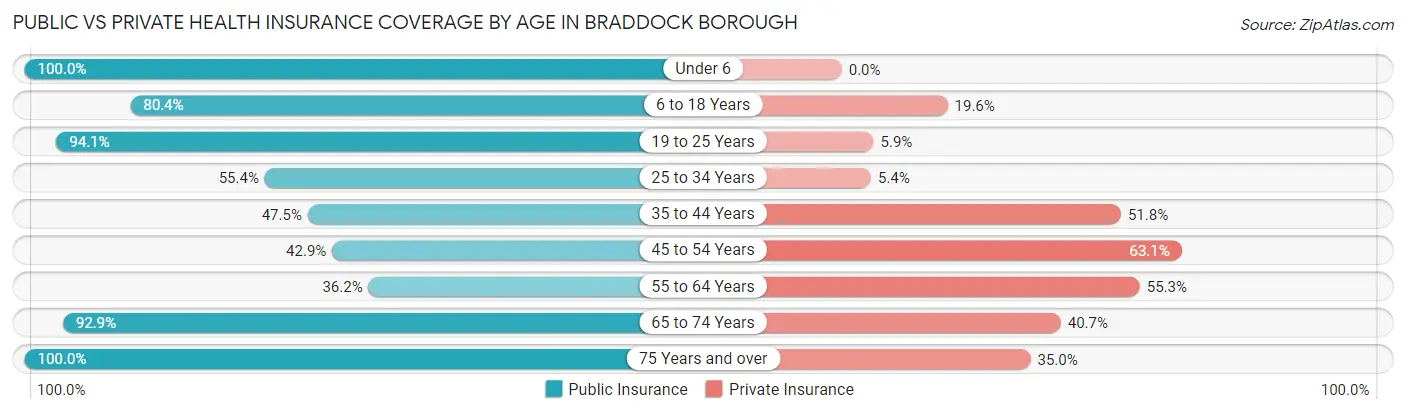
| Age Bracket | Public Insurance | Private Insurance |
| Under 6 | 30 (100.0%) | 0 (0.0%) |
| 6 to 18 Years | 315 (80.4%) | 77 (19.6%) |
| 19 to 25 Years | 255 (94.1%) | 16 (5.9%) |
| 25 to 34 Years | 51 (55.4%) | 5 (5.4%) |
| 35 to 44 Years | 65 (47.4%) | 71 (51.8%) |
| 45 to 54 Years | 115 (42.9%) | 169 (63.1%) |
| 55 to 64 Years | 68 (36.2%) | 104 (55.3%) |
| 65 to 74 Years | 144 (92.9%) | 63 (40.6%) |
| 75 Years and over | 197 (100.0%) | 69 (35.0%) |
| Total | 1,240 (71.7%) | 574 (33.2%) |
Disability Status by Sex by Age in Braddock borough
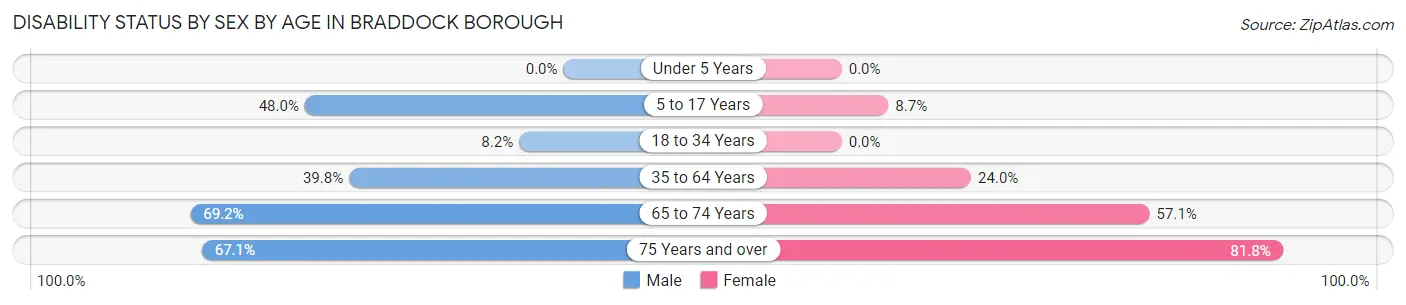
| Age Bracket | Male | Female |
| Under 5 Years | 0 (0.0%) | 0 (0.0%) |
| 5 to 17 Years | 96 (48.0%) | 18 (8.6%) |
| 18 to 34 Years | 20 (8.2%) | 0 (0.0%) |
| 35 to 64 Years | 115 (39.8%) | 73 (24.0%) |
| 65 to 74 Years | 54 (69.2%) | 44 (57.1%) |
| 75 Years and over | 51 (67.1%) | 99 (81.8%) |
Disability Class by Sex by Age in Braddock borough
Disability Class: Hearing Difficulty
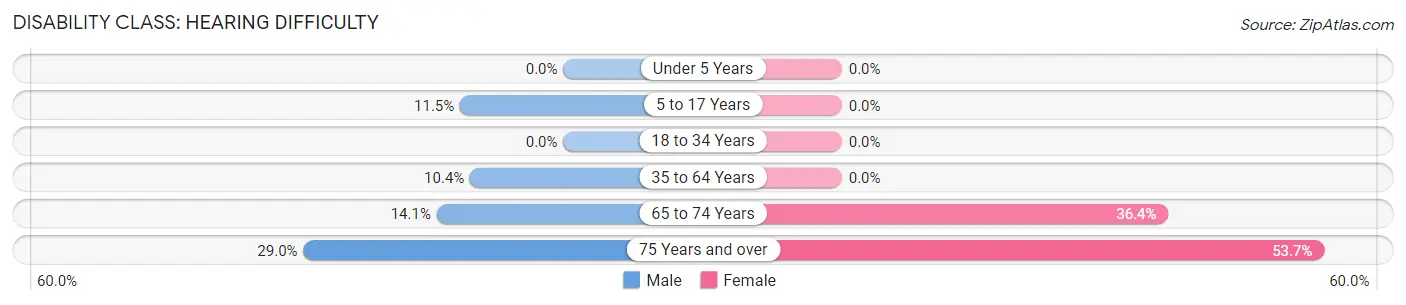
| Age Bracket | Male | Female |
| Under 5 Years | 0 (0.0%) | 0 (0.0%) |
| 5 to 17 Years | 23 (11.5%) | 0 (0.0%) |
| 18 to 34 Years | 0 (0.0%) | 0 (0.0%) |
| 35 to 64 Years | 30 (10.4%) | 0 (0.0%) |
| 65 to 74 Years | 11 (14.1%) | 28 (36.4%) |
| 75 Years and over | 22 (28.9%) | 65 (53.7%) |
Disability Class: Vision Difficulty
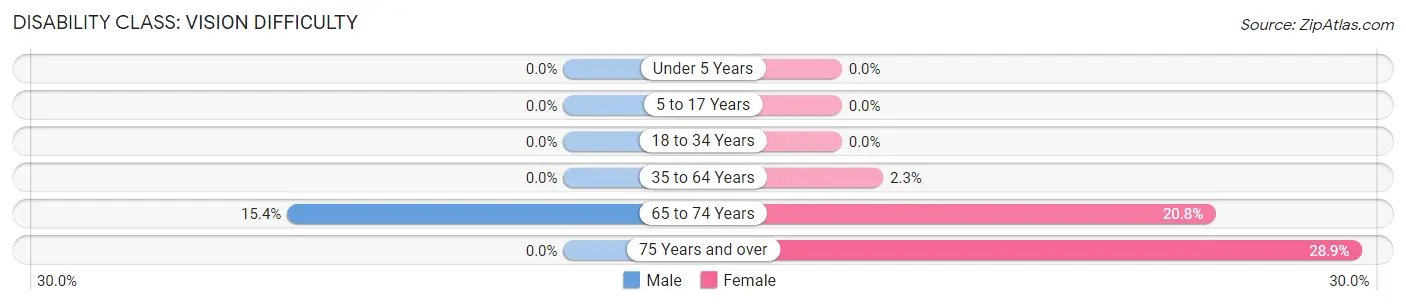
| Age Bracket | Male | Female |
| Under 5 Years | 0 (0.0%) | 0 (0.0%) |
| 5 to 17 Years | 0 (0.0%) | 0 (0.0%) |
| 18 to 34 Years | 0 (0.0%) | 0 (0.0%) |
| 35 to 64 Years | 0 (0.0%) | 7 (2.3%) |
| 65 to 74 Years | 12 (15.4%) | 16 (20.8%) |
| 75 Years and over | 0 (0.0%) | 35 (28.9%) |
Disability Class: Cognitive Difficulty
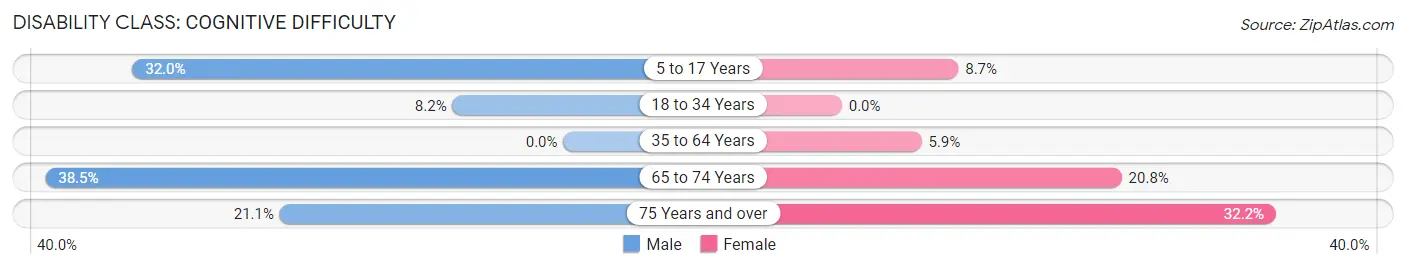
| Age Bracket | Male | Female |
| 5 to 17 Years | 64 (32.0%) | 18 (8.6%) |
| 18 to 34 Years | 20 (8.2%) | 0 (0.0%) |
| 35 to 64 Years | 0 (0.0%) | 18 (5.9%) |
| 65 to 74 Years | 30 (38.5%) | 16 (20.8%) |
| 75 Years and over | 16 (21.0%) | 39 (32.2%) |
Disability Class: Ambulatory Difficulty
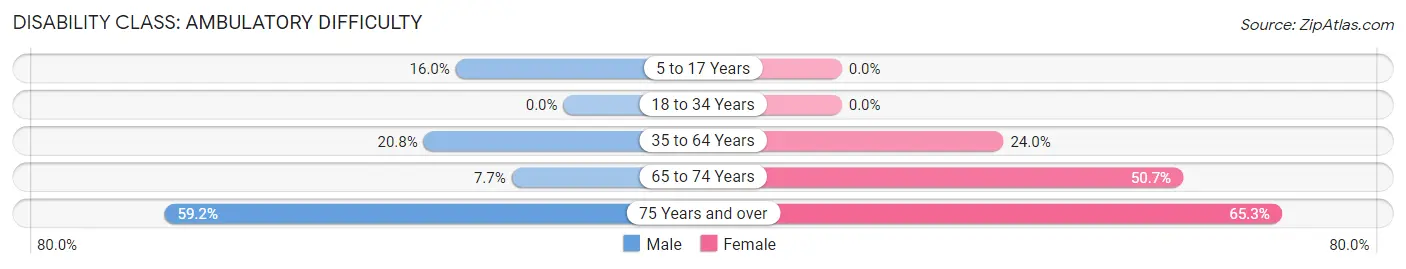
| Age Bracket | Male | Female |
| 5 to 17 Years | 32 (16.0%) | 0 (0.0%) |
| 18 to 34 Years | 0 (0.0%) | 0 (0.0%) |
| 35 to 64 Years | 60 (20.8%) | 73 (24.0%) |
| 65 to 74 Years | 6 (7.7%) | 39 (50.6%) |
| 75 Years and over | 45 (59.2%) | 79 (65.3%) |
Disability Class: Self-Care Difficulty
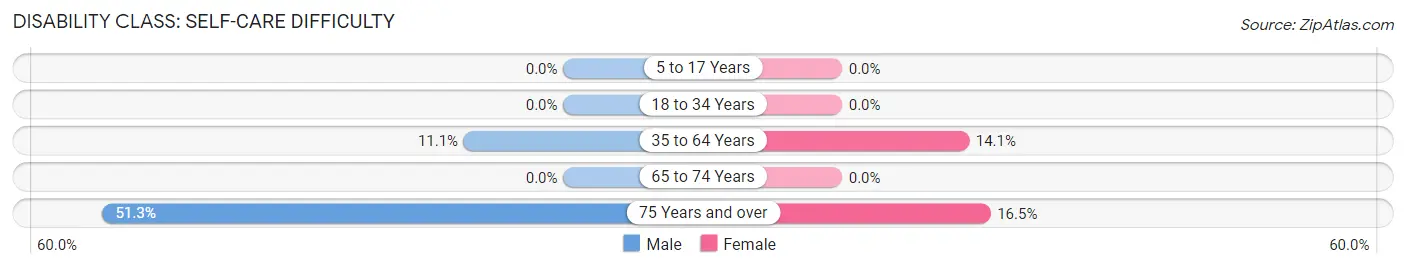
| Age Bracket | Male | Female |
| 5 to 17 Years | 0 (0.0%) | 0 (0.0%) |
| 18 to 34 Years | 0 (0.0%) | 0 (0.0%) |
| 35 to 64 Years | 32 (11.1%) | 43 (14.1%) |
| 65 to 74 Years | 0 (0.0%) | 0 (0.0%) |
| 75 Years and over | 39 (51.3%) | 20 (16.5%) |
Technology Access in Braddock borough
Computing Device Access in Braddock borough
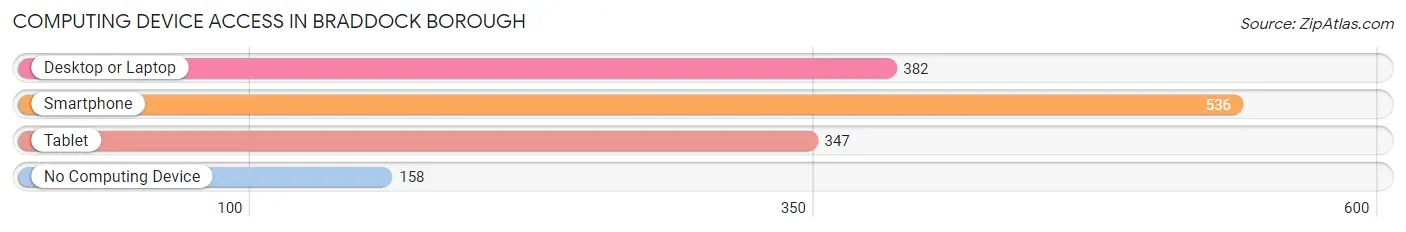
| Device Type | # Households | % Households |
| Desktop or Laptop | 382 | 52.2% |
| Smartphone | 536 | 73.2% |
| Tablet | 347 | 47.4% |
| No Computing Device | 158 | 21.6% |
| Total | 732 | 100.0% |
Internet Access in Braddock borough
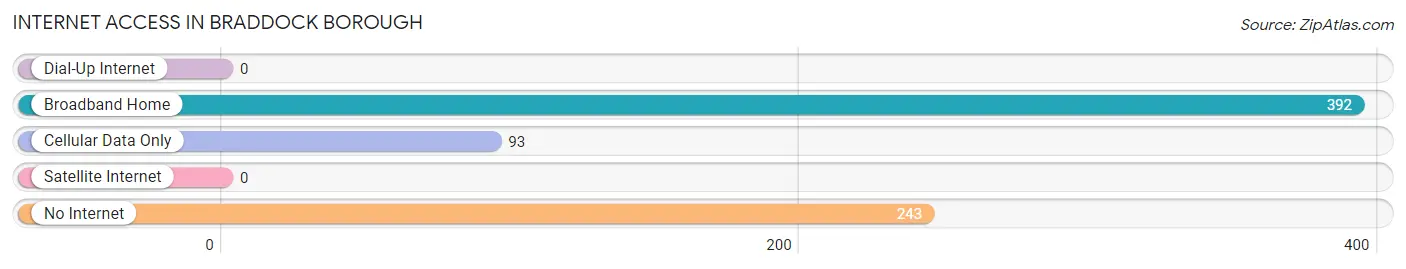
| Internet Type | # Households | % Households |
| Dial-Up Internet | 0 | 0.0% |
| Broadband Home | 392 | 53.5% |
| Cellular Data Only | 93 | 12.7% |
| Satellite Internet | 0 | 0.0% |
| No Internet | 243 | 33.2% |
| Total | 732 | 100.0% |
Braddock borough Summary
Braddock Borough is a small borough located in Allegheny County, Pennsylvania. It is situated just east of Pittsburgh and is part of the Pittsburgh metropolitan area. The borough was founded in 1742 and is named after General Edward Braddock, who was killed in the French and Indian War. Braddock Borough has a population of 2,159 as of the 2010 census.
Geography
Braddock Borough is located at 40°25'17" North, 79°51'45" West (40.4214, -79.8625). It is situated in the Monongahela River valley, just east of Pittsburgh. The borough has a total area of 0.7 square miles, all of which is land.
Demographics
As of the 2010 census, Braddock Borough had a population of 2,159. The racial makeup of the borough was 79.2% White, 16.2% African American, 0.2% Native American, 0.7% Asian, 0.1% Pacific Islander, 1.2% from other races, and 2.6% from two or more races. Hispanic or Latino of any race were 3.2% of the population.
The median income for a household in the borough was $20,972, and the median income for a family was $25,000. The per capita income for the borough was $11,945. About 28.2% of families and 33.2% of the population were below the poverty line, including 45.2% of those under age 18 and 16.2% of those age 65 or over.
Economy
Braddock Borough has a diverse economy, with a mix of manufacturing, retail, and service industries. The borough is home to several large employers, including U.S. Steel, which has a large steel mill in the area. Other major employers include the University of Pittsburgh Medical Center, Allegheny County, and the Braddock Borough School District.
The borough also has a number of small businesses, including restaurants, shops, and other services. The borough is also home to several historic sites, including the Edgar Thomson Steel Works, the Braddock Carnegie Library, and the Braddock Cemetery.
History
Braddock Borough was founded in 1742 and was named after General Edward Braddock, who was killed in the French and Indian War. The borough was originally part of the larger Braddock Township, which was established in 1788. In 1867, the borough was incorporated as a separate municipality.
The borough was an important industrial center in the late 19th and early 20th centuries. The Edgar Thomson Steel Works, which opened in 1875, was the first steel mill in the United States. The mill was owned by Andrew Carnegie and was the birthplace of the modern steel industry.
The borough was also home to the Braddock Carnegie Library, which was the first public library in the United States. The library was founded in 1889 and is still in operation today.
In the late 20th century, the borough experienced a period of economic decline. The steel industry in the area declined, and many of the borough's businesses closed. The borough has since experienced a resurgence, with new businesses and development projects.
Common Questions
What is Per Capita Income in Braddock borough?
Per Capita income in Braddock borough is $17,645.
What is the Median Family Income in Braddock borough?
Median Family Income in Braddock borough is $38,346.
What is the Median Household income in Braddock borough?
Median Household Income in Braddock borough is $27,212.
What is Income or Wage Gap in Braddock borough?
Income or Wage Gap in Braddock borough is 0.8%.
Women in Braddock borough earn 99.2 cents for every dollar earned by a man.
What is Inequality or Gini Index in Braddock borough?
Inequality or Gini Index in Braddock borough is 0.47.
What is the Total Population of Braddock borough?
Total Population of Braddock borough is 1,814.
What is the Total Male Population of Braddock borough?
Total Male Population of Braddock borough is 984.
What is the Total Female Population of Braddock borough?
Total Female Population of Braddock borough is 830.
What is the Ratio of Males per 100 Females in Braddock borough?
There are 118.55 Males per 100 Females in Braddock borough.
What is the Ratio of Females per 100 Males in Braddock borough?
There are 84.35 Females per 100 Males in Braddock borough.
What is the Median Population Age in Braddock borough?
Median Population Age in Braddock borough is 40.4 Years.
What is the Average Family Size in Braddock borough
Average Family Size in Braddock borough is 3.5 People.
What is the Average Household Size in Braddock borough
Average Household Size in Braddock borough is 2.3 People.
How Large is the Labor Force in Braddock borough?
There are 752 People in the Labor Forcein in Braddock borough.
What is the Percentage of People in the Labor Force in Braddock borough?
50.2% of People are in the Labor Force in Braddock borough.
What is the Unemployment Rate in Braddock borough?
Unemployment Rate in Braddock borough is 29.4%.